Submitted:
03 February 2025
Posted:
04 February 2025
You are already at the latest version
Abstract
Pakistan's water quality and water management are at a crucial juncture, especially in the underdeveloped province of Baluchistan. The 5th most populous country which ranks 5th in global climate vulnerability index confronts evolving water security challenges, which is complicating its national security matrix. Water shortages are escalating swiftly due to increasing demand across all industries that utilize water. Burgeoning population, increasing from 175 million in 2010 to an estimated 247 million in 2024 and adverse impacts of climate change are seriously affecting water quality and availability across different sectors, which is exacerbated by persistent political instability and internal security issues, disincentivizing the potential investors in water sector at-least in short to medium term in Pakistan. The quality of drinking water is rapidly deteriorating due to water scarcity and contamination from various sources. Despite the government’s promises of providing clean drinking water to inhabitants of Baluchistan and employing smart technology for irrigation purposes, the implementation of these policies remains a formidable task. The study argues that surface and ground water in Baluchistan is contaminated, posing health risks and evolving human security challenges. The study examines drinking water quality using laboratory testing by collecting samples from designated urban and rural areas and comparing them with the minimum safe standards established by international and national clean drinking water guidelines. Laboratory testing has shown a significant decay in the quality of drinking water in Baluchistan, warranting immediate redressal. The persistent decline in water quality and water availability poses serious challenges in the attainment of the water related United Nations Sustainable Development Goals (UNSDGs) number six by 2030. The study provides incisive analysis and recommendations to facilitate the government and relevant ministries in mitigating the vulnerabilities of climate change, provide clean drinking water to inhabitants of Baluchistan and address critical issues of water security on sustainable basis.
Keywords:
water scarcity
; water contamination
; health risks
; human security
; national security
1. Introduction
Pakistan with a population of 247 million [1] is seriously impacted by the adverse impacts of climate change and ranks 5th on climate vulnerability index [2], which has profound implications for the water availability, quality and distributions system. Contaminated water has emerged as a prominent issue in Pakistan, attributable to multiple sources [3]. The primary reasons are elevated temperatures, which raise the heat levels of drinking water, as well as the presence of organic compounds, microorganisms, heavy metals, and nutrients [4]. Water contamination in Pakistan arises from geological and natural factors, including chemicals, herbicides, pesticides, oil refining, coal mining, inappropriate waste disposal, and septic tank leakage [5]. Access to safe drinking water in Pakistan, both surface and underground, is in a dreadful state. Apathy manifests in both urban and rural areas [6]. Moreover, the per capita supply of water is rapidly declining, and Pakistan is classified as a “water stressed” nation, which is expected to transit to a “water scarce” status in the coming years [7]. Figure 1. indicate water availability and projected demand by year 2025.
The evolving situation present numerous challenges for the residents, who are heavily reliant on agricultural as an employment and food security, hence exacerbating human security concerns [8]. It adversely affects energy-producing companies reliant on hydrological methods for industrial and domestic users. Water contamination in Pakistan has reached a critical level, with approximately 80% of the population compelled to consume contaminated water, while merely 20% having access to safe drinking water [9]. The climate change is also adversely impacting the water availability and quality especially, in the province of Baluchistan, where data of 2022 to 2024 reveal changes in the precipitation patterns causing heavy floods and droughts in the same year from 2022 to 2024. The map data produced by Pakistan metrological department for year 2023 is shown in Figure 2. to build the context of evolving climatic variations.
A comprehensive review of existing literature on water resources management indicates that 97.5% of the water covering the Earth’s surface is saline, found in oceans. Freshwater constitutes 2.5%, although less than 1% is accessible for use. Secondly, an additional difficulty is the unequal distribution of accessible fresh water worldwide due to natural systems, in contrast to the global population distribution, significantly affecting water availability in Pakistan. Approximately 785 million individuals worldwide lack access to clean drinking water, with around 100 million in Pakistan at risk of consuming contaminated water [10]. Approximately 70% of the population in Pakistan consumes contaminated water, resulting in the annual death of around 53,000 children under the age of five years due to use of contaminated water [11]. The sources of ground water in Pakistan are shown in Figure 3. which indicates that main source of recharge are rains and canal leakage, which if not preserved well can have the potential contamination effects.
The measures for assessing water quality often encompass the chemical and physical variations resulting from variables such as detergents, pesticides, worn bedrock, sedimentation, temperature runoff, and hydrogen ion concentration (pH). The most persistent challenge regarding global water quality is eutrophication, characterized by elevated levels of phosphorus (P) and lead (Pb) in water, rendering it contaminated and hazardous, hence adversely impacting public health. Water scarcity and contaminated drinking water have become a significant national security concern for Pakistan. The disproportionate distribution of water for agriculture, home and industrial purposes, as well as for potable consumption, has exacerbated water security challenges.
The study investigates Baluchistan’s water resources, their distribution among the districts and different sectors for daily usage and agriculture production. The results of water quality laboratory tests covering all the geographical regions of Baluchistan have given clear insight about the impending health risks on use of contaminated drinking water especially in the rural areas of Baluchistan, which is an alarming trend. The laboratory tests indicated that the quality of drinking water in most samples exceeded the recommended thresholds established by the World Health Organization (WHO) and the National Environmental Quality Standards (NEQS). Furthermore, the groundwater contamination in Baluchistan is attributable to mining, the open disposal of industrial and domestic waste, and inadequate drainage systems, all of which have led to dilapidated water quality. Comprehensive recommendations are presented in the last part of the study to facilitate the relevant ministries through structured feedback for achieving water related sustainable development goal number 6 by envisaged timeframe of 2030, which is around the corner.
Literature Review
The methodology of systematic literature review (SLR) was adopted. The existing literature amply covers the ongoing climate change impacts on different sectors of Pakistan, especially the water availability and water quality, however, very less literature is available on Baluchistan. The burgeoning population and lessening of water resources compounded by the negative effects of climate change have complicated Pakistan’s water situation [12]. Water security is an evolving national security challenge for Pakistan, impacting human security across multiple dimensions [13]. The glaciers of Pakistan, especially in the Himalayas and Karakoram ranges, are undergoing rapid melting as a result of increasing temperatures, which have the potentials of glacial lake outburst floods (GLOFs), which Pakistan has been experiencing regularly for the past four years, and altered river flows that impact millions reliant on glacial meltwater for agriculture and potable water [14]. Alterations in precipitation patterns and glacial melt resulting in the atypical drought observed during the years 2022 to 2024 have considerable ramifications on Pakistan’s limited water supplies [15]. The visible impacts of climate change are the unpredictable rain pattern which is affecting the harvesting seasons. The intensification of water scarcity, especially in arid and semi-arid areas, resulting in reduced agricultural output, heightened rivalry for water resources, and possible disputes over water distribution across provinces have become more pronounced [16]. Climate change correlates with a rise in the frequency and severity of extreme weather phenomena, including floods, droughts, and heatwaves. The catastrophic effects of these occurrences on communities, infrastructure, agriculture, and livelihoods, intensifying poverty and food insecurity [17]. The agricultural industry of Pakistan, an essential element of its economy is significantly vulnerable to the effects of climate change. The fading crop yields, alterations in cropping patterns, heightened insect infestations, and animal losses owing to changing climatic conditions, jeopardizing food security and rural livelihoods [18]. Environmental descent produced by climate change, including water scarcity, flooding, and land degradation, is driving internal displacement and migration in Pakistan. The evolving situation is causing socio-economic difficulties encountered by displaced populations, such as the loss of livelihoods, social tensions, and strain on urban infrastructure and services [19]. Climate change is also impacting public health, such as heat stress, vector-borne infections, and food insecurity. The rising incidence of heat-related illnesses, waterborne diseases, malnutrition, and mental health disorders, exacerbating existing health inequities. Climate change has significantly affected water quality in Pakistan, particularly for drinking purposes [20]. Climate change presents substantial problems to water governance in Pakistan, impacting water availability, quality, and distribution. Regarding water governance and security, it is noted that Pakistan has the highest water-intensive economy globally, which signifying that the water consumption per unit of GDP is the greatest in the world, reflecting an exceptionally low level of productivity and efficiency [21]. Insufficient water reservoirs, inefficient water management in agriculture and domestic settings, limited wastewater recycling, and the pollution of potable water have emerged as significant health hazards, posing national security threats for Pakistan [22]. Baluchistan with a huge landmass is most impoverished province in Pakistan. Mostly dependent on rainwater for harvesting and underground tubewells. Unpredictable weather patterns and negative impacts of climate change and inefficient water governance have caused water scarcity and water contamination, seriously impacting the health of inhabitants and impacting the crops yield [23]. Water scarcity is also creating food insecurity in Baluchistan [24]. The majority of Baluchistan is dependent on Tubewells for irrigation purposes as their main sources of water supply. The government’s policies of providing relief to farmers through electricity subsidy and solar powered tube wells on easy installments have compounded groundwater scarcity, which has been intensified by changing precipitation pattern throughout Pakistan, especially in the Baluchistan province, therefore, food security and water scarcity are emerging as potential challenges exacerbated by depleting water quality causing human security issues in Baluchistan [25].
Materials and Methods
The outline of methodology, data collection, sampling sites and investigation process is given in Figure 4, which is also explained in relevant paragraphs.
3.1. Systematic Literature Review
A systematic literature review (SLR) is a structured and deliberate process for discovering, analyzing, and synthesizing current research on a particular subject. The procedure generally commences with the formulation of a precise research question or objective, followed by the creation of a protocol that delineates inclusion and exclusion criteria, search methodologies, and data extraction techniques. Relevant research is located via exhaustive searches of academic databases and additional sources. Subsequently, selected studies undergo comprehensive appraisal for quality and relevance. The findings are ultimately synthesized, employing qualitative or quantitative approaches, to deliver an evidence-based summary of the available literature. In this study, comprehensive literature review on water security issues was conducted covering the prevailing water predicaments of Pakistan in general and Baluchistan in particular. The methodology of SLR was adopted to review the existing data concerning water status in Pakistan. Commencing from 123 shortlisted articles, these were succinctly narrowed down to 67 articles which were most relevant and accordingly incorporated in the study, however, the limitation of very less literature on Baluchistan was obvious. The literature review is presented in the study after the introduction paragraph.
3.2. Study Area
Baluchistan province comprises thirty administrative districts and seven divisions, encompassing both A areas (where police has jurisdiction) and B areas (jurisdiction of law enforcing agencies other than Police). The government’s processes are segmented between the police and other law enforcement entities, each possessing distinct levels of jurisdiction and involvement. Ethnically, the northern territory is predominantly populated by the Pashtuns, and the southern portion is mainly occupied by the Baluchis. The capital city of Quetta and its environs comprise a broad array of ethnic groups. The capital city is relatively developed, featuring significant infrastructure, government edifices, military training facilities, and shopping centers. In the overall national context, geographically the Baluchistan is Pakistan’s biggest province but in HDI and infrastructure point of view, it is lagging in all the provinces. Figure 5. contains Baluchistan’s geographical regions.
3.3. Water Sampling Sites
For detailed examination on the status of water quality in Baluchistan, the water samples from rural and urban areas were collected for subsequent examination and laboratory tests. Eighteen places were designated for sample collection and analysis as given in Figure 6. The laboratory testing was executed at zone centers and later the results were compiled at the province level.
3.4. Laboratory Examination and Water Quality Analysis
The laboratory examination of water samples involved the division of sampling areas and sites into geographical zones as given in Figure 7. for administrative convenience and homogeneity of regions. This was followed by establishment of the group of monitoring stations, sampling frequency, sampling designs, laboratory testing and documenting of the water quality status of each zone.
Water quality laboratory testing was conducted using a stringent protocol to evaluate the biological, chemical and physical properties of water samples. The procedure primarily entailed the gathering of samples from specified sampling locations. Special care was taken in sample preservation to ensure integrity during the transportation to the designated laboratories. A three-step technique was employed in the laboratory testing to ascertain water quality. Following visual inspection, the samples were tested for microbiological analysis to determine the presence of pathogens. In the second stage, a physical analysis was performed to ascertain the levels of turbidity, conductivity, and dissolved solids. The third stage entailed chemical analysis to determine the concentrations of pH, phosphate, and mineral contaminants such as iron, manganese, chloride, lead, and sodium. Finally, the acquired data was analyzed in relation to the established water quality criteria and guidelines provided by the World Health Organization (WHO) and the national quality standard (NQS) framework for drinking water in Pakistan. The three-step laboratory testing process is described in the ensuing paragraphs.
3.5. Microbiological Examination
The water samples were obtained in sanitized plastic bottles (200 ml). Careful measures were taken to avert any contamination. The samples were obtained from taps that were not leaking at the spindle and gland to avoid external contamination. The samples were carried to the laboratory at a regulated temperature (20C to 8°C) in suitably lightproof and sanitized insulated containers. Water samples containing chlorine traces were treated with sodium thiosulfate to eliminate residual chlorine. Neutralization of chlorine is essential, as its presence may result in the death of bacteria during transport, leading to erroneous results. Special care was taken to ensuring that the interval between sample collection and analysis did not surpass 6 hours. The membrane filtering and multiple tube fermentation procedures were employed to determine the levels of coliform and E. coli, with bacterial counts conducted using a microscope. The membrane filtration technique entailed passing the water sample through a membrane filter with a pore size of 0.45 microns, appropriate for bacterial retention. The filter was subsequently placed on the selective medium m-ColiBlue24 for coliforms and E. coli, and incubated at a temperature ranging from 35°C to 37°C. In the multiple tube fermentation approach, the water sample was serially diluted in tubes containing a lactose broth, thereafter, incubated at a temperature range of 35°C to 37°C, and monitored for color changes indicating the presence or absence of coliforms.
3.6. Physical Examination
A physical investigation was performed to ascertain the levels of dissolved solids, conductivity and turbidity utilizing the designated instruments and methodology. The turbidity meter was utilized for turbidity analysis, commencing with calibration according to the manufacturer’s recommendations, subsequently filling the container with the sampled water for testing, and inserting the turbidity meter to record its reading. The conductivity analysis was conducted using a conductivity meter following the requisite calibration. The conductivity cell was washed with distilled water between measurements. The examination of dissolved solids was conducted by initially filtering the sample to eliminate suspended materials, followed by placing it in a dish that was subsequently heated in an oven to facilitate evaporation, thereby retaining the dissolved solids in the dish. The total dissolved solids (TDS) were determined using the formula: TDS (mg/L) = (weight of solid / volume of sample) x 1000.
3.7. Chemical Examination
Water samples were collected in 0.5 liter and 1.5-liter polystyrene bottles. Prior to sample collection, the bottles were put through extensive washing and rinsing. Boric acid and nitric acid (HNO) were incorporated as preservatives in sampling vials for trace elements and nitrate nitrogen. 2 ml per liter of nitric acid was utilized as a preservative for trace elements, while 1 ml per 100 ml of boric acid served as a preservative. The samples gathered for chemical analysis were taken to the laboratory without refrigeration. A pH meter was utilized for pH analysis following calibration by immersing it in a water sample, and the reading was documented on the form. The phosphate analysis utilized a phosphate test kit, which measured color development following the addition of chemicals to the water sample. The color intensity was quantified via a spectrophotometer. The chloride analysis was conducted through a testing kit that required the addition of reagents to a water sample to create a titratable complex, from which the chlorine concentration was determined through titration. A flame photometer was employed for sodium analysis by placing it in the sample container and recording the sodium concentration reading.
3.8. Supplementary Factors Considered During Investigation
Sample collections from filtration plants and water supply taps were conducted using taps that were devoid of rust, adequately cleaned, and allowed to run for several minutes prior to sample collection. Samples from tubewells were obtained after allowing water to flow for 10 minutes to ensure a representative sample of groundwater. The groundwater depth and tubewell locations were indicated on the topographic survey sheet. Samples from water supply schemes were taken near the source to mitigate the impact of pollution in the distribution system. Correspondingly, samples from hand pumps were obtained following purging, executing one stroke for every foot of depth. The stream samples were obtained by standing in the center and preventing the bottle from contacting the substrate to avoid contamination and extraneous particles. All samples were accompanied by relevant collection forms that included essential information such as sample ID, sample type, sample code, GPS coordinates, and the date and time of collection.
For water quality investigation and analysis, four types of classifications were designated for laboratory tests, as per the details given in Table 1. The samples were collected from multiple sources including tabs, hand pumps, tube wells, springs, reservoirs, streams and local government distribution networks.
The standard sampling pattern guidelines were followed in the selection of sampling sites and detailing of grid sizes implementing a valid criterion; 15 and 25 km2 for big cities, 5 and 14 km2 for medium cities and 1 km2 for small cities. Samples were taken mostly from public usage points and continuous monitoring was ensured. Each monitoring point was 1 to 2 Kms away, and each site was marked according to grid specifications on the testing map. Every sample was also marked for identification. Depending on the type of investigations, A for bacterial analysis, B for trace elements analysis, C for Nitrate (N) analysis and D for other water quality parameters was designated. Table 2. shows the details about sampling design.
The details of samples collected from rural and urban areas of each zone are given in Table 3. The process was spread over entire year of 2024, with the assistance of civil administration of Baluchistan who facilitated the establishment of observation centers and sampling sites.
The water samples underwent extensive laboratory testing in two phases. Phase 1 was from January to June 2024, while phase 2 was undertaken from September to November 2024. The purpose was to examine the water quality of Baluchistan during all four seasons by comparing it with the national standard framework of Pakistan and the American Public Health Association (APHA). The results were subsequently compared with standards parameters given in Table 4. for bacteriological, aesthetic, and physicochemical characteristics.
The water quality was examined within the drinking water permissible limits given in Table 5. The acronyms used in the table are explained here. NDWQS- National Drinking Water Quality Standards, CFU- Colony Forming Unit, TCU- Total Color Units, WHO-World Health Organization, NGVS-No Guidance Value Set, NTU-Turbidity Unit
Following ranges were considered in results for establishing drinking water quality.
Results and Discussion
The laboratory testing of water samples and their comparison to the minimum standards established by WHO and Pakistan’s National Quality Drinking Water guidelines, indicated medium to high levels of contamination, hence presenting health hazards and hindering the attainment of UNSDGs in their current form. A series of initiatives have been proposed to ensure the availability of clean drinking water for the residents of Baluchistan, along with a set of recommendations for ensuring water security on a sustainable basis. Zone wise water sample testing results are given in the succeeding paragraphs.
4.1. Zone 1–(Eastern Zone)
Zone 1 represents Loralai, Zhob, Barkhan and Kohlu districts. Popultaion wise, it is densely populated with a developed infrastructure. It is served with different modes of water supply containing springs, river streams, tubewells, hand pumps and water supply schemes. Water samples were collected from 121 sample sites for laboratory examination of water quality. The results indicate presence of arsenic, turbidity, iron, TDS, E Coli and bacteria. Overall, 40% samples were found unsafe and 60% were found safe for drinking. The results of are given in Table 8.
4.2. Zone 2 (Central)
Zone 2 represents Sibbi, Nushki, Kalat, Kharan and Khuzdar districts. In this study, 86 samples were put through laboratory test. Overall, 58% of the water is found contaminated with coliforms, Arsenic, E.coli, TDS and Iron. Overall, 58% sources were found unsafe and 42% were found safe for drinking Table 9. shows the water testing results in zone 2.
4.3. Zone 3 (Western)
Zone 3 represents Panjgur, Dalbadin, Nokkundi and Turbat districts. In this study, 83 samples were put through laboratory test. Overall, 61% of the water is found contaminated with coliforms, Arsenic, E.coli, TDS and Iron and 39% were found safe for drinking Table 10. shows the water testing results in zone 3.
4.4. Zone 4 (Coastal)
Zone 4 represents coastal areas of Jiwani, Gwadar, Pasni, Ormara. In this study, 103 samples were put through laboratory test. Overall, 50% of the water is found contaminated with coliforms, Arsenic, E.coli, TDS, Turbidity and Iron and 50% were found safe for drinking. Table 11. shows the water testing results in zone 4.
4.5. Zone 5 (Quetta)
Zone 5 represents Quetta urban centre which is also the capital of Baluchistan having maximum population and well-developed infrastructure. In this study, 206 samples were put through laboratory test. Overall, 43% of the water is found contaminated with coliforms, Arsenic, E.coli, TDS, Turbidity, Fluoride and Iron, whereas, 57% were found safe for drinking. Table 12. shows the water testing results in zone 5.
The laboratory test results of 5 zones spread all over the province of Baluchistan containing rural and urban canters indicate the water quality risk varies from high to medium. Zone 2 and zone 3 are highly contaminated, zone 1, zone 4 and zone 5 are moderately contaminated as shown in Figure 8.
4.6. Causes of Water Contamination in Baluchistan
Water contamination constitutes a significant challenge in Baluchistan, where the arid climate and scarce water resources intensify the issue. The region has a complex water problem stemming from both natural and human-induced factors. The causes can be classified as over-extraction, agricultural and industrial practices, inadequate infrastructure, and natural contamination, all of which provide significant dangers to the health and livelihoods of locals. The over-extraction of groundwater is a primary contributor to water contamination in Baluchistan. The region depends significantly on ground water due to the scarcity of surface water sources like rivers and lakes. The over-extraction of groundwater, especially for agricultural use, has resulted in a notable decline in the water Table The excessive extraction results in the encroachment of salty water into freshwater aquifers, rendering the water unfit for consumption or irrigation. In coastal regions, the incursion of seawater into aquifers has intensified the salinity problems. The reduction in groundwater levels intensifies the concentration of naturally occurring contaminants, including fluoride and arsenic, which presents significant health hazards as well. Agriculture constitutes the backbone of Baluchistan’s economy; nevertheless, redundant farming practices have led to water pollution. The overuse of chemical fertilizers and pesticides infiltrates water sources via runoff, especially during rainfall or irrigation. This runoff pollutes both surface and groundwater with nitrates, phosphates, and hazardous compounds. These pollutants not only degrade water quality but also adversely affect aquatic ecosystems and render the water unfit for human consumption. Additionally, animal waste from livestock agriculture frequently contaminates water sources, introducing pathogens and organic debris that compromise water safety.
Industrialization and mining operations in Baluchistan, however restricted, constitute a notable source of water pollution. Mining activities for coal, copper, and other minerals frequently discharge deleterious compounds, including heavy metals (lead, arsenic, and mercury) and acid mine drainage, into adjacent water bodies. These pollutants are extremely hazardous and remain in the environment for extended durations. Limited industrial facilities, release untreated wastewater containing dangerous chemicals directly into rivers and streams owing to inadequate waste management systems. This not only contaminates aquatic ecosystems but also presents enduring threats to human health and agriculture. Inadequate wastewater treatment facilities also contribute to water pollution in Baluchistan. Urban regions are deficient in adequate sewage infrastructure, resulting in untreated effluent from residential and commercial sources being frequently released directly into natural water bodies. This effluent comprises a combination of biological and chemical contaminants, including bacteria, viruses, and nutrients that facilitate the proliferation of detrimental algae. In rural regions, open defecation and inadequate sanitation practices exacerbate water quality by contaminating drinking water sources with fecal matter and pathogens. The improper disposal of solid waste, encompassing plastics, dangerous substances, and medical refuse, is a notable contributor to water contamination. Disposing of waste in or adjacent to water bodies, like streams and canals, results in the seeping of detrimental chemicals into the water. Plastics and non-biodegradable substances obstruct streams, while heavy metals from batteries and gadgets contaminate both surface and groundwater. The absence of structured waste management systems exacerbates this issue, especially in urban areas such as Quetta, where population density is significant. Specific regions of Baluchistan are impacted by natural water source contamination. The existence of elevated concentrations of arsenic and fluoride in groundwater is a considerable issue. These toxins emanate from geological formations and are discharged into the water by natural processes. Prolonged ingestion of water with high arsenic concentrations can result in severe health issues, such as cancer, dermal sores, and cardiovascular disorders. Excessive fluoride concentrations induce dental and skeletal problems, particularly impacting children.
Baluchistan’s arid climate makes it particularly vulnerable to climate change, which intensifies water contamination issues. Prolonged droughts reduce the availability of surface water, forcing communities to rely even more heavily on over-extracted groundwater. Reduced water availability also concentrates pollutants, affecting water quality. Additionally, unpredictable rainfall patterns increase the likelihood of flash floods, which wash contaminants from the land into water bodies. Climate change further exacerbates salinity problems in coastal areas due to rising sea levels and seawater intrusion. The lack of a comprehensive water quality monitoring system in Baluchistan is a critical barrier to addressing water contamination challenges. Limited testing facilities and weak regulatory enforcement allow industries, farmers, and households to discharge pollutants into water sources without accountability. Many residents rely on untreated water for drinking and domestic purposes, unaware of its contamination levels. This lack of oversight perpetuates the cycle of pollution and poses significant risks to public health. The deterioration and inadequate maintenance of water supply infrastructure can contribute to water contamination. Leaking pipelines and exposed storage tanks facilitate the infiltration of contaminants, including dust, bacteria, and chemicals, into the water supply. Insufficient safeguarding of wells and boreholes renders them vulnerable to pollution from surface runoff and anthropogenic activities. The deficiency in investment for infrastructure development exacerbates these difficulties, resulting in numerous communities having unsafe drinking water.
4.7. Water Scarcity in Baluchistan
At the time of independence in 1947, Pakistan’s per capita availability of water was 5600 cubic meters, which is consistently decreasing [26] to 5260 cubic meters in 1951 and 1038 cubic meters in 2010. By this projection, by 2025 the water availability is assumed as 877 cubic meters and by 2050 it will reach 575 cubic meters per annum [27]. Figure 9. indicate the projected per capita decline in water from 1951 to 2050.
Water scarcity in Baluchistan is a significant and complex issue, fundamentally linked to the province’s arid climate, mismanagement of water resources, demographic pressures, and socio-economic weaknesses. Baluchistan, Pakistan’s largest province by area, encounters substantial physical and climatic challenges, exacerbated by weak water governance and infrastructural shortcomings. This persistent dilemma endangers both the livelihoods of the local populace and the province’s delicate ecological and economic stability. The severe weather conditions in Baluchistan are a key factor contributing to water scarcity. The province is situated in an arid to semi-arid region, marked by minimal and unpredictable precipitation. The region’s average annual precipitation significantly lags below the national average, inadequate to satisfy the increasing water requirements of its populace, agriculture, and limited industrial usage. The recurrent incidence of droughts intensifies the issue, as extended dry periods further diminish already limited water resources. Climate change has exacerbated these patterns, resulting in heightened variability in precipitation and a greater frequency of extreme weather events, including flash floods and extended droughts, so upsetting conventional water supply patterns. Groundwater constitutes the principal water supply in Baluchistan owing to the scarcity of surface water. Nonetheless, unsustainable extraction methods have resulted in the swift depletion of aquifers. The extensive utilization of tube wells for agricultural and domestic applications has resulted in a significant decline in groundwater levels throughout the province. In many regions, the water table has declined to such an extent that wells have completely dried up, compelling people to excavate deeper at high-priced undertakings. Inefficient water management strategies and antiquated infrastructure substantially exacerbate water scarcity. The province lacks a comprehensive water management system to govern usage and guarantee equitable resource distribution. Dilapidated and inadequately maintained irrigation systems lead to significant water losses from leakage and evaporation. Inadequate storage capacity for rainwater compounds the issue, resulting in a substantial amount of seasonal rainfall being lost as runoff. The absence of small and medium-sized dams for water collecting and storage exacerbates water scarcity issues. Conventional agricultural practices and the growth of water-demanding crops, such as wheat exert significant strain on the region’s scarce water resources. Inefficient irrigation methods, such as flood irrigation, result in considerable water loss. The lack of contemporary irrigation methods, like drip and sprinkler systems, exacerbates the problem, rendering agriculture a significant factor in water scarcity. Urban cities like Quetta are experiencing increasing pressure to satisfy the demands of their expanding population, resulting in excessive dependence on finite groundwater resources. Informal settlements in urban regions frequently lack access to potable water, compelling inhabitants to rely on unregulated sources, hence intensifying over-extraction and depleting communal resources. Moreover, insufficient design for urban water supply and distribution systems exacerbates the existing limitations of water infrastructure. Climate change is an escalating issue that also compliments water scarcity challenges.
Deforestation and environmental degradation have significantly affected the region’s water resources. The reduction of forest cover diminishes the land’s capacity to hold water, resulting in reduced groundwater recharge and heightened surface runoff during precipitation. Soil erosion resulting from deforestation intensifies this issue by diminishing the land’s ability to absorb and retain water. Despite the existence of national water management policies, their implementation in Baluchistan is handicapped by inadequate institutional capacity and weak governance. The absence of cooperation among federal, provincial, and municipal authorities obstructs the formulation and implementation of effective water management programs. Inadequate investment in water infrastructure and a deficiency of political resolve to tackle the issue exacerbate the problem. The water scarcity is also compounded by transboundary water concerns with adjacent provinces. Conflicts regarding the allocation of river water, including the Indus and its tributaries, pose difficulties in guaranteeing a reliable and equitable water supply to Baluchistan. The province’s dependence on upstream areas for water supply renders it susceptible to alterations in water allocation rules or the construction of dams and barrages by adjacent regions, exacerbating its already constrained supplies. Conventional water utilization methods in Baluchistan frequently emphasize agricultural and tribal requirements at the expense of conservation. In numerous regions, water is regarded as a shared resource, resulting in overexploitation and mismanagement.
The reasons for water scarcity in Baluchistan are intricately linked, arising from a blend of natural and anthropogenic forces. The province’s arid climate, excessive dependence on groundwater, inadequate water management, ineffective agricultural techniques, and the effects of climate change all exacerbate the escalating water crisis. Confronting these difficulties necessitates a comprehensive strategy that encompasses investment in water infrastructure, the promotion of sustainable farming methods, the enforcement of appropriate water management policies, and the augmentation of community involvement
Recommendations for Ensuring Water Security in Baluchistan
Pakistan is fast transiting from water stressed to water scarce country which will create serious human security issues in coming years. The year 2025 marks the beginning of Pakistan’s water scarcity line, which warrants immediate attention by all the policy circles as an evolving national security issue hampering the achievement of UNSDGs number 6 related to water security by the year 2030. Following recommendations are proffered for dealing with the evolving water security challenges in Pakistan especially, the Baluchistan province.
5.1. Water Management, Conservation and Distribution
During the harvesting season, water scarcity poses a significant challenge in Pakistan, leading to conflicts between the federation and the provinces. The Council of Common Interest and the 1991 water accord were intended to address grievances related to water allocation; nevertheless, insufficient administration, poor governance, and perceptual disparities between the federation and provinces are significant obstacles. A comprehensive governmental strategy is advised, accompanied by onsite consultation visits by officials of provincial and federal governments, as well as political leaders, to foster consensus and enhance knowledge regarding the complexity associated with the prudent and inclusive utilization of existing water resources. Pakistan possesses the “Pakistan Water Apportionment Accord 1991,” which addresses the equitable allocation of the Indus River System’s waters among the provinces of Pakistan. Nevertheless, due to insufficient clarity, this agreement failed to address the issue stemming from the inequitable allocation of water. The “Indus River System Authority” was founded in 1992 through parliamentary legislation to serve as an agency for the management and monitoring of Indus water resources in Pakistan, ensuring prudent distribution. Nonetheless, the issues with equitable water distribution, monitoring and installation systems, and the operation of treatment plants have never functioned as intended. The eighteenth constitutional amendment designated water distribution between rural and urban areas within each province as an internal provincial concern.
The government of Baluchistan should promote the collection and storage of rainwater through rooftop harvesting systems, community tanks, and surface reservoirs to make use of seasonal rainfall efficiently. By encouraging the adoption of modern irrigation techniques such as drip irrigation, sprinkler systems, and laser land leveling to reduce water wastage in agriculture. The district administrations should revive and maintain the ancient Karez irrigation system to ensure efficient water distribution and recharge groundwater sustainably, alongside conducting educational programs to raise public awareness about water conservation, emphasizing the importance of reducing water wastage in daily activities. It is suggested to enforce policies to monitor and regulate the over-extraction of groundwater, including licensing tube wells and implementing usage caps. There is a need to develop systems to treat and reuse wastewater for non-potable purposes such as irrigation and industrial and cleaning. Encouraging farmers to grow less water-intensive crops that are better suited to Baluchistan’s arid climate. Install water-efficient fixtures such as low-flow faucets, dual-flush toilets, and smart irrigation systems in households, industries, and public spaces. Build small and medium-sized dams, water tanks, and check dams to store runoff and prevent evaporation. Conserve and restore watersheds, wetlands, and forests to improve natural water retention and reduce surface runoff. By engaging local communities in water conservation initiatives, empowering them to manage and distribute water resources equitably and repair leaking pipelines, tanks, and taps to minimize water loss in urban and rural water supply systems. Implement water audits for limited industries, agriculture, and public utilities to identify inefficiencies and improve water use practices. Use meteorological data to anticipate rainfall patterns and prepare storage systems in advance to maximize water retention during wet seasons. The provincial government should develop and enforce laws and policies promoting water conservation, such as mandatory water-saving infrastructure in new construction projects.
5.2. Water Quality Monitoring Mechanism
A water quality monitoring system is a device utilized to measure chlorine levels, suspended particles, pH, total ionic concentrations, and Oxygen-Reduction Potential in water, among other parameters. Various sensors are employed for detection, including Residual Chlorine Sensor, Total Organic Carbon (TOC) Sensor, Turbidity Sensor, Conductivity Sensor, pH Sensor, and Oxygen-Reduction Potential (ORP) Sensor, among others (Smith, 2018). The Pakistan Council of Research in Water Resources (PCRWR) is tasked with monitoring the quality of safe drinking water in numerous urban and rural areas of Pakistan. On October 20, 2021, a program titled “National Water Quality Monitoring Program” was launched to assess and evaluate the issues pertaining to drinking water throughout Pakistan (PCWR, 2021). To achieve the 6.1 target established by the UN Sustainable Development Goals, Pakistan must double the enhancement of water quality. PCRWR operates a network of 24 water quality laboratories that function continuously throughout Pakistan, diligently striving to enhance the water quality system nationwide. A proposal is made for the process and capacity enhancement of PCRWR, including the establishment of offices and laboratories nationwide, particularly in the undeveloped region of Baluchistan. The government of Baluchistan should establish community-level water filtration plants in rural and urban areas to remove contaminants such as salinity, arsenic, and other pollutants. Distribute low-cost household water purification solutions, such as ceramic filters, chlorination tablets, and portable filtration systems, to underserved communities. Repair and upgrade existing water supply networks, pipelines, and storage tanks to prevent leaks and contamination. Ensure proper sanitation around water sources. Implement the waste-water management systems to prevent the contamination of natural water sources. Establish wastewater treatment facilities in urban and semi-urban areas. Safeguard natural springs and aquifers from pollution and over-extraction. Establish buffer zones around water sources and regulate industrial or agricultural activities near them. Set up solar-powered water kiosks in remote areas to provide filtered drinking water to communities. These can be operated and maintained through local committees. Regularly test water sources for contaminants and publish data to ensure accountability. Equip local health departments with tools and training for water quality monitoring. Conduct awareness campaigns on the importance of hygiene and safe water handling, including storing drinking water in clean containers and boiling water when necessary. Utilize innovative solutions such as solar-powered desalination systems, ultraviolet (UV) disinfection units, and IoT-enabled water quality sensors to address clean drinking water challenges effectively.
5.3. Recycling of Wastewater
The government of Baluchistan through proper installation of treatment plants can filter the sewage or wastewater which can then be used for irrigation, washing and cleaning. The treatment plants use seven basic steps for the cleaning and filtering of wastewater, which includes screening, aeration, coagulation and flocculation, sedimentation, filtration, chlorination and supplementary treatment.
Conclusion
Water security and quality are pressing concerns in Baluchistan, necessitating immediate and comprehensive solutions. The province’s arid environment, excessive dependence on groundwater, and restricted surface water supplies have resulted in extensive water scarcity, intensified by ineffective water management and unsustainable farming practices. The deterioration of water quality from natural toxins such as arsenic and fluoride, together with anthropogenic factors such industrial effluent, agricultural runoff, and insufficient wastewater management, has exacerbated the scarcity of water resources. The dual crises provide significant dangers to public health, livelihoods, and the socio-economic stability of the region.
Addressing water security and quality in Baluchistan necessitates a holistic strategy that incorporates sustainable water management, infrastructure enhancement, and community involvement. Improving rainwater gathering and constructing tiny check dams can substantially enhance water storage and groundwater replenishment. Upgrading irrigation infrastructure and advocating for smart farming practices can minimize water wastage while sustaining productivity. Investments in wastewater treatment facilities and the enforcement of rigorous regulations to mitigate industrial and agricultural pollution are essential for maintaining water quality. Ensuring water security and enhancing water quality in Baluchistan is essential for the province’s sustained development and the welfare of its inhabitants. Cooperative initiatives among the government, local communities, and foreign organizations can facilitate a future in which access to clean and adequate water is attainable for all inhabitants of Baluchistan. It is appreciated that this study shall find its place in the relevant government ministries of Baluchistan as a policy input for addressing the impending human security and national security issues and contribute significantly towards attainment of water related UNSDGs.
Funding
No funding was provided for this study.
Ethics committee approval
The study has been approved by Ethics Committee of National University of Modern Languages (NUML), Islamabad vide letter number ML-R&SI/3743 dated December 30, 2024
Data Availability
The author declares that the data and empirical analyses supporting the findings of this research article are available within this article in the form of figures and tables.
Conflict of Interest
No conflict of Interest has reported by the author.
References
- World Bank World Bank, “World Bank Pakistani Population,” World Bank Open Data, December 19, 2024, https://data.worldbank.org.
- UN Habitat, “Pakistan Country Report 2023” (UN-Habitat, December 31, 2023), https://unhabitat.org/sites/default/files/2023/06/4._pakistan_country_report_2023_b5_final_compressed.pdf.
- .
- M. K. Daud et al., “Drinking Water Quality Status and Contamination in Pakistan,” BioMed Research International 2017, no. 1 (2017): 7908183, . [CrossRef]
- Azizullah Azizullah et al., “Water Pollution in Pakistan and Its Impact on Public Health — A Review,” Environment International 37, no. 2 (February 1, 2011): 479–97, . [CrossRef]
- Maimoona Raza et al., “Groundwater Status in Pakistan: A Review of Contamination, Health Risks, and Potential Needs,” Critical Reviews in Environmental Science and Technology 47, no. 18 (September 17, 2017): 1713–62, . [CrossRef]
- Waseem Ishaque, Rida Tanvir, and Mudassir Mukhtar, “Climate Change and Water Crises in Pakistan: Implications on Water Quality and Health Risks,” Journal of Environmental and Public Health 2022, no. 1 (2022): 5484561, . [CrossRef]
- Waseem Ishaque, Mudassir Mukhtar, and Rida Tanvir, “Pakistan’s Water Resource Management: Ensuring Water Security for Sustainable Development,” Frontiers in Environmental Science 11 (January 20, 2023), . [CrossRef]
- Waseem Ishaque, Khalid Sultan, and Zia ur Rehman, “Water Management and Sustainable Development in Pakistan: Environmental and Health Impacts of Water Quality on Achieving the UNSDGs by 2030,” Frontiers in Water 6 (February 8, 2024), . [CrossRef]
- Safdar Bashir et al., “Impacts of Water Quality on Human Health in Pakistan,” in Water Resources of Pakistan: Issues and Impacts, ed. Muhammad Arif Watto, Michael Mitchell, and Safdar Bashir (Cham: Springer International Publishing, 2021), 225–47, . [CrossRef]
- Misbah Fida et al., “Water Contamination and Human Health Risks in Pakistan: A Review,” Exposure and Health 15, no. 3 (September 1, 2023): 619–39, . [CrossRef]
- Waseem Ishaque, Shuja Mahesar Ahmed, and Imdad Sahito Hussain, “Influence of Climate Change on Pakistan’s National Security,” Grassroots 49, no. 2 (December 31, 2015): 65.
- Mudassar Hussain et al., “A Comprehensive Review of Climate Change Impacts, Adaptation, and Mitigation on Environmental and Natural Calamities in Pakistan,” Environmental Monitoring and Assessment 192, no. 1 (December 16, 2019): 48, . [CrossRef]
- Shah Fahad and Jianling Wang, “Climate Change, Vulnerability, and Its Impacts in Rural Pakistan: A Review,” Environmental Science and Pollution Research 27, no. 2 (January 1, 2020): 1334–38, . [CrossRef]
- Mohammad Aslam Khan et al., “The Challenge of Climate Change and Policy Response in Pakistan,” Environmental Earth Sciences 75, no. 5 (February 24, 2016): 412, . [CrossRef]
- Sajjad Ali et al., “Climate Change and Its Impact on the Yield of Major Food Crops: Evidence from Pakistan,” Foods 6, no. 6 (June 2017): 39, . [CrossRef]
- Sadia Mariam Malik, Haroon Awan, and Niazullah Khan, “Mapping Vulnerability to Climate Change and Its Repercussions on Human Health in Pakistan,” Globalization and Health 8, no. 1 (September 3, 2012): 31, . [CrossRef]
- Toqeer Ahmed et al., “Water-Related Impacts of Climate Change on Agriculture and Subsequently on Public Health: A Review for Generalists with Particular Reference to Pakistan,” International Journal of Environmental Research and Public Health 13, no. 11 (November 2016): 1051, . [CrossRef]
- Muhammad Aamir Khan et al., “Economic Effects of Climate Change-Induced Loss of Agricultural Production by 2050: A Case Study of Pakistan,” Sustainability 12, no. 3 (January 2020): 1216, . [CrossRef]
- Alia Saeed et al., “Modelling the Impact of Climate Change on Dengue Outbreaks and Future Spatiotemporal Shift in Pakistan,” Environmental Geochemistry and Health 45, no. 6 (June 1, 2023): 3489–3505, . [CrossRef]
- Muhammad Nabeel Aslam et al., “Climate Change Impact on Water Scarcity in the Hub River Basin, Pakistan,” Groundwater for Sustainable Development 27, no. 1 (November 1, 2024): 101339, . [CrossRef]
- He Baocheng et al., “Impact of Climate Change on Water Scarcity in Pakistan. Implications for Water Management and Policy,” Journal of Water and Climate Change 15, no. 8 (July 2, 2024): 3602–23, . [CrossRef]
- Muhammad Nabeel Aslam et al., “Climate Change Impact on Water Scarcity in the Hub River Basin, Pakistan,” Groundwater for Sustainable Development 27 (November 1, 2024): 101339, . [CrossRef]
- Khurram Aslam Khan, “Water Scarcity and Its Impact on the Agricultural Sector of Balochistan,” Journal of Public Policy Practitioners 1, no. 1 (June 30, 2022): 01–66, . [CrossRef]
- Khan.
- Shamsul Islam, “Water Availability Has Dropped 500% since 1947,” The Express Tribune, June 20, 2011, sec. News, http://tribune.com.pk/story/193120/water-availability-has-dropped-500-since-194.
- M. K. Daud et al., “Drinking Water Quality Status and Contamination in Pakistan,” BioMed Research International 2017 (August 14, 2017): e7908183, . [CrossRef]
Figure 1.
Pakistan’s water availability and demand projection.
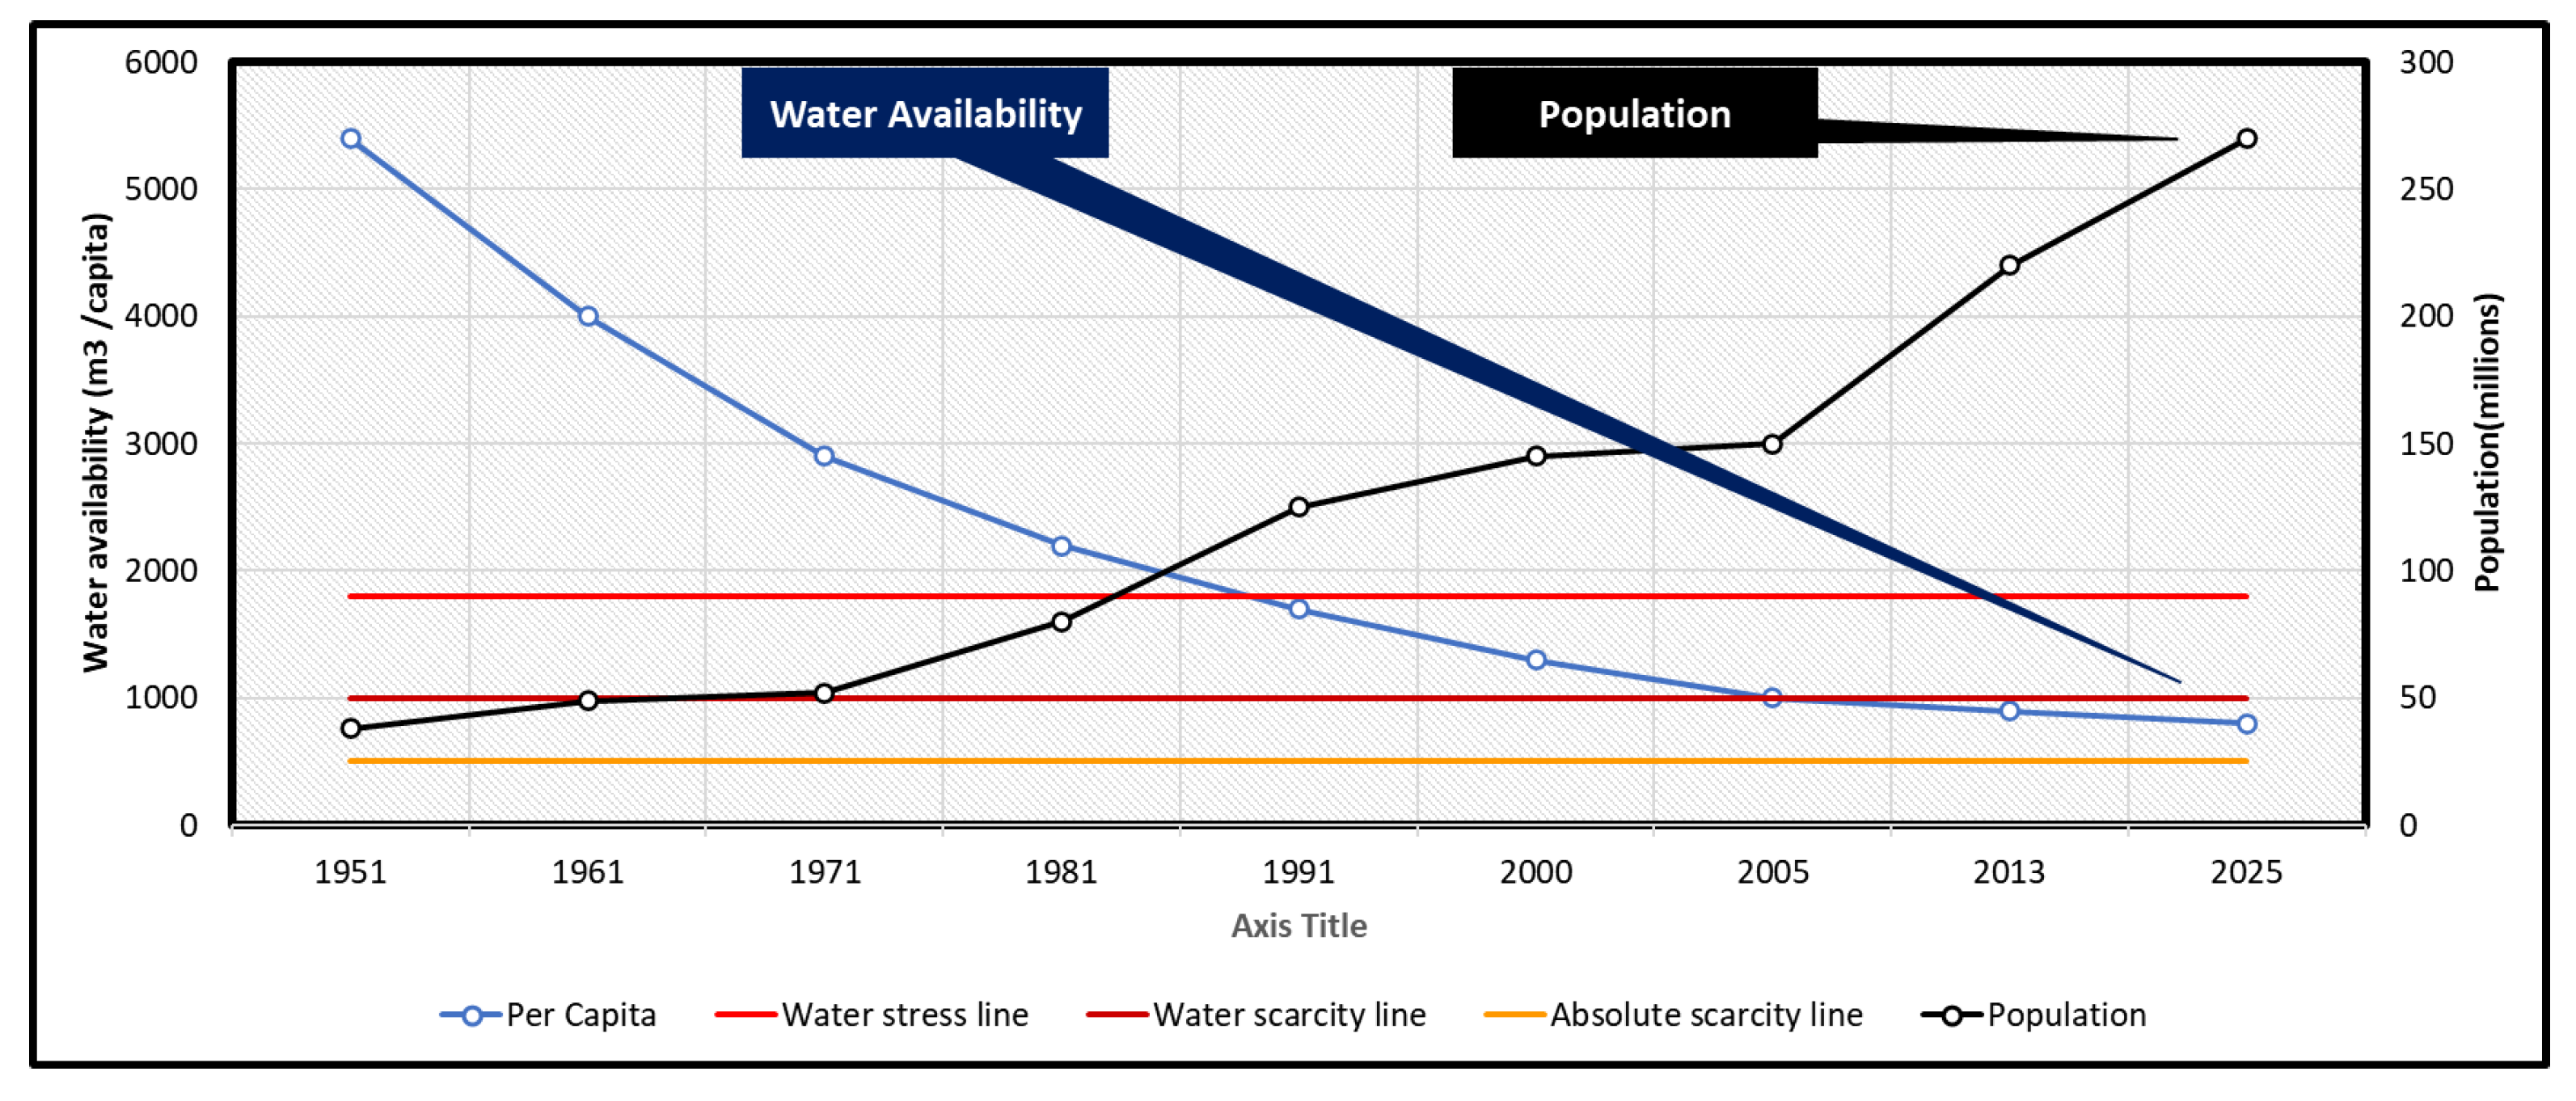
Figure 2.
Pakistan’s climate change rainfall data- metrological department.
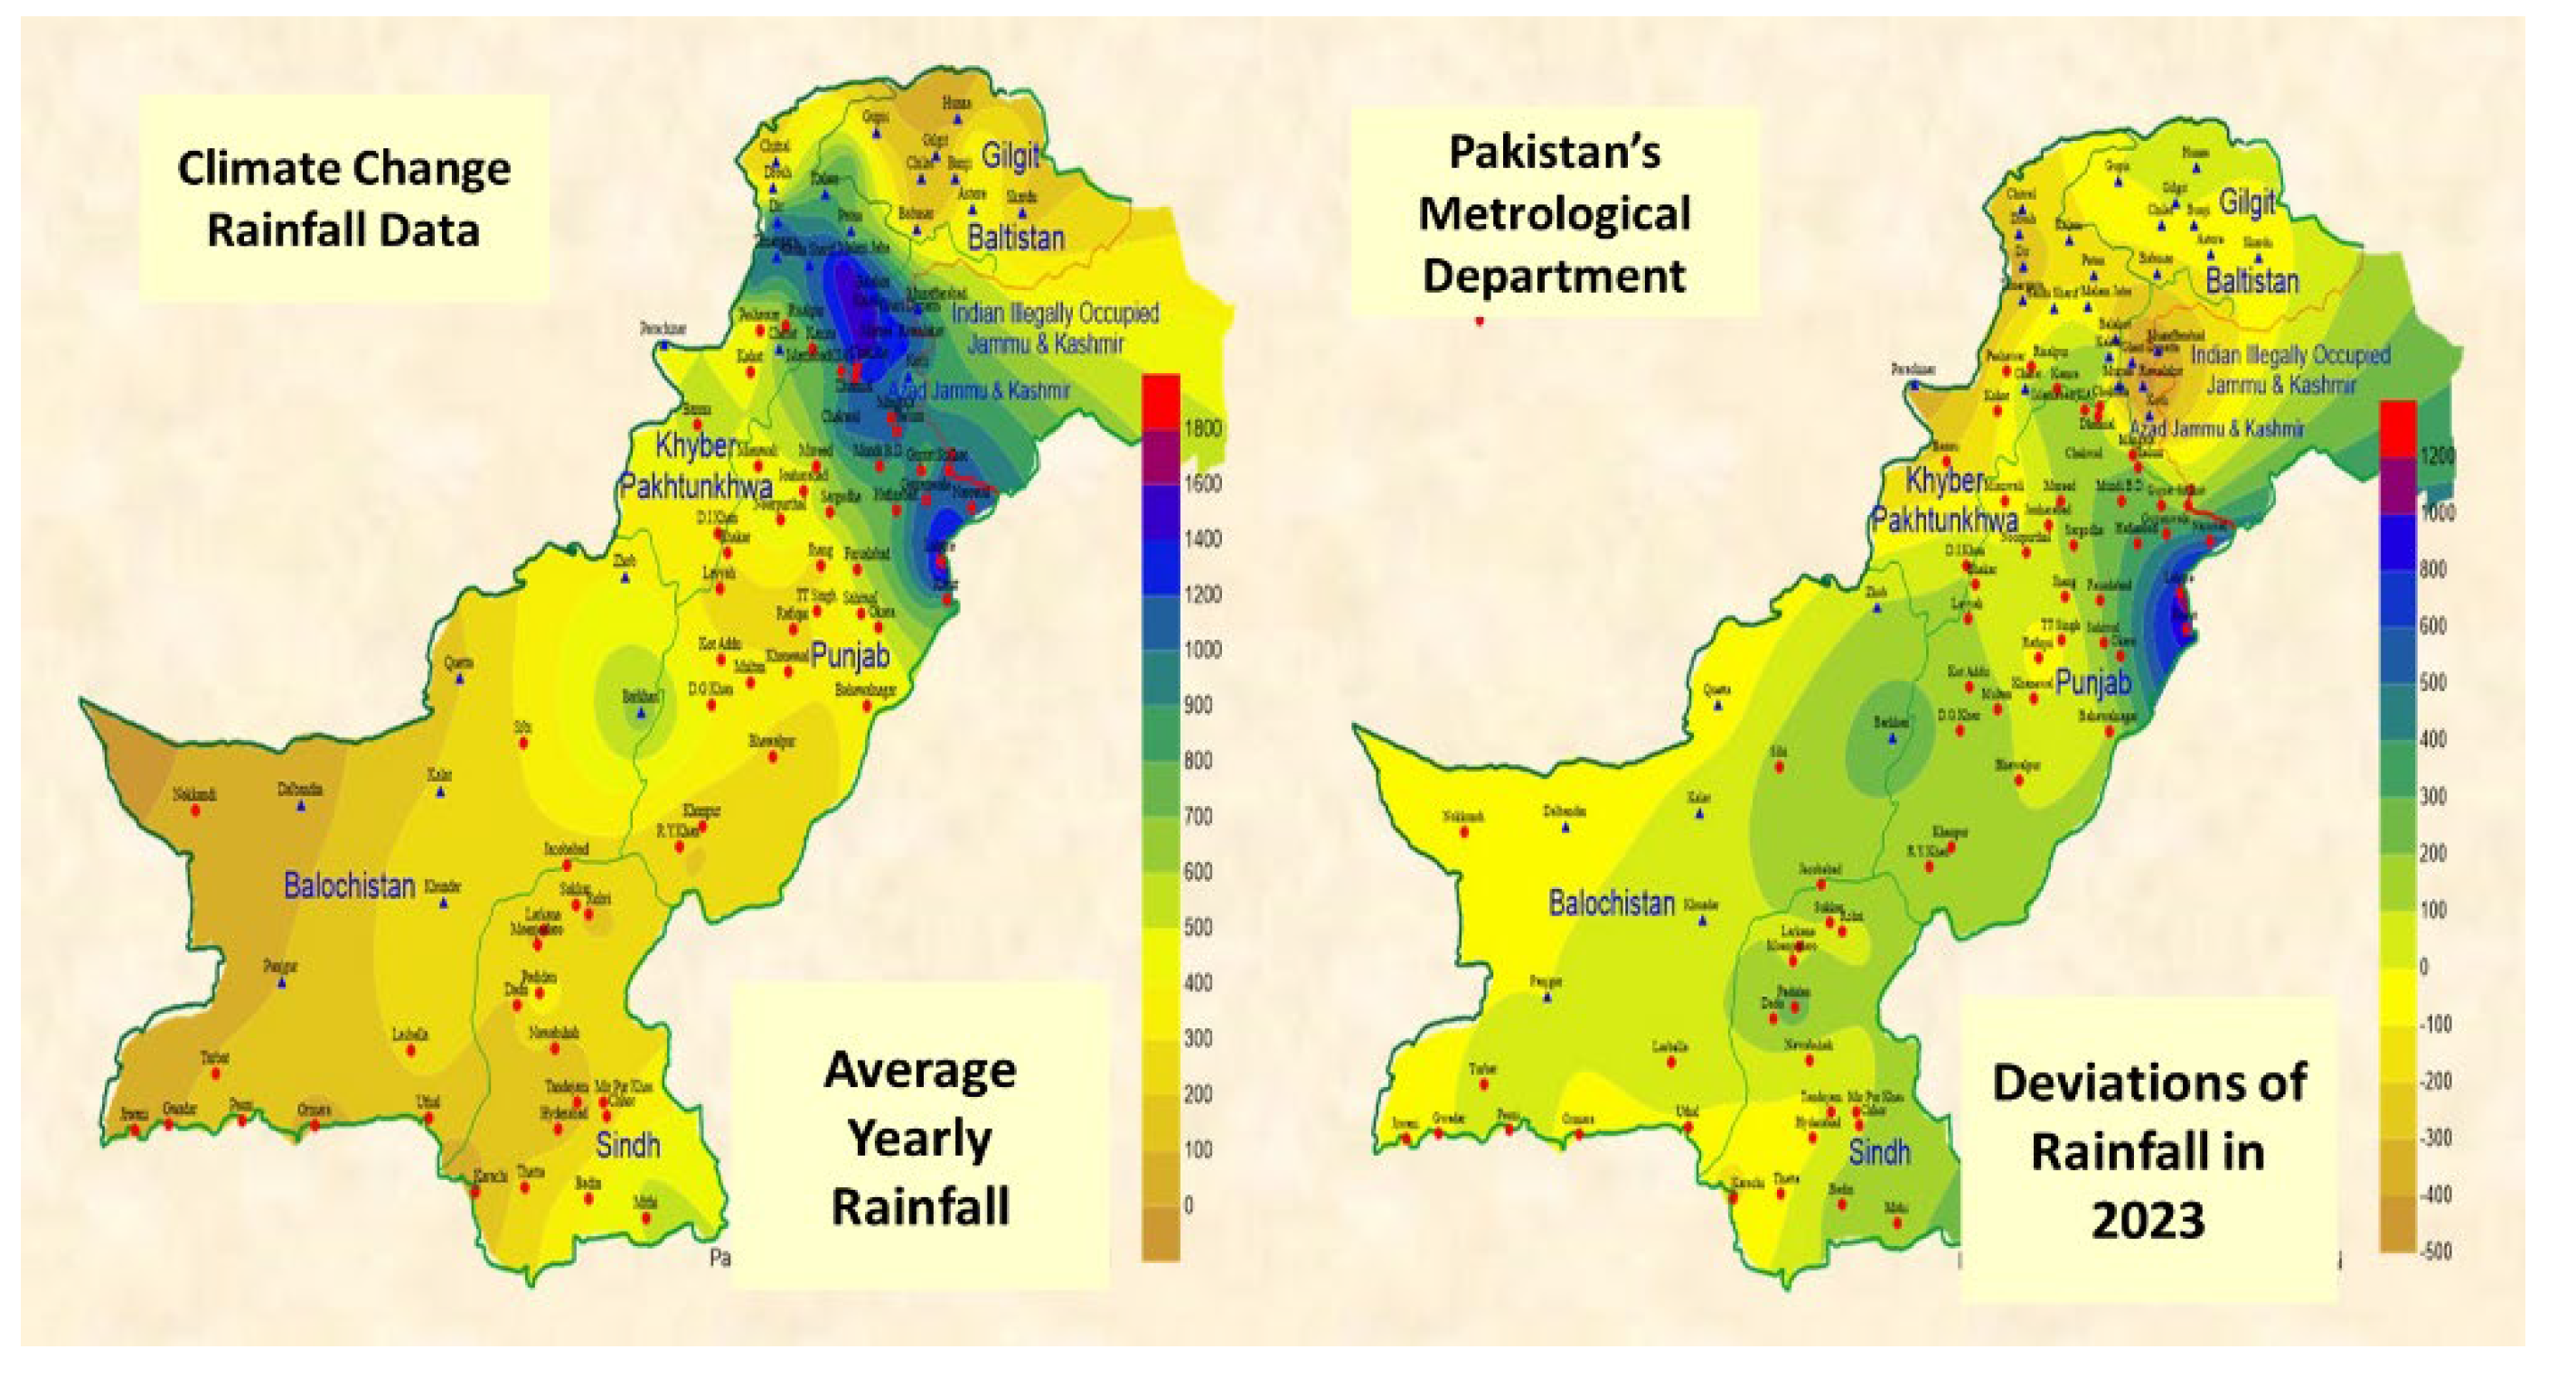
Figure 3.
Pakistan’s ground water compiled by authors from different sources.
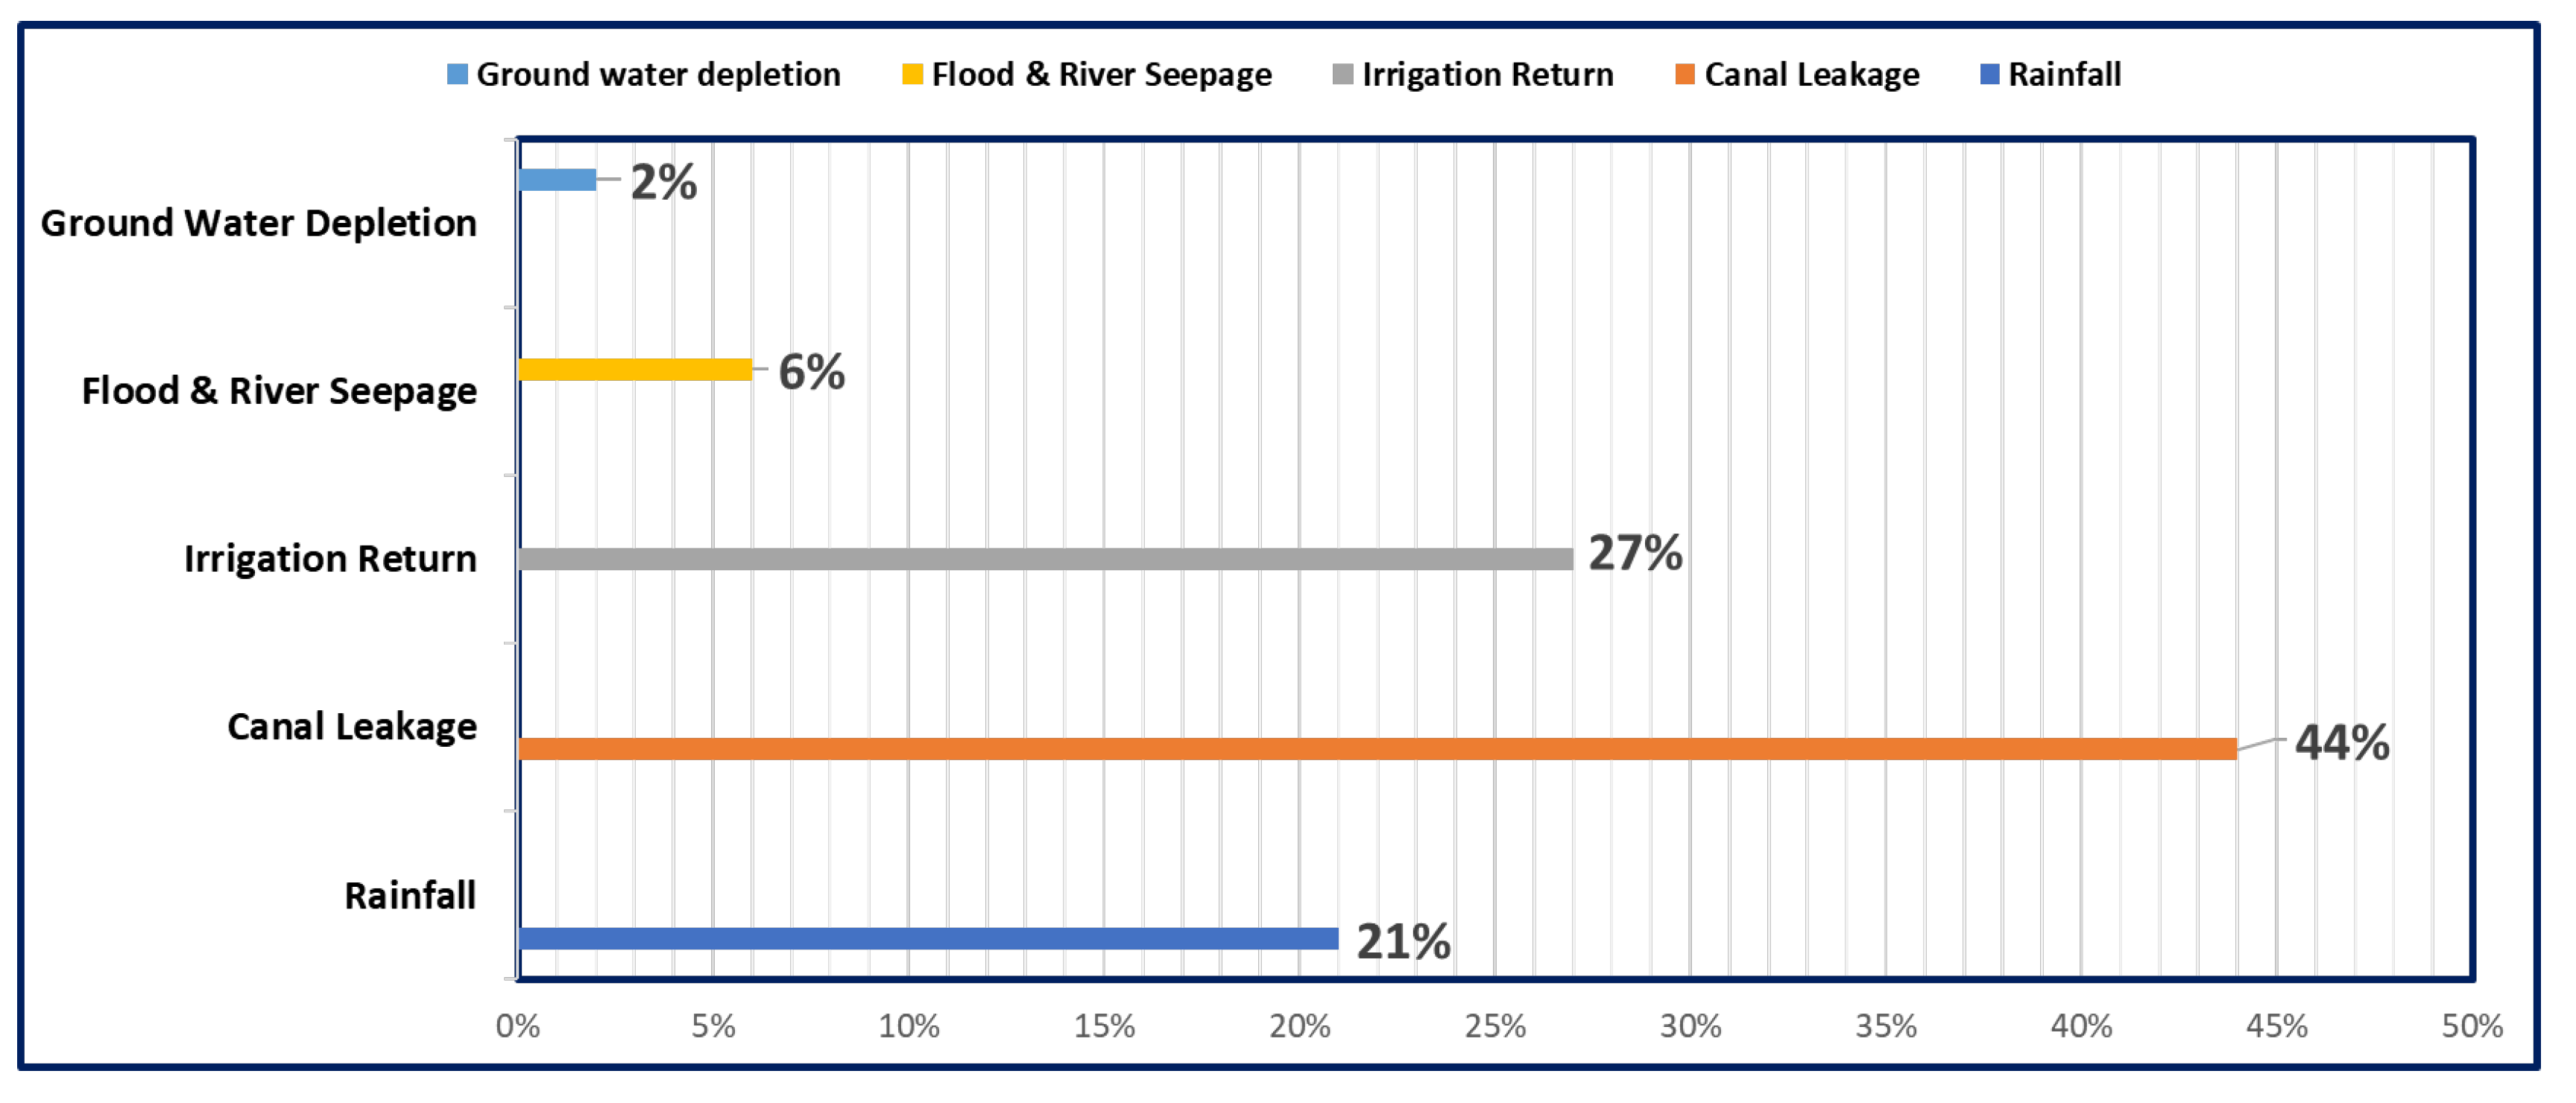
Figure 4.
Outline concept of materials and methods.
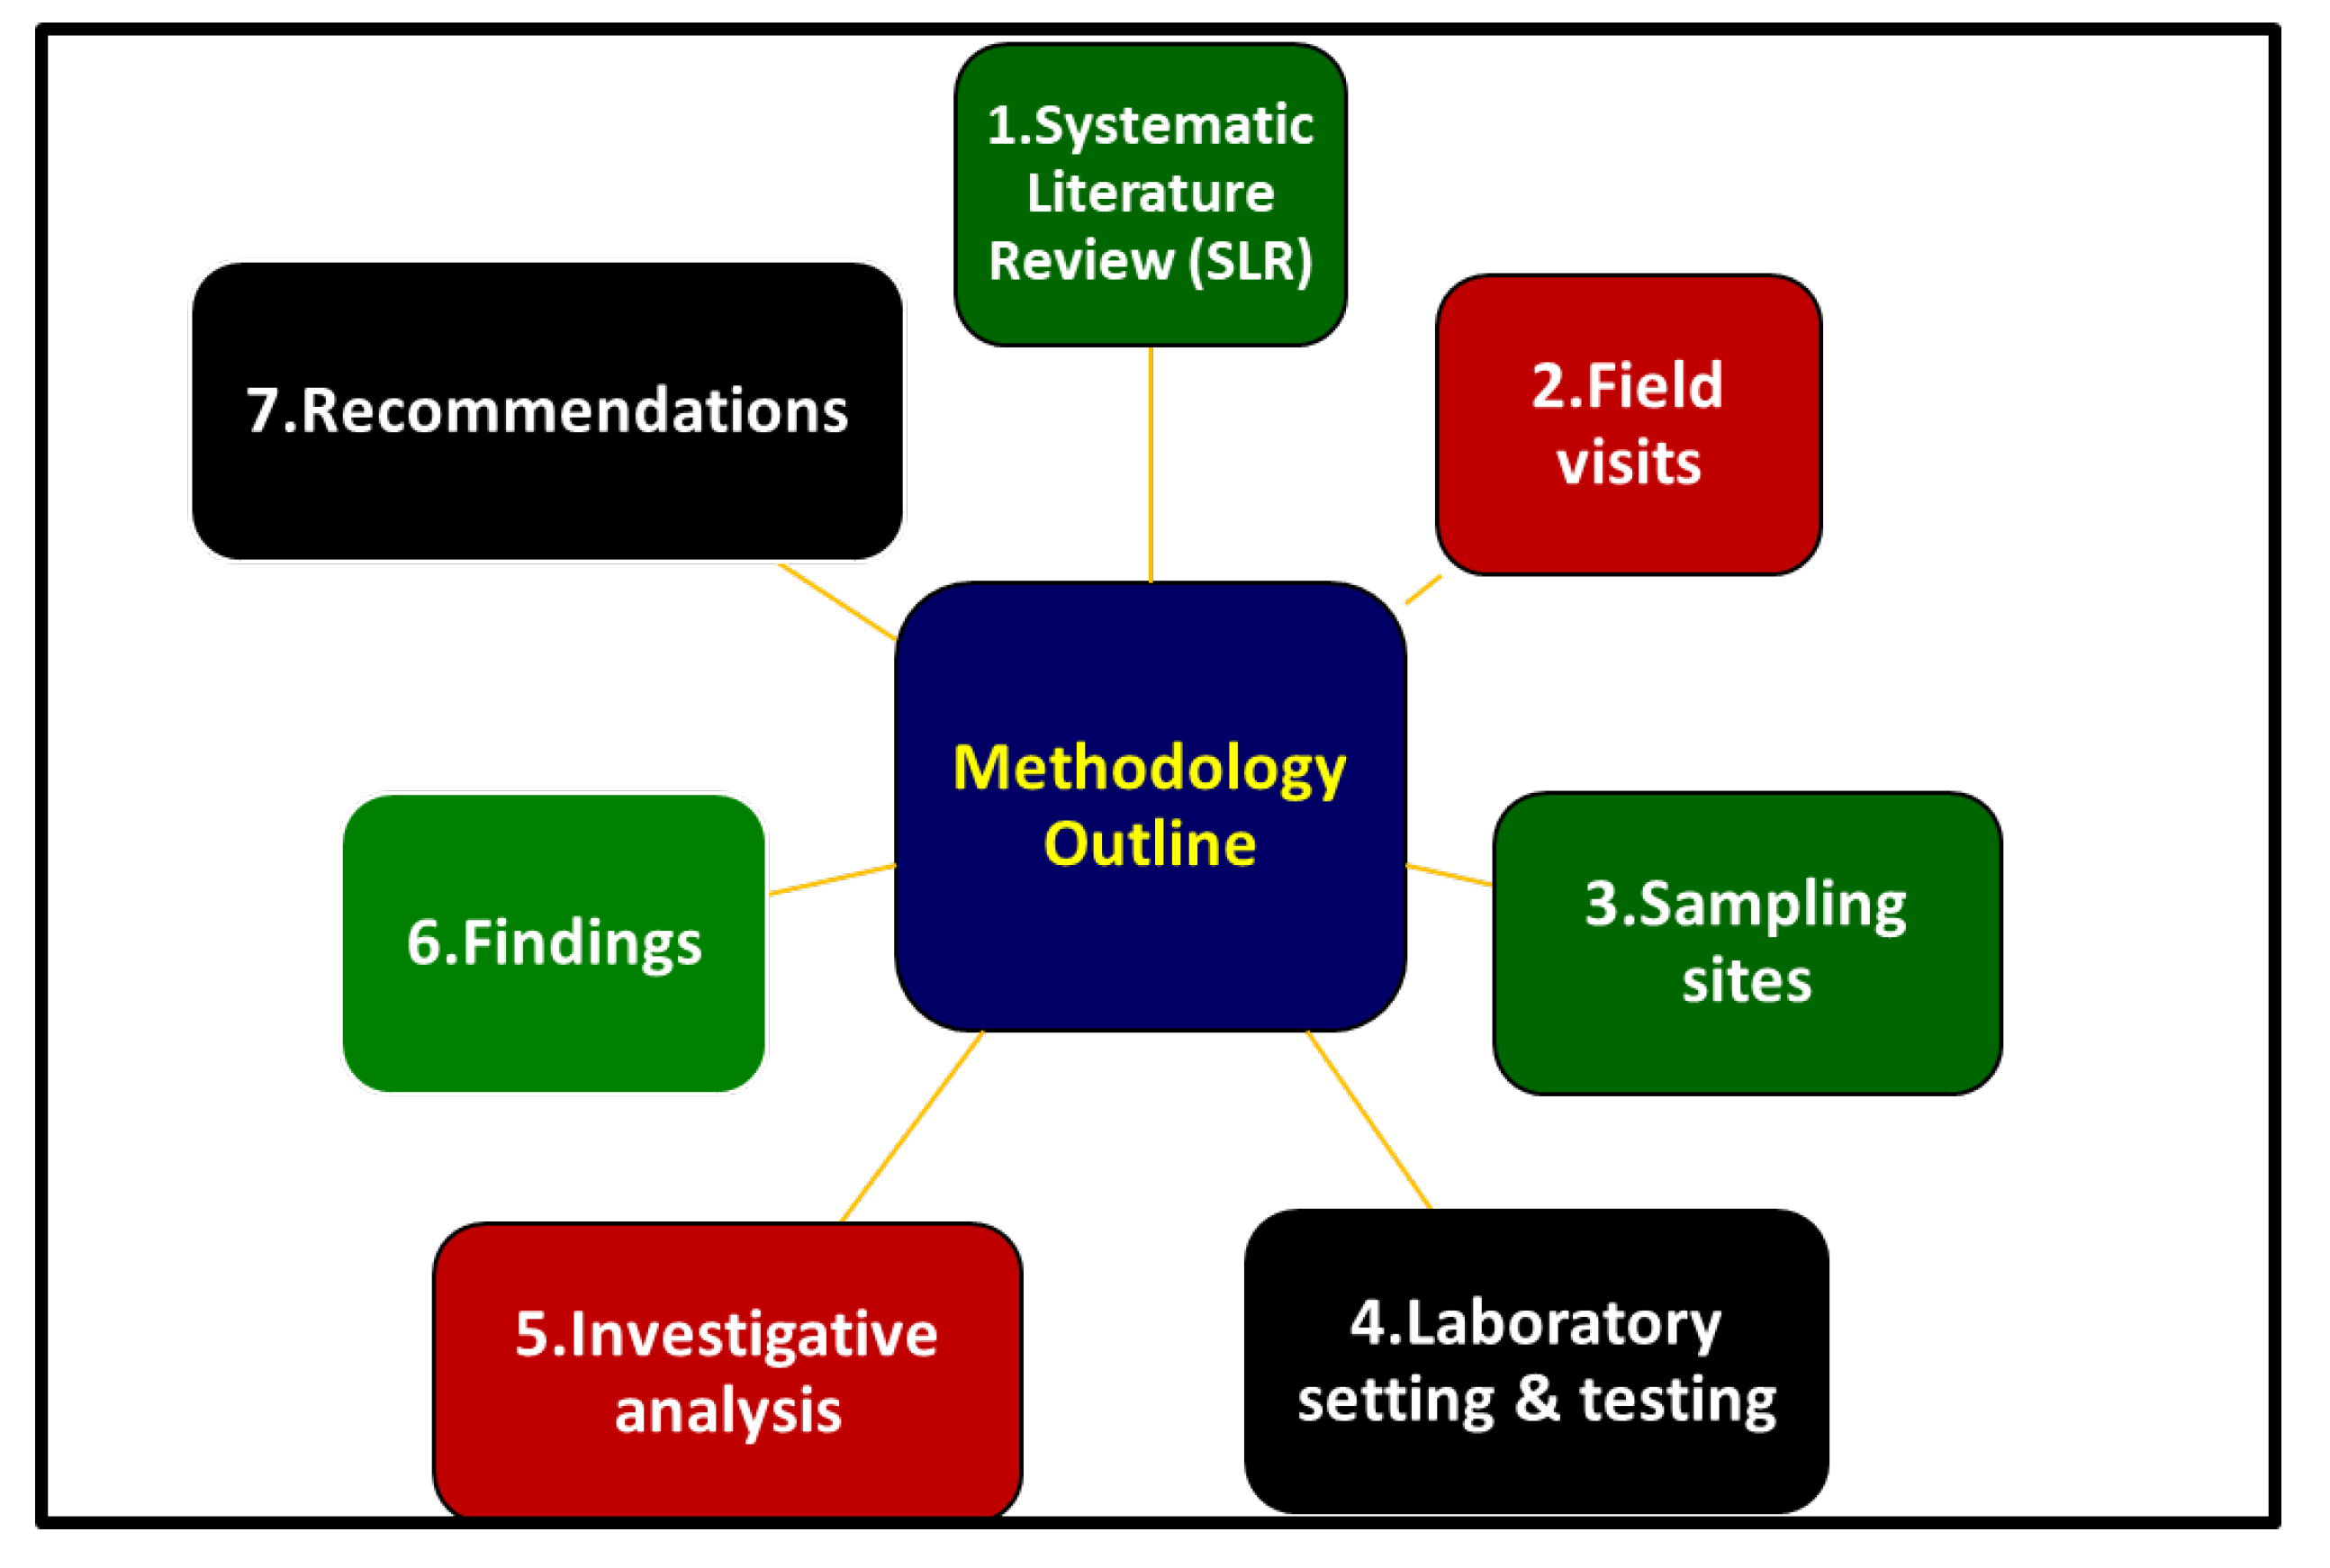
Figure 5.
Geographical regions of Baluchistan.
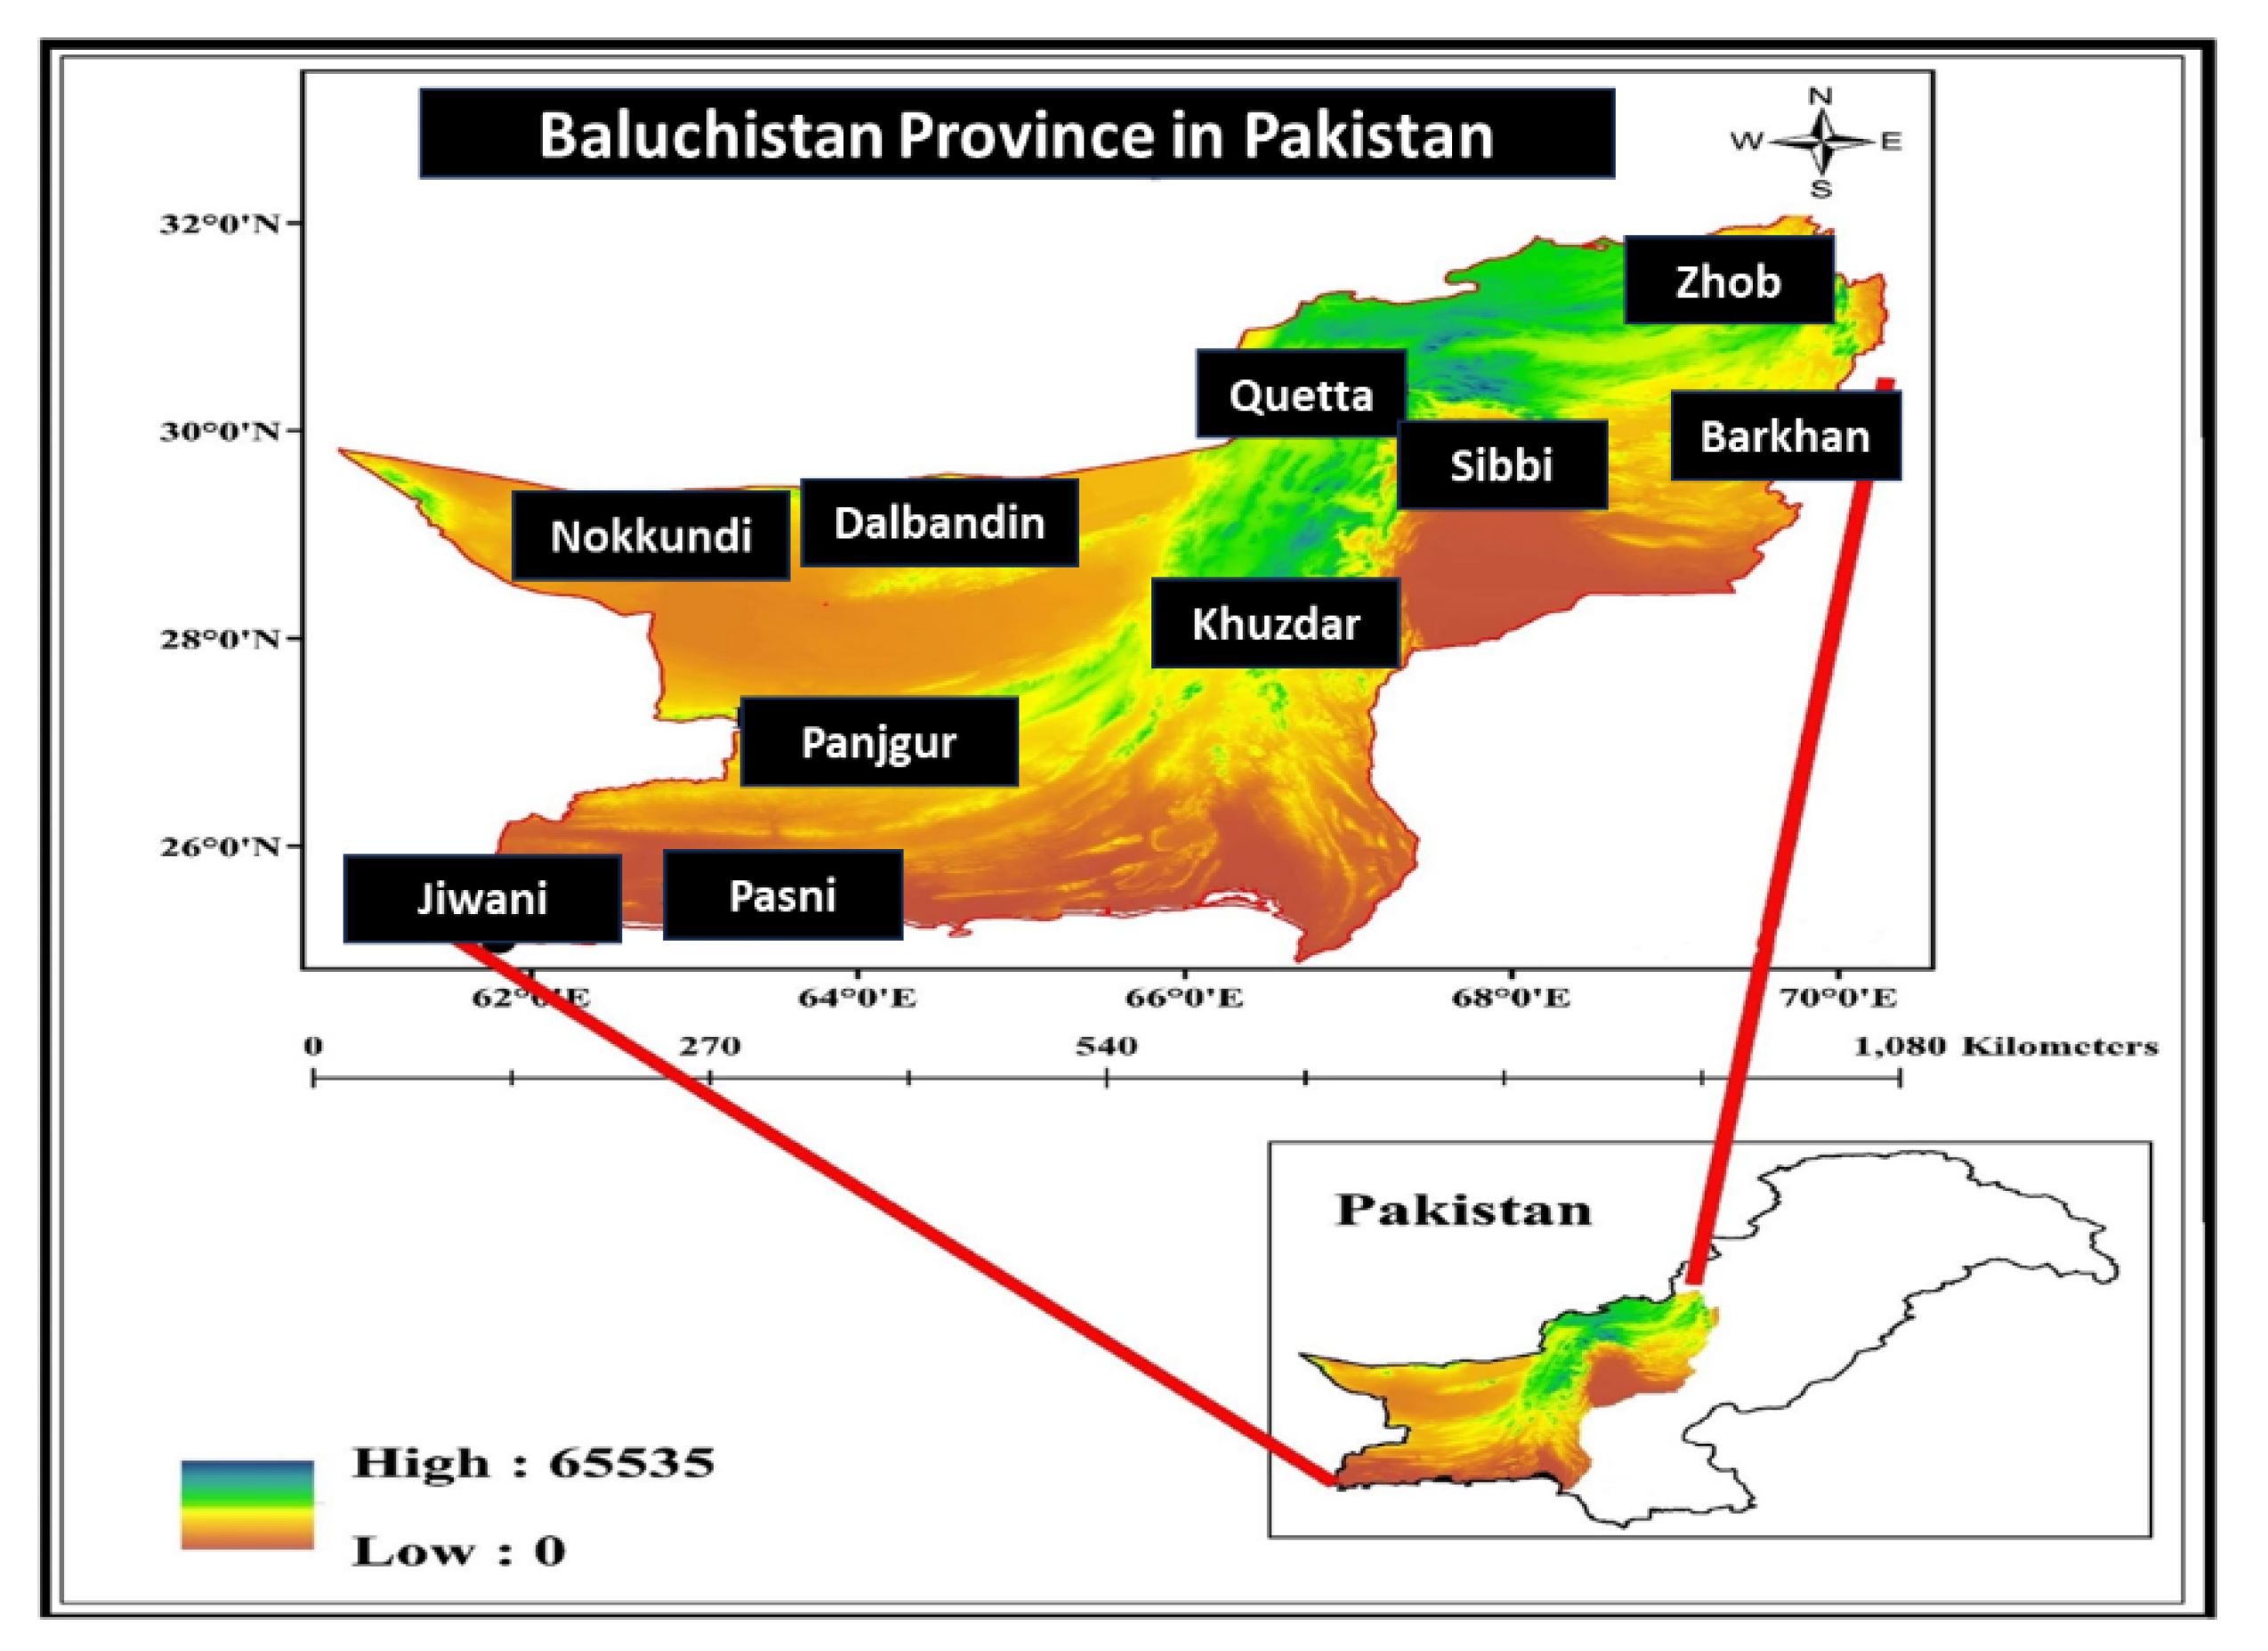
Figure 6.
Water sampling sites in Baluchistan.
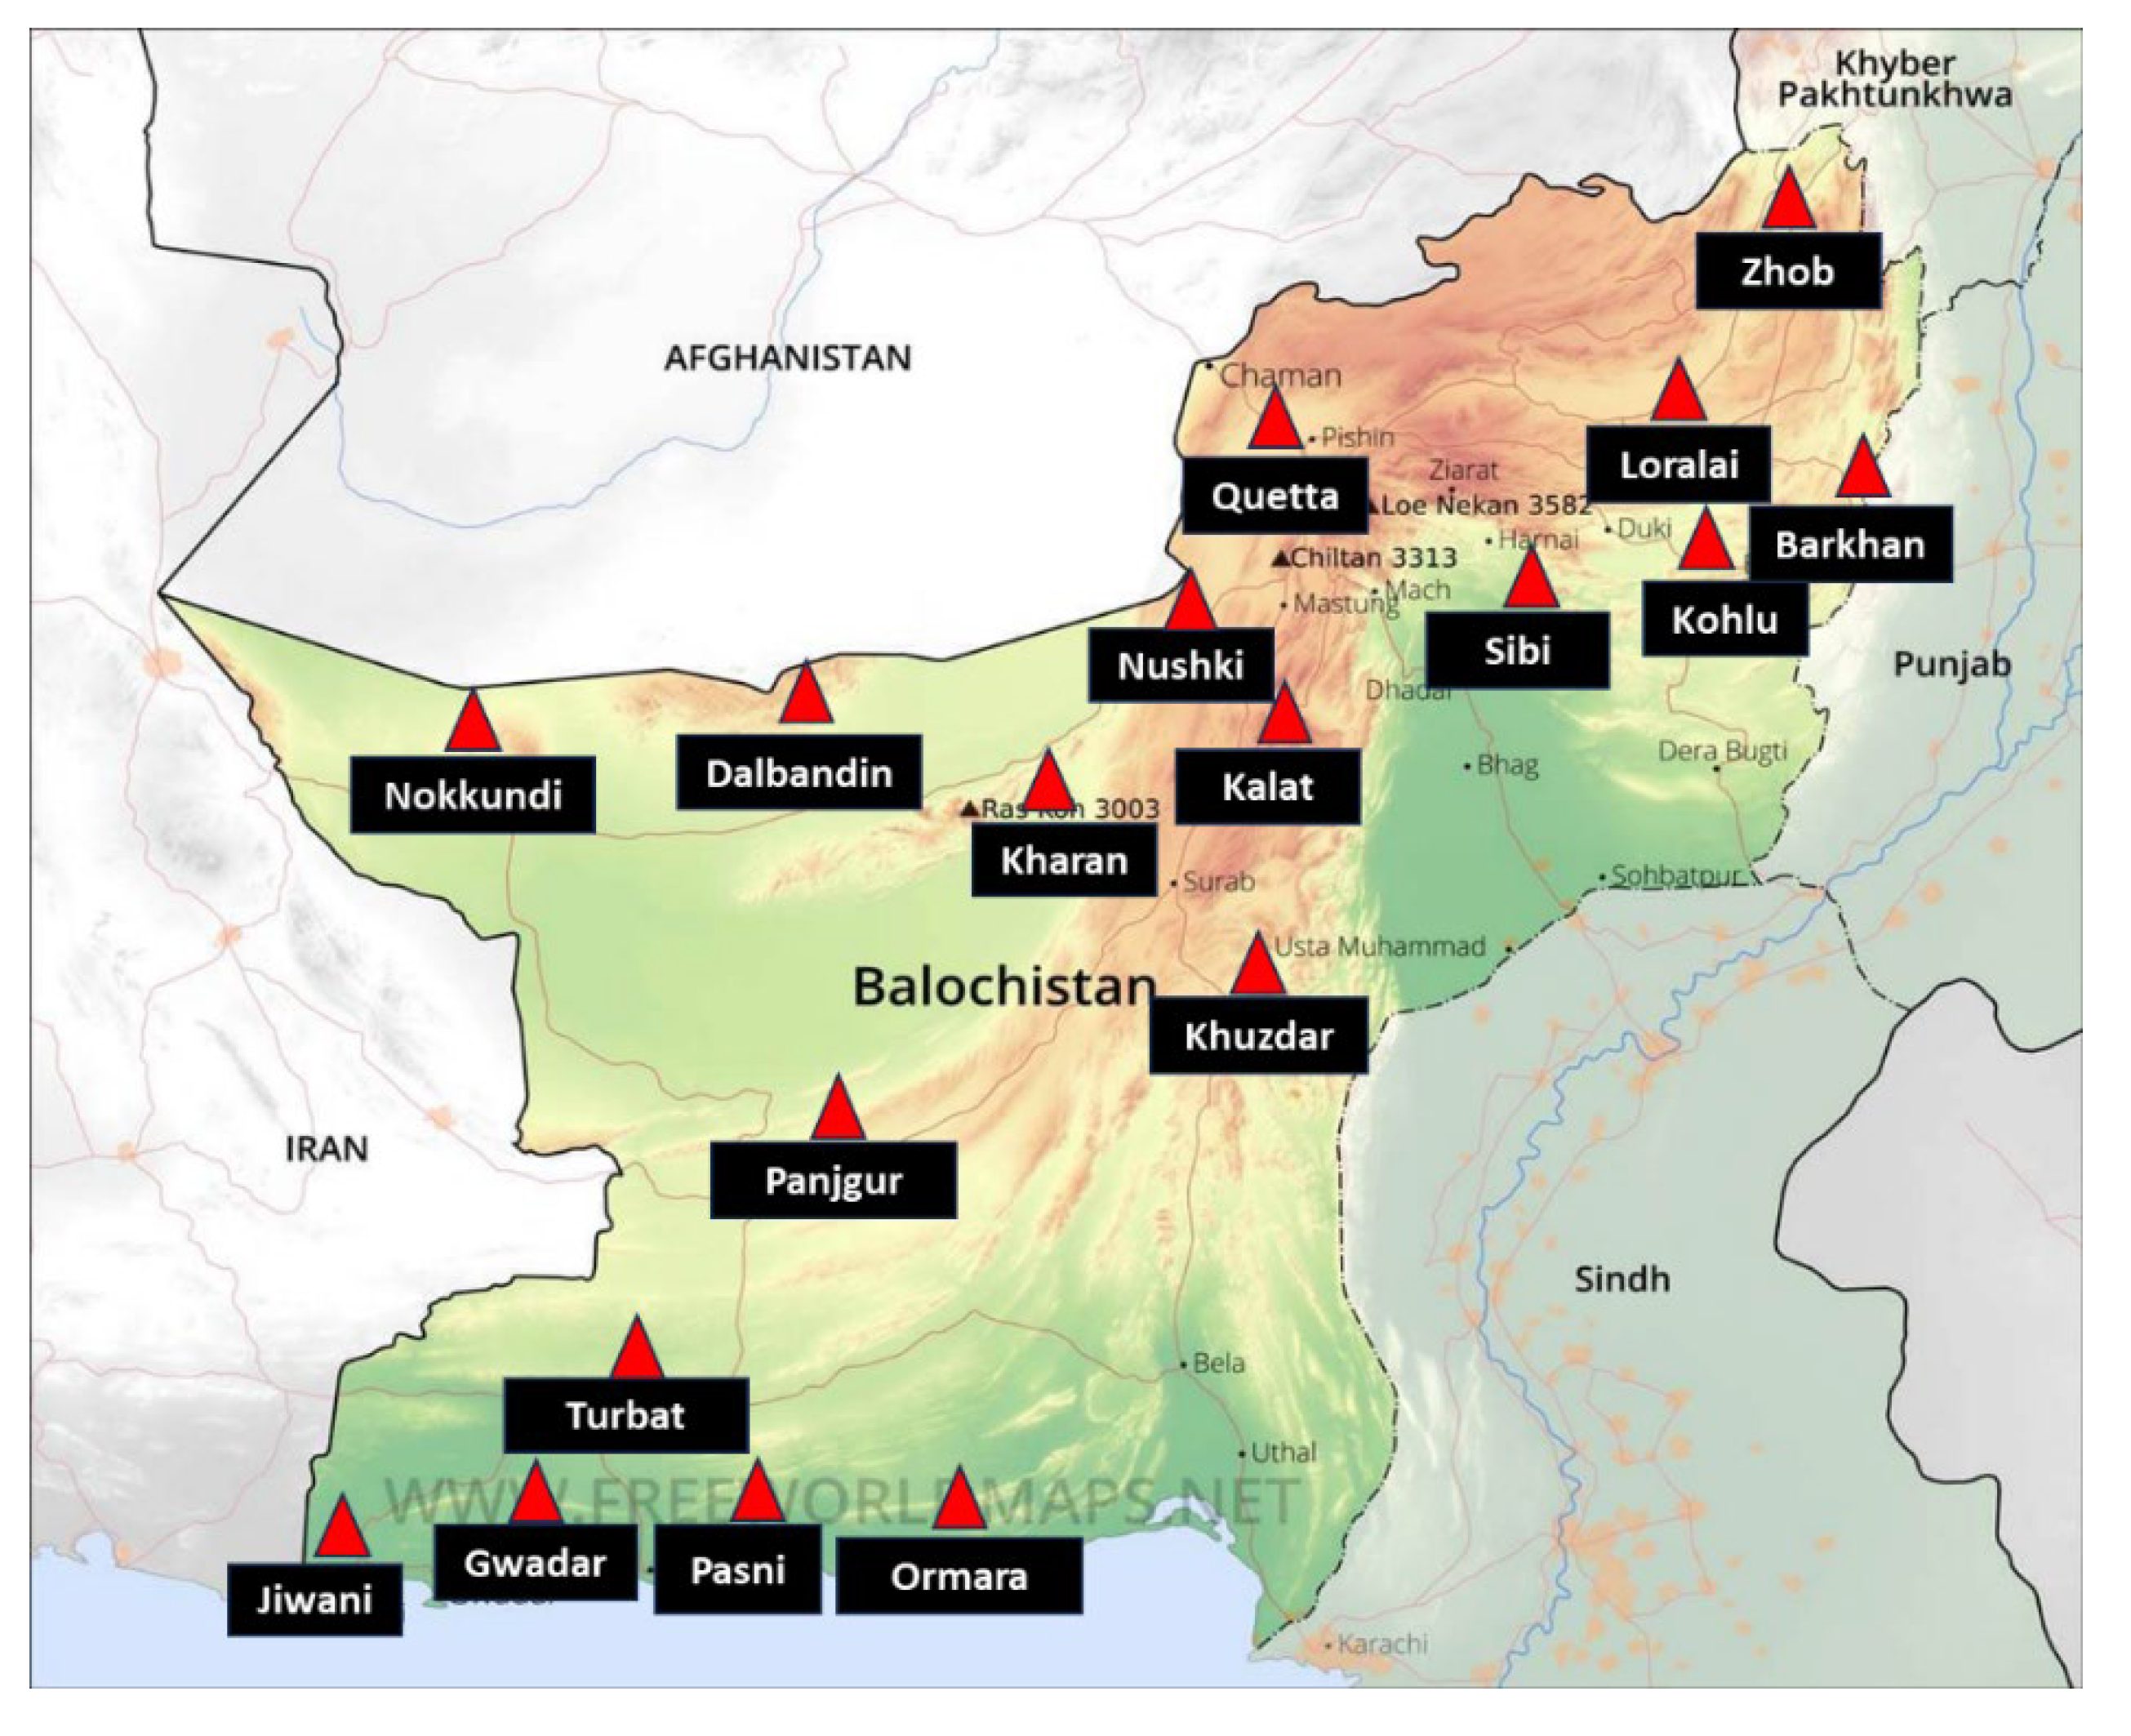
Figure 7.
Zonal distribution of sampling sites.
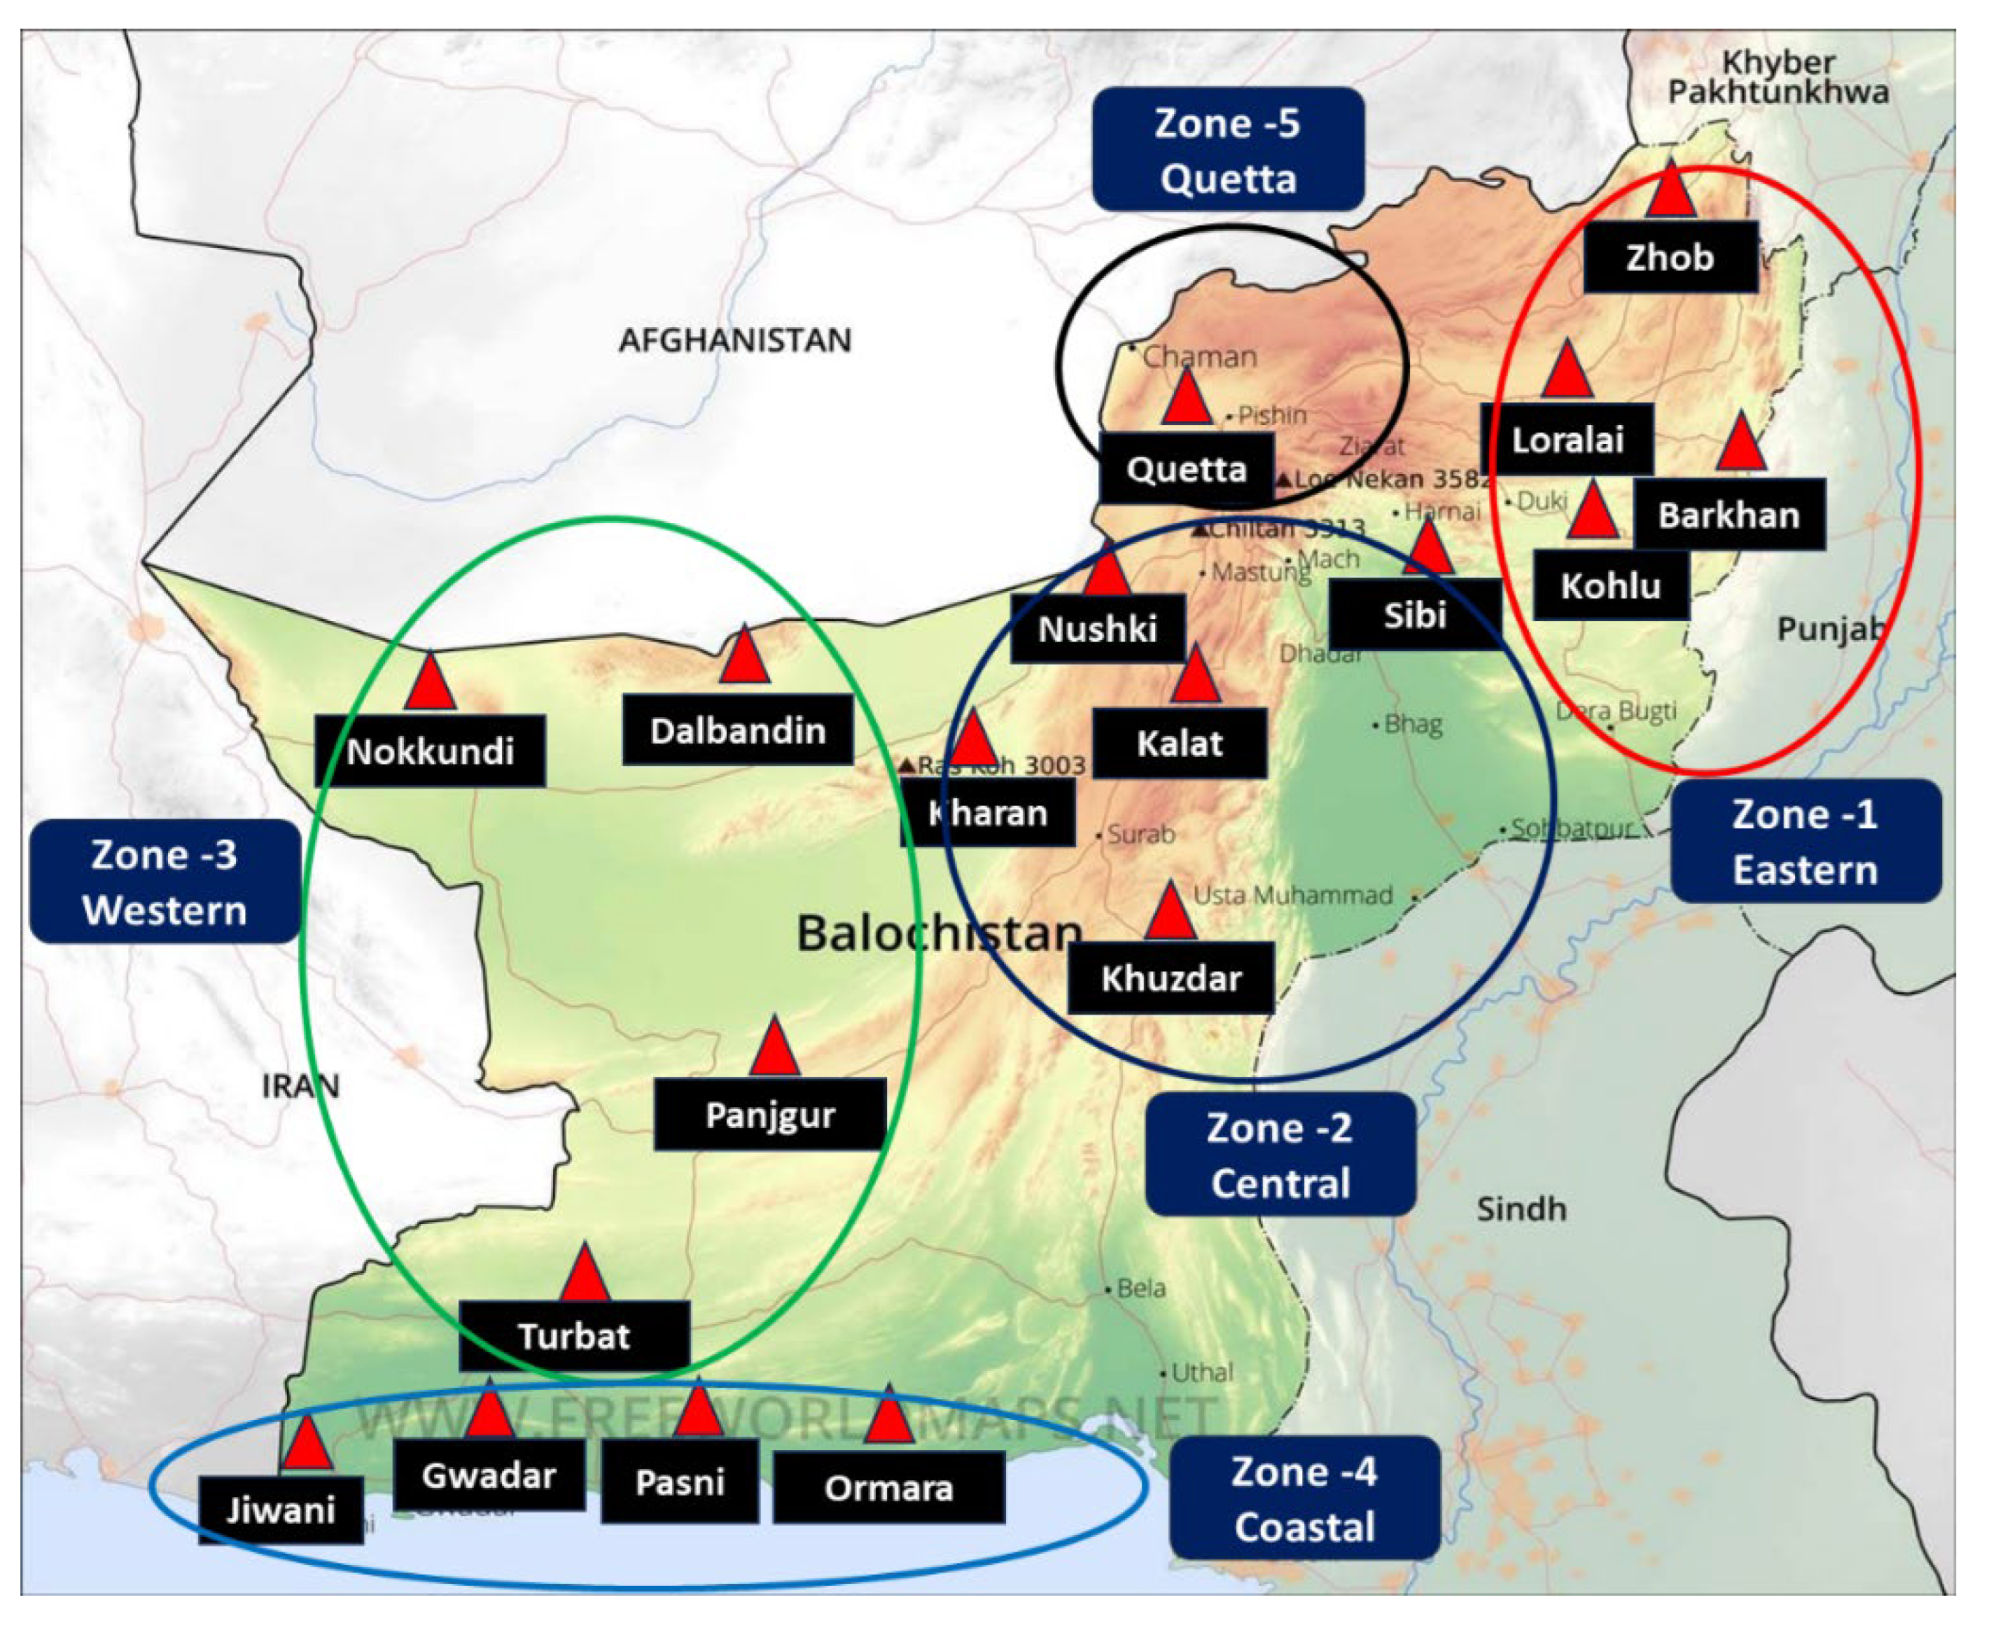
Figure 8.
Zone wise water contamination grades.
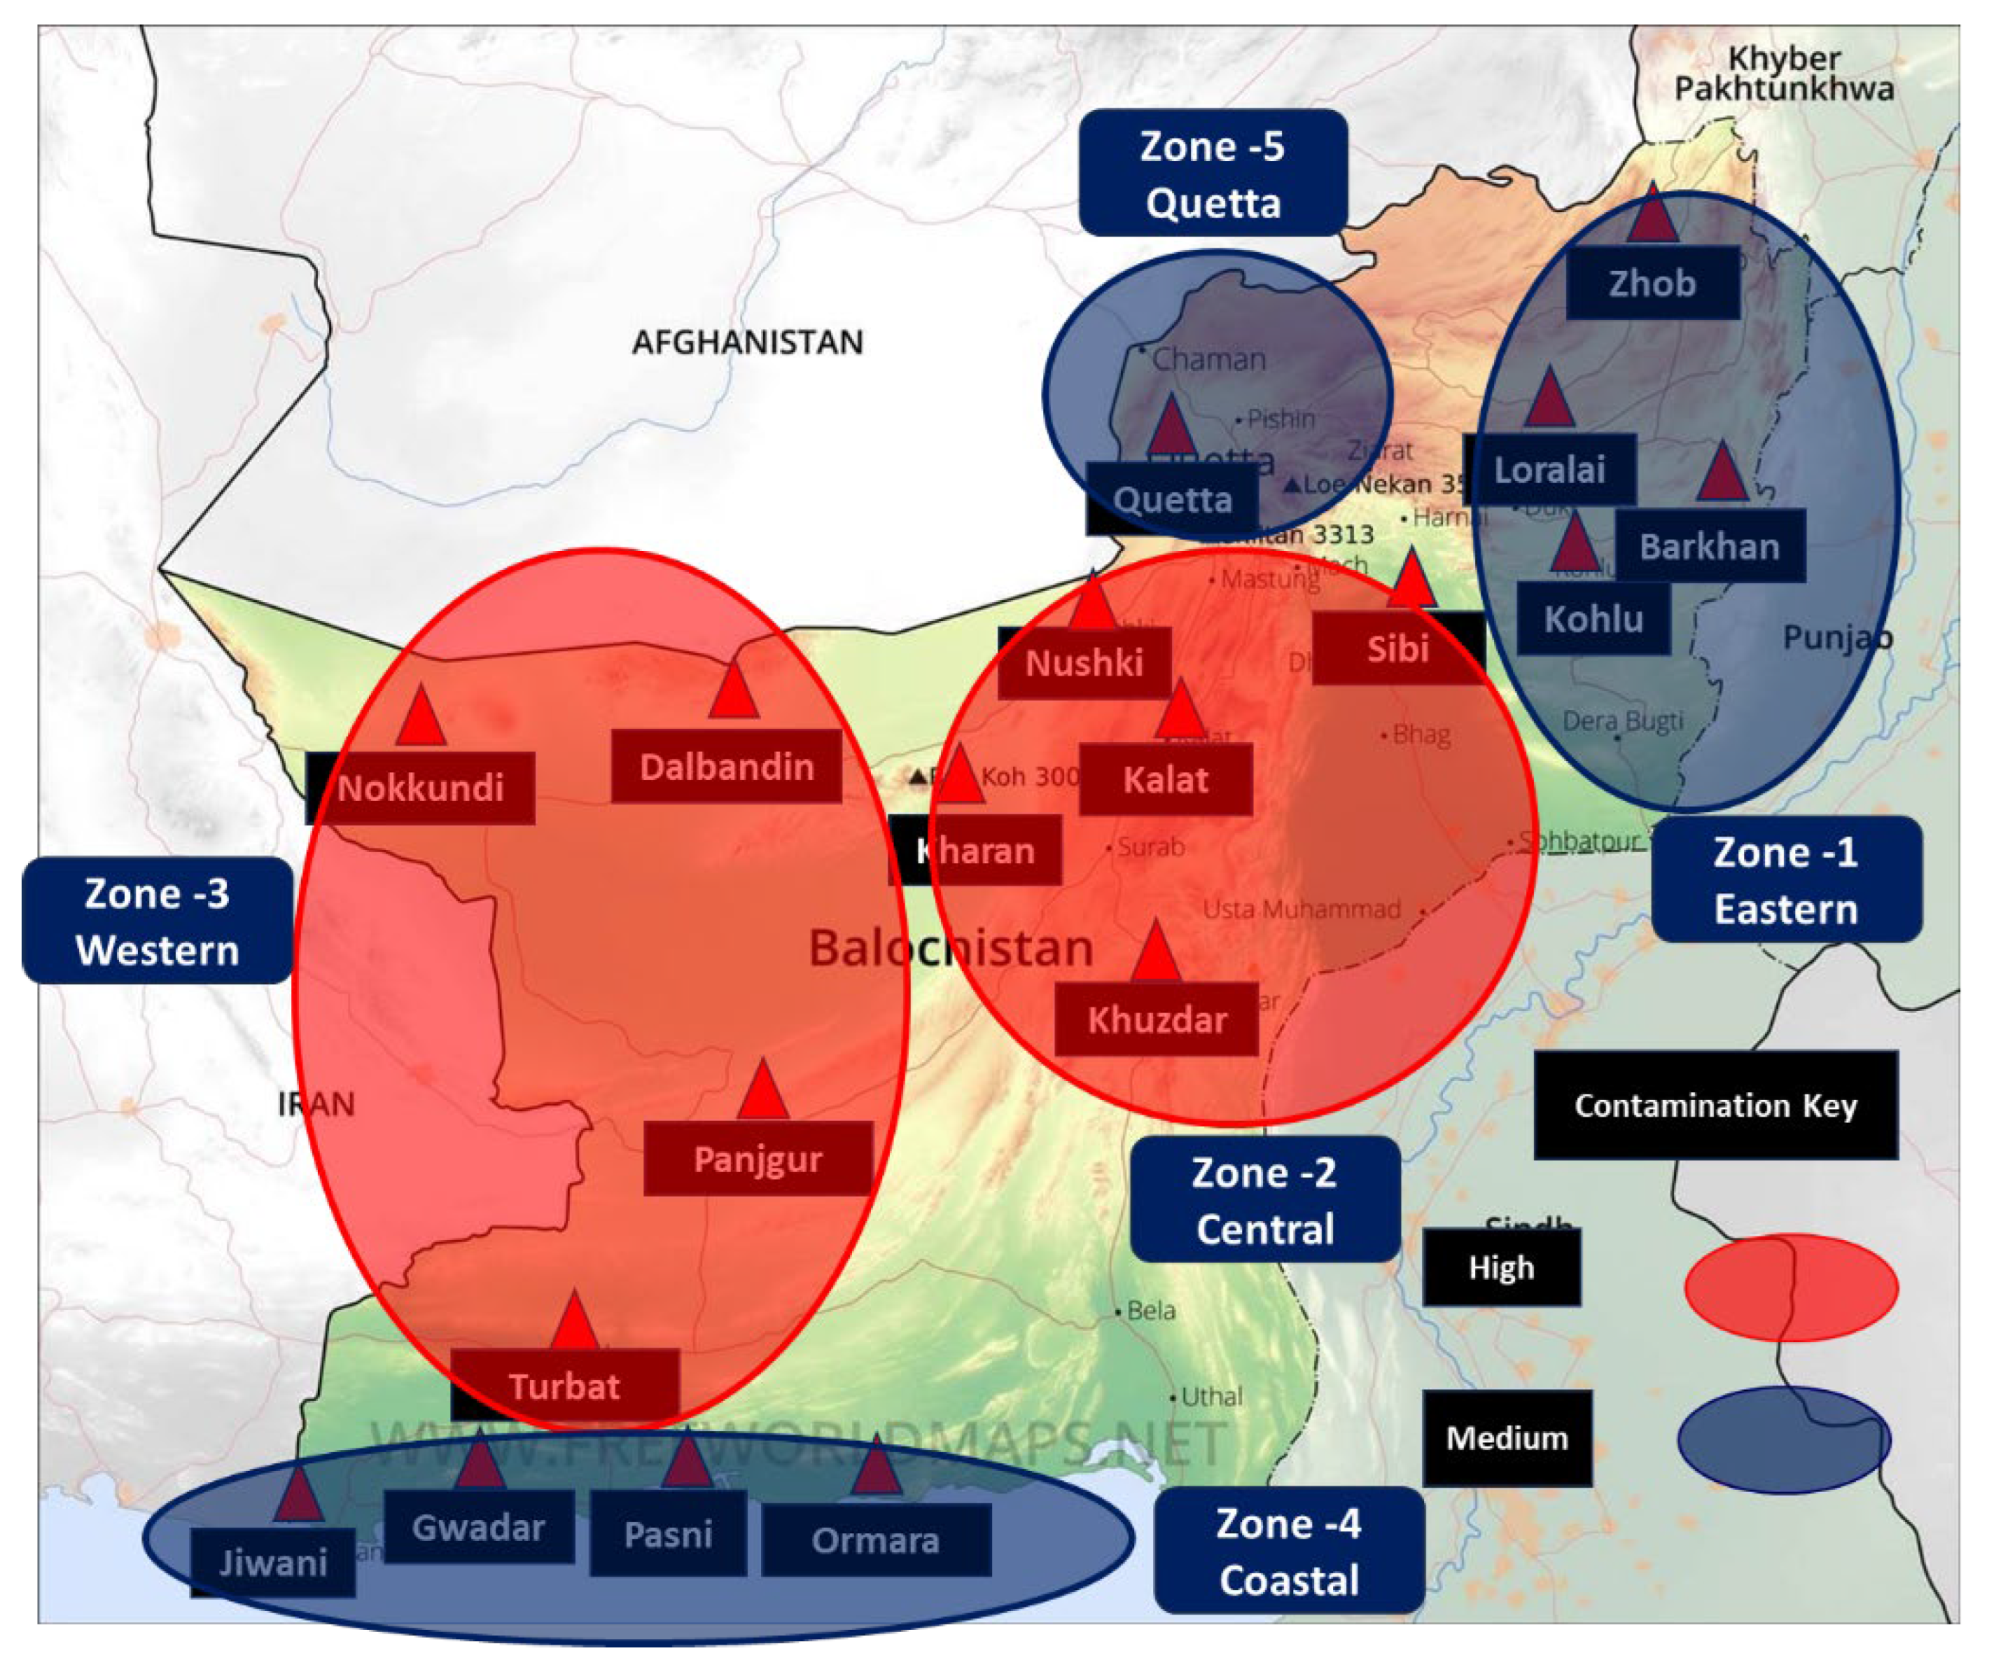
Figure 9.
Projected water decline 2050.
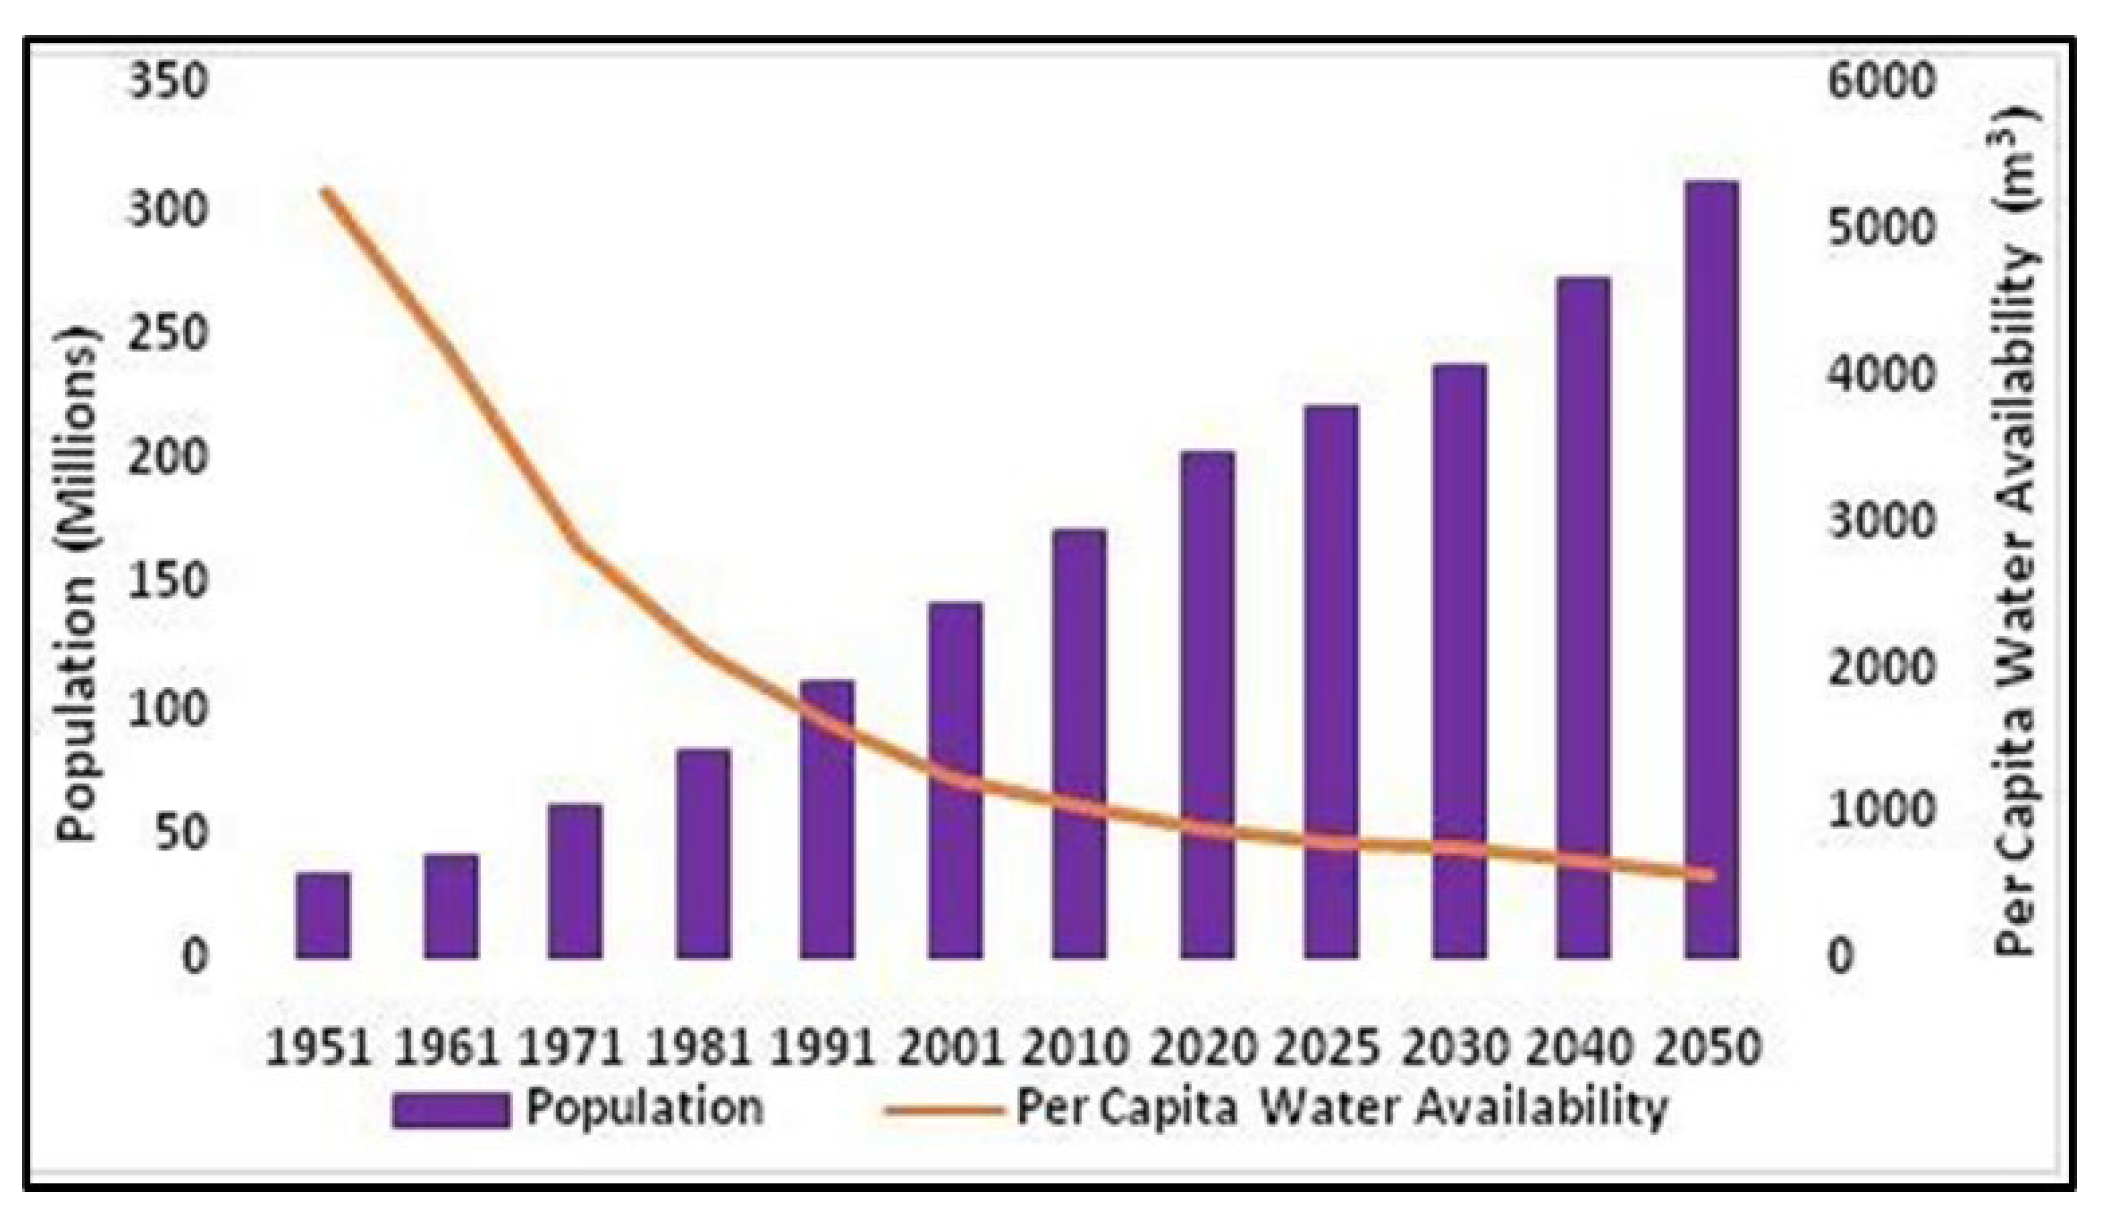

Table 1.
Sampling pre-requisites and process.
| Types of samples | Sample sites | Container types | Objectives | Preservatives details |
| Type 1 | All | Bottles over 150 ml sterilized | Testing of microbiological contents | Pre-sterilized |
| Type 2 | “ | Polystyrene bottle of 0.5 Liter | Establishing trace elements | Nitric Acid 1.5 to 2 ml in a Liter of sample (HNO 3) |
| Type 3 | “ | Polystyrene bottle of 0.5 Liter | Discovering nitrate presence | Boric Acid 1 ml in a sample of 100 ml |
| Type 4 | “ | Polystyrene bottle of 1 Liter | Presence of other chemicals | Without any preservatives |
Table 2.
Sampling design.
| Serial | Place | Code | Grid size km2 | Points for sampling | Remarks |
| Zone 1 (Loralai) | |||||
| 1 | Zhob | ZHB | 4 | 24 | |
| 2 | Loralai | LLI | 4 | 24 | |
| 3 | Barkhan | BKN | 2 | 16 | |
| 4 | Kohlu | KHL | 3 | 20 | |
| Zone 2 (Sibi) | |||||
| 5 | Sibi | SBI | 4 | 24 | |
| 6 | Nushki | NKI | 3 | 20 | |
| 7 | Kalat | KLT | 3 | 20 | |
| 8 | Kharan | KHN | 3 | 20 | |
| 9 | Khuzdar | KZR | 4 | 24 | |
| Zone 3 (Turbat) | |||||
| 10 | Dalbandin | DBN | 3 | 20 | |
| 11 | Nokkundi | NKD | 3 | 20 | |
| 12 | Panjgur | PJR | 3 | 20 | |
| 13 | Turbat | TRT | 3 | 20 | |
| Zone 4 (Coastal) | |||||
| 14 | Jiwani | JWN | 3 | 20 | |
| 15 | Gwadar | GDR | 3 | 20 | |
| 16 | Pasni | PNI | 3 | 20 | |
| 17 | Ormara | OMR | 3 | 20 | |
| Zone 5 (Quetta) | |||||
| 18 | Quetta | QTA | 6 | 34 | |
Table 3.
Water collection points for laboratory testing.
| Serial | Places | Monitored sources | Number of sample sites |
| 1 | Zone 1 | Filtration Plants (10), Tube wells (21), Tabs (27), Hand Pumps (35), Water Supply (10), Streams (18) | 121 |
| 2 | Zone 2 | Filtration Plants (8), Tube wells (27), Tabs (8), Hand Pumps (30), Streams (13) | 86 |
| 3 | Zone 3 | Filtration Plants (5), Tube wells (30), Tabs (8), Hand Pumps (27), Water Supply (13) | 83 |
| 4 | Zone 4 | Filtration Plants (10), Tube wells (35), Tabs (10), Hand Pumps (33), Water Supply (15) | 103 |
| 5 | Zone 5 | Filtration Plants (47), Tube wells (23), Tabs (59), Hand Pumps (29), Water Supply (33), Streams (15) | 206 |
Table 4.
Standard parameters for water quality examination.
| Serial | Standard Parameters | Method of analysis |
| 1 | Phosphate (mg/l) | 8190 and 8048 Colorimeters (HACH) |
| 2 | Alkalinity (mg/l as CaCO3) | 2320, Standard method 2017 |
| 3 | Fluoride (mg/l) | 4500-FC.ion-Selective Electrode Method Standard 2017 |
| 4 | Chloride (mg/l) | Titration (Silver Nitrate), Standard Method 2017 |
| 5 | Nitrate as Nitrogen (mg/l) | Cd. Reduction (Hach-8171) by Spectrophotometer |
| 6 | Potassium (mg/l) | Flame photometer PFP7, UK |
| 7 | Total Coliforms | 9221-B,C&D, Standard Methods 2017 APHA |
| 8 | Turbidity (NTU) | Turbidity Meter, Lamotte, Model 2008, USA |
| 9 | Calcium (mg/l) | 3500-Ca-D, Standard Method 2017 |
| 10 | TDS (mg/l) | 2540C, Standard method 2017 |
| 11 | E-coli | 9221-B,C&D, Standard Methods 2017 APHA |
| 12 | Hardness (mg/l) | EDTA Titration, Standard Method 2017 |
| 13 | Magnesium (mg/l) | 2340-C, Standard Method 2017 |
| 14 | pH | pH Meter, Hanna Instrument, Model 8519, Italy |
| 15 | Bicarbonate (mg/l) | 2320, Standard method 2017 |
| 16 | Carbonate (mg/l) | 2320, Standard method 2017 |
| 17 | Sodium (mg/l) | Flame photometer PFP7, UK |
| 18 | Arsenic (ppb) | AAS Vario 6, Analytik Jena AG (3111B APHA) 2017 |
| 19 | Conductivity (μS/cm) | E.C meter, Hach-44600-00, USA |
| 20 | Sulphate (mg/l) | SulfaVer4 (Hach-8051) by Spectrophotometer |
Table 5.
Drinking water assessment thresholds.
| Serial | Parameters | Units | Limits |
| 1 | Sodium | mg/l | NGVS |
| 2 | TDS | mg/l | 1000 |
| 3 | Calcium | mg/l | NGVS |
| 4 | E-coli | CFU/100ml | 0 |
| 5 | Magnesium | mg/l | NGVS |
| 6 | Sulphate | mg/l | NGVS |
| 7 | Potassium | mg/l | NGVS |
| 8 | Bicarbonate | mg/l | NGVS |
| 9 | Chloride | mg/l | 250 |
| 10 | pH | - | 6.51-8.51 |
| 11 | Arsenic | µg/l | 51 |
| 12 | Nitrate-N | mg/l | 10.05 |
| 13 | Fluoride | mg/l | 1.53 |
| 14 | Alkalinity | mg/l | NGVS |
| 15 | Hardness | mg/l | 500 |
| 16 | Carbonate | mg/l | NGVS |
| 17 | Turbidity | NTU | <5 |
| 18 | Conductivity | µS/cm | NGVS |
| 19 | Total Coliforms | CFU/100ml | 0 |
| 20 | Colour | TCU | Colourless |
| 21 | Iron | mg/l | 0.31 |
Table 6.
Guidelines for risk analysis.
| Serial | Score | Risk Assessment | Type of Contamination |
| 1 | 0 | Marginally Safe | Level of dissolved Solids, Coliforms, Fluoride, and Nitrate within limits |
| 2 | 1 | Low | Bacterial contamination only (Total Coliforms & Faecal Coliforms) |
| 3 | 2 | Low | Dissolved solids only |
| 4 | 4 | Medium | Single microbial & chemical contamination |
| 5 | 3 | Medium | Single chemical contamination |
| 6 | 5 | High | Double chemical contamination |
| 7 | 6 | High | Numerous chemicals & microbial contamination |
Table 7.
Contamination range parameters.
| Ser | Risk Type | Range |
| 1 | Low | 1-2 |
| 2 | Medium | 3-4 |
| 3 | High | 5-6 |
Table 8.
Zone 1 water quality results.
| Serial | Water Quality Parameter (WQP) | Unit of measurement | Samples tested | Contaminated Samples | Contamination percentage |
| 1 | Arsenic (As) | µg/l | 121 | 46 | 38% |
| 2 | Coliform | MPN/100 ml | 121 | 49 | 40% |
| 3 | TDS | mg/l | 121 | 48 | 39% |
| 4 | E. coli | MPN/100 ml | 121 | 52 | 42% |
| 5 | Iron (Fe) | mg/l | 121 | 49 | 40% |
| 6 | Overall contamination percentage | 40% | |||
Table 9.
Zone 2 water quality results.
| Serial | Water Quality Parameter (WQP) | Unit of measurement | Samples tested | Contaminated Samples | Contamination percentage |
| 1 | Arsenic (As) | µg/l | 86 | 48 | 55% |
| 2 | Coliform | MPN/100 ml | 86 | 51 | 59% |
| 3 | TDS | mg/l | 86 | 46 | 53% |
| 4 | E. coli | MPN/100 ml | 86 | 52 | 60% |
| 5 | Iron (Fe) | mg/l | 86 | 54 | 62% |
| 6 | Overall contamination percentage | 58% | |||
Table 10.
Zone 3 water quality result.
| Serial | Water Quality Parameter (WQP) | Unit of measurement | Samples tested | Contaminated Samples | Contamination percentage |
| 1 | Arsenic (As) | µg/l | 83 | 51 | 61% |
| 2 | Coliform | MPN/100 ml | 83 | 49 | 59% |
| 3 | TDS | mg/l | 83 | 55 | 66% |
| 4 | E. coli | MPN/100 ml | 83 | 48 | 57% |
| 5 | Iron (Fe) | mg/l | 83 | 51 | 61% |
| 6 | Overall contamination percentage | 61% | |||
Table 11.
Zone 4 water quality results.
| Serial | Water Quality Parameter (WQP) | Unit of measurement | Samples tested | Contaminated Samples | Contamination percentage |
| 1 | Arsenic (As) | µg/l | 103 | 52 | 50% |
| 2 | Coliform | MPN/100 ml | 103 | 54 | 52% |
| 3 | TDS | mg/l | 103 | 45 | 43% |
| 4 | E. coli | MPN/100 ml | 103 | 53 | 51% |
| 5 | Iron (Fe) | mg/l | 103 | 55 | 53% |
| 6 | Turbidity | NTU | 103 | 49 | 48% |
| 6 | Overall contamination percentage | 50% | |||
Table 12.
Zone 5 water quality results.
| Serial | Water Quality Parameter (WQP) | Unit of measurement | Samples tested | Contaminated Samples | Contamination percentage |
| 1 | Arsenic (As) | µg/l | 206 | 81 | 39% |
| 2 | Coliform | MPN/100 ml | 206 | 87 | 42% |
| 3 | TDS | mg/l | 206 | 93 | 45% |
| 4 | E. coli | MPN/100 ml | 206 | 91 | 44% |
| 5 | Iron (Fe) | mg/l | 206 | 93 | 45% |
| 6 | Hardness | mg/l | 206 | 23 | 13% |
| 7 | Fluoride (F) | mg/l | 206 | 88 | 42% |
| 8 | Overall contamination percentage | 43% | |||
Disclaimer/Publisher’s Note: The statements, opinions and data contained in all publications are solely those of the individual author(s) and contributor(s) and not of MDPI and/or the editor(s). MDPI and/or the editor(s) disclaim responsibility for any injury to people or property resulting from any ideas, methods, instructions or products referred to in the content. |
© 2025 by the authors. Licensee MDPI, Basel, Switzerland. This article is an open access article distributed under the terms and conditions of the Creative Commons Attribution (CC BY) license (http://creativecommons.org/licenses/by/4.0/).
Copyright: This open access article is published under a Creative Commons CC BY 4.0 license, which permit the free download, distribution, and reuse, provided that the author and preprint are cited in any reuse.


