
Submitted:
02 February 2025
Posted:
04 February 2025
You are already at the latest version
Abstract
Age-related Macular Degeneration (AMD) is a major cause of irreversible vision loss, especially in elderly, that can be diagnosed from OCT images. OCT, a noninvasive imaging modality, is not only widely applied in detecting retinal diseases but meaningful correlations have also been found between OCT images and neurological disorders like Alzheimer disease. The insufficient labeled dataset is the key challenge in using OCT images for disease detection, highlighting the importance of employing semi-supervised methods to address this issue. In this paper, the first step is to investigate the optimal structure of a supervised model for detecting AMD with the model being based on EfficientNet. In subsequent steps, the dataset size is reduced to 70%, 50%, 20%, and 5% of the total dataset to identify the best model based on an iterative teacher-student approach for detecting AMD disorders. In this study, the available OCT dataset gathered at Noor Eye Hospital consisting of 16,822 retinal OCT images are utilized. The optimized supervised model achieved 87.14% accuracy in distinguishing different AMD stages. As the dataset size is reduced to the most severe conditions (i.e., 20% and 5%), an expected decrease in accuracy to 77.05% and 54.78% has observed. Introduced semi-supervised learning based on iterative teacher-student model improved the accuracy to 88.56% at 20% and 64.15% at 5% volume of dataset, achieving high confidence levels, thereby enhancing the performance of the supervised model. This study introduces a framework that can be used in future studies to detect diseases with an insufficient OCT dataset, aiming to improve model accuracy.
Keywords:
Semi Supervised Learning
; Age-Related Macular Degeneration
; Optical Coherence Tomography
1. Introduction
Retinal diseases encompass a range of conditions that can significantly impair vision and even lead to blindness. Retinopathies, such as glaucoma, macular holes, diabetic macular edema (DME), and age-related macular degeneration (AMD), often result in complications like macular edema and retinal detachment. AMD, a complex retinal disorder, is one of the leading causes of irreversible vision loss in industrialized countries, particularly affecting individuals over the age of 60 [1,2]. AMD is clinically categorized into two main subtypes: dry (non-exudative) and wet (exudative). In the early stages of dry AMD, yellowish-white deposits known as drusen form between the retinal pigment epithelium (RPE) and Bruch's membrane (BM), marking the onset of the disease [3,4]. As these deposits accumulate, choroidal capillaries extend into the RPE and BM, leading to pathological changes characterized by abnormal choroidal neovascularization (CNV) beneath the retina. This progression can cause exudation, bleeding, scarring, and eventual loss of central vision [5,6,7]. The introduction of anti-VEGF therapies has significantly improved outcomes for wet AMD, helping to preserve visual acuity [1,8,9]. Early detection, however, remains crucial for preventing advanced retinal damage and reducing treatment costs.
Retinal disorders are commonly diagnosed using imaging techniques such as fundus photography, fluorescein angiography, and optical coherence tomography (OCT and OCTA) [5]. OCT, a noninvasive and noncontact modality, captures high-resolution, cross-sectional images of retinal layers through low-coherence light. Its high speed, resolution, and nondestructive imaging capabilities make OCT a valuable tool for diagnosing and monitoring retinal diseases [10,11]. OCT’s utility extends beyond ophthalmology; recent studies have highlighted its relevance in detecting neurological conditions like Alzheimer’s, multiple sclerosis, and Parkinson’s disease [12,13,14]. However, OCT interpretation poses challenges. As the population ages and AMD and other chronic retinal conditions increase, the demand for OCT evaluations is straining healthcare systems. Manual OCT analysis, especially for detecting subtle or early-stage lesions, presents significant challenges, as it can be both complex and prone to misinterpretation, particularly for conditions lacking distinct visual markers in the retina. Additionally, the process can be time-consuming, with notable delays in obtaining tests, reporting results, and associated costs, which may place a burden on patients and healthcare systems. Limited data availability for rare conditions further exacerbates the difficulty in achieving accurate diagnosis and effective treatment planning. These challenges highlight the limitations of relying solely on traditional manual OCT analysis to address the growing demands of retinal care. Figure 1 provides an illustration of OCT B-scans for AMD cases
Artificial Intelligence (AI) encompasses technologies that simulate human cognitive functions, enabling machines to perform tasks requiring human-like understanding and pattern recognition Within AI, Machine Learning (ML) focuses on developing algorithms that learn from data, allowing systems to make predictions or decisions without explicit programming [15,16,17].
AI has made significant strides in multi-disease classification for healthcare, particularly in medical image analysis [18,19]. In ophthalmology, DL models have shown remarkable accuracy in detecting AMD-related lesions using OCT images, with notable studies advancing this application [6,10,20]. For example, He et al. proposed a two-stage DL model combining ResNet-50 with a local outlier factor algorithm to detect AMD from OCT volume scans, achieving high accuracy and AUC [21]. Alenezi et al. utilized a weighted fusion approach to combine outputs from models like ResNet and EfficientNet with attention mechanisms, achieving 91.88% accuracy in AMD classification [22]. SL models have also demonstrated efficacy across various tasks in OCT image analysis, including automated classification and segmentation of lesions [23,24]. Wang et al. used DenseNet, ResNet, and other architectures to classify OCT images into AMD, DME, and normal classes [25]. Meanwhile, Zapata et al. deployed a 24-layer CNN to differentiate between AMD and glaucomatous optic neuropathy using fundus and OCT images [26]. Other models, such as Dong et al.'s joint CNN detector using Yolov3, identified AMD among 11 retinal conditions with 88% sensitivity and 98% specificity [27]. In another study, Mathews et al. used a lightweight CNN to classify OCT images with 100% sensitivity and specificity across AMD, DME, and normal categories [28]. These advancements underscore the growing role of SL in enhancing OCT analysis, contributing to accurate and efficient diagnostics in retinal healthcare.
A major challenge in deploying SL models for disease detection lies in the limited availability of labeled data, especially for rare or specific conditions. SL algorithms require large labeled datasets to achieve robust performance. The process of annotating and diagnosing data is resource-intensive and time-consuming for medical professionals. While routine screenings can generate raw data, labeling these datasets remains a barrier. Semi-supervised learning (SSL) approaches offer a promising solution by leveraging large amounts of unlabeled data alongside smaller labeled datasets to build effective classifiers. This makes developing automated systems capable of assessing and distinguishing diseases with minimal labeled data essential for advancing medical diagnostics.
Recent studies highlight the challenge of limited labeled data in medical imaging, particularly for rare or early-stage eye diseases, and emphasize the potential of SSL in addressing this issue. SSL has been widely explored for detecting retinopathies in OCT and fundus images [29,30]. Dali Chen et al. proposed an SSL approach combining U-Net with an iterative dataset updating strategy, improving blood vessel segmentation in retinal images [31]. Amir Rahdar et al. leveraged unlabeled data for retinoblastoma tumor segmentation, using a Gaussian mixture model (GMM) to detect abnormalities in fundus images [32]. Additionally, Andres Diaz-Pinto et al. improved glaucoma prediction accuracy by integrating a Deep Convolutional Generative Adversarial Network (DCGAN) with an SSL-based retinal image synthesizer, achieving an AUC of 0.9017 on 86,926 retinal images [33]. Xi Wang et al. employed a Student-Teacher architecture for diabetic macular edema (DME) detection in OCT images, utilizing confidence-based pseudo-labeling and consistency regularization to address label noise [34]. Further, Sixu Duan et al. proposed a semi-supervised graph-attentional convolutional neural network (GACNN), combining CNN and graph convolutional networks (GCN) with attention mechanisms to leverage both labeled and unlabeled fundus images [35]. Zhicong Tan et al. implemented a transfer learning method with sub-domain adaptation (TLSDA), achieving impressive classification accuracies of 93.63% and 96.59% on private datasets, outperforming conventional supervised approaches. These studies collectively demonstrate the efficacy of SSL in improving retinal disease classification using limited labeled data [36].
The primary aim of this study is to investigate methodologies for evaluating the diagnosis of diseases such as neurological disorders, Alzheimer's disease, or eye diseases like Retinitis Pigmentosa (RP), for which very limited datasets are available, in order to propose an optimal performance of DL models, particularly SSL models. To achieve this, various experiments are conducted based on use of small dataset of OCT images to identify AMD diseases, including cases where the dataset is moderately reduced, slightly reduced, severely limited, and minimally available. This investigation is conduced across four categories: 70%, 50%, 20%, and 5% of the train dataset volume, to introduce the best SSL method based on the results. In this study, DL models are evaluated on 16822 OCT scans of Noor Eye Hospital (NEH) to reach optimized model for discriminating normal, dry and wet AMD.
2. Material and Methods
2.1. Database
This study utilized the publicly available Noor dataset, which consists of 16,822 retinal OCT images collected from 441 patients, comprising a total of 554 OCT volumes. The dataset covers various stages of age-related macular degeneration (AMD). Of the 16,822 B-scans, 8,584 images are normal, 4,998 depict drusen, and 3,240 represent cases of choroidal neovascularization (CNV). At the volume level, there are 187 normal cases, 194 drusen cases, and 173 CNV cases out of the 554 total volumes. The OCT images were captured using the Heidelberg SD-OCT imaging system at Noor Eye Hospital and annotated by retinal specialists. The dataset includes patients aged 50 years or older with no other retinal pathologies and with good image quality (Q ≥ 20). Some patients had both eyes scanned, with each OCT volume containing an average of 30 B-scans.
2.2. Data Preprocessing and Augmentation
During the preprocessing stage, all images are resized to a consistent dimension to ensure uniform input for the model, facilitating efficient training. Additionally, normalization is applied to all images to standardize pixel intensity values, ensuring a zero mean and unit variance. This normalization step helps accelerate the convergence of the model during training by ensuring the inputs are on a comparable scale. To further enhance the diversity of the dataset and improve the model's generalization ability, several data augmentation techniques are employed. These include random cropping to simulate different field-of-view variations, horizontal flipping to increase variability in orientation, and rotation within a controlled range. Additionally, affine transformations such as translation and shear are applied to simulate spatial variations, further enriching the training set. These augmentations help improve the model's robustness by exposing it to a wider range of potential input variations, thereby reducing the risk of overfitting and enhancing its performance on unseen data.
2.3. Proposed Model
The aim of the first step of this study is to achieve best performance to distinguish mentioned dataset OCT images into normal, drusen and CNV categories using SL models. Among the SL models, EfficientNet B0, part of the EfficientNet family of deep learning models, has employed as supervised learning model to classify different stages of AMD due to its design and architecture benefits. EfficientNet B0 is specifically optimized to achieve a good balance between model accuracy and computational efficiency. This means it can deliver competitive performance on tasks while requiring less computational resources compared to larger models. The architecture of EfficientNet is designed to scale efficiently to different sizes (B0 to B7), allowing flexibility in choosing a model size based on the available compute resources and the specific requirements of the task. Also, due to pre-training on large datasets like ImageNet, it can be effectively used for transfer learning. This allows for faster training convergence and better performance on new tasks with smaller datasets. Moreover, it has demonstrated good generalization capabilities, meaning it can perform well across a variety of domains and datasets, making it versatile for different computer vision tasks [37,38]. Furthermore, based on several experiments and investigating the other models including ResNet, EfficientNet B0 and Attention, it has been concluded that the model exhibits superior performance in AMD classification on NEH dataset [22].
In the next stage, only defined portion of the train dataset volume is considered as labeled data with the remaining unlabeled data. The SL model is trained on this labeled dataset and classified OCT images. The accuracy percentage of disease detection in each image by the model in this stage is crucial. For training the SSL model, the Teacher/Student method has been utilized. The Teacher-Student (TS) approach is a widely used strategy in semi-supervised learning, aiming to enhance model performance by utilizing both labeled and unlabeled data. This method involves two distinct neural networks: the teacher and the student. Typically, the teacher network is a pre-trained model that generates pseudo-labels for the unlabeled data. The student network, which is undergoing training, learns from both the valid labeled data and the pseudo-labels produced by the teacher [39]. Initially, the teacher network is trained on the labeled dataset. Once trained, it predicts labels for the unlabeled data, and the confidence in these predictions helps create pseudo-labels. The confidence parameter essentially controls how much trust is placed in the pseudo-labels generated by the teacher model for the unlabeled data. Each prediction comes with an associated confidence score, which reflects how certain the teacher model is about the predicted label. The confidence parameter sets a threshold for these confidence scores. Only the pseudo-labels that exceed this threshold are used for training the student model. This helps ensure that only high-confidence (more reliable) pseudo-labels are incorporated into the student model’s training process. The primary purpose of the confidence parameter is to balance the trade-off between the quantity and quality of the pseudo-labels used for training. By carefully adjusting this parameter, the semi-supervised learning process aims to improve the student model’s accomplishment by leveraging the additional data while minimizing the risk of learning from incorrect or uncertain labels.
The student network is subsequently trained using both the labeled and pseudo-labeled data, with the goal of improving classification performance. This technique capitalizes on the availability of unlabeled data, which is often easier and more cost-effective to obtain than labeled data. Utilizing pseudo-labels allows the student network to potentially generalize better to new, unseen data. The success of the student network is significantly dependent on the quality of the pseudo-labels provided by the teacher network, as low-quality pseudo-labels can hinder training. Therefore, it is essential to maintain a balance in the performance between the teacher and student networks to prevent issues such as overfitting.
In this study, an Iterative Teacher-Student (ITS) approach is employed to enhance the training of deep learning models for OCT image analysis. The process begins with training a teacher model on the labeled portion of the dataset. The teacher model then generates pseudo-labels for the unlabeled OCT images, which are used to expand the training set. To ensure the reliability of the pseudo-labels, a confidence threshold is applied: only pseudo-labels with a confidence score above a certain threshold are added to the labeled dataset for the next iteration. This threshold helps ensure that only high-confidence predictions are incorporated into the training data, improving the quality of the pseudo-labels and preventing the model from learning from uncertain or incorrect labels. The student model is trained on both the original labeled data and the pseudo-labeled data from the teacher, refining its parameters through multiple iterations. This iterative process allows the model to progressively improve by leveraging unlabeled data, while the confidence threshold maintains control over the quality of the pseudo-labels used in each iteration, enhancing the model’s generalization capabilities and performance on the AMD classification task. Figure 2 provides a visual representation of the ITS entire process.
3. Experiments
To enhance computational efficiency, manage memory usage, and facilitate effective preprocessing and data augmentation in deep learning networks, all OCT images are resized to a uniform size of 224x224 pixels. Various batch sizes (16, 32, and 64) are tested to optimize computational resources and ensure the model generalizes well to new data. The training process typically spans 100 epochs to refine model parameters and avoid overfitting, with strategies such as early stopping, model checkpointing, and learning rate reduction (with a patience of 15 epochs) employed to preserve the best model. Data augmentation is applied to improve model performance, reduce overfitting, and enhance generalization. Additionally, the models are initialized with pre-trained weights from large image datasets, enabling faster convergence and transfer learning for AMD classification. The Adam optimizer, known for its adaptive learning rate capabilities, is used alongside categorical cross-entropy loss for multi-class classification tasks.
For model training, the dataset is divided into training, validation, and test sets, consisting of 10,811 training images, 2,839 validation images, and 3,235 test images from a total of 16,822 OCT images. The test set remains constant across all experiments to ensure consistent evaluation, while training data varies based on the strategies investigated and dataset sizes. To prevent information leakage, data is partitioned patient-wise, ensuring no overlap between training and test sets. If class imbalance exists, appropriate techniques (e.g., oversampling or class weighting) are applied to address it. Data augmentation is employed on the training set to enhance model generalization.
In the second phase of the evaluation, the model's performance is assessed using progressively smaller subsets of the dataset. Specifically, subsets containing 70%, 50%, and 20% of the original training data are created, with the remaining data excluded from the training process. The SL model, configured with parameters (obtained in previous phase), is then trained and tested on these subsets. During this phase, various parameter configurations are explored to identify the optimal settings based on performance metrics. The impact of reducing the training dataset size on model performance is analyzed, and the results are compared to those from the later SSL phase to evaluate the added value of the semi-supervised approach.
In the SSL phase, a confidence threshold for labeling images is defined at 0%, 90%, 95%, and 99% for each unlabeled image. The quantity and quality of the pseudo-labeled data significantly influence model performance. In contrast to the second phase, the model is presented with a mix of labeled and unlabeled data, where labeled images account for 70%, 50%, 20%, and 5% of the total training data, while the rest are treated as unlabeled. As the model makes predictions on the unlabeled images, those with a confidence level exceeding the specified threshold are added to the labeled set as pseudo-labeled images. The model is then retrained with this expanded dataset to evaluate the effectiveness of the SSL approach in improving accuracy as more data becomes available.
4. Results
4.1. SL Training Phase
Initially, the complete dataset was used to train the SL model, optimizing key parameters such as batch size, data augmentation, and the inclusion of pre-trained weights. The experiments showed no significant performance differences across batch sizes, although smaller sizes increased training time. Based on these results, a batch size of 64 was selected as it provided a good balance between performance and training efficiency. Transfer learning substantially improved classification accuracy compared to models trained from scratch, highlighting its role in leveraging pre-trained feature representations. Moreover, fine-tuning pre-trained layers yielded a 7–10% increase in detection accuracy over freezing them, underscoring the importance of adaptable feature extraction for disease classification. Table 1 summarizes the SL model’s performance under different parameter settings.
4.2. Limited Data in SL Models
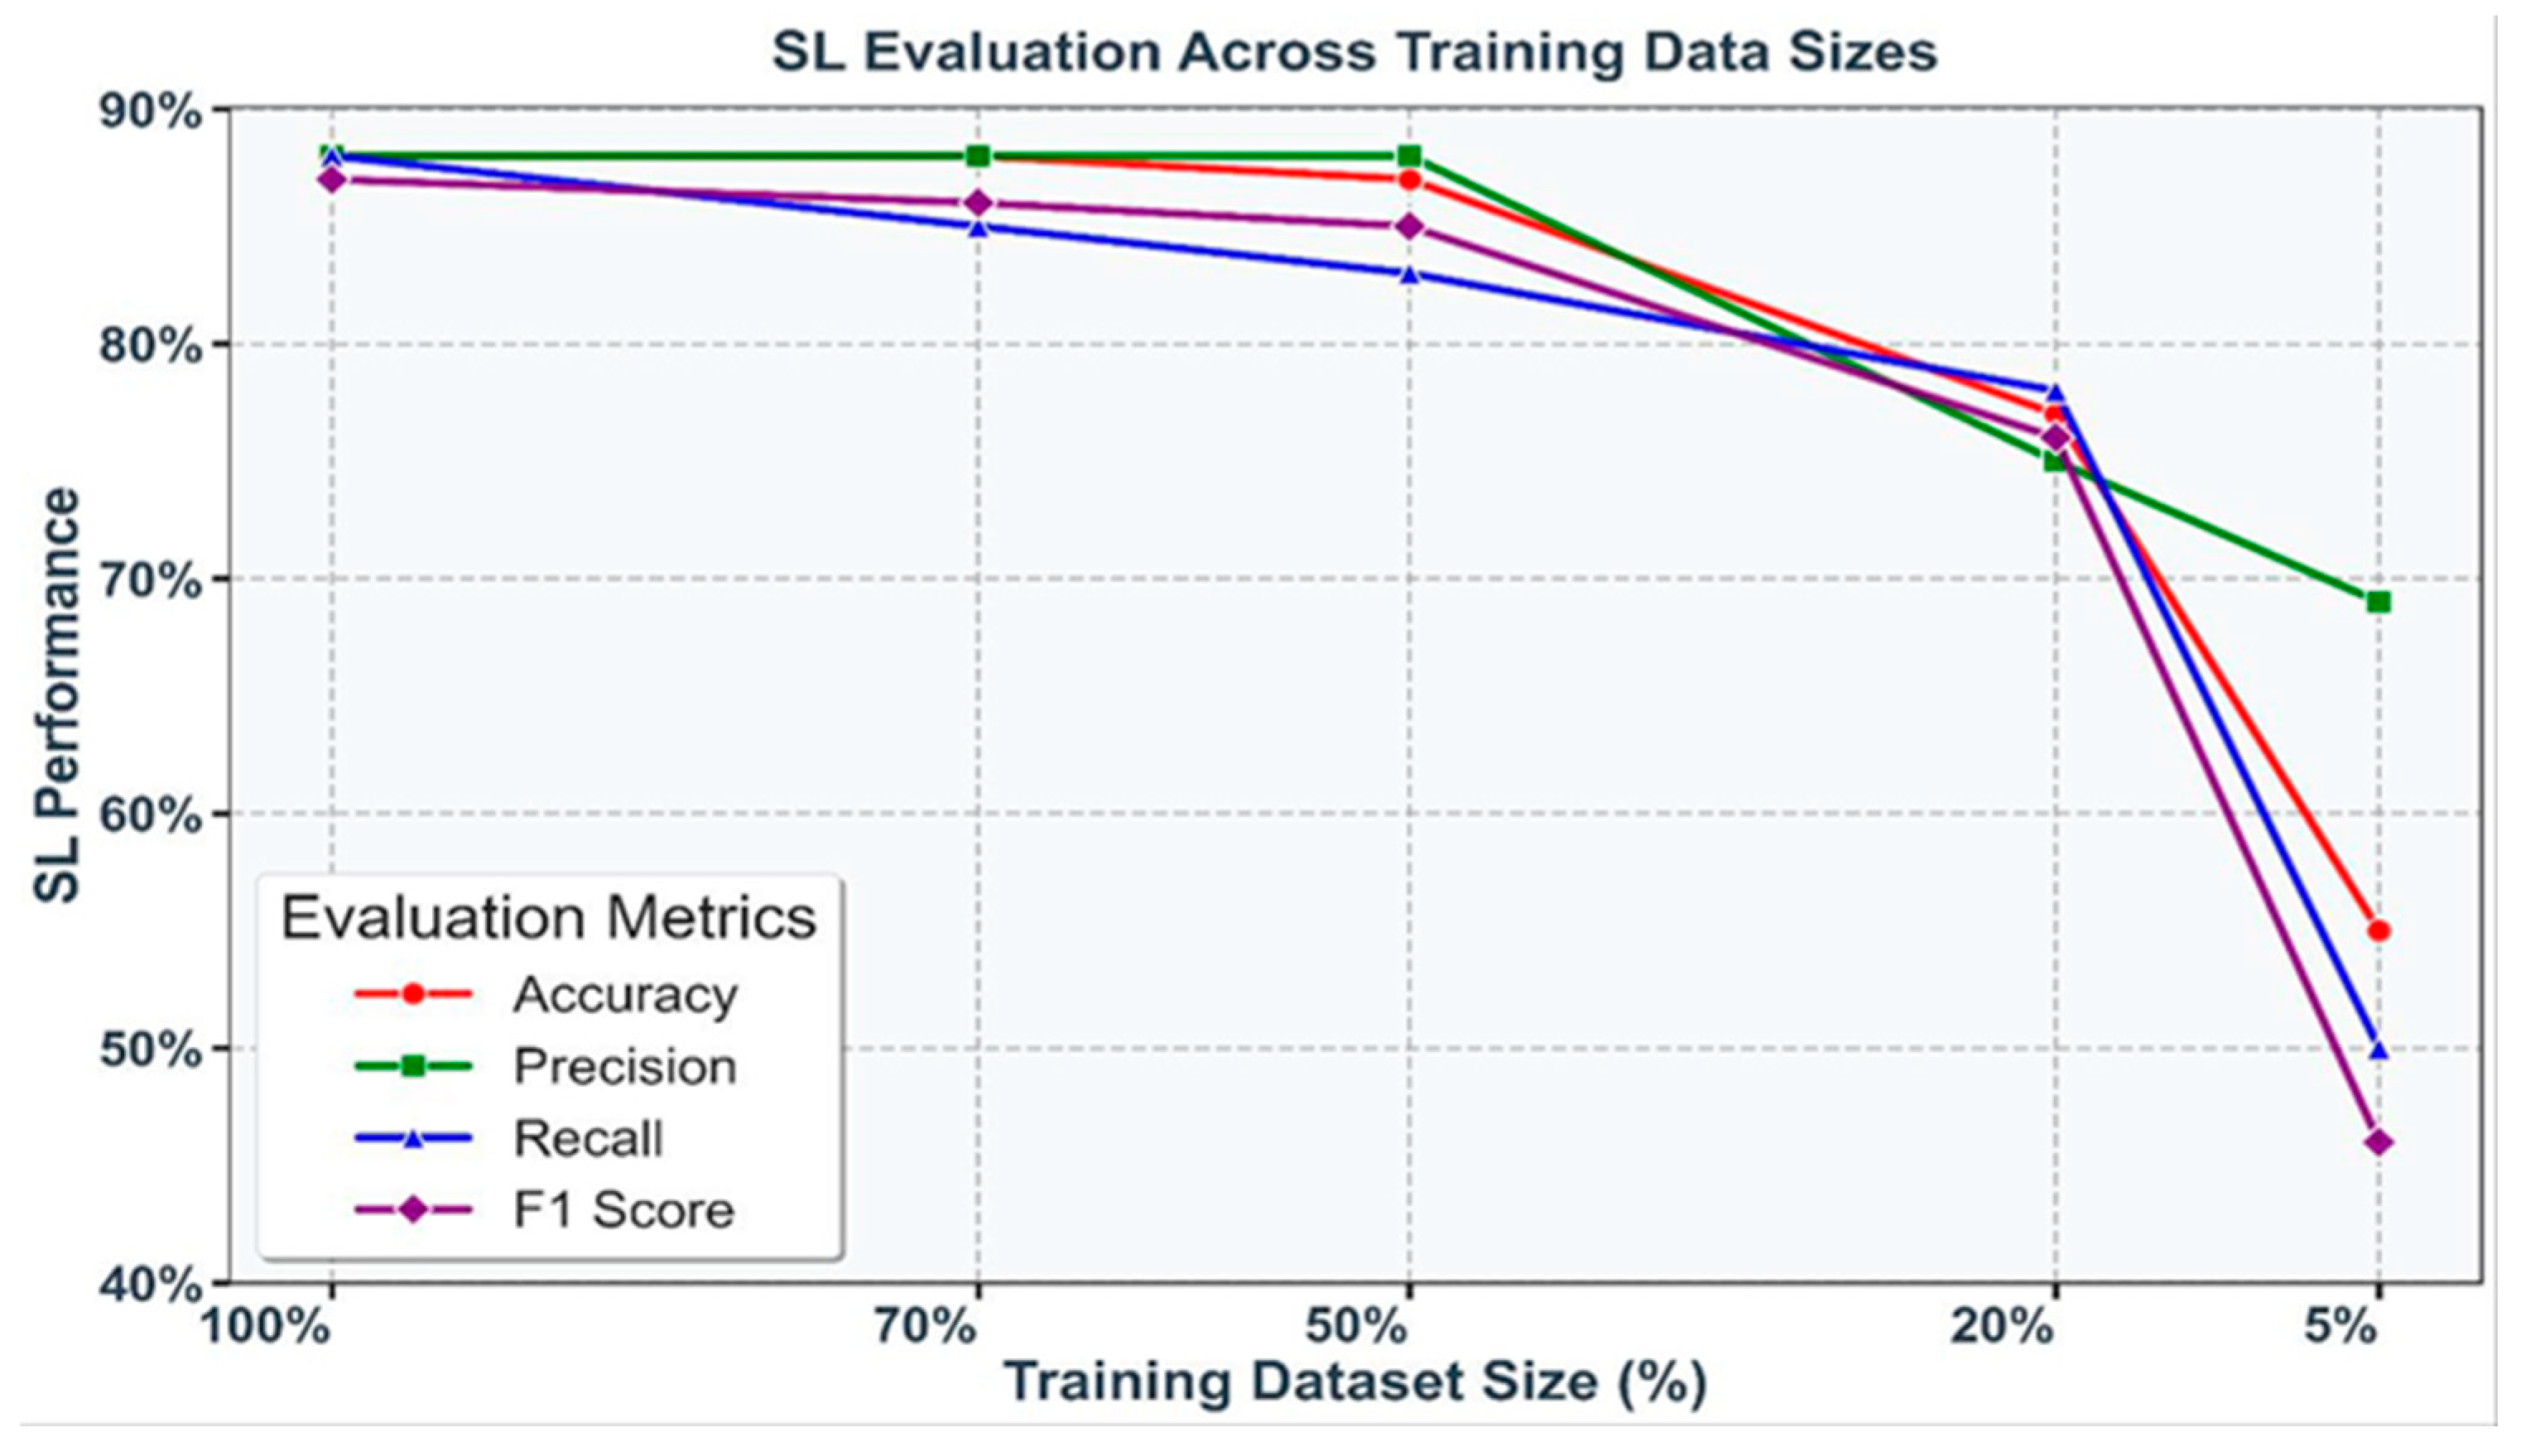
To evaluate the impact of data scarcity, SL models were trained on progressively smaller subsets of the training dataset: 100%, 70%, 50%, 20%, and 5%. A consistent decline in performance was observed as the data volume decreased, with accuracy dropping sharply from 88.44% at 70% of the dataset to 77.05% at 20%, and further reductions seen with only 5% of the data. Similar trends were evident across precision, recall, and F1 score, underscoring the sensitivity of SL models to training data size. These results are visualized in Figure 3, where each metric is represented by a distinct color, highlighting the critical importance of data availability in maintaining robust model performance.
Figure 3.
Performance of SL models (accuracy, precision, recall, and F1 score) under varying training dataset sizes (100%, 70%, 50%, 20%, and 5%). Each metric is represented by a unique color, illustrating the decline in performance with reduced data availability.
Figure 3.
Performance of SL models (accuracy, precision, recall, and F1 score) under varying training dataset sizes (100%, 70%, 50%, 20%, and 5%). Each metric is represented by a unique color, illustrating the decline in performance with reduced data availability.
4.3. Performance of Teacher-Student (TS) Models
The TS approach was evaluated using datasets with varying proportions of labeled data (70%, 50%, 20%, and 5%) alongside unlabeled data. Pseudo-labeling was employed to generate additional labeled examples, with different confidence thresholds determining the inclusion criteria for pseudo-labeled images.
Based on the results from all the experiments, it is observed that the best outcomes were achieved with a 95% confidence criterion when the dataset size was reduced to 20%. The accuracy at 70% was 88.71, and at 50% it was 88.32. Besides, defining confidence threshold 95% significantly enhances the model’s achievement across all metrics: accuracy, precision, recall, and F1 score. This improvement indicates that the integration of a substantial volume of pseudo-labeled data, even with lower confidence, positively impacts model capabilities. Performance at the 20% dataset size across various metrics is shown in Table 2.
With a significant reduction in dataset size to 20% and 5%, the model’s diagnostic competency obviously diminished. However, by increasing the strictness of the confidence criterion, particularly at the 5% dataset size, better results were achieved. At this reduced size, with a confidence level of 95%, the accuracy was 49.34%, and with a 99% confidence level, the accuracy improved to 55.88%.
4.4. Performance of Iterative Teacher-Student (ITS) Models
The proposed ITS model, considering the improvement of the TS model’s results by adding pseudo-labeled data, aims to refine and enhance the model’s detection quality in performance metrics. Applying this method can improve the severe decrease in accuracy at lower volumes, especially in specific diseases with limited labeled data. Based on the results obtained from the TS model, the best model performances at 20% and 5% volumes have been included in the iteration process. Refer to figure 3 for the results of the iteration process at 20% and 5% of train dataset.
Based on the experimental results, the model's efficiency in the iterative process positively affected its accuracy and precision. Compared to the TS model results, the diagnostic accuracy of the model at a 20% dataset volume shows a 2.5% increase in the first iteration. Additionally, at a 5% dataset size, an upward trend is observed in the iterative process, particularly in the second iteration, where the model’s accuracy increased by 10%, reaching 64.15%.
Figure 3.
ITS model results at 20% and 5% of dataset volume in 4 iterations.
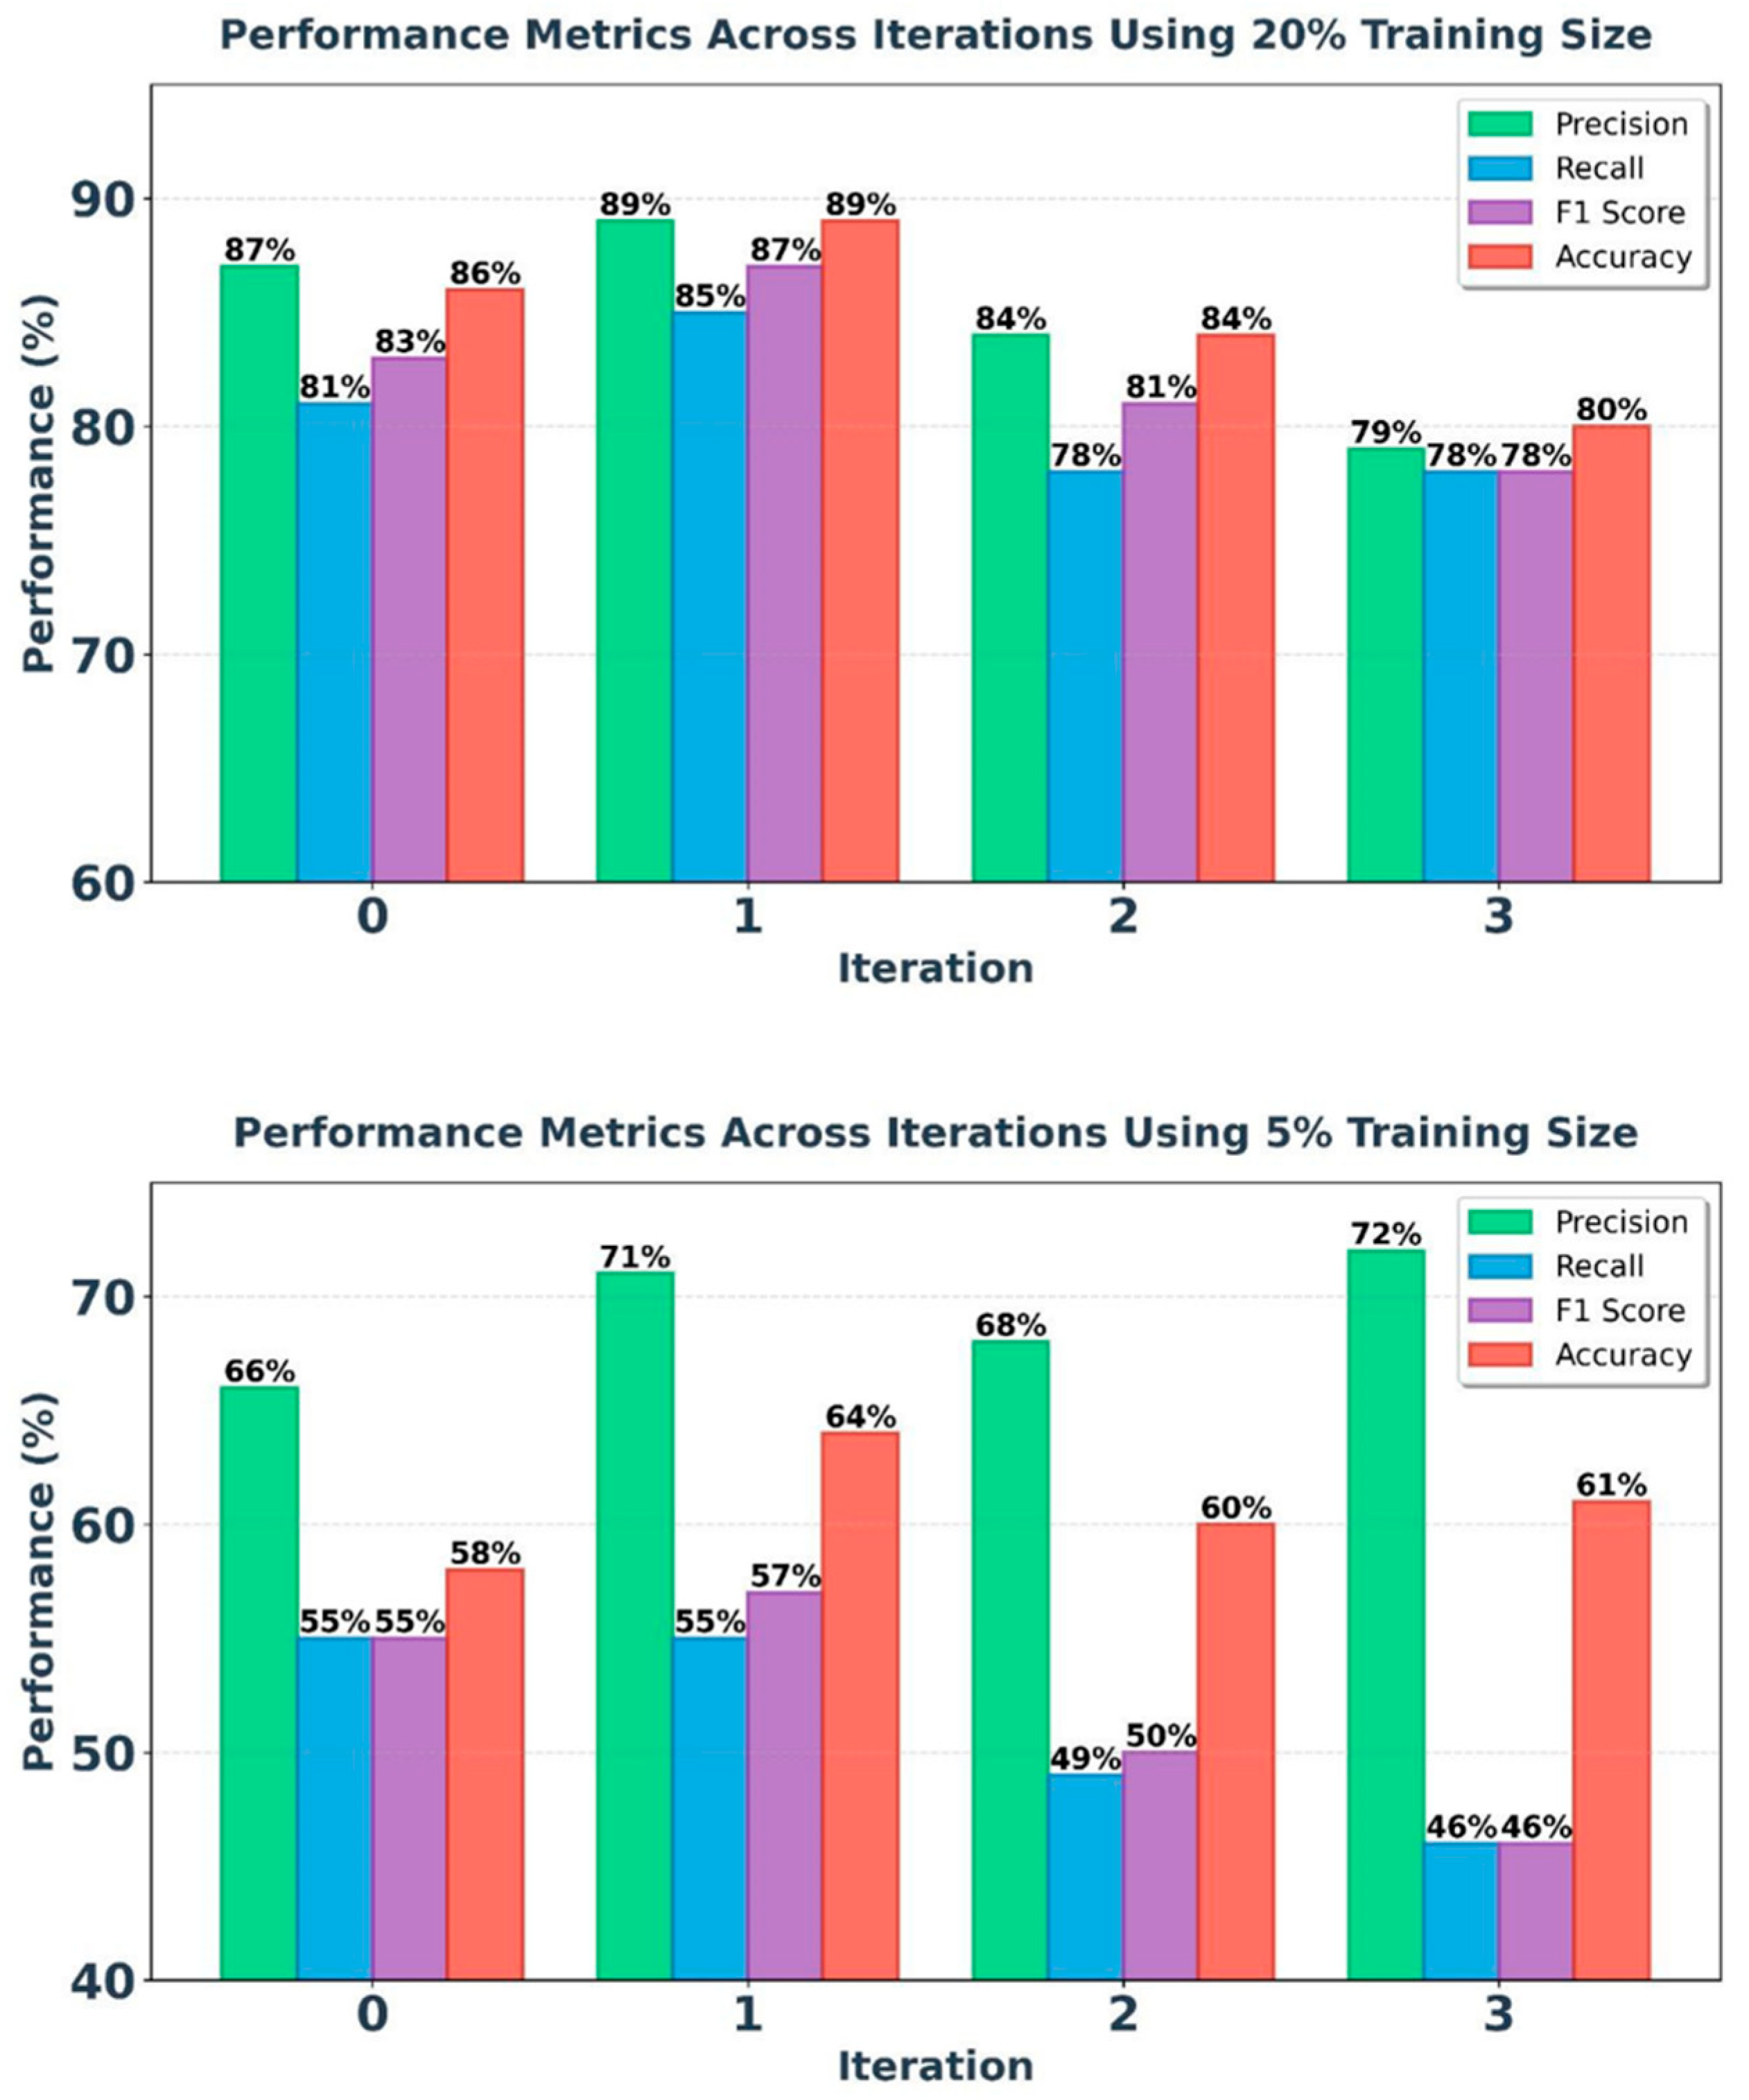
The iterative process demonstrates that while the addition of high-confidence pseudo-labels initially improves model accuracy and reduces test loss, excessive pseudo-labeling can lead to diminishing returns and potential overfitting. The model performs best with a balanced amount of pseudo-labeled data, as seen in the first and second iteration, and shows decreased performance with further iterations.
4.5. Confusion Matrix
To provide a detailed assessment of the classification performance of each model, the four confusion matrices (CMs) corresponding to SL and our proposed ITS Model are presented. Each confusion matrix is a 3 × 3 table that displays the distribution of true labels versus predicted labels for the three AMD classes: normal, drusen, and CNV across all datasets (see Figure 4).
By comparing the CMs in the SL and ITS models, it can be observed that at a 20% volume, the misclassification rate across different AMD classes has significantly decreased. At a 5% of dataset volume, despite diagnostic errors in drusen, the ITS model has shown good performance in classifying normal and CNV classes, indicating that the proposed model has performed very well in distinguishing AMD cases.
4.6. ROC Curve Analysis
To thoroughly assess the performance of the optimized supervised learning (SL) model and the proposed iterative teacher-student (ITS) model in detecting and distinguishing AMD cases at reduced dataset volumes (20% and 5%), Figure 5 presents the receiver operating characteristic (ROC) curves. These include ROC curves for the AMD classes (normal, drusen, and CNV), along with the micro-average and macro-average ROC curves.
The micro-average curve combines the true positives and false positives rates across all classes, and then calculates performance metrics based on these combined totals. This provides a comprehensive assessment of the model’s overall performance and gives an insight into how both the SL and ITS models perform across all classes. In contrast, the macro-average curve computes the performance metrics like ROC curve for each AMD class individually, and then averages these values, giving equal weight to each class. By comparing these curves across both SL and ITS settings, we can evaluate the effectiveness of the proposed method in differentiating between AMD cases.
5. Conclusion
The study demonstrates the critical role of parameter selection, transfer learning, and data augmentation in achieving optimal performance in supervised learning (SL) models for OCT images classification. Experiments revealed that batch size had no significant impact on performance but influenced training time, with smaller batch sizes increasing computational costs. Incorporating transfer learning significantly enhanced classification accuracy, particularly when pre-trained layers were fine-tuned. Models trained with frozen pre-trained layers exhibited a 7–10% decrease in accuracy, emphasizing the importance of enabling further learning within these layers. The SL model achieved its best performance with a batch size of 64, transfer learning, unfrozen pre-trainable layers, and effective data augmentation.
As the training dataset size decreased from 70% to 20% of the total data, a consistent decline in performance metrics, including accuracy, precision, recall, and F1 score, was observed. Accuracy dropped from 88.44% with 70% of the training data to 77.05% with 20%, highlighting the sensitivity of model performance to dataset size. Despite this, the robustness of the chosen parameter settings across varying data volumes was evident. However, the results underscore the need for larger training datasets to ensure optimal model performance, particularly in scenarios where high accuracy is critical. Decision-makers must carefully weigh the trade-offs between computational efficiency and model performance when determining dataset sizes.
The findings also underscore the importance of pre-trainable layers in SSL models. The inclusion of these layers led to significant improvements across all metrics, as they enhanced the model’s ability to generalize and make accurate predictions. For SSL models, unfrozen pre-trainable layers contributed to a 14.05% improvement in accuracy compared to frozen layers, a greater benefit than the 5.40% gain observed in SL models. This suggests that SSL methods are better equipped to leverage additional fine-tuning, making them more adaptable to exploiting learnable parameters and improving overall performance.
In TS model, when the dataset is reduced, the 95% confidence level can be effective. However, when the dataset size is drastically reduced, increasing the strictness of the confidence threshold yields better results.
Pseudo-labeling in SSL was shown to be an effective strategy for leveraging unlabeled data, with accuracy improving from 77% in the teacher model to 82.15% in the student model using pseudo-labeled data. The iterative process revealed that a balanced approach to adding high-confidence pseudo-labels was essential for maintaining model performance while minimizing test loss. Excessive pseudo-labeling led to diminishing returns and potential overfitting, emphasizing the need for careful management of pseudo-labeling strategies. Despite these challenges, the results demonstrated that pseudo-labeling, even with lower-confidence data, positively impacted model performance by providing valuable supplementary information.
Overall, this study highlights the distinct benefits of SSL over SL, particularly in scenarios where labeled data is limited. While both SL and SSL benefit from unfrozen pre-trainable layers, SSL shows a more pronounced improvement, suggesting its superior adaptability to fine-tuning. The findings emphasize the importance of careful parameter tuning, dataset size considerations, and pseudo-labeling strategies in optimizing model performance. These insights can guide future research and practical applications, paving the way for more effective machine learning systems in disease classification and beyond.
Author Contributions
Conceptualization, Ata Jodeiri; Methodology, Ata Jodeiri, Armin Alizadeh, and Nastaran Khakestari; Software, Ata Jodeiri, Armin Alizadeh, and Nastaran Khakestari; Validation, Ata Jodeiri and Ahmad Alenezi; Formal Analysis, Ata Jodeiri; Data Curation, Yashar Amizadeh, Armin Alizadeh, and Nastaran Khakestari; Writing—Original Draft Preparation, Armin Alizadeh; Writing—Review and Editing, Ata Jodeiri, Ahmad Alenezi, and Yashar Amizadeh; Visualization, Armin Alizadeh; Supervision, Ata Jodeiri; Project Administration, Ata Jodeiri; Funding Acquisition, this research received no external funding.
Funding
This research was supported by Tabriz University of Medical Sciences.
Institutional Review Board Statement
This study was conducted in accordance with the Declaration of Helsinki and approved by the Ethics Committee of Tabriz University of Medical Sciences (protocol code IR.TBZMED.REC.1403.535). .
Informed Consent Statement
Not applicable, data was publicly available online and published.
Data Availability Statement
The data presented in this study are openly available in: https://data.mendeley.com/datasets/8kt969dhx6/1.
Acknowledgments
We would like to express our gratitude to Tabriz University of Medical Sciences for their support and resources provided for this study. We also extend our sincere appreciation to our colleagues and collaborators for their valuable insights and constructive feedback, which significantly contributed to the completion of this work.
Conflicts of Interest
The authors declare no conflict of interest.
References
- Wong WL, Su X, Li X, Cheung CM, Klein R, Cheng CY, et al. Global prevalence of age-related macular degeneration and disease burden projection for 2020 and 2040: a systematic review and meta-analysis. The Lancet Global health. 2014;2(2):e106-16. [CrossRef]
- Taylor DJ, Hobby AE, Binns AM, Crabb DP. How does age-related macular degeneration affect real-world visual ability and quality of life? A systematic review. BMJ open. 2016;6(12):e011504. [CrossRef]
- Lim LS, Mitchell P, Seddon JM, Holz FG, Wong TY. Age-related macular degeneration. Lancet (London, England). 2012;379(9827):1728-38. [CrossRef]
- Pennington KL, DeAngelis MM. Epidemiology of age-related macular degeneration (AMD): associations with cardiovascular disease phenotypes and lipid factors. Eye and vision (London, England). 2016;3:34. [CrossRef]
- Deng Y, Qiao L, Du M, Qu C, Wan L, Li J, et al. Age-related macular degeneration: Epidemiology, genetics, pathophysiology, diagnosis, and targeted therapy. Genes & diseases. 2022;9(1):62-79. [CrossRef]
- Sotoudeh-Paima S, Jodeiri A, Hajizadeh F, Soltanian-Zadeh H. Multi-scale convolutional neural network for automated AMD classification using retinal OCT images. Computers in biology and medicine. 2022;144:105368. [CrossRef]
- Schmidt-Erfurth U, Sadeghipour A, Gerendas BS, Waldstein SM, Bogunović H. Artificial intelligence in retina. Progress in retinal and eye research. 2018;67:1-29. [CrossRef]
- Abedi F, Wickremasinghe S, Islam AF, Inglis KM, Guymer RH. Anti-VEGF treatment in neovascular age-related macular degeneration: a treat-and-extend protocol over 2 years. Retina (Philadelphia, Pa). 2014;34(8):1531-8. [CrossRef]
- Kniggendorf V, Dreyfuss JL, Regatieri CV. Age-related macular degeneration: a review of current therapies and new treatments. Arquivos brasileiros de oftalmologia. 2020;83(6):552-61. [CrossRef]
- Treder M, Lauermann JL, Eter N. Automated detection of exudative age-related macular degeneration in spectral domain optical coherence tomography using deep learning. Graefe's archive for clinical and experimental ophthalmology = Albrecht von Graefes Archiv fur klinische und experimentelle Ophthalmologie. 2018;256(2):259-65. [CrossRef]
- Li X, Shen L, Shen M, Tan F, Qiu C. Deep Learning Based Early Stage Diabetic Retinopathy Detection Using Optical Coherence Tomography. Neurocomputing. 2019;369:134-44. [CrossRef]
- Katsimpris A, Karamaounas A, Sideri AM, Katsimpris J, Georgalas I, Petrou P. Optical coherence tomography angiography in Alzheimer's disease: a systematic review and meta-analysis. Eye (London, England). 2022;36(7):1419-26. [CrossRef]
- Salehi MA, Rezagholi F, Mohammadi S, Zakavi SS, Jahanshahi A, Gouravani M, et al. Optical coherence tomography angiography measurements in Parkinson's disease: A systematic review and meta-analysis. Eye (London, England). 2023;37(15):3145-56. [CrossRef]
- Donica VC, Alexa AI, Pavel IA, Danielescu C, Ciapă MA, Donica AL, et al. The Evolvement of OCT and OCT-A in Identifying Multiple Sclerosis Biomarkers. Biomedicines. 2023;11(11). [CrossRef]
- Jordan MI, Mitchell TM. Machine learning: Trends, perspectives, and prospects. Science. 2015;349(6245):255-60. [CrossRef]
- Lecun Y, Bottou L, Bengio Y, Haffner P. Gradient-Based Learning Applied to Document Recognition. Proceedings of the IEEE. 1998;86:2278-324. [CrossRef]
- Bengio Y, Courville A, Vincent P. Representation Learning: A Review and New Perspectives. IEEE transactions on pattern analysis and machine intelligence. 2013;35:1798-828. [CrossRef]
- Bajwa J, Munir U, Nori A, Williams B. Artificial intelligence in healthcare: transforming the practice of medicine. Future healthcare journal. 2021;8(2):e188-e94. [CrossRef]
- Lu W, Tong Y, Yu Y, Xing Y, Chen C, Shen Y. Applications of Artificial Intelligence in Ophthalmology: General Overview. Journal of ophthalmology. 2018;2018:5278196. [CrossRef]
- Lee CS, Baughman DM, Lee AY. Deep learning is effective for the classification of OCT images of normal versus Age-related Macular Degeneration. Ophthalmology Retina. 2017;1(4):322-7. [CrossRef]
- He T, Zhou Q, Zou Y. Automatic Detection of Age-Related Macular Degeneration Based on Deep Learning and Local Outlier Factor Algorithm. Diagnostics (Basel, Switzerland). 2022;12(2). [CrossRef]
- Alenezi A, Alhamad H, Brindhaban A, Amizadeh Y, Jodeiri A, Danishvar S. Enhancing Readability and Detection of Age-Related Macular Degeneration Using Optical Coherence Tomography Imaging: An AI Approach. Bioengineering (Basel, Switzerland). 2024;11(4). [CrossRef]
- Hassan B, Qin S, Ahmed R, Hassan T, Taguri AH, Hashmi S, et al. Deep learning based joint segmentation and characterization of multi-class retinal fluid lesions on OCT scans for clinical use in anti-VEGF therapy. Computers in biology and medicine. 2021;136:104727. [CrossRef]
- Li F, Chen H, Liu Z, Zhang X, Wu Z. Fully automated detection of retinal disorders by image-based deep learning. Graefe's archive for clinical and experimental ophthalmology = Albrecht von Graefes Archiv fur klinische und experimentelle Ophthalmologie. 2019;257(3):495-505. [CrossRef]
- Wang D, Wang L. On OCT image classification via deep learning. IEEE Photonics Journal. 2019;11(5):1-14.
- Zapata MA, Royo-Fibla D, Font O, Vela JI, Marcantonio I, Moya-Sánchez EU, et al. Artificial Intelligence to Identify Retinal Fundus Images, Quality Validation, Laterality Evaluation, Macular Degeneration, and Suspected Glaucoma. Clinical ophthalmology (Auckland, NZ). 2020;14:419-29. [CrossRef]
- Dong L, He W, Zhang R, Ge Z, Wang YX, Zhou J, et al. Artificial Intelligence for Screening of Multiple Retinal and Optic Nerve Diseases. JAMA network open. 2022;5(5):e229960. [CrossRef]
- Anzar SM. A lightweight deep learning model for retinal optical coherence tomography image classification. International Journal of Imaging Systems and Technology. 2022;33. [CrossRef]
- Ren F, Cao P, Zhao D, Wan C. Diabetic macular edema grading in retinal images using vector quantization and semi-supervised learning. Technology and health care : official journal of the European Society for Engineering and Medicine. 2018;26(S1):389-97. [CrossRef]
- Zheng C, Ye H, Yang J, Fei P, Qiu Y, Xie X, et al. Development and Clinical Validation of Semi-Supervised Generative Adversarial Networks for Detection of Retinal Disorders in Optical Coherence Tomography Images Using Small Dataset. Asia-Pacific journal of ophthalmology (Philadelphia, Pa). 2022;11(3):219-26. [CrossRef]
- Chen D, Ao Y, Liu S. Semi-Supervised Learning Method of U-Net Deep Learning Network for Blood Vessel Segmentation in Retinal Images. Symmetry. 2020;12:1067. [CrossRef]
- Rahdar A, Ahmadi MJ, Naseripour M, Akhtari A, Sedaghat A, Hosseinabadi VZ, et al. Semi-supervised segmentation of retinoblastoma tumors in fundus images. Scientific reports. 2023;13(1):13010. [CrossRef]
- Diaz-Pinto A, Colomer A, Naranjo V, Morales S, Xu Y, Frangi AF. Retinal Image Synthesis and Semi-Supervised Learning for Glaucoma Assessment. IEEE transactions on medical imaging. 2019;38(9):2211-8. [CrossRef]
- Wang X, Tang F, Chen H, Cheung CY, Heng PA. Deep semi-supervised multiple instance learning with self-correction for DME classification from OCT images. Medical image analysis. 2023;83:102673. [CrossRef]
- Duan S, Huang P, Chen M, Wang T, Sun X, Chen M, et al. Semi-supervised classification of fundus images combined with CNN and GCN. Journal of applied clinical medical physics. 2022;23(12):e13746. [CrossRef]
- Tan Z, Zhang Q, Lan G, Xu J, Ou C, An L, et al. OCT Retinopathy Classification via a Semi-Supervised Pseudo-Label Sub-Domain Adaptation and Fine-Tuning Method. Mathematics. 2024;12:347. [CrossRef]
- Tan M, Le Q. EfficientNet: Rethinking Model Scaling for Convolutional Neural Networks. In: Kamalika C, Ruslan S, editors. Proceedings of the 36th International Conference on Machine Learning; Proceedings of Machine Learning Research: PMLR; 2019. p. 6105--14. [CrossRef]
- Radosavovic I, Kosaraju RP, Girshick R, He K, Dollár P, editors. Designing network design spaces. Proceedings of the IEEE/CVF conference on computer vision and pattern recognition; 2020. [CrossRef]
- Lee D-H, editor Pseudo-label: The simple and efficient semi-supervised learning method for deep neural networks. Workshop on challenges in representation learning, ICML; 2013: Atlanta.
Figure 1.
Sample OCT images of normal, dry AMD and wet AMD eye from the Noor Eye Hospital dataset.
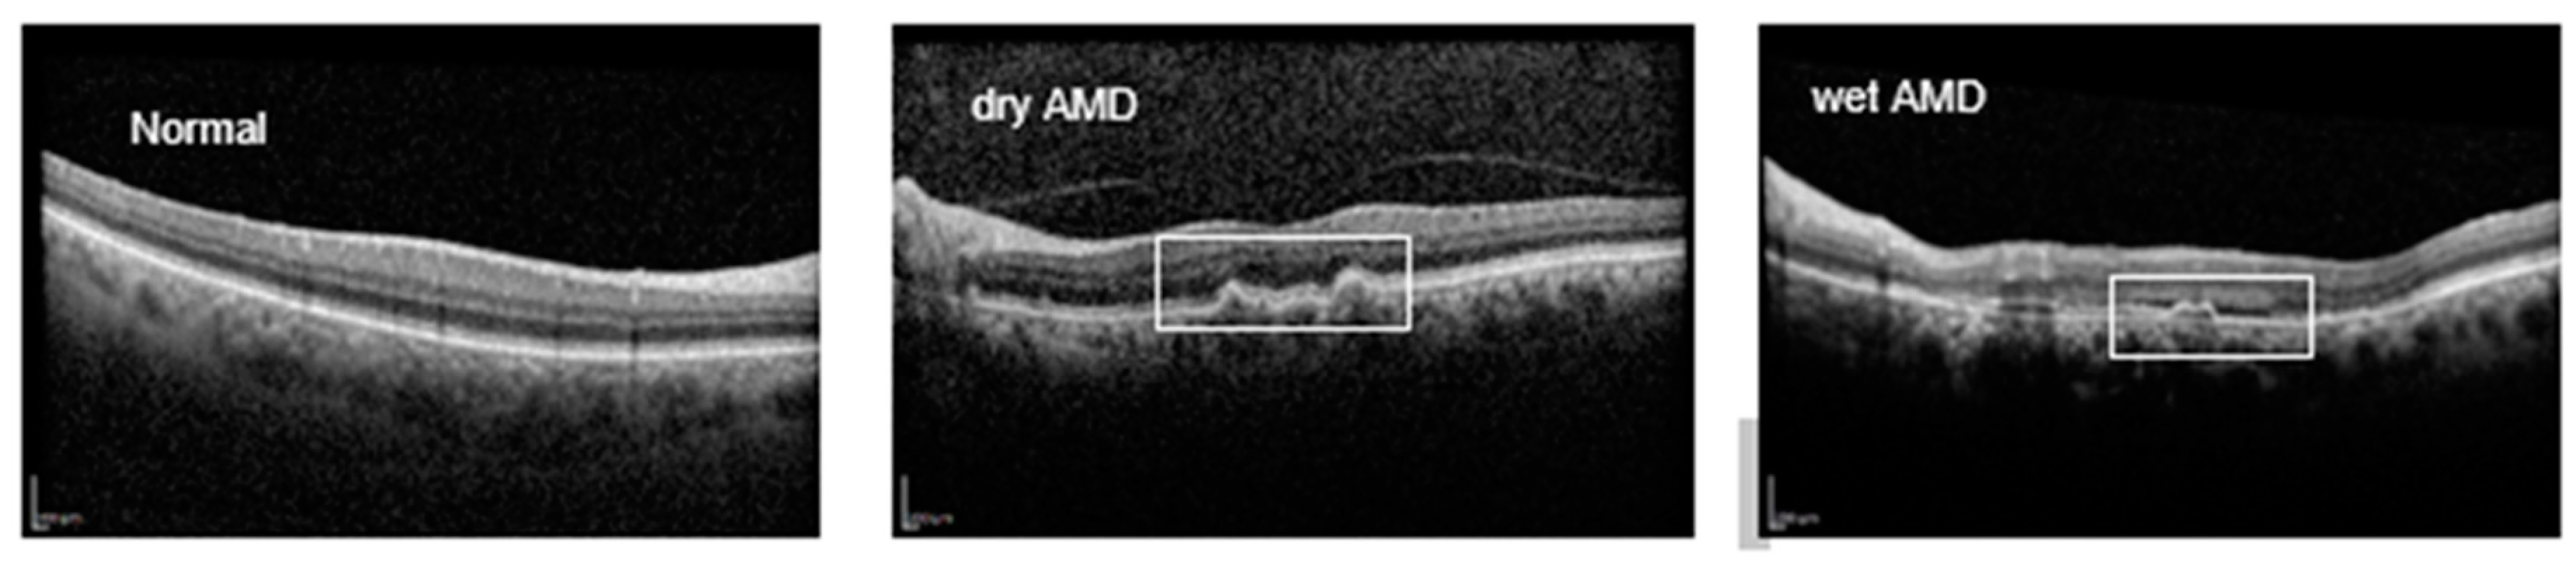
Figure 2.
Overview of the proposed semi-supervised framework ITS.
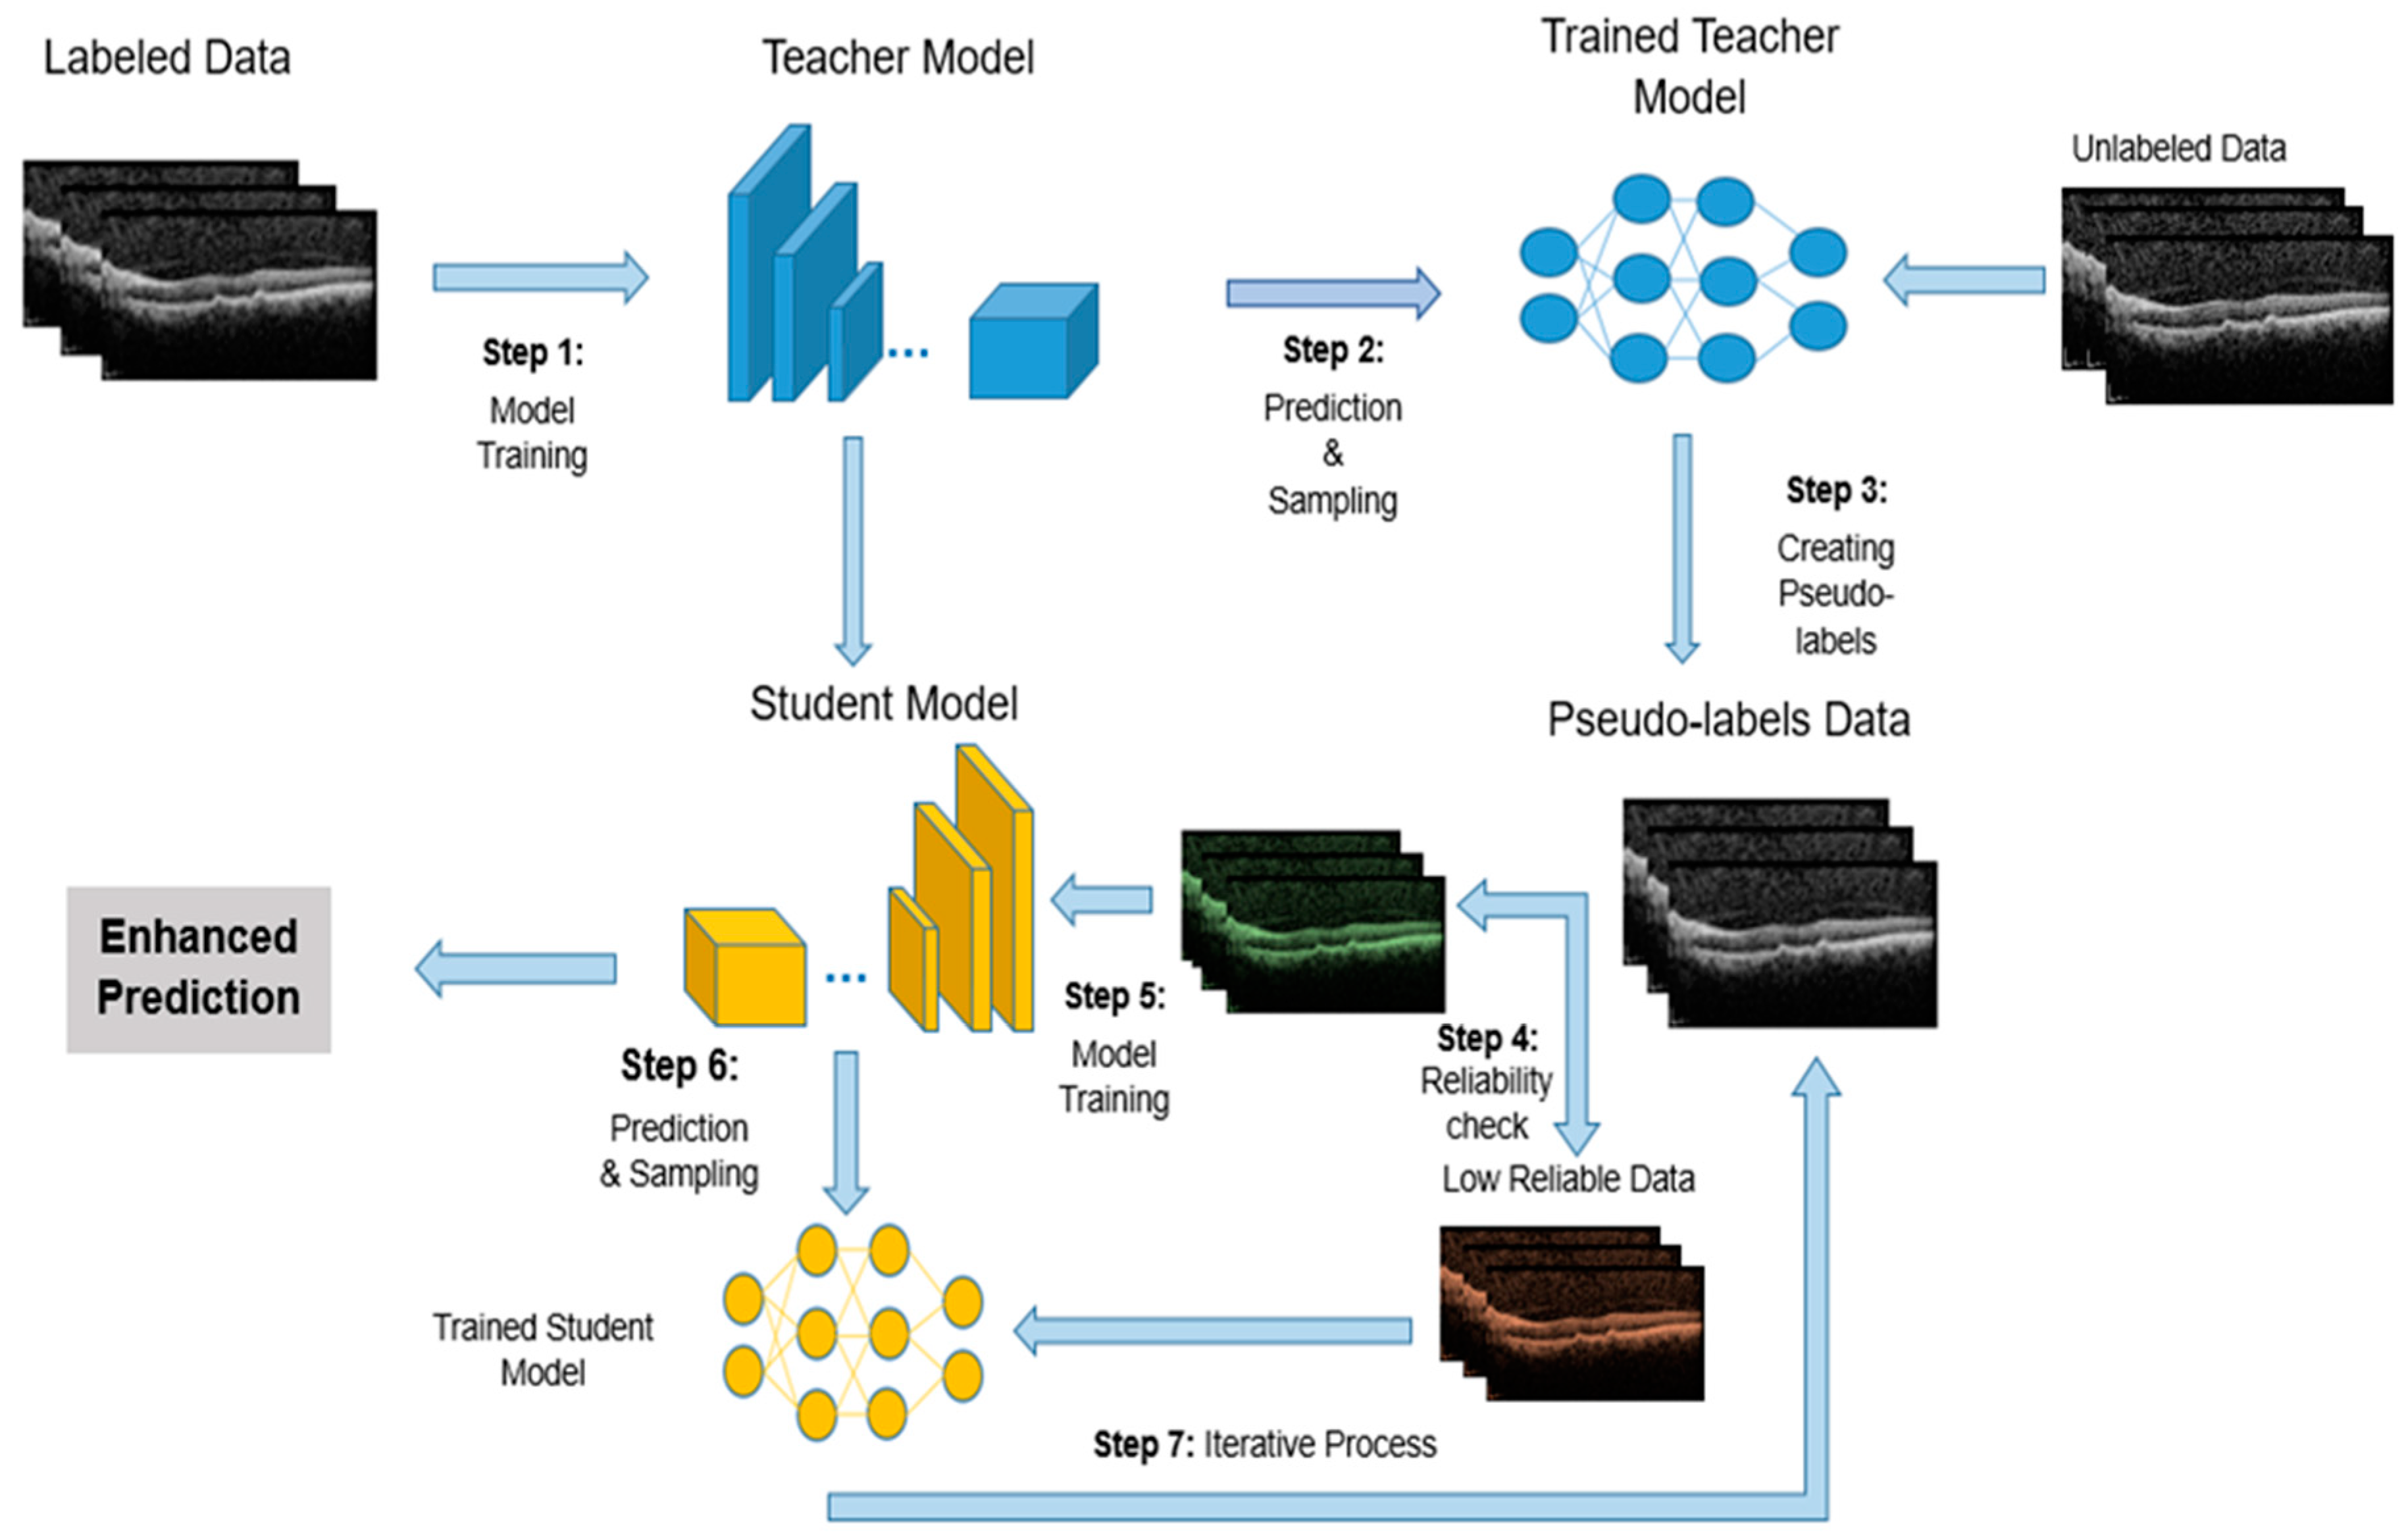
Figure 4.
Confusion matrices for model evaluation: true vs. predicted labels across three AMD classes at 20% and 5% of dataset size in SL and ITS models.
Figure 4.
Confusion matrices for model evaluation: true vs. predicted labels across three AMD classes at 20% and 5% of dataset size in SL and ITS models.
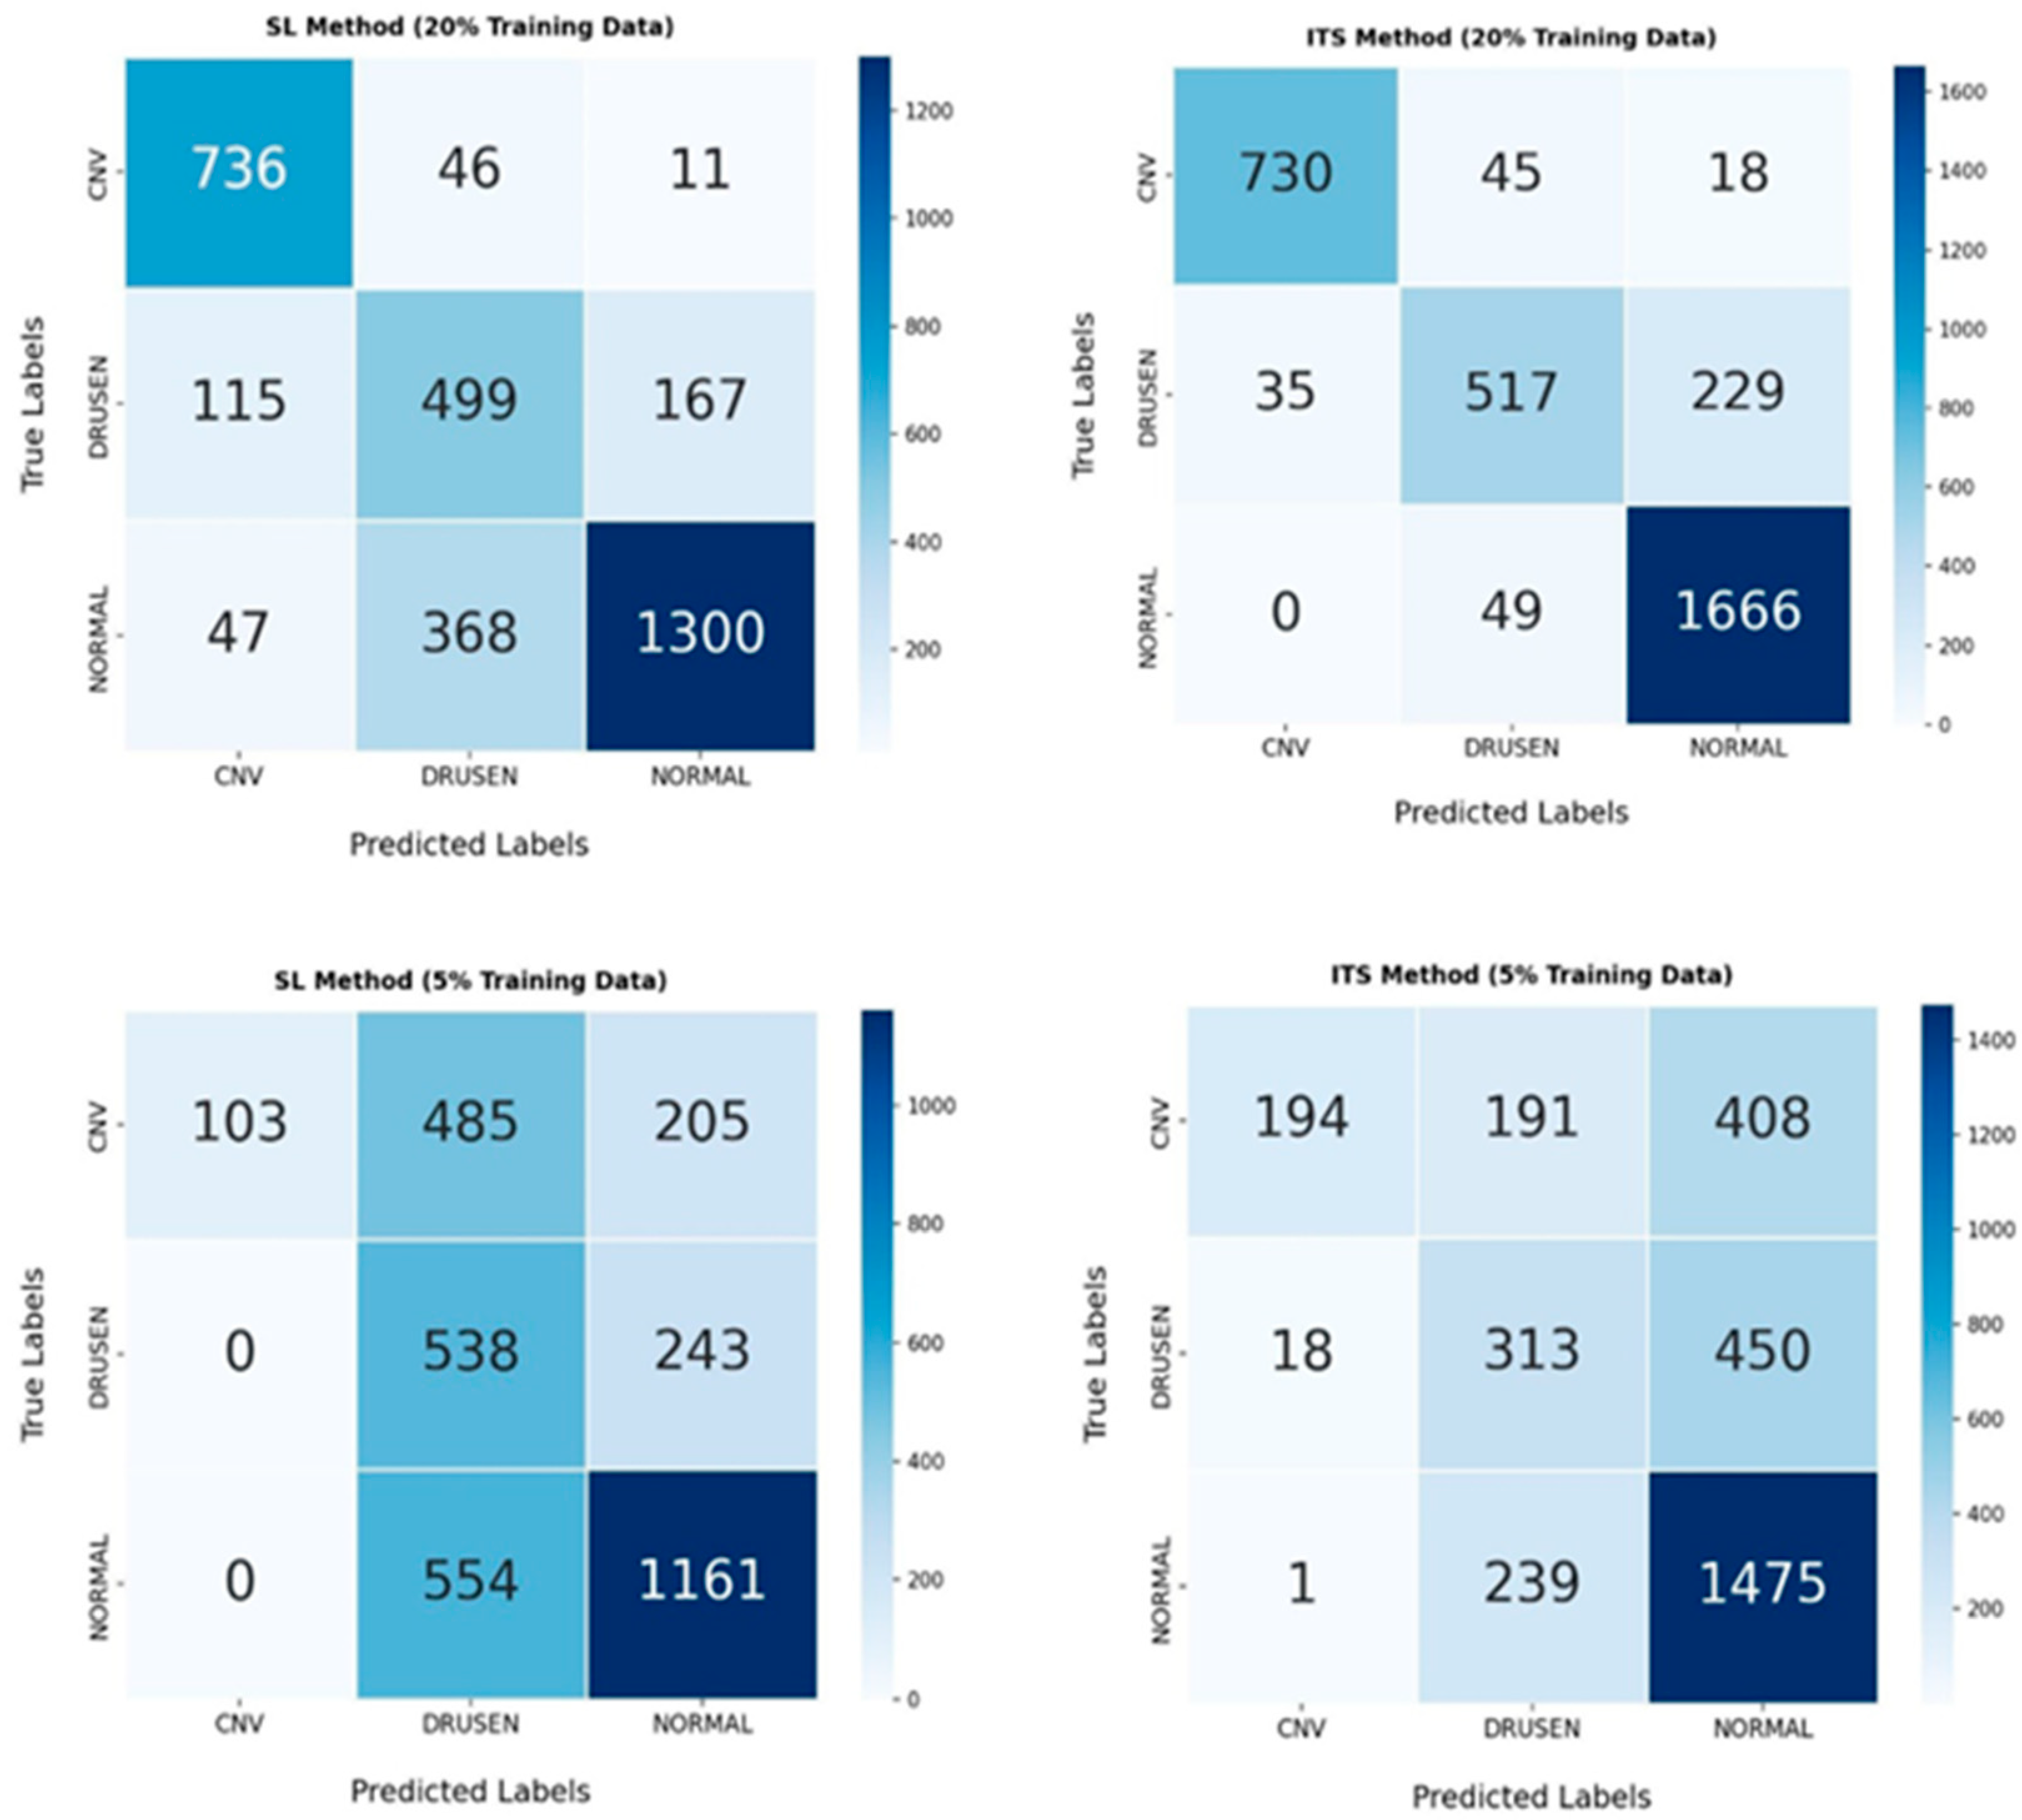
Figure 5.
ROC curves illustrating SL and ITS model performance at 20% and 5% of dataset volume: individual class ROC curves (Classes 0, 1, 2) micro-average ROC curve, and macro-average ROC Curve. The dashed diagonal line represents a reference line (line of no-discrimination).
Figure 5.
ROC curves illustrating SL and ITS model performance at 20% and 5% of dataset volume: individual class ROC curves (Classes 0, 1, 2) micro-average ROC curve, and macro-average ROC Curve. The dashed diagonal line represents a reference line (line of no-discrimination).
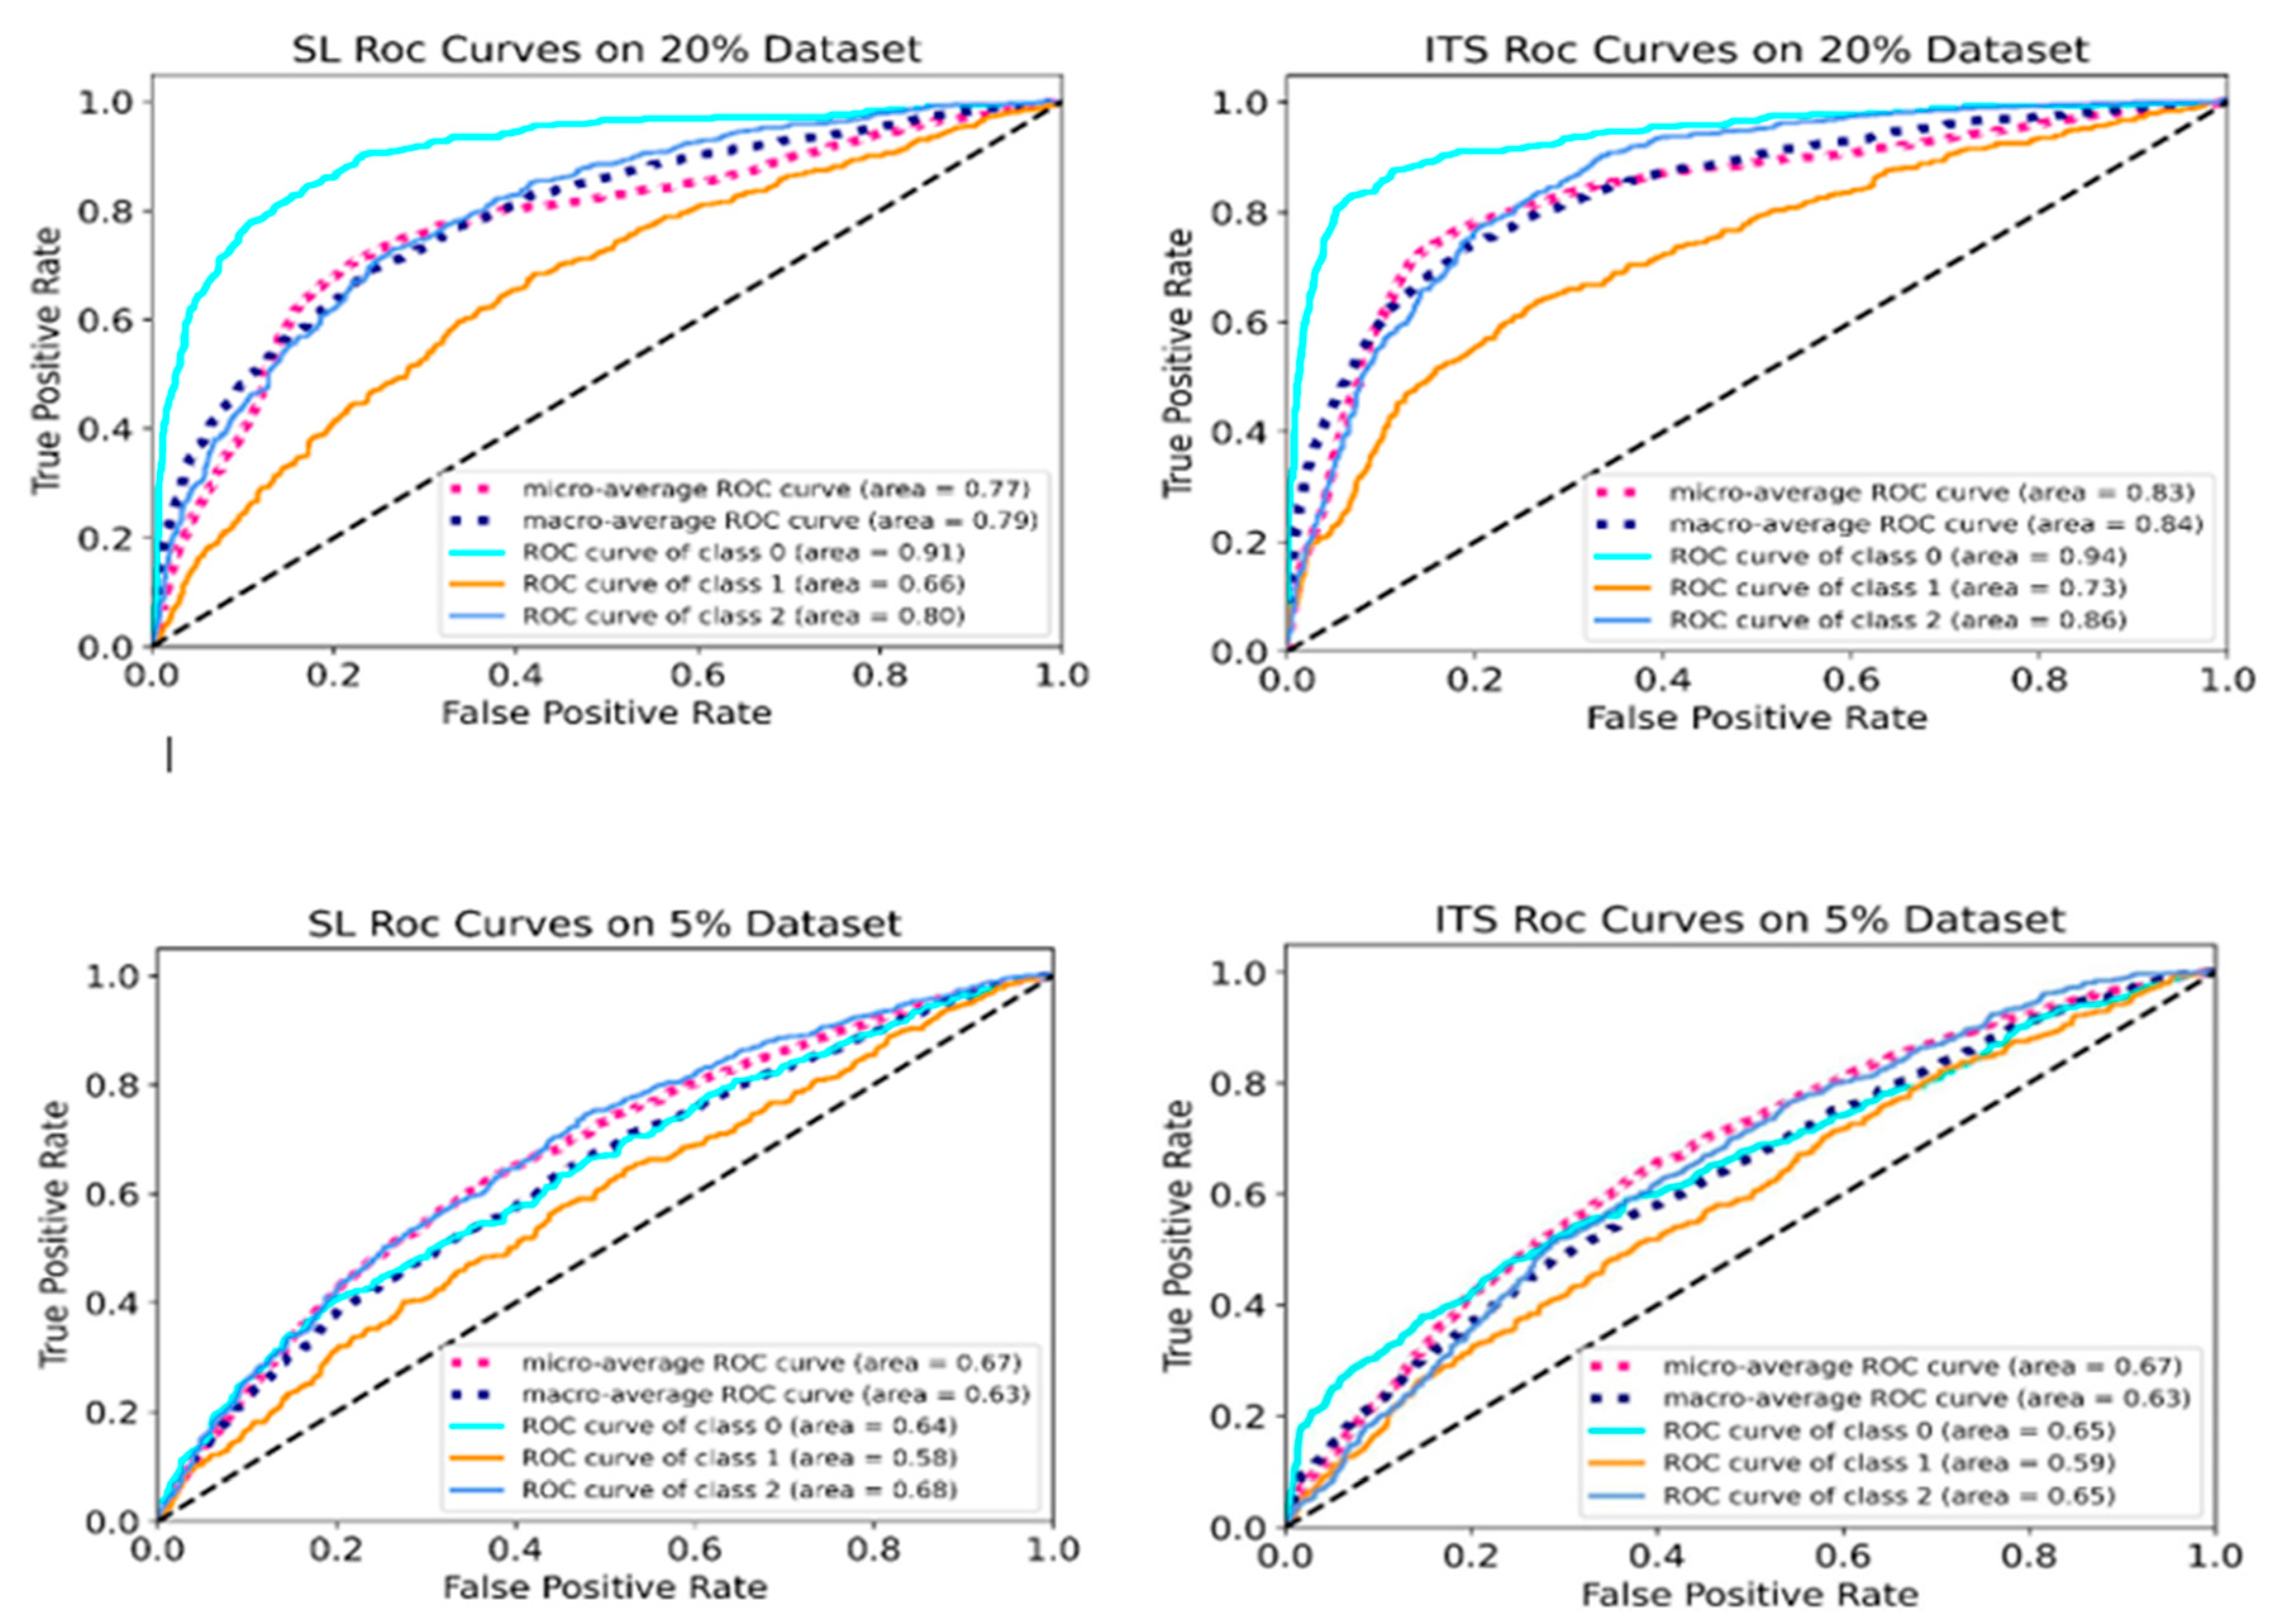

Table 1.
Performance metrics of SL model using optimizing parameters. Best results are highlighted in bold.
Table 1.
Performance metrics of SL model using optimizing parameters. Best results are highlighted in bold.
| Experiment Number | Transfer Learning | Pre-Trained Layers | Data Aug. | Accuracy (%) | Precision (%) | Recall (%) |
F1 Score (%) |
|---|---|---|---|---|---|---|---|
| 1 | ImageNet | Fine-tuned | Enabled | 87.14 | 87.33 | 87.66 | 87.33 |
| 2 | ImageNet | Frozen | Enabled | 77.31 | 76.66 | 75.33 | 76.66 |
| 3 | ImageNet | Fine-tuned | Disabled | 86.27 | 88.33 | 84.66 | 86 |
| 4 | Random | Fine-tuned | Enabled | 86.27 | 86.66 | 85.33 | 85.66 |
Table 2.
Performance metrics changes in 20% of train dataset.
| Model | Acc. Change (%) | Prec. Change (%) | Recall Change (%) | F1-Sco. Change (%) | ||||||||||||
|---|---|---|---|---|---|---|---|---|---|---|---|---|---|---|---|---|
| Confidence (%) | Confidence (%) | Confidence (%) | Confidence (%) | |||||||||||||
| 0 | 90 | 95 | 99 | 0 | 90 | 95 | 99 | 0 | 90 | 95 | 99 | 0 | 90 | 95 | 99 | |
| Trained on 20% | 82.15 | 84.25 | 86.01 | 85.31 | 84 | 85 | 87.33 | 81.66 | 77 | 81 | 86.01 | 80 | 79 | 82 | 81 | 80 |
Disclaimer/Publisher’s Note: The statements, opinions and data contained in all publications are solely those of the individual author(s) and contributor(s) and not of MDPI and/or the editor(s). MDPI and/or the editor(s) disclaim responsibility for any injury to people or property resulting from any ideas, methods, instructions or products referred to in the content. |
© 2025 by the authors. Licensee MDPI, Basel, Switzerland. This article is an open access article distributed under the terms and conditions of the Creative Commons Attribution (CC BY) license (http://creativecommons.org/licenses/by/4.0/).
Copyright: This open access article is published under a Creative Commons CC BY 4.0 license, which permit the free download, distribution, and reuse, provided that the author and preprint are cited in any reuse.


