
Submitted:
02 February 2025
Posted:
03 February 2025
You are already at the latest version
Abstract
Purpose: To compare the oncogenic risk related to radiation exposure in patients frequently exposed to ionizing radiation for diagnostic purposes, specifically ICU patients, according to different risk models, including the BEIR VII, ICRP 103, and US EPA models.
Methods: This was an IRB-approved observational retrospective study. Seventy-one patients (58 male, 13 female; median age, 66 years; interquartile range [IQR], 71-56 years) admitted to the CU who underwent x-ray examinations between October 1, 2021, and February 28, 2023 were included. For each patient, the cumulative effective dose during a single hospital admission was calculated. Lifetime attributable risk (LAR) was estimated based on the BEIR VII, ICRP 103, and US EPA risk models to calculate additional oncogenic risk related to radiation exposure. The Friedman test repeated-measures analysis of variance was used to compare risk values between different models. The intraclass correlation coefficient (ICC) was used to assess the consistency of risk values between different models.
Results: Different organ, leukemia, and all-cancer risk values estimated according to different oncogenic risk models were significantly different, but the intraclass correlation coefficient revealed a good (>0.75) or even excellent (>0.9) agreement between different risk models. The ICRP 103 model estimated a lower all-cancer (median 69.05 [IQR 30.35-195.37]) and leukemia risk (8.22 [3.02-27.93]) compared to the US EPA (all-cancer: 139.68 [50.51-416.16]; leukemia: 23.34 [3.47-64.37]) and BEIR VII (all-cancer: 162.08 [70.6-371.40]; leukemia: 24.66 [12.9-58.8]) models.
Conclusions: Cancer risk values were significantly different between risk models, though inter-model agreement in the consistency of risk values was found to be good, or even excellent. The ICRP 103 risk model estimated the lowest all radiation-induced cancer and leukemia risk.
Keywords:
BEIR VII
; oncogenic risk
; intensive care unit
; effective dose
; computed tomography
; radiation exposure
Introduction
Medical exposures to ionizing radiation for diagnostic purposes continue to increase [1,2] and related potential oncogenic effects represent a source of concern [3,4,5]. In radiology, dose metrics are used to optimize the radiation dose to the patient, but they cannot be applied to estimate individual radiation risk based on age, gender, or tissue type.
To estimate the lifetime risks of radiation-induced cancer, different oncogenic risk models have been developed based on epidemiological data from the Life Span Study [6,7,8,9,10] using the linear no-threshold theoretical principle, which states that any radiation exposure, regardless of dose, increases cancer risk [11]. The National Research Council and National Academy of Sciences published the Biological Effects of Ionizing Radiation seventh report (BEIR VII) in 2006 [12] and proposed a model for estimating radiation-induced oncogenic risk. The BEIR VII model applies a linear-quadratic radiation dose–cancer risk relationship for both acute and chronic radiation exposure and a quadratic relationship for leukemia. The Radiation Risk Assessment Tool [13] is an additional model based on BEIR VII and supported by the National Cancer Institute that was proposed to estimate the lifetime cancer risk by integrating life expectancy in the US population and cancer incidence. In addition, the United Nations Scientific Committee on the Effects of Atomic Radiation and the International Commission on Radiological Protection (ICRP) developed two cancer risk models that were presented in the UNSCEAR 2006 report [14] and ICRP Publication 103 [15], respectively. Other risk models that have been developed include the United States Environmental Protection Agency (US EPA) model [16], which represents a developed version of the BEIR VII model, and the World Health Organization model [17], which adapted the latest models of the United Nations Scientific Committee on the Effects of Atomic Radiation and ICRP to conduct off-site analyses of the Fukushima nuclear accident.
A marked reduction in radiation dose is particularly necessary in intensive care unit (ICU) patients, who are frequently exposed to radiation doses as high as 100 mSv or more during a single hospital admission, especially among patients with prolonged hospitalization [18,19]. Due to their clinical status requiring frequent monitoring of medical and/or surgical complications in the chest and/or abdomen, ICU patients frequently undergo CT, often with extended scanning lengths and with the scans repeated several times during a short period of time, resulting in a high effective dose and increased risk of radiation-induced cancer.
The aim of this study was to compare the oncogenic risk related to radiation exposure in patients frequently exposed to ionizing radiation for diagnostic purposes, specifically ICU patients, according to different risk models, including the BEIR VII, ICRP 103, and US EPA models.
Materials and Methods
Patient Population
This observational single-center retrospective study was conducted in accordance with the Declaration of Helsinki and approved by the hospital IRB and patient informed consent was obtained (Protocol number 0002146 approved April 13, 2023). We identified all consecutive patients referred to the ICU of our hospital between October 1, 2021, and February 28, 2023, because of their severe clinical status after recent major thoracic or abdominal surgery or solid organ transplant, or major trauma with severe solid organ injuries, and who underwent x-ray examinations during their hospitalization in the ICU, such as radiography of the chest, abdomen, limbs, or spine; fluoroscopy and/or interventional radiological procedures; and CT of the head, neck, chest, abdomen, pelvis, or limbs with or without injection of iodinated contrast agents. We excluded pediatric patients (age < 18 years) and patients who had repeated CT scans due to patient movement or respiratory artifacts, had a CT scan as part of PET/CT, underwent solely brain CT or limb CT, had a CT scan as part of a research protocol (since scanning protocols could be different from routine CT scans), or had a higher risk of cancer due to genetics, including Li-Fraumeni syndrome, Lynch syndrome, Von Hippel-Lindau disease, multiple endocrine neoplasia, and Cowden syndrome.
CT Scanning Protocols
Patients were scanned craniocaudally from the lower neck to the level of the costophrenic angle on chest CT, and from the diaphragm level to the pelvis on abdominal CT before and after iodinated contrast agent injection. The arterial phase was triggered by placing a region-of-interest over the abdominal CT scan at the level of the second lumbar vertebral body and starting the scan when the density level reached 100 HU. The portal venous and late phases were obtained 70 s and 180 s after iodinated contrast injection, respectively. The following CT parameters were used: tube voltage, 100-120 kVp; automatic tube current modulation activated; gantry rotation period, 280 ms; detector collimation, 0.625 mm; and detector pitch, 1.53. The CT dataset was then reconstructed at a section thickness of 1.25 mm with 512×512 matrices using standard kernels for soft tissues.
Cumulative Effective Dose
The cumulative effective dose per patient was calculated by summing the effective dose from each radiological procedure in the ICU during the hospital admission period. The effective dose from radiography of different body segments was estimated based on medial values derived from the literature [19]. To calculate the effective dose for fluoroscopy and interventional radiology procedures, the dose-area product (DAP, expressed in mGy×cm²) was multiplied for established conversion factors (k) [19,20] expressed in mSv/(mGy×cm²) to obtain the effective dose in mSv according to the following formula: effective dose = k × DAP. To calculate the CT effective dose, a Monte Carlo simulation algorithm was used. CT data were deidentified at the facility where they were obtained and uploaded to a single server using Radimetrics (Radimetrics Enterprise Platform, Bayer Healthcare, Berlin, Germany), a software tool for monitoring and tracking patient radiation exposures. Two experts in medical physics performed the analysis and provided final data from Radimetrics. The software extracts patient sex, age, date and time of the examination, scan region, study description, protocol name, scanner manufacturer and model, and dose metrics from the Radiation Dose Structured Report (RDSR) sent to the Picture Archiving and Communication Systems (PACS). Radimetrics calculates the volume CT dose index (CTDIvol), the average per section radiation exposure; the dose-length product, the product of CTDIvol and scan length measured in mGy x cm; and effective dose measured in mSv. To calculate effective dose, Radimetrics matches patients to a particular phantom in its library on the basis of age, weight, or patient diameter and runs a set of Monte Carlo simulations based on the examination parameters. The organ absorbed doses are used to calculate effective dose according to tissue-weighting factors in ICRP 103 [21,22].
Data were collected for each irradiation event and then combined and reported according to the examination. We did not include scout scan and bolus-track scans obtained to determine the timing of the injection of iodinated contrast material.
Radiation-Induced Oncogenic Risk
The main features of the radiation dose-cancer risk models are reported in Table 1. In this study, we included the BEIR VII, ICRP 103, and US EPA risk models. We did not include the Radiation Risk Assessment Tool due to its similarity to the BEIR VII model or United Nations Scientific Committee on the Effects of Atomic Radiation model due to a lack of specific recommendations regarding the reduction of risk at low doses and low dose rates [13,14,15]. All risk models included lifetime attributable risk (LAR), which represents an approximation of the risk of radiation-induced death, defined as death or incident cases of cancer that would have occurred without radiation exposure but occurred at a younger age because of radiation exposure, and that corresponds to the probability that an individual will die from or develop cancer associated with radiation exposure according to sex-, age-, and tumor site-specific coefficients. LAR is expressed as the number of excess cancers or deaths due to cancer per 100 000 persons of mixed ages exposed to 0.1 Gy [12]:
LAR is mathematically defined as the sum of risks between the age at exposure (e) plus a latency period (L), which is set at 5 years for solid cancers and 2 years for leukemia based on evidence from the Life Span Study, and a maximum age (aMAX), set at 100 years. corresponds to the absolute risk at attained age a from an exposure at age e, S(a) represents the probability of surviving to age a (cancer-free survival), and S(a)/S(e) represents the conditional probability of a person being alive and cancer-free at age e reaching at least an attained age a. LAR is defined within an interval of 10 years for each age class for individuals aged >18 years, as considered in this study. For individuals included in a different age class, the LAR risk was calculated by using linear interpolation. For example, for an individual aged 75 years, the risk was calculated by linear interpolation between 70 and 80 years.
To express the radiation-induced cancer risk, different from the other risk models, ICRP 103 [15] includes the risk of exposure-induced cancer incidence, which can be approximated to LAR for low-dose exposure and be calculated as:
Where (a | D, e) and μic(a) indicate the specific cancer incidence (c) at age a with or without radiation exposure, L represents the minimal latency period, and S (a | D, e) indicates the probability of cancer-free survival.
One expert in mathematics performed the risk analysis. To obtain comparable risk models, the oncogenic risk was expressed as the additional oncogenic risk (AOR), the risk index of cancers in patients exposed to x-ray in addition to the oncogenic risk in the general population. AOR is calculated based on the linear no-threshold model. AOR corresponds to the LAR per 100 000 individuals per 0.1 Gy multiplied by cumulative effective dose/0.1 in the BEIR VII model, and to the LAR per 10 000 individuals per Gy multiplied by cumulative effective dose in the ICRP 103 and US EPA risk models [24,25]. To make numbers comparable, AOR was finally multiplied by 100 000.
Statistical Analysis
All anonymized data were exported to an Excel file (Microsoft Office Professional Plus 2010, Microsoft Corporation, Redmond, USA). Statistical analyses were performed using MedCalc for Windows, v. 23.1.3 (MedCalc Software, Mariakerke, Belgium). We estimated needing to recruit at least 50 patients to detect a significant difference in cancer risk considering a statistical power of 0.8 and significance criterion of 0.05. For all analyses, orthogonal regression was conducted and the Pearson r computed. To evaluate consistency, intraclass correlation coefficients (ICCs) were determined and Bland-Altman analyses performed._We used the ICC to assess the consistency of risk values between different models. ICC values <0.5 indicate poor agreement; ≥0.5 and <0.75, moderate agreement; ≥0.75 and <0.9, good agreement; ≥0.9, excellent agreement. Results for continuous variables were expressed as the median and interquartile range (IQR). As the Shapiro-Wilk test failed to show a normal data distribution, the Friedman test repeated-measures analysis of variance was used to compare risk values between different models. P < .05 was considered indicative of a difference.
Results
Patient Characteristics
The inclusion of patients in the study is shown inFigure 1. After exclusion, we included 71 patients (Table 2) who underwent 2847 radiological examinations, including 2472 x-ray films (87%), 270 contrast-enhanced CT scans (9%), and 106 fluoroscopy and interventional radiology procedures (4%). Patients underwent CT of different body regions; 19 underwent chest CT (n=10 unenhanced CT and after iodinated contrast injection during the arterial phase, n=9 unenhanced CT and contrast-enhanced CT in both arterial and portal venous phases), 20 abdominal CT (n=12 unenhanced CT and after iodinated contrast injection during the arterial phase, n=8 unenhanced CT and contrast-enhanced CT in both arterial and portal venous phases), and 32 chest and abdominal CT (n=12 unenhanced CT in arterial phase, n=20 unenhanced CT in both arterial and portal venous phases).
Cumulative Effective Dose
The median cumulative effective dose per patient was 38.82 (IQR, 17.34 – 84.64) mSv. Male patients were exposed to a higher median cumulative effective dose than female patients (37.59 [IQR, 17.6 – 78.01] vs. 44.11 [IQR, 14.19 – 86.85]).
Oncogenic Risk
Figure 2 shows the all-cancer and leukemia risk distribution according to different risk models. A significant correlation was observed between all risk models (r = 0.71 – 0.97, P = .001) (Figure 3) and Bland-Altman analysis showed negligible bias (mean difference, -0.001 – 0.004) (Figure 4). Different organ, leukemia, and all-cancer risk values (Table 3) were significantly different, but the ICC revealed good or even excellent inter-model consistency in risk values. The ICRP 103 model indicated a lower all-cancer and leukemia risk compared to the US EPA and BEIR VII models (Table 3). Both the BEIR VII and ICRP 103 models indicated higher all-cancer risk in females, whereas the US EPA model showed higher all-cancer risk in males (Table 4). ICRP 103 showed higher leukemia risk in females, whereas both BEIR VII and ICRP 103 showed higher leukemia risk in males (Table 4).
Discussion
In this study, we compared the calculated oncogenic risk related to radiation exposure across a clinical dataset according to the most accredited risk models. As effective dose cannot express the individual oncogenic risk and sex, age, and tissue characteristics affect individual radiation risk have been proposed as surrogates for actual patient risk [26]. There is currently no system to compute radiation-induced cancer risk for clinical cases because it is labor-intensive and computationally expensive. Therefore, we proposed AOR as a risk index calculated from the effective dose and LAR product.
The first result of our study was that different organ, leukemia, and all-cancer risk values estimated according to different oncogenic risk models were significantly different in patients with frequent exposure to ionizing radiation for diagnostic purposes. Yet, the ICC revealed good or even excellent inter-model consistency in risk values. The evidence of significantly different oncogenic risk values should imply the need for more reliable and reproducible cancer risk models based on recent epidemiological data in addition the epidemiological data from atomic bomb survivors in the Life Span Study [6,7,8,9,10] who had whole-body exposure to x-rays. Excess absolute risk is more feasible when significant differences are present (e.g., ethnicity, diet, and other additional parameters) between the population under investigation and the population on which the model was developed. Therefore, it would be more appropriate to extrapolate risk factors from the Japanese population at the time of the bombings to a contemporary European or US population. In particular, the lower all-cancer and leukemia risk we found in applying the ICRP 103 risk model is likely related to the use of a broader reference population (Europe, USA, Asia vs. USA population used by all other risk models), higher excess absolute risk/excess relative risk ratio (0.5/0.5 vs. 0.3/0.7 used by all other risk models), and higher value for the dose and dose rate effectiveness factor (2 vs. 1.5 used by all other risk models) compared to the other models. Moreover, estimates by the ICRP 103 and US EPA models were based mainly on mortality data from the Life Span Study for 1950 to 1985 [12], whereas BEIR VII evaluated site-specific cancer mortality data through 1997 and cancer incidence data through 1998. ICRP 103 estimates are intended to be relevant for a world population, whereas the other estimates were specifically for the US population. The variation in estimates for site-specific cancers further highlights the general uncertainties inherent in this process.
We found all-cancer risk to be lower in males than in females according to both the BEIR VII and ICRP 103 models, whereas leukemia risk was higher in males than in females according to both the BEIR VII and ICRP 103 models and lower in males than in females according to the ICRP 103 model. Considering the quadratic relationship and 5-year latency for leukemia in all risk models, these results are most likely related to male ICU patients with higher median age and longer hospital stays and, consequently, higher cumulative effective dose from radiological procedures, causing higher risk of radiation-induced solid cancers and leukemia. The higher all-cancer risk found in female patients was likely related to the general higher radiosensitivity of female patients included in the risk models and related to the higher radiation-related risk in breast, ovary, and uterine cancer.
Slovis et al. [27] reported a mean cumulative effective dose ± standard deviation of 22.2 ± 25 mSv from CT examinations among ICU patients, whereas our findings indicate a higher cumulative effective dose from all radiological investigations (median, 38.82 mSv [IQR, 17.34 - 84.64 mSv]), likely related to the higher clinical complexity of patients included in our dataset who mainly received major surgery or transplant procedures. Consequently, we identified a radiation-induced cancer risk higher than the risk reported by Slovis et al. [27]. Yee et al. [28] indicated an increase in the median cumulative effective dose from 34.59 mSv in 2004 to 40.51 mSv in 2009. Our study confirms that diagnostic imaging with ionizing radiation plays a critical role in diagnosing and managing ICU patients, and generally in all patients with life-threatening conditions, though radiation exposure should be minimized in this patient category while preserving diagnostic quality. Currently, specific emphasis should be placed on dose-reduction methods, such as ultra-low-dose CT, and educational initiatives for healthcare workers to promote safer practices, including low-dose scanning and reconstruction techniques based on iterative algorithms or deep learning artificial intelligence. Further advances in technology, including improvements in automatic exposure control and beam-shaping bow-tie filters, could allow tailored adjustments for individual patient anatomy and clinical indications [29,30]. According to the results of our study, a sustainable ICU radiological practice needs to be developed that merges patient safety, quality care, and optimal use of radiological investigation supported by continuous multidisciplinary research and technological innovation [31].
This study has some limitations due to its retrospective nature and single-center design, which focused on a single hospital admission.
In conclusion, cancer risk values were significantly different between risk models, though inter-model agreement in the consistency of risk values was found to be good or even excellent. The ICRP 103 risk model estimated the lowest all radiation-induced cancer and leukemia risk.
Abbreviations
- AOR = Additional oncogenic risk
- BEIR VII = Biological Effects of Ionizing Radiation seventh report
- CTDIvol = Volume computed tomography index
- ICRP 103 = International Commission on Radiological Protection 103
- ICC = Intraclass correlation coefficient
- ICU = Intensive care unit
- IQR = Interquartile range
- LAR = Lifetime attributable risk
- US EPA = United States Environmental Protection Agency
References
- Mahesh, M.; Mahesh, M.; Ansari, A.J.; Ansari, A.J.; Mettler, F.A.; Mettler, F.A. Patient Exposure from Radiologic and Nuclear Medicine Procedures in the United States and Worldwide: 2009–2018. Radiology 2023, 307, e221263–e221263. [Google Scholar] [CrossRef] [PubMed]
- United Nations Scientific Committee on the Effects of Atomic Radiation. Sources, effects, and risks of ionizing radiation. Evaluation of medical exposure to ionizing radiation. Vol 1, Scientific Annex A. 2020/2021 Report to the General Assembly with annexes. New York, NY: United Nations, 2022.
- Toy, D.; Siegel, M.D.; Rubinowitz, A.N. Imaging in the Intensive Care Unit. Semin. Respir. Crit. Care Med. 2022, 43, 899–923. [Google Scholar] [CrossRef] [PubMed]
- Xie, Z.; Liao, X.; Kang, Y.; Zhang, J.; Jia, L. Radiation Exposure to Staff in Intensive Care Unit with Portable CT Scanner. BioMed Res. Int. 2016, 2016, 1–4. [Google Scholar] [CrossRef] [PubMed]
- Krishnan, S.; Moghekar, A.; Duggal, A.; Yella, J.; Narechania, S.; Ramachandran, V.; Mehta, A.; Adhi, F.; Vijayan, A.K.C.; Han, X.; et al. Radiation Exposure in the Medical ICU. Chest 2018, 153, 1160–1168. [Google Scholar] [CrossRef]
- Shigematsu, I. Greetings: 50 years of Atomic Bomb Casualty Commission–Radiation Effects Research Foundation studies. Proc. Natl. Acad. Sci. 1998, 95, 5424–5425. [Google Scholar] [CrossRef]
- Kodama, K.; Mabuchi, K.; Shigematsu, I. A Long-Term Cohort Study of the Atomic-Bomb Survivors. J. Epidemiology 1996, 6, 95–105. [Google Scholar] [CrossRef]
- Ozasa, K. Epidemiological research on radiation-induced cancer in atomic bomb survivors. J. Radiat. Res. 2016, 57, i112–i117. [Google Scholar] [CrossRef]
- Kodama, K.; Ozasa, K.; Okubo, T. Radiation and cancer risk in atomic-bomb survivors. J. Radiol. Prot. 2012, 32, N51–N54. [Google Scholar] [CrossRef]
- Ozasa, K.; Grant, E.J.; Kodama, K. Japanese Legacy Cohorts: The Life Span Study Atomic Bomb Survivor Cohort and Survivors’ Offspring. J. Epidemiology 2018, 28, 162–169. [Google Scholar] [CrossRef]
- Calabrese, E.J. The linear No-Threshold (LNT) dose response model: A comprehensive assessment of its historical and scientific foundations. Chem. Interactions 2019, 301, 6–25. [Google Scholar] [CrossRef]
- National Research Council of the National Academies. Health Risks from Exposure to Low Levels of Ionizing Radiation: BEIR VII Phase 2. Washington, DC: The National Academies Press; 2006: 245.
- de Gonzalez, A.B.; Apostoaei, A.I.; Veiga, L.H.S.; Rajaraman, P.; A Thomas, B.; Hoffman, F.O.; Gilbert, E.; Land, C. RadRAT: a radiation risk assessment tool for lifetime cancer risk projection. J. Radiol. Prot. 2012, 32, 205–222. [Google Scholar] [CrossRef] [PubMed]
- United Nations Scientific Committee on the Effects of Atomic Radiation. Sources, effects, and risks of ionizing radiation. Evaluation of medical exposure to ionizing radiation. Vol 1, Scientific Annex A. 2020/2021 Report to the General Assembly with annexes. New York, NY: United Nations, 2022.
- ICRP 2007 The 2007 recommendations of the International Commission on Radiological Protection. ICRP Publication 103 (Oxford: Elsevier).
- U.S. Environmental Protection Agency. EPA radiogenic cancer risk models and projections for the U.S. population. 2011.
- World Health Organization. Health risk assessment from the nuclear accident after the 2011 great east Japan earthquake and tsunami based on a preliminary dose estimation. 2013.
- Krishnan, S.; Moghekar, A.; Duggal, A.; Yella, J.; Narechania, S.; Ramachandran, V.; Mehta, A.; Adhi, F.; Vijayan, A.K.C.; Han, X.; et al. Radiation Exposure in the Medical ICU. Chest 2018, 153, 1160–1168. [Google Scholar] [CrossRef]
- ICRP 2010 Conversion coefficients for radiological protection quantities for external radiation exposures. ICRP Publication 116 (Oxford: International Commission of Radiological Protection).
- Petoussi-Henss, N.; E Bolch, W.; Eckerman, K.F.; Endo, A.; Hertel, N.; Hunt, J.; Menzel, H.G.; Pelliccioni, M.; Schlattl, H.; Zankl, M. ICRP Publication 116—the first ICRP/ICRU application of the male and female adult reference computational phantoms. Phys. Med. Biol. 2014, 59, 5209–5224. [Google Scholar] [CrossRef]
- Deak, P.D.; Smal, Y.; Kalender, W.A. Multisection CT Protocols: Sex- and Age-specific Conversion Factors Used to Determine Effective Dose from Dose-Length Product. Radiology 2010, 257, 158–166. [Google Scholar] [CrossRef] [PubMed]
- Deak, P.D.; Smal, Y.; Kalender, W.A. Multisection CT Protocols: Sex- and Age-specific Conversion Factors Used to Determine Effective Dose from Dose-Length Product. Radiology 2010, 257, 158–166. [Google Scholar] [CrossRef]
- Boone, J.M.; McNitt-Gray, M.F.; Hernandez, A.M. Monte Carlo Basics for Radiation Dose Assessment in Diagnostic Radiology. J. Am. Coll. Radiol. 2017, 14, 793–794. [Google Scholar] [CrossRef] [PubMed]
- Rääf, C.; Markovic, N.; Tondel, M.; Wålinder, R.; Isaksson, M. Introduction of a method to calculate cumulative age- and gender-specific lifetime attributable risk (LAR) of cancer in populations after a large-scale nuclear power plant accident. PLOS ONE 2020, 15, e0228549. [Google Scholar] [CrossRef]
- Brenner, D.J.; Doll, R.; Goodhead, D.T.; Hall, E.J.; Land, C.E.; Little, J.B.; Lubin, J.H.; Preston, D.L.; Preston, R.J.; Puskin, J.S.; et al. Cancer risks attributable to low doses of ionizing radiation: Assessing what we really know. Proc. Natl. Acad. Sci. USA 2003, 100, 13761–13766. [Google Scholar] [CrossRef]
- Samei, E.; Järvinen, H.; Kortesniemi, M.; Simantirakis, G.; Goh, C.; Wallace, A.; Vano, E.; Bejan, A.; Rehani, M.; Vassileva, J. Medical imaging dose optimisation from ground up: expert opinion of an international summit. J. Radiol. Prot. 2018, 38, 967–989. [Google Scholar] [CrossRef]
- Slovis, B.H.; Shah, K.H.; Yeh, D.D.; Seethala, R.; Kaafarani, H.M.A.; Eikermann, M.; Raja, A.S.; Lee, J. Significant but reasonable radiation exposure from computed tomography-related medical imaging in the ICU. Emerg. Radiol. 2016, 23, 141–146. [Google Scholar] [CrossRef]
- Yee, M.V.; Barron, R.A.; Knobloch, T.A.; Pandey, U.; Twyford, C.; Freebairn, R.C. Radiation exposure of ventilated trauma patients in intensive care. Eur. J. Emerg. Med. 2012, 19, 231–234. [Google Scholar] [CrossRef] [PubMed]
- Douglas, P.S.; Cerqueira, M.D.; Cummings, J.E.; Gerber, T.C.; Mukherjee, D.; Taylor, A.J.; Bacher, K.; Bogaert, E.; Lapere, R.; et al.; WRITING/STEERING COMMITTEE MEMBERS Developing an Action Plan for Patient Radiation Safety in Adult Cardiovascular Medicine. Circ. Cardiovasc. Imaging 2012, 5, 400–414. [Google Scholar] [CrossRef] [PubMed]
- Söderberg, M.; Gunnarsson, M. Automatic exposure control in computed tomography – an evaluation of systems from different manufacturers. Acta Radiol. 2010, 51, 625–634. [Google Scholar] [CrossRef] [PubMed]
- Najjar, R. Radiology's Ionising Radiation Paradox: Weighing the Indispensable Against the Detrimental in Medical Imaging. Cureus 2023, 15, e41623. [Google Scholar] [CrossRef]
Figure 1.
Patient flow chart.
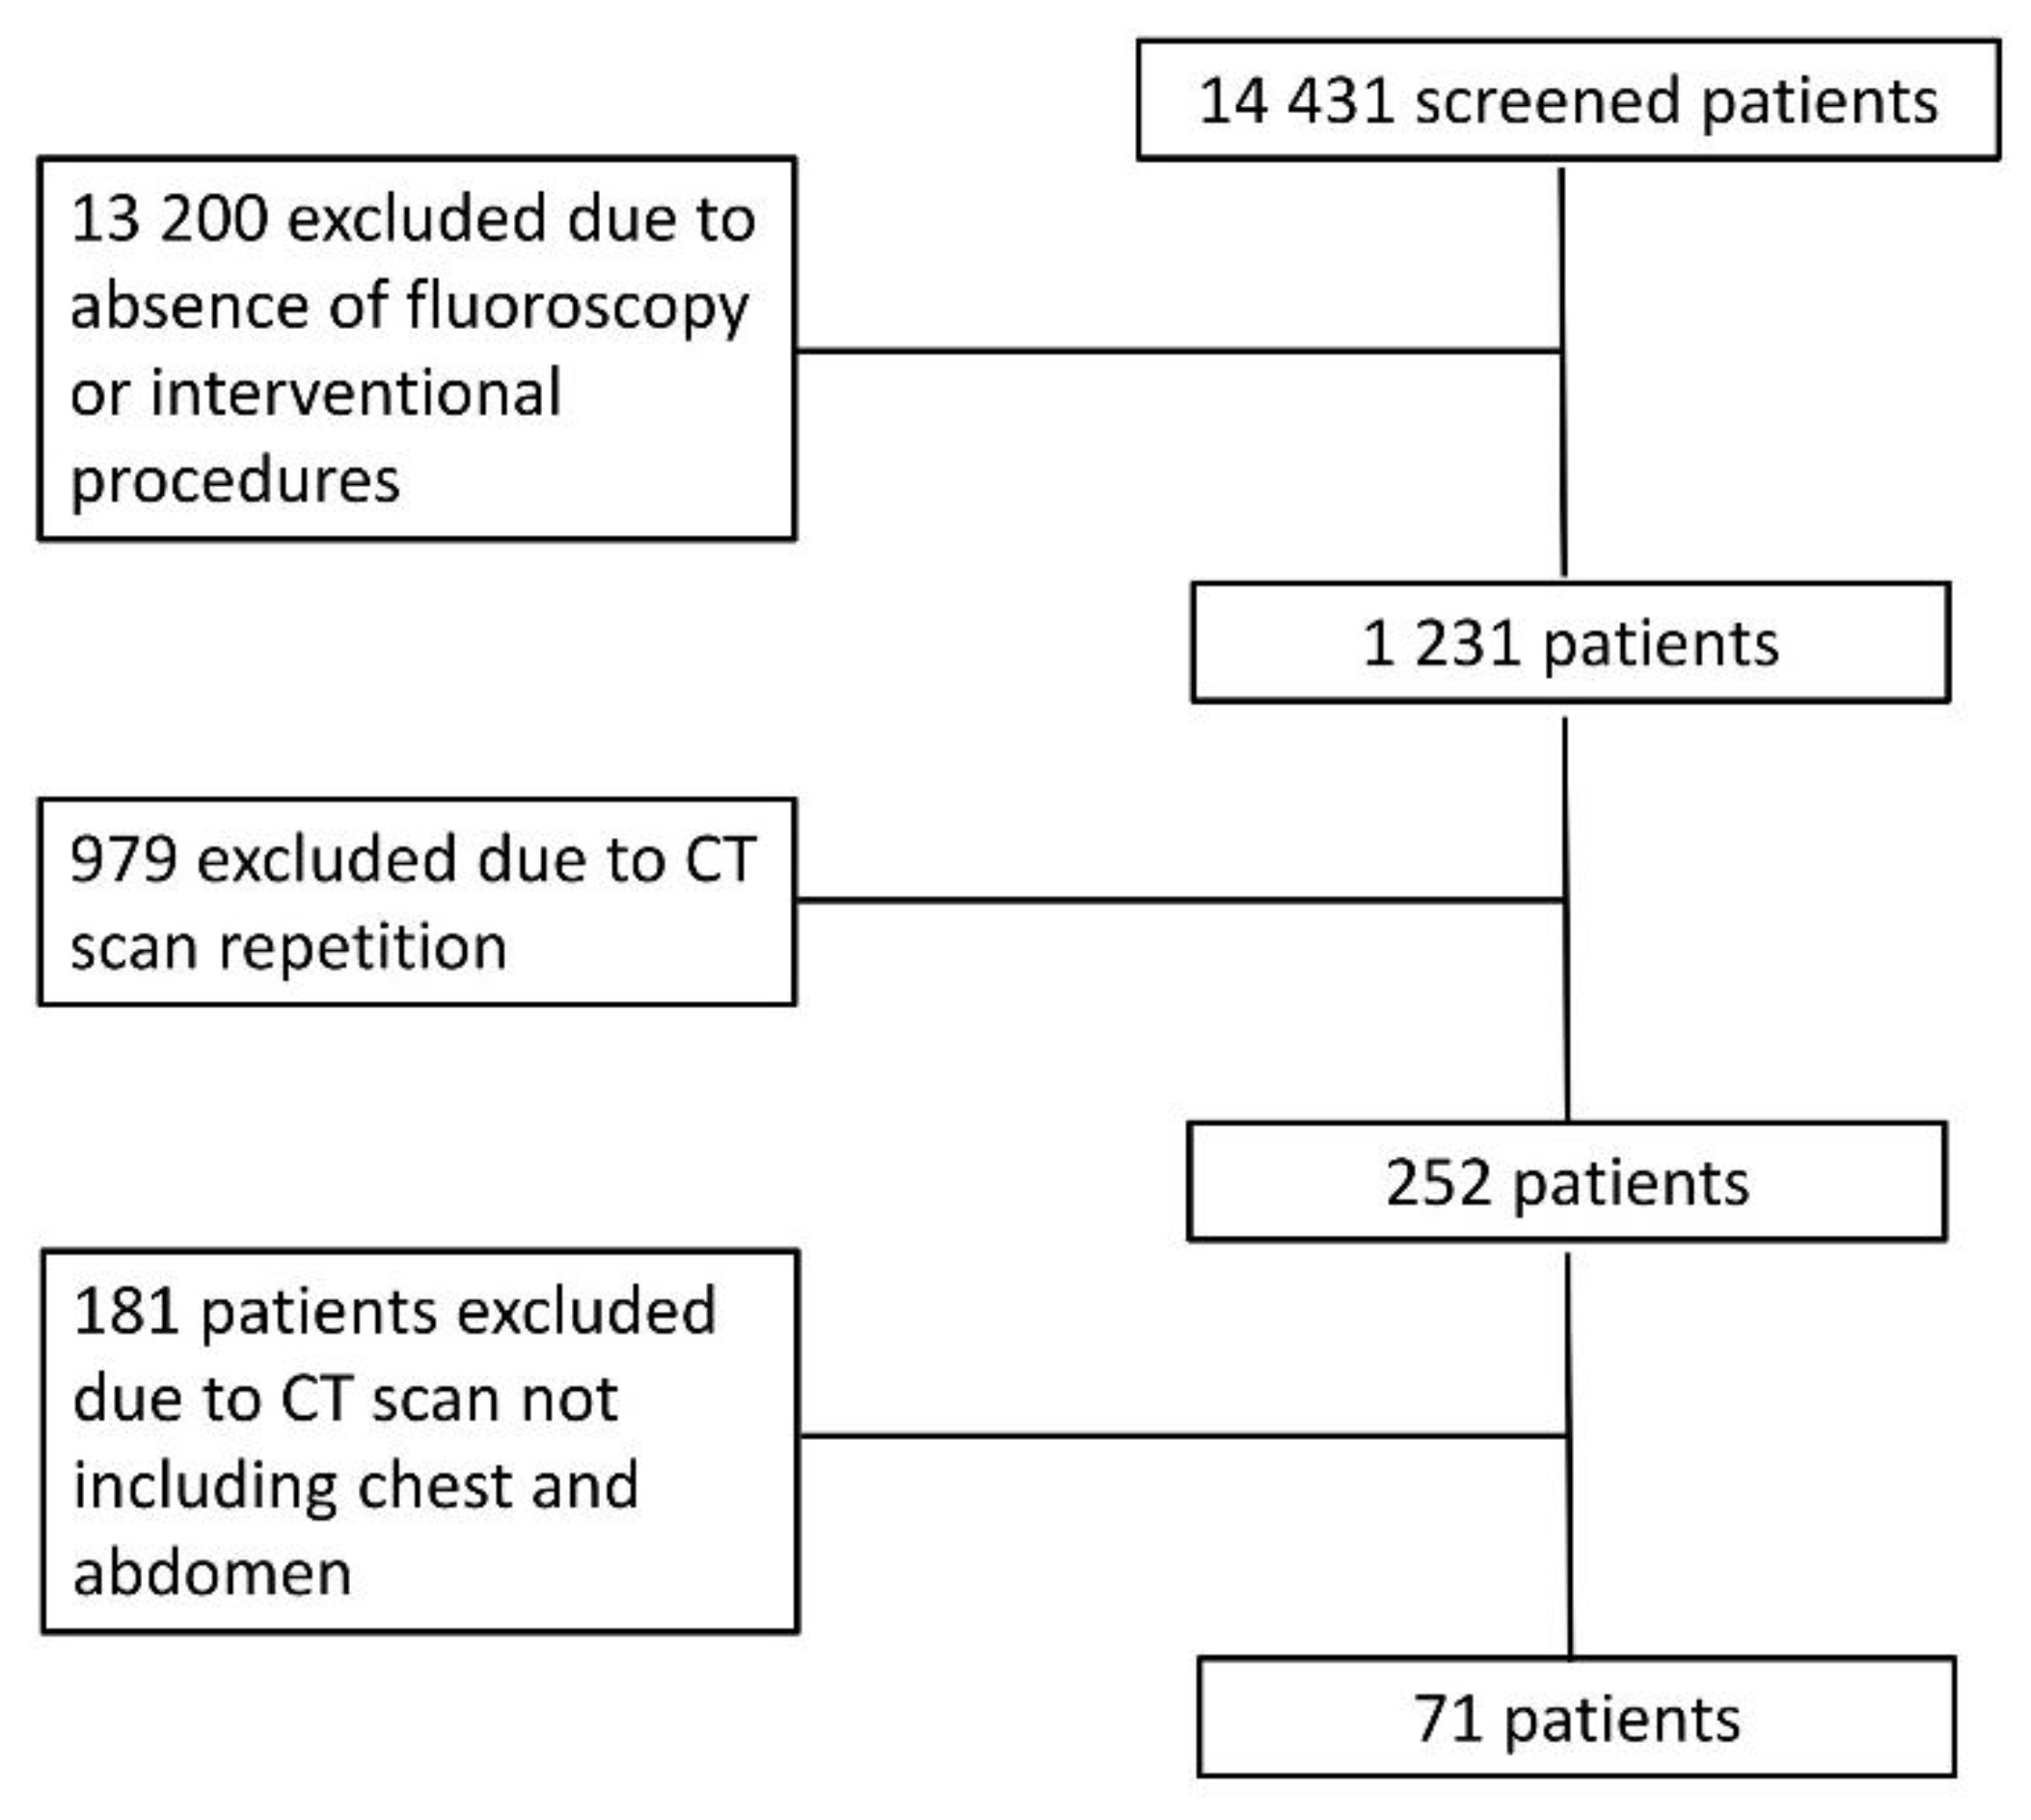
Figure 2.
Box plots showing the all-cancer risk (a) and leukemia risk (b) distribution according to oncogenic risk model. The box includes the first and third quartile, and the horizontal line corresponds to the median value. Vertical lines extending from the box indicate variability outside the upper and lower quartiles with whiskers indicating the maximum and minimum value. Outliers are plotted as individual points beyond the whiskers.
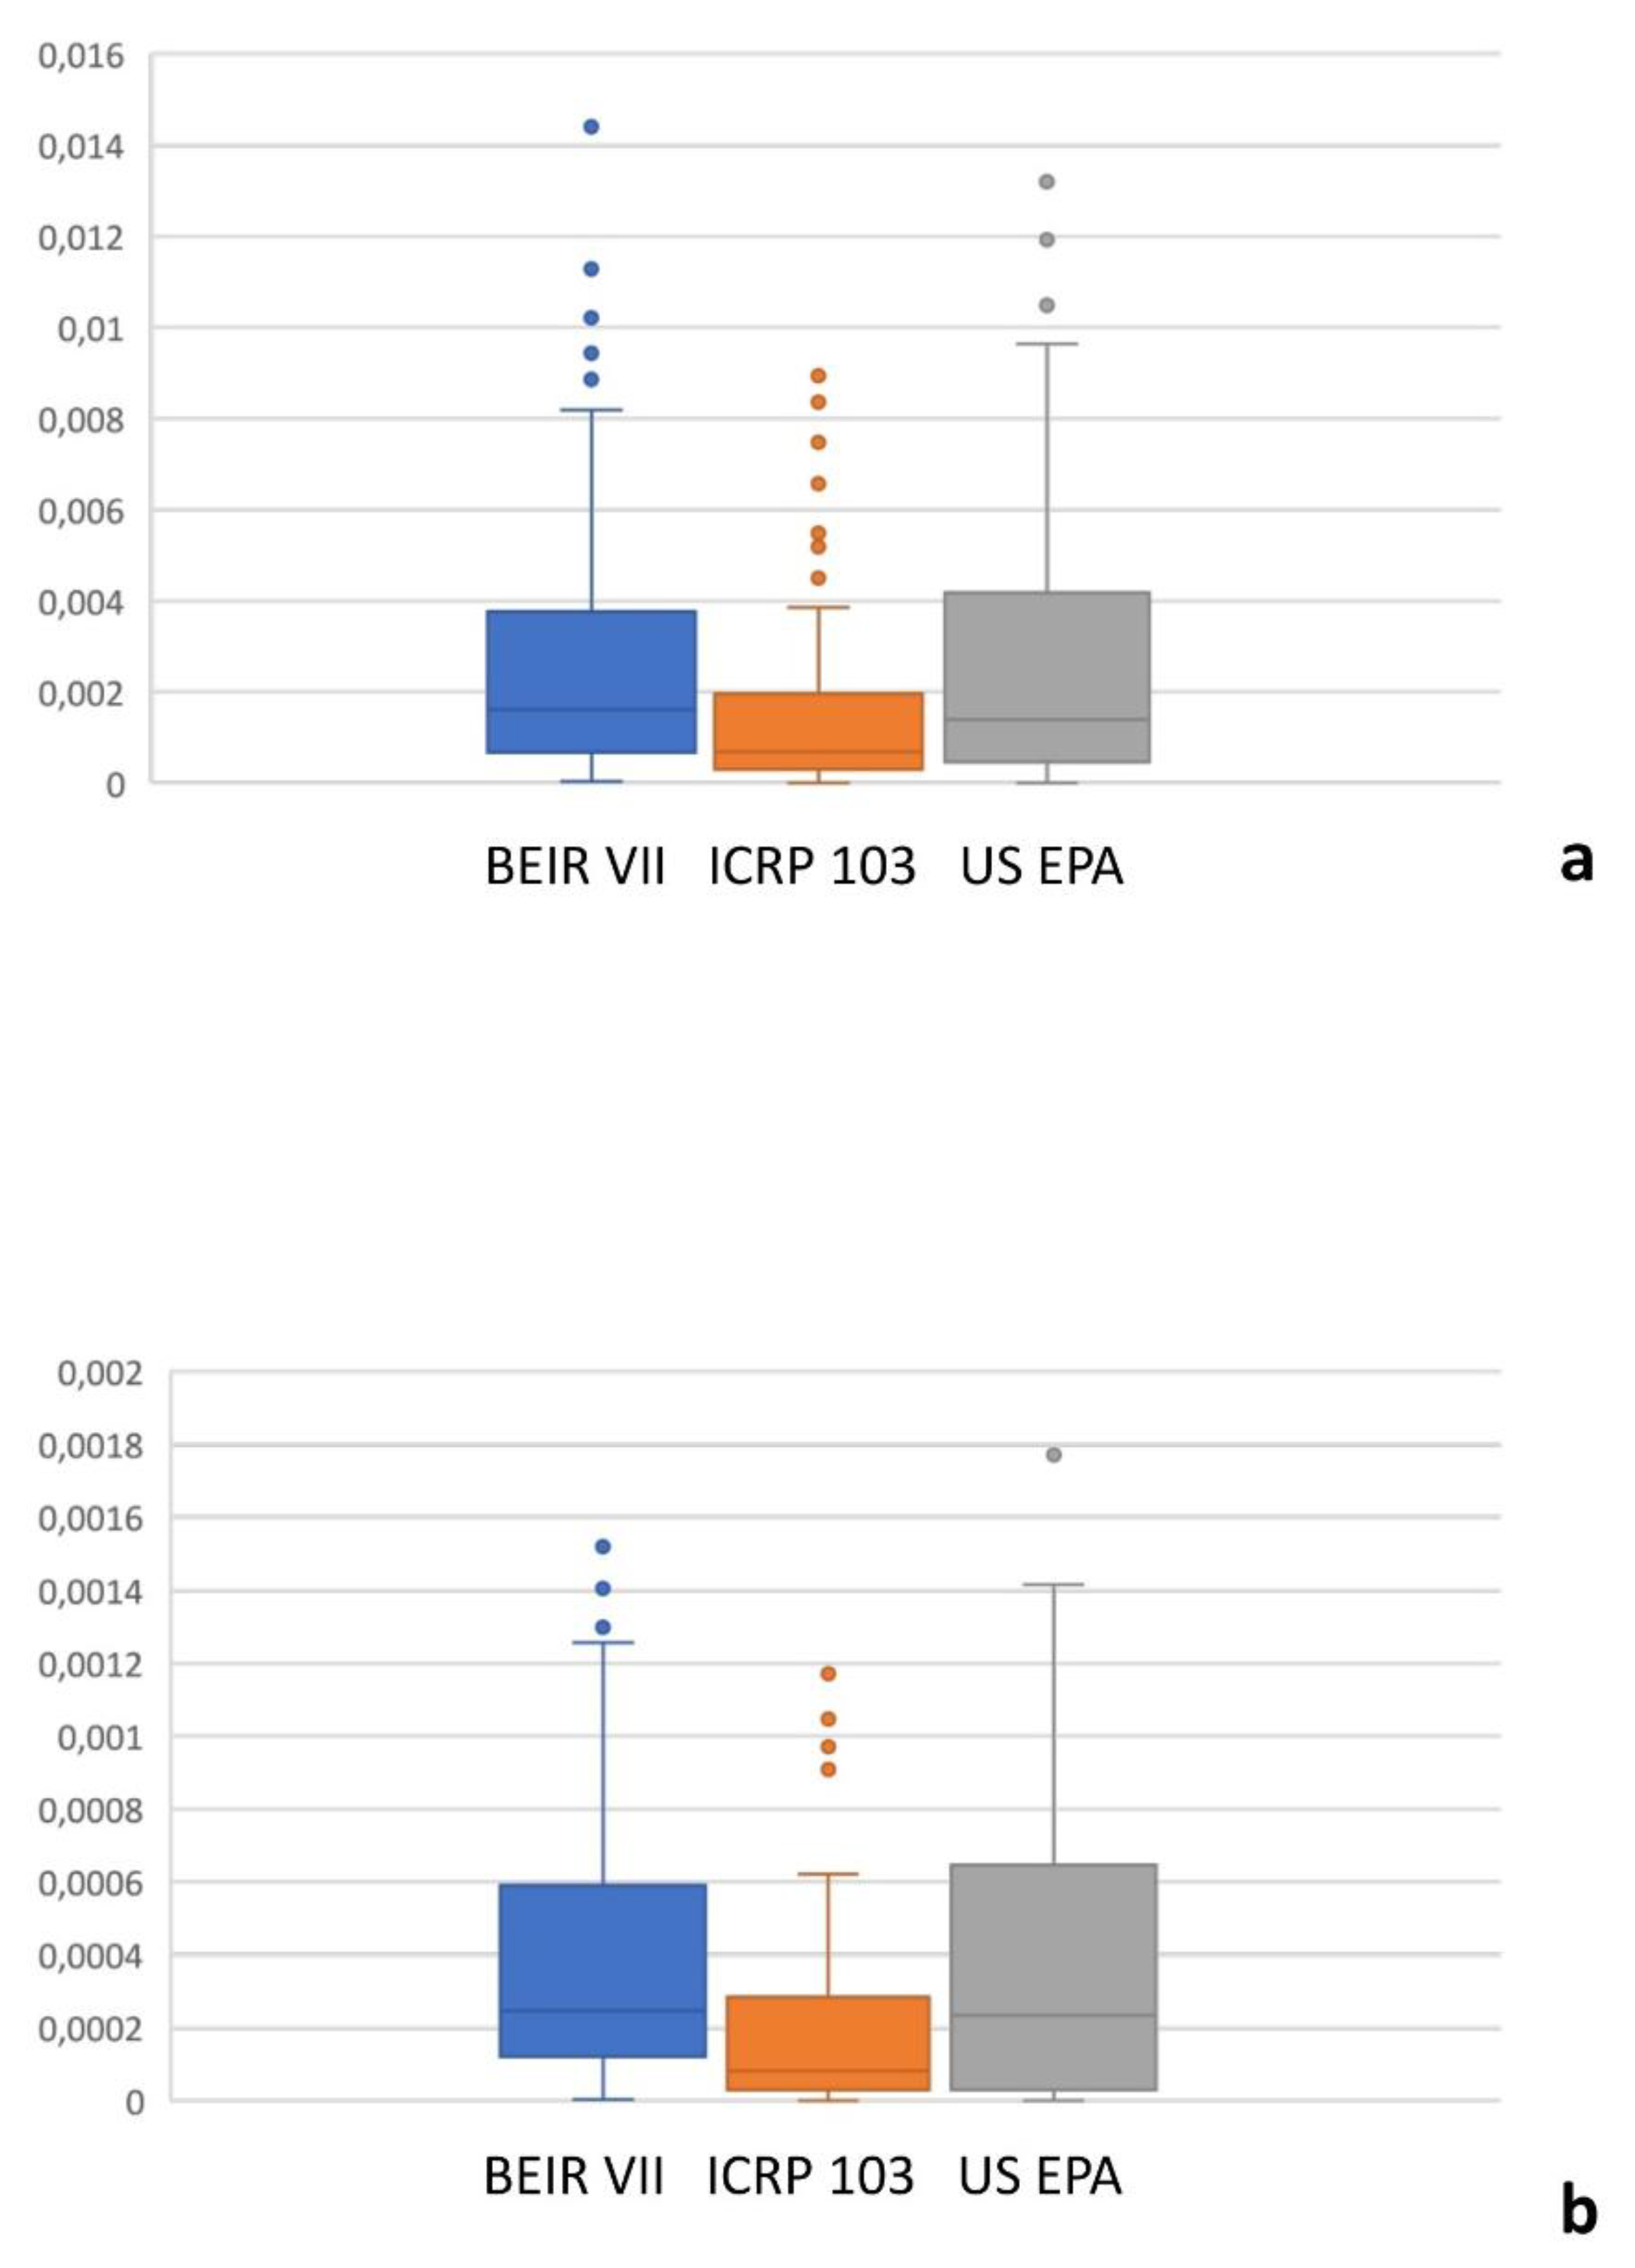
Figure 3.
Correlation analysis between different risk models. (a) All-cancer risk in the BEIR VII vs. ICRP 103, (c) ICRP 103 vs. US EPA, and (e) BEIR VII vs. US EPA risk models. (b) Leukemia risk in the BEIR VII vs. ICRP 103, (d) ICRP 103 vs. US EPA, and (f) BEIR VII vs. US EPA risk models. A significant correlation was observed between all risk models (r = 0.71 – 0.97, P = < .0001).
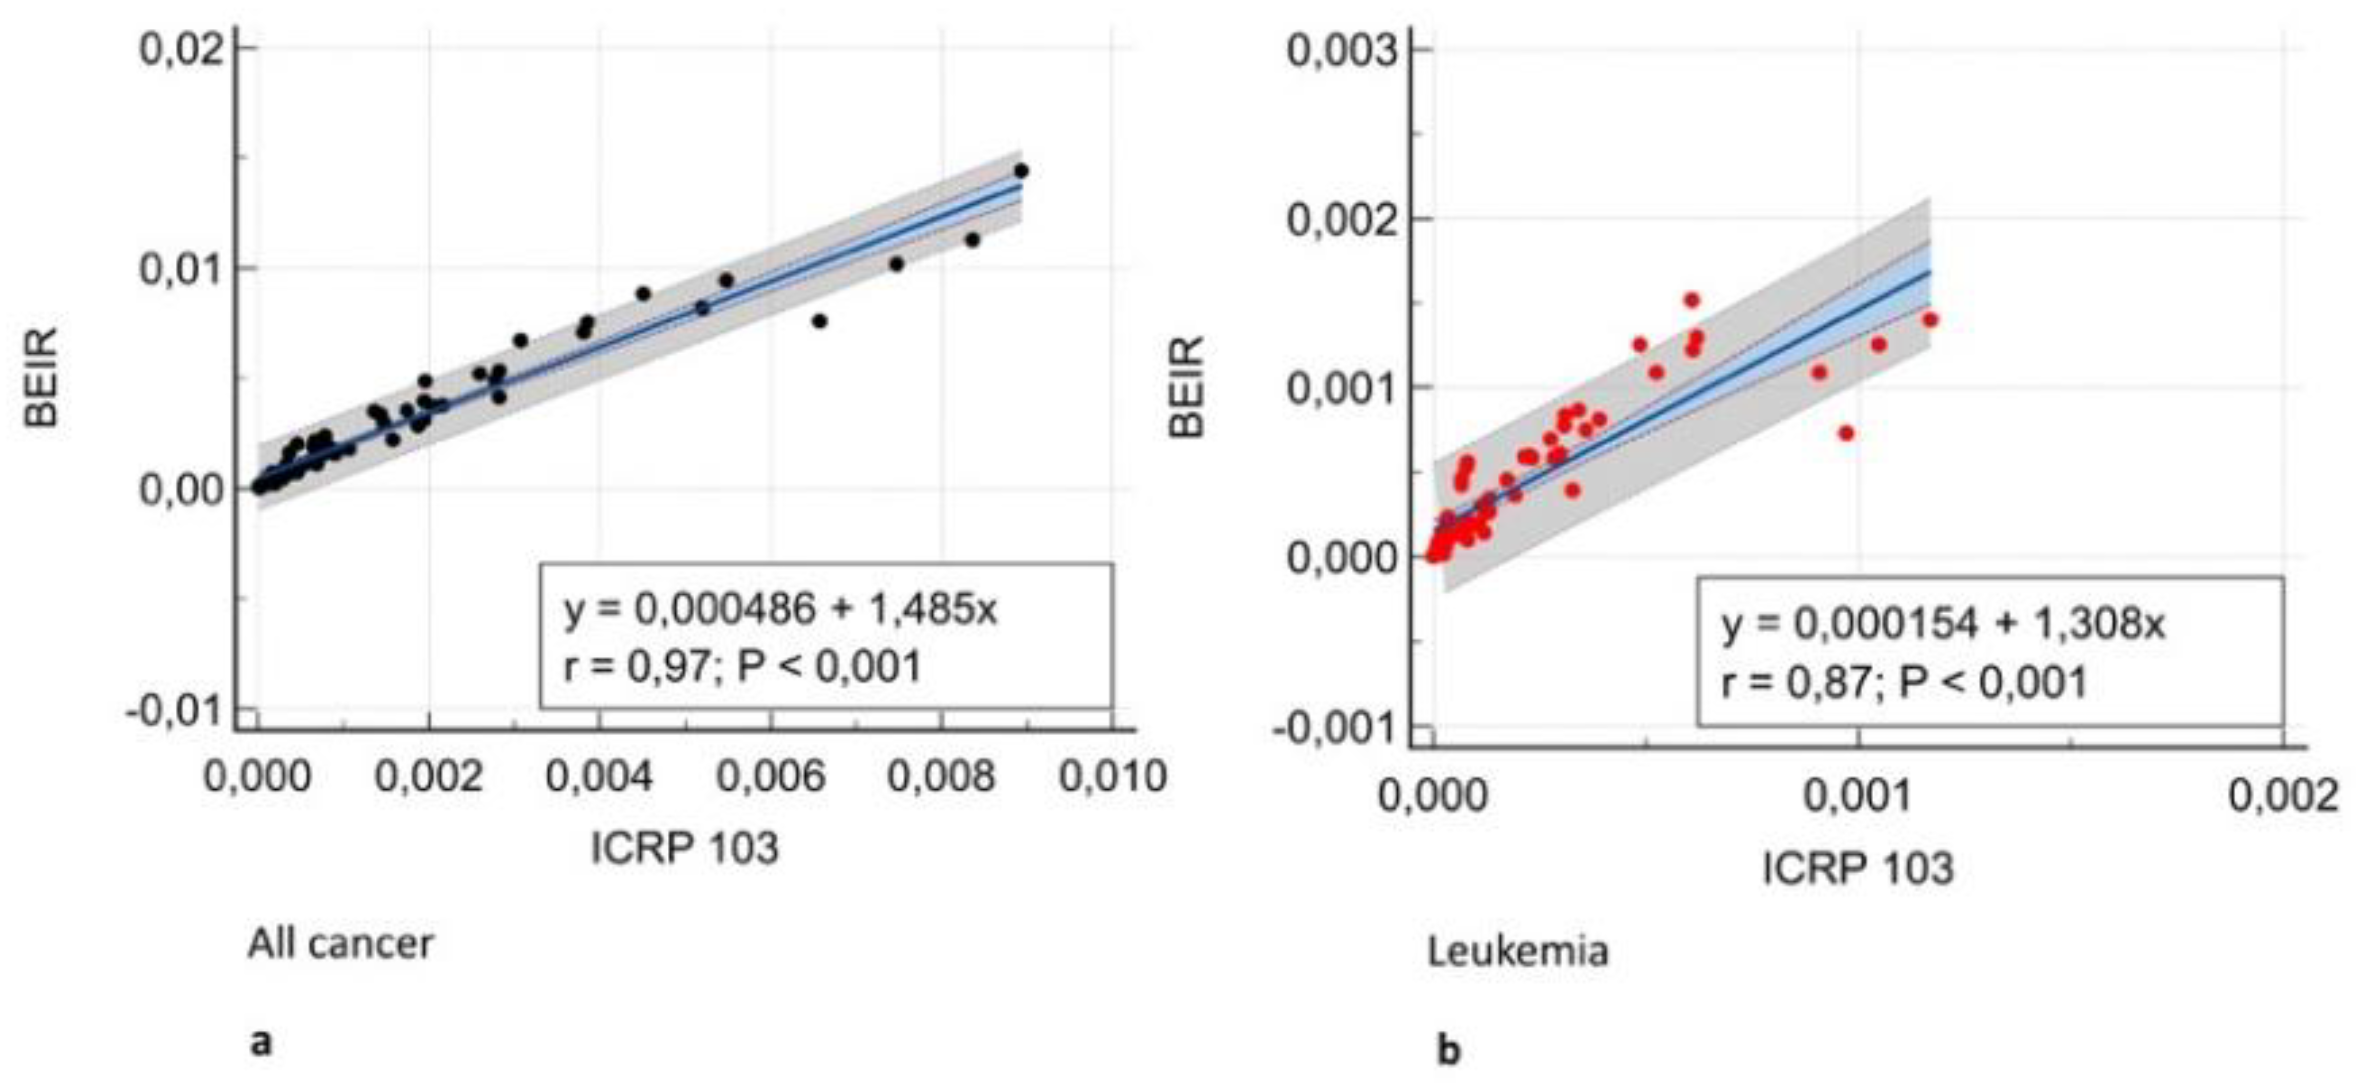
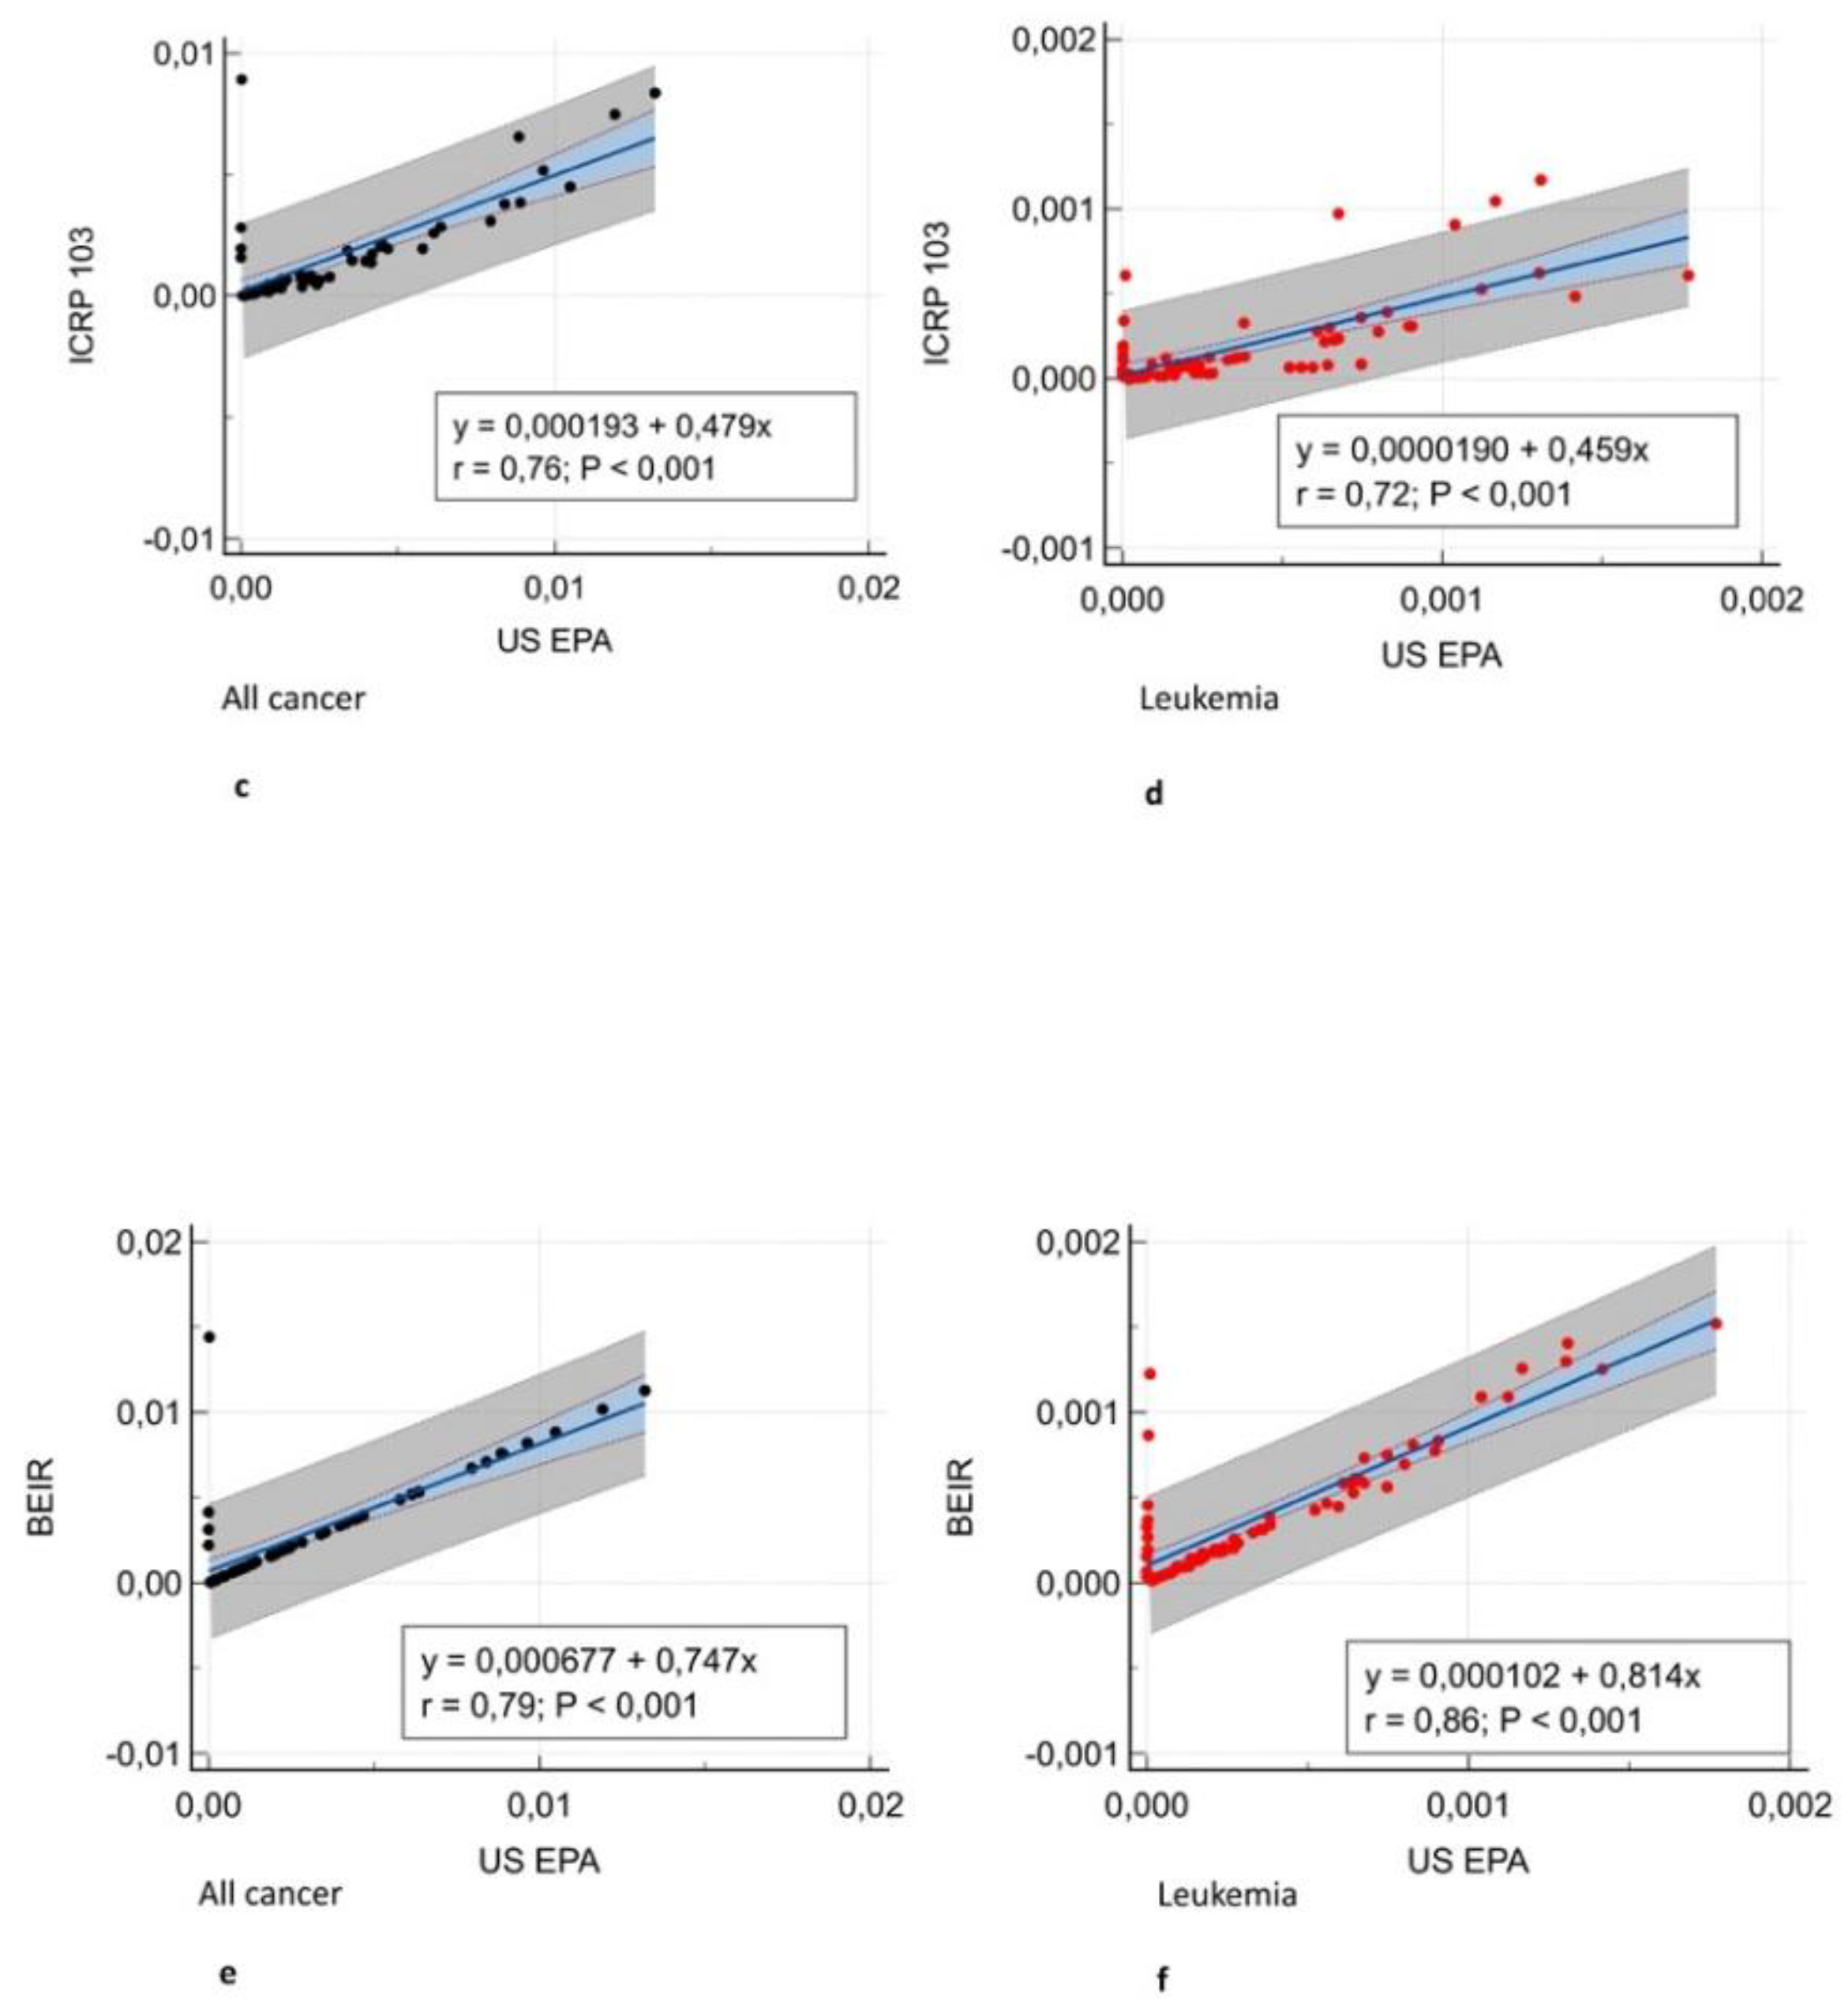
Figure 4.
Agreement assessment according to the Bland-Altman analysis between different risk models. (a) All-cancer risk in the BEIR VII vs. ICRP 103, (c) ICRP 103 vs. US EPA, and (e) BEIR VII vs. US EPA risk models. (b) Leukemia risk in the BEIR VII vs. ICRP 103, (d) ICRP 103 vs. US EPA, and (f) BEIR VII vs. US EPA risk models. The difference in the estimated risks is on the y-axis and the mean of the two model estimated risks is on the x-axis. Comparisons revealed a very low bias (mean difference, -0.001 – 0.004) in both all-cancer (e) and leukemia risk (f) agreement.
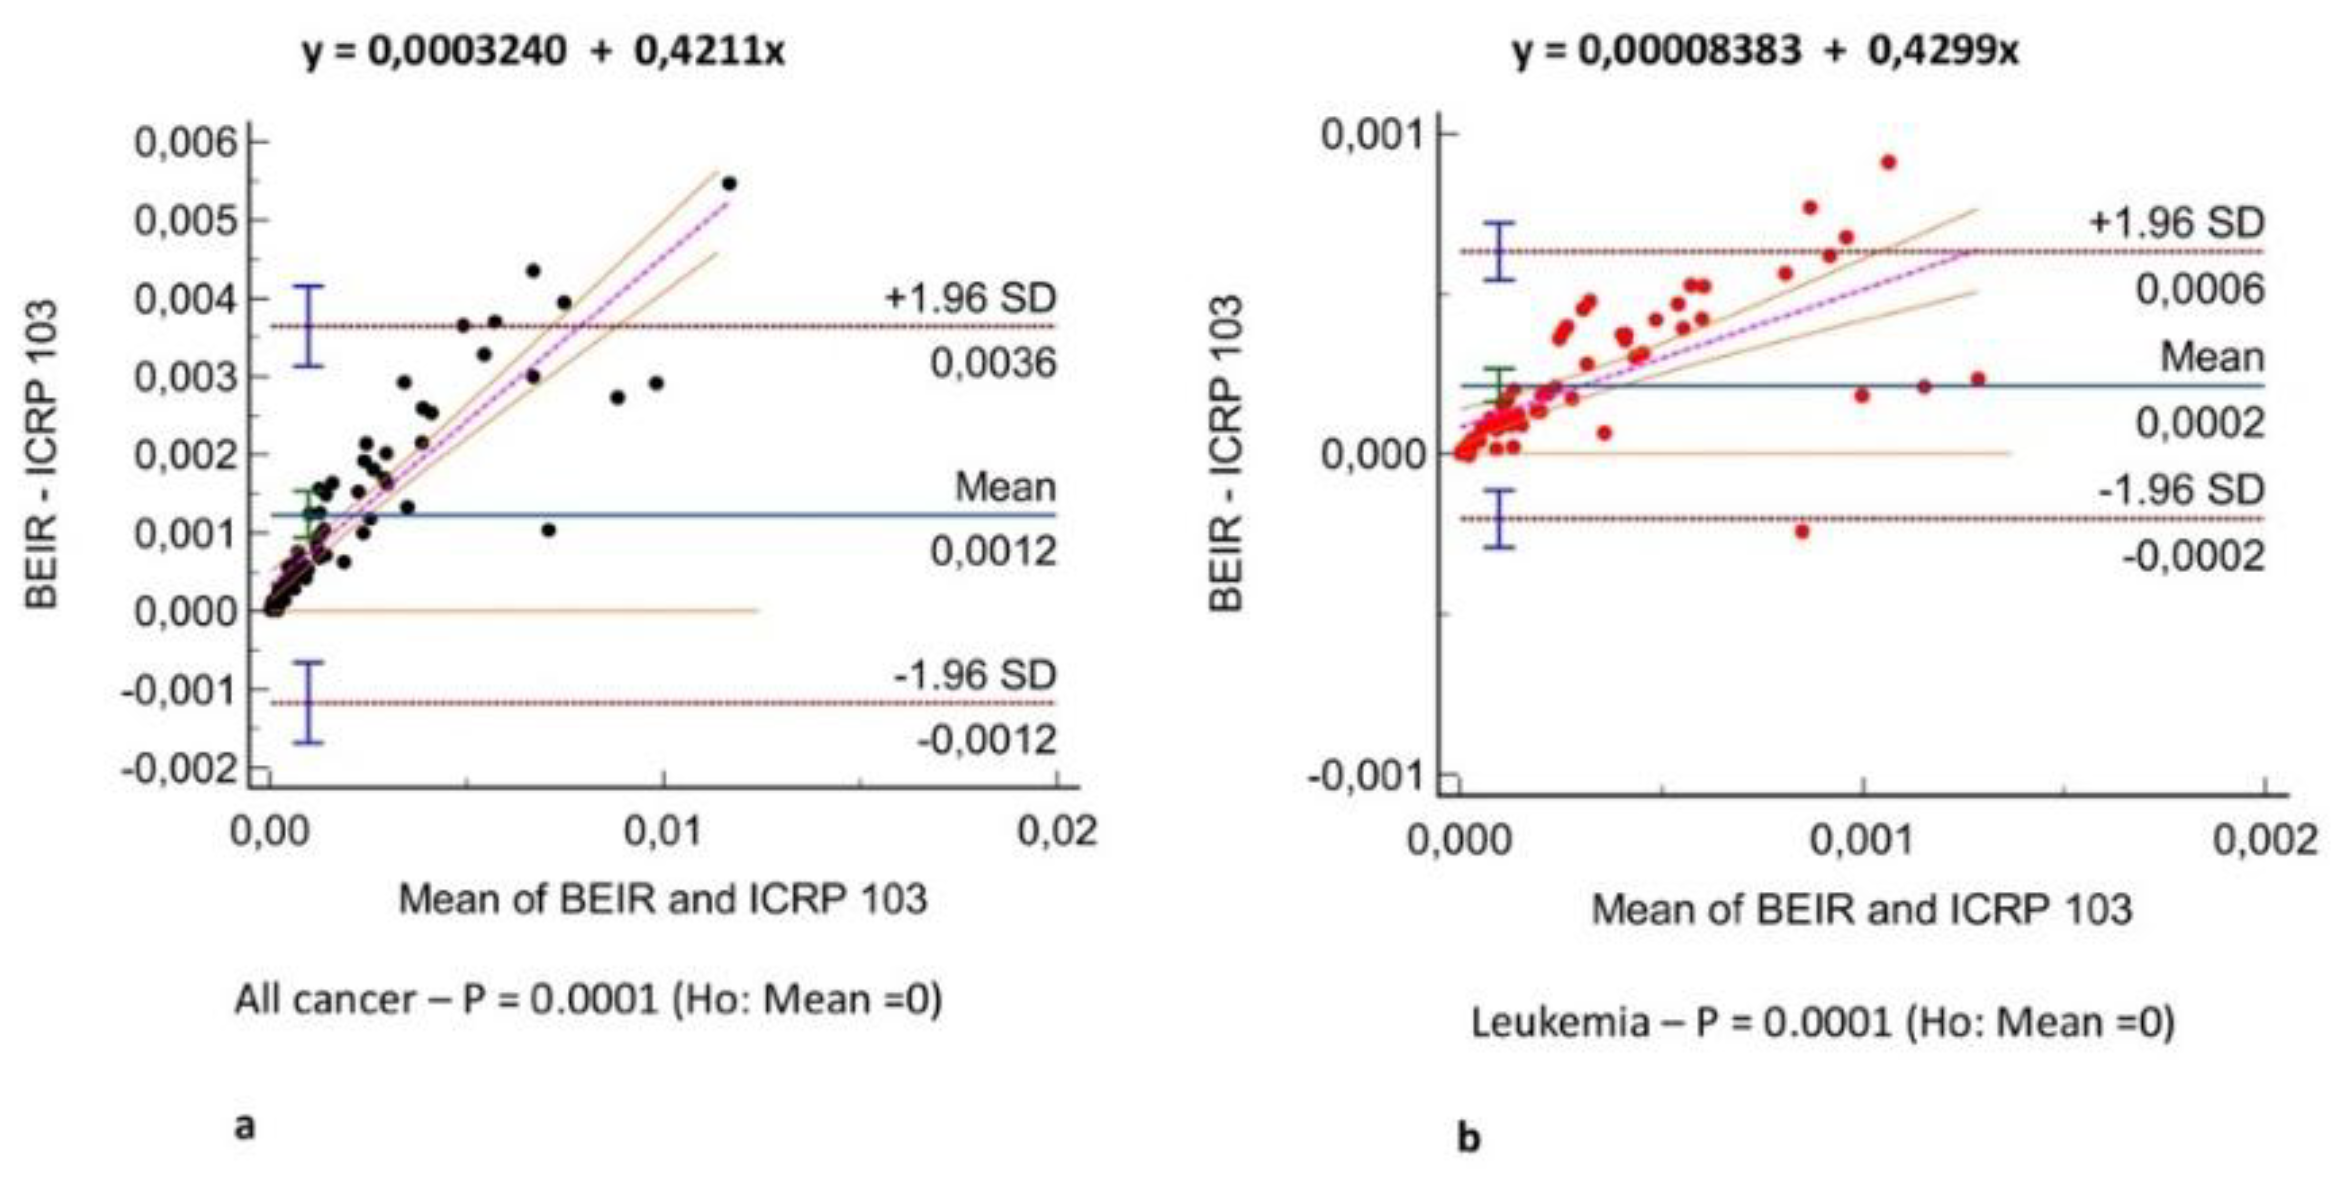
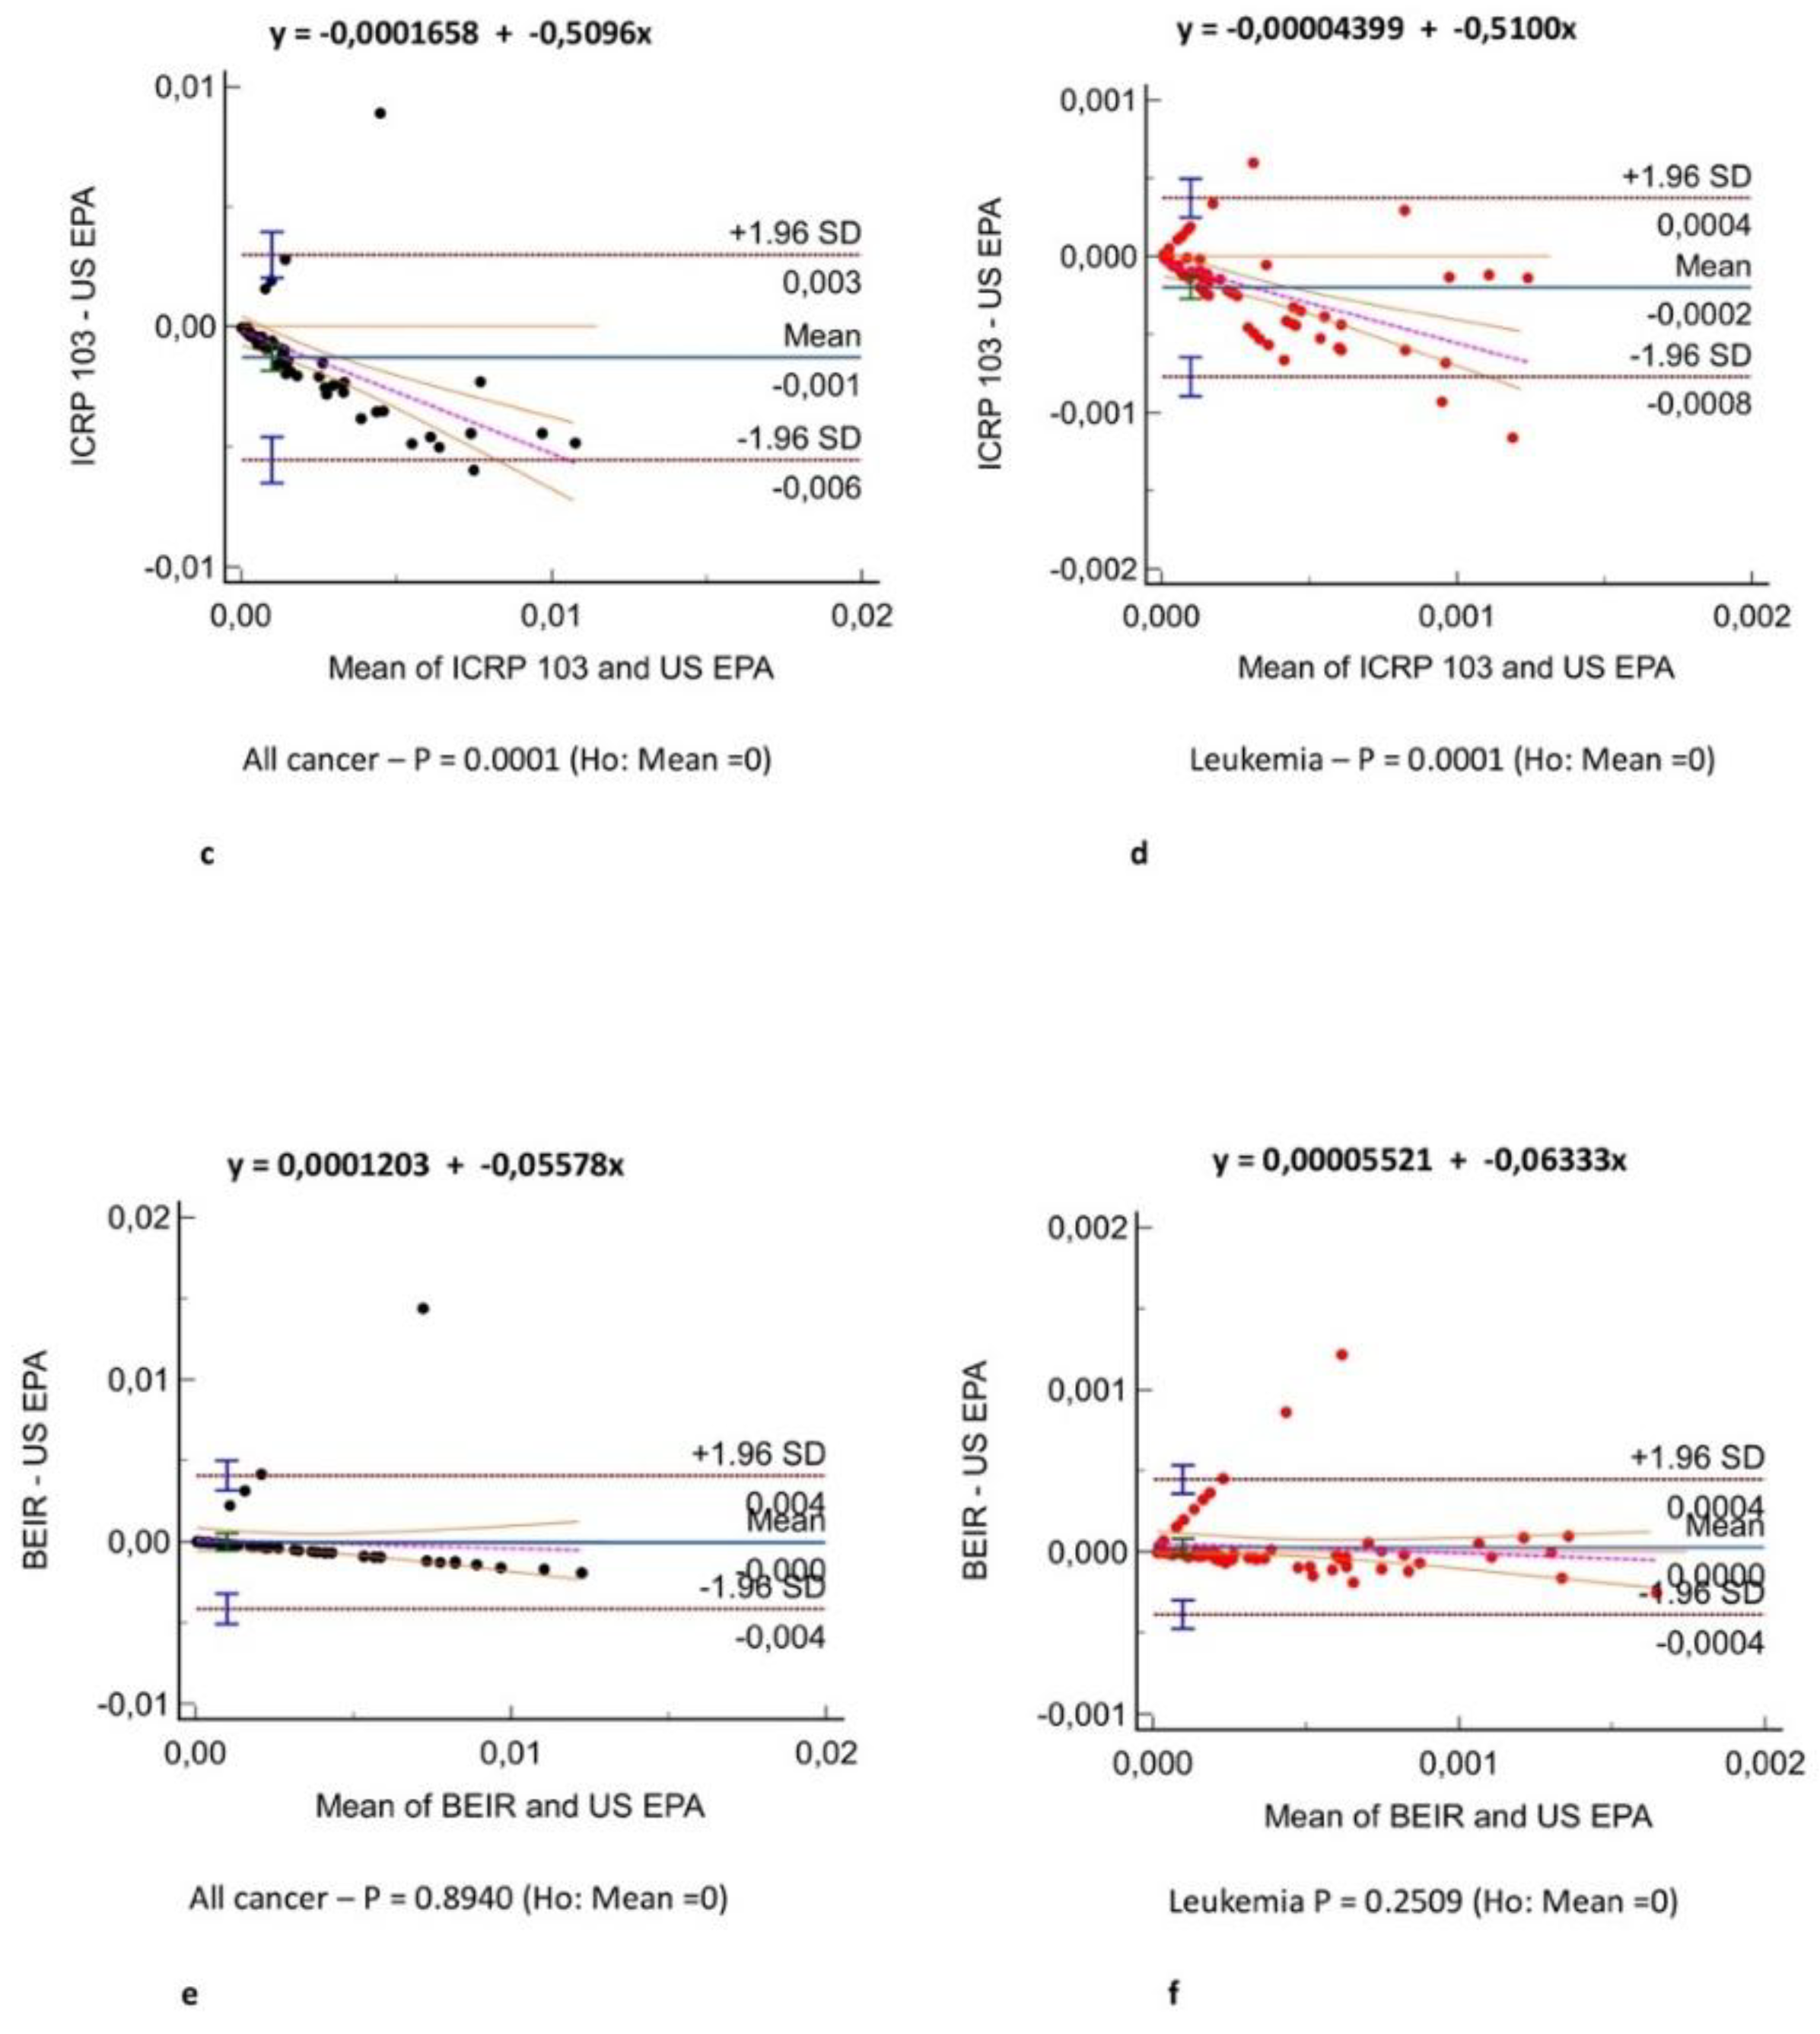

Table 1.
Differences between the different models for estimating lifetime risk of cancer.
| BEIR VII | ICRP 103 | US EPA | |
| Epidemiological data | Solid cancer: Japanese atomic bomb survivor morbidity data from the period 1958-1998 | ||
|
Leukemia: Japanese atomic bomb survivor mortality from the period 1950-2000 | |||
| Reference population | USA | Europe, USA, Asia | USA |
| Excess absolute risk /excess relative risk |
0.3/0.7 |
0.5/0.5 | 0.3/0.7 |
| Dose-response model | Linear no-threshold | ||
| Minimal tumoral latency period | 5 years for solid tumors 2 years for leukemia |
||
| Dose and dose rate effectiveness factor | 1.5 | 2 | 1.5 |
| Lifetime attributable risk | Weighted geometric mean | Weighted arithmetic mean | Weighted arithmetic mean |
Note.–BEIR VII = Biological Effects of Ionizing Radiation VII report. ICRP 103 = International Commission on Radiological Protection Publication 103. US EPA = United States Environmental Protection Agency. The dose and dose rate effectiveness factor was proposed to overcome discrepancies between experimental and epidemiological data from high-dose and dose-rate exposure as derived from epidemiological data from the atomic bomb explosion and allows the estimation of risk from low-dose and dose-rate exposures. The dose and dose rate effectiveness factor implies that, for low doses, the probability of DNA damage being carcinogenic is reduced by a factor of 1.5 or 2.
Table 2.
Patient characteristics.
| Characteristics | |
| Age (years) | 66 (71 – 56) |
| Male | 66 (71 – 55) |
| Female | 61 (73 – 58) |
| Sex | |
| Male | 58 |
| Female | 13 |
| Hospitalization (days) | 31 (70 – 15) |
| Male | 30 (70 – 21) |
| Female | 20 (26 – 15) |
| Reason for hospitalization | |
| Major thoracic surgery | 19 |
| Major abdominal surgery | 27 |
| Solid organ transplant | 20 |
| Major trauma | 5 |
Note.–Values are given as median (interquartile range) or no. of patients.
Table 3.
Additional oncogenic risk × 100 000 between different risk models for different cancer categories.
Table 3.
Additional oncogenic risk × 100 000 between different risk models for different cancer categories.
| Cancer Categories | BEIR VII | ICRP 103 | US EPA | P # | ICC (95% CI) |
| Bladder | 20.75 (8.78 – 46.89) | 7.22 (2.96 – 20.93) | 10.55 (4.07 – 28.23) | 0.0001 | 0.87 (0.81 – 0.91) |
| Bone | * | * | 0.29 (0.001 – 1.66) | ||
| Breast | 10.55 (3.95 – 27.44) | 17.37 (1.63 – 23.62) | * | 0.003 | 0.9 (0.67 – 0.97) |
| Colon | 25.77 (12.23 – 66.67) | 7.14 (3.09 -17.74) | 25.69 (12.2 – 67.85) | 0.0001 | 0.85 (0.79 – 0.90) |
| Kidney | * | * | 20.45 (9.36 – 50.41) | ||
| Liver | 3.6 (1.37 – 9.24) | 2.79 (1.24 – 7.48) | 6.18 (3.19 – 17.04) | 0.0001 | 0.88 (0.83 – 0.92) |
| Lung | 30.81 (13.43 - 74) | 23.35 (9.75 – 60.48) | 31.06 (13.5 – 78.79) | 0.0001 | 0.98 (0.97 – 0.98) |
| Esophagus | * | 4 (1.71 – 8.88) | * | ||
| Ovary | 6.93 (2.29 – 13.32) | 3.99 (0.69 – 6.1) | * | 0.001 | 0.7 (0.17 – 0.91) |
| Prostate | 4.37 (0.65 – 15.26) | * | 9.46 (1.39 – 34.68) | 0.001 | 0.71 (0.58 – 0.81) |
| Skin | * | * | 29.43 (11.43 – 72.64) | ||
| Stomach | 5.26 (2.13 – 15.27) | 4.14 (1.75 – 13.63) | 11.46 (4.93 – 27.16) | 0.001 | 0.87 (0.81 – 0.91) |
| Thyroid | 0.10 (0.02 – 0.5) | 0.46 (0.35 – 2.03) | 4.57 (1.52 – 8.71) | 0.001 | 0.38 (0.23 – 0.53) |
| Uterus | 3.50 (1.14 – 6.78) | * | * | ||
| Other solid tumors | 28.93 (11.16 – 71.35) | 10.34 (3.09 – 30.84) | 6.43 (2.16 – 12.17) | 0.001 | 0.9 (0.86 – 0.93) |
| Leukemia | 24.66 (12.9 – 58.8) | 8.22 (3.02 – 27.93) | 23.34 (3.47 – 64.37) | 0.001 | 0.83 (0.76 – 0.88) |
| All solid tumors | 132.80 (53.76 – 316.2) | * | 86.78 (16.66 – 296.53) | 0.001 | 0.97 (0.88 – 0.99) |
| All cancers | 162.08 (70.6 – 371.4) | 69.05 (30.35 – 195.37) | 139.68 (50.51 – 416.16) | 0.001 | 0.91 (0.87 – 0.94) |
Note.–Additional oncogenic risk (AOR) x 100 000 between the BEIR VII, ICRP 103, and U.S. EPA risk models. Values are median (interquartile range, IQR). * = Not estimated by the model. # Friedman test repeated-measures analysis of variance. ICC = Intraclass correlation coefficient. CI = Confidence interval.
Table 4.
Comparison of additional oncogenic risk × 100 000 for all-cancer risk and leukemia risk in each sex according to different risk models.
Table 4.
Comparison of additional oncogenic risk × 100 000 for all-cancer risk and leukemia risk in each sex according to different risk models.
| BEIR VII | ICRP 103 | US EPA | P # | ICC (95% CI) | |
| All-cancer, male | 161.86 (72.82 – 376.95) | 65.97 (30.9 – 187.03) | 188.88 (81.73 – 418.07) | 0.001 | 0.91 (0.87 – 0.94) |
| All-cancer, female | 220.46 (746.82 - 4148.07) | 175.69 (48.93 – 280.85) | 60.91 (42 – 134.19) | 0.018 | 0.44 (0.2 – 0.94) |
| Leukemia, male | 29.47 (14.04 – 65.36) | 8.22 (3.09 – 28.33) | 28.36 (14.88 – 67.68) | 0.0001 | 0.85 (0.79 – 0.90) |
| Leukemia, female | 19.87 (68.82 – 366.38) | 11.97 (2.33 – 18.75) | 12.86 (6.11 – 25.61) | 0.00034 | 0.38 (0.1 – 0.80) |
Note.–Comparison of Additional Oncogenic Risk (AOR) x 100.000 for all-cancer risk and leukemia-risk according to BEIR VII, ICRP 103 and US EPA risk models in male and female. Values are median (interquartile range, IQR). EPA presents a single estimates for both sexes. # Friedman test repeated-measures analysis of variance. ICC = Intraclass correlation coefficient. CI = Confidence interval.
Disclaimer/Publisher’s Note: The statements, opinions and data contained in all publications are solely those of the individual author(s) and contributor(s) and not of MDPI and/or the editor(s). MDPI and/or the editor(s) disclaim responsibility for any injury to people or property resulting from any ideas, methods, instructions or products referred to in the content. |
© 2025 by the authors. Licensee MDPI, Basel, Switzerland. This article is an open access article distributed under the terms and conditions of the Creative Commons Attribution (CC BY) license (http://creativecommons.org/licenses/by/4.0/).
Copyright: This open access article is published under a Creative Commons CC BY 4.0 license, which permit the free download, distribution, and reuse, provided that the author and preprint are cited in any reuse.


