Submitted:
01 February 2025
Posted:
04 February 2025
You are already at the latest version
Abstract
Worldwide, environmental pollution is a leading cause of illness and mortality. This includes heavy metals, air pollutants, agricultural pesticides, and polluted food and water. Various factors, such as impaired renal excretion, degree of renal impairment, medication use, dialysate contamination, quality of the dialysis water, and metabolic changes in those suffering with end-stage kidney disease, may lead to heavy metal accumulation in hemodialysis patients. The study aimed to assess heavy metal toxicity levels in adults on hemodialysis compared to a control group and to investigate the correlation between parathyroid hormone (PTH) and heavy metal levels, uremic pruritus, and anemia. Method: Cross-sectional research involving 60 adult patients was conducted on regular hemodialysis for at least three months. As a control group, there were 60 adult volunteers who matched in age and sex with the patient group. The Inductively Coupled Plasma Mass Spectrometry (ICP-MS) method was used to examine the concentrations of heavy metals in drinking water and dialysate water for both groups, including serum levels of aluminum (Al), lead (Pb), cadmium (Cd), chromium (Cr), and arsenic (As). Result: The hemodialysis group had greater levels of Al, Pb, Cd, Cr, and As than the control group. Serum lead levels and PTH and serum ferritin and chromium levels were significantly correlated negatively. There was no significant correlation between heavy metal levels with uremic pruritus and anemia. Heavy metals in dialysis and drinking water samples were within acceptable ranges, and they were below the detection limit according to WHO and Association for the Advancement of Medical Instrumentation/American National Standards Institute (AAMI/ANSI). Elevated heavy metal levels might not be primarily caused by drinking water or dialysis.
Keywords:
chronic kidney disease
; heavy metals
; uremic pruritus
; regular hemodialysis
; parathyroid hormone
; anemia
; ferritin
; aluminum
; lead
; cadmium
; chromium
; arsenic
1. Introduction
According to the definition of chronic kidney disease (CKD), kidney damage or an estimated glomerular filtration rate (eGFR) of less than 60 ml/min per 1.73 square meters that lasts for three months or more is considered chronic. Kidney replacement therapy, such as dialysis or a kidney transplant, is required as kidney function gradually declines [1]. In patients with end-stage renal disease, various factors influence serum trace element concentrations, such as increased oral intake, impaired renal excretion, degree of renal impairment, medication use, dialysate contamination, quality of the water intake for dialysis, and metabolic changes associated with kidney failure [2]. Worldwide, environmental contamination is a leading source of illness, disability, and mortality. Examples include heavy metals, air pollutants, agricultural pesticides, and polluted food and water [3]. Heavy metal exposure may lead to a number of dangerous illnesses in individuals, including cancer, neurological conditions, and respiratory issues. Arsenic, chromium, cadmium, lead, and aluminum have been the most frequent heavy metals to cause poisoning in humans [4].
Depending on their dialysis indication, patients receiving hemodialysis three times a week are exposed to 300–600 L of water; according to their residual kidney function solute clearance, hemodialysis patients are also exposed to considerable volumes of dialysate water. Because heavy metal accumulation leads to several medical issues, including osteomalacia, low parathyroid hormone levels, anemia, increased erythropoietin needs, dialysis-induced encephalopathy, and increased mortality, it is therefore a serious concern for individuals receiving hemodialysis [5].
As heavy metals enter the body, they accumulate in the brain, parathyroid glands, bones, and other organs. Toxicological effects can result from heavy metal accumulation. Heavy metal toxicity often leads to accelerated cell death due to chronic disruption of cellular metabolism, and it can lead to interference with the glucose transphosphatase cycle, disruption of parathyroid hormone (PTH), bone metabolism, and alteration of essential serum elements such as calcium and phosphorus [6]. Heavy metal causes direct and indirect effects on the parathyroid glands, acting through different mechanisms. Accumulation of heavy metal in the parathyroid glands may increase or decrease the parathyroid response to hypocalcemia or hypercalcemia. In addition, it also interferes with the synthesis of PTH and inhibits the proliferation of parathyroid cells [7].
One harmful xenobiotic that causes a lot of major health issues is lead (Pb). Because of its many characteristics, such as its low melting point and resistance to corrosion, it has been used in a variety of items, despite being poisonous, such as paint, waterproofing tape, cosmetics, gasoline, etc. Consequently, reports of immunoregulatory, hematological, reproductive, and gastrointestinal issues have been made. Since the kidney is the primary organ for excretion from the body and is prone to renal damage from oxidative stress and lipid peroxidation, it is one of the sites of lead poisoning. Acute Pb poisoning has been linked to aminoaciduria, glycosuria, and phosphaturia as indicators of proximal tubule failure [8].
Human health is negatively impacted by cadmium, a hazardous heavy metal that comes from industrial and agricultural sources. It can cause cancerous tumors, bone disease, cardiovascular illness, infertility, and chronic kidney disease (CKD). The accumulation of cadmium in the kidneys, liver, and bones has an impact on health. The link between low-level environmental cadmium exposure and illnesses including renal disease, lung disease, hypertension, and dyslipidemia is becoming more and more clear. Environmental sources of cadmium include fuel burning, phosphate fertilizers, smoking, contaminated food or water, and inferior paints or cosmetics. In patients with end-stage renal disease (ESRD), including those receiving hemodialysis (HD) and peritoneal dialysis (PD), there is apparently a correlation between blood cadmium levels and mortality risk [9].
One 3d-transition element that occurs naturally is chromium (Cr; atomic number 24). With an average concentration of 125 mg/kg, chromium ranks as the sixth most prevalent metal in the Earth’s crust [10,11]. The most stable forms of chromium are trivalent and hexavalent [Cr (III)], while it may exist in a range of oxidation states from -4 to +6. Furthermore, chromium metal, or Cr (0), is a form of chromium that is present in the environment. Compared to Cr (III), Cr (VI) is 100 times more poisonous and soluble in water. The unstable Cr (V), Cr (IV), and stable Cr (III) interact with proteins and DNA by a number of different mechanisms, resulting in DNA crosslinks and single- and double-stranded DNA breaks. The initial intracellular concentration of Cr (VI) determines the dose-dependent genetic alterations that occur [10,12]. Inducing cellular death, changing gene methylation, upsetting the control of histones and micro-RNA, creating microsatellite instability, and reducing the function of p16 and p53 tumor suppression are all possible effects of chromium intermediates and metabolites [10].
Naturally occurring metallic arsenic is found in large quantities in the Earth’s crust and groundwater, as well as in trace levels in the air and food items, particularly seafood and shellfish. Arsenic is associated with many complications in the body’s organ systems: skin, nervous, respiratory, cardiovascular, hematopoietic, immune, endocrine, liver, kidney, reproductive, and developmental [13]. In the general population, exposure to aluminum (Al) and other heavy metals through food (processed foods), beverages, and medications containing aluminums, aluminum cookware; or cosmetic products (e.g., antiperspirant, sunscreen, and toothpaste) [14]. The two major ways that heavy metals enter the human body are by ingestion (through food and drink) and inhalation; however, the skin can also absorb heavy metals. The primary metal refining process, downstream sectors that manufacture aluminum products (such as automobiles, airplanes, and metal goods), and aluminum welding present additional risks of inhalation exposure for workers in the aluminum sector. Additionally, cigarette smoke can raise the levels of heavy metals in the air [15]. Approximately 1.5 to 2% of inhaled aluminum and 0.01 to 5% of ingested aluminum are absorbed, and most of the absorbed aluminum is excreted in the urine. Heavy metal accumulation in the dialysis population may be due to environmental or dietary exposure or contaminated dialysate [15]. The back is most frequently afflicted by uremic pruritus, which can also affect the limbs, head, and abdomen. The painful sensation of uremic pruritus (UP) is widespread in people with end-stage renal disease (ESRD). It has an impact on hemodialysis (HD) patients’ quality of life and is linked to a higher risk of death [16]. The pathophysiology of UP is complex and poorly understood, despite its great occurrence. The main theories for UP include inflammation, central/peripheral nervous system dysfunction, endogenous opioid dysregulation, and loss of normal skin function. Iron deficiency anemia, hepatitis virus infection, xerosis, hyperparathyroidism hormones, precipitates containing calcium phosphate, and other illnesses are other variables that contribute to the pathophysiology of UP [14].
This study aimed to assess potential heavy metal toxicity levels in adults undergoing regular hemodialysis compared to a control group and to evaluate the effects of aluminum, lead, cadmium, chromium and arsenic on PTH and the disturbance in calcium, and phosphorus and other blood parameters. Additionally, it also aimed to investigate the relationship between uremic pruritus, anemia, and heavy metal levels in these individuals. To our knowledge, no similar studies have been performed in Saudi Arabia.
2. Materials and Methods
2.1. Study Design
A cross-sectional study was conducted on 60 adult patients aged 18 and above from Buraidah Central Hospital’s hemodialysis unit. A control group of 60 healthy volunteers was also included. Medical records were analyzed for full history, including age and sex, residency, marital status, education level, occupation, smoking habits, and the duration of hemodialysis, medical and medication histories, toxicological history, clinical examinations, and blood tests.
2.2. Study Groups
The study involved two groups: patients on regular hemodialysis with single-use hollow-fiber dialyzers fitted with modified membranes and a control group of 60 subjects from Buraidah Central Hospital. Inclusion criteria of hemodialysis group included patients undergoing regular hemodialysis for more than three months, for 4 hours/3 times weekly, patients with controlled blood pressure and blood sugar levels. The exclusion criteria of hemodialysis group included pregnant patients, cancer patients, acute kidney injury adults, peritoneal dialysis patients, and autoimmune diseases. Inclusion criteria of control group included subjects apparently healthy, subjects with controlled blood pressure and blood sugar levels. Exclusion criteria of control group included subjects with a history of cancer or autoimmune diseases. Prior approval and consent were obtained from everyone.
2.3. Ethics Statement
The study received approval from the Saudi Ministry of Health’s College of Pharmacy and Research Ethics Committee, participants were notified of the study’s purpose before giving their informed consent. It was ethically reviewed by the Qassim Region Research Ethics Committee. (Approval Number: 607-45-13842; 22/4/2024).
2.4. Blood Collection and Storage:
The first 5 IU/ml of blood from the catheter was thrown away, and a 2.5 ml venous blood sample was taken from the venous ports of hemodialysis patients prior to heparin being added to the entire blood samples of hemodialysis patients [17]. The whole blood should be collected and then allowed to coagulate at room temperature without being disturbed. This typically requires 15 to 30 minutes. Remove the clot by centrifuging it in a centrifuge at 3,500 rpm for 5 minutes; if it is not being tested right away, it should be well labeled and kept at -20°C or below.
2.5. Sample Preparation
A microwave digestion system (Mile stone, START D, Leutkirch am Allgau, Germany) was used to digest serum samples, weighing between 0.5 and 1.0 grams; 2 ml of HNO3 and 1 ml of H2O2 were used to digest serum samples. The microwave digesting system’s heating procedure was divided into three stages: (1) 15 minutes of radiation at 400 W and 120 °C; (2) 15 minutes of radiation at 800 W and 200 °C; and (3) 5 minutes of radiation at 800 W and 200 °C [18]. Inductively coupled plasma mass spectrometry (ICP-MS) was then used to evaluate the samples. To calibrate the system, an ICP-MS stock tuning solution including Pb, Cd, Cr, As, and Al (10 µg/L) was used. Multielement calibration standard solutions (10 µg/mL) were used to create calibration curves. A dynamic reaction cell was used to reduce polyatomic interferences. The study’s operational conditions are shown in Table 1.
2.6. Drinking / Dialysis Water Sample Collection
A total of 60 filtered water samples from Buraidah city’s patients’ kitchens and one from a dialysis unit were collected. The water was cleaned, rinsed three times, and then acidified using HNO₃, 69%, to prevent metal precipitation and crystallization.
2.7. Uremic Pruritus
We used an NRS (Numerical Rating Scale) to assess the severity of pruritus. The NRS is an 11-point numerical scale that indicates the severity of individual’s symptoms. 0 represents no pruritus, 1–3 mild itching, 4-6 moderate itching, 7-9 severe itching, and 10 the worst symptoms possible [19].
2.8. Statistical Analysis
The study used Microsoft Office Excel 2010 for graphing and SPSS version 16 for data entry and analysis. While averages, standard deviations, and ranges were used to represent quantitative data, frequencies and relative frequencies were used to show qualitative data. Numerous tests were used, including the Kruskal-Wallis test, Fisher Exact Test, Pearson’s Chi-square, Kolmogorov-Smirnov test, Independent Student’s t-test, and Spearman rank correlation coefficient [20].
3. Results
Regarding age, Table 2 revealed no statistically significant differences between the control group (mean ± SD, 56.3 ± 18.7) and the hemodialysis group (mean ± SD, 57.4 ± 17.4). In addition, there were no statistically significant differences between the two groups as regards gender, residence, education, or employment; however, there were statistically significant disparities between the two groups as regards marital status.
In the current study, there were more than half of the hemodialysis group (58.3%) with non-uremic pruritus and most uremic pruritus cases had mild pruritus (21.7%) followed by the worst imaginable symptoms (8.3%) then moderate itching (6.7%) then severe itching (5%) as shown in Table 3. According to Table 4, there was no statistically significant association between heavy metals and uremic pruritus in the hemodialysis group.
As regards the levels of heavy metals in hemodialysis and control groups, we found that hemodialysis cases had higher levels of Al, Cd, Cr, Pb, and As than control, with a significant statistical difference (P-value < 0.001*), as indicated in Table 5.
As regards the correlation between parathyroid hormone, phosphorus, and calcium with heavy metal in serum among the hemodialysis group as shown in Table 6, there was a negative significant correlation between serum lead level and PTH in the hemodialysis group (P-value = 0.027*); however, there was no significant correlation between heavy metal level and either phosphorus or calcium.
There were no statistically significant differences between the hemodialysis group’s RBC, hemoglobin, and platelets with Al, Cd, Cr, Pb, and As levels, according to Table 7.
Serum chromium and ferritin had statistically significant negative relationships, as indicated in Table 8, but there were no statistically significant correlation between ferritin and AL, Cd, Cr, Pb, or As in the hemodialysis group.
Regarding the levels of heavy metals in the water sample taken from the hemodialysis unit, Table 9 demonstrated that it was below the normal range according to AAMI/ANSI maximum allowable chemical contaminant levels for dialysis water in the hemodialysis unit.
The amounts of each heavy metal in the drinking water samples from the hemodialysis group were within acceptable limits and, in some cases, even below the detection limit, according to Table 10. By meeting the WHO and AAMI/ANSI specifications, the highest lead level was in East Buraydah (mean ± SD 2.69 ± 6.38), while the lowest cadmium level was in West Buraydah (mean ± SD -0.41 ± 1.24), and the highest aluminum level was in North Buraydah (mean ± SD 33.9 ± 43.9) without statistically significant difference.
The method of validation for linearity, sensitivity, selectivity, precision, and accuracy. The method demonstrated excellent linearity for each metal, with a high correlation coefficient and a small percentage relative standard deviation Table 11 and Table 12. It also demonstrated high sensitivity based on LOD (3.3 σ/S) and LOQ (10 σ/S) values. The method’s selectivity was tested by observing interference from drinking water and human plasma matrices, demonstrating no interference. The method’s intraday and inter-day precision were assessed; the small values of (% RSD) indicate reasonable repeatability, high accuracy, and precision of the proposed method Table 11 and Table 12. The method’s accuracy was demonstrated through the determination of different concentrations of pure metal samples Table 13 and Table 14.
4. Discussion
As observed in our study, the biological serum samples from the hemodialysis group had higher levels of all five heavy metals than those from the control group.
In the current study, the hemodialysis group included 48.4% males and 51.7% females, whereas the control group had 46.7% males and 53.3% females. The gender distribution of the two groups wasn’t statistically significantly different. Regarding age, the hemodialysis group’s mean ± SD was 57.4 ± 17.4 years, while the control group was 56.3 ± 18.7 years; the two groups’ age distributions weren’t statistically significantly different.
The above-mentioned observations find agreement with those of Hegazy, A. et al., [21] founded that, with regard to of age and gender, there was no statistically significant difference between the cases and the controls. In addition, Siha, M., [22] showed that there were no age-related statistically significant differences between the exposed and control groups. In the current study, the majority of cases and control residency were in South Buraydah (48.3% and 45%, respectively), and the lowest residency of cases and control were in North Buraydah (15% and 12.5%, respectively), with no significant differences between them. Also, when the hemodialysis group and the control group were compared, there was a statistically significant difference in marital status, and the majority was married in the hemodialysis group (61.7%) and the control group (73.3%).
This agreed with Li, J. et al., [23] who reported a statistically significant difference in marital status. However, there are no statistically significant variations between the two groups’ occupations and educational attainment.
Aluminum is usually eliminated by the kidney. Aluminum can accumulate when renal function is significantly diminished or absent since there is little to no ability to eliminate the metal [24]. In the current study, serum aluminum levels in CKD patients on regular hemodialysis were considerably greater than those in control in this investigation; they were (187.45 ± 144.82 ppb) and (64.24 ± 35.86 ppb), respectively with statistically significant difference (P = 0.001). Our results are in accordance with Hegazy A. et al., and Anees et al., [25,26] they reported that there is a significantly high level of serum aluminum in hemodialysis cases compared to controls.
In previous research, Yue et al., [27] founded that Canadian peritoneal dialysis patients had mean blood aluminum levels of 4.8 ± 2.0 g/dL, while Neiva et al., [28] founded that Brazilian hemodialysis patients had mean blood aluminum levels of 4.5 ± 2.9 g/dL. On the other hand, Hsu et al., study from Chang Gung Memorial Hospital [29] founded that the percentage of patients with abnormal blood aluminum levels dropped from 13.7% in 2018 to 2.2% in 2021. It may result from the use of phosphate binders that don’t contain aluminum and the reverse osmosis process, which removes aluminum from dialysis water [30].
Available data in current study suggested that cadmium, chromium, lead and arsenic concentration serum level in the hemodialysis group (with mean ± SD, (1.21 ±1.21, 1.06 ±2.24, 4.32 ±2.65 and 1 ± 0.44, respectively)) were higher than in control group (with mean ± SD, (0.07 ± 0.12, 1.32 ±1.44, 0.002 ±0.021 and 0.66 ± 0.37, respectively)) with strong statistically significant differences (P-value <0.001*), our results are similar to that obtained by Covic, A., & Gusbeth-Tatomir, P., [31] who reported that hemodialysis patients had lower amounts of selenium, zinc, and manganese and greater levels of cadmium, chromium, copper, lead, and vanadium than controls, and Shanmugam, L., et al., [32] reported that end-stage renal disease group’s mean chromium level was 5.9947 ± 2.74μg/l, whereas the control groups were 1.2655 ± 0.77μg/l; there was a statistically significant difference (p<0.001). Zima T et al., [33] observed a similar finding, dialysis patients had a mean chromium level of 3.67 ± 0.35 μg/l, which was statistically significant. Higher chromium levels are linked to the development of cancer, contact dermatitis, and hemolysis [32].
Shanmugam, L., et al, [32] reported that serum arsenic levels were 4.76±2.285 μg/l and the mean lead level was 66.5558±36.62 μg/l in the end-stage renal disease group, which was significantly higher (p=0.001) than the control group’s mean levels of 43.5060±24.68 μg/l. The control group’s mean levels were 1.61±0.992 μg/l, which was statistically significant (p-value ≤ 0.001).
The limited number of published research investigations on the association between PTH and heavy metals in hemodialysis patients. The current study investigates, and correlation “r” was done to test for the presence of correlation between levels of serum aluminum, cadmium, chromium, lead, and arsenic with serum PTH, the results suggested that lead was negatively significantly correlated with PTH, with Spearman rank r -0.289 and p value = 0.027, but other heavy metals had no significant correlation with PTH. This agreed with Siha, M., [22] who reported that the negative correlations between serum aluminum level, serum PTH, and calcium, but disagreed with Hegazy, A. et al., [25] demonstrated a positive correlation between serum aluminum levels, parathyroid hormone (PTH), and age. also disagreed with Sang, Z. et al., [34] indicated that cadmium exhibited a negative association with PTH, while lead demonstrated a positive association with PTH, both in a nonlinear manner.
Sang, Z., et al., [35] examined the relationship between blood cadmium and lead and serum parathyroid hormone (PTH) in the general population. They found that lead had a non-linear positive association with PTH and a negative association with PTH, while cadmium and PTH were not significantly related in females. The association between cadmium and PTH did, however, differ by gender (all non-linearity P values were less than 0.05).
Anemia affects almost everyone with end-stage renal failure. The most common cause of anemia is decreased synthesis of erythropoietin hormone (EPO) [25], current study revealed significant negative correlations between serum ferritin and chromium (Spearman rank r = -0.355 and p-value = 0.006), but no correlation between ferritin and other heavy metals or between serum of heavy metals and the number of red blood cells, hemoglobin, or platelets in the blood among the cases group. These results were relatively different from what was obtained by Mahieu et al., [36] who studied the hemotoxic effect of aluminum intoxication in rats over 6 months of exposure, and they found that at the 1st month, at the end of the study, the red cell count significantly increased after initially declining in comparison to the control group (10±0.3 versus 8.7±0.2 million/ml). Therefore, even if microcytic anemia is a sign of long-term aluminum exposure, extended exposure may result in a rise in red blood cell count and a recovery of hematocrit and hemoglobin concentration levels.
Our research supported that of Bandeira, C. et al., [37] who analyzed lead, copper, manganese, arsenic, chromium, and cadmium in three groups: cancer smokers, non-smokers with cancer, and non-cancer smokers. They found no differences in metal quantifications, but there was a significant difference (p=0.0223) in the mean copper levels of the non-smokers with cancer.
Also, our study disagreed with the effects of secondhand and active smoking on the concentration of different essential and toxic metals in milk were investigated by Mansouri, B. et al., [38] who found that the levels of As in the breast milk of the active and nonsmoker groups differed significantly, and that the breast milk of passive and active smokers had significantly higher levels of Cd, Pb, and Hg than that of nonsmokers.
Carcinogenic heavy metal levels (Pb, Cd, As, Ni, and Cr) were demonstrated by Viana et al., [39] to be a substantial source of exposure and risk for both active and passive smokers, though these levels may fluctuate widely among the different cigarette brands available in this nation.
In our study, we found that more than half of the hemodialysis group (58.3%) had non-uremic pruritus, and the majority of pruritus patients had mild pruritus (21.7%) followed by the worst possible itching (8.3%) then moderate itching (6.7%) then severe itching (5%). There was no statistically significant association with uremic pruritus (UP). This finding was in contrast with research conducted by Friga et al., [40] on 94 HD patients, which found a positive correlation between pruritus and serum Al levels. But in their study of 54 HD patients, Carmichael et al., [41] found such a correlation. Al-containing vaccinations have been linked to chronic pruritus and itchy nodules in the general population [42]. Bergfors et al., [42] founded that 77% of children with Al allergies experienced a high prevalence of itchy nodules following the injection of the diphtheria-tetanus/acellular pertussis vaccinations. It is uncertain how pruritus and serum Al interact in persons with maintenance HD.
Finally, in the current study, water contaminated with heavy metals was investigated, whether it was water used in the hemodialysis unit and drinking water. The current study’s findings demonstrated the levels of each of the heavy metals evaluated: Al, Cd, Cr, Pb, Because levels in drinking water and dialysis water from hemodialysis centers were within permissible bounds and, in some cases, even below the detection limit. By meeting the WHO and AAMI/ANSI specifications, this suggests that sources other than drinking water and dialysis fluid were responsible for the higher blood concentrations of heavy metals.
In contrast, several investigations conducted outside of Saudi Arabia Humudat, Y. R., & Al-Naseri, S. K., [43] revealed that the dialysis fluid had a very high Al content, while some also showed an elevated Pb concentration.
Previous studies have shown that the efficacy of the reverse osmosis system differed by city. Asadi et al., [44] in Qom, Taleshi et al., [45] in Yazd, and Totao et al., [46] in Italy conducted investigations that showed the reverse osmosis system was 100% efficient with respect to the components being studied. All the elements’ concentrations were lowered to levels within the acceptable ranges. However, studies conducted in Isfahan by Shahryari et al., [47] and Kermanshah by Pirsaheb et al., [48] and Palestine by Abualhasan et al., [49] have demonstrated the inefficiency of the reverse osmosis system and its inability to bring the concentration of some of the elements under study—heavy metals in particular—down to levels that are acceptable.
This current study disagreed with Hegazy, A., et al., [25] which revealed that the amount of aluminum in drinking water was 300 µg/L, above the allowable limit. This is a significant finding. Aluminum is used as a flocculent in Egypt to purify drinking water. Metal can be found using foils for packaging and beverage cans, in addition to cooking with metal utensils. Also, our result disagreed with several parts of Pakistan, there was more arsenic in the drinking water than the WHO-recommended threshold of 10 ppb(μg/L). Based on Ashraf et al., [50] the amounts of arsenic in the three largest reservoirs in Pakistan—Lloyd (620 μg/L), Chashma (750 μg/L), and Tarbela (620 μg/L) are greater than the WHO safe limit.
Our study agreed with Alhagri, I. et al., [51] who stated that filtered water typically has lower mean amounts of As, Pb, Cd, Hg, Cr, and Ni than tap water. Furthermore, the average concentrations of each element in filtered and tap water are below the GSO and WHO recommendations; indicating that the amounts of these substances in the water samples fall within the permitted drinking water ranges.
All case serum samples, control samples, and water samples in the current investigation had good correlation coefficients (R2), with values ranging from 0.98 to 0.999. The recoveries of all elements were founded in drinking water samples range of 100.57% - 113.1%, and in the serum sample 98% - 108%. The results’ agreement demonstrates that the quantitative element determination and the suggested mineralization process of the samples are both accurate. LOQs and LODs value reflect the lowest amount of elements which can be determined accurately by the procedure.
5. Conclusions
The study found that hemodialysis patients had significantly higher serum concentrations of heavy metals compared with control group, including aluminum, cadmium, chromium, lead, and arsenic. Serum lead levels and PTH were shown to be negatively correlated in the current investigation, but heavy metal levels and uremic pruritus (UP) did not significantly correlate. Additionally, the study discovered no meaningful relationship between the amounts of heavy metals and the platelet, hemoglobin, or red blood cell counts. However, negative associations between ferritin and serum chromium were statistically significant. The study suggests that drinking water is not the primary cause of elevated heavy metals levels.
6. Limitation
The study has limitations, including being cross-sectional, single-center, and having a moderate patient population. It also lacked information on diets and cosmetics and other heavy metal sources. The study was limited to a subset of heavy metals, excluded certain metals linked to death, and used only one blood test. Compared to bone lead, blood lead might not be a more reliable biomarker of chronic lead exposure.
7. Recommendation
This work recommends public health awareness of heavy metal toxicity risks, routine measurement of metal levels for new hemodialysis patients, and the implementation of dialysis water quality monitoring programs. Additionally, it suggests health education initiatives to raise public knowledge of the harmful effects of heavy metals and the significance of antioxidants in diet. Monitoring concentrations of heavy metals in air-borne, soil-based, aquatic environments, cosmetics, and food additives is also recommended. Including natural antioxidants like curcumin in diets can help combat oxidative stress, and additional investigation is required to determine the causes of metal intoxication.
References
- Vaidya SR, Aeddula NR. Chronic Kidney Disease. [Updated 2022 Oct 24]. In: StatPearls [Internet]. Treasure Island (FL): StatPearls Publishing; 2024 Jan. Available online: https://www.ncbi.nlm.nih.gov/books/NBK535404/.
- Hashmi MF, Benjamin O, Lappin SL. End-Stage Renal Disease. [Updated 2023 Aug 28]. In: StatPearls [Internet]. Treasure Island (FL): StatPearls Publishing; 2024 Jan. Available online: https://www.ncbi.nlm.nih.gov/books/NBK499861/.
- Landrigan, P.J.; Sly, J.L.; Ruchirawat, M.; Silva, E.R.; Huo, X.; Diaz-Barriga, F.; Zar, H.J.; King, M.; Ha, E.H.; Asante, K.A.; et al. Health Consequences of Environmental Exposures: Changing Global Patterns of Exposure and Disease. Ann. Glob. Health 2016, 82, 10–19. [Google Scholar] [CrossRef] [PubMed]
- Balali-Mood M, Naseri K, Tahergorabi Z, Khazdair MR, Sadeghi M. Toxic Mechanisms of Five Heavy Metals: Mercury, Lead, Chromium, Cadmium, and Arsenic. Front Pharmacol. 2021 Apr 13; 12:643972. [CrossRef] [PubMed] [PubMed Central]
- Tsai, M., Fang, Y., Liou, H., Leu, J., & Lin, B. (2018). Association of Serum Aluminum Levels with Mortality in Patients on Chronic Hemodialysis. Scientific Reports, 8(1). [CrossRef]
- Rahimzadeh MR, Rahimzadeh MR, Kazemi S, Amiri RJ, Pirzadeh M, Moghadamnia AA. Aluminum Poisoning with Emphasis on Its Mechanism and Treatment of Intoxication. Emerg Med Int. 2022 Jan 11;2022:1480553. [CrossRef] [PubMed] [PubMed Central]
- Mehrdad Rafati Rahimzadeh, Mehravar Rafati Rahimzadeh, Sohrab Kazemi, Roghayeh Jafarian Amiri, Marzieh Pirzadeh, Ali Akbar Moghadamnia, “Aluminum Poisoning with Emphasis on Its Mechanism and Treatment of Intoxication”, Emergency Medicine International, vol. 2022, Article ID 1480553, 13 pages, 2022. [CrossRef]
- Rana MN, Tangpong J, Rahman MM. Toxicodynamics of Lead, Cadmium, Mercury and Arsenic- induced kidney toxicity and treatment strategy: A mini review. Toxicol Rep. 2018 May 26;5:704-713. [CrossRef] [PubMed] [PubMed Central]
- Tsai KF, Hsu PC, Kung CT, Lee CT, You HL, Huang WT, Li SH, Cheng FJ, Wang CC, Lee WC. The Risk Factors of Blood Cadmium Elevation in Chronic Kidney Disease. Int J Environ Res Public Health. 2021 Nov 24;18(23):12337. [CrossRef] [PubMed] [PubMed Central]
- Sun H, Brocato J, Costa M. Oral Chromium Exposure and Toxicity. Curr Environ Health Rep. 2015 Sep;2(3):295-303.
- Wise JP, Young JL, Cai J, Cai L. Current understanding of hexavalent chromium [Cr(VI)] neurotoxicity and new perspectives. Environ Int. 2022 Jan;158:106877. [PMC free article] [PubMed] [Reference list].
- Tchounwou PB, Yedjou CG, Patlolla AK, Sutton DJ. Heavy metal toxicity and the environment. Exp Suppl. 2012;101:133-64. [PMC free article] [PubMed] [Reference list].
- Kuivenhoven M, Mason K. Arsenic Toxicity. [Updated 2023 Jun 12]. In: StatPearls [Internet]. Treasure Island (FL): StatPearls Publishing; 2024 Jan. Available online: https://www.ncbi.nlm.nih.gov/books/NBK541125/.
- Klotz, K.; Weistenhofer, W.; Neff, F.; Hartwig, A.; van Thriel, C.; Drexler, H. The health effects of aluminum exposure. Dtsch. Arztebl. Int. 2017, 114, 653–659. Available online: https://www.ncbi.nlm.nih.gov/pubmed/29034866 (accessed on 9 February 2022). [CrossRef] [PubMed]
- Afridi, H.I.; Talpur, F.N.; Kazi, T.G.; Brabazon, D. Effect of trace and toxic elements of different brands of cigarettes on the essential elemental status of irish referent and diabetic mellitus consumers. Biol. Trace Elem. Res. 2015, 167, 209–224. Available online: https://www.ncbi.nlm.nih.gov/pubmed/25805269 (accessed on 9 February 2022). [CrossRef] [PubMed]
- Krewski D, Yokel RA, Nieboer E, Borchelt D, Cohen J, Harry J, Kacew S, Lindsay J, Mahfouz AM, Rondeau V. Human health risk assessment for aluminium, aluminium oxide, and aluminium hydroxide. J Toxicol Environ Health B Crit Rev. 2007;10 Suppl 1(Suppl 1):1-269. doi: 10.1080/10937400701597766. Erratum in: J Toxicol Environ Health B Crit Rev. 2008 Feb;11(2):147. [CrossRef] [PubMed] [PubMed Central]
- Rogers, J. (n.d.). LibreTexts Blog – The future is open. CLINICAL CHEMISTRY - THEORY, ANALYSIS, CORRELATION. Available online: http://blog.libretexts.org/.
- Yahaya, M., Shehu, A., & Dabai, F. (2013). Efficiency of Extraction of Trace metals from Blood samples using Wet Digestion and Microwave Digestion Techniques. Journal of Applied Sciences and Environmental Management, 17(3). [CrossRef]
- Yue, C.S.; Christie, M.; Lavergne, V.; Sikaneta, T.; Taskapan, H.; Mardini, K.; Tam, P.; Ting, R.; Ghannoum, M. Aluminum toxicokinetics in peritoneal dialysis patients. Clin. Toxicol. 2011, 49, 659–663. [Google Scholar]
- Schober, P., Boer C. and Schwarte L.A. (2018): Correlation Coefficients: Appropriate Use and Interpretation. Anesth Analg.; 126(5):1763-1768.
- Anees M, Mumtaz A, Frooqi S, Ibrahim M, Hameed F. Serum trace elements (aluminum, copper, zinc) in hemodialysis patients. Biomedica. 2011;27:106-110.
- Siha, M. (2014). Effect of Occupational Exposure to Aluminum on Parathyroid Hormone and Calcium Metabolism. British Journal of Medicine and Medical Research, 4(11), 2265–2276. [CrossRef]
- Li, J., Molnar, M. Z., Zaritsky, J. J., Sim, J. J., Streja, E., Kovesdy, C. P., Salusky, I., & Kalantar-Zadeh, K. (2013). Correlates of parathyroid hormone concentration in hemodialysis patients. Nephrology Dialysis Transplantation 28(6), 1516–1525. [CrossRef]
- Lloyd, S. Aluminium toxicity in Adult haemodialysis patients clinical guideline, V1. Principal author: Sioned Lloyd Approved by Wirral Drugs & Therapeutic Committee; 2011.
- Hegazy, A., El-Salam, M., & Ibrahim, G. (2015b). Serum Aluminum Level and Its Relation with Parathyroid Hormone and Anemia in Children on Maintenance Hemodialysis. British Journal of Medicine and Medical Research 7(6), 494–502. [CrossRef]
- Anees M, Mumtaz A, Frooqi S, Ibrahim M, Hameed F. Serum trace elements (aluminum, copper, zinc) in hemodialysis patients. Biomedica. 2011;27:106-110.
- Yue, C.S.; Christie, M.; Lavergne, V.; Sikaneta, T.; Taskapan, H.; Mardini, K.; Tam, P.; Ting, R.; Ghannoum, M. Aluminum toxicokinetics in peritoneal dialysis patients. Clin. Toxicol. 2011, 49, 659–663. Available online: https://www.ncbi.nlm.nih.gov/ pubmed/21819285 (accessed on 9 February 2022).
- Neiva, T.J.; Benedetti, A.L.; Tanaka, S.M.; Santos, J.I.; DAmico, E.A. Determination of serum aluminum, platelet aggregation and lipid peroxidation in hemodialyzed patients. Braz. J. Med. Biol. Res. 2002, 35, 345–350. Available online: https://www.ncbi.nlm.nih.gov/pubmed/11887212 (accessed on 9 February 2022). [CrossRef] [PubMed]
- Hsu, C.W.; Weng, C.H.; Chan, M.J.; Lin-Tan, D.T.; Yen, T.H.; Huang, W.H. Association between serum aluminum level and uremic pruritus in hemodialysis patients. Sci. Rep. 2018, 8, 17251. Available online: https://www.ncbi.nlm.nih.gov/pubmed/30467375 (accessed on 9 February 2022). [CrossRef] [PubMed]
- Gault, P.M.; Allen, K.R.; Newton, K.E. Plasma aluminium: A redundant test for patients on dialysis? Ann. Clin. Biochem. 2005, 42, 51–54. Available online: https://www.ncbi.nlm.nih.gov/pubmed/15802033 (accessed on 9 February 2022). [CrossRef] [PubMed]
- Covic, A., & Gusbeth-Tatomir, P. (2009). Trace elements in end-stage renal disease – unfamiliar territory to be revealed. BMC Nephrology, 10(1). [CrossRef]
- Shanmugam, L., Green, S. R., Radhakrishnan, H., Kadavanu, T. M., Ramachandrappa, A., Tiwari, S. R., Rajkumar, A. L., & Govindasamy, E. (2016). Trace Elements in Chronic Haemodialysis Patients and Healthy Individuals-A Comparative Study. JOURNAL OF CLINICAL AND DIAGNOSTIC RESEARCH. [CrossRef]
- Zima T, Mestek O, Tesar V, Tesarova P, Nemecek K, Zak A, et al. Chromium levels in patients with internal disease. Biochem Mol Biol Int.1998;46(2):365–74.
- Sang, Z., Zhang, H., Ma, W., Dong, Y., & Shi, B. (2022). Parathyroid hormones in relation to serum cadmium and lead: the NHANES 2003–2006. Environmental Science and Pollution Research, 30(7), 18491–18498. [CrossRef]
- Sang, Z., Zhang, H., Ma, W., Dong, Y., & Shi, B. (2022b). Parathyroid hormones in relation to serum cadmium and lead: the NHANES 2003–2006. Environmental Science and Pollution Research, 30(7), 18491–18498. [CrossRef]
- Mahieu S, Del Carmen Contini M, Gonzalez M, Millen N and Elias MM. Aluminum toxicity. Hematological effects. Toxicol Lett. 2000;111:235-42.
- Bandeira, C. M., De Almeida, A. Á., Carta, C. F. L., Almeida, A. A., De Figueiredo, F. a. T., Sandrim, V. C., Gonçalves, A. J., & Almeida, J. D. (2018). Tobacco influence in heavy metals levels in head and neck cancer cases. Environmental Science and Pollution Research, 25(27), 27650–27656. [CrossRef]
- Mansouri, B., Azadi, N. A., Sharafi, K., & Nakhaee, S. (2023). The effects of active and passive smoking on selected trace element levels in human milk. Scientific Reports, 13(1). [CrossRef]
- Viana GF, Garcia KS, Menezes-Filho JA (2011) Assessment of carcino genic heavy metal levels in Brazilian cigarettes. Environ Monit Assess 181:255–265. [CrossRef]
- Wang H, Huang P, Zhang R, Feng X, Tang Q, Liu S, et al. Effect of lead exposure from electronic waste on haemoglobin synthesis in children. Int Arch Occup Environ Health. (2021) 94:911–8. doi: 10.1007/s00420-020-01619-1 (APRT and HPRT) by Pb2+: a potential mechanism of lead toxicity. Toxicology. (2009) 259:77–83. doi: 10.1016/j.tox.2009.02.005.
- Friga, V., Linos, A. & Linos, D. A. Is aluminum toxicity responsible for uremic pruritus in chronic hemodialysis patients? Nephron 75, 48–53 (1997).
- Carmichael, A. J., McHugh, M. M., Martin, A. M. & Farrow, M. Serological markers of renal itch in patients receiving long term haemodialysis. British medical journal 296, 1575 (1988).
- (2019a, December 25). Ministry of Health Saudi Arabia. Ministry of Health Saudi Arabia. Available online: https://www.moh.gov.sa/en/Ministry/MediaCenter/Publications/Pages/Publications-2019-12-25-001.aspx.
- Naderi, B., Attar, H. M., & Mohammadi, F. (2022). Evaluation of Some Chemical Parameters of Hemodialysis Water: A Case Study in Iran. Environmental Health Insights, 16. [CrossRef]
- Asadi M, Safdari M, Paydari Shayesteh N. The study of anion density in influent water to dialysis machines and its comparison with Association for the advance ment of medical instrumentation and European Pharmacopeia Standards in Qom Hospitals. J Sabzevar Univ Med Sci. 1970;20:117-121. Available online: http://jsums.sinaweb.net/article_321.html (accessed on 18 September 2022).
- Taleshi MSA, Azimzadeh HR, Ghaneian MT, Namayandeh SM. Performance evaluation of reverse osmosis systems for water treatment required of hemodialy sis in Yazd educational hospitals, 2013. J Res Environ Heal. 2015;1:95-103.
- Totaro M, Casini B, Valentini P, et al. Evaluation and control of microbial and chemical contamination in dialysis water plants of Italian nephrology wards. J Hosp Infect. 2017;97:169-174.
- Shahryari A, Nikaeen M, Hatamzadeh M, Vahid Dastjerdi M, Hassanzadeh A. Evaluation of Bacteriological and chemical quality of dialysis water and fluid in Isfahan, central Iran. Iran J Public Health. 2016;45:650-656. Accessed September 18, 2022. Available online: https://ijph.tums.ac.ir/index.php/ijph/article/view/6801 (accessed on 18 September 2022).
- Pirsaheb M, Naderi S, Lorestani B, Khosrawi T, Sharafi K. Efficiency of reverse osmosis system in the removal of lead, cadmium, chromium and zinc in feed water of dialysis instruments in Kermanshah Hospitals. J Maz Univ Med Sci. 2014;24:151-157. Available online: http://jmums.mazums.ac.ir/article-1-4516-en.html (accessed on 18 September 2022).
- Midrar-Ul-Haq, Khattak RA, Puno HK, Saif MS, Memon KS.2005. Surface and ground water contamination in NWFP and Sindh provinces with respect to trace elements. International Journal of Agriculture and Biology 7(2), 214–217.
- Ashraf M, Tariq J, Jaffar M.1991. Contents of trace metals in fish, sediment and water from three freshwater reservoirs on the Indus River, Pakistan. Fisheries Research 12(4), 355–64. [CrossRef]

Table 1.
Inductively Coupled Plasma Mass Spectrometry technique’s operational conditions.
| ICP-MS Condition | Value |
|---|---|
| Model Name | G8421A |
| Serial Number | JP15380160 |
| Nebulizer Type | MicroMist |
| Sample Introduction | PeriPump |
| Autosampler Type | Agilent I-AS |
| Autosampler Rack | 53 Samples |
| I-AS Escape Mode | Off |
| Plasma Ignition Mode | Aqueous Solution |
| Ion Lenses Model | x-Lens |
Table 2.
Demographic characteristics of hemodialysis group (N=60) and control group (N=60).
| Groups Variables |
Hemodialysis cases (N=60) |
Control (N=60) |
Total (N=120) |
P-value ^ |
|---|---|---|---|---|
| Age (Years) (mean±SD) | 57.4 ± 17.4 | 56.3 ± 18.7 | 56.8 ±18 | 0.725 |
| Sex (%) | ||||
| Male | 29(48.4%) | 28(46.7%) | 57(47.5%) | 0.855 |
| Female | 31(51.7%) | 32(53.3%) | 63(52.5%) | |
| Residency (%) | ||||
| South Buraydah | 29(48.3%) | 27(45.0%) | 56(46.7%) | 0.578 |
| North Buraydah | 9(15.0%) | 15(12.5%) | 24(20.0%) | |
| West Buraydah | 10(16.7%) | 8(13.3%) | 18(15.0%) | |
| East Buraydah | 12(20.0%) | 10(16.7%) | 22(18.3%) | |
| Marital Status (%) | ||||
| Single | 11(18.3%) | 8(13.3%) | 19(18.8%) | 0.040* |
| Married | 37(61.7%) | 44(73.3%) | 81(67.5%) | |
| Widow | 11(18.3%) | 3(5.0%) | 14(11.7%) | |
| Divorced | 1(1.7%) | 5(8.3%) | 6(5.0%) | |
| Educational level (%) | ||||
| Illiterate | 32(53.3%) | 26(43.3%) | 58(48.3%) | 0.285 |
| Primary | 7(11.7%) | 6(10.0%) | 13(10.8%) | |
| Secondary | 6(10.0%) | 4(6.7%) | 10(8.3%) | |
| Tertiary | 5(8.3%) | 11(18.3%) | 16(13.3%) | |
| Diploma | 3(5.0%) | 1(1.7%) | 4(3.3%) | |
| Bachelor | 6(10.0%) | 12(20.0%) | 18(15.0%) | |
| Postgraduate | 1(1.7%) | 0(0.0%) | 1(0.8%) | |
| Occupation (%) | ||||
| Not working | 35(58.3%) | 28(46.7%) | 63(52.5%) | 0.410 |
| Employee | 13(21.7%) | 15(25.0%) | 28(23.3%) | |
| Retired | 12(20.0%) | 17(28.3%) | 29(24.2%) | |
^ Chi-square, Fisher exact and independent T-test were used. * Significant p-value> 0.05; SD= standard deviation.
Table 3.
Numerical score rate of uremic pruritus among the hemodialysis group (N=60).
| Numerical Score Rate | N. | % |
|---|---|---|
|
35 | 58.3% |
|
13 | 21.7% |
|
4 | 6.7% |
|
3 | 5.0% |
|
5 | 8.3% |
Table 4.
Spearman rank correlation between uremic pruritus and heavy metals in serum among the haemodialysis group (N=60).
Table 4.
Spearman rank correlation between uremic pruritus and heavy metals in serum among the haemodialysis group (N=60).
| Heavy Metals in Serum | Uremic Pruritus | |
|---|---|---|
| Spearman Rank r | P. value | |
| Aluminum(ppb) | 0.027 | 0.838 |
| Cadmium(ppb) | -0.107 | 0.416 |
| Chromium(ppb) | 0.214 | 0.100 |
| Lead(ppb) | -0.152 | 0.245 |
| Arsenic(ppb) | -0.028 | 0.833 |
ppb= parts per billion.
Table 5.
Comparison between hemodialysis group (N=60) and control group (N=60) regarding concentration of serum heavy metals.
Table 5.
Comparison between hemodialysis group (N=60) and control group (N=60) regarding concentration of serum heavy metals.
| Groups Variables |
Hemodialysis cases (N=60) |
Control (N=60) |
P-value ^ |
|---|---|---|---|
| Aluminum (ppb) | |||
| Mean ± SD | 187.45 ±144.82 | 64.24 ± 35.86 | <0.001* |
| Range (Min-Max) | 865.9(44.09- 909.99) | 264(4.83-268.85) | |
| Cadmium (ppb) | |||
| Mean ± SD | 1.21 ±1.21 | 0.07 ± 0.12 | <0.001* |
| Range (Min-Max) | 8.47 (0.00-8.47) | 0.54 (0.00-0.54) | |
| Chromium (ppb) | |||
| Mean ± SD | 1.06 ±2.24 | 1.32 ±1.44 | <0.001* |
| Range (Min-Max) | 14.16(0.00-14.16) | 8.65(0.14-8.79) | |
| Lead (ppb) | |||
| Mean ± SD | 4.32 ±2.65 | 0.002 ±0.021 | <0.001* |
| Range (Min-Max) | 17.74(0.39-18.13) | 0.17(0.00-0.17) | |
| Arsenic(ppb) | |||
| Mean ± SD | 1 ± 0.44 | 0.66 ± 0.37 | <0.001* |
| Range (Min-Max) | 1.97(0.48-2.46) | 1.72(0.21-1.92) | |
^ Mann-Whitney U test was used. * Significant p-value> 0.05; SD= standard deviation; ppb= parts per billion.
Table 6.
Spearman rank correlation between parathyroid hormone, phosphorus and calcium with serum heavy metal among haemodialysis group (N=60).
Table 6.
Spearman rank correlation between parathyroid hormone, phosphorus and calcium with serum heavy metal among haemodialysis group (N=60).
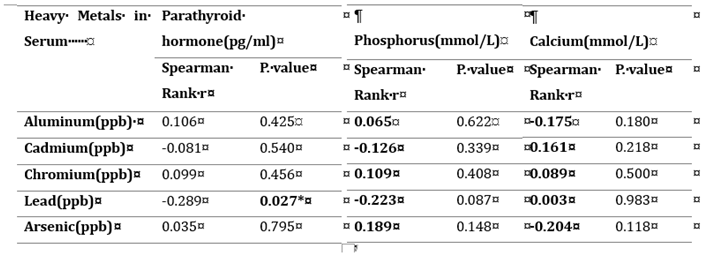 |
* Significant p-value> 0.05; SD=standard deviation; ppb= parts per billion, pg/ml = picograms per milliliter, mmol/L = Millimoles per liter.
Table 7.
Spearman rank correlation between RBC, hemoglobin, and platelets with serum heavy metals among the haemodialysis group (N=60).
Table 7.
Spearman rank correlation between RBC, hemoglobin, and platelets with serum heavy metals among the haemodialysis group (N=60).
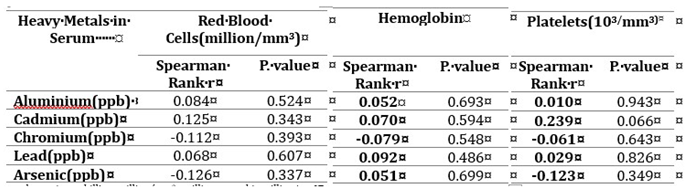 |
ppb= parts per billion, million/mm3 =million per cubic millimeters.
Table 8.
Spearman rank correlation between ferritin and heavy metals in serum among the haemodialysis group (N=60).
Table 8.
Spearman rank correlation between ferritin and heavy metals in serum among the haemodialysis group (N=60).
| Heavy Metals in Serum | Ferritin(ng/ml) | |
|---|---|---|
| Spearman Rank r | P. value | |
| Aluminum(ppb) | -0.178 | 0.182 |
| Cadmium(ppb) | -0.029 | 0.827 |
| Chromium(ppb) | -0.355 | 0.006* |
| Lead(ppb) | 0.029 | 0.831 |
| Arsenic(ppb) | 0.211 | 0.112 |
* Significant p-value > 0.05; ppb= parts per billion, ng/ml = nanograms per milliliter.
Table 9.
Concentration of heavy metals in water sample that taken from hemodialysis unit.
| Heavy metals | Normal range according to AAMI/ANSI | Concentration (ppb) |
|---|---|---|
| Aluminum | 10 Ppb | 1.82 |
| Chromium | 14 Ppb | 0.15 |
| Cadmium | 1 Ppb | 0.03 |
| Lead | 5 Ppb | 0.42 |
| Arsenic | 5 Ppb | 0.46 |
ppb= parts per billion, AAMI/ANSI = Association for the Advancement of Medical Instrumentation/ American National Standards Institute.
Table 10.
Concentration of heavy metals in the drinking water samples among the hemodialysis group.
| Groups | Aluminum (ppb) | Cadmium (ppb) | Chromium (ppb) | Lead (ppb) | Arsenic (ppb) |
|---|---|---|---|---|---|
| Mean ± SD | Mean ± SD | Mean ± SD | Mean ± SD | Mean ± SD | |
|
South Buraydah group (N=36) |
29.6±42.7 | -0.04±0.54 | 0.35±0.30 | 0.93±1.22 | 0.70±0.23 |
|
North Buraydah group (N=12) |
33.9±43.9 | -0.23±0.94 | 0.39±0.80 | 0.49±0.25 | 0.67±0.27 |
|
West Buraydah group (N=7) |
20.9±25.7 | -0.41±1.24 | 0.29±0.46 | 1.23±2.09 | 0.65±0.17 |
|
East Buraydah group (N=8) |
17.2±14.7 | 0.03±0.28 | 0.53±0.96 | 2.69±6.38 | 0.63±0.30 |
| Kruskal-Wallis test | 0.90 | 1.02 | 5.9 | 0.93 | 1.07 |
| P-value | 0.825 | 0.796 | 0.116 | 0.818 | 0.784 |
ppb= parts per billion; SD= standard deviation.
Table 11.
Method validation for determination of different heavy metals in serum samples.
| Name | Mass | Tune Mode | ISTD | R2 | Precision RSD% | Units | DL | BEC | LOD | LOQ |
|---|---|---|---|---|---|---|---|---|---|---|
| Al | 27 | He | 45Sc [He] | 0.9996 | 7.280432497 | ppb | 0.5005 | 0.8166 | 0.03107 | 0.09415 |
| Cr | 52 | He | 45Sc [He] | 0.9994 | 8.49323584 | ppb | 0.1048 | 0.0868 | 0.011061 | 0.011061 |
| As | 75 | He | 72Ge [He] | 0.9881 | 6.510971624 | ppb | 0.0929 | 0.1543 | 0.004088 | 0.012387 |
| Cd | 111 | He | 89Y [He] | 0.9998 | 14.52082453 | ppb | 0.0365 | 0.1656 | 0.001466 | 0.004443 |
| Pb | 208 | He | 209Bi [He] | 0.9996 | 0.489287076 | ppb | 0.3461 | 0.5521 | 0.018608 | 0.056389 |
He = Helium, R2 = correlation coefficients, RSD= relative standard deviation, DL = detection limits, BEC = background equivalent concentration, LOD = limit of detection, LOQ= limit of quantification.
Table 12.
Method validation for determination of different heavy metals in water samples.
| Name | Mass | Tune Mode | ISTD | R2 | Precision RSD% | Units | DL | BEC | LOD | LOQ |
|---|---|---|---|---|---|---|---|---|---|---|
| Al | 27 | He | 45Sc [He] | 0.9919 | 7.2432 | ppb | 0.2319 | 0.2295 | 0.0232 | 0.0289 |
| Cr | 52 | He | 45Sc [He] | 0.9966 | 4.4851 | ppb | 0.0783 | 0.1318 | 0.0041 | 0.0094 |
| As | 75 | He | 72Ge [He] | 0.9996 | 6.1927 | ppb | 0.0661 | 0.1107 | 0.0114 | 0.0345 |
| Cd | 111 | He | 89Y [He] | 0.9941 | 5.0982 | ppb | 4.6392 | 3.3649 | 0.0093 | 0.0282 |
| Pb | 208 | He | 209Bi [He] | 0.999 | 0.5427 | ppb | 0.0506 | 0.21 | 0.0070 | 0.0211 |
He = Helium, R2 = correlation coefficients, RSD= relative standard deviation, DL = detection limits, BEC = background equivalent concentration, LOD = limit of detection, LOQ= limit of quantification.
Table 13.
Relative standard deviation (RSD%) and average element recovery from drinking water samples.
Table 13.
Relative standard deviation (RSD%) and average element recovery from drinking water samples.
| Elements | Spik 5 ppb | Spik 10 ppb | Spik 15 ppb | |||
|---|---|---|---|---|---|---|
| Recovery % | ±RSD% | Recovery % | ±RSD% | Recovery % | ±RSD% | |
| Al | 117.3067 | 3.5519 | 112.4384 | 10.6245 | 92.2339 | 14.6239 |
| Cr | 114.3375 | 3.201 | 113.1093 | 16.4002 | 92.4376 | 7.968 |
| As | 89.5835 | 11.7724 | 109.0297 | 3.4458 | 97.0331 | 14.7269 |
| Cd | 95.3322 | 0.9896 | 100.5768 | 0.4886 | 100.1193 | 0.2477 |
| Pb | 117.1043 | 2.2061 | 106.1278 | 5.2681 | 85.8772 | 1.0119 |
ppb= parts per billion; RSD = relative standard deviation.
Table 14.
Relative standard deviation (RSD%) and average element recovery from serum samples.
| Elements | Spik 5 ppb | Spik 10 ppb | Spik 15 ppb | |||
|---|---|---|---|---|---|---|
| Recovery % | ±RSD% | Recovery % | ±RSD% | Recovery % | ±RSD% | |
| Al | 113.5116 | 1.2109 | 108.0549 | 0.8855 | 97.4791 | 1.3088 |
| Cr | 83.8930 | 2.7060 | 99.0152 | 2.1850 | 100.7660 | 4.0182 |
| As | 86.1409 | 5.2010 | 103.3337 | 5.4865 | 98.2201 | 8.9477 |
| Cd | 86.0087 | 6.8916 | 98.0248 | 0.7820 | 103.4809 | 5.9730 |
| Pb | 87.6788 | 0.4699 | 101.5059 | 0.4692 | 100.7964 | 0.3631 |
ppb= parts per billion; RSD = relative standard deviation.
Disclaimer/Publisher’s Note: The statements, opinions and data contained in all publications are solely those of the individual author(s) and contributor(s) and not of MDPI and/or the editor(s). MDPI and/or the editor(s) disclaim responsibility for any injury to people or property resulting from any ideas, methods, instructions or products referred to in the content. |
© 2025 by the authors. Licensee MDPI, Basel, Switzerland. This article is an open access article distributed under the terms and conditions of the Creative Commons Attribution (CC BY) license (https://creativecommons.org/licenses/by/4.0/).
Copyright: This open access article is published under a Creative Commons CC BY 4.0 license, which permit the free download, distribution, and reuse, provided that the author and preprint are cited in any reuse.


