
Submitted:
31 January 2025
Posted:
03 February 2025
You are already at the latest version
Abstract
The aim of the Italian Integrated Environmental Research Infrastructures System (ITINERIS) project is to establish the Italian Hub of Research Infrastructures within the environmental scientific domain. ITINERIS seeks to facilitate the observation and investigation of environmental processes across the atmosphere, marine domain, terrestrial biosphere, and geosphere. The project also endeavors to promote sustainable, cross-disciplinary research by leveraging existing data and services, emphasizing accessibility for users. The cornerstone of this initiative is the creation of the ITINERIS HUB, designed to provide users with seamless access to data and services. Notably, ITINERIS opts for the optimization and harmonization of existing data centers rather than creating new ones. The project will fortify these centers through various activities, with a particular focus on enhancing the Findable, Accessible, Interoperable, and Reusable paradigm across all participating entities. This contribution highlights the role of Laboratori Nazionali del Sud of Istituto Nazionale di Fisica Nucleare in the project. LNS is leading the Italian Ocean Sound sub-system in the contest of the marine domain of ITINERIS. An overview on the acoustic data acquisition chain and storage will be reported, with a particular insight into the use of high-sensitivity and large band-width hydrophones installed on the mooring station of LNS for real-time and long-term data capture. Hydrophones’ data are continuously transmitted to shore and analyzed. A selection of raw data and sound pressure levels in third-octave bands are calculated and stored to study the soundscape at the site.
Keywords:
ITINERIS
; ocean noise
; underwater acoustics
; Sound Pressure Level analysis
; Passive Acoustic Monitoring
1. Introduction
Sound serves as a primary sensory modality for many marine organisms due to its efficient propagation in water. Unlike light or chemical cues, acoustic signals travel long distances in aquatic environments, enabling communication, navigation, and detection of prey or predators. However, the advent of industrialization and increasing human activities in marine ecosystems has introduced significant levels of anthropogenic noise into the oceans. This “acoustic pollution” raises concerns about its biological and ecological ramifications [1]. Anthropogenic noise sources, such as shipping, seismic surveys, military sonar, and coastal construction, have been shown to interfere with the natural acoustic environment. Fish and marine mammals, which rely heavily on sound for critical life processes, are particularly vulnerable. Disruptions caused by ocean noise can lead to altered behavior, physiological stress, impaired communication, and, in severe cases, mortality.
The most pervasive contributor to underwater noise pollution is commercial shipping. Modern vessels generate continuous sound through engine vibrations, propeller cavitation, and hull movement, with most of this noise occupying low-frequency ranges that overlap with the hearing sensitivities of many marine species [2]. Long-term data indicate a significant rise in global ambient noise levels due to shipping, with increases in some regions approaching 3 dB per decade [1]. Similarly, seismic airguns used for oil and gas exploration represent another major source of anthropogenic noise. These devices emit high-intensity, low-frequency pulses capable of penetrating the seabed, with sound pressure levels often exceeding 250 dB re 1 Pa at 1 m. The signals generated by seismic surveys propagate over hundreds of kilometers, affecting marine life across vast areas [3].
Observing the short and long-term effects of noise caused by naval traffic, at the species, population, and ecosystem levels, requires large-scale, long-term monitoring (tens of years) that provides historical data series describing how ecosystems respond over time to this pressure (e.g., variations in the distribution and use of habitat for marine mammals).
At the institutional level, however, underwater anthropogenic noise is now considered a real source of pollution with impacts at both the individual and population levels. The Marine Strategy Framework Directive (MSFD) 2008/56/C includes "underwater noise produced by humans" within the definition of "pollution" (Art. 3, point 8) and lists it in the list of pressures (Descriptor 11) to be analyzed and monitored (Table 2 of Annex III) for the determination of the good ecological status of marine environments (Annex I, point 11) and the preparation of protection strategies [4]. Furthermore, the Marine Strategy Directive foresees the achievement of the "Good Environmental Status" (GES), a balance that allows marine and maritime activities to be carried out in environmentally sustainable conditions.
Efforts to mitigate the impacts of anthropogenic noise on marine life require technological innovations, regulatory measures, and adaptive management approaches. Technological advancements include the development of quieter ship designs, such as air-lubricated hulls and optimized propeller systems, which can significantly reduce noise emissions. Bubble curtains and acoustic dampeners are increasingly employed to minimize noise during seismic surveys and pile driving activities [5]. Regulatory measures, such as those implemented by the International Maritime Organization (IMO), aim to reduce underwater noise from shipping through voluntary guidelines and best practices.
Monitoring and adaptive management are critical for ensuring the effectiveness of mitigation measures. Passive Acoustic Monitoring (PAM) systems provide, among the others, real-time data on noise levels and their effects on marine life, enabling the implementation of targeted interventions. Adaptive management frameworks allow for the continuous refinement of noise mitigation strategies based on new scientific insights and environmental conditions [6]. The task of the research, therefore, is to provide data on the eco-sustainability of the level of anthropogenic noise and its periodicity, highlighting risks and vulnerabilities in terms of geographical areas, time periods, species, and ecosystems in general. The complexity of such studies, particularly regarding diffuse noise, requires an experimental approach and the use of statistical and predictive methodologies.
Acoustic receivers offer a wide range of possibilities. Due to their characteristics, they are often used passively to record data periodically or continuously. These data, if stored in raw form, can be used for a detailed post-analysis of various objects of study. It should be noted that the storage of these data can take up enormous storage space, depending on their sampling rate and number of channels. The sampling frequency will limit the frequency range that can be captured (Nyquist-Shannon sampling theorem). The directivity and sensitivity of the sensor will allow the recording of sensitive sounds. Having a single sensor allows the study of the presence/absence of noise sources of interest, and analyzes their intensity, emission time, duration, repetition rate, etc. but having an array of more than one receiver also allows studies for the location of the source. The analyses that can be made on these data are very diverse, also depending on the characteristics of noise to evaluate. So it is advisable to set at least one main objective before starting an indiscriminate recording.
The use of hydrophones as PAM sensors is common in underwater acoustics. They are usually omnidirectional and operate in a wide (and flat) frequency ranges. This has advantages over other sensors to determine the presence/absence, and even determine the origin, of many sources of noise. Given the large amount of information provided by hydrophone recordings and their various forms of analysis, the definition of certain indicators has been initiated to evaluate the main sources of noise under the sea (mostly anthropogenic) and assess its impact on the marine environment. Just as environmental acoustics began to define evaluation standards and generalizable key parameters in order to carry out real comparative studies of noise levels and acoustic maps, underwater acoustics is trying to reach a similar consensus with their use, and a first start has been made by the Global Ocean Observing System (GOOS) [7] which, among other things, take into account the acoustics in its Essential Ocean Variables (EOV). These EOVs are vital for various oceanographic studies and play a good role in assessing the health of marine ecosystems, understanding weather patterns, and studying ocean dynamics. Having a good set of parameters defined for monitoring certain noise sources of interest can be a great advance in underwater acoustics. If these levels are agreed upon and well defined, dedicated offshore stations will be able to process their raw data, calculate these EOVs and discard the raw data, thus freeing up a lot of storage space.
In this contest the Italian Integrated Environmental Research Infrastructures System (ITINERIS) project [8], funded under Italy’s National Recovery and Resilience Plan (PNRR), aims to establish a dynamic system that, for the first time, integrates ocean data and metadata into a unified national framework to facilitate the discovery and access to marine data and data products. This system will ensure data are traceable, accessible, interoperable, and reusable, adhering to the FAIR principles [9], to serve the entire scientific community. The ITalian Integrated Ocean Observing System (IT-IOOS) is one of the eight domain-specific projects inside ITINERIS and will set up for the first time at national level an integrated system sharing standard procedures, established guidelines and common tools for harvesting, collecting, analyzing and make public ocean sound data following the up-to-date best practice for ocean sound data. Once online the IT-IOOS will runs operational services that provide ocean physics data and data products built with common standards, free of charge and without restrictions.
2. The Italian Integrated Ocean Observing System
The main purpose of the IT-IOOS is to expand the accessibility and usability of acoustic data in marine environment for multiple applications, like monitoring acoustic pollution, search for soniferous marine species, and studying anthropogenic noise sources and geological events like earthquakes. In recent years, indeed, the attention of the marine science community into the ocean sound has dramatically increased. Ocean sound monitoring provides information of paramount importance for safety, security and surveillance, disaster prevention, marine spatial planning, Ocean GES, and climate change. Therefore, it has been recognized mandatory to add the ocean sound in the list of environmental variables to characterize the environmental status of the sea.
Despite several attempts at international scale the community still lacks a shared protocol and best practice to harvest, analyze and expose ocean sound data. Recommendation on ocean sound measurement strategies and its implementation plans have been provided in the context of the EU MSFD and several initiatives guided by Joint Programming Initiative Healty and Productive Seas and Oceans (JPI Oceans) [4]. Moreover, complete recording of the soundscape of a marine area requires a sizable effort in terms of data streaming/storing capabilities considering a typical data transmission rate of 6.2 Mbps for a single hydrophone with a data sampling of 24bits/192 kHz. Identification of sources requires, in addition, the use of phased arrays (i.e. time synchronized) of hydrophones properly distributed in space. Unfortunately, the large variability and inhomogeneity in data harvesting/collection strategies (sensor characteristics, depth, location, calibration, sampling frequency, duration of acquisitions, duration of experiments) together with lack of common patterns for data analysis (definition of physical quantity, common/shared algorithms) and shared metadata format turns out in a major difficulty to implement a shared system at national and international level.
The IT-IOOS attempts for the first time to set a common platform for ocean sound data monitoring and sharing. This effort will also define and share a set of recommendation and best practice for ocean sound data collection, analysis and sharing among all the Research Infrastructures (RIs) which operate acoustic devices in Italian seas. To uphold data fairness, each dataset generated by the different research infrastructures of ITINERIS will be paired with a corresponding metadata set. Metadata are essential as they provide the contextual framework necessary to interpret the primary data, detailing aspects such as the time, location, and methodologies of data collection. This contextual information is vital for ensuring the reproducibility of scientific results, and represents a cornerstone of scientific progress. Without metadata, validating findings or building on previous work becomes challenging. Moreover, metadata are crucial for harmonizing and comparing datasets from diverse studies, particularly in environmental and oceanographic research, where data often originate from different sources using varied methods. Metadata align these datasets, enabling meaningful comparisons and integrated analyses. They are also indispensable for the long-term preservation and usability of data, ensuring that future researchers can access and understand the information even as technologies and personnel change over time.
Drawing on extensive expertise in deep-sea acoustic systems and data analysis, the Laboratori Nazionali del Sud (LNS) of the Istituto Nazionale di Fisica Nucleare (INFN) is leveraging its role within the ITINERIS project and the IT-IOOS to advance interdisciplinary research in environmental sciences. Indeed, the role of INFN-LNS is twofold: design and deploy a new underwater Junction Box (JB) at the infrastructure located in Portopalo di Capo Passero, Sicily, at a depth of approximately 3450 m, and develop a flexible, integrated national system for the collection and storage of ocean acoustic data and metadata, ensuring these are accessible, traceable, interoperable, and reusable according to the FAIR principles [9]. The LNS has already developed and successfully operates a network of three prototype JBs at this depth. Each JB supports the connection of over 10 observatories to the mainland and includes acoustic sensors. These sensors enable the construction of a phased array on the seafloor, allowing for the efficient collection, storage, and near real-time analysis of acoustic data. This acoustic network primarily supports bio-acoustics, geophysics, and ship noise monitoring. Additionally, the data contribute to the positioning system of the KM3NeT Neutrino Telescope [10] research infrastructure and advance research in acoustic neutrino detection.
3. The Capo Passero INFN Infrastructure
The Capo Passero site (Figure 1), managed by INFN - LNS, is a cabled subsea multipurpose undersea infrastructure serving several experiments and projects. It hosts a phased array of hydrophones deployed on the seafloor (3450 m average water depth), at 100 km Southeast of Capo Passero (Sicily). From the harbor of Portopalo, two Main Electro-Optical Cables (MEOCs) are laid. The 2 MEOCs, each approximately 100 km long, are used for power and data transport for the operation of the observatories deployed in the deep sea.
Each cable is terminated with a Cable Termination Frame (CTF) that relates to a network of special subsea assets (the so-called Junction Boxes - JBs, Figure 2) capable to provide high reliability/high-availability/high-speed data link and uninterruptible power supply to multiparametric deep-sea observatories, with demanding time-synchronization capabilities and data payloads and transfer rates. Three JBs are connected to MEOC-1; six additional JBs will be connected to MEOC-2. Each JB acts as a hub, providing power and data connection for oceanographic probes and for (up to) 14 observatories connected to the JB via electro optical jumper cables. For acoustic monitoring purposes each JB hosts (at least) 1 hydrophone. The latter (DG0330 from co.l.mar.) is omnidirectional, operates from few Hz up to about 90 kHz frequencies range, and has two output channels. The same input signal from the piezoceramic of the hydrophone is addressed to two different amplifiers: the first one has a gain of +26 dB, while the other one has a gain of +46 dB. These gains are used to study distant/weak and close/strong sources, thus avoiding signal saturation. Their Received Voltage Response (RVR) is approximately -156 dB (re 1 V/Pa at 1 m) in the high-gain channel. The two streams are sampled by a stereo 24-bit ADC (CS-4270) and converted into standard consumer AES3/EBU (Audio Engineering Society/ European Broadcasting Union) protocol using a DIT (Digital Interface Transmitter). Each JB is equipped with a custom Instrumentation Control Electronics (ICE) board, designed by INFN that acquires the audio stream and route it to shore embedded in the JB optical stream. On land, the data are stored and distributed to analysis stations. Data can be dispatched either in native AES/EBU format (that permit easy interfacing with standard acoustic libraries and software) or in any other format that allows conservation of acoustic information (24 bits/channel, 195 kHz sampling frequency, absolute time header).
Furthermore, the main storage system at INFN - LNS is then constantly accessed from an ERDDAP (Environmental Research Division’s Data Access Program [11]) server that acts as an interface between local data and the ITINERIS Marine Data Store [8]. ERDDAP is a web-based data server that allows users to access, visualize, and download a wide range of oceanographic and other environmental data. ERDDAP provides a unified interface for searching and retrieving data in various formats, such as CSV, NetCDF, and JSON, and supports multiple types of data, including time series, gridded data, and trajectory data. This versatility makes it a powerful tool for researchers and scientists who need to work with diverse datasets.
One of the key features of ERDDAP is its ability to generate visual representations of the data, such as time series plots, maps, and heatmaps. These visualizations help users quickly understand the spatial and temporal patterns in the data. Additionally, ERDDAP supports the creation of custom data subsets, allowing users to download only the specific data they need for their analyses.
To facilitate the sharing and collaboration of oceanographic data, ERDDAP servers can be accessed remotely via the internet, making it easy for researchers from different institutions and locations to access and share data. This open access to data promotes transparency and collaboration in the scientific community, enabling researchers to build on each other’s work and advance our understanding of the oceans. ERDDAP is widely used in the oceanographic community to share data from various sources, such as satellite observations, buoy measurements, and model outputs. By providing a standardized and user-friendly interface, ERDDAP simplifies the process of accessing and working with complex oceanographic data, making it an essential tool for modern oceanographic research.
4. Analysis Strategy
Noise data are generally represented in the frequency domain, although occasionally a time-domain waveform of a transient event will be displayed. It is recommended that ambient noise data be displayed at minimum in third-octave bands [4]. This simplifies the data and is appropriate for most considerations of environmental impact. However, where narrow-band features exist in the data (such as tonal components from specific sources), narrow-band analysis may be required to illustrate these features (tonal components will not be apparent in third-octave band analysis).
To illustrate the temporal variation in frequency content for a time-varying signal, a time-frequency representation is recommended, such as a spectrogram or waterfall plot [12]. In a spectrogram, the spectral levels are represented using a color mapping, with time and frequency on the horizontal and vertical axes and a clearly defined color scale. Care must be taken when interpreting spectrograms. A choice must be made on the filter bandwidth to be used: wide-band spectrograms provide high time resolution, and narrow-band spectrograms give high frequency resolution. There is a time-bandwidth trade-off which means that emphasizing one loses definition of the other. The optimum choice depends on the type of sound and the information that is required from the spectrogram. For example, a narrow filter bandwidth used with repeated pulses can smear them and give a series of frequency striations so that the repetitive nature of the sounds is lost. When referring to the primary frequency of harmonic sounds, it is important to state whether the frequency is that of the lowest harmonic (the fundamental), or the strongest harmonic (the highest amplitude), or the repetition frequency. It is most common for noise signals to be represented in the frequency domain as noise spectral levels plotted as a function of frequency. The data for ambient noise is usually expressed as spectral density levels, where the data in each frequency band has been normalized by dividing by the bandwidth of the frequency band. The units of the levels in each band, in case of calibrated data, are then dB re 1 Pa2/Hz.
A widely used EOV for expressing ambient noise is the so-called Sound Pressure Level (SPL) [12,13]. When analyzing noise, it is necessary to average the measured data. This is because the instantaneous values of the sound pressure fluctuate continually, and any snapshot at a specific instant in time cannot represent the statistical variation in the values. When averaging noise, it is necessary first to square the data (since sound pressure has both positive and negative excursions, the unsquared data will tend to average to zero). Therefore, the noise values are most often stated as mean square values or in terms of Root Mean Square (RMS) values. To undertake data averaging, the measured data are divided into analysis time windows, or “snapshots”. For each snapshot time sequence, the SPL is then calculated at each frequency of analysis (typically, for each third-octave band). This will result in a sequence of SPL data for each frequency band, and these data are then processed to provide averaged levels and the statistical variation of the data. The choice of snapshot time will depend on the nature of the available data. The processing into third-octave bands is often accomplished with digital filters or with Fast Fourier Transform (FFT) processing, and for an accurate representation of third-octave band levels at low frequencies, a long snapshot time is required (sufficient accuracy at 10 Hz requires a snapshot time of at least 30 s).
In the case reported here, a selection of raw data and SPLs in third-octave frequency bands are calculated and stored to study the soundscape at the site. In particular from the continuous data stream of JBs in position 1, 4 and 5 (see Figure 1), SPL and Power Spectral Density (PSD) provide statistics of how noise level varies for each frequency or frequency band in a large sample. They are used as input data for algorithms that estimate what sounds have been produced, i.e., by vocal animals/cetaceans or by anthropogenic activities.
Taking into account all of the above, this permits the study of many indicators in line with those described by the MSFD. First of all, the mean value should be calculated, together with the 25th, 50th, 75th and 95th percentiles of SPL. These values should be calculated for third-octave bands comprising 63 and 125 Hz minimum (mainly cargo ship noise with Automatic Identification System (AIS) information), and if possible supplemented with those for 1, 2, 5, and 20 kHz [14,15]. Data from JBs are acquired continuously by saving 5 min-long raw data each 5 min files from each hydrophone. This process is performed at the Ground terminal facility counting rooms, that is the Capo Passero harbor INFN - LNS shore station. Custom data acquisition systems are used to retrieve acoustic data stream in the shore station data center and, therefore, to parse data to dedicated computing services (see the following sections). Hardware and software tools developed by INFN - LNS and services are in place to fully control the subsea observatory from remote and change data acquisition settings. Access to onshore and subsea data acquisition services is allowed only though the INFN - LNS Virtual Private Network (VPN). Sampling frequency for each hydrophone is 195.3 kHz, with 24-bit depth. Raw data format is a customization of consumer AES3 format. Data analysis is performed at the INFN - LNS computing control at the INFN - LNS main laboratory (Catania) where all recorded raw data files are copied into a dedicated storage and server facility. Raw data copy from cabled observatories is performed by a synchronized secure copy protocol process from the ground terminal (details in the following sections). Data from JB hydrophones are dumped to a temporary storage (buffer storage system in the following) controlled by a Virtual Machine (VM) that has also the duty to check audio data integrity of recording date and time, check of audio data format, and check of missing data chunks. Once the data flow passes the checks, a second VM performs the analysis in the so-called Near-Real time (NRT) regime. At this stage, the dumped raw file in binary format are converted in Hierarchical Data Format (HDF5) with a 6x compression factor to save disk space (i.e., 5-min raw recording stores about 225 MB of disk space with a 24-bit depth at 195.3 kHz sampling frequency). During this process also a set of metadata will be created and attached to the header of the raw file. The second step of analysis is the calculation of the SPL Ocean Sound EOV. According to the best practice suggested from the ITINERIS community for the SPL calculation, the latter should be at least calculated for octave thirds comprising 63 and 125 Hz frequency bands. Finally, the mean value of SPL is calculated together with the 25th, 50th, 75th and 95th percentile at 5 min. The analysis chain ends with the data transfer of all the output (raw and analyzed) to a permanent storage (main storage system in the following) located in the INFN – LNS data center. Due to large size of raw data files and continuous data acquisition, only a part of acoustic data is stored in digital memories at data center facility, i.e., only 1 raw data/metadata HDF5 file/hour (6 GB/day) is stored permanently for check and minimum bias analyses. The rest of the raw data is erased on a week base, after being analyzed. For elaborated data and products, all data and metadata are stored in HDF5 format being their disk occupancy negligible (6 MB/file) with respect to the raw ones. INFN - LNS uses RAID storage system to increase the lifespan of the data.
5. Discussion and Conclusions
Sound pressure is one of the two main variables for the Ocean Sound EOV. Indeed, it propagates through water as compressions and expansions and can be recorded, both actively or passively, by using underwater hydrophones [13]. This can answer questions about how SPL contributes to soundscapes and the distance of sound sources. Hydrophones convert acoustic pressure into an electrical signal that can be further amplified, filtered and digitized by the electronics systems. If the hydrophone is omnidirectional and calibrated, its output can be expressed in terms of SI units of pressure (Pa) as a function of the frequency. Trends in ocean sound depend on the frequency band of observed sound, so a proper selection of the latter becomes of crucial importance for specific ocean acoustic observation. For example, sounds at frequencies below a few hundred Hz can propagate with little loss in deep oceans. Fin whales (Balaenoptera physalus), for instance, utilize these frequencies for communication that can be detected hundreds of kilometers away [16]. Conversely, low-frequency sounds from ships propagate equally well, thereby masking the sounds produced by whale communications [17]. Indeed, ODE [18] and ODE-2 [19] projects established, in the recent past, a data library comprising more than 2000 h of recordings. This library serves as a tool for modeling underwater acoustic noise at great depths, characterizing its variations based on environmental parameters, biological sources, and human activities, and determining the presence of cetaceans in the test area [20,21].
In this respect, the analysis strategy proposed within the framework of the ITINERIS project was conceived as an advanced and unique (in the pan-European context) monitoring tool for noise levels in underwater environments. Here, ocean sounds are recorded from large bandwidth hydrophones installed on the site for real-time and long-term data capture. Indeed, according to the European MSFD, studying the SPL in third-octave bands is essential for monitoring the ecological status and the impact of anthropogenic noise on marine mammals and animals in oceanic environments. In this context, LNS, within the ITINERIS project, contributes to the establishment of a national database for cataloging and validating the acoustic data recorded by the various research infrastructures partnering in the project. The quality of data, especially metadata, is of great importance as it will directly influence result management and, particularly, analyses that need to be comparable and repeatable across different RIs. For this reason, a common strategy is being developed among the involved entities to establish, at the national level and for the first time, a common standard for the type and format of result sharing. Since the analysis is primarily conducted at the local level, data management rules will ensure uniformity and universality of processing. Each recording are therefore accompanied by a set of metadata written in a common format for all RIs, enabling analysis by all partners even years later.
Figure 3 shows, as an example, five-minute spectrograms in third-octave bands recorded on January 04, 2025 (05:55 UTC) from the three different hydrophones onboard of JB1, JB4 and JB5 of the network in the Capo Passero site (Figure 1). Depending on the type of the performed analysis, the digital filter applied can vary from time to time. In this case an FFT of 216 points and a 50% overlap Hamming window was applied. This translates in a time resolution of about 0.3 s and a frequency resolution of about 3 Hz with a sampling frequency of 195.3 kHz. Several types of high-frequency signals can be identified: they are mainly a time-varying signature from acoustic emitters, positioned on the seabed of the site, captured by the JB hydrophone, at frequencies in the range of 20 kHz - 40 kHz. Those emitters are autonomous acoustic beacons used to triangulate the positions of the observatories on the seafloor. At lower frequencies, the third-octave bands at 63 Hz and 125 Hz show characteristic diffuse noise from maritime traffic.
Finally, by storing and sharing data and metadata via the ERDDAP server installed at the LNS-INFN data centre infrastructure, long-terms analysis can be also performed.
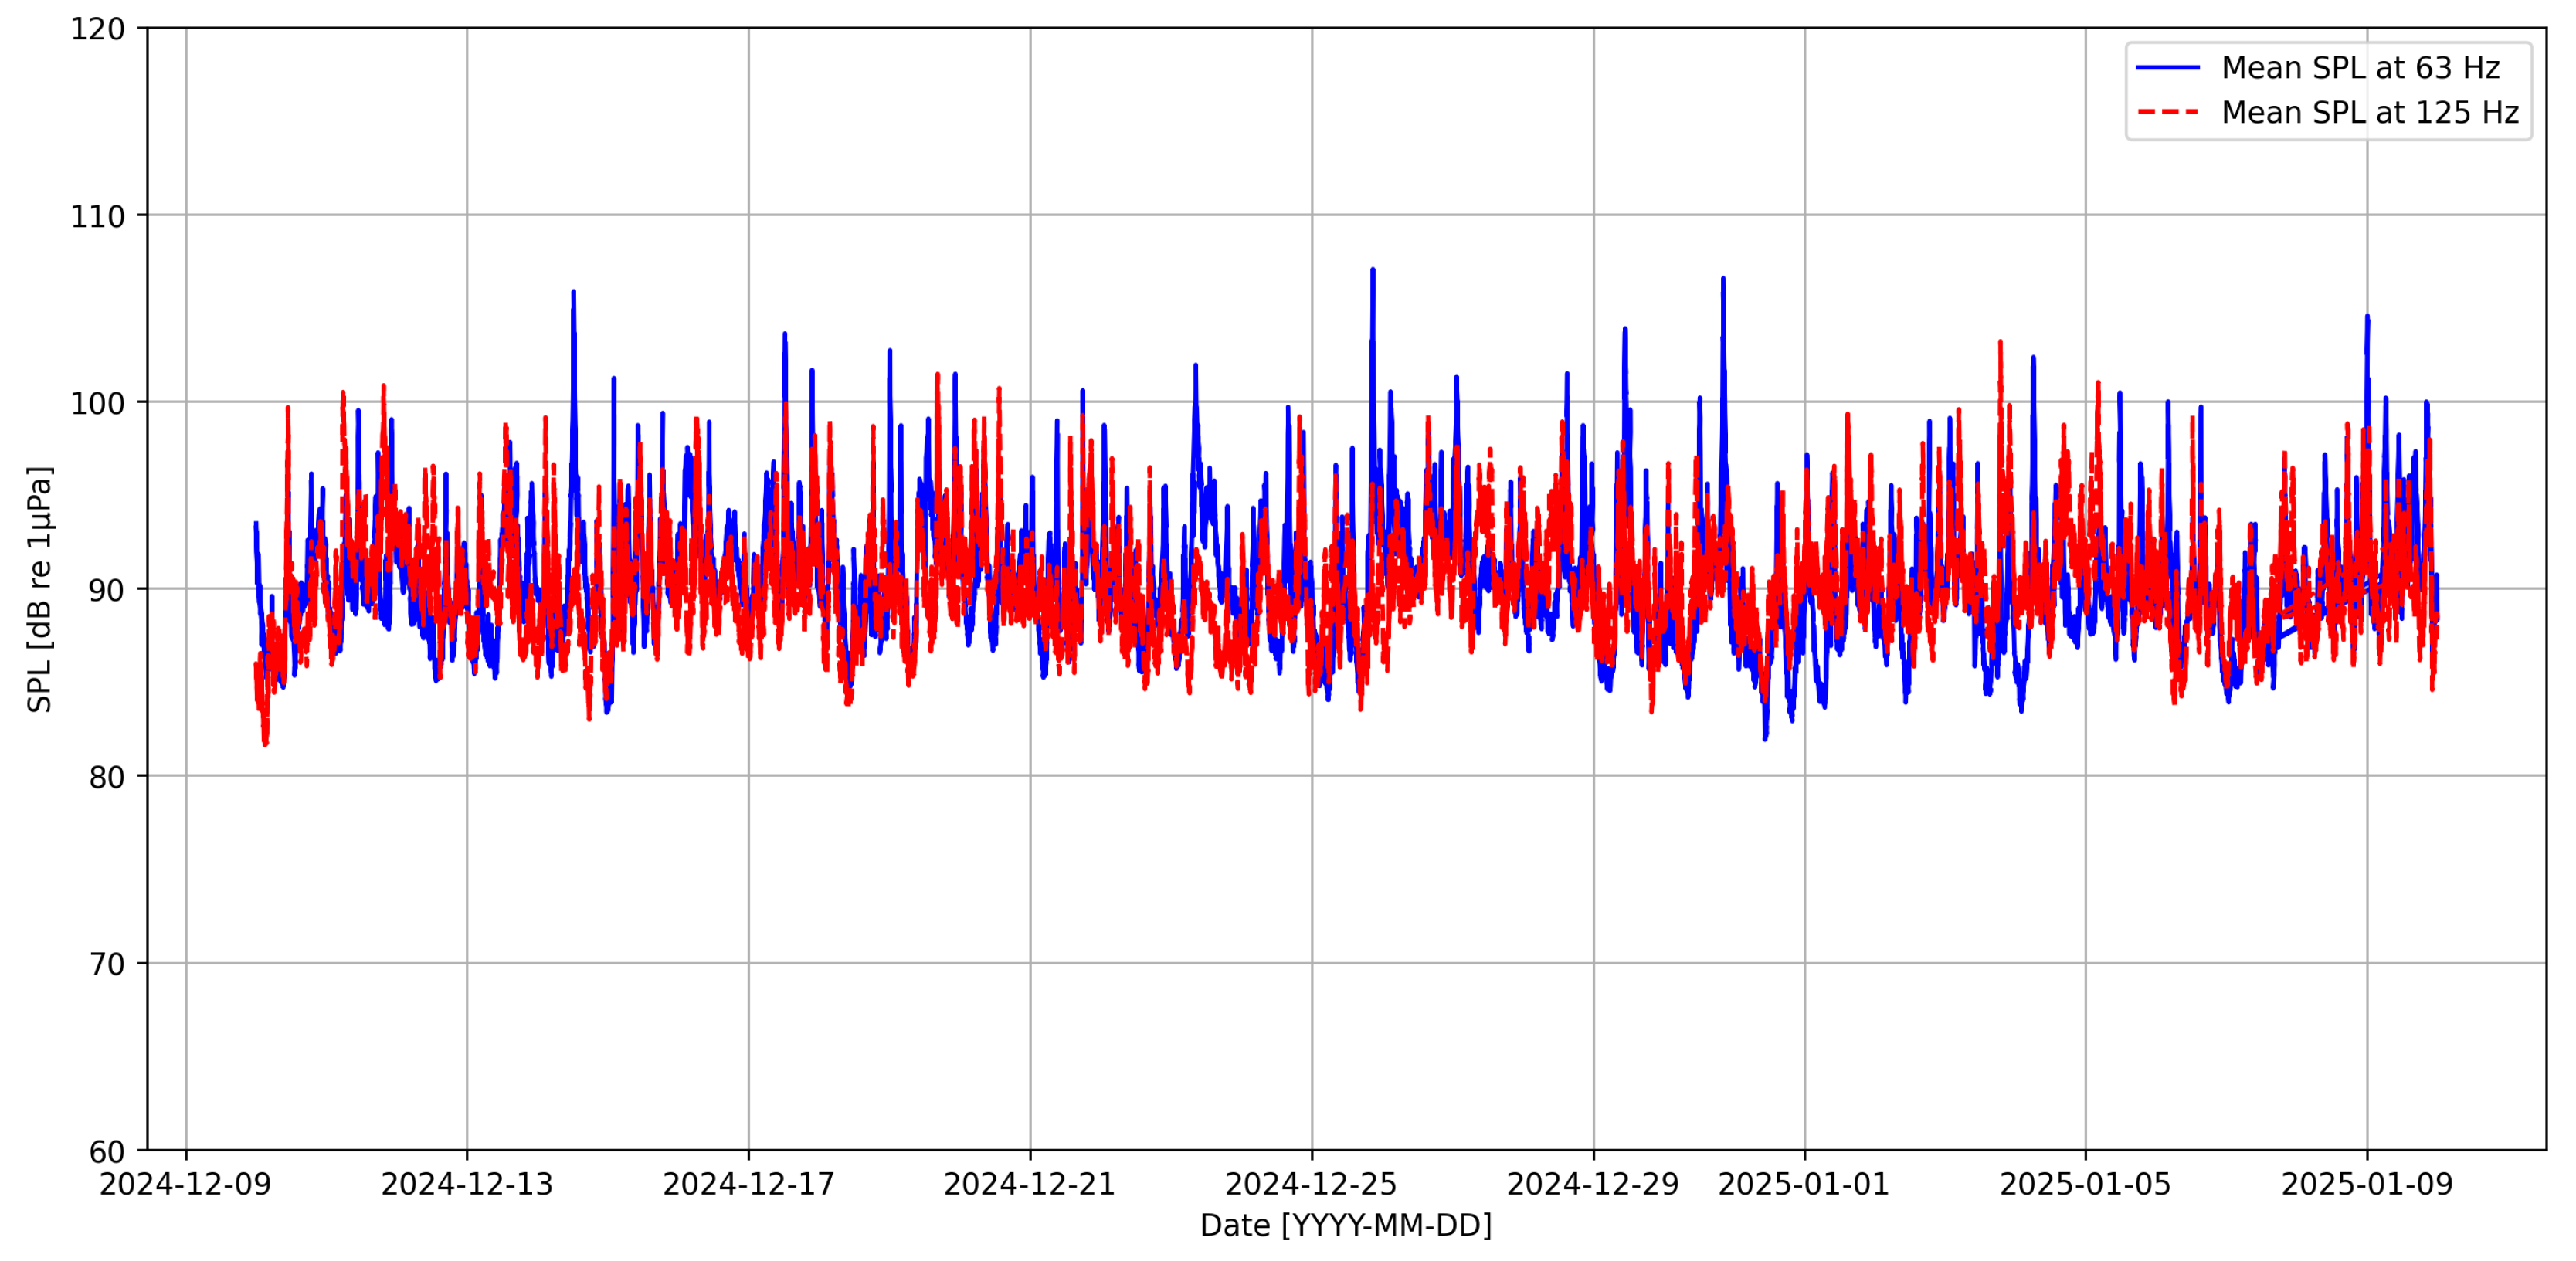
Figure 4 shows a long-range SPL monitoring spectrum took from the hydrophone in JB1 in the two third-octave frequency bands of 63 Hz and 125 Hz. It shows, over a period of about 30 days, the mean value of the sound pressure level in the frequency range used to monitor the soundscape of the site as suggested by the MSFD. SPL values are compatible with the tracks of several ships in the area.
Acknowledgments
The work presented here has been funded by the European Union – NexGenerationEU and by Ministero dell’Università e della Ricerca of Italian Government in the context of Avviso pubblico per la presentazione di proposte progettuali Decreto Direttoriale n. 3264 del 28/12/2021, PNRR MUR, Missione 4, “Istruzione e Ricerca” – Componente 2, “Dalla ricerca all’impresa”, Linea di investimento 3.1, “Fondo per la realizzazione di un sistema integrato di infrastrutture di ricerca e innovazione”, con Decreto D.D. n 130 del 21/06/2022. Progetto Codice IR0000032, “ITINERIS – Italian Integrated Environmental Research Infrastructures System”, CUP B53C22002150006.
Conflicts of Interest
The authors declare no conflicts of interest.
References
- Andrew, R.K.; Howe, B.M.; Mercer, J.A.; Dzieciuch, M.A. Ocean ambient sound: Comparing the 1960s with the 1990s for a receiver off the California coast. Acoust. Res. Lett. Online 2002, 3, 65–70. [CrossRef]
- McDonald, M.A.; Hildebrand, J.A.; Wiggins, S.M. Increases in deep ocean ambient noise in the Northeast Pacific west of San Nicolas Island, California. J. Acoust. Soc. Am. 2006, 120, 711–718. [CrossRef]
- McCauley, R.D.; Fewtrell, J.; Duncan, A.J.; Jenner, C.; Jenner, M.N.; Penrose, J.D.; Prince, R.I.T.; Adhitya, A.; Murdoch, J.; McCabe, K. Marine seismic surveys: Analysis of airgun signals; and effects of air gun exposure on humpback whales, sea turtles, fishes and squid. Rep. from Centre for Marine Science and Technology, Curtin Univ., Perth, WA, for Austral. Petrol. Prod. Assoc., Sydney, NSW 2000, pp. 8–5.
- Parliament, E.; of the European Union, C. Directive 2008/56/EC of the European Parliament and of the Council of 17 June 2008 establishing a framework for community action in the field of marine environmental policy (Marine Strategy Framework Directive). Off. J. Eur. Union 2008, L164, 19-40.
- Erbe, C.; others. Reducing underwater noise: State of the art and recommendations. Mar. Pollut. Bull. 2019, 139, 459–485. [CrossRef]
- Van Parijs, S.M.; others. Management and research applications of real-time and archival passive acoustic sensors over varying temporal and spatial scales. Mar. Ecol. Prog. Ser. 2009, 395, 21–36. [CrossRef]
- Global Ocean Observing System. Global Ocean Observing System Implementation Plan, 2012. Available at: https://www.goosocean.org.
- Collaboration, I. Italian Integrated Environmental Research Infrastructures System, 2022.
- for Life Sciences, D.T. FAIR Data Knowledge & Expertise, 2024.
- Adrián-Martínez, S.; Ageron, M.; Aharonian, F.; Aiello, S.; Albert, A.; Ameli, F.; Anassontzis, E.; Andre, M.; Androulakis, G.; Anghinolfi, M.; et al. Letter of intent for KM3NeT 2.0. J. Phys. G: Nucl. Part. Phys. 2016, 43, 084001. [CrossRef]
- NOAA ERDDAP. ERDDAP - Environmental Research Division Data Access Program. https://coastwatch.pfeg.noaa.gov/erddap/.
- Diego-Tortosa, D.; Bonanno, D.; Bou-Cabo, M.; Mauro, L.S.D.; Idrissi, A.; Lara, G.; Riccobene, G.; Sanfilippo, S.; Viola, S. Effective Strategies for Automatic Analysis of Acoustic Signals in Long-Term Monitoring, 2025. In press. Submitted for this Special Issue "Marine Environmental Noise" in Journal of Marine Science and Engineering.
- Jones, C.D.; Marten, K. Underwater Noise: Guidance for Assessing Impacts and Mitigation. https://tethys.pnnl.gov/sites/default/files/publications/gpg133underwater.pdf, 2016.
- Dekeling, R.; Tasker, M.; Van der Graaf, S.; Ainslie, M.; Andersson, M.; André, M.; Borsani, J.; Brensing, K.; Castellote, M.; Cronin, D.; Dalen, J.; Folegot, T.; Leaper, R.; Pajala, J.; Redman, P.; Robinson, S.; Sigray, P.; Sutton, G.; Thomsen, F.; Werner, S.; Wittekind, D.; Young, J. Monitoring Guidance for Underwater Noise in European Seas – Part I: Executive Summary; Number JRC88733 in EUR 26557, Publications Office of the European Union: Luxembourg, 2014. [CrossRef]
- Dekeling, R.; Tasker, M.; Van der Graaf, S.; Ainslie, M.; Andersson, M.; André, M.; Borsani, J.; Brensing, K.; Castellote, M.; Cronin, D.; Dalen, J.; Folegot, T.; Leaper, R.; Pajala, J.; Redman, P.; Robinson, S.; Sigray, P.; Sutton, G.; Thomsen, F.; Werner, S.; Wittekind, D.; Young, J. Monitoring Guidance for Underwater Noise in European Seas – Part II: Monitoring Guidance Specifications; Number JRC88045 in EUR 26555, Publications Office of the European Union: Luxembourg, 2014. [CrossRef]
- Sciacca, V.; Viola, S.; Pulvirenti, S.; Riccobene, G.; Caruso, F.; De Domenico, E.; Pavan, G. Shipping noise and seismic airgun surveys in the Ionian Sea: Potential impact on Mediterranean fin whale. Proceedings of Meetings on Acoustics. AIP Publishing, 2016, Vol. 27. [CrossRef]
- Viola, S.; Grammauta, R.; Sciacca, V.; Bellia, G.; Beranzoli, L.; Buscaino, G.; Caruso, F.; Chierici, F.; Cuttone, G.; D’Amico, A.; others. Continuous monitoring of noise levels in the Gulf of Catania (Ionian Sea). Study of correlation with ship traffic. Mar. Pollut. Bull. 2017, 121, 97–103. [CrossRef]
- Riccobene, G.; others. Long-term measurements of acoustic background noise in very deep sea. Nuclear Instruments and Methods in Physics Research Section A: Accelerators, Spectrometers, Detectors and Associated Equipment 2009, 604, S149–S157. ARENA 2008, . [CrossRef]
- Viola, S.; Ardid, M.; Bertin, V.; Enzenhöfer, A.; Keller, P.; Lahmann, R.; Larosa, G.; Llorens, C.D. NEMO-SMO acoustic array: A deep-sea test of a novel acoustic positioning system for a km3-scale underwater neutrino telescope. Nuclear Instruments and Methods in Physics Research Section A: Accelerators, Spectrometers, Detectors and Associated Equipment 2013, 725, 207–210. [CrossRef]
- Caruso, F.; Sciacca, V.; Bellia, G.; De Domenico, E.; Larosa, G.; Papale, E.; Pellegrino, C.; Pulvirenti, S.; Riccobene, G.; Simeone, F.; Speziale, F.; Viola, S.; Pavan, G. Size Distribution of Sperm Whales Acoustically Identified during Long Term Deep-Sea Monitoring in the Ionian Sea. PLoS ONE 2015, 10, 1–16. [CrossRef]
- Sciacca, V.; Caruso, F.; Beranzoli, L.; Chierici, F.; De Domenico, E.; Embriaco, D.; Favali, P.; Giovanetti, G.; Larosa, G.; Marinaro, G.; Papale, E.; Pavan, G.; Pellegrino, C.; Pulvirenti, S.; Simeone, F.; Viola, S.; Riccobene, G. Annual Acoustic Presence of Fin Whale (Balaenoptera physalus) Offshore Eastern Sicily, Central Mediterranean Sea. PLoS ONE 2015, 10, 1–18. [CrossRef]
Figure 1.
Left: a bathymetric map of the southeastern coast of Sicily, showing depth contour lines (isolines) that represent the underwater topography of the Ionian Sea. The map combines satellite imagery with bathymetric data, highlighting the morphology of the seabed. It also marks the location of INFN - LNS Portopalo di Capo Passero site and indicates the route of the two MEOCs detailed in the text. Right: a layout of the subsea network and deep sea assets from the same site. Here the JBs assets are represented as colored rectangular shapes (courtesy of KM3NeT Collaboration [10]).
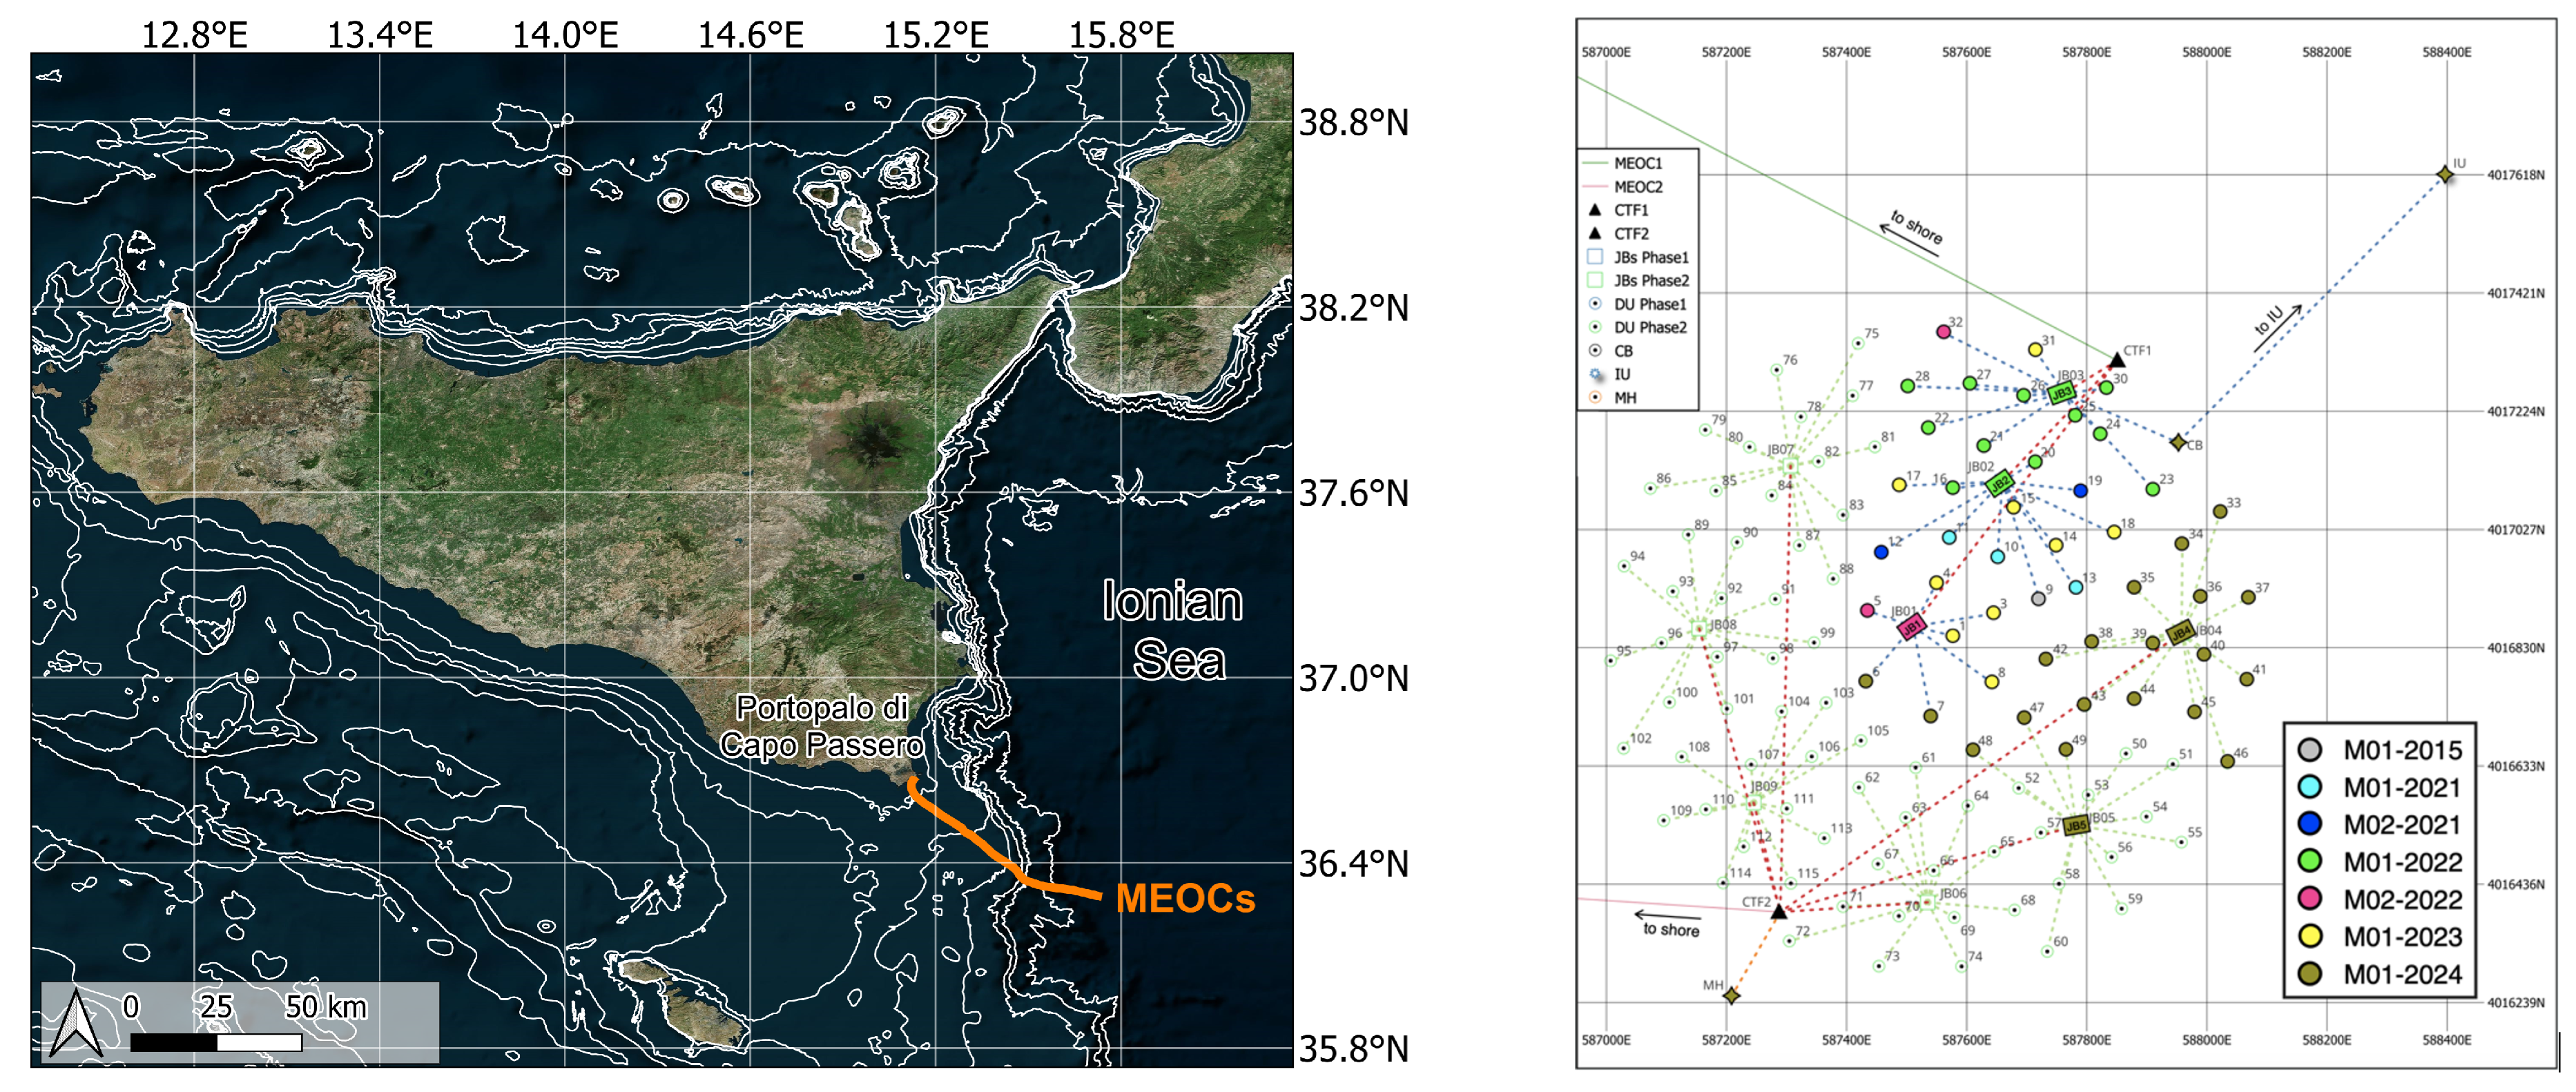
Figure 2.
Picture of two Junction Boxes subsea assets in the assembly hall (on the left), and during the deployment campaign on the seafloor of the Portopalo site after the connection with the observatories (right).
Figure 2.
Picture of two Junction Boxes subsea assets in the assembly hall (on the left), and during the deployment campaign on the seafloor of the Portopalo site after the connection with the observatories (right).
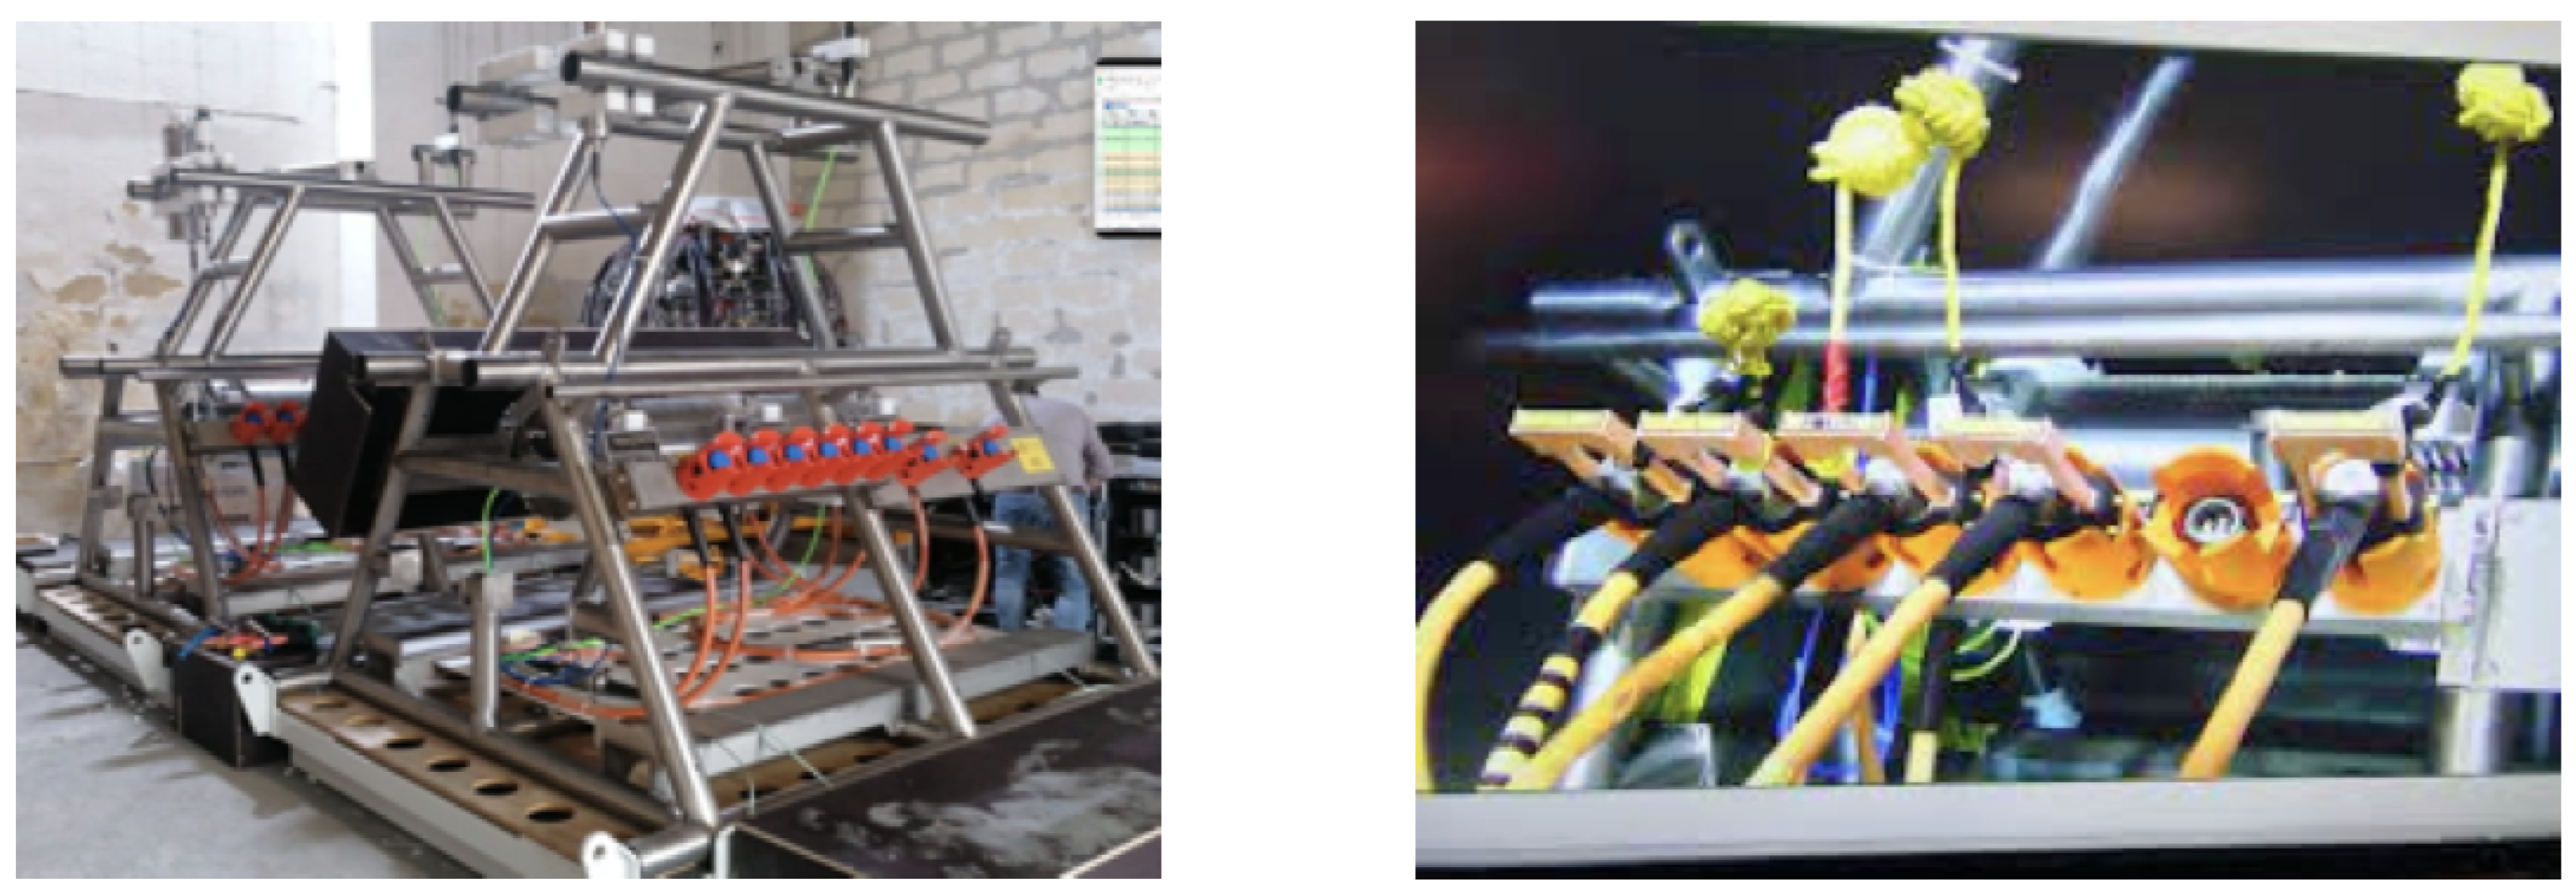
Figure 3.
Spectrograms in third-octave bands obtained from 5 min of acoustic recordings from the ITINERIS site on January 04, 2025 (05:55 a.m. UTC) from hydrophones on board of JB1, JB4 and JB5 (upper left clockwise). Details in the text.
Figure 3.
Spectrograms in third-octave bands obtained from 5 min of acoustic recordings from the ITINERIS site on January 04, 2025 (05:55 a.m. UTC) from hydrophones on board of JB1, JB4 and JB5 (upper left clockwise). Details in the text.
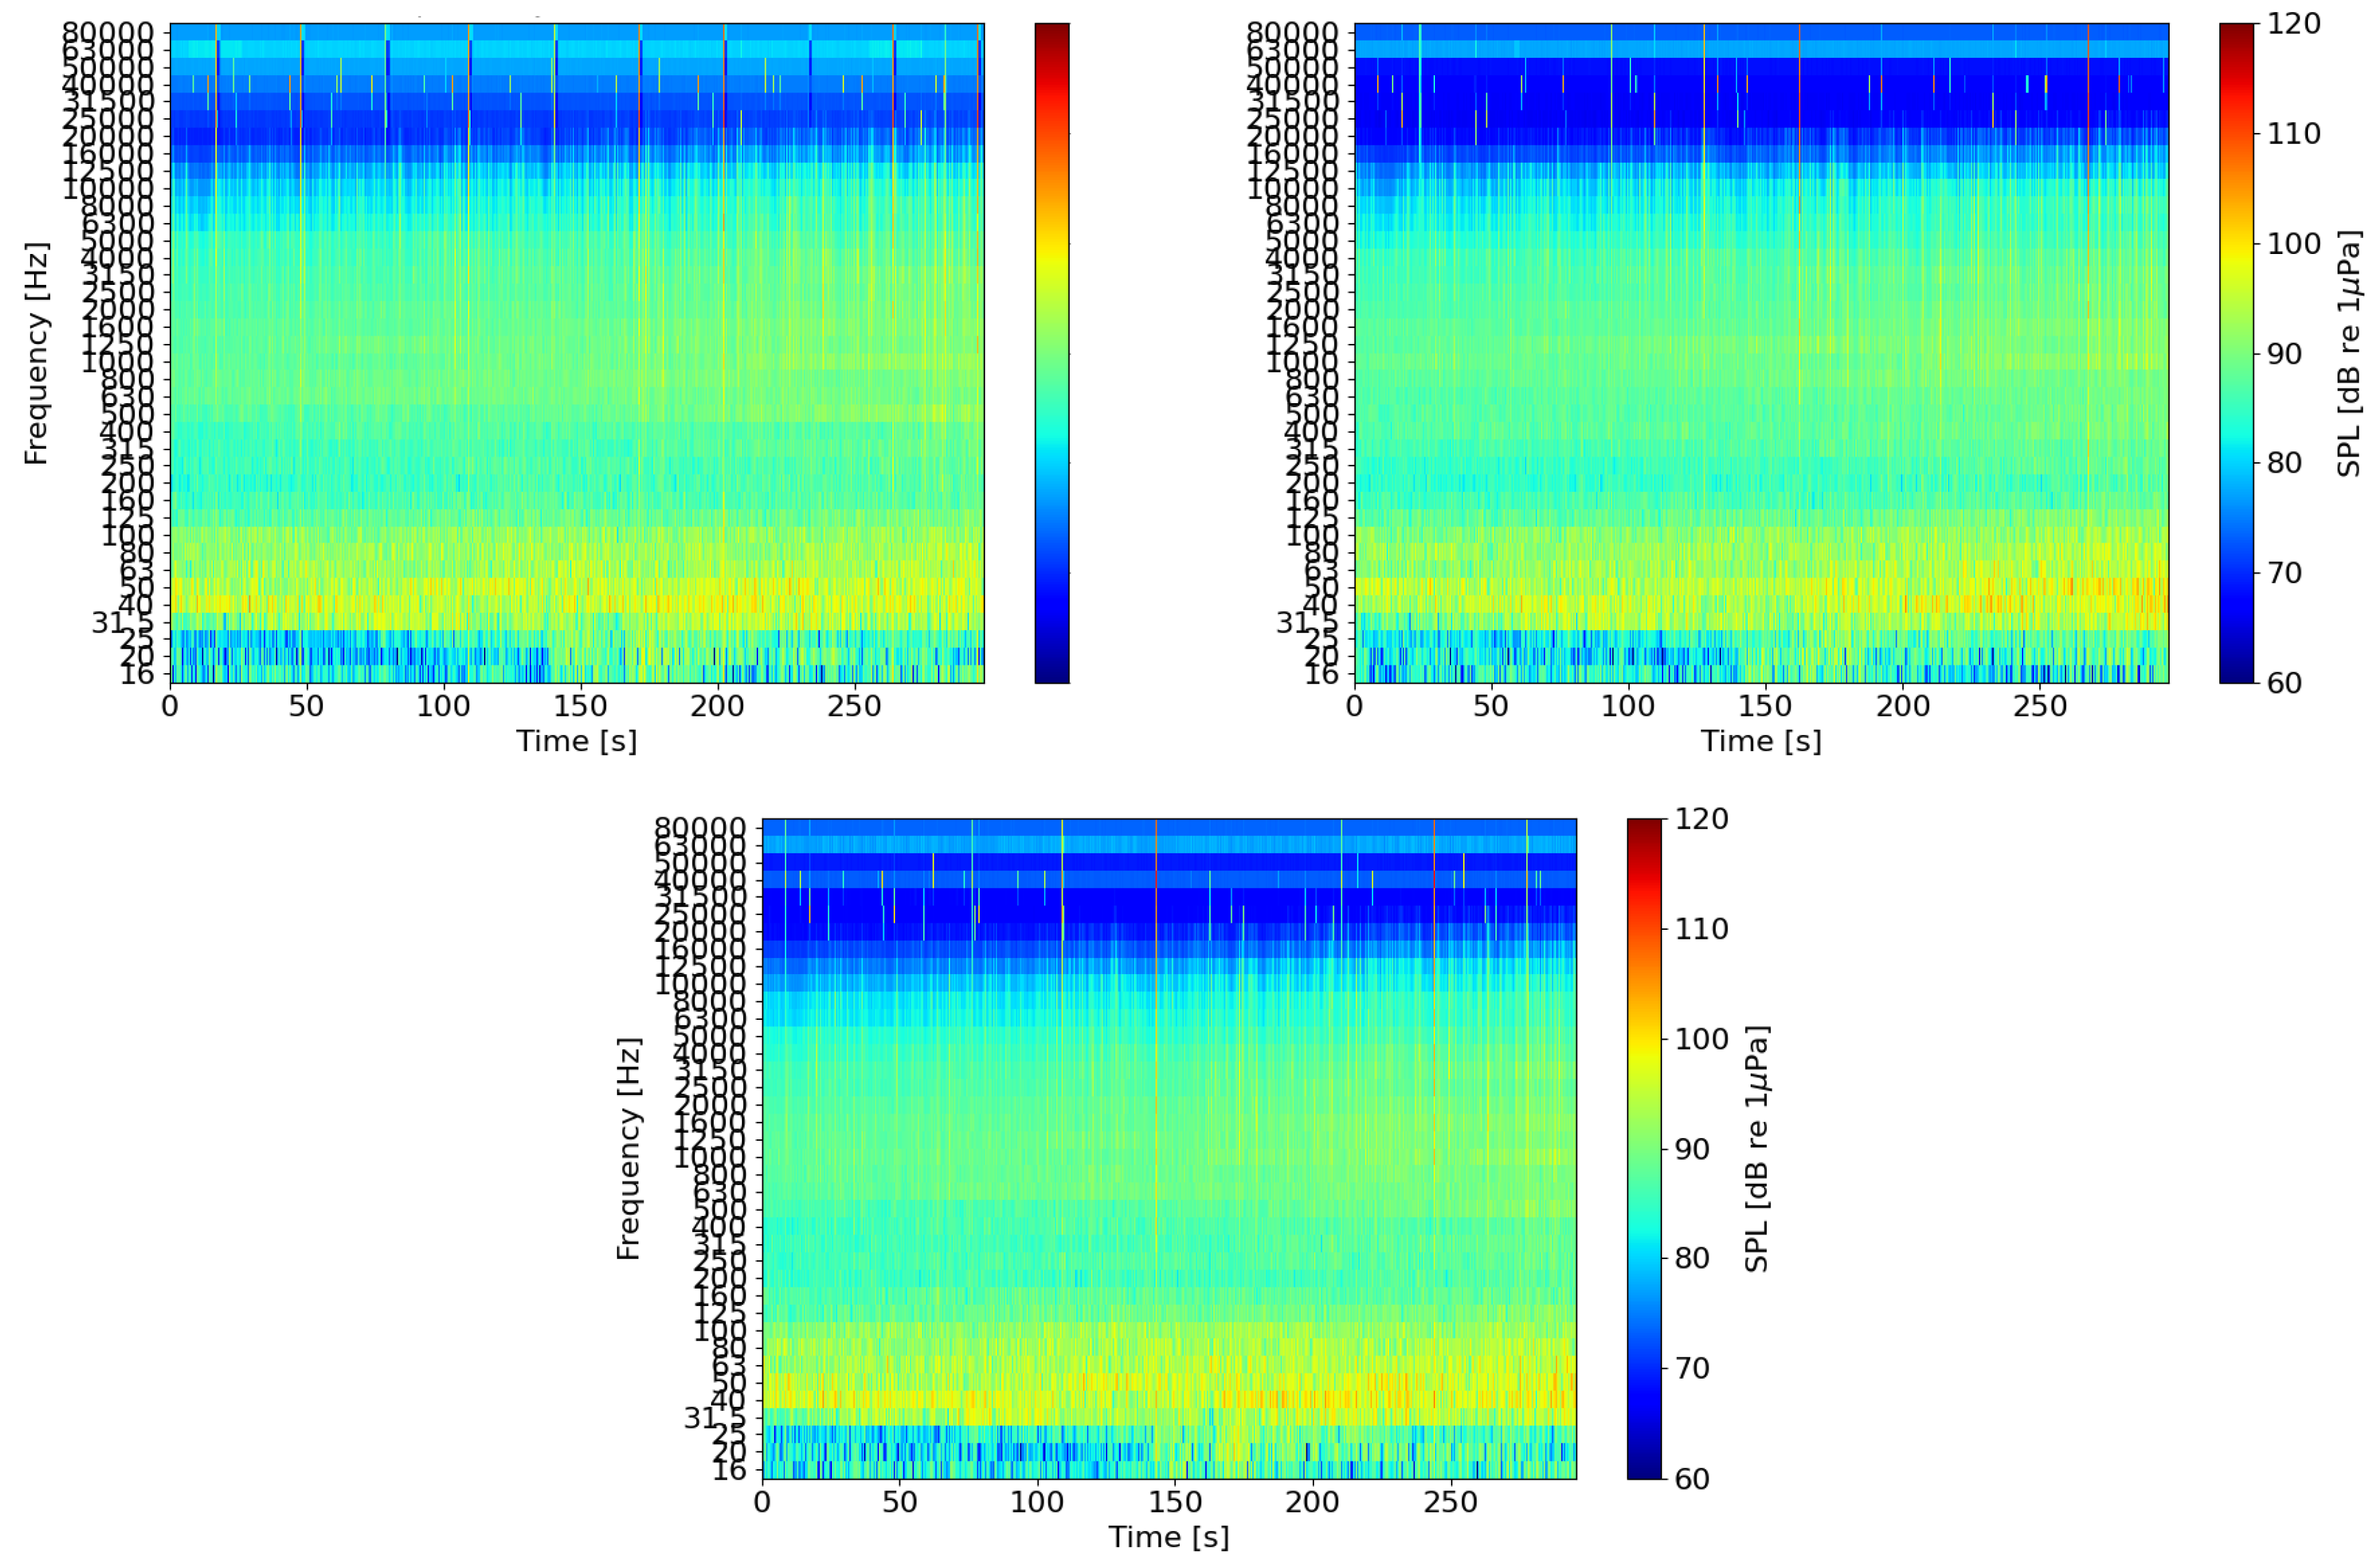
Figure 4.
30-days of SPL recordings (from 10th December 2024 to 10th January 2025) at the Portopalo di Capo Passero site in the 63 Hz and 125 Hz third-octave bands as captured by the hydrophone on board of one JB subsea asset. Typical emission noise (about 90 dB re 1Pa) from commercial ships populates the spectrum.
Disclaimer/Publisher’s Note: The statements, opinions and data contained in all publications are solely those of the individual author(s) and contributor(s) and not of MDPI and/or the editor(s). MDPI and/or the editor(s) disclaim responsibility for any injury to people or property resulting from any ideas, methods, instructions or products referred to in the content. |
© 2025 by the authors. Licensee MDPI, Basel, Switzerland. This article is an open access article distributed under the terms and conditions of the Creative Commons Attribution (CC BY) license (http://creativecommons.org/licenses/by/4.0/).
Copyright: This open access article is published under a Creative Commons CC BY 4.0 license, which permit the free download, distribution, and reuse, provided that the author and preprint are cited in any reuse.


