Preprint
Article

This version is not peer-reviewed.

Anti-Tumor Effects of Cecropin A and Drosocin Incorporated into Macrophage-Like Cells Against Hematopoietic Tumors in Drosophila mxc Mutants

A peer-reviewed article of this preprint also exists.

Submitted:

31 January 2025

Posted:

31 January 2025

You are already at the latest version

Abstract

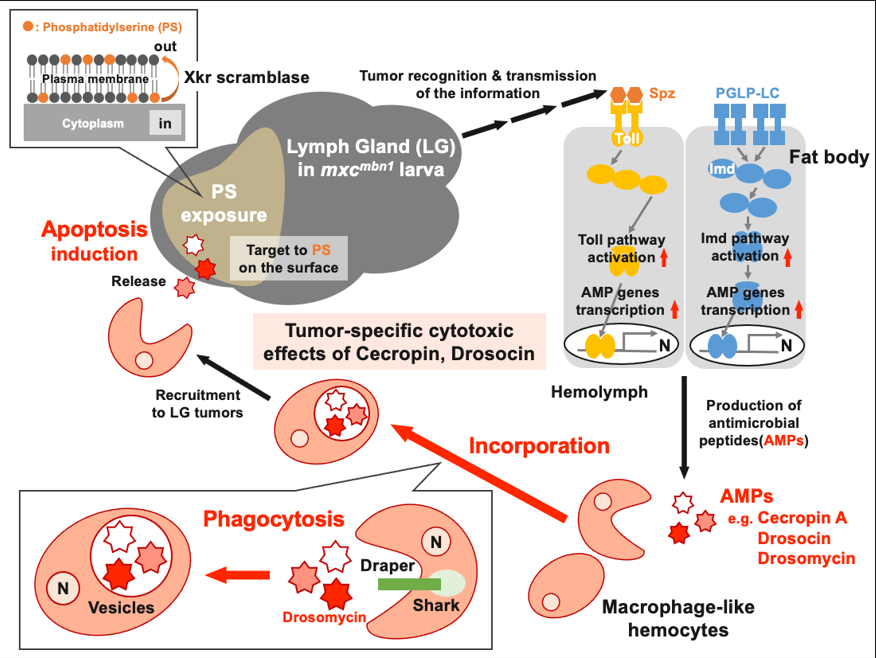
Five major antimicrobial peptides (AMPs) in <i>Drosophila</i> are induced in <i>multiple sex combs</i> (<i>mxc</i>) mutant larvae harboring lymph gland (LG) tumors and exhibit anti-tumor effects. The effects of the other well-known AMPs, Cecropin A and Drosocin, remain unelucidated. We investigated the tumor-elimination mechanism of these AMPs. A half-dose reduction of either <i>Toll</i> or <i>Imd</i> gene reduced the AMPs’ induction in the fat body and enhanced tumor growth in <i>mxc<sup>mbn1</sup></i> mutant larvae, indicating that their anti-tumor effects depend on the innate immune pathway. Overexpression of these AMPs in the fat body suppressed tumor growth without affecting cell proliferation. Apoptosis was significantly promoted in the mutant LGs but not in normal tissues. Conversely, their knockdown inhibited apoptosis and enhanced tumor growth. Therefore, these AMPs inhibit LG tumor growth by inducing apoptosis. The AMPs from the fat body were incorporated into hemocytes of mutant but not normal larvae. Another AMP, Drosomycin, was taken up via phagocytosis factors. Enhanced phosphatidylserine signals were observed on the tumor surface. Inhibition of the cell-surface exposed signals impeded tumor growth suppression. AMPs may target phosphatidylserine in the tumors for apoptosis induction to execute tumor-specific effects. AMPs are potentially beneficial anti-cancer drugs with minimal side effects for clinical development.

Keywords: 
;  ;  ;  ;  ;  

1. Introduction

Insects such as Drosophila do not possess acquired immunity and thus rely on innate immunity for protection [1]. Although innate immunity provides only initial defense, its involvement in initiating and regulating acquired immunity has recently been reaffirmed [2,3]. Many studies on the molecular mechanisms of innate immunity have been conducted using Drosophila, since its specific functions are not overshadowed by the more powerful acquired immunity [4]. Thanks to advanced genetic and developmental biology methods, Drosophila offers an excellent model for studying immunity.
Innate immunity in Drosophila includes humoral and cellular defense responses [5,6,7]. Antimicrobial peptides (AMPs) play a major role in the humoral defense response. In response to infection, AMPs are produced by the fat body, whose functions are similar to those of the mammalian liver and adipose tissue [8]. AMP production is mediated by the activation of either, or both, of two major signaling pathways: Toll and Imd [1,8,9]. The Toll pathway is activated primarily by gram-positive bacteria or fungal infections [10,11]. Recognition proteins identify cell wall components common to those bacteria or fungi [12,13]. A serine protease cascade is then activated, ultimately producing an active Spätzle [14]. This binds to the Toll receptor, and the signals are transmitted into the cytoplasm [15]. Subsequently, the degradation of Cactus—which inhibits the nuclear translocation of the Dif and Dorsal transcription factors—translocates the factors into the nucleus and induces the transcription of relevant AMP genes [8,14]. In contrast, the Imd pathway is activated mainly by gram-negative bacterial infection [10]. The transmembrane receptor recognizes cell wall components common to these bacteria [16,17]. It then transmits signals via protein complexes including Imd [18,19]. Eventually, the Relish transcription factor allows its nuclear translocation and induction of the relevant AMP genes’ transcription [16,20]. The Drosophila Toll- and Imd-mediated pathways are highly homologous to the mammalian Toll-like receptor and tumor necrosis factor (TNF) receptor-mediated signaling pathways, respectively [6,18,21]. Some of their target gene products, AMPs, are also conserved among different species. The first AMP, cecropin, was isolated in the 1980s from the silkworm moth, Hyalophora cecropia [22]. The following seven major AMPs are well characterized in Drosophila: Attacin, Cecropin, Defensin, Diptericin, Drosocin, Drosomycin, and Metchinikowin [1]. Among them, synthetic cecropin A peptides possess anti-tumor properties against cancer cells in culture systems [23,24,25]. AMP's cytotoxic and tumor growth-suppressive properties have been demonstrated in vitro as well as in Drosophila bodies [26,27,28,29]. Five of these seven AMPs are induced by activation of the innate immune pathway in response to tumors arising in imaginal discs and hematopoietic tissues, and effectively suppress tumor growth by inducing apoptosis in Drosophila [26,29]. However, it is still unclear how innate immunity recognizes tumor cells, how they activate the two innate immune pathways to induce AMPs, and how tumors are suppressed by AMPs from the fat body.
In Drosophila, mature hemocytes circulating in the hemolymph take charge of important innate immunity responses [30]. During the latter larval stage, hemocytes are supplied from the hematopoietic pockets and the lymph gland (LG). Plasmatocytes represent approximately 95% of hemocytes and act like macrophages, which eliminate apoptotic cells by phagocytosis. Hemocytes play a role in fighting bacterial infection as well as tumor cells by conveying immune signals toward the fat body to induce the expression of AMPs [31,32]. The transcriptional regulation of Drosocin via inter-tissue communication by hemocytes has been well characterized recently [31]. Drosophila hemocyte development and function are very similar to those of mammalian macrophages. Immune cell recruitment to tumor-forming foci is a hallmark of cancer [33]. Drosophila models also showed that hemocytes accumulate in tumors when they recognize damage to the basement membrane [34,35,36]. These cells produce Spätzle in tumors arising in the imaginal discs [28]. However, the detailed mechanisms of tumor recognition, signaling, and subsequent tumor suppression by hemocytes remain unelucidated.
The mxcmbn1 is a loss-of-function allele of the multi sex combs (mxc) gene and the hemizygotes for the mutation result in enlarged LG at the larval stage [26,37]. Moreover, mxcmbn1 exhibits a leukemia-like phenotype with increased numbers of undifferentiated hematopoietic cells in the hemolymph and their invasion to other tissues [38,39]. The LG tumors in the mxcmbn1 mutants exhibit overgrowth and invasive metastasis. In the mutant larvae, five of the seven major AMPs are induced and exhibit anti-tumor effects [26]. By contrast, two remaining AMPs, Cecropin A and Drosocin, have not been previously analyzed, although they are expected to be related to cancer and the innate immune system, as mentioned.
In this study, we focused on these two AMPs to determine whether they are induced in response to LG tumors and possess tumor-suppressive effects. We initially verified whether these AMP genes are induced in the fat body of mxcmbn1 mutants. We next examined whether the AMPs exhibit inhibitory effects on the LG tumors and suppress tumor growth by inducing apoptosis, as shown in the other five AMPs. Further, we address their anti-tumor effect mechanism in a tumor-specific manner. Our findings are expected to help elucidate the mechanisms of innate immune system activation and tumor suppression in response to Drosophila tumors. Although mammalian AMPs exhibit anti-cancer potential [40], most studies on their effects have been conducted in cultured cells. In contrast, our findings were determined using living organisms. This may benefit the future development of AMPs as promising new anti-cancer drugs with minimal side effects.

2. Materials and Methods

2.1. Drosophila stocks

w1118 (w) was used as a normal control stock. The recessive lethal allele of mxc, mxcmbn1, was used as a malignant hematopoietic tumor mutant [26,37,38,39]. The following Gal4 driver stocks were used for ectopic expression in specific larval tissues or cells as described; w*; P{w+mC=r4-GAL4}3 for induction of gene expression in the fat body (#33832; Bloomington Drosophila Stock Center (BDRC) [26]), P{He-GAL4.Z}85 (He-Gal4) (#8700; BDSC) for moderate induction in circulating hemocytes [37], P{upd3-GAL4} (a gift from N. Perrimon, Harvard Medical School, Boston, MA, USA) for induction of gene expression in LG tumor of mxcmbn1. To monitor the gene expression of the Dro, CecA and Drs genes, Dro-GFP (a gift from M. Miura, University of Tokyo, Tokyo, Japan [40]), CecA1-GFP (#600216; BDSC [40]), and Drs-YFP (a gift from Y. Yagi, Nagoya University, Nagoya, Japan [41]) were used, respectively. To visualize the localization of Drosomycin in the circulating hemocytes, we used the P{Drs-GFP.JM804}1 stock (#55707; BDSC) in which the EGFP-tagged Drosomycin expresses under its gene promoter. For dsRNA-dependent gene silencing, the following UAS-RNAi stocks were used; P{GD498}v42503 (#42503; VDRC) (UAS-DroRNAi) [31], P{GD3965}v9710 (#9710; VDRC) (UAS-CecA1RNAi) [42], P{GD15912} (#48383; VDRC) (UAS-xkrRNAi) [43], P{w[+mC]=UAS-drpr.dsRNA}2 (UAS-drprRNAi) (#67034; BDSC) [44], and P{TRiP.HMJ02128}attP40 (UAS-sharkRNAi) (#42555; BDSC). Those UAS-RNAi stocks could efficiently deplete the relevant mRNAs by combining them with Gal4 drivers. P{w+mC=UAS-GFP.dsRNA.R}142 (#9330; BDSC) was used as a control for the RNAi experiments. To induce ectopic expression of the genes, the following UAS stocks were used; UAS-Dro and UAS-CecA1 (respectively. gifts from B. Lemaitre, École Polytechnique Fédérale de Lausanne, Lausanne, Swiss [9,45]). For down-regulation of the innate immune pathways, imd1 and Toll1-rxa were used (a gift from Y. Yagi, Nagoya University, Nagoya, Japan [26]). For visualization of phosphoserine on the outside of the plasma membrane, UAS-Annexin V-GFP (a gift from C. Han, Cornell University, NY, USA [46]) was used.
All Drosophila stocks were maintained on standard cornmeal food, as previously described [47]. Per liter of water, 40 g of dried yeast (Asahi Group, Tokyo, Japan), 40 g of corn flour (Nippun, Tokyo, Japan), 100 g of glucose (Kato Chemical, Aichi, Japan), and 7.2 g of agar powder (Matsuki Agar, Nagano, Japan) were contained. 5 mL of 10 % methyl para hydroxybenzoate solution and 5 mL of propionic acid (Tokyo Kasei Kogyo, Tokyo, Japan) were added to 1 L of the fly food. Induction of Gal4-dependent gene expression was performed at 28°C. Other experiments and stock maintenance were conducted at 25°C.

2.2. Germline transformation

pUAST-CecA-CFLAGHA plasmid that permits cDNA expression for Cecropin A fused with FLAG- and HA- tags at its carboxyl-terminal under the UAS sequences (BDGF Tagged ORF collection, Drosophila Genomics Resource Center (Bloomington, Indiana, USA)). The plasmid DNA was injected into Drosophila embryos via PhiC31 integrase-mediated germ line transformation (BestGene Inc. (Chino Hills, CA, USA)).

2.3. Visualization of AMP gene expression in Drosophila larvae using Green fluorescent protein (GFP) reporter

Mature third instar larvae carrying the GFP reporters that monitored Dro and CecA1 gene expression were collected and fixed on double-sided tape. The larvae were observed using a stereo fluorescence microscope SZX7 (OLYMPUS, Tokyo, Japan) equipped with a digital camera DIGITAL SIGHT DS-Fi2 (Nikon, Tokyo, Japan), and bright field images and fluorescent Images were acquired using the DS-L3 camera control unit (Nikon, Tokyo, Japan). A pair of fat body from mature third instar larvae was observed using a stereo fluorescence microscope SZX7 (OLYMPUS, Tokyo, Japan) equipped with a digital camera DIGITAL SIGHT DS-Fi2 (Nikon, Tokyo, Japan) and a camera control unit DS-L3 (Nikon, Tokyo, Japan) to obtain bright field and fluorescence images.

2.4. Preparation of fixed samples to measure LG size

The mxcmbn1 was maintained heterozygous for the FM7a, P{w[+mC]=sChFP}1 balancer. The larvae that did not express RFP were selected as the mxcmbn1 hemizygotes from the stock [26]. The larval LGs are attached along the dorsal vessel and have three lobe-like structures, which are paired on the left and right sides [48]. The first lobe contains mature hemocytes at the cortical zone, and undifferentiated hematopoietic precursors at the medullary zone [49,50]. Larval LGs collected from mature third-instar larvae were fixed in 4% paraformaldehyde for 15 minutes. DNA was stained with 4',6-diamidino-2-phenylindole (DAPI) solution (1 µg/ml in PBS (Wako Pure Chemicals, Osaka, Japan)). The LG specimen mounted under a mounting medium (Vector Laboratories, CA, USA) was gently spread to obtain a single LG cell layer as described elsewhere [26]. To quantify the size of DAPI-stained LG, the entire area of each hemisphere of the LG was measured on the acquired fluorescence image using Image J software (https://imagej.nih.gov/ij/).

2.5. LG immunostaining

The fixed LG samples were blocked with PBS containing 0.1% Triton X-100 and 10% normal goat serum and incubated with the primary antibodies (anti-cDcp1 (Asp215) antibody (1:500; #9578, Cell Signaling Technology, Danvers, MA, USA) and anti-PH3(Ser10) antibody (1:1000; #06-570, Merk-Millipore, MA, USA)) overnight at 4℃. After washing repeatedly, the secondary antibody conjugated with Alexa Fluor 488 (1:400; #A11008, Molecular Probes, OR, USA) was added to detect the primary antibodies. DAPI was used for the DNA staining. The stained LG samples mounted in VECTASHIELD Mounting Medium (Vector Laboratories, CA, USA) were observed with an inverted fluorescence microscope IX81 (OLYMPUS, Tokyo, Japan) equipped with a digital CCD camera ORCA-R2 (Hamamatsu Photonics, Shizuoka, Japan). Fluorescence images were acquired using MetaMorph® 7.6 Software (Molecular Devices, CA, USA) and then processed on Adobe Photoshop CS (Adobe, CA, USA). The areas emitting the immunofluorescent signals among each hemisphere of the LG were measured on the fluorescence images by Image J. The percentage of the fluorescence areas in the anterior LG lobes was calculated.

2.6. Detection of Phosphatydilserine (PS) exposed on the cell membrane surface in LG

To detect PS on the surface of LG cells, GFP-tagged Annexin V—which binds to PS at a high affinity—was expressed in the fat body using the r4-Gal4 driver. When we observe the PS on the LGs of the larvae harboring the precursor cells-specific depletion of xkr mRNA using the upd3-Gal4 driver, Annexin V-GFP expression via the simultaneous use of r4-Gal4 cannot be induced. Thus, larval LGs collected from mature third instar larvae were incubated with 5% Alexa Fluor 594-conjugated Annexin V (#A13203, Life Technologies, CA, USA) for 30 min. The LGs were fixed in 4% paraformaldehyde for 15 min. DAPI-staining and fluorescence imaging were then carried out as described above. The GFP fluorescence-positive areas among the anterior lobes of each LG hemisphere on the fluorescence images were measured using Image J. The percentage of the fluorescence areas in the whole LG lobe region was calculated.

2.7. Immunostaining of circulating hemocytes

A single larva at the third instar stage was transferred into the Drosophila Ringer’s solution (DR) on a glass slide. Subsequently, only the larval epidermis was cut using a set of fine forceps to allow the circulating hemocytes to be released into the DR outside the larvae. After an aliquot of the DR containing circulating hemocytes was placed on the glass slide, the hemocytes were fixed in 4% paraformaldehyde for 10 min. Immunostaining of the hemocytes was performed using anti-HA-tag rabbit IgG (1:1000; #3724, Cell Signaling Technology, Danvers, MA, USA) as described above. Fluorescence intensities of the hemocytes were quantified using Image J.

2.8. Microinjection of synthetic cecropin A peptides

A 50 mM solution of synthetic cecropin A (#C6830, Sigma-Aldrich, St. Louis, USA) dissolved in DR containing a red food color was prepared for microinjection [51]. Using red pigment as an injection marker, approximately 0.1 µL of the AMP solution was injected into the posterior-ventral area of a recipient larva at the third instar, using glass needles. The needles were prepared from G1.2 capillaries (outer diameter of 1 mm, Narishige Co., Tokyo, Japan) using a grass puller (PN-31, Narishige Co., Tokyo, Japan). They were ground against the side of the microscope glass to sharpen the tip. After injection, the larvae were placed on a piece of wet filter paper for 1 hour to recover from the damage and raised on standard food overnight before observation.

2.9. Quantitative reverse transcription-PCR (qRT-PCR) analysis

Total RNA was extracted from 14 to 18 pairs of fat bodies of mature third instar larvae using Trizol Regent® (Invitrogen, USA, MA). After treatment with DNase I (Epicentre Technologies, WI, USA) to remove mixed genomic DNA, the purity of RNA was checked by ensuring that the A260 and A280 ratio of each RNA sample was between 1.8 and 2.0. cDNA was synthesized from the total RNA using a PrimeScript High-Fidelity RT-PCR Kit (TaKaRa, Clontech Laboratories, Shiga, Japan). Real-time PCR reactions were performed on a Thermal Cycler Dice® Real-Time System III (TaKaRa Bio, Shiga, Japan) using TB Green® Premix Ex Taq™ II Tli RNaseH Plus (TaKaRa Bio, Shiga, Japan). The PCR reaction was carried out using a cycling program consisting of initial denaturation at 95℃ for 5 m, followed by 40 cycles at 95℃ for 5 s and 60℃ for 30 s. The temperature was increased from 60℃ to 95℃ at a rate of 0.1℃/s. Real-time PCR was performed using a Thermal Cycler Dice® Real-Time System III (TaKaRa Bio., Shiga, Japan) using TB Green Premix Ex Taq II (#RR820A, TaKaRa Bio, Shiga, Japan). Each sample was analyzed in triplicate on a PCR plate, and the final results were obtained by averaging three biological replicates. For quantification, the ∆∆Ct method was used to determine the differences between target gene expression and that of the reference gene, Rp49. Three identical PCR reaction reagents were prepared for one cDNA sample, and the mean and standard deviation of mRNA amounts were calculated. mRNA amounts were analyzed by the ΔΔCt method. The following primer sequences were used in the real-time quantitative PCR; RP49-Fw, 5′-TTCCTGGTGCACAACGTG-3′ and RP49-Rv, 5′-TCTCCTTGCGCTTCTTGG-3′; Cecropin A1-Fw, 5′-TCTTCGTTTTCGTCGCTCTC-3′ and Cecropin A1-Rv, 5′-CTTGTTGAGCGATTCCCAGT-3′; Drosocin-Fw, 5′-TCAGTTCGATTTGTCCACCA-3′ and Drosocin-Rv, 5′-GATGGCAGCTTGAGTCAGGT-3′.

2.10. Statistical analysis

Welch's t-test and one-way ANOVA for multiple comparisons were used to assess statistical differences. Unless otherwise stated, one-way ANOVA multiple comparison with Bonferroni correction was used for statistical comparisons. Sample sizes and p-values are given in the description of the results. A p-value of 0.05 or less was considered statistically significant. The results of each tabulation were displayed as scatter plots or bar charts created using GraphPad Prism 6 (GraphPad Software, CA, USA).

3. Results

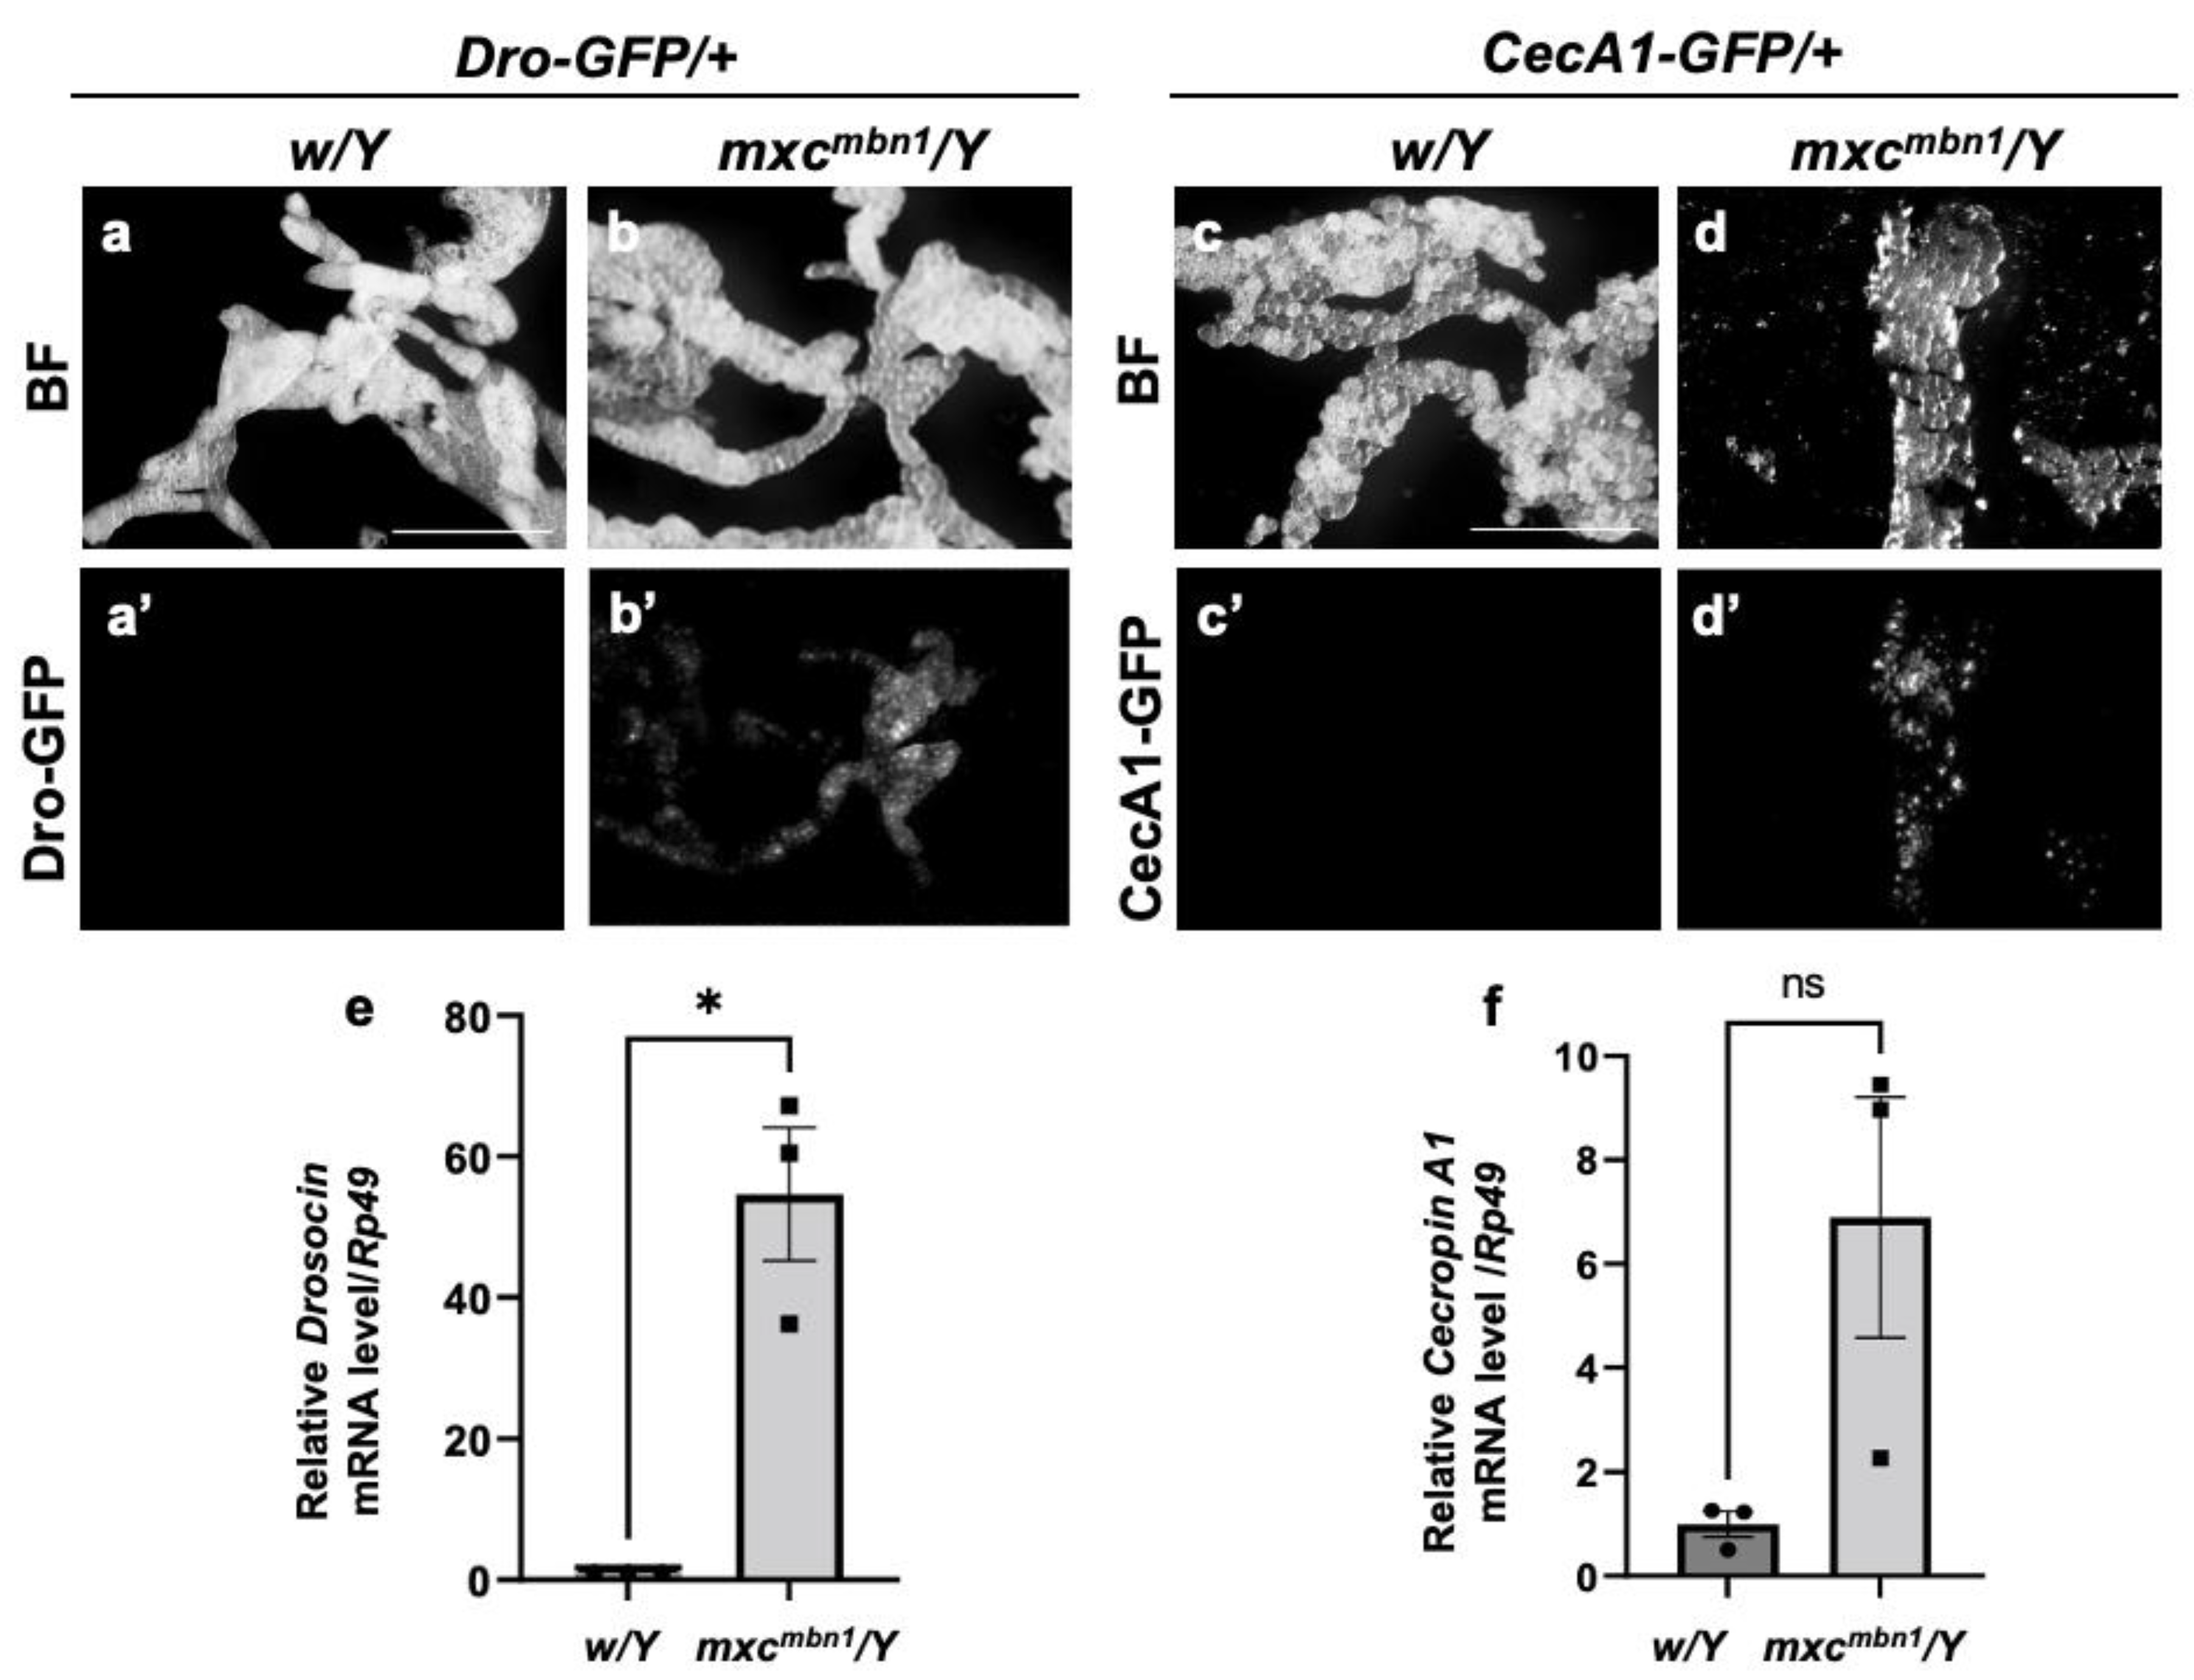
3.1. Induction of AMP genes encoding Drosocin and Cecropin A in the fat body of mxcmbn1 mutant larvae

Transcription of genes encoding the five major AMPs was induced in the fat body of mxcmbn1 mutant larvae [26]. Thus, we first examined whether the other two major AMP genes encoding Drosocin (Dro) and Cecropin A (CecA1) showed a consistent induction of transcription in the mutant fat body. First, we visualized Dro gene expression in the fat body of normal (w/Y; Dro-GFP/+) and mxcmbn1 mutant larvae (mxcmbn1/Y; Dro-GFP/+) at the third instar stage using the green fluorescent protein (GFP) reporter. GFP fluorescence was not detected in the normal control (n = 20) (Figure 1a’). In contrast, the mxcmbn1 larvae (n = 23) showed GFP fluorescence in the fat body of 35% (n = 8/23) of the larvae (Figure 1b’), although the fluorescence intensity was weaker than that observed in bacterial infection. Similarly, CecA1 gene expression in the fat body of third-instar mature larvae of normal controls (w/Y; CecA1-GFP/+) and mxcmbn1 mutants (mxcmbn1/Y; CecA1-GFP/+) was visualized using the GFP reporter. GFP fluorescence was not detected in the controls (n = 20) (Figure 1c’) but was detected in the fat body of 33% (n = 11/33) of the mutant larvae at the same stage (Figure 1d’). These findings suggest that the Dro and CecA1 genes were upregulated in the fat body of mxcmbn1 larvae.
To confirm the upregulation of Dro and CecA1 in mxcmbn1 larvae, we performed quantitative reverse transcription-PCR (qRT-PCR) experiments using total RNA from the fat body of the normal control (w/Y) and mutant (mxcmbn1/Y) larvae at the third instar mature stage. Dro mRNA levels were significantly elevated by approximately 50-fold in the mutant fat body compared to those of the normal controls (p < 0.05) (Figure 1e). The average mRNA levels of CecA1 increased approximately 7-fold, respectively, in the mutants compared to those in the normal controls (Figure 1f). Thus, the Dro and the CecA1 genes were overexpressed in the fat body of mxcmbn1 larvae harboring the LG tumor.

3.2. Dro and CecA1 mRNA level declines and LG hyperplasia enhancement in mxcmbn1 larvae by half-dose reduction of the genes encoding the innate immune pathway factors

We investigated whether Dro and CecA1 in mxcmbn1 were induced via the activation of innate immune pathways. Genetic analysis was performed to determine the reduction in gene expression and its influence on LG tumor size when the innate immunity pathway was downregulated. Heterozygotes for Toll or imd mutations in mxcmbn1 mutants exhibited reduced mRNA levels of the five other AMP genes [26]. In mxcmbn1 mutants heterozygous for a loss-of-function mutation for Toll (mxcmbn1/Y; Toll1-RXA/+) or imd (mxcmbn1/Y; imd/+), the mRNA levels of Dro and CecA1 in the fat body were quantified using qRT-PCR with RNA prepared from the fat body of third instar stage larvae. The Dro mRNA level declined to approximately 7% of that of mxcmbn1 (mxcmbn1/Y) in the mutant larvae heterozygous for the Toll mutation and to approximately 3% in imd heterozygous mutants (Figure S1a). These differences were statistically significant (p < 0.0001). Consistently, the CecA1 mRNA levels declined to 35% of those of mxcmbn1 in the mutant larvae heterozygous for the Toll mutation and by approximately one-third in imd heterozygous mutants (Figure S1b). This difference was statistically significant (p < 0.01).
Next, we observed whether the growth of the LG tumor was enhanced when the mRNAs of AMP genes were downregulated in mxcmbn1 heterozygous for the Toll or imd mutation (Figure S1c-f). The entire LG lobe region size in mature larvae at the third instar stage was quantified. LG tumor size (mean: 0.55 mm2, n = 20) increased significantly by 1.13-fold in mxcmbn1 larvae heterozygous for Toll mutation compared to those in mxcmbn1 larvae without the mutation (mean: 0.48 mm2, n=20) (Figure S1g) (p < 0.05). Consistently, the LG tumors in mxcmbn1 heterozygous for the imd mutation (mean: 0.67 mm2, n = 20) were 1.38-fold larger (Figure S1g) than those in mxcmbn1 (mean: 0.48 mm2, n = 20). This difference was statistically significant (p < 0.0001). In summary, LG hyperplasia was enhanced in mxcmbn1 mutants heterozygous for Toll or imd mutations. Thus, LG tumors may be suppressed by the gene products of Dro and CecA1 induced by innate immune pathway activation.

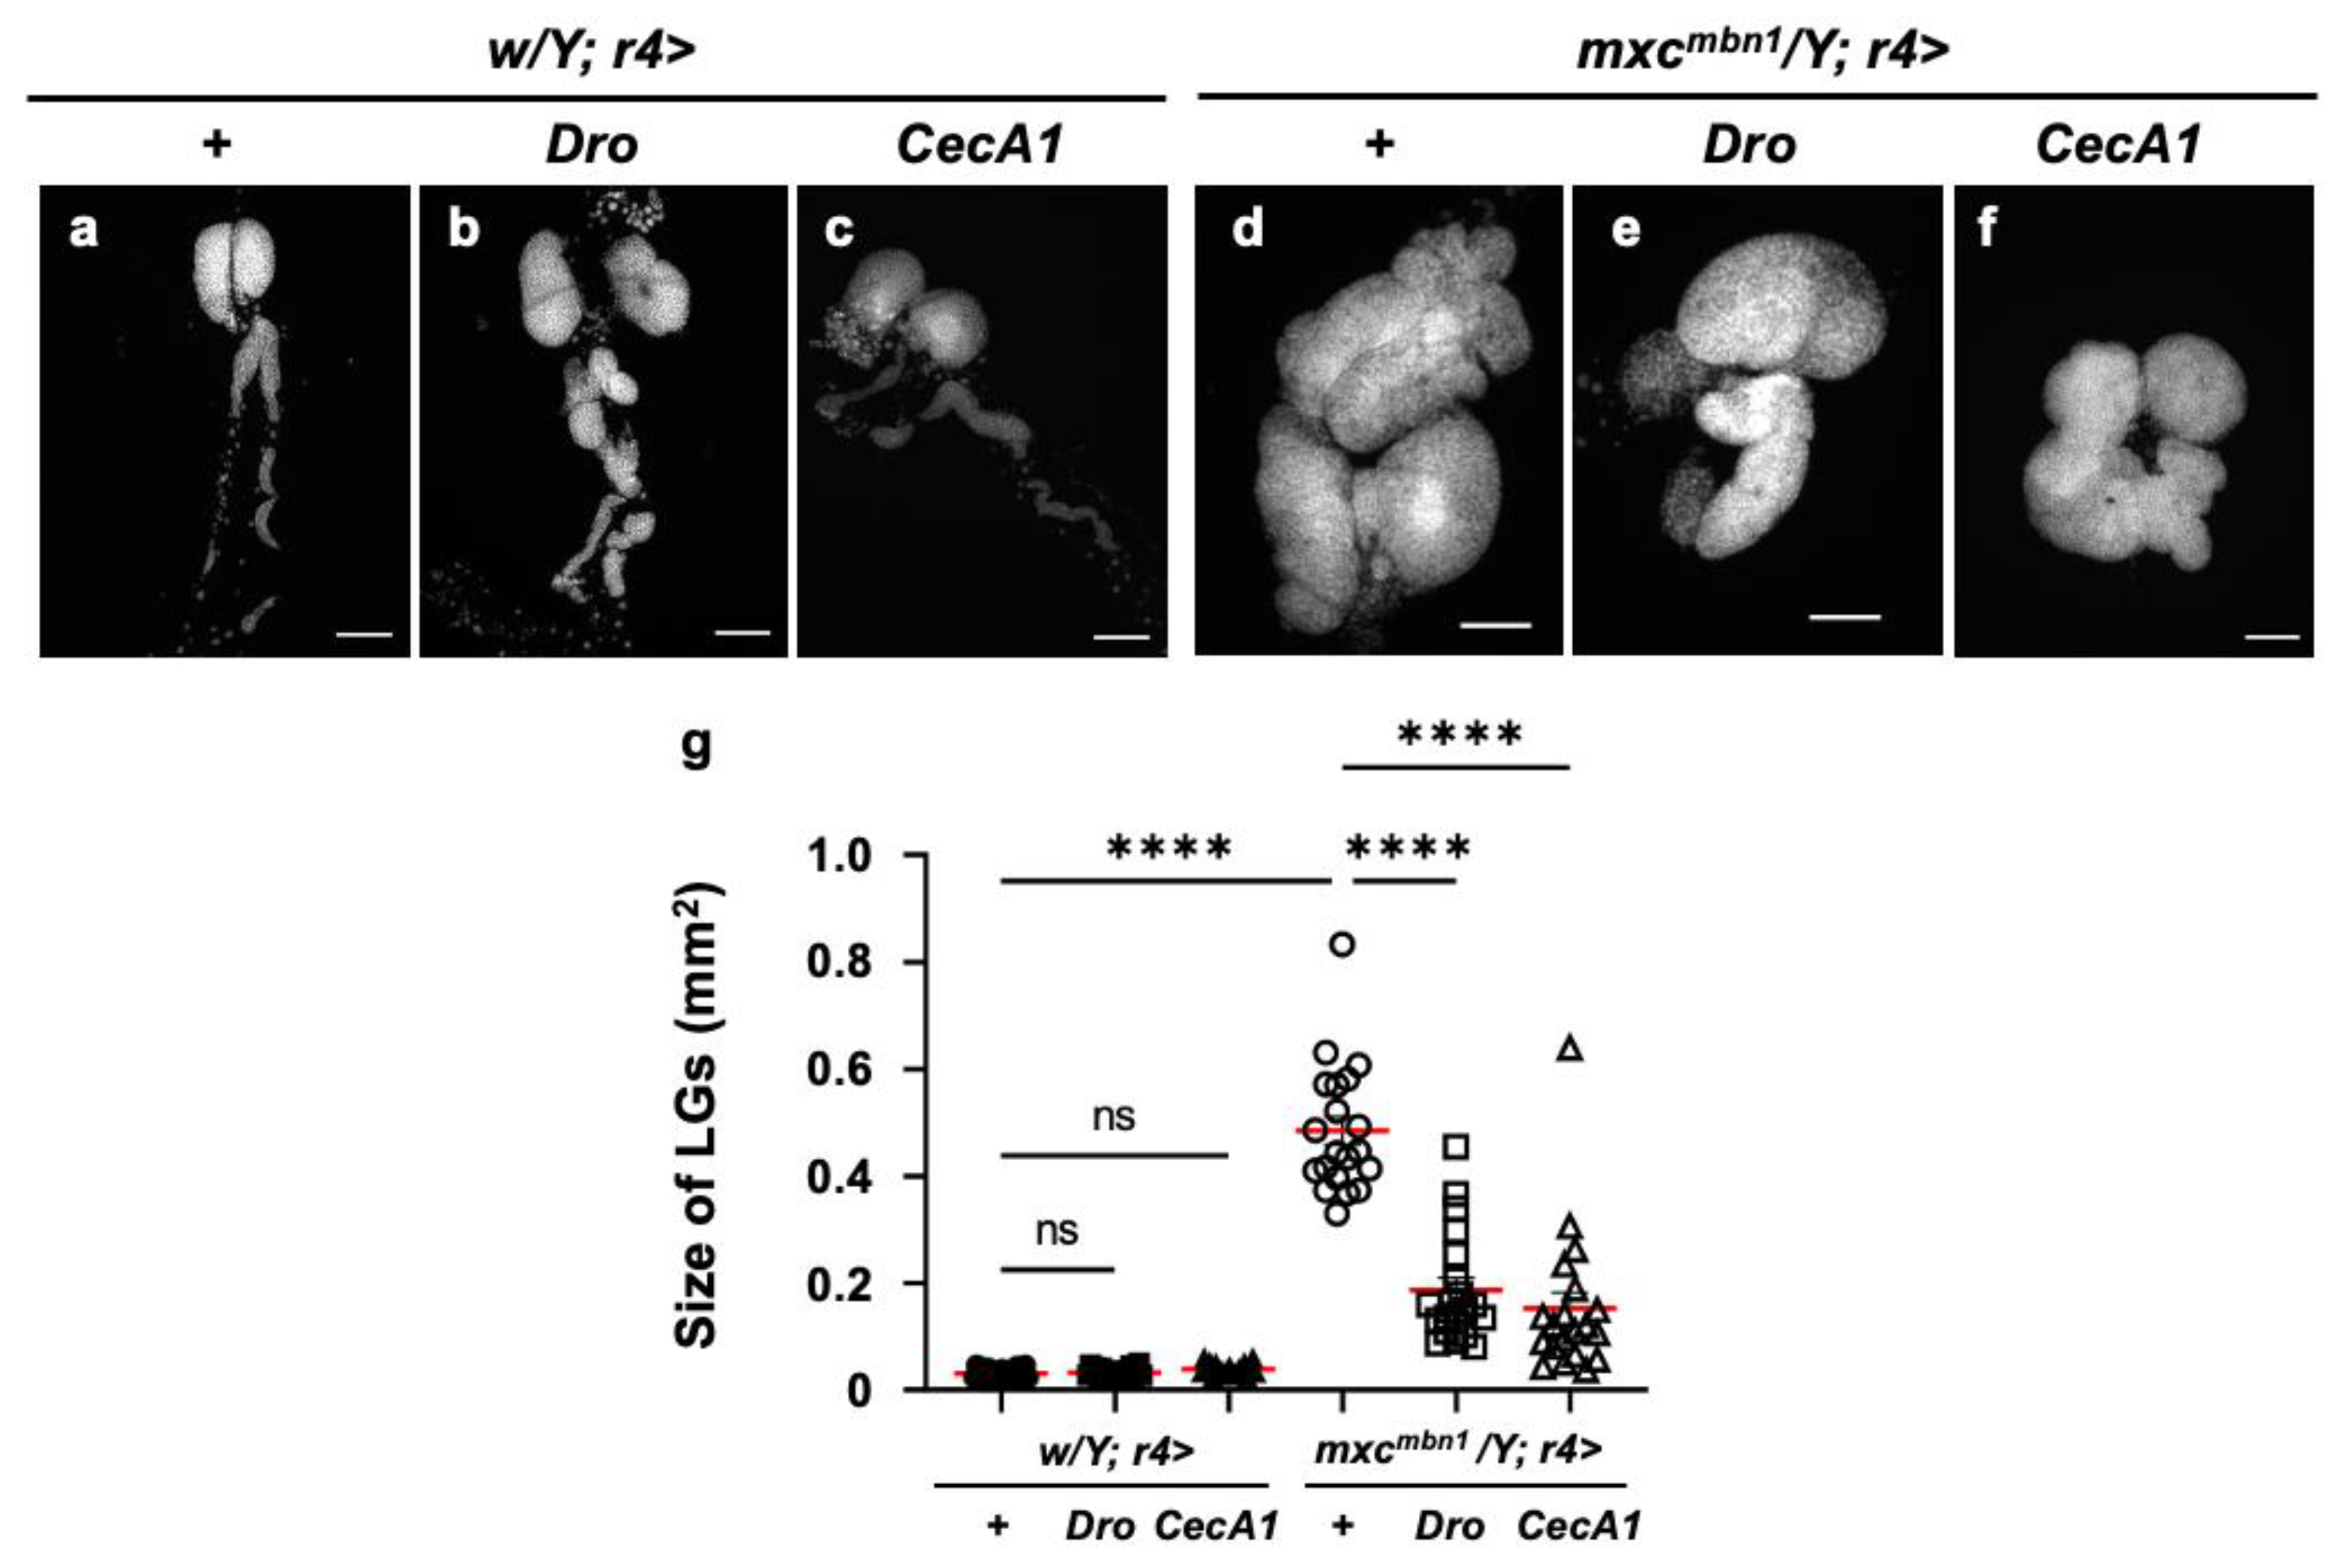
3.3. LG hyperplasia suppression in mxcmbn1 larvae by overexpression of Dro or CecA1 gene in the fat body

Further, we investigated the anti-tumor potential of Drosocin and Cecropin A. The fat body-specific overexpression of either gene (w/Y; r4>Dro or w/Y; r4>CecA1) did not affect LG size, relative to that of normal control larvae (w/Y; r4>+) (Figure 2a-c). We next compared the LG size of Dro-overexpressing mxcmbn1 larvae in the fat body (mxcmbn1/Y; r4>Dro) with that of mxcmbn1 larvae (mxcmbn1/Y; r4>+) (Figure 2d, e). The average size of the entire LG lobe region (mean: 0.18 mm2, n = 20) was significantly reduced to approximately one-third of that of mxcmbn1 (mean: 0.48 mm2, n = 20) (Figure 2g) (p < 0.0001). These results indicate the anti-tumor potential of Drosocin on LG tumors in mxcmbn1. Next, we compared the LG size of mxcmbn1 larvae with fat body-specific CecA1 overexpression (mxcmbn1/Y; r4>CecA1) to that of mxcmbn1 larvae (mxcmbn1/Y; r4>+) (Figure 2d, f). The LG size (mean: 0.15 mm2, n = 20) was significantly reduced to approximately one-third of that of the control (mxcmbn1/Y; r4>+) (mean: 0.48 mm2, n = 20) (Figure 2g) (p < 0.0001). These results indicate the anti-tumor potentials of Drosocin and Cecropin A, which suppressed LG tumor growth in mxcmbn1 larvae.

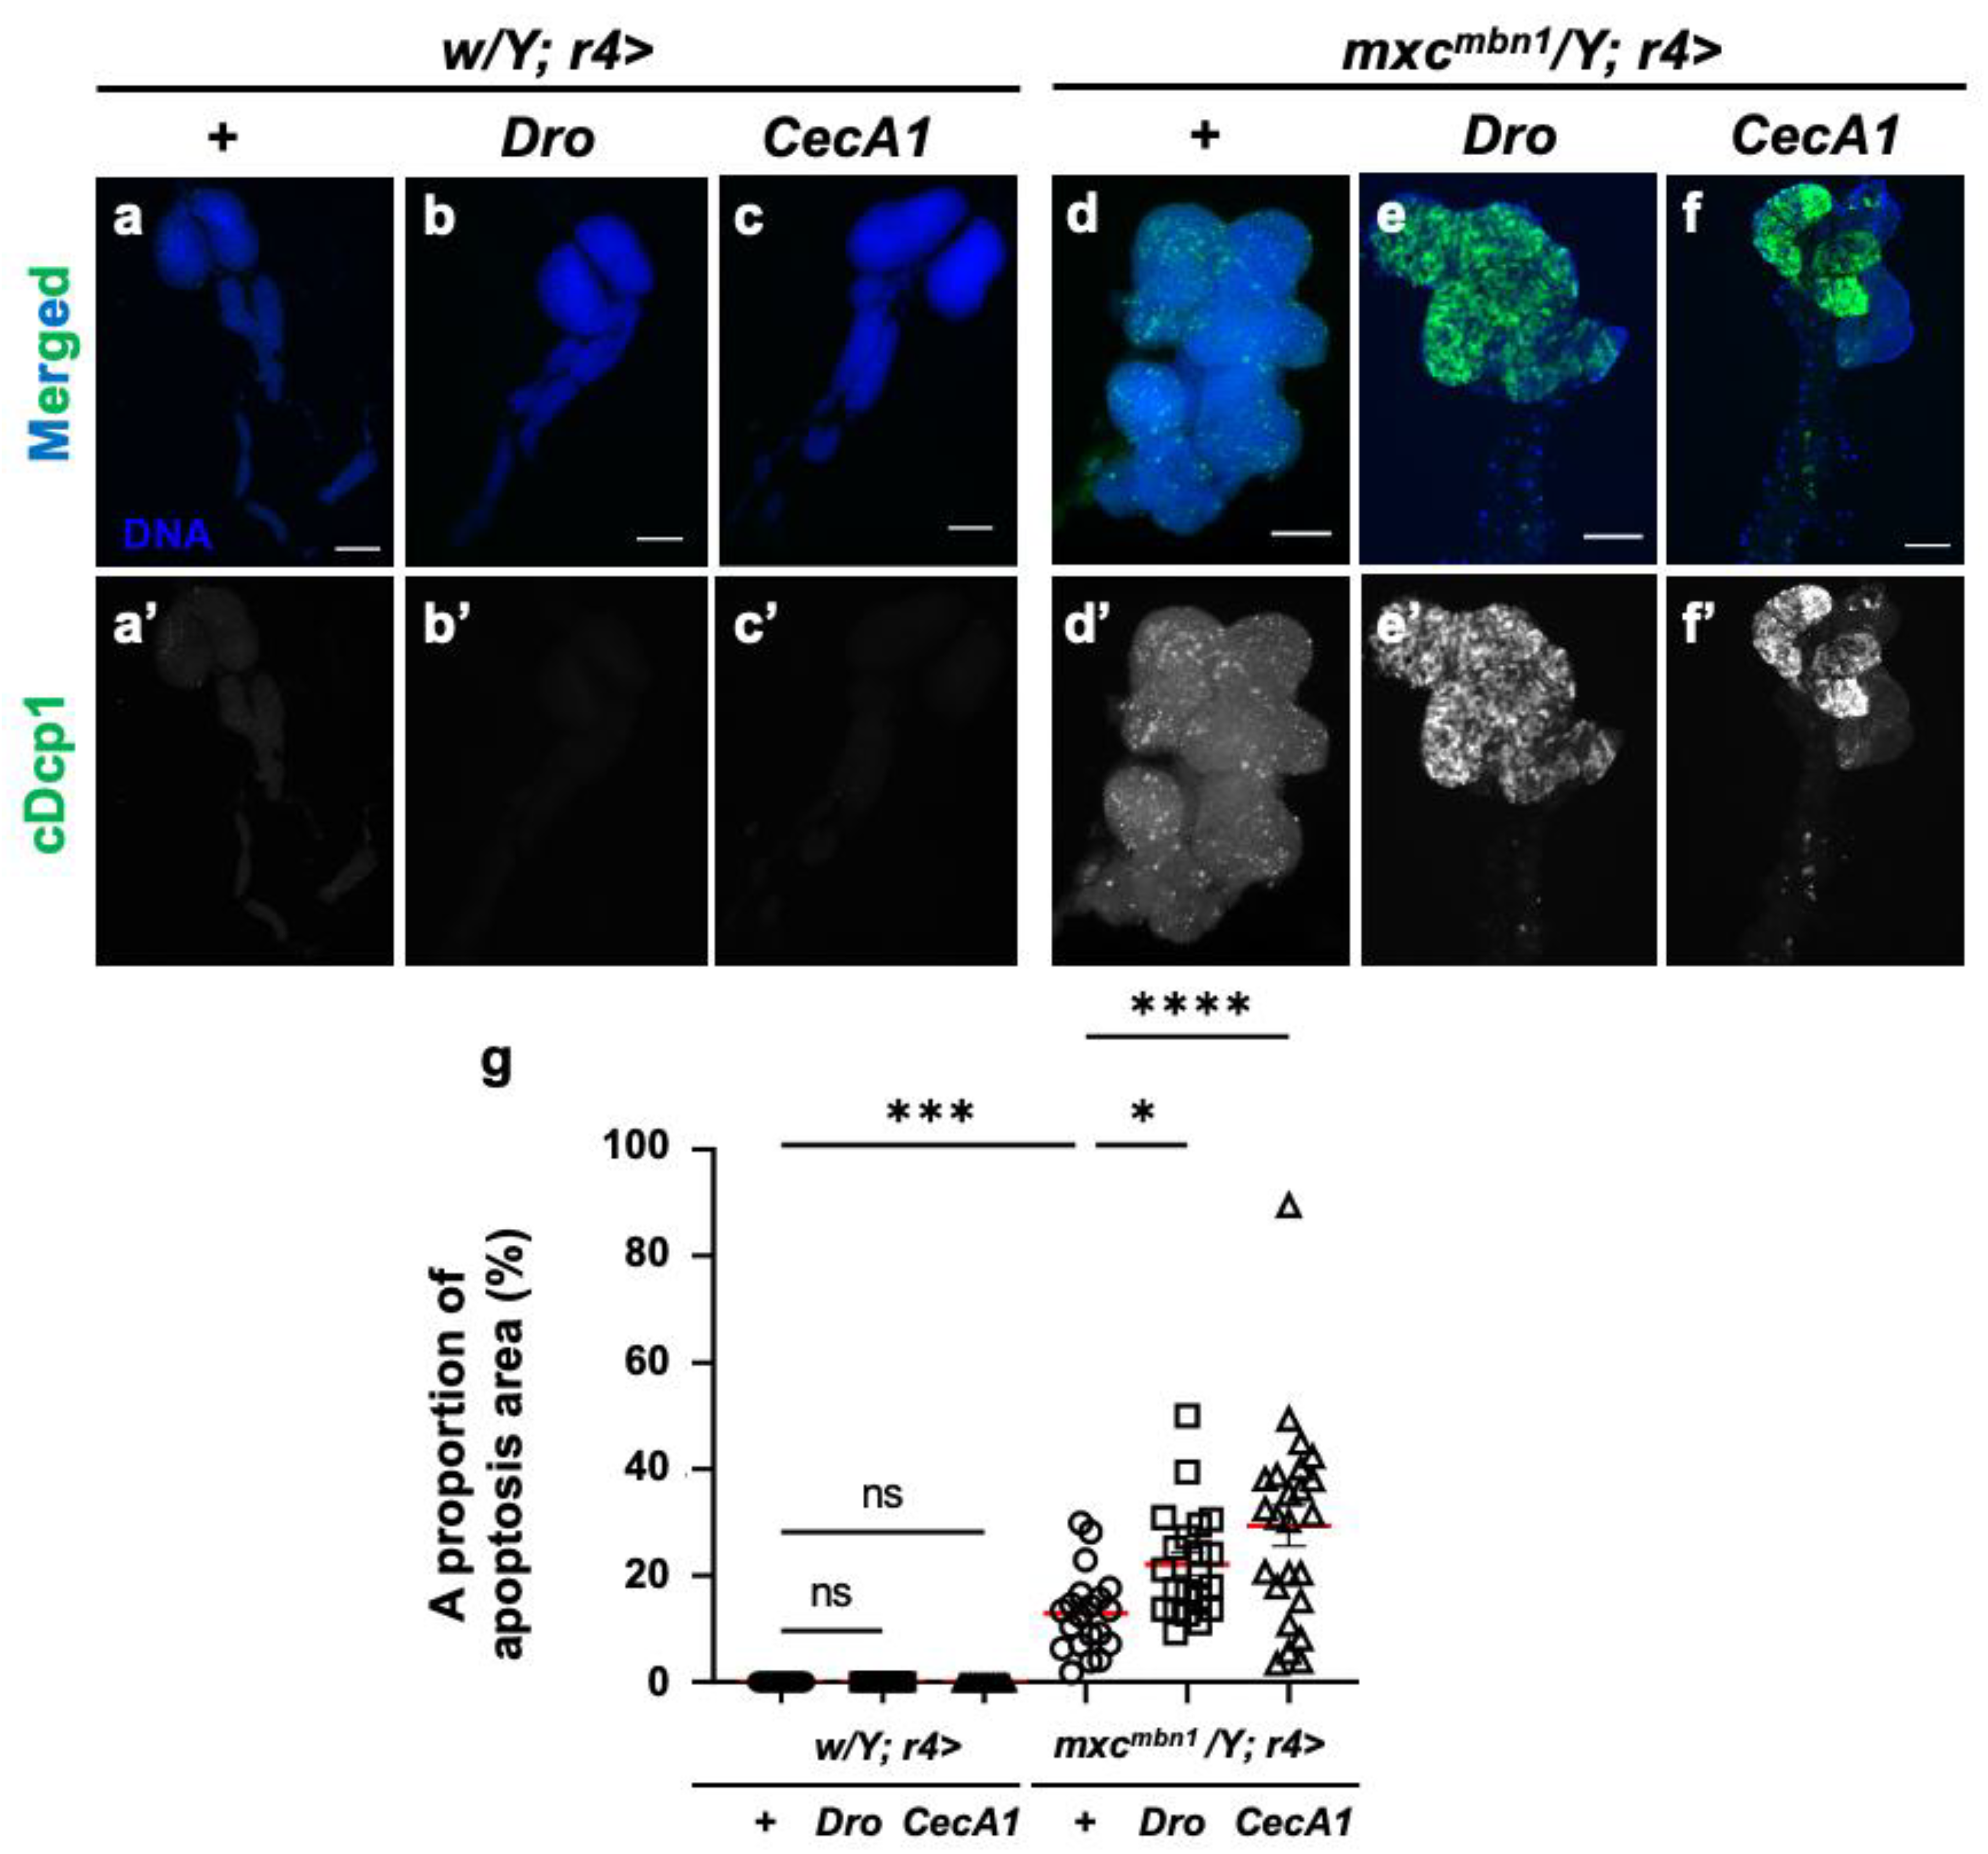
3.4. Dro or CecA1 overexpression in the fat body enhanced apoptosis in the LG tumors of mxcmbn1 larvae

To elucidate the mechanism underlying the anti-tumor effect of Drosocin and Cecropin A, we investigated whether these two AMPs exhibit apoptosis-inducing effects in LG tumors, similar to those of the other five AMPs [26]. First, we confirmed that fat body-specific overexpression of Dro (w/Y; r4>Dro) or CecA1 (w/Y; r4>CecA1) did not influence LG size in normal larvae. The percentage of anti-cDcp1 immunostaining signal-positive area in the total lobe region of the LG was calculated and compared to that of the control (w/Y; r4>+) (Figure 3a’-c’). Next, we performed anti-cDcp1 immunostaining of the LG in mxcmbn1 mutant larvae harboring fat body-specific overexpression of Dro (mxcmbn1/Y; r4>Dro). LGs of the third instar larvae showed an immunostaining signal corresponding to apoptotic cells in an average of 22.1% (n = 21) of the total lobe area (n = 21), which was significantly (1.8-fold) higher than the average of 12.9% (n = 20) in the control (mxcmbn1/Y; r4>+) (Figure 3d’, e’, g) (p < 0.05). These results suggest that Drosocin induces apoptosis in mxcmbn1 mutant LG tumors. Consistently, fat body-specific overexpression of CecA1 in mxcmbn1 larvae (mxcmbn1/Y; r4>CecA1) also significantly increased the apoptosis area in an average of 29.4% of the total lobe area of LGs (n = 24) in third instar stage larvae. This percentage was 2.3-fold higher than the average of 12.9% (n = 20) in controls (mxcmbn1/Y; r4>+) (Figure 3d’, f’, g) (p < 0.0001). These results suggest that Cecropin A could induce apoptosis in mxcmbn1 mutant LG tumors.
To further confirm whether the apoptosis induction occurs in tumor-specific manner, we overexpressed Dro or CecA1 specifically in the fat body of normal larvae and investigated apoptosis in larval tissues such as imaginal discs by anti-cDcp1 immunostaining. Consequently, few signals were observed in wing imaginal discs, similar to the controls (Figure S2a-c). Thus, Drosocin and Cecropin A induced apoptosis specifically in the LG tumors of mxcmbn1 larvae.

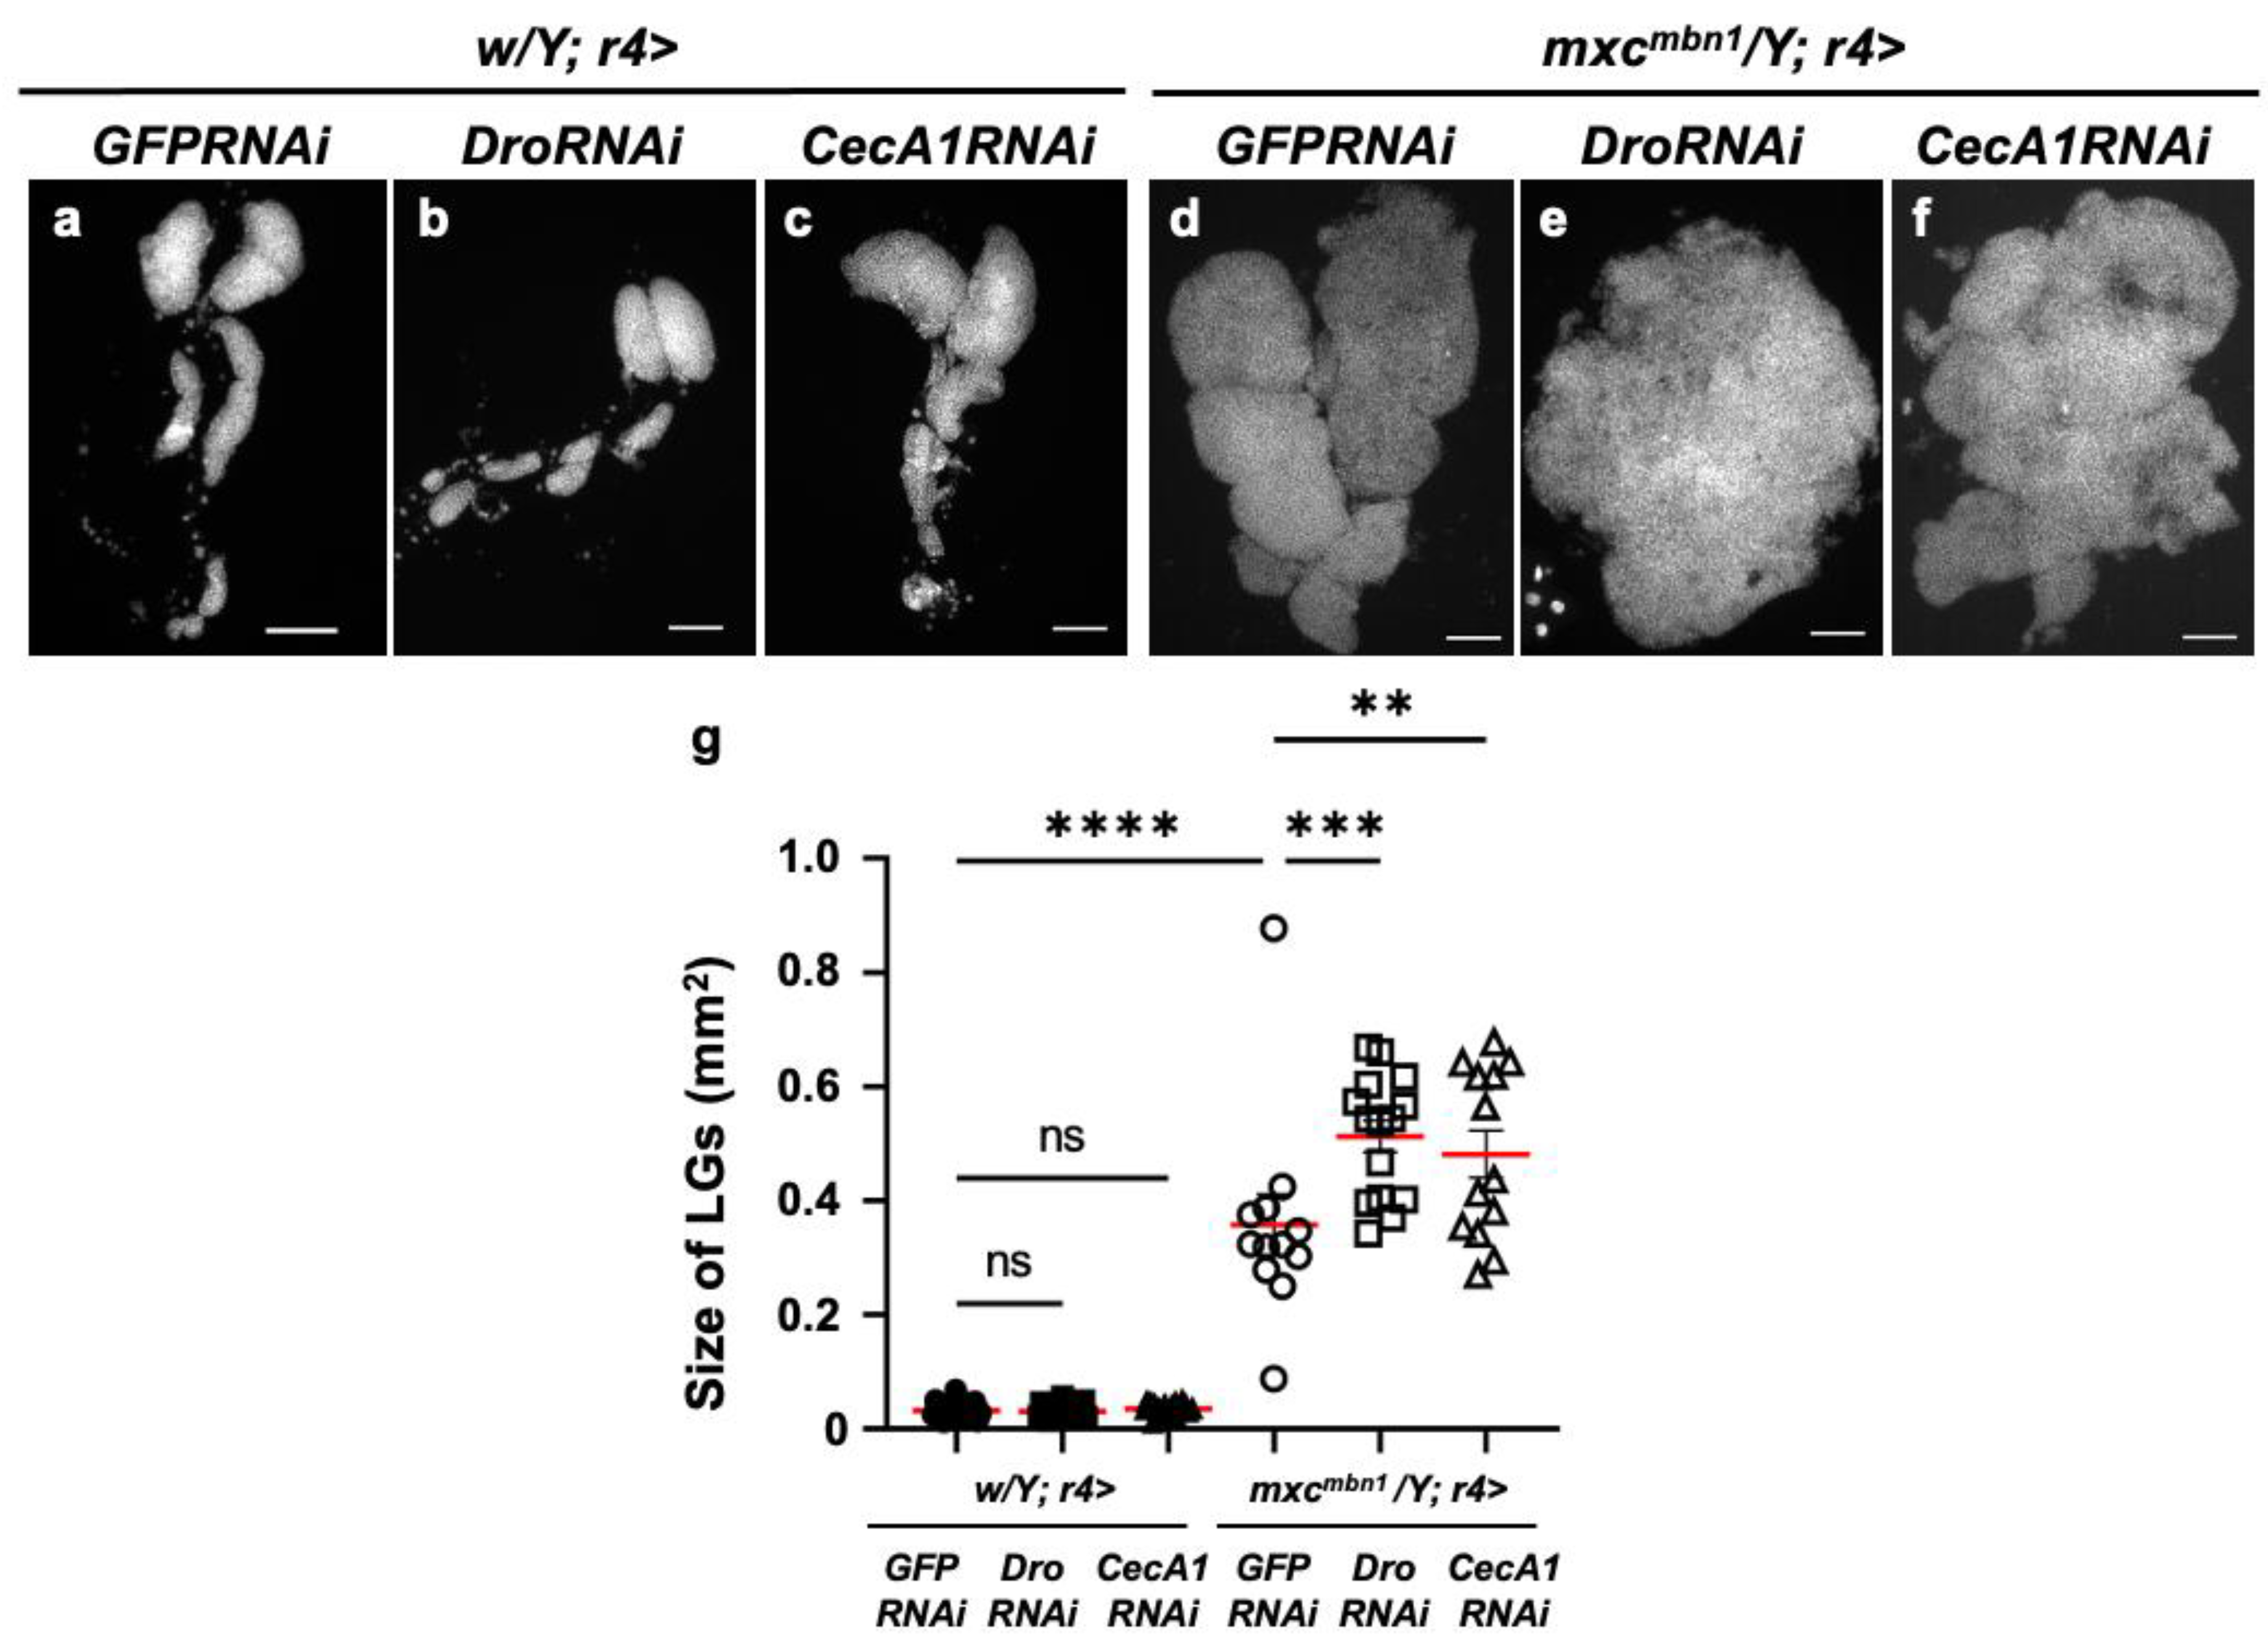
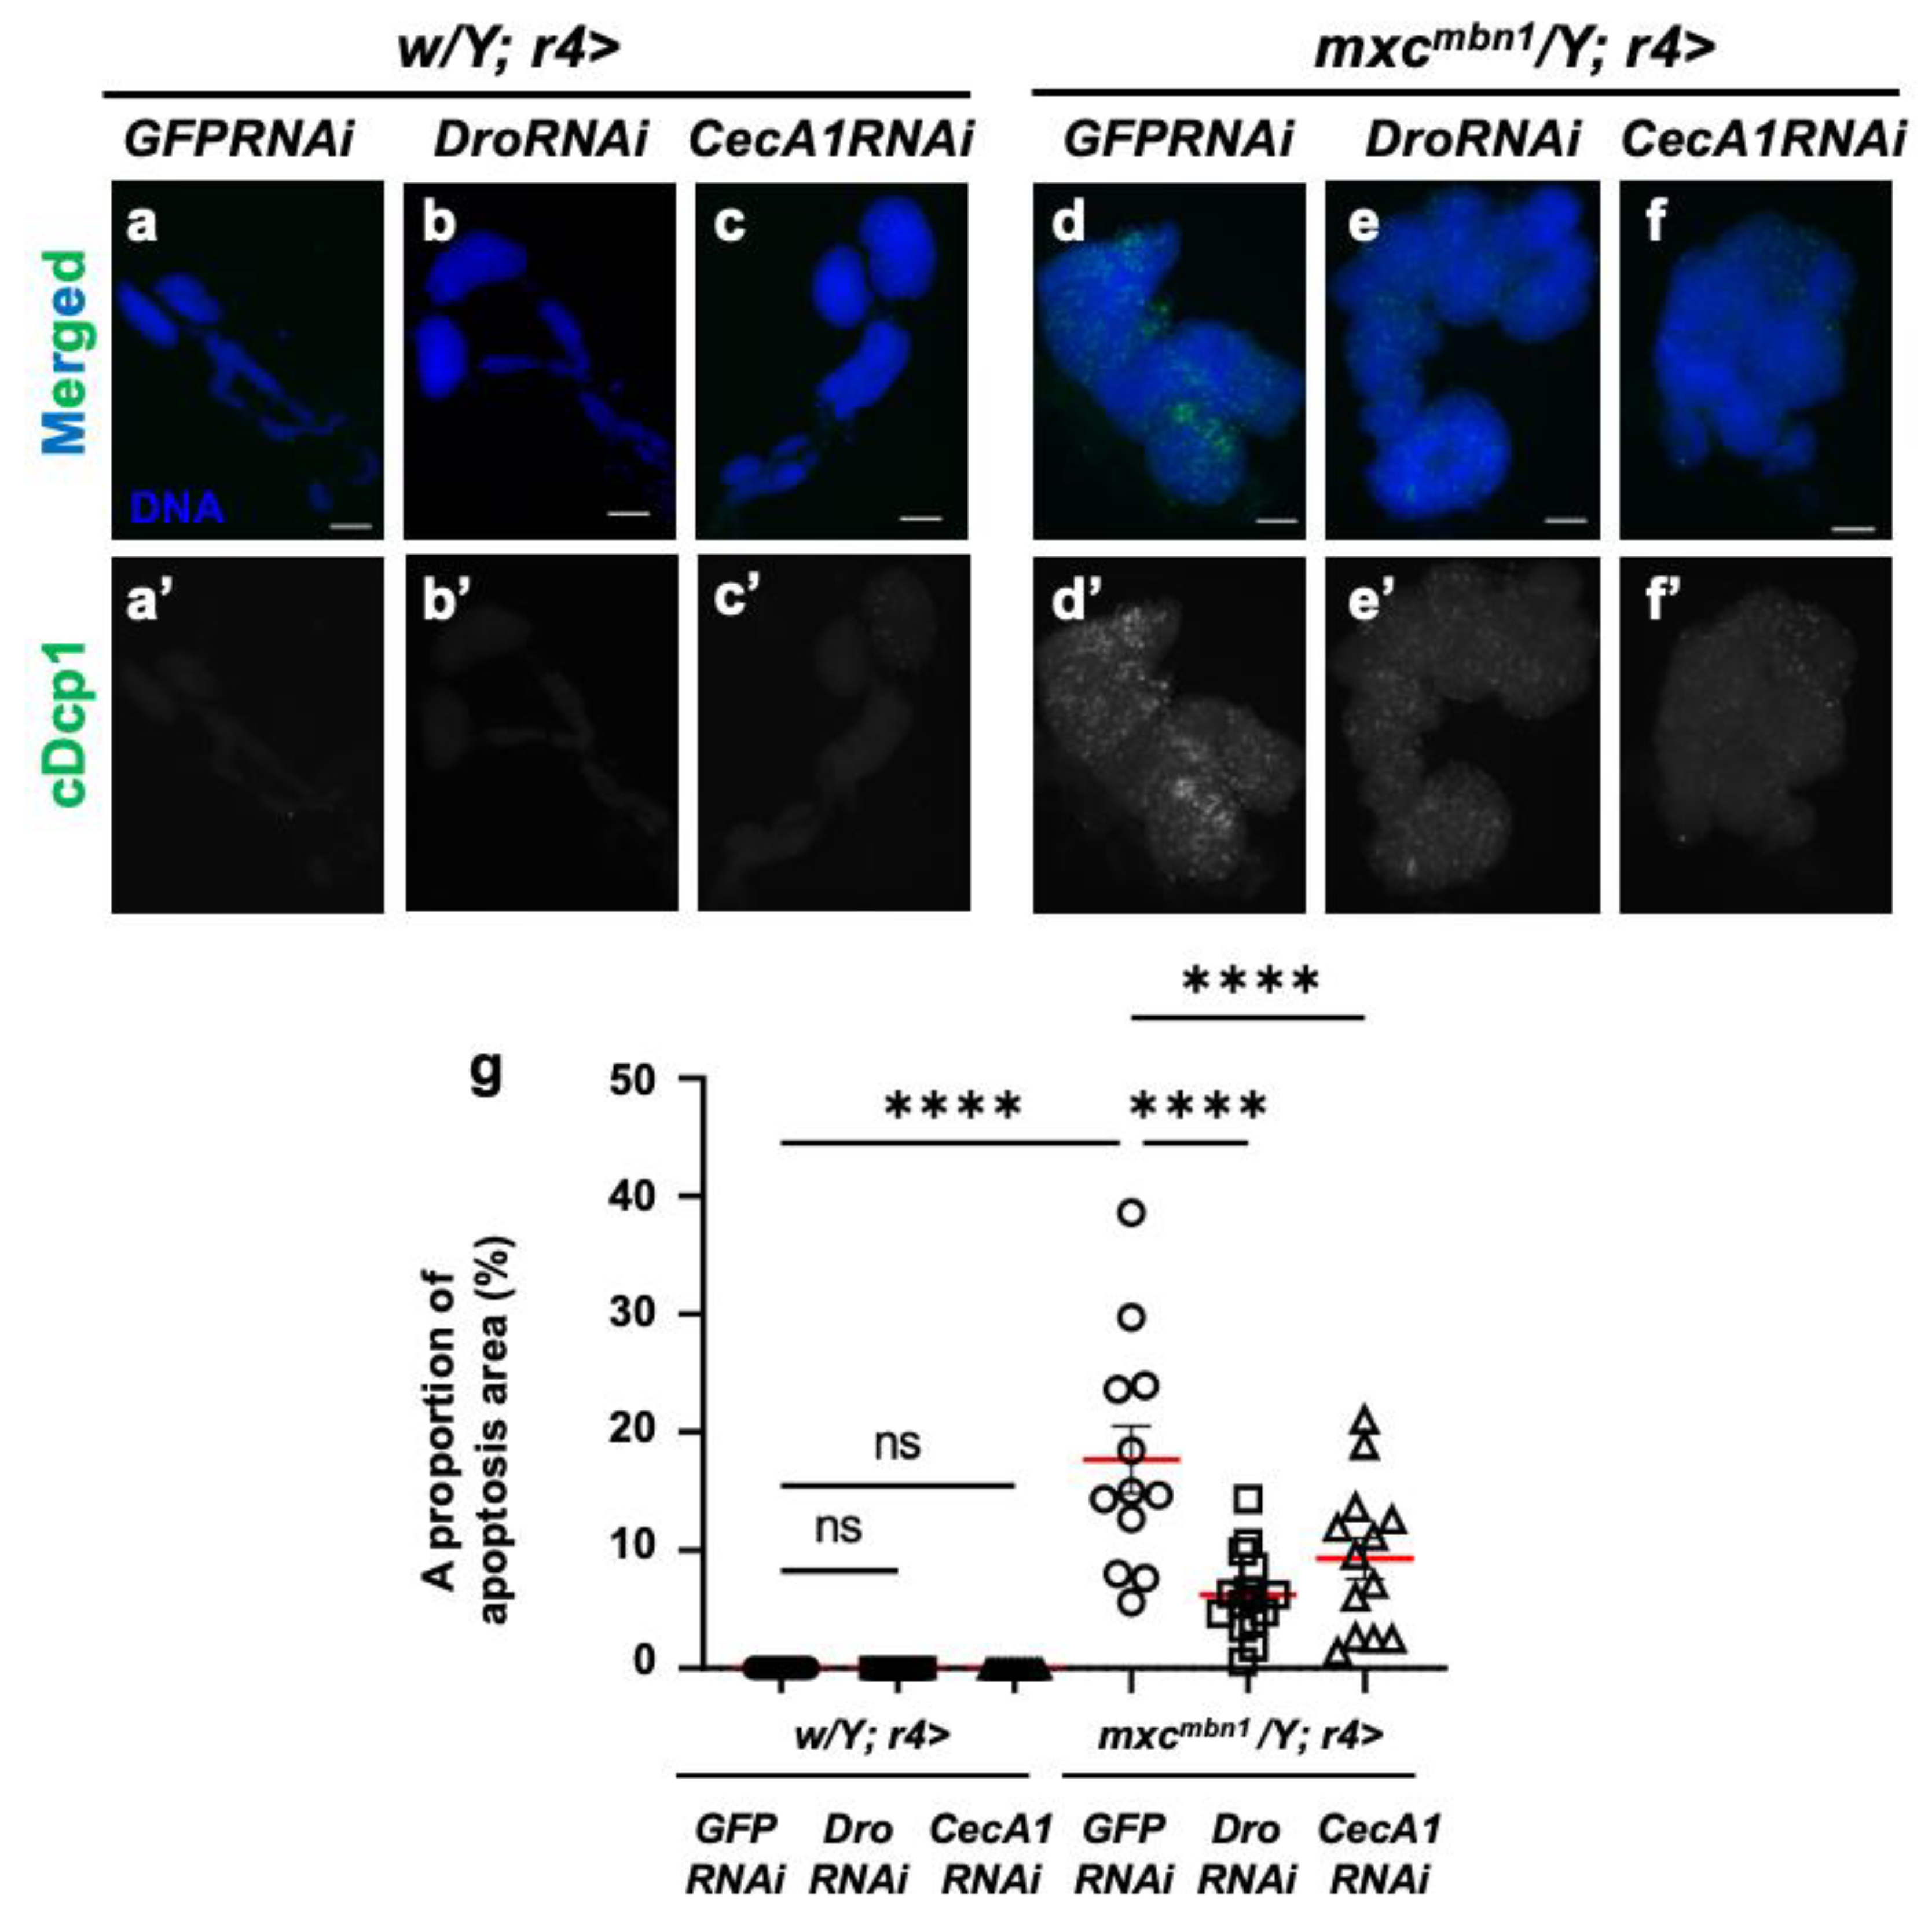
3.5. Dro or CecA1 knockdown in the fat body enhanced LG hyperplasia and suppressed apoptosis in LG tumors in mxcmbn1 larvae

We next investigated whether these two AMPs exhibited an anti-tumor effect. We induced dsRNA against Dro mRNA (w/Y; r4>DroRNAi) or dsRNA against GFP mRNA in the fat body of normal controls (w/Y; r4>GFPRNAi) (Figure 4a, b). The average LG tumor sizes of these controls were 0.032 mm2 (n = 20) and 0.031 mm2 (n = 21), respectively (Figure 4g). No significant differences were observed. Further, we compared LG size between mxcmbn1 larvae harboring fat body-specific Dro depletion (mxcmbn1/Y; r4>DroRNAi) and mxcmbn1 mutant larvae expressing non-specific dsRNA against GFP mRNA (mxcmbn1/Y; r4> GFPRNAi) (Figure 4d, e). The average size of the LG lobe area in mutant larvae harboring the Dro depletion (mean: 0.51 mm2, n = 15) was significantly larger (1.43 times) than that in the controls (mean: 0.36 mm2, n = 12) (Figure 4g) (p < 0.001). These results indicated the anti-tumor effect of Drosocin, which suppressed LG tumor growth in mxcmbn1.
Consistently, fat body-specific depletion of CecA1 (w/Y; r4>CecA1RNAi) or ectopic expression of non-specific dsRNA against GFP mRNA (w/Y; r4>GFPRNAi) did not significantly affect LG size in normal larvae (Figure 4a, c). We compared the LG size of mxcmbn1 larvae harboring fat body-specific depletion of CecA1 (mxcmbn1/Y; r4>CecA1RNAi) with that of mxcmbn1 mutants expressing dsRNA against GFP mRNA (mxcmbn1/Y; r4> GFPRNAi) (Figure 4d, f). The area of the entire LG lobe region in the mutant larvae harboring the depletion of CecA1 (mean: 0.48 mm2, n = 13) was larger (1.34 times) than that of the controls (mean: 0.36 mm2, n = 12) (Figure 4g) (p < 0.01). These results indicate that Cecropin A also has an anti-tumor effect on mxcmbn1 LG tumors.
To further confirm apoptosis induction in mutant LGs by Dro or CecA1 overexpression, we investigated whether their depletion influenced LG tumors. First, we confirmed that neither depletion of Dro mRNA (w/Y; r4>DroRNAi) nor ectopic expression of non-specific dsRNA against GFP mRNA (w/Y; r4>GFPRNAi) in the fat body influenced a positive area stained with anti-cDcp1 antibody in LGs of normal larvae (Figure 5a’, b’). In mxcmbn1 larvae harboring fat body-specific expression of dsRNA against GFP mRNA, we observed anti-cDcp1 immunostaining signal in an average of 17.7% of the total lobe areas (n = 12) in the mutant LG in third instar larvae (mxcmbn1/Y; r4>GFPRNAi). In contrast, in the LGs of the mutant larvae harboring fat body-specific depletion of Dro (mxcmbn1/Y; r4>DroRNAi), we observed an average of 6.2% of the total lobe areas (n = 15) (Figure 5d, e). This percentage declined to 35% of that in the LGs of mutant larvae harboring the non-specific dsRNA expression (Figure 5g) (p < 0.0001). These results indicate that Drosocin induces apoptosis in LG tumors in mxcmbn1 mutant larvae.
Next, we also confirmed whether CecA1 depletion in the fat body suppressed apoptosis in the mutant LGs. We confirmed that neither depletion of CecA1 mRNA (w/Y; r4>CecA1RNAi) nor ectopic expression of non-specific dsRNA against GFP mRNA (w/Y; r4>GFPRNAi) in the fat body influenced apoptosis areas in the LGs of normal larvae (Figure 5a’, c’). In contrast to the average percentage of 17.7% (n = 12) in the mutant LGs, (mxcmbn1/Y; r4>GFPRNAi), we observed the apoptosis signals in an average 9.3% (n = 13) of the total lobe area in the LGs of the mutant larvae at the same third instar stage (Figure 5d, f). This percentage declined by approximately 50% in the LGs of mutant larvae harboring the non-specific dsRNA expression (Figure 5g) (p < 0.0001). These results indicate that Cecropin A induced apoptosis in the LG tumors of mxcmbn1 larvae.
Furthermore, we investigated whether synthetic cecropin A peptides injected into the mxc mutant larvae could also induce apoptosis in the LG tumors. As synthetic cecropin A of H. cecropia was commercially available, we injected the solutions into mxcmbn1 larvae at the third instar stage. Fifteen hours later, we observed whether the apoptosis areas in the mutant LGs increased compared to the areas of mutant larvae injected with PBS only (Figure 6a-d). The average percentage of the cDcp1-positive areas within the mutant LGs increased by 48.3%, compared with the PBS-injected control (Figure 6e). The difference was statistically significant (p < 0.01, Figure 6e). These results suggest that synthetic cecropin A peptides of a different species can also induce apoptosis in Drosophila LG tumors.

3.6. Dro or CecA1 overexpression in the fat body did not affect cell proliferation in the LGs of mxcmbn1 larvae

Presumably, another potential anti-tumor mechanism of these two AMPs may be the inhibition of LG cell proliferation. To test this possibility, we observed mitotic cells in the LGs of mutant larvae overexpressing Dro or CecA1 in the fat body. Anti-phosphorylated histone H3 immunostaining revealed 3.0% (n = 20) mitotic cells of the total lobe region in normal LGs (Figure S3a-c). Although this percentage was approximately 30% higher than the average of 4.0% (n = 20) in mxcmbn1/Y; r4>+ (Figure S3d), the differences were not statistically significant. Next, we observed mitotic cells in 14.8% of the total lobe area in Dro-overexpressing third instar stage mutant larvae (mxcmbn1/Y; r4>Dro) LG (Figure S3e). Although this percentage reduced from average (16.0%, n = 20) in LGs of mxcmbn1/Y; r4>+ (n = 20), the difference was not statistically significant (p = 0.347, Figure S3g). Thus, Drosocin overexpression failed to alter cell proliferation in the LG tumors of mxcmbn1 mutants.
Similarly, we induced CecA1 overexpression in the fat body and performed anti-PH3 immunostaining of LGs in the larvae at the third instar stage using anti-PH3 antibody. Inducing CecA1 expression in the fat body of mxcmbn1 mutant larvae (mxcmbn1/Y; r4>CecA1) resulted in immunostaining of an average of 16.4% (n = 17) of the total lobe area in the LG of third instar stage larvae, similar to 16.0% in mxcmbn1/Y; r4>+ larvae (n = 20) (Figure S3d, f). However, this difference was not statistically significant (p = 0.44, Figure S3g). Thus, similar to Drosocin, Cecropin A overexpression did not affect cell proliferation in mxcmbn1 LG tumors.

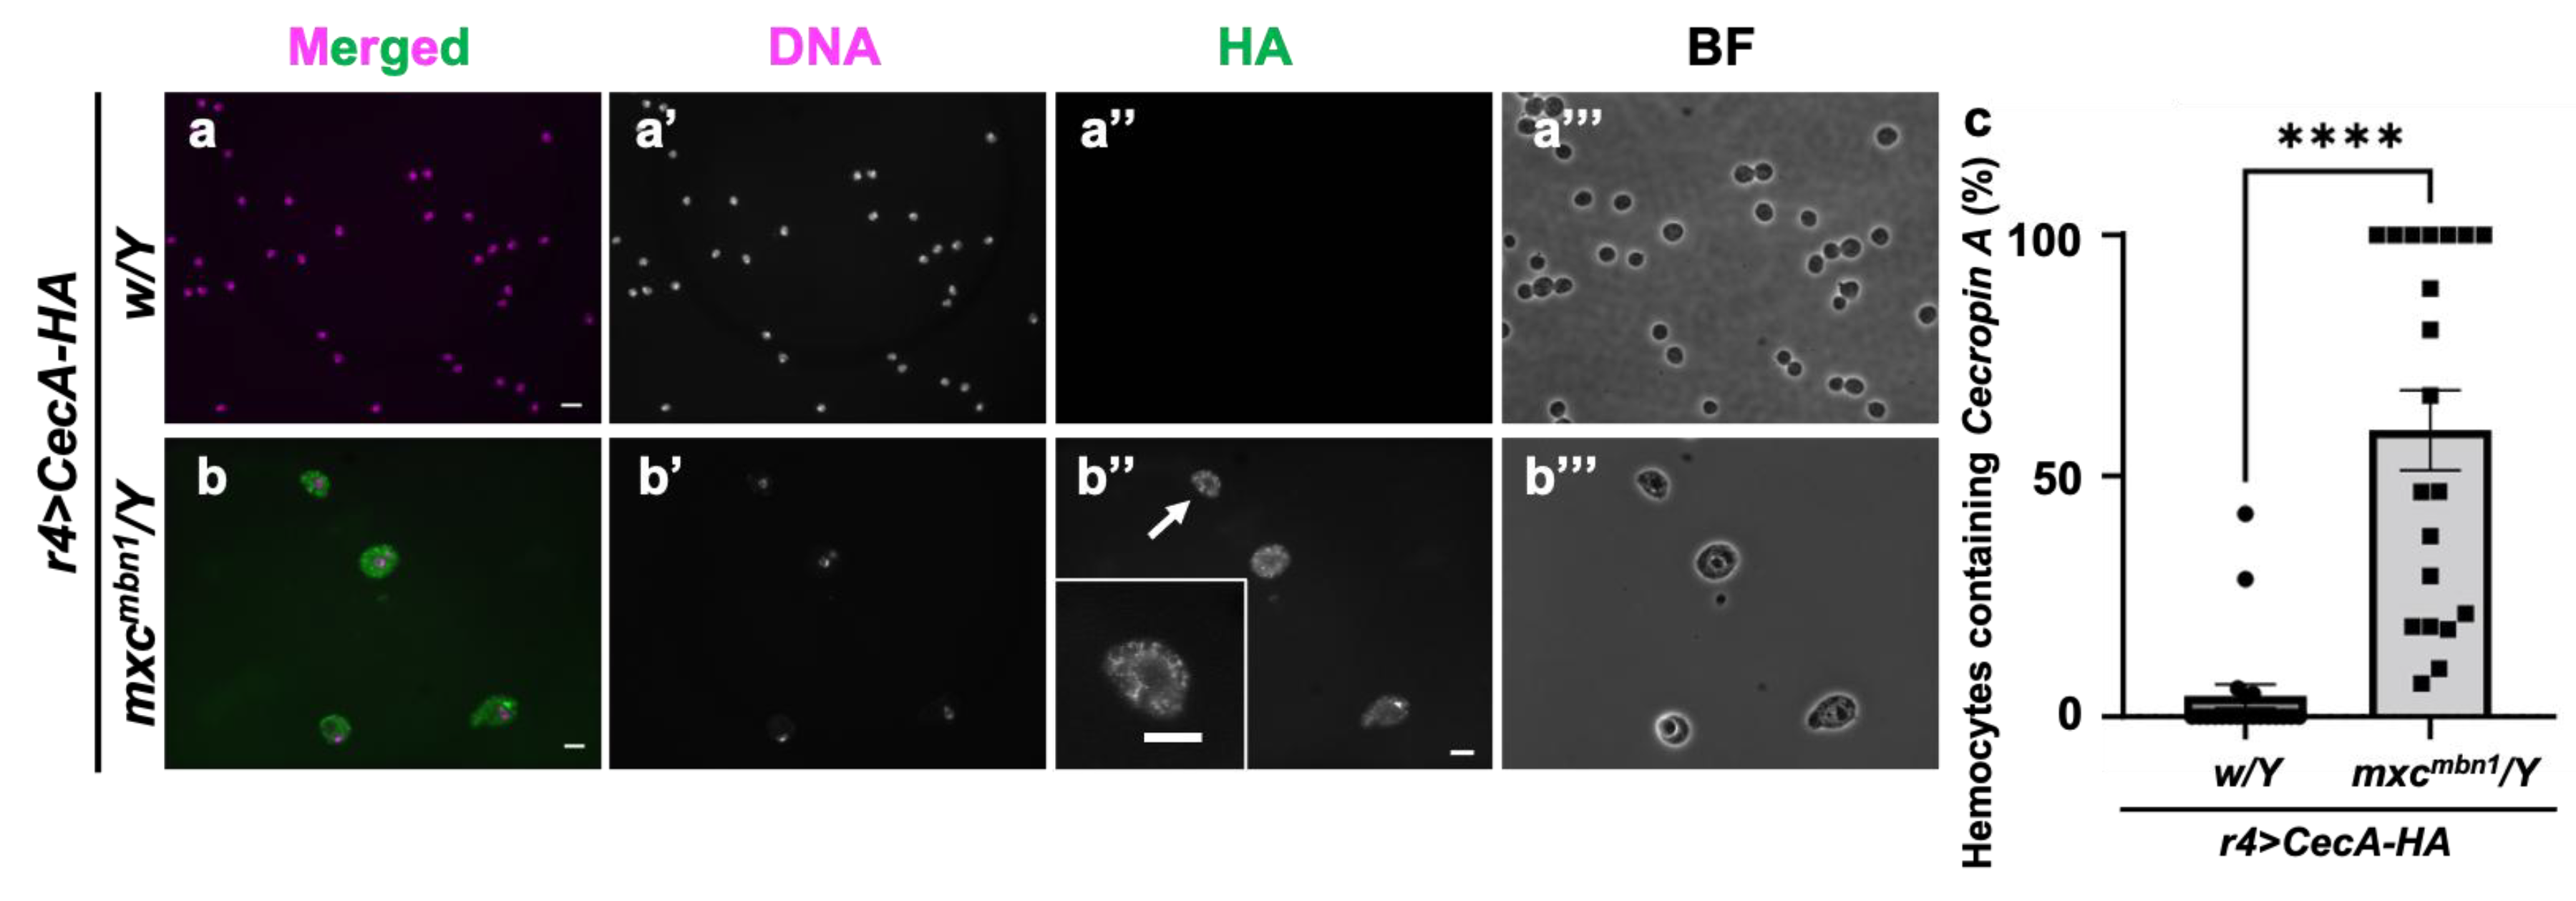
3.7. Incorporation of Cecropin A into the circulating hemocytes in tumor-bearing mxcmbn1 but not in control larvae

Next, we investigated how Cecropin A, synthesized in the fat body and secreted into the hemolymph, acts on LG tumors (Figure 7). Other AMPs—Drosomycin, Diptericin, and Defensin—are incorporated into hemocytes in the hemolymph of tumor-bearing larvae in mxcmbn1. We therefore investigated whether Cecropin A has a similar property. HA-tagged Cecropin A was expressed in the fat body of mxcmbn1 larvae (mxcmbn1/Y; r4 > CecA1-HA) and immunostaining of the circulating hemocytes was performed with anti-HA antibody to see whether it would be taken up by the cells. We observed HA immunostaining signals indicating Cecropin A inside 59.5% of hemocytes in the mxc mutant larvae (n = 450 hemocytes from 7 larvae were examined) (Figure 7b”). In contrast, we found few signals in the hemocytes of control larvae (n = 443 cells from 10 larvae)(Figure 7a”).

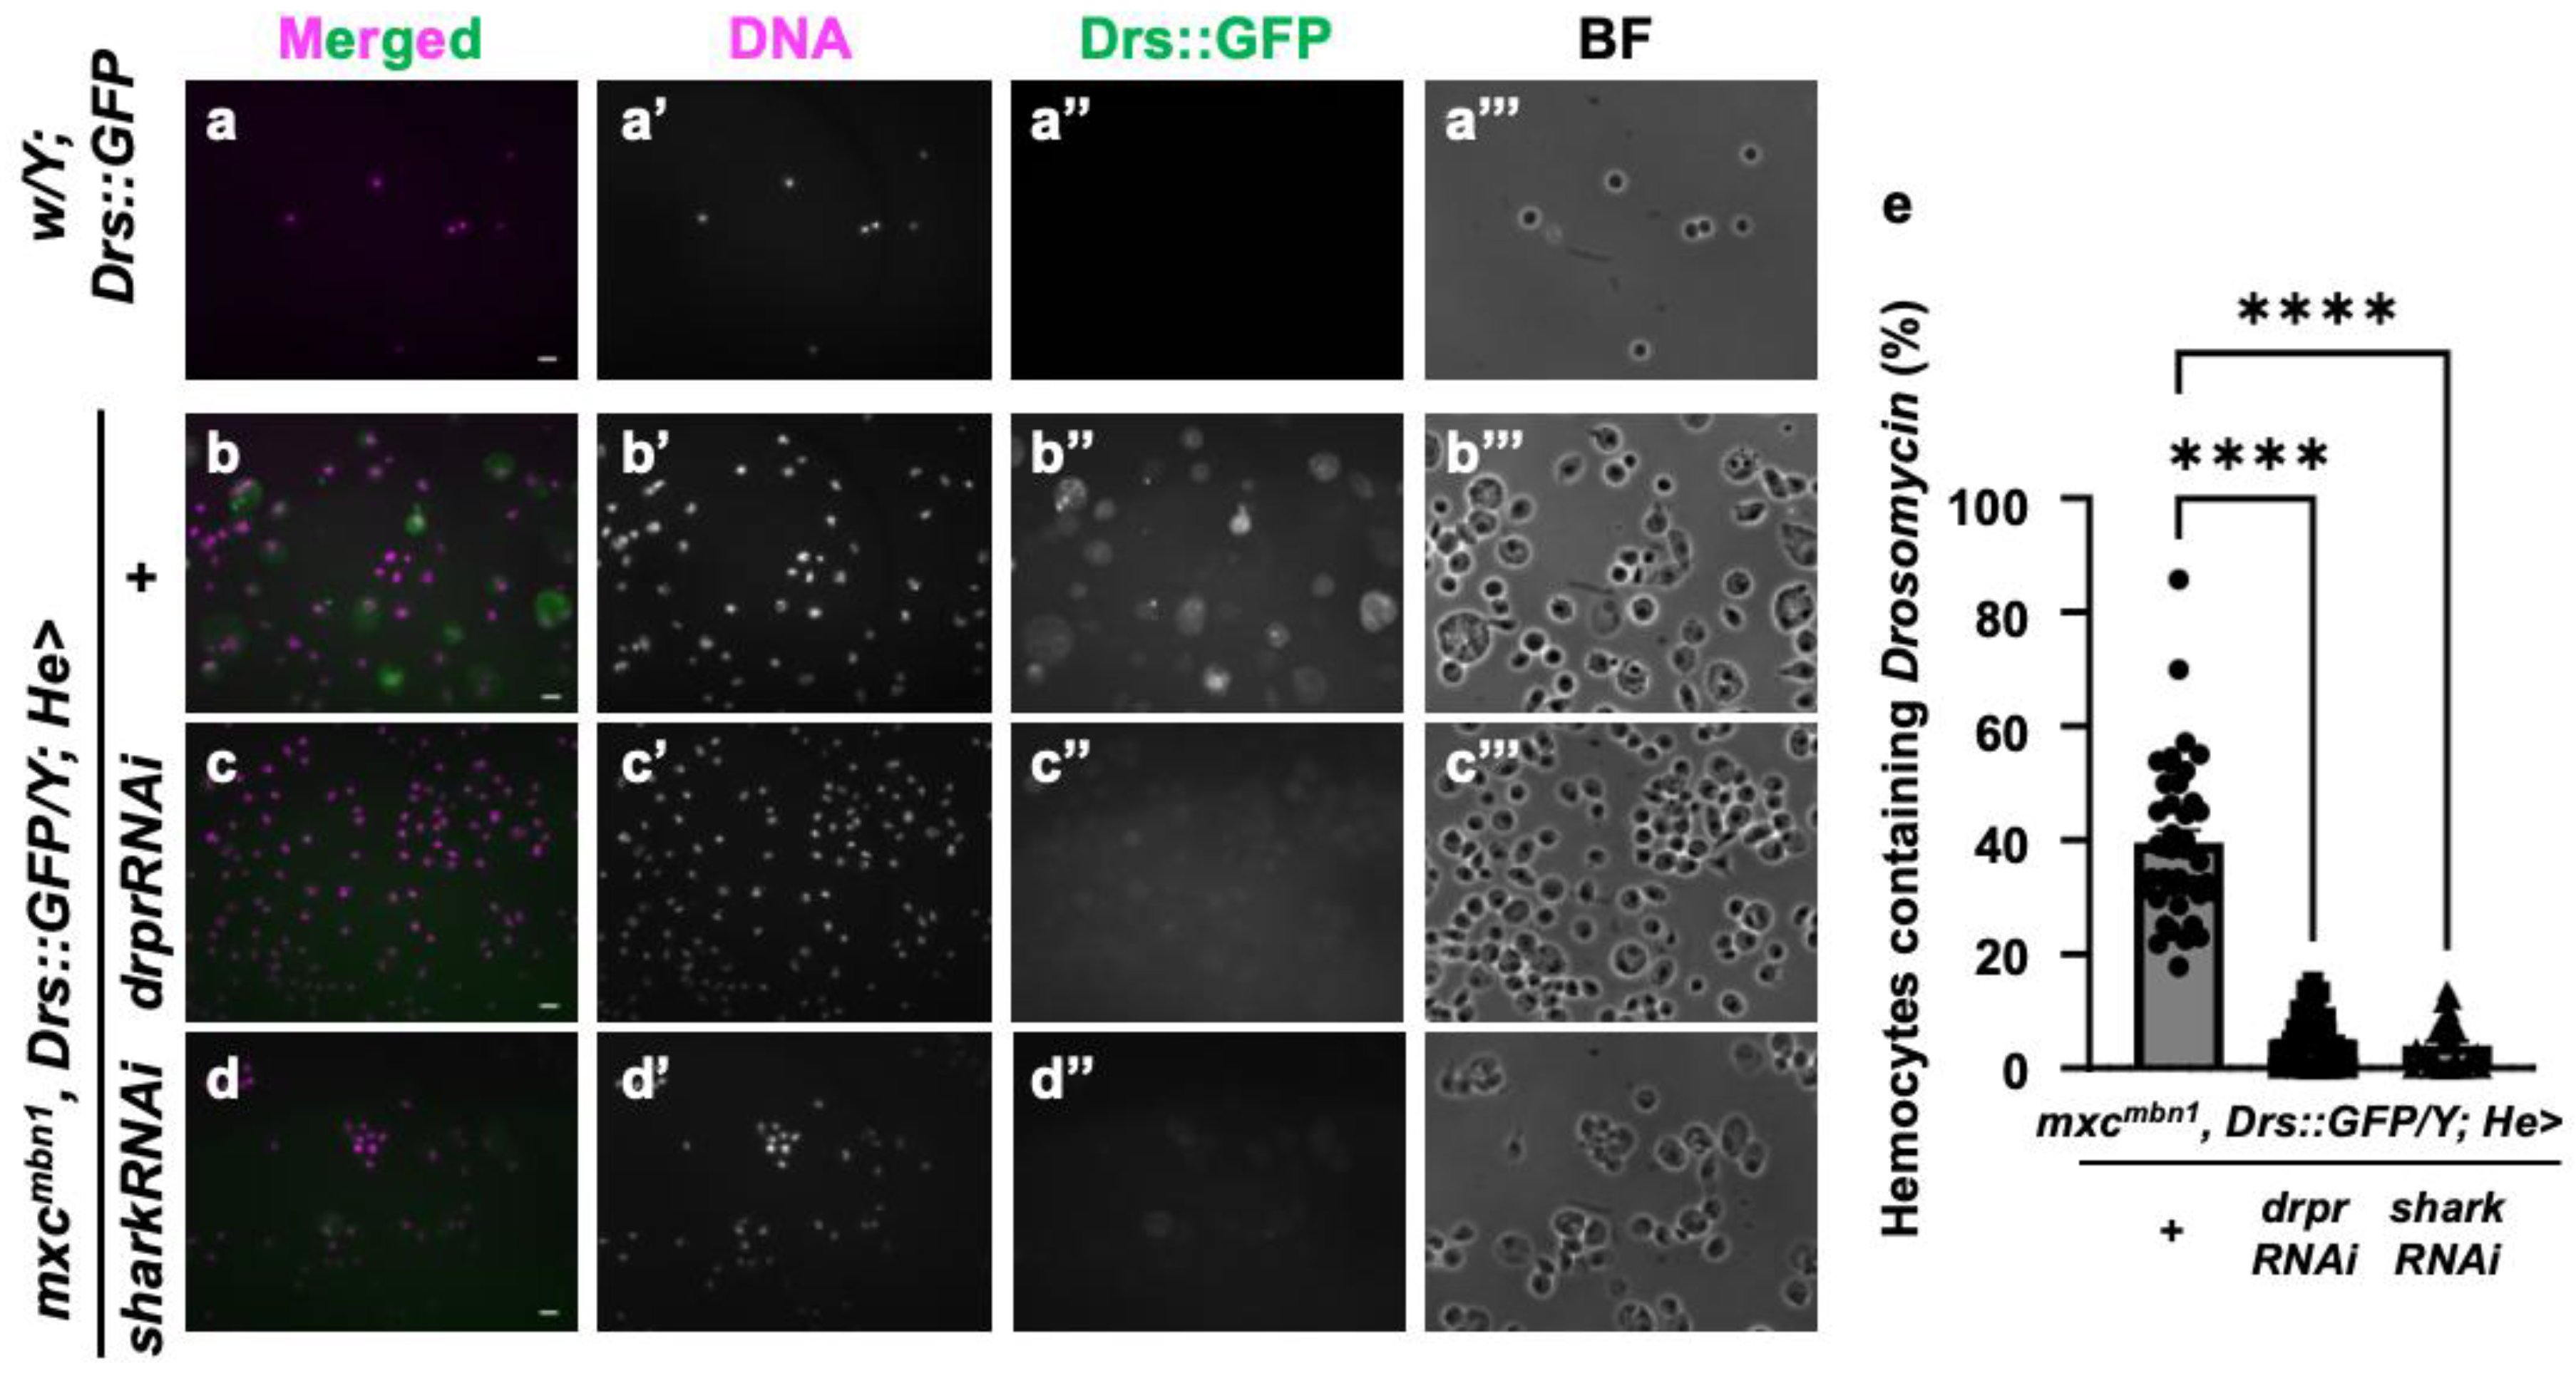
3.8. Drosomycin incorporation into the hemocytes required Draper signaling in mxcmbn1 larvae

Next, we investigated the specific mechanism by which AMPs known to possess anti-tumor properties are taken up into the circulating hemocytes in the mxc mutant larvae bearing the LG tumor. As we speculated that endocytosis factors mediate the process, we depleted mRNA for Draper, a phagocytosis factor, specifically in the hemocytes. Since antibodies against Cecropin A or other well-known AMPs are unavailable, we used the stock that permits the expression of GFP-tagged Drosomycin under its gene promoter (Drs::GFP). This AMP is also incorporated into the circulating hemocytes in the mutant larvae [26]. We examined the cellular localization of the anti-tumor AMP in the hemocytes using this GFP fusion protein. GFP signals indicative of Drosomycin were not detected in the hemocytes of w, Drs::GFP/Y larvae (374 hemocytes from 6 larvae, 30 fields on the microscope) (Figure 8a”). By contrast, a 10-fold increase in fluorescence intensity was detected in the cytoplasm of hemocytes in mxcmbn1, Drs::GFP/Y larvae (1,021 cells from 8 larvae, 40 fields on the microscope) (Figure 8b”). There were no alterations in the number of circulating hemocytes in larvae harboring hemocyte-specific depletion of phagocytosis factors, Draper and Shark (w/Y; He > drprRNAi and w/Y; He > sharkRNAi) compared to control larvae (w/Y), suggesting that depletion of these factors did not affect hemocyte survival. Thus, we next depleted these mRNAs specifically in the hemocytes of the mutant larvae (Figure 8c, d). The number of GFP+ cells decreased to 5.1% and 3.5 % (107 cells/2,098 cells, 40 fields, and 42 cells/1,193 cells, 30 fields, respectively) compared to 39.5% (360 cells/1,021 cells, 40 fields) of hemocytes the depletion (mxcmbn1, Drs::GFP; He>+). The differences are significant in both cases (p < 0.0001) (Figure 8e). The intensities of the GFP signal indicative of Drosomycin within the hemocytes also decreased below a background level (Figure 8b”-d”). From these results, we concluded that when drpr or shark mRNA is depleted in hemocytes, the uptake of Drs is inhibited. In other words, this suggests that the Draper signaling in hemocytes is indispensable for the uptake of into hemocytes in mxcmbn1 larvae.
Furthermore, to exclude the possibility that gene transcription was induced in the mxc mutant hemocytes, we monitored its gene expression using a Drs-YFP reporter. We did not see any YFP signals indicating its expression in the mxcmbn1 mutants and the controls (Figure S4a’, b’, n = 245 hemocytes from 5 larvae). From these results, we concluded that Drs is not transcribed in circulating hemocytes in the mxcmbn1 mutant larvae. Based on these results, Drosomycin is incorporated, but not transcribed, into circulating hemocytes, specifically those of the mxcmbn1 larvae bearing the LG tumors, which require phagocytosis factors: Draper and Shark.

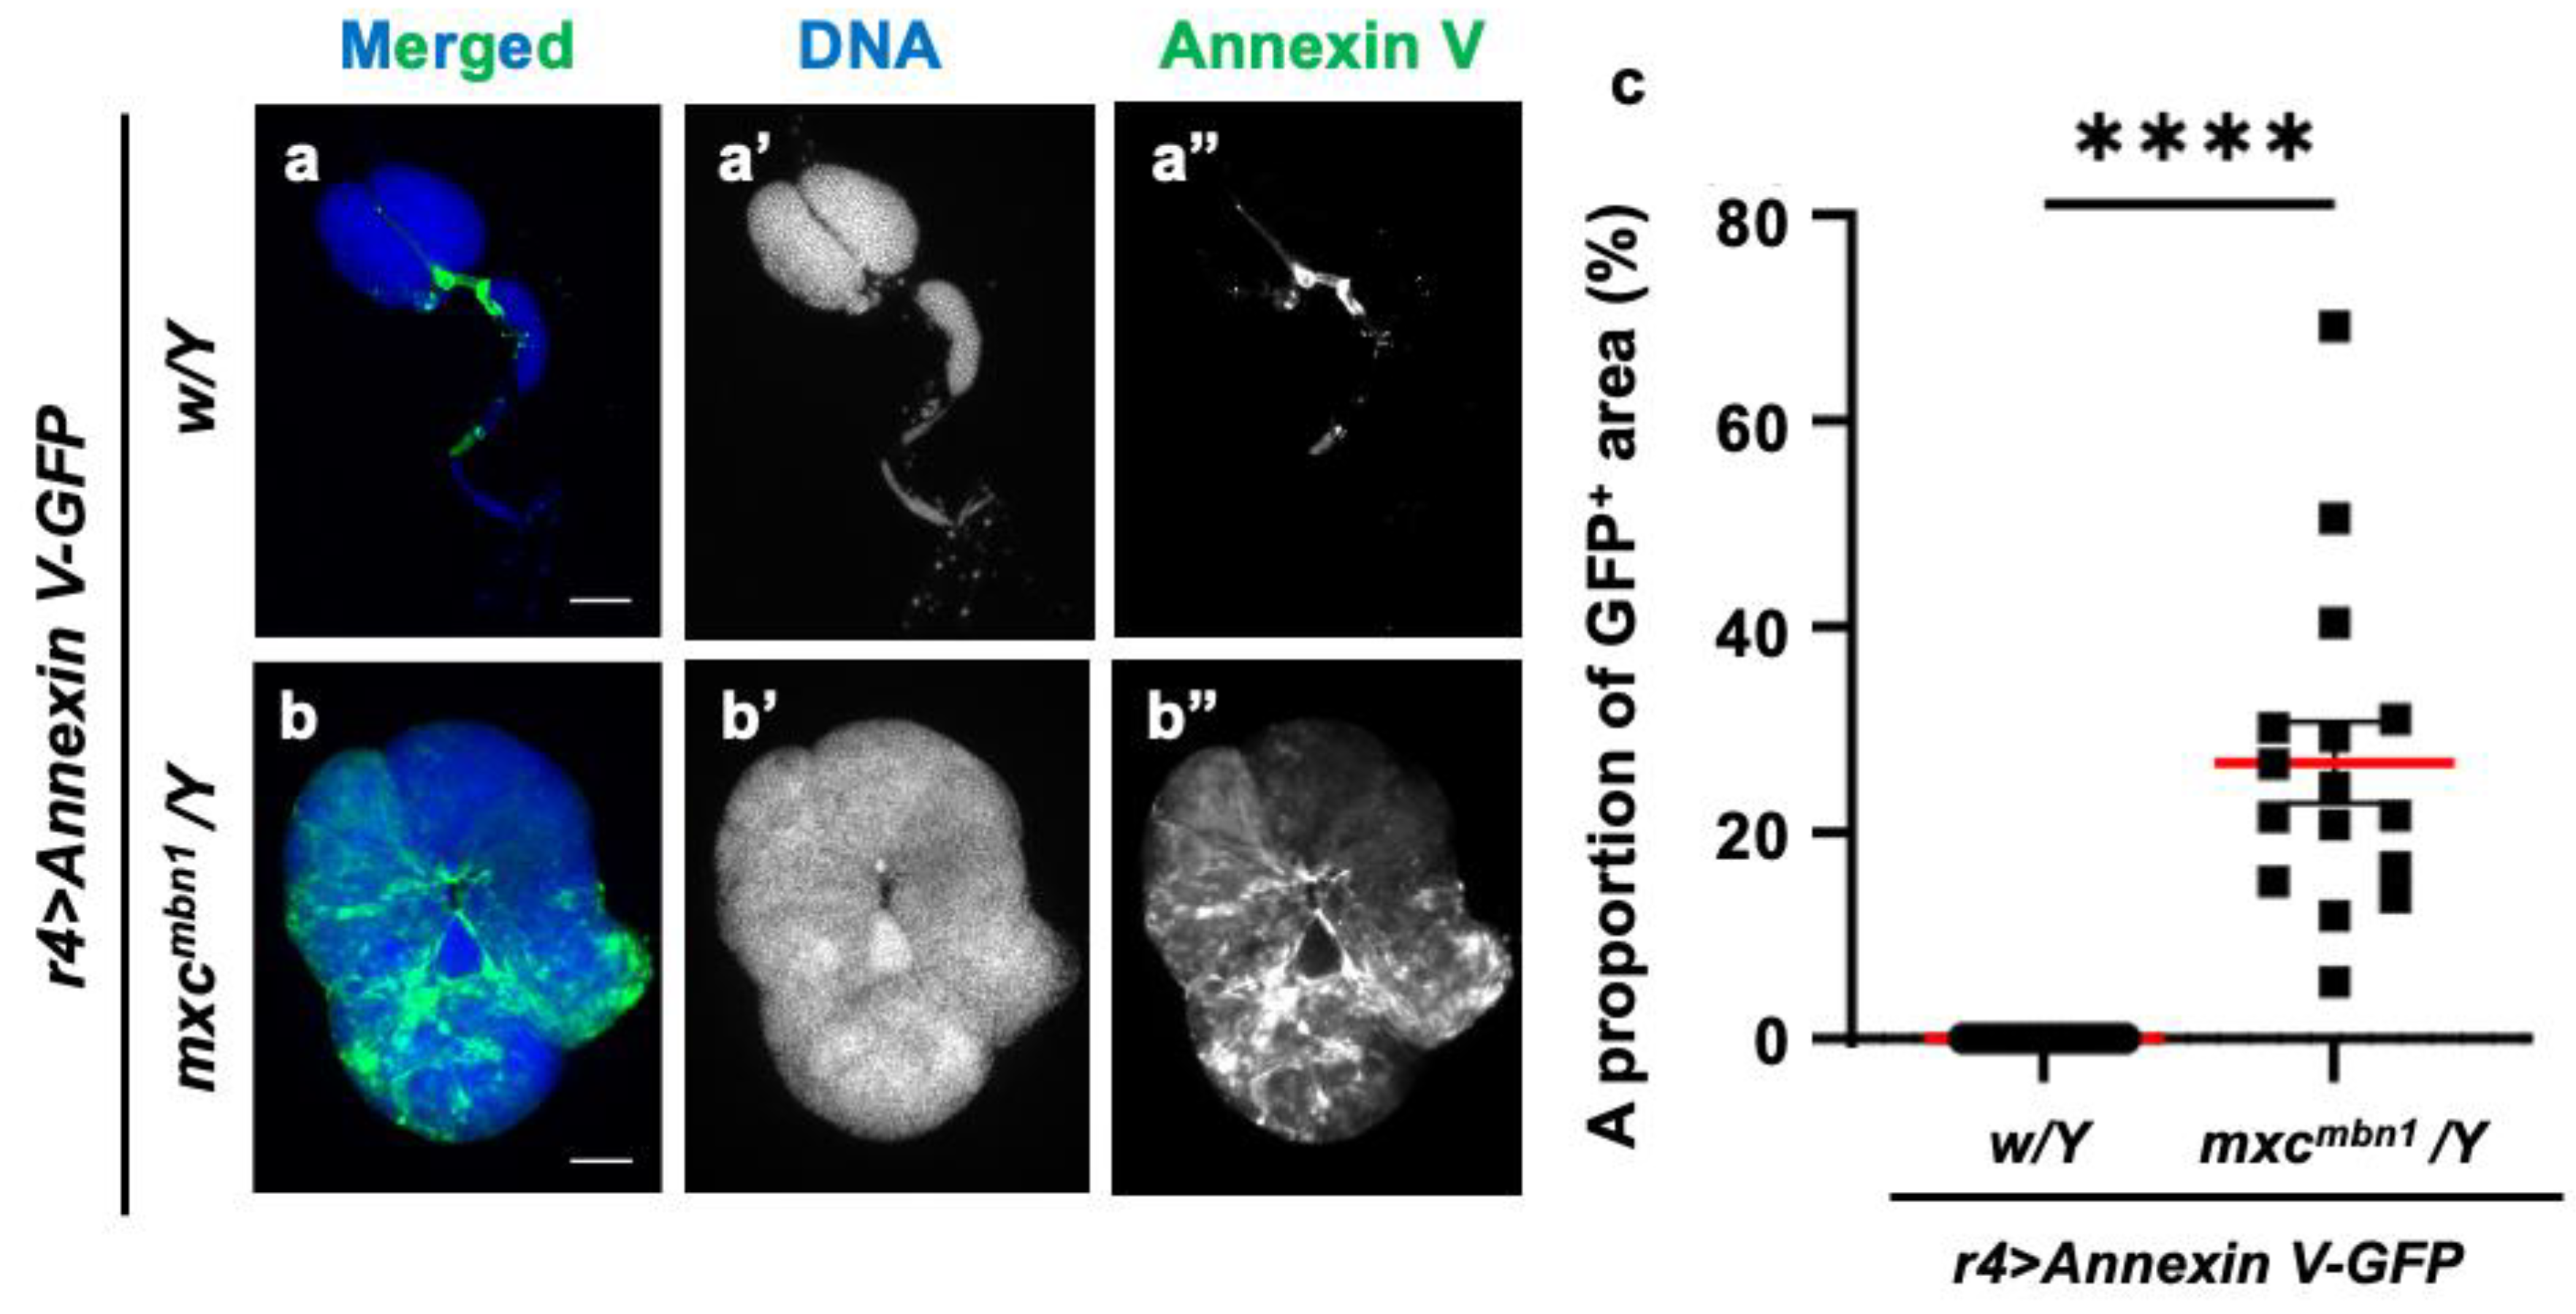
3.9. Phosphatidylserine localization on the plasma membrane surface in LG tumors

Phosphatidylserine (PS) is exposed on the lipid bilayer surface in cancer cells and serves as a marker for phagocytosis by macrophages. In the lipid bilayers of tumors arising on the wing discs in Drosophila dlg mutants, more PS is exposed on the surface than in the wild type [29]. Therefore, we hypothesized PS localization on the cell surface in LG tumors of mxcmbn1 mutants. To test this, we induced ectopic expression of Annexin V-GFP, which has a strong affinity for PS, in the fat body to allow hemolymph secretion. We observed GFP fluorescence in the LG tumors of mxcmbn1 larvae (mxcmbn1/Y; r4>Annexin V-GFP) but not in normal controls (w/Y; r4>Annexin V-GFP) (Figure 9a”, b”), indicating Annexin V binding. To quantify the percentage of GFP signal regions in the LG lobe regions, fixed LG samples were stained with DAPI, and the surface area of the entire LG lobe region was measured. The Annexin V-binding region (mean: 26.8%) (n = 16) increased in the LG of mxcmbn1 mutants compared to that in normal controls (n = 20) (Figure 9c) (p < 0.0001). Thus, we concluded that PS was exposed on the cell membrane surface in mxcmbn1 LG tumors.

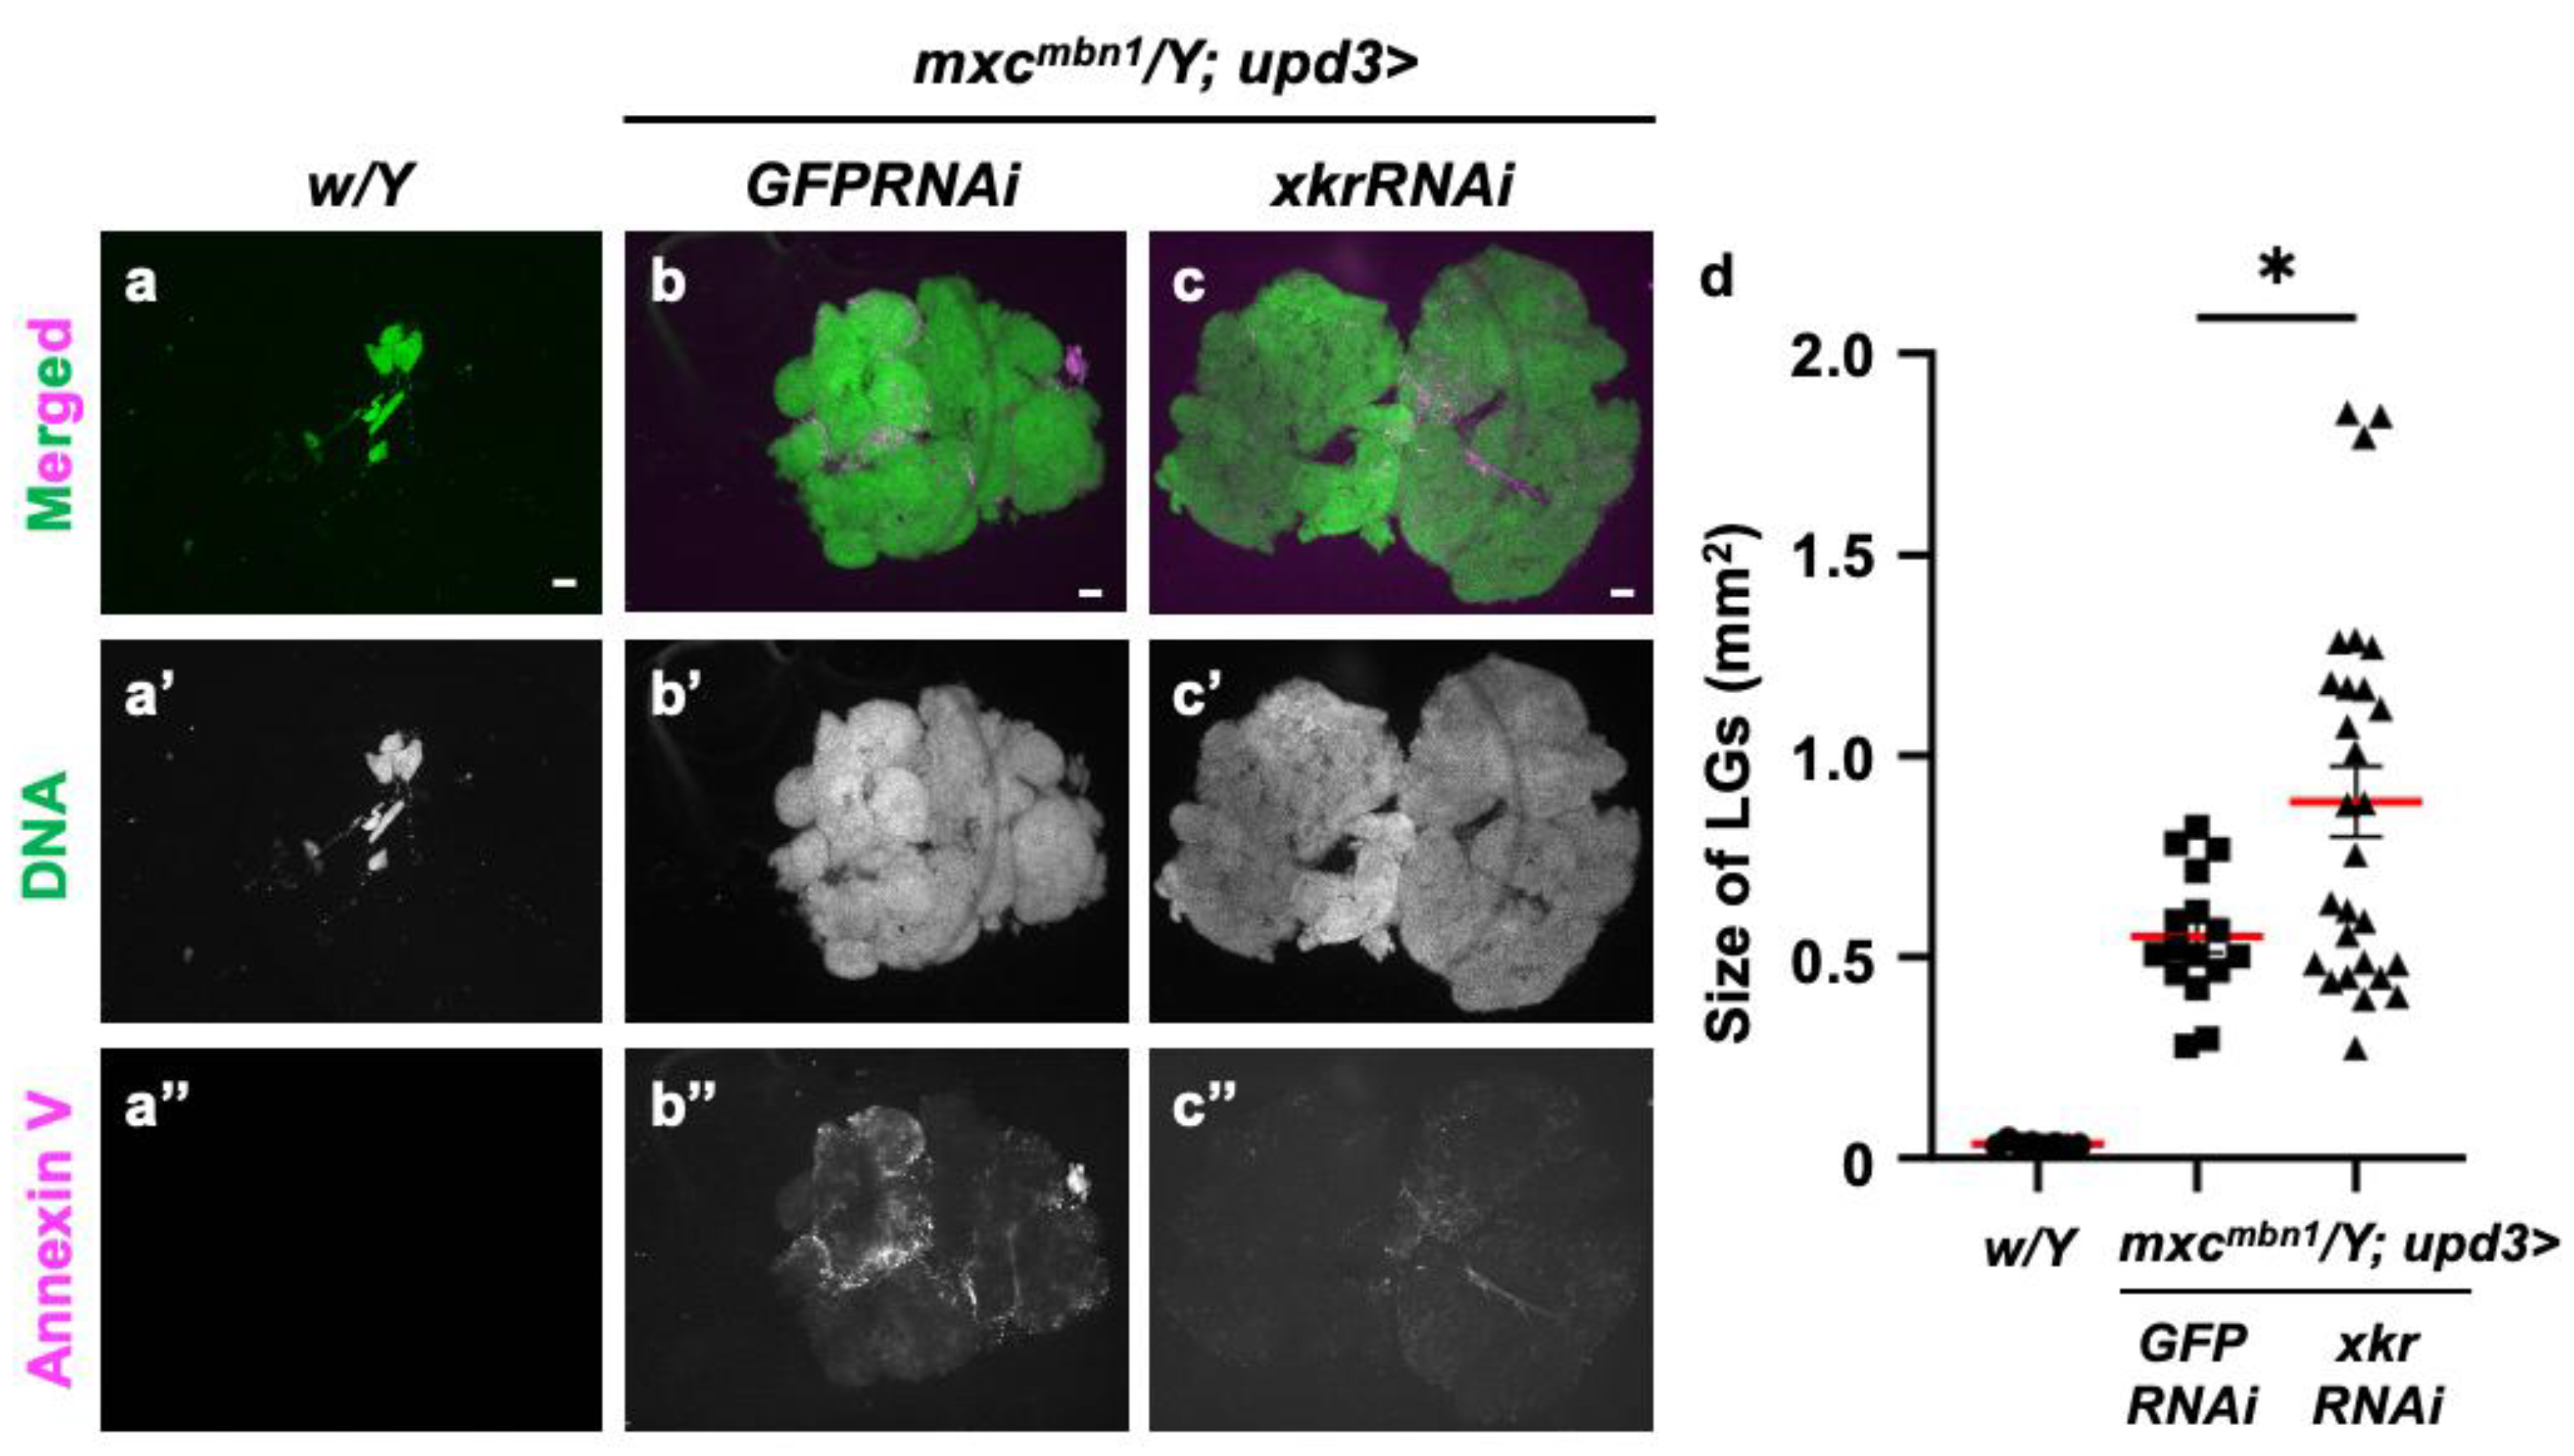
3.10. Xkr scramblase knockdown canceled PS localization on the surface of LG cells and led to LG hyperplasia enhancement in mxcmbn1

To confirm whether PS is indeed used as a target of tumor suppression, we depleted the mRNA for scramblase required to expose PS to the cell surface and examined its effect on LG tumor growth. For this purpose, we induced double-stranded RNAs against xkr scramblase mRNA using the known UAS-xkrRNAi stock [52] and the upd3-Gal4 driver, in which Gal4 is expressed in the undifferentiated cell region of the LG: the origin from which the LG tumors arise [37]. The fluorescence indicating Alexa594-Annexin V binding almost disappeared from the xkrRNAi LGs, as shown in Figure 10c”. In other words, the PS signal exposed to the cell surface in the LG tumor region was reduced. In these larvae, the LG tumor size increased to an average of approximately twice that of the control (Figure 10d). This difference was statistically significant (p < 0.05). Based on these results, we conclude that PS exposure on the surface of tumor cells is required to target anti-tumor proteins, such as Drosomycin to the LG tumor.

4. Discussion

4.1. Cecropin A and Drosocin induction via the innate immune pathways in the fat body of mxcmbn1 mutant larvae bearing the LG tumors

This study demonstrated that the levels of mRNAs encoding Cecropin A and Drosocin were elevated in the fat body of mxcmbn1 larvae bearing LG tumors. This upregulation depended on both the Toll-and Imd-mediated immune pathways. These findings suggest that the innate immune system plays a role in suppressing cancer cells, even in Drosophila. In mammals, both the innate and acquired immune systems are involved in eliminating cancer cells [53,54,55,56]. By contrast, invertebrates lack an acquired immune system. Consequently, the tumor-suppressive effects described in this study are attributable to the innate immune system. This process involves the participation of plasmatocytes, which are macrophage-like cells in Drosophila hemolymph [32,36]. In mxcmbn1 larvae with LG tumors, circulating hemocytes can recognize damage to the basement membrane and subsequently accumulate on the tumors [35]. Additionally, as this LG tumor expresses Eiger/a tumor necrosis factor (TNF) orthologue, the hemocytes recognize it via Eiger receptors on the cell surface, thereby inducing Turandot family proteins with anticancer effects [32]. Therefore, in Drosophila, cells of the innate immune system can recognize the tumor and transmit this information to the fat body. The induction of Cecropin A and Drosocin is interpreted as induced via a similar inter-tissue communication. Furthermore, crosstalk between the fat body and hemocytes is also needed to suppress tumors that arise in the wing imaginal discs. In this instance, active Spätzle, generated by the reactive oxygen species accumulated in hemocytes, activates Toll in the fat body cells [28,35]. In contrast, the mechanism by which the Imd pathway is activated in response to tumors remains unelucidated. The present study demonstrates that the induction of Cecropin A and Drosocin in the fat body is diminished in mxcmbn1 mutants when the doses of the genes for signaling factors in the Imd pathway are halved. The expression of these two AMPs during bacterial infection is regulated by both the Toll and Imd pathways [9]. It was reported that these two pathways engage in cross-talk [57]. Consequently, a Toll-mediated signal is triggered by Spätzle around tumor-responsive hemocytes associated with the fat body. This may also activate the Imd pathway, eventually inducing target AMP gene expression.

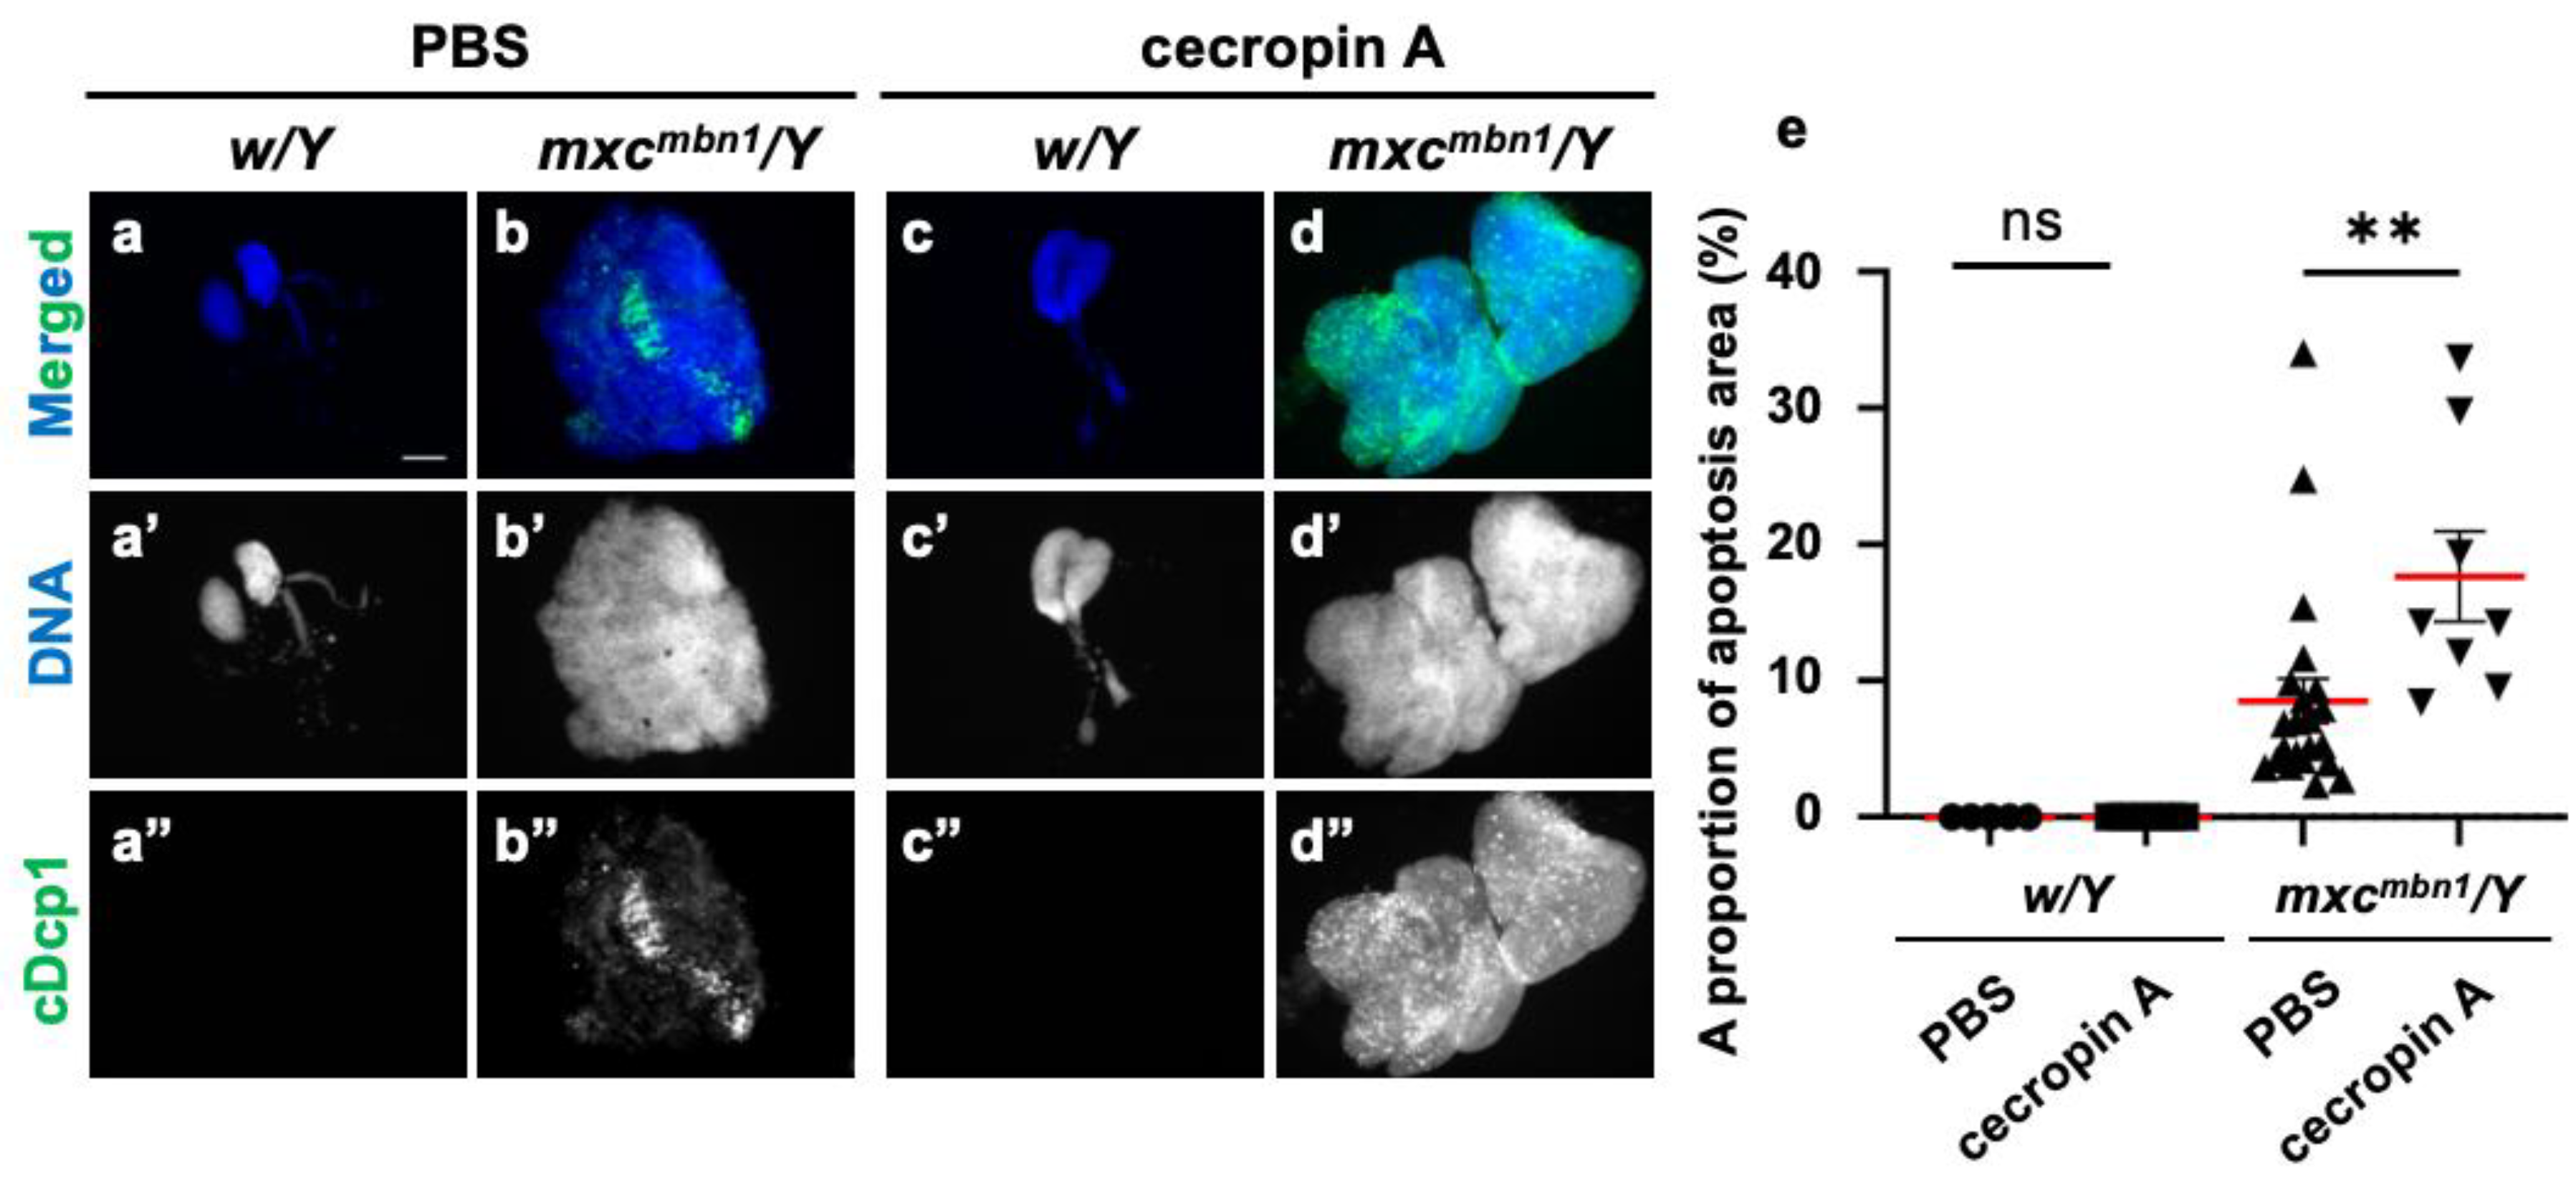
4.2. Cytotoxic effects of Cecropin A and Drosocin on tumors in Drosophila larvae

This study showed that Cecropin A and Drosocin overexpression in the fat body increased apoptosis induction and consequently reduced LG tumor size in mxcmbn1 larvae. Therefore, we conclude that these two AMPs have anti-tumor effects against LG tumors of mxcmbn1 larvae. These results are consistent with the previous findings that five other AMPs—Drosomycin, Diptericin, Defensin, Metchinikowin, and Attacin A—and two Turandot family proteins—TotB and TotF—possess antitumor properties that suppress tumor growth in Drosophila [26,29,58]. Moreover, this study demonstrated that synthetic cecropin A peptides of Cecropia moth can also stimulate apoptosis in the LG tumor in Drosophila. Consistently, housefly cecropin also induces apoptosis in human hepatocellular carcinoma cells without affecting normal cells [59]. Synthetic cecropin A possesses anticancer properties against leukemia cell lines [60,61]. These studies were performed to check the anticancer properties of AMPs of other species in vitro. By contrast, we demonstrated that cecropin A stimulated apoptosis in tumors in living organisms. Our experimental system may be used as a simple in vivo model to determine if the anti-cancer drug candidates stimulate apoptosis and suppress tumor growth. Cecropin B also exhibits selective antitumor activity against human cancer cells, which can be applied to anticancer cell therapy [62,63]. Therefore, cecropin B may exhibit a stronger antitumor effect. This will be investigated in our future study.

4.3. Tumor-specific effect of Cecropin A and Drosocin on LG tumors in mxcmbn1 larvae may be determined by the circulating hemocytes that take up AMPs

The detailed mechanism of the cytotoxic effects of AMPs on tumors while sparing normal cells remains unclear [63,64]. Drosomycin, Defensin, and Turandots are taken up by the circulating hemocytes in the mxcmbn1 mutant larvae bearing tumors but not normal larvae [26,32,58]. Basement membrane damage in LG tumors is involved in tumor cell recognition by circulating hemocytes, resulting in their accumulation [35]. Eiger, a Drosophila TNF orthologue, is ectopically expressed in the LG tumors of mxcmbn1 larvae. When hemocytes receive it via the Eiger receptor on the cell surface, Upd3—a Drosophila functional IL-6 orthologue—is induced. This is essential in transmitting information to the fat body [32]. Circulating hemocytes that recognize LG tumors may take up the AMPs in this way and accumulate in LG tumors again. The AMPs are then released from the hemocytes and can act locally on tumors.
This study demonstrated that the circulating hemocytes of mxcmbn1 larvae take up Cecropin A, although the mechanism remains unclear. The localization of HA-tagged AMP specifically induced using a fat-body specific Gal4 driver was investigated employing anti-HA immunostaining. Knocking down the genes required for hemocyte uptake using another driver in the same larvae is challenging. Antibodies to detect either AMP were unavailable, despite our efforts to generate them. We will continue to raise them and investigate the localization of Drosocin. Instead, we investigated the uptake of Drosomycin using the strain in which the GFP-tagged peptides can be induced under its promoter. We observed GFP fluorescence in the hemocytes of mxcmbn1 mutants but not in normal larvae, even though the gene was not transcribed in the hemocytes of the mutant larvae. This is consistent with the results that HA-tagged Drosomycin and other AMPs, including Cecropin A, are incorporated into the circulating hemocytes of the mutant larvae [26], this study. Using the stock expressing GFP-tagged Drosomycin, we demonstrated that phagocytosis factors, Draper and Shark [65], are required for hemocyte uptake of the AMP. The AMP is possibly taken up into vacuoles, such as phagosomes, formed during phagocytosis. Previous studies described that Drosomycin is enclosed in cytoplasmic vesicles and is transported to the endosome system when it is released from the fat body into the hemolymph against bacterial infection [66,67]. Consistently, in response to tumor cells, these incorporated AMPs are likely transported to the plasma membrane via a recycling endosome pathway [68]. Subsequently, they may be released from the cells via exocytosis [69]. This hypothesis needs to be validated in the future .

4.4. Restrictive anti-cancer effects of AMPs on the LG tumor cells in which PS was exposed on the plasma membrane surface

This study showed that Cecropin A or Drosocin overexpression in the fat body of mxcmbn1 larvae stimulated apoptosis and suppressed LG tumor growth. Furthermore, the absence of apoptosis induction in tissues of normal larvae overexpressing Drosocin or Cecropin A suggested that these AMPs act in a strict tumor-specific manner. The cell membrane surface of normal cells is positively charged, whereas that of malignant tumor cells is negatively charged. This is due to the superficial presence of PS on the external plasma membrane surface [70]. PS is retained in the inner leaflet of the plasma membrane in normal cells by scramblase [71]. In cancer cells, however, PS is exposed on the cell surface because of reduced scramblase activity [72]. The relationship between PS density on the surface and cell sensitivity to AMP has been suspected in several cancer cell lines, suggesting that PS plays a critical role in anti-cancer activity [73]. The negative surface charge of cancer cell membranes is shared by bacterial cells [64,74]. Thus, AMPs may attack tumors through a mechanism similar to that of bacteria. This implies that AMPs with positively charged amino acid sequences may easily bind to negatively charged cancer cell membranes. On insertion in the cell membrane, they can kill cancer cells by rupturing the membrane [75]. PS is prevalent on the surface of the plasma membrane in Drosophila wing disc tumors and Defensin acts by marking this PS on the surface of the tumors [29]. This study observed that Annexin V, which acts through the hemolymph, binds to the cell surface in LG tumors, sparing healthy tissues. Thus, conceivably, PS is similarly exposed on the surface of Drosophila LG tumor cells of mxcmbn1 larvae, which may facilitate AMPs’ tumor cell targeting. Thus, AMPs act on PS as a landmark, resulting in apoptosis. Taken together, we can speculate the following story: when hemocytes recognize LG tumors, they take up AMPs via phagocytosis and are recruited very close to the LG tumor, where AMPs are released. In addition to the role of hemocytes in the limitation of AMPs’ action range, their possible target, tumor cell surface PS, further restricts AMPs’ antitumor effect. Notably, an important factor in developing anti-cancer drugs is the absence of side effects. If the tumor-specific anti-cancer effects of the AMPs are proven and their acting mechanism elucidated, they are expected to constitute anti-cancer drugs with minimal side effects.
Finally, we discuss the study limitations and several issues to be addressed in the future. First, Cecropin A is incorporated into hemocytes in larvae with tumors, while Drosocin uptake has not been investigated. Antibodies that can be used for immunostaining have not been obtained. This is a limitation of this study. In future studies, we would establish a UAS line that expresses HA-tagged Drosocin and confirm its tumor-dependent uptake. Second, although we found that synthetic AMP peptides of insects other than Drosophila can also induce apoptosis in the mxcmbn1 tumors, many AMPs are not conserved between species. Exceptionally, some defensin family members are also conserved in mammals [76]. Another issue is investigating mammalian synthetic defensins' effects on LG tumors. Some AMPs require post-translational modifications such as glycosylation for their cytotoxic effects. If so, these effects may not be observed in synthetic peptides. This is a problem with this method. While the effects cannot be studied as readily as synthetic peptides, it is possible to determine whether it can suppress tumor growth by expressing mammalian AMPs in Drosophila. Third, we have shown that Drosomycin uptake requires phagocytosis factors, Draper and Shark; however, how AMPs are taken into the cell remains to be elucidated. Previous studies suggest that they are inserted into the plasma membrane and that the cellular membrane is subsequently disrupted. When such peptides are enclosed in the phagosome, the reason why they do not act on the isolating membrane is not understood. The mechanism by which the enclosed AMPs are secreted outside the hemocytes must also be identified. Exocytosis is presumed to be involved, but it is necessary to verify this through knockdown experiments of the genes required.

5. Conclusions

Two major AMPs in Drosophila, Cecropin A and Drosocin, are induced in the mxc mutant larvae harboring the LG tumors depending on the innate immune pathway. These AMPs specifically exert cytotoxic effects on the tumors by enhancing apoptosis. The AMPs synthesized in the fat body are incorporated into the macrophage-like blood cells in the mutant, not in normal larvae. Another AMP, Drosomycin, is incorporated via the Draper-mediated phagocytotic signaling. After being transported to the vicinity of the tumors, the AMPs released from the blood cells may target phosphatidylserine exposed on the tumor surface for apoptosis induction. Synthetic cecropin A peptides of another organism also showed an apoptosis-inducing property. They are expected to be anti-cancer drugs with minimal side effects.

Supplementary Materials

The following supporting information can be downloaded at: www.mdpi.com/xxx/s1, Figure S1: The mRNA levels of Dro and CecA genes in the fat body and LG tumor size of mxcmbn1 larvae heterozygous for mutations of the genes encoding the factors in innate immune pathways. Figure S2: Immunostaining and quantification of apoptosis in wing imaginal discs of control larvae harboring fat body-specific induction of Dro or CecA1 overexpression. Figure S3: Immunostaining and quantifying cell proliferation in LGs of mxcmbn1 larvae with a fat body-specific expression of Dro or CecA1. Figure S4: Absence of the Drs gene transcription in hemocytes, as confirmed by the Drs-YFP reporter in mxcmbn1 larvae.

Author Contributions

Conceptualization, Y.H.I.; methodology, M.H. and Y.HI.; validation, M.H., and Y.H.I.; formal analysis, M.H.; investigation, M.H.; resources, Y.H.I.; data curation, Y.H.I.; writing—original draft preparation, M.H.; writing—review and editing, Y.H.I.; visualization, X.X.; supervision, Y.H.I and T.N.; project administration, Y.H.I.; funding acquisition, Y.H.I. All authors have read and agreed to the published version of the manuscript.

Funding

This study was partially supported by Grant-in-Aid for Scientific Research C (17K07500) to YHI.

Institutional Review Board Statement

The animal study protocol was approved by the Kyoto Institute of Technology Review Board (protocol code: R4-11 and date of approval: 24 January 2023).

Data Availability Statement

The datasets generated and/or analyzed in the current study are available from the corresponding author upon reasonable request.

Acknowledgments

This study was partially supported by Grant-in-Aid for Scientific Research C (17K07500) to YHI. We are grateful to BDSC, VDRC, B. Lemaitre (École Polytechnique Fédérale de Lausanne, Swiss), C. Han (Cornell University, NY, USA), M. Miura (University of Tokyo, Tokyo, Japan), Y. Yagi (Nagoya University, Nagoya, Japan) for providing fly stocks or antibodies.

Conflicts of Interest

The authors declare no conflicts of interest.

References

  1. Lemaitre, B.; Hoffmann, J. The host defense of Drosophila melanogaster. Annu. Rev. Immunol. 2007, 25, 697–743. [Google Scholar] [CrossRef] [PubMed]
  2. Clark, R.; Kupper, T. Old meets new: The interaction between innate and adaptive immunity. J. Invest. Dermatol. 2005, 125, 629–637. [Google Scholar] [CrossRef] [PubMed]
  3. Willermain, F.; Rosenbaum, J.T.; Bodaghi, B.; Rosenzweig, H.L.; Childers, S.; Behrend, T.; Wildner, G.; Dick, A.D. Interplay between innate and adaptive immunity in the development of non-infectious uveitis. Prog. Retin. Eye. Res. 2012, 31, 182–194. [Google Scholar] [CrossRef] [PubMed]
  4. Nicolas, E.; Reichhart, J.M.; Hoffmann, J.A.; Lemaitre, B. In vivo regulation of the IκB homologue Cactus during the immune response of Drosophila. J. Biol. Chem. 1998, 273, 10463–10469. [Google Scholar] [CrossRef]
  5. Brennan, A.; Anderson, V. Drosophila: the genetics of innate immune recognition and response. Annu. Rev. Immunol. 2004, 22, 457–483. [Google Scholar] [CrossRef]
  6. Hoffmann, J.A. The immune response of Drosophila. Nature 2003, 426, 33–38. [Google Scholar] [CrossRef]
  7. Leclerc, V. , and Reichhart, J.-M. The immune response of Drosophila melanogaster. Immunol. Rev. 2004, 198, 59–71. [Google Scholar] [CrossRef]
  8. Hoffmann, J.A.; Reichhart, J.-M. Drosophila innate immunity: an evolutionary perspective. Nat. Immunol. 2002, 3, 121–126. [Google Scholar] [CrossRef]
  9. Tzou, P.; Reichhart, J.-M.; Lemaitre, B. Constitutive expression of a single antimicrobial peptide can restore wild-type resistance to infection in immunodeficient Drosophila mutants. Proc. Natl. Acad. Sci. USA. 2002, 99, 2152–2157. [Google Scholar] [CrossRef]
  10. Lemaitre, B.; Reichhart, J.-M.; Hoffmann, J.A. Drosophila host defense: Differential induction of antimicrobial peptide genes after infection by various classes of microorganisms. Proc. Natl. Acad. Sci. U.S.A. 1997, 94, 14614–14619. [Google Scholar] [CrossRef]
  11. Lindsay, S.A.; Wasserman, S.A. Conventional and non-conventional Drosophila Toll signaling. Dev. Comp. Immunol. 2014, 42, 16–24. [Google Scholar] [CrossRef] [PubMed]
  12. Gobert, V.; Gottar, M.; Matskevich, A.A.; Rutschmann, S.; Royet, J.; Belvin, M.; Hoffmann, J.A.; Ferrandon, D. Dual activation of the Drosophila Toll pathway by two pattern recognition receptors. Science 2003, 302, 2126–2130. [Google Scholar] [CrossRef] [PubMed]
  13. Gottar, M.; Gobert, V.; Matskevich, A.A.; Reichhart, J.-M.; Wang, C.; Butt, T.M.; Belvin, M.; Hoffmann, J.A.; Ferrandon, D. Dual detection of fungal infections in Drosophila via recognition of glucans and sensing of virulence factors. Cell 2006, 127, 1425–1437. [Google Scholar] [CrossRef] [PubMed]
  14. Valanne, S.; Wang, J.-H.; Rämet, M. The Drosophila Toll signaling pathway. J. Immunol. 2011, 186, 649–656. [Google Scholar] [CrossRef]
  15. Sun, H.; Bristow, B.N.; Qu, G.; Wasserman, S.A. A heterotrimeric death domain complex in Toll signaling. Proc. Natl. Acad. Sci. U.S.A. 2002, 99, 12871–12876. [Google Scholar] [CrossRef]
  16. Gottar, M.; Gobert, V.; Michel, T.; Belvin, M.; Duyk, G.; Hoffmann, J.A.; Ferrandon, D.; Royet, J. The Drosophila immune response against Gram-negative bacteria is mediated by a peptidoglycan recognition protein. Nature 2002, 416, 640–644. [Google Scholar] [CrossRef]
  17. Kleino, A.; Silverman, N. The Drosophila IMD pathway in the activation of the humoral immune response. Dev. Comp. Immunol. 2014, 42, 25–35. [Google Scholar] [CrossRef]
  18. Buchon, N.; Silverman, N.; Cherry, S. Immunity in Drosophila melanogaster — from microbial recognition to whole-organism physiology. Nat. Rev. Immunol. 2014, 14, 796–810. [Google Scholar] [CrossRef]
  19. Ertürk-Hasdemir, D.; Broemer, M.; Leulier, F.; Lane, W.S.; Paquette, N.; Hwang, D.; Kim, C.-H.; Stöven, S.; Meier, P.; Silverman, N. Two roles for the Drosophila IKK complex in the activation of Relish and the induction of antimicrobial peptide genes. Proc. Natl. Acad. Sci. U.S.A. 2009, 106, 9779–9784. [Google Scholar] [CrossRef]
  20. Kleino, A.; Silverman, N. The Drosophila IMD pathway in the activation of the humoral immune response. Dev. Comp. Immunol. 2014, 42, 25–35. [Google Scholar] [CrossRef]
  21. Tanji, T.; Ip, Y.T. Regulators of the Toll and Imd pathways in the Drosophila innate immune response. Trends Immunol. 2005, 26, 193–198. [Google Scholar] [CrossRef] [PubMed]
  22. Hultmark, D.; Steiner, H.; Rasmuson, T.; Boman, H.G. Insect immunity. purification and properties of three inducible bactericidal proteins from hemolymph of immunized pupae of Hyalophora cecropia. Eur. J. Biochem. 1980, 106, 7–16. [Google Scholar] [CrossRef] [PubMed]
  23. Chen, H.M.; Wang, W.; Smith, D.; Chan, S.C. Effects of the anti-bacterial peptide cecropin B and its analogs, cecropins B-1 and B-2, on liposomes, bacteria, and cancer cells. Biochim Biophys Acta. 1997, 1336, 171–179. [Google Scholar] [CrossRef] [PubMed]
  24. Chan, S.C.; Hui, L.; Chen, H.M. Enhancement of the cytolytic effect of anti-bacterial cecropin by the microvilli of cancer cells. Anticancer Res. 1998, 18, 4467–474. [Google Scholar]
  25. Moore, A.J.; Devine, D.A.; Bibby, M.C. Preliminary experimental anticancer activity of cecropins. Pept. Res. 1994, 7, 265–269. [Google Scholar]
  26. Araki, M.; Kurihara, M.; Kinoshita, S.; Awane, R.; Sato, T.; Ohkawa, Y.; Inoue, Y.H. Anti-tumour effects of antimicrobial peptides, components of the innate immune system, against hematopoietic tumors in Drosophila mxc mutants. Dis. Model. Mech. 2019, 12, dmm037721. [Google Scholar] [CrossRef]
  27. Arefin, B.; Kunc, M.; Krautz, R.; Theopold, U. The immune phenotype of three Drosophila leukemia models. G3: Genes Genomes Genet. 2017, 7, 2139–2149. [Google Scholar] [CrossRef]
  28. Parisi, F.; Stefanatos, R.K.; Strathdee, K.; Yu, Y.; Vidal, M. Transformed epithelia trigger non-tissue-autonomous tumor suppressor response by adipocytes via activation of Toll and Eiger/TNF signaling. Cell Rep. 2014, 6, 855–867. [Google Scholar] [CrossRef]
  29. Parvy, J.-P.; Yu, Y.; Dostalova, A.; Kondo, S.; Kurjan, A.; Bulet, P.; Lemaître, B.; Vidal, M.; Cordero, J.B. The antimicrobial peptide Defensin cooperates with Tumour Necrosis Factor to drive tumor cell death in Drosophila. eLife 2019, 8, e45061. [Google Scholar] [CrossRef]
  30. Lebestky, T.; Chang, T.; Hartenstein, V.; Banerjee, U. Specification of Drosophila hematopoietic lineage by conserved transcription factors. Science 2000, 288, 146–149. [Google Scholar] [CrossRef]
  31. Sanche Bosch, P.; Makhijani, K.; Herboso, L.; Gold, KS.; Baginsky, R.; Woodcock, KJ.; Alexander, B.; Kukar, K.; Corcoran, S.; Jacobs, T.; Ouyang, D.; Wong, C.; Ramond, EJV. ; Rhiner, C.; Moreno, E.; Lemaitre, B.; Geissmann, F.; Brückner, K. Adult Drosophila lack hematopoiesis but rely on a blood cell reservoir at the respiratory epithelia to relay infection signals to surrounding tissues. Dev. Cell 2019, 51, 787–803. [Google Scholar] [CrossRef] [PubMed]
  32. Kinoshita, J.; Kinoshita, Y.; Nomura, T.; Inoue, Y.H. Macrophage-like blood cells are involved in inter-tissue communication to activate JAK/STAT signaling, inducing antitumor Turandot proteins in Drosophila fat body via the TNF-JNK pathway. Int. J. Mol. Sci. 2024, 25, 13110. [Google Scholar] [CrossRef] [PubMed]
  33. Hanahan, D.; Weinberg, R.A. Hallmarks of cancer: the next generation. Cell 2011, 144, 646–674. [Google Scholar] [CrossRef] [PubMed]
  34. Cordero, J.B.; Macagno, J.P.; Stefanatos, R.K.; Strathdee, K.E.; Cagan, R.L.; Vidal, M. Oncogenic Ras diverts a host TNF tumor suppressor activity into tumor promoter. Dev. Cell 2010, 18, 999–1011. [Google Scholar] [CrossRef]
  35. Kinoshita, S.; Takarada, K.; Kinoshita, Y.; Inoue, Y.H. Drosophila hemocytes recognize lymph gland tumors of mxc mutants and activate the innate immune pathway in a reactive oxygen species-dependent manner. Biol. Open 2022, 11, bio059523. [Google Scholar] [CrossRef]
  36. Pastor-Pareja, J.C.; Wu, M.; Xu, T. An innate immune response of blood cells to tumors and tissue damage in Drosophila. Dis. Model. Mech. 2008, 1, 144–154. [Google Scholar] [CrossRef]
  37. Kurihara, M.; Komatsu, K.; Awane, R.; Inoue, Y.H. Loss of histone locus bodies in the mature hemocytes of larval lymph gland result in hyperplasia of the tissue in mxc mutants of Drosophila. Int. J. Mol. Sci. 2020, 21, 1586. [Google Scholar] [CrossRef]
  38. Remillieux-Leschelle, N. , Santamaria, P., and Randsholt, N.B. Regulation of larval hematopoiesis in Drosophila melanogaster: a role for the multi sex combs gene. Genetics 2002, 162, 1259–1274. [Google Scholar] [CrossRef]
  39. Takarada, K.; Kinoshita, J.; Inoue, Y.H. Ectopic expression of matrix metalloproteinases and filopodia extension via JNK activation are involved in the invasion of blood tumor cells in Drosophila mxc mutant. Genes. Cells. 2023, 28, 709–726. [Google Scholar] [CrossRef]
  40. Tzou, P.; Ohresser, S.; Ferrandon, D.; Capovilla, M.; Reichhart, J.-M.; Lemaitre, B.; Hoffmann, J.A.; Imler, J.-L. Tissue-specific inducible expression of antimicrobial peptide genes in Drosophila surface epithelia. Immunity 2000, 13, 737–748. [Google Scholar] [CrossRef]
  41. Yagi, Y.; Lim, Y.-M.; Tsuda, L.; Nishida, Y. fat facets induce polyubiquitination of Imd and inhibits the innate immune response in Drosophila. Genes Cells. 2013, 18, 934–945. [Google Scholar] [CrossRef] [PubMed]
  42. Schnorrer, F.; Schönbauer, C.; Langer, C.C.; Dietzl, G.; Novatchkova, M.; Schernhuber, K.; Fellner, M.; Azaryan, A.; Radolf, M.; Stark, A.; Keleman, K.; Dickson, B.J. Systematic genetic analysis of muscle morphogenesis and function in Drosophila. Nature. 2010, 2010. 464, 287–291. [Google Scholar] [CrossRef]
  43. Kira, A.; Tatsutomi, I.; Saito, K.; Murata, M.; Hattori, I.; Kajita, H.; Muraki, N.; Oda, Y.; Satoh, S.; Tsukamoto, Y.; Kimura, S.; Onoue, K.; Yonemura, S.; Arakawa, S.; Kato, H.; Hirashima, T.; Kawane, K. Apoptotic extracellular vesicle formation via local phosphatidylserine exposure drives efficient cell extrusion. Dev. Cell 2023, 58, 1282–1298. [Google Scholar] [CrossRef]
  44. MacDonald, J.M.; Beach, M.G.; Porpiglia, E.; Sheehan, A.E.; Watts, R.J.; Freeman, M.R. The Drosophila cell corpse engulfment receptor Draper mediates glial clearance of severed axons. Neuron 2006, 50, 869–881. [Google Scholar] [CrossRef]
  45. Badinloo, M.; Nguyen, E.; Suh, W.; Alzahrani, F.; Castellanos, J.; Klichko, VI.; Orr,WC. ; Radyuk, SN. Overexpression of antimicrobial peptides contributes to aging through cytotoxic effects in Drosophila tissues. Arch. Insect. Biochem. Physiol. 2018, 98, e21464. [Google Scholar] [CrossRef]
  46. Sapar, M.L.; Ji, H.; Wang, B.; Poe, A.R.; Dubey, K.; Ren, X.; Ni, J.Q.; Han, C. Phosphatidylserine externalization results from and causes neurite degeneration in Drosophila. Cell Rep. 2018, 24, 2273–2286. [Google Scholar] [CrossRef]
  47. Oka, S.; Hirai, J.; Yasukawa, T.; Nakahara, Y.; Inoue, Y.H. A correlation of reactive oxygen species accumulation by depletion of superoxide dismutases with age-dependent impairment in the nervous system and muscles of Drosophila adults. Biogerontol. 2015, 16, 485–501. [Google Scholar] [CrossRef]
  48. Reimels, TA.; Pfleger, CM. Methods to examine the lymph gland and hemocytes in Drosophila larvae. J. Vis. Exp. 2016, 117, 54544. [Google Scholar]
  49. Evans, C.J.; Hartenstein, V.; Banerjee, U. Thicker than blood: conserved mechanisms in Drosophila and vertebrate hematopoiesis. Dev. Cell 2003, 5, 673–690. [Google Scholar] [CrossRef]
  50. Jung, S.-H.; Evans, C.J.; Uemura, C.; Banerjee, U. The Drosophila lymph gland as a developmental model of hematopoiesis. Development 2005, 132, 2521–2533. [Google Scholar] [CrossRef]
  51. Anghel, R.; Jitaru, D.; Bădescu, L.; Bădescu, M.; Ciocoiu, M. The cytotoxic effect of magainin II on the MDA-MB-231 and M14K tumour cell lines. Biomed. Res. Int. 2013, 2013, 831709. [Google Scholar] [CrossRef] [PubMed]
  52. Shiomi, A.; Nagao, K.; Yokota, N.; Tsuchiya, M.; Kato, U.; Juni, N.; Hara, Y.; Mori, MX.; Mori, Y.; Ui-Tei, K.; Murate, M.; Kobayashi, T.; Nishino, Y.; Miyazawa, A.; Yamamoto, A.; Suzuki, R.; Kaufmann, S.; Tanaka, M.; Tatsumi, K.; Nakabe, K.; Shintaku, H.; Yesylevsky, S.; Bogdanov, M.; Umeda, M. Extreme deformability of insect cell membranes is governed by phospholipid scrambling. Cell Rep. 2021, 35, 109219. [Google Scholar] [CrossRef] [PubMed]
  53. Diefenbach, A.; Tomasello, E.; Lucas, M.; Jamieson, A.M.; Hsia, J.K.; Vivier, E.; Raulet, D.H. Selective associations with signaling proteins determine stimulatory versus costimulatory activity of NKG2D. Nat. Immunol. 2002, 3, 1142–1149. [Google Scholar] [CrossRef]
  54. Fridman, W.H.; Pagès, F.; Sautès-Fridman, C.; Galon, J. The immune contexture in human tumours: impact on clinical outcome. Nat. Rev. Cancer. 2012, 12, 298–306. [Google Scholar] [CrossRef] [PubMed]
  55. Schreiber, R.D. ; Old. L.J.; Smyth, M.J. Cancer immunoediting: integrating immunity's roles in cancer suppression and promotion. Science 2011 331, 1565–1570. [Google Scholar]
  56. Kalbasi, A.; June, C.H.; Haas, N.; Vapiwala, N. Radiation and immunotherapy: A synergistic combination. J. Clin. Invest. 2013, 123, 2756–2763. [Google Scholar] [CrossRef]
  57. Yoo, T.-J.; Sup Shim, M.; Bang, J.; Kim, J.-H.; Jae Lee, B. SPS1 deficiency-triggered PGRP-LC and Toll expression controls innate immunity in Drosophila S2 Cells. Biol. Open 2022, 11, bio059295. [Google Scholar] [CrossRef]
  58. Kinoshita, Y.; Shiratsuchi, N.; Araki, M.; Inoue, Y.H. Anti-tumor effect of Turandot proteins induced via the JAK/STAT pathway in the mxc hematopoietic tumor mutant in Drosophila. Cells, 2023, 12, 2047. [Google Scholar] [CrossRef]
  59. Jin, X.; Mei, H.; Li, X.; Ma, Y. ; Zeng AH, Wang, Y. Apoptosis-inducing activity of the antimicrobial peptide Cecropin of Musca domestica in human hepatocellular carcinoma cell line BEL-7402 and the possible mechanism. Acta. Biochim. Biophys. Sin. (Shanghai) 2010, 259–265.
  60. Sang, M.; Zhang, J.; Zhuge, Q. Selective cytotoxicity of the antibacterial peptide ABP-dHC-Cecropin A and its analog towards leukemia cells. Eur. J. Pharmacol. 2017, 803, 138–147. [Google Scholar] [CrossRef]
  61. Zhang, L.; Gallo, R.L. Antimicrobial peptides. Curr. Biol. 2016, 26, R14–R19. [Google Scholar] [CrossRef]
  62. Brady, D.; Grapputo, A.; Romoli, O.; Sandrelli, F. Insect Cecropins, antimicrobial peptides with potential therapeutic applications. Int. J. Mol. Sci. 2019, 20, 5862. [Google Scholar] [CrossRef]
  63. Ziaja, M.; Dziedzic, A.; Szafraniec, K.; Piastowska-Ciesielska, A. Cecropins in cancer therapies-where we have been? Eur. J. Pharmacol. 2020, 882, 173317. [Google Scholar] [CrossRef]
  64. Hoskin, D.W.; Ramamoorthy, A. Studies on anticancer activities of antimicrobial peptides. Biochim. Biophys. Acta, Bioenerg. 2008, 1778, 357–375. [Google Scholar] [CrossRef]
  65. Serizier, S.B.; Peterson, J.S.; McCall, K. Non-autonomous cell death induced by the Draper phagocytosis receptor requires signaling through the JNK and SRC pathways. J. Cell Sci. 2022, 135, jcs250134. [Google Scholar] [CrossRef]
  66. Bonifacino, J.S.; Glick, B.S. The mechanisms of vesicle budding and fusion. Cell 2004, 116, 153–166. [Google Scholar] [CrossRef]
  67. Shandala, T.; Brooks, D.A. Innate immunity and exocytosis of antimicrobial peptides. Commun. Integr. Biol. 2012, 5, 214–216. [Google Scholar] [CrossRef]
  68. O'Sullivan, M.J.; Lindsay, A.J. The endosomal recycling pathway-at the crossroads of the cell. Int. J. Mol. Sci. 2020, 21, 6074. [Google Scholar] [CrossRef]
  69. Thorn, P.; Zorec, R.; Rettig, J.; Keating, D.J. Exocytosis in non-neuronal cells. J Neurochem. 2016, 137, 849–859. [Google Scholar] [CrossRef]
  70. Schweizer, F. Cationic amphiphilic peptides with cancer-selective toxicity. Eur. J. Pharmacol. 2009, 625, 190–194. [Google Scholar] [CrossRef]
  71. Daleke, D.L. Phospholipid flippases. J. Biol. Chem. 2007, 282, 821–825. [Google Scholar] [CrossRef]
  72. Bevers, E.M.; Williamson, P.L. Phospholipid scramblase: an update. FEBS Lett. 2010, 584, 2724–2730. [Google Scholar] [CrossRef]
  73. Iwasaki, T.; Ishibashi, J.; Tanaka, H.; Sato, M.; Asaoka, A.; Taylor, D.; Yamakawa, M. Selective cancer cell cytotoxicity of enantiomeric 9-Mer peptides derived from beetle Defensins depends on negatively charged phosphatidylserine on the cell surface. Peptides 2009, 30, 660–668. [Google Scholar] [CrossRef] [PubMed]
  74. Mader, J.S.; Hoskin, D.W. Cationic antimicrobial peptides as novel cytotoxic agents for cancer treatment. Expert. Opin. Investig. Drugs 2006, 15, 933–946. [Google Scholar] [CrossRef] [PubMed]
  75. Riedl, S.; Rinner, B.; Asslaber, M.; Schaider, H.; Walzer, S.; Novak, A.; Lohner, K.; Zweytick, D. In Search of a Novel Target — Phosphatidylserine exposed by non-apoptotic tumor cells and metastases of malignancies with poor treatment efficacy. Biochimi. Biophys. Acta, Biomembr. 2011, 1808, 2638–2645. [Google Scholar] [CrossRef] [PubMed]
  76. Gao, X.; Ding, J.; Liao, C.; Xu, J.; Liu, X.; Lu, W. Defensins: The natural peptide antibiotic. Adv. Drug Deliv. Rev. 2021, 179, 114008. [Google Scholar] [CrossRef]
Figure 1. Expression of Dro-GFP and CecA1-YFP reporters in the fat body of mxcmbn1 mutant larvae. (a, b) Bright-field (BF) stereomicroscopic images of the fat body of third instar mature larva carrying the Drosocin (Dro)-GFP reporter. Scale bars: 500 µm. (a’, b’) Green fluorescent protein (GFP) fluorescence images in the fat body of third instar mature larvae with Dro-GFP reporter. (c, d) BF stereomicroscopic images of the fat body in a third instar mature larva carrying the Cecropin A1 (CecA1)-GFP reporter. (c’, d’) GFP fluorescence images in the fat body of the larvae with CecA1-GFP reporter. (a, c) Normal control (w/Y) and (b, d) mxcmbn1 mutant (mxcmbn1/Y) larvae. (e, f) mRNA quantification of Dro and CecA1 using quantitative reverse transcription-PCR (qRT-PCR). The X-axis of each graph shows the mRNA levels of the normal control (w/Y) and mxcmbn1 (mxcmbn1/Y) larvae from left to right; the Y-axis shows the mRNA levels of the target gene relative to the endogenous control gene (Rp49). (e, f) mRNA levels of the Dro (e) and CecA1 (f) genes. Welch′s t-test assessing each experimental group (*p < 0.05, ns: not significant).The error bars indicate the standard error of the mean (SEM).
Preprints 147847 g001
Figure 2.  Observation of lymph glands (LGs) from mxcmbn1 larvae and quantification of their size by induction of Dro or CecA1 overexpression in a fat body (FB)-specific manner. (a-f) Fluorescence images of DAPI-stained LGs collected from mature third instar larvae. (a) Pair of LGs from a normal control larva (w/Y; r4>+). (b) LG from control larvae with FB-specific overexpression of Dro (w/Y; r4>Dro) or (c) CecA1 (w/Y; r4>CecA1). A pair of LGs from (d) mxcmbn1 larva (mxcmbn1/Y; r4>+), (e) mxcmbn1 larvae with FB-specific expression of Dro (mxcmbn1/Y; r4>Dro) or (f) CecA1 (mxcmbn1/Y; r4>CecA1). Scale bars: 100 µm. (g) LG size quantification in larvae with FB-specific expression of Dro (w/Y; r4>+ (n = 20), w/Y; r4>Dro (n = 20), mxcmbn1/Y; r4>+ (n = 20), mxcmbn1/Y; r4>Dro (n = 20)), and CecA1 ((w/Y (n = 20), w/Y; r4>CecA1 (n = 20), mxcmbn1/Y; r4>+ (n = 20), mxcmbn1/Y; r4>CecA1 (n = 20)). Differences between each experimental group were performed using one-way ANOVA for multiple comparisons (****p < 0.0001, ns: not significant). The red lines indicate the mean LG size. The error bars indicate the SEM.
Preprints 147847 g002
Figure 3. Observation and quantification of apoptosis areas in LGs of mxcmbn1 larvae harboring fat body (FB)-specific overexpression of Dro or CecA1. (a-f) Immunostaining of LGs with anti-cDcp1 antibodies that recognize apoptotic cells in LGs from the third instar-stage mature larvae. (a) A pair of LGs from control larvae (w/Y; r4>+). (b) Control larvae overexpressing Dro (w/Y; r4>Dro), or (c) CecA1 (w/Y; r4>CecA1) specifically in the FB. (d) Anterior lobes of a pair of LGs from mxcmbn1 larvae (mxcmbn1/Y; r4>+). (e) mxcmbn1 larvae overexpressing Dro (mxcmbn1/Y; r4>Dro) or (f) CecA1 (mxcmbn1/Y; r4>CecA1). Blue indicates DNA staining; green indicates anti-cDcp1 immunostaining signals. Scale bars: 100 µm. (g) Percentage of areas occupied by apoptotic cells in the lobe regions of LGs from larvae with FB-specific Dro overexpression (n = 21 LGs from 11 larvae) or CecA1 (n = 24 LGs from 12 larvae). One-way ANOVA multiple comparisons (*p < 0.05, ***p < 0.001, ****p < 0.0001, ns: not significant). The red line indicates the mean percentage of apoptosis. The error bars indicate the SEM.
Preprints 147847 g003
Figure 4.  Quantification of LG sizes in mxcmbn1 larvae harboring FB-specific knockdown of Dro or CecA1. (a-f) DAPI-stained images of LGs from mature third instar stage larvae. (a-c) LGs expressing dsRNAs against mRNAs for (a) GFP (w/Y; r4>GFPRNAi) (control), (b) Dro (w/Y; r4>DroRNAi), or (c) CecA1 (w/Y; r4>CecA1RNAi) specifically in the fat body are shown. (d-f) LGs expressing dsRNAs against (d) GFP in the fat body of mxcmbn1 larvae (mxcmbn1/Y; r4>GFPRNAi), (e) Dro (mxcmbn1/Y; r4>DroRNAi) or (f) CecA1 (mxcmbn1/Y; r4>CecA1RNAi). Scale bars: 100 µm. (g) Quantification graphs of the LG size that larvae of each genotype have. The LG size of larvae with DroRNAi (n = 15 LGs from 8 larvae) and CecA1RNAi (n = 13 LGs from 7 larvae). One-way ANOVA multiple comparisons (**p < 0.01, ***p < 0.001, ****p < 0.0001, ns: not significant). The red lines indicate the mean LG size. The error bars indicate the SEM.
Preprints 147847 g004
Figure 5. Apoptosis observation and quantification in LGs of mxcmbn1 larvae harboring fat body-specific knockdown of Dro or CecA1. (a-f) Immunostaining of LGs with anti-cDcp1 antibodies that recognize apoptotic cells. LGs expressing dsRNA against mRNAs for (a) GFP (w/Y; r4>GFPRNAi), (b) Dro (w/Y; r4>DroRNAi), or (c) CecA1 (w/Y; r4>CecA1RNAi) specifically in the fat body are shown. (d-f) LG expressing dsRNA against (d) GFP specifically in the fat body of mxcmbn1 larvae (mxcmbn1/Y; r4>GFPRNAi), (e) Dro (mxcmbn1/Y; r4>DroRNAi) or (f) CecA1 (mxcmbn1/Y; r4>CecA1RNAi) are shown. Blue indicates DNA staining; green indicates an anti-cDcp1immunostaining signal. Scale bars: 100 µm. (g) The graphs indicate the percentage of apoptotic cells in the lobe regions of the LGs of larvae harboring FB-specific depletion of Dro (n = 15 LGs from 8 larvae) or CecA1 (n = 13 LGs from 7 larvae). One-way ANOVA multiple comparisons (****p < 0.0001, ns: not significant). The red line indicates the mean percentage of apoptosis. The error bars indicate the SEM.
Preprints 147847 g005
Figure 6. Apoptosis area quantification in mxcmbn1 larvae LGs after synthetic cecropin A peptide injection. . (a-d) Immunostaining of LGs in control (a, c) and mxcmbn1 (b, d) larvae with anti-cDcp1 antibodies that recognize apoptotic cells. Larvae at the third instar stage injected with PBS (control; a, b) or synthetic cecropin A (c, d) dissolved in PBS. Green (white in a’’-d’’) indicates a signal of anti-cDcp1 immunostaining, and blue (white in a’-d’) indicates DNA staining. Scale bars: 100 µm. (e) Quantification graphs indicate the percentage of apoptotic cells in the lobe regions of LGs after injecting PBS (n = 5 LGs from 3 w/Y and n = 22 LGs from 11 mxcmbn1/Y larvae), and cecropin A (n = 7 LGs from 4 w/Y and n = 8 LGs from 4 mxcmbn1/Y larvae). One-way ANOVA was used for multiple comparisons (**p < 0.01, ns: not significant). The red line indicates the mean percentage of apoptosis. The error bars indicate the SEM.
Preprints 147847 g006
Figure 7.  Observation of circulating hemocytes in which HA-tagged Cecropin A produced in the fat body was incorporated in control and mxcmbn1 larvae. (a, b) Anti-HA immunostaining of circulating hemocytes in normal (w/Y; r4>CecA1-HA) (a) and mxcmbn1 larvae (mxcmbn1/Y; r4>CecA1-HA) (b) expressing Cecropin A-HA in the fat body. Green, fluorescence of anti-HA immunostaining (white in a”, b”); magenta, DNA (white in a’, b’). A magnified image of the hemocyte pointed by an arrow is presented in the insets in b”. Scale bars: 10 µm. (c) Percentages of the hemocytes harboring HA-tagged Cecropin A in control and mxcmbn1 larvae. Significant differences were determined using Welch′s t test (****p < 0.0001, n = 20). The error bars indicate SEM.
Preprints 147847 g007
Figure 8. Observation and quantification of hemocytes in which GFP-tagged Drosomycin was incorporated in control and mxcmbn1 larvae. (a, b) GFP fluorescence of circulating hemocytes to detect GFP-tagged Drosomycin (a, b), induced in the FB of control (w, Drs::GFP/Y)(a) and mxcmbn1 (mxcmbn1, Drs::GFP/Y) (b) larvae. (c, d) GFP fluorescence indicating GFP-tagged Drosomycin in the circulating hemocytes of the mutant larvae harboring hemocyte-specific knockdown of draper (mxcmbn1, Drs::GFP/Y; He>drprRNAi) (c), or shark (mxcmbn1, Drs::GFP/Y; He>sharkRNAi) (d). The circulating hemocytes harboring GFP-tagged Drosomycin (Drs::GFP) are colored in green in a-d (white in (a”-d”). DNA is magenta in a-d (white in a’-d’). Scale bars: 10 µm. (e) Percentages of the hemocytes harboring GFP-tagged Drosomycin in control and mxcmbn1 larvae. X-axis from left to right: control larvae expressing GFP-tagged Drosomycin under its promoter (w, Drs::GFP/Y (n = 374 hemocytes (6 larvae)), mxcmbn1, Drs::GFP/Y (n = 1,021 (8)), mxcmbn1, Drs::GFP/Y; He>drprRNAi (n = 2,098 (8)), and mxcmbn1, Drs::GFP/Y; He>sharkRNAi (n = 1,193 (6)) larvae. One-way ANOVA was used for multiple comparisons (****p < 0.0001). The error bars indicate SEM.
Preprints 147847 g008
Figure 9.  Detection of phosphatidylserine (PS) exposed on the cell surface of lymph gland (LG) tumors from control and mxcmbn1 larvae. (a, b) DAPI-stained fluorescence images of LGs from larvae at the third instar stage: (a) normal control, (b) mxcmbn1 mutant. Blue indicates DNA staining and green indicates Annexin V-GFP signal. Scale bars: 100 µm. (c) Quantification graph indicating the percentage of GFP fluorescent regions in LGs, indicative of Annexin V binding. Significant differences were determined using Welch′s t test (****p < 0.0001, n = 16). The red line indicates the mean percentage. The error bars indicate SEM.
Preprints 147847 g009
Figure 10. Loss of PS on the surface of LG cells by Xkr scramblase knockdown and its influence on LG hyperplasia in mxcmbn1 larvae. (a-c) DAPI-stained anterior lobes and fluorescence indicating Alexa 594-Annexin V binding to PS on the LG lobes in normal controls (w/Y) (a), mxcmbn1 with ectopic expression of control dsRNA in the medulla zone in primary lobes of the LG (mxcmbn1/Y; upd3>GFPRNAi) (b), and mxcmbn1 with depletion of xkr mRNA (mxcmbn1/Y; upd3>xkrRNAi) (c) in the larvae at the third instar stage. DNA is stained in blue in a-c (white in a’-c’), and Alexa594-Annexin-V is in magenta in a-c (white in a”-c”). Scale bars: 100 μm. (d) Quantification of the LG size of mxcmbn1 harboring xkr depletion in the LG tumor cells. The average LG size was calculated among the controls (w/Y) (n = 9 LGs (5 larvae)), mxcmbn1/Y; upd3>GFPRNAi (n = 16 (8)), and mxcmbn1/Y; upd3>xkrRNAi (n = 28 (14)). One-way ANOVA multiple comparisons (*p < 0.05). The red line indicates the mean percentage of apoptosis. The red line indicates the mean LG size. The error bars indicate the SEM.
Preprints 147847 g010
Disclaimer/Publisher’s Note: The statements, opinions and data contained in all publications are solely those of the individual author(s) and contributor(s) and not of MDPI and/or the editor(s). MDPI and/or the editor(s) disclaim responsibility for any injury to people or property resulting from any ideas, methods, instructions or products referred to in the content.
Copyright: This open access article is published under a Creative Commons CC BY 4.0 license, which permit the free download, distribution, and reuse, provided that the author and preprint are cited in any reuse.
Prerpints.org logo

Preprints.org is a free preprint server supported by MDPI in Basel, Switzerland.

Subscribe

Disclaimer

Terms of Use

Privacy Policy

Privacy Settings

© 2025 MDPI (Basel, Switzerland) unless otherwise stated