1. Introduction
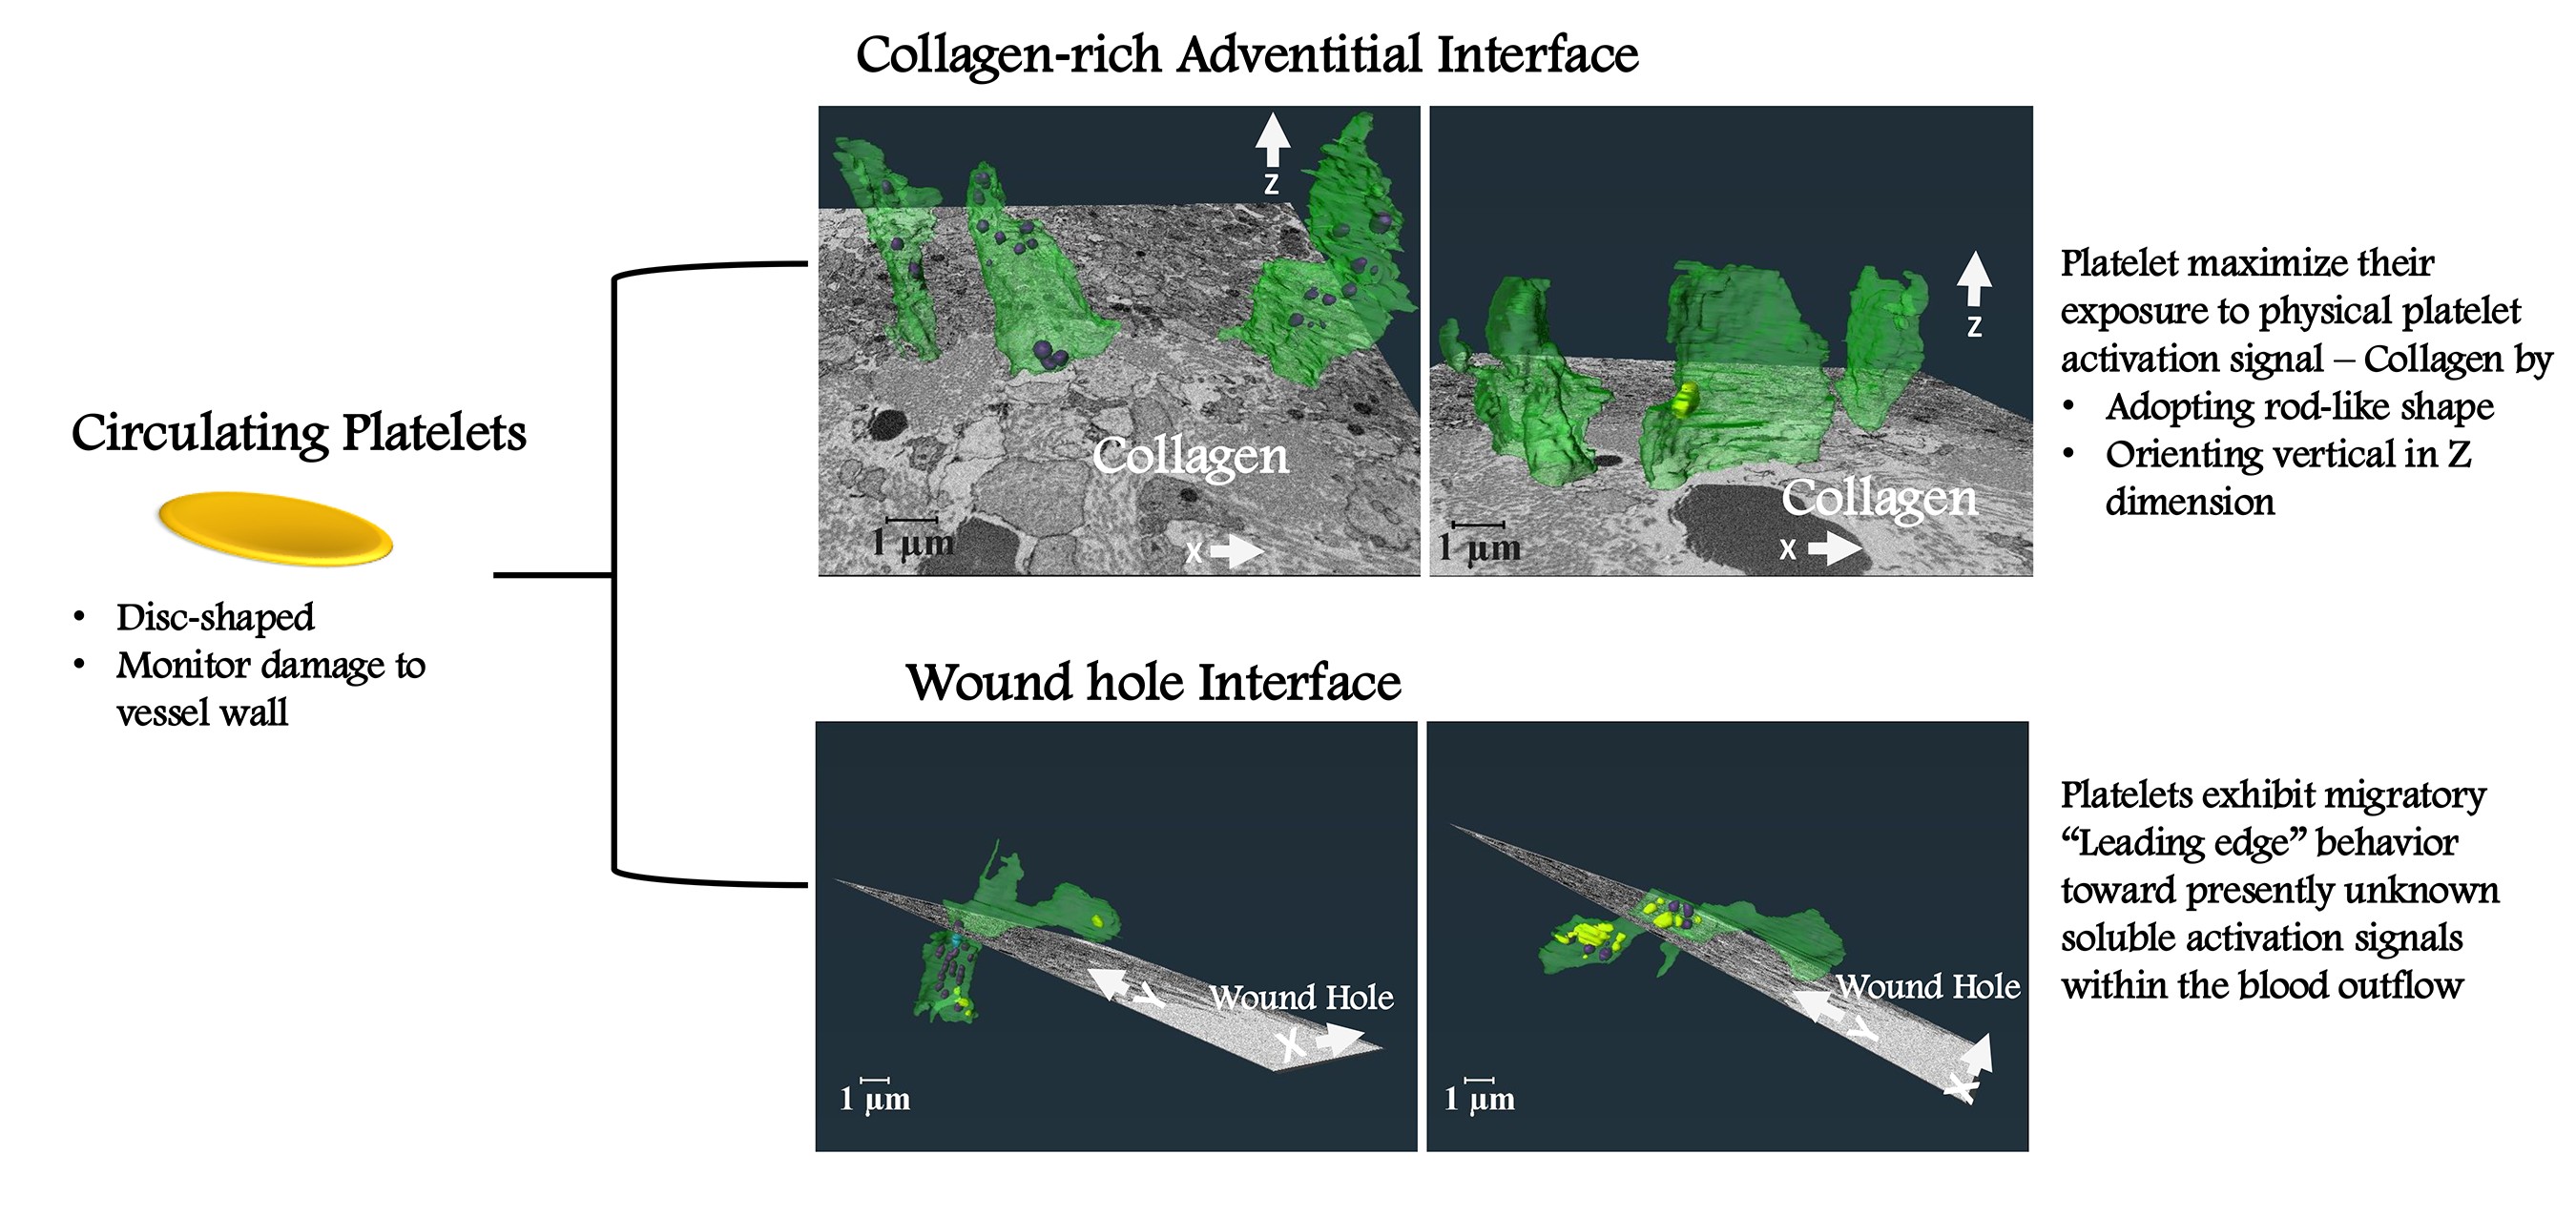
Platelets function as anucleate surveillance cells within the mammalian circulatory system that monitor damage to the vessel wall. In response to a puncture wound, platelets bind to exposed, collagen-rich extracellular matrix to generate a platelet-rich aggregate, a thrombus, that caps the wound hole. How platelets react to the distinct local microenvironments present within a thrombus potentially provides a route to defining discrete platelet activation states and their functional role, but the effects of such localized microenvironments on platelet morphodynamics remain poorly understood.
Methods such as light microscopy and transmission electron microscopy (TEM) have advanced our understanding of platelet behavior. However, these methods typically provide information only in two dimensions and are insufficient to fully capture the complex three-dimensional (3D) morphodynamics of platelets within a thrombus, where platelets interact with both structural and biochemical cues in their environment. As such, methodology has limited our ability to understand how platelets reorganize their structure and orient themselves within different microenvironments of a thrombus.
Our study presents, a pioneering high-resolution, 3D imaging approach using region of interest (ROI) serial block-face scanning electron microscopy (SBF-SEM) to investigate how distinct local signaling environments within thrombus influence platelet activation states. This technique enables a detailed, single-cell level visualization of platelet ultrastructure in vivo [
1]. Through detailed examination of platelets in two clearly distinguishable microenvironments within a murine jugular vein puncture wound thrombus, namely, the collagen-rich adventitial interface and the wound hole platelet interface, we provide a comprehensive 3D analysis of platelet behavior at the single cell level in response to adhesive versus soluble activation signals respectively. Our study addresses the unique 3D spatial morphodynamics of platelets in each local microenvironment, revealing previously unrecognized platelet adaptations.
These findings offer new insights into the complex behaviors of platelets in response to diverse signaling environments and may have the potential to pave the way for future therapeutic strategies targeting thrombus formation and stability in a more controlled and localized manner.
2. Results
2.1. Experimental System
We utilized SBF-SEM to 3D image two ROIs within a 5-minute post-puncture mouse jugular vein thrombus. As shown in
Figure 1A, one ROI is at the collagen-rich adventitial thrombus interface and the other is at the wound hole interface, a site protected from intravascular flow within the jugular vein (red arrows,
Figure 1A). The yellow lines in the higher magnification images (
Figure 1B & D) indicate that the subsequent analysis was restricted to platelets in direct contract with either collagen or the wound hole. Our expectation was that the platelets in these two locations would be subject to very different signaling environments that could then establish the respective platelet morphodynamics. As shown at higher resolution in
Figure 1C & E, the encircled platelets to be analyzed in 3D appeared to be devoid of organelles and differed in shape in the 2D image slices with those at the wound hole appearing more elongate. Because C and E are single slices, the size of the platelet profiles differs greatly and the small profiles may be difficult to see. Note: with the combination of a saline prefusion before fixation and paraformaldehyde fixation, the preparation(s) studied retained only components exhibiting molecular interactions, for example, aggregated platelets; there are no red blood cells retained within the wound hole or the jugular vein itself.
2.2. Platelet Morphodynamics at the Collagen-Rich Adventitial Interface
As shown in
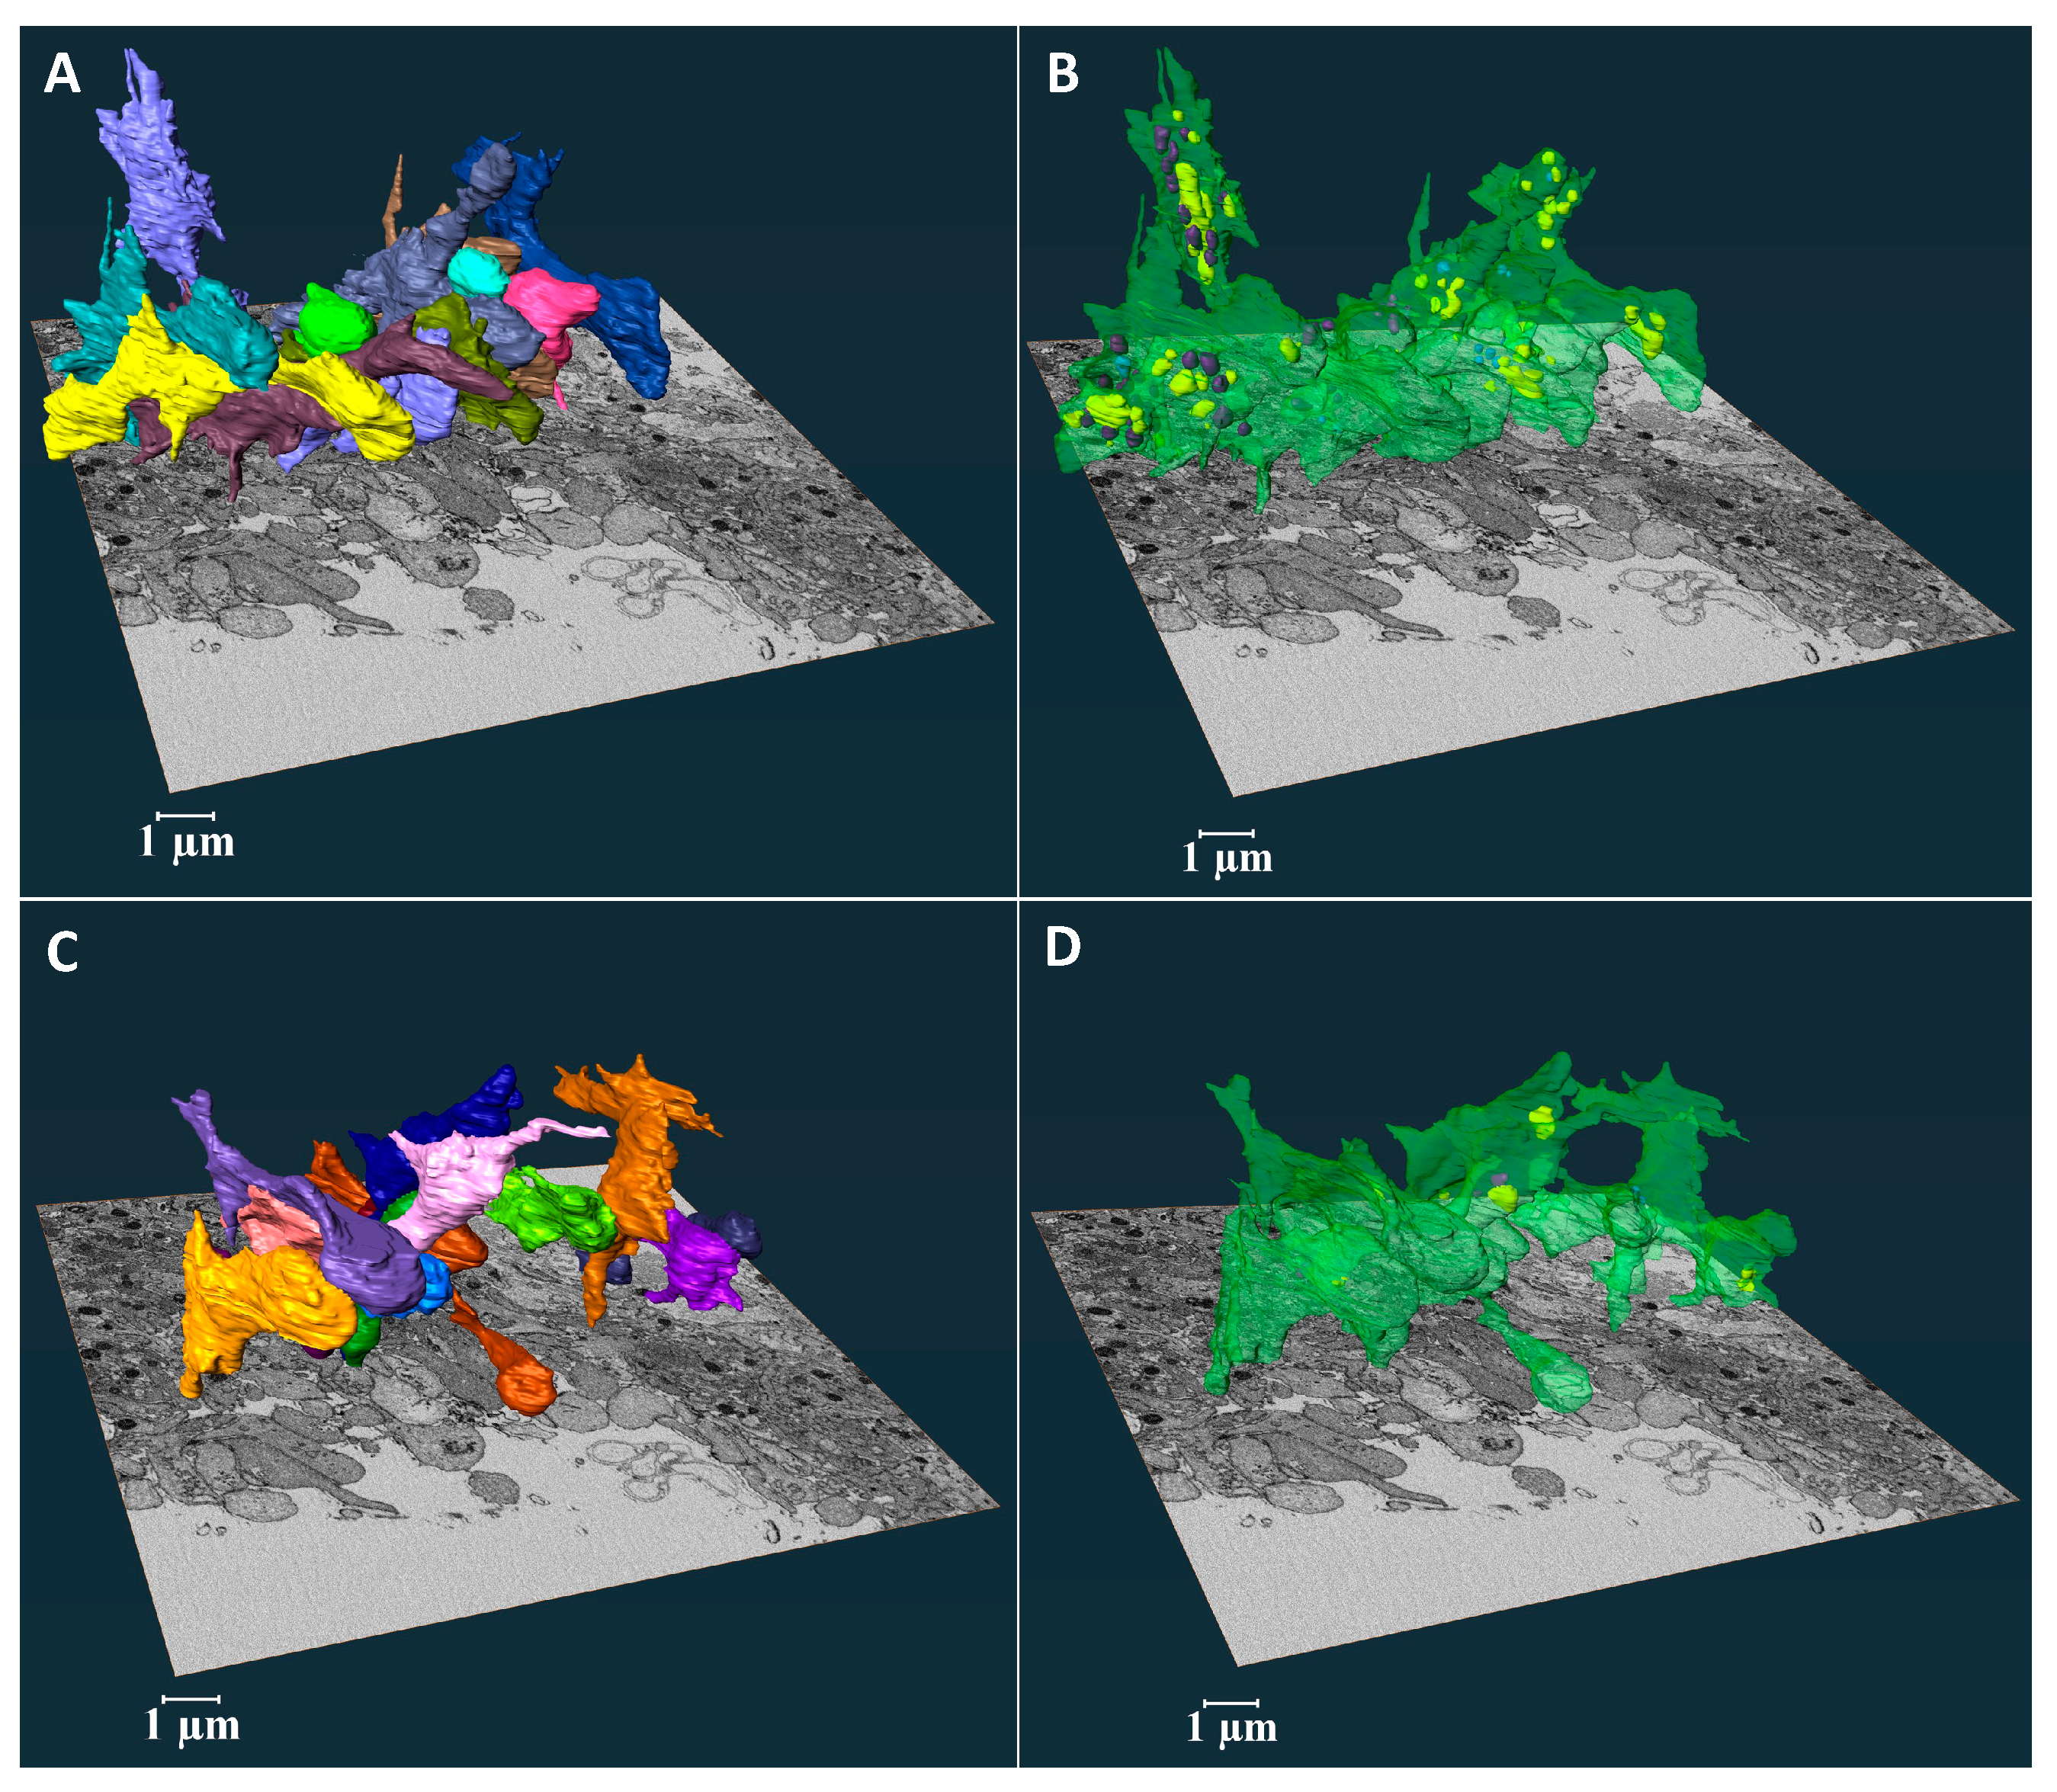
Figure 2A, the ROI volume imaged was sufficient to include both full platelet volumes and to image their relationship to interfacial collagen fibers. The 3D shapes of the rendered platelets revealed vertically oriented, flattened cylinders that aligned with one another and showed few to no pseudopods (
Figure 2B & Supplemental Movie 1). The vertical orientation was perpendicular to both venous and puncture flow vectors (
Figure 1A). In 3D, each platelet appeared to be enveloped in collagen (light gray cloud, see also Supplemental Movie 1). To reveal the arrangement of organelles within the platelets the membrane was rendered transparent (
Figure 2C & Supplemental Movie 2). Mitochondria (purple) and alpha-granules (condensed, blue and decondensed, yellow, secreted contents [
2,
3]), the two major platelet organelles, were located primarily towards the thrombus. Of the 15 rendered platelets, about half retained mitochondria and only about one-quarter contained alpha-granules (
Figure 2D, E & Supplemental Movie 2). In all cases, the number of retained organelles, be they mitochondria or alpha-granules was substantially less than that of circulating mouse platelets [
2].
At the higher magnification of
Figure 2F & G, the ortho-slices showed that the collagen fibers tended to wrap around the embedded platelets. We observed a random distribution of residual organelles in platelets located closer to the collagen-rich adventitia interface (
Figure 2F-F’). Platelets located deeper within collage-rich adventitia had fewer organelles and the residual organelles were positioned more towards the thrombus (
Figure 2G-G’, & see also Supplemental Movie 2). Overall, the 3D shape of these organelle-deficient platelets maximized their exposure to collagen (Supplemental Movie 1 & 2).
2.3. Platelet Morphodynamics at the Wound Hole Interface
In contrast to the collagen-rich, adventitial interface, much of the signaling here should be due to soluble molecules within the blood outflow which could act as chemo-attractants. Platelets lining the wound hole were selected from a mid-stack slice, verified for full volume inclusion, and then analyzed in 3D (
Figure 3A). In
Figure 3B & C, all 25 rendered platelets are shown. Surface rendering revealed they aligned parallel with one another in the XY plane at ~45 degrees to either blood flow within the puncture hole or within the Jugular vein. The aligned platelets were flattened in the YZ plane. Unexpectedly, many of the platelets extended large, vertical segments in the Z dimension, typically distal from the wound hole (
Figure 3B & Supplemental Movie 3). As seen in
Figure 3C and Supplemental Movie 4 when the platelet plasma membrane was rendered transparent, the rendered organelles, mitochondria (purple) and condensed (blue) and decondensed alpha-granules (yellow) were concentrated in the vertical, wound hole distal portions of the platelets while the hole proximal portions contained little to no mitochondria or alpha-granules. When viewed in ortho-slices (
Figure 3B & C). the hole proximal portions of the platelets appeared to be deficient in all cytoplasmic organelles. Quantitatively about 3/4th of the scored contained either alpha-granules, mitochondria or both (
Figure 3H). The number of mitochondria or alpha-granules retained (
Figure 3I) was low in comparison to circulating mouse platelets [
2], most -granules were decondensed indicating extensive content release [
3].
Individually displayed, transparent, rendered examples demonstrated striking organelle partitioning with what appears to be the “leading edge” of each platelet extending towards the wound hole being deficient in organelles (
Figure 3D-G). Each of these platelets displayed a striking boot like shape with organelles being concentrated in the boot “upper”. This overall platelet shape was frequent within the 25 platelets. A second common shape class was “tube-like” with little to no mitochondria nor -granules (< 3). Members of this class were concentrated proximal to the hole, suggestive of platelet partitioning and subsequent platelet fission (
Figure 4). We conclude from our 3D analysis that platelets near the wound hole are partitioning their content with the major organelles being retained in vertical portions distal to the hole while portions proximal to the wound hole appeared to be acting as an organelle-free leading edge that exhibits migratory behavior. In brief, these results suggest that platelets are capable of both cell fission and chemotactic migration toward presently unknown signals within the blood outflow.
2.4. Quantitative Comparisons of Platelet at the Collagen-Rich Adventitial Interface (ROI 1) and Wound Hole Interface (ROI 2)
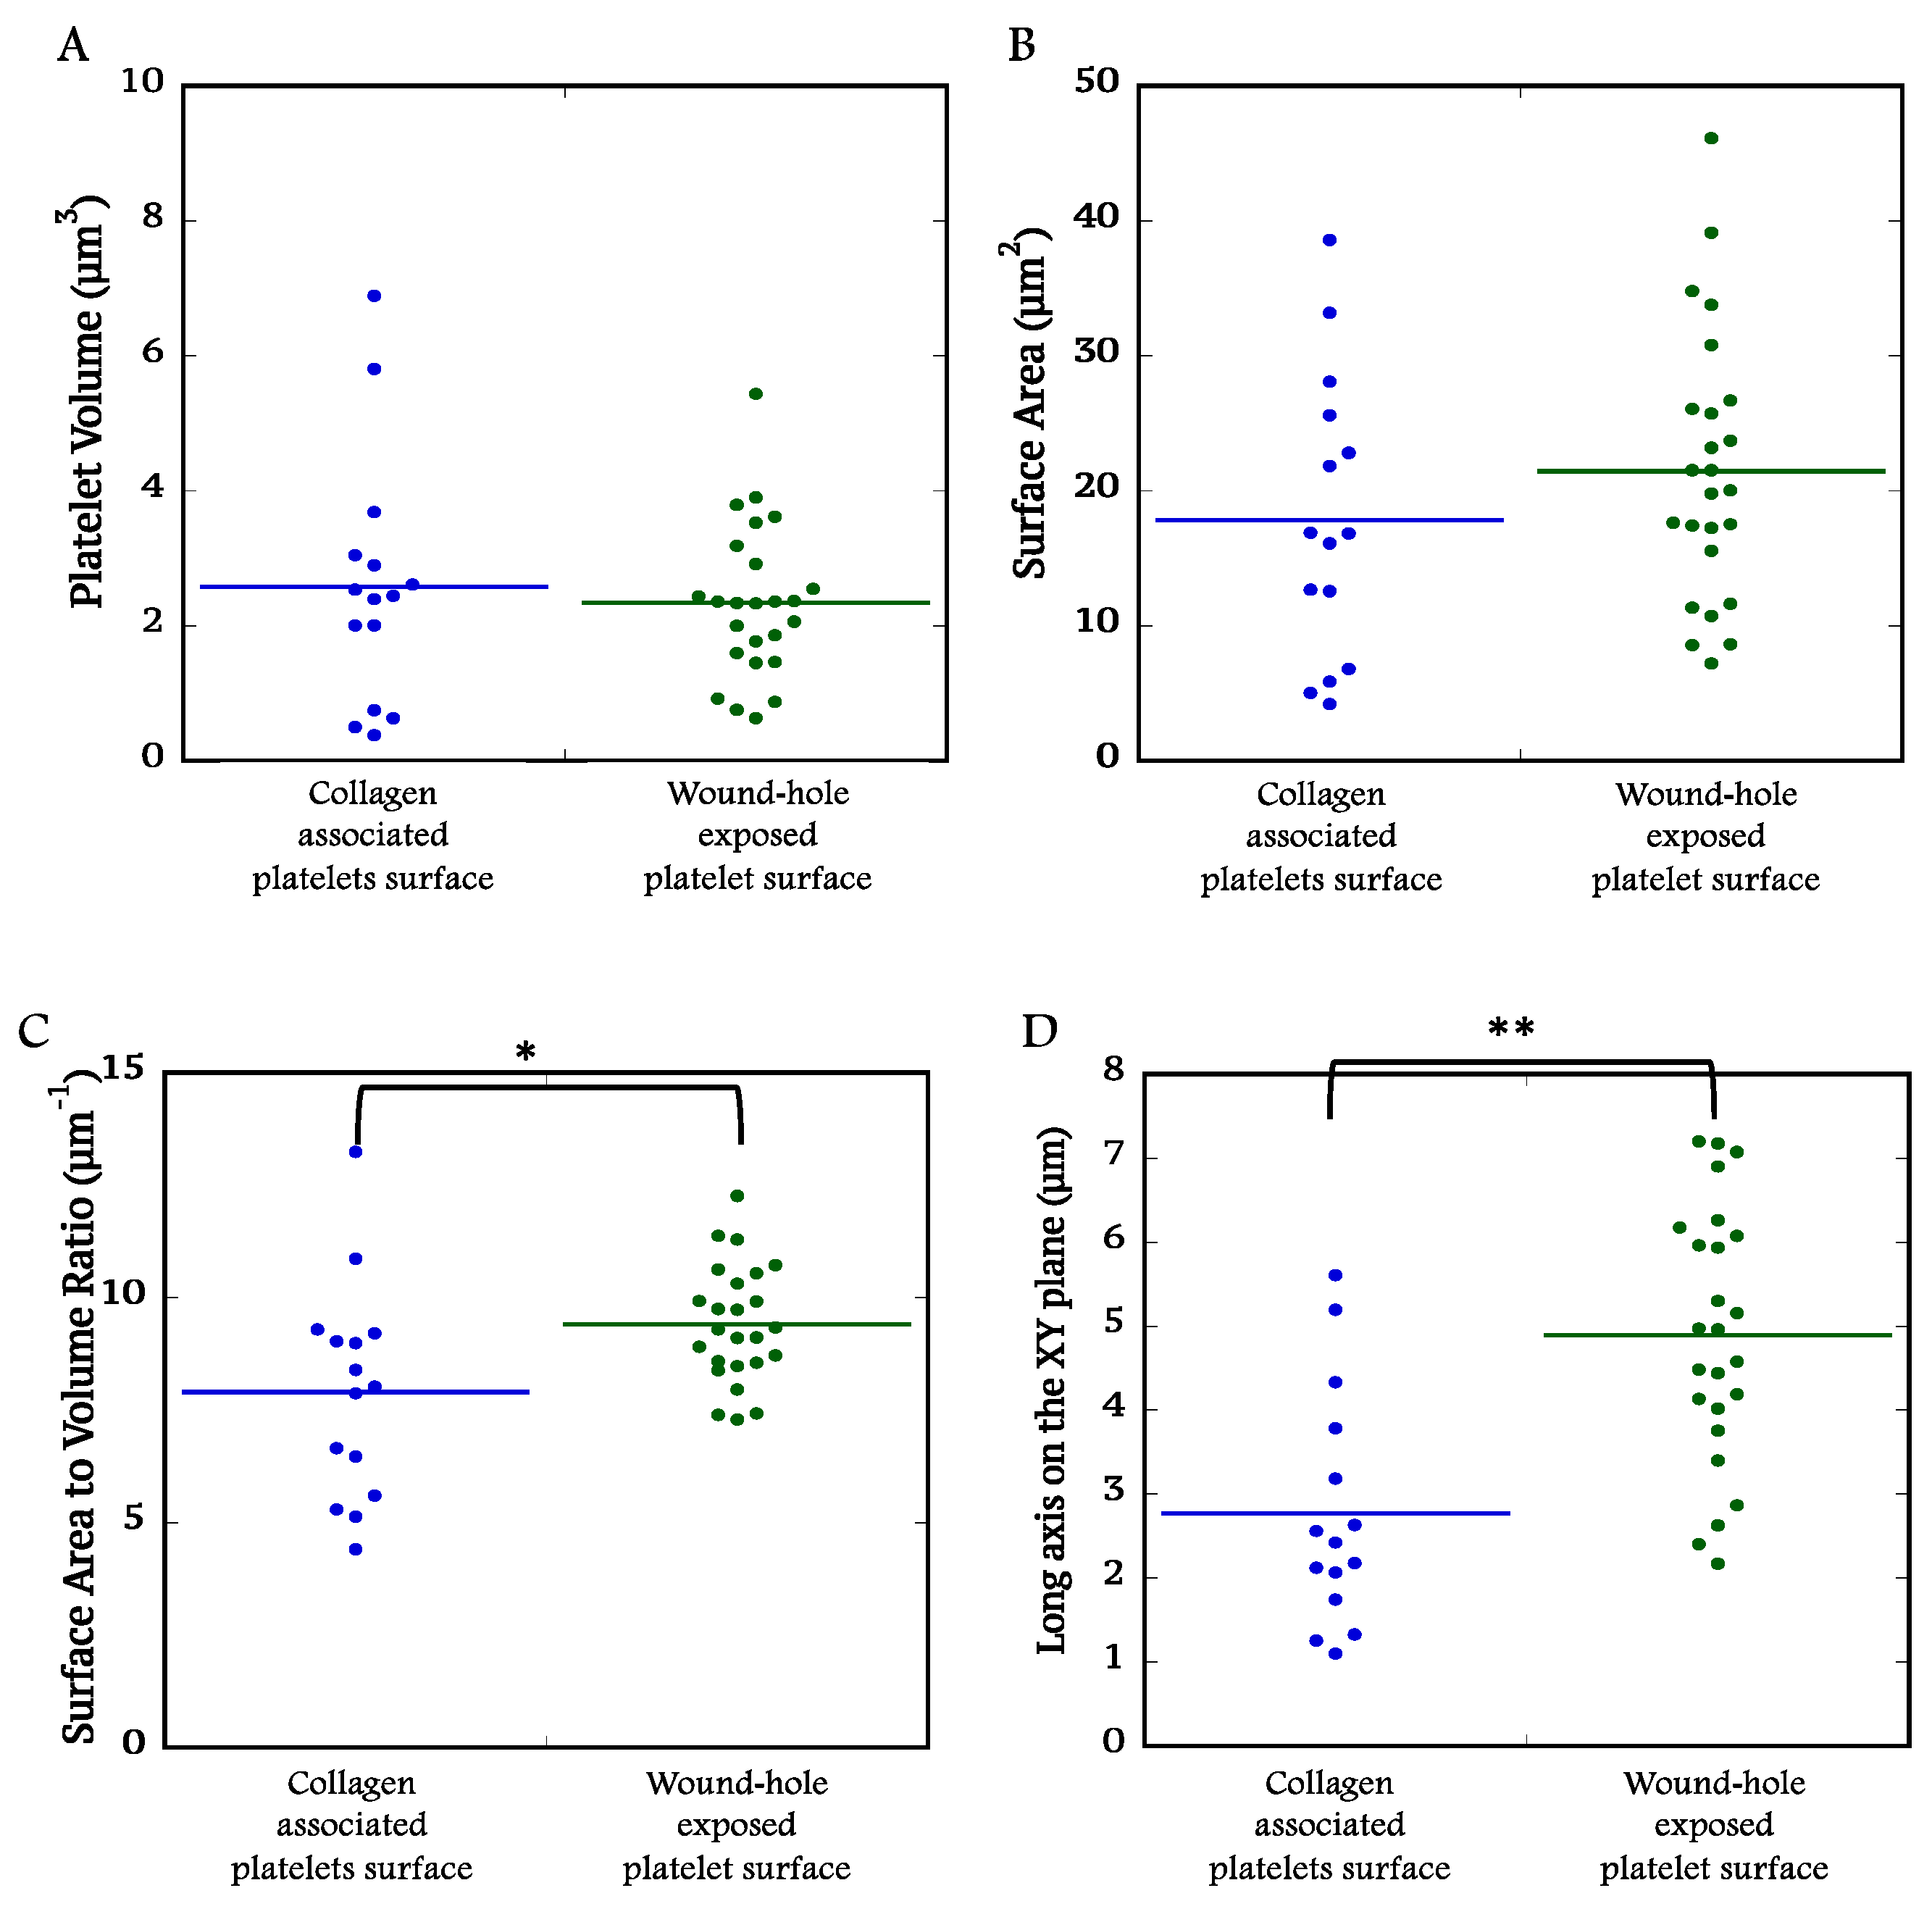
As expected for an experimental system in which all platelets within the ROIs originate from the same source, the mean platelet volume in either ROI was not significantly different (2.57
+ 1.84 µm3 and 2.34
+ 1.13 µm3, collagen-rich adventitial interface and wound hole interface,
Figure 5A) and fell within 10 to 20% of that of immediately fixed C57Bl/6 platelets (2.9
+ 0.34 µm3) [
2]. This is a strong indication that the platelet within the analyzed ROIs have the same mass and are little different in mass than that of circulating mouse platelets. Consistent with this, mean platelet surface areas had no significant differences across the two ROIs (
Figure 5B). In brief, differences in platelet surface area to volume ratio and in long axis on XY plane length must be due to differences in platelet shape between collagen- and wound hole-associated platelets (
Figure 5C & D). The numerical analysis is entirely consistent with the qualitative imaging; collagen-associated platelets (ROI 1) are comparatively thick and elongated in the Z-dimension only while the wound hole-associated platelets are thin/flattened in the YZ plane and elongated in the XY plane.
2.5. Platelets Exhibited Leading Edge Behavior in Vaulted Regions of Femoral Artery Puncture Wounds and in Ex-Vivo Experiments
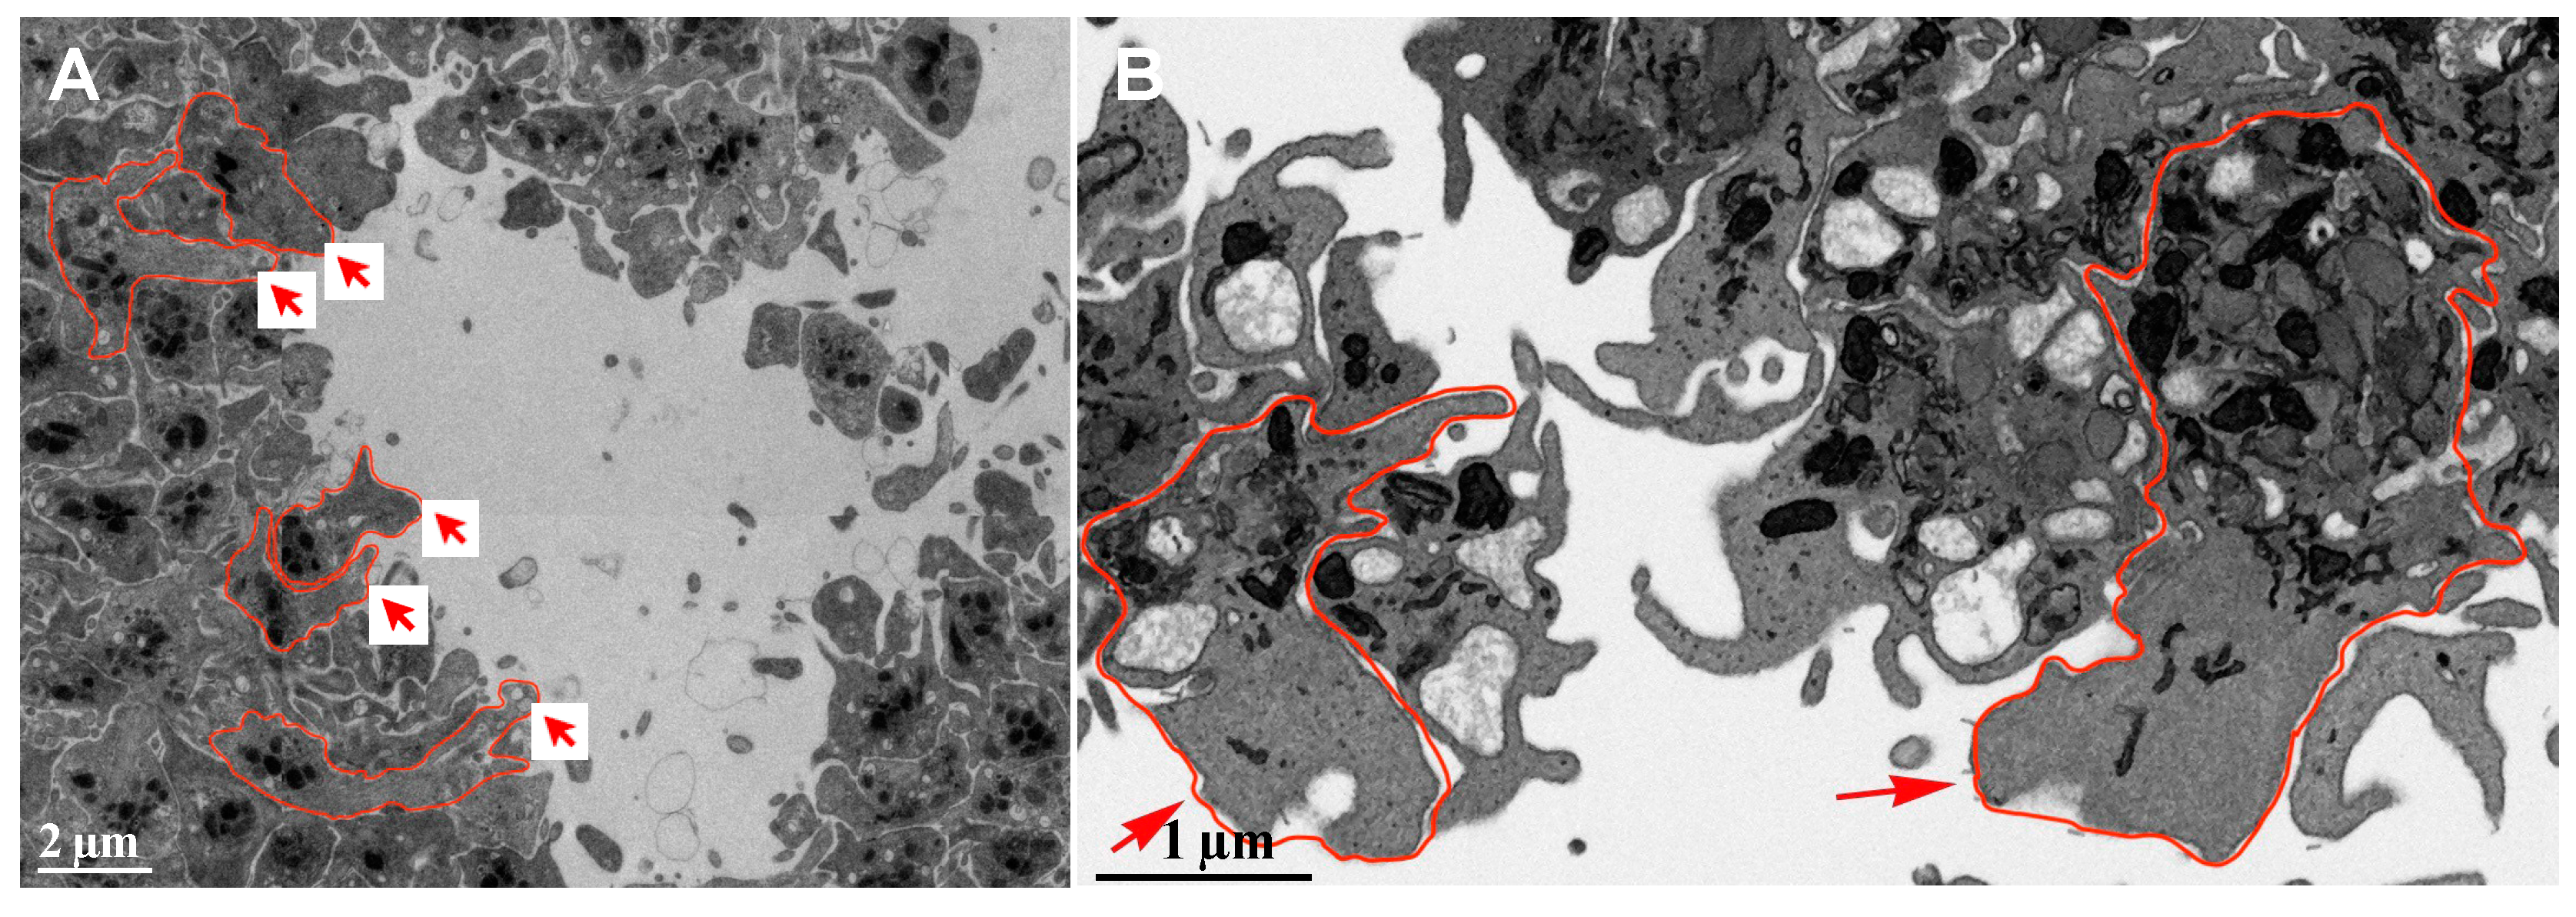
To test if similar platelet leading edge migratory behavior was observed in other examples than the jugular vein puncture wound, we next examined a femoral artery puncture wound and an ex-vivo thrombin stimulated case. In the femoral example, the 5 min puncture wound hole was closed by an extravascular cap [
4]. Our expectation was that any leading-edge behavior would be most obvious in flow protected, vaulted areas of the thrombus where accumulation of soluble signals would be relatively protected from flow. As shown in 2D image at mid thrombus depth (
Figure 6A), we observed several platelets (arrows) which exhibited “migratory” leading edge behavior extending outwards from an organelle rich cell body, like that found at the wound hole interface in the still bleeding 5 min jugular vein post-puncture wound thrombus. In aggregated mouse platelets stimulated ex-vivo for 300 sec with 0.1 U/mL thrombin and imaged by FIB-SEM, we again observed lead edge, migratory behavior (arrow,
Figure 6B). Leading edge behavior was not observed in 90 sec thrombin stimulated platelets, a condition where platelet aggregation had not occurred [see, 5]. These data strongly suggest that the formation of a platelet leading edge and platelet partitioning of organelles towards the cell body is a common “social” behavior of aggregated platelets in response to soluble signals which require platelet-platelet interactions.
3. Discussion
Our investigation into platelet morphodynamics reveal unexpected, signaling-influenced platelet shape changes within two distinct regions in a puncture wound thrombus and points to platelets exhibiting a migratory response resembling that of fibroblasts within the open wound hole. Platelets exhibit distinct shape at the collagen-rich adventitial interface and a wound hole interface. In the first case, an orientation that maximizes contact with collagen and places the platelet in a vertical orientation with respect to flow. In the second case, apparent thrombus embedded platelet movement partitions platelet contents and places a “leading edge” proximal to the wound hole. These findings suggest that platelet behavior within a thrombus is highly specialized in response to adhesive versus soluble activation signals.
At the adventitial interface, platelets elongated vertically to flow, exhibited a flattened-cylindrical shape that enhanced their ability to bind collagen. This orientation maximized surface exposure to the physical signal collagen while allowing platelets in collagen-rich environment to undergo organelle degranulation. Consistent with previous 2D intravital microscopy and wide-area transmission electron micrograph observations [
4,
5,
6] collagen associated platelets at adventitial interface were highly activated and extensively degranulated. Our 3D analysis revealed the 3D spatial embedding of these degranulated platelets between collagen bundles and that degranulation was selective for -granules versus mitochondria. At the adventitial interface platelets preferentially retained mitochondria. Platelet shape changes at the adventitial interface likely facilitate platelet activation, by supporting adhesion to collagen fibers and potentially enhancing initial steps in platelet recruitment to generate thrombus.
In contrast, platelets at the wound hole interface presented a set of unique morphological traits suggestive of "migratory" leading edge behavior. This behavior, reminiscent of the “leading edge” phenomenon first described by Abercrombie et al., (1970) for fibroblasts [
7], suggest that platelets may possess a similar capacity for directed movement in response to chemotactic signals within the thrombus environment. In our study, this was most clearly observed in boot-shaped platelets, where an organelle-poor, leading edge extended toward the wound site outward from the residual cell body which was comparatively rich in organelles. The perpendicular arrangement of the leading edge with respect to the cell body suggests an active mechanism and is difficult to explain through more passive mechanisms such as clot contraction [
8]. Instead, our data suggest that this behavior is a chemotactic response to soluble signals in the wound hole. Additionally, we identified a second shape class of apparent migratory platelets, tube-like platelets extending toward the wound hole. We suggest that these could be migratory fragments resulting from the fission of boot-shaped platelets. The presence of tube-like platelets vertically oriented in relation to blood flow further supports the idea of fission, that leaves the upper portion of the boot behind. Together, these traits imply that platelets are actively responding to soluble signals in the blood flow, forming “migratory” leading-edge structures that may well be critical for thrombus formation.
Previous in-vivo 2D studies by Nechipurenko et al. (2019) demonstrated that procoagulant platelets are localized at the periphery of thrombi, where they contribute to thrombus stability through enhanced interactions with clotting factors [
8]. This peripheral positioning allows procoagulant platelets to create a negatively charged surface by exposing phosphatidylserine, which promotes the assembly of coagulation complexes essential for thrombin generation [
9]. The organelle-poor, leading-edge structures observed in our study at the wound hole regions may represent a step within a multistep procoagulant platelets formation process. An organelle-depleted region is a key feature in the formation of procoagulant platelets and may enhances their role in coagulation by optimizing the surface area for binding clotting factors.
Our ex-vivo example indicates that organelle partitioning within a platelet requires platelet interaction and that one candidate soluble signal for organelle partitioning is thrombin. Previous isolated platelet studies e.g., [
5,
10], show that low-dose, ex-vivo thrombin stimulation does not produce organelle partitioning in non-adherent, non-aggregated platelets. However, we found repeated examples of organelle partitioning within thrombin-induced, ex-vivo platelet aggregates. Whether other soluble signals such as ADP are sufficient to produce organelle partitioning within platelet aggregates remains an important and open question. Humbert et al., 2009 show in aggregometer experiments with ADP stimulated human platelets that the platelets on the periphery of the formed aggregates are devoid of organelles while those more centrally located are rich in organelles [
11]. However, the 2D electron micrograph presented in that study is insufficient to provide spatial evidence on how these platelets originated. In sum, our data suggest thrombin as a candidate protein for such signaling in-vivo with ADP being a second putative candidate. Based on these findings, we suggest that, modulating platelet behavior within specific regions of a thrombus might be a viable strategy for controlling clot formation without disrupting overall hemostasis.
In summary, our study provides 3D spatial evidence of differential platelet morphodynamics in response to localized signaling environments within a thrombus, with platelets adopting specialized structures and putative function depending on whether they are interacting with collagen or responding to soluble factors at the wound site. These findings point to platelets exhibiting a similar migratory behavior to that of fibroblast in culture and contribute to a growing understanding of the complexity of platelet behavior in-vivo. They may have implications for developing more refined therapeutic interventions for thrombotic disorders.
4. Materials and Methods
4.1. Mice and Reagents
Wild-type C57BL/6 mice aged 8-12 weeks were purchased from Jackson Laboratories, Bar Harbor, Maines. Animal usage protocols were approved by the Institutional Animal Care and Use Committee. Reagents are described elsewhere [
12]. For ex-vivo experiments, isolated platelets were stimulated with 0.1 Units/ml as previously described [
3].
4.2. Jugular Vein and Femoral Artery Puncture Wounds and Sample Preparation for Serial Block Face-Scanning Electron Microscopy (SBF-SEM)
A jugular puncture wound with a nominal diameter of 312 microns was produced with a 30-gauge needle as previously described [
2,
4]. At 5-min post-puncture the jugular vein wound was fixed in situ by perfused 4% paraformaldehyde in buffer and subsequently processed for SBF-SEM [
13,
14]. The sample was embedded in plastic and pre-stained with heavy metals (osmium, uranyl and lead). Femoral puncture wounds were done using a 33-gauge needle, 210 microns nominal diameter as previously described [
14].
4.3. Election Microscopy - Region of Interest (ROI) Imaging
The 5-min post-puncture jugular vein sample was mounted for SBF-SEM as previously described [
12,
14]. Progressive SBF-SEM microscopy at a XY resolution of 100 nm and a Z-step size of 200 nm produced a series of exposed block faces and an image approximately 25% into the puncture thrombus was used to select ROIs for detailed analysis. Two ROIs, one at the collagen-rich adventitial interface and the other at the wound hole interface, were imaged at 6 x 6 nm XY pixel size and Z-step size of 50 nm. Images were collected over a total of 8.8 microns depth, 176 image slices.
For focused ion beam scanning electron microscopy (FIB-SEM), thrombin treated platelets were prepared as previously described [
3,
14]. For thin section, wide area transmission electron microscopy, femoral artery puncture wounds were prepared as described [
12,
13].
4.4. ROI Analysis
Amira software, version 2022.2 (Thermo Fisher Scientific, Waltham, MA, USA) was used to segment platelets, their organelles, and associated collagen as previously described [
3]. In total, fifteen platelets from collagen-rich adventitial interface and twenty-five platelets from the wound hole exposed platelet interface were selected for the analysis. 3D rendering and subsequent numerical analysis of platelet volume, platelet surface area, platelet surface area to volume ratio, and organelle parameters were all calculated within the Amira environment. Supplemental Movies 1-4 were prepared in Amira software.
4.5. Statistical Analysis
Dot plots were prepared, and statistical analyses were preformed using the Student t-test to calculate P values (Kaleidagraph software, Synergy Software, Reading, PA, USA).
4.6. Data Availability
The respective ROI data sets will be deposited in the European Bioinformatics image data base [
13].
Supplementary Materials
The following supporting information can be downloaded at the website of this paper posted on Preprints.org, Supplemental Movie 1, Rendered platelets at collagen-rich adventitial interface; Supplemental Movie 2, Transparent platelets showing organelles at collagen-rich adventitial interface; Supplemental Movie 3, Rendered platelets at puncture hole interface, soluble signaling; Supplemental Movie 4, Transparent platelets showing organelles at puncture hole interface, soluble signaling
Author Contributions
Madhavi A. Ariyathne performed software analysis of the platelets, prepared all figures and numeric analysis, and prepared the first draft of the manuscript and edited subsequent version. Irina D. Pokrovskaya and Kelly K. Ball prepared samples through animal surgeries and embedding and trimming for electron microscopy. Oliver Zhou did SBF-SEM imaging and demonstrated that the ROI analysis was possible with SBF-SEM resolution samples. Maria A. Aronova, directly supervised the SBF-SEM imaging and Oliver Zhou. Richard D. Leapman is laboratory chief for the SBF-SEM imaging done at the NIBIB. Brian Storrie supervised the entire project and did much of the editing of the manuscript. All authors have read and agreed to the published version of the manuscript.
Funding
This research was partially funded by United States National Institutes of Health grant R01 HL 155519 to BS and subawards from R01 HL146373 (Lawrence F. Brass) and R35 HL150818 (Sidney W. Whiteheart). Work in the Richard D. Leapman laboratory, United States National Institute of Biomedical Imaging and Bioengineering, was funded by the agency intramural research program.
Animal Use Statement
The animal study protocol was approved by the Institutional Review Board of the University of Arkansas for Medical Research (IPROTO202200000418, approved 1/31/2023).
Data Availability Statement
All 3D image datasets will be deposited in the Microscopy Public Image Archive (
https://www.ebi.ac.uk/empiar) and will be publicly available as raw images upon acceptance of this manuscript. All mapping analysis, resulting quantitative analysis, and mapping imagery are unique and original to the present work.
Acknowledgments
Electron microscopy sample preparation at the University of Arkansas for Medical Sciences was supported by Jeffrey A. Kamykowski.
Conflicts of Interest
The authors declare no conflicts of interest. The funders had no role in the design of the study; in the collection, analyses, or interpretation of data; in the writing of the manuscript; or in the decision to publish the results.
References
- McBride, E.; Rao, A.; Zhang, G.; Hoyne, J.; Calco, G.; Kuo, B.; He, Q.; Prince, A.; Pokrovskaya, I.; Storrie, B.; et al. Comparison of 3D cellular imaging techniques based on scanned electron probes: Serial block face SEM vs. Axial bright-field STEM tomography. J. Struct. Biol. 2018, 202, 216–228. [Google Scholar] [CrossRef] [PubMed]
- Pokrovskaya, I.; Tobin, M.; Desai, R.; Aronova, M.A.; Kamykowski, J.A.; Zhang, G.; Joshi, S.; Whiteheart, S.W.; Leapman, R.D.; Storrie, B. Structural analysis of resting mouse platelets by 3D-EM reveals an unexpected variation in α-granule shape. Platelets 2020, 32, 608–617. [Google Scholar] [CrossRef] [PubMed]
- Pokrovskaya, I.D.; Joshi, S.; Tobin, M.; Desai, R.; Aronova, M.A.; Kamykowski, J.A.; Zhang, G.; Whiteheart, S.W.; Leapman, R.D.; Storrie, B. SNARE-dependent membrane fusion initiates α-granule matrix decondensation in mouse platelets. Blood Adv. 2018, 2, 2947–2958. [Google Scholar] [CrossRef] [PubMed]
- Pokrovskaya, I.D.; Rhee, S.W.; Ball, K.K.; Kamykowski, J.A.; Zhao, O.S.; Cruz, D.R.; Cohen, J.; Aronova, M.A.; Leapman, R.D.; Storrie, B. Tethered platelet capture provides a mechanism for restricting circulating platelet activation to the wound site. Res. Pr. Thromb. Haemost. 2023, 7, 100058. [Google Scholar] [CrossRef] [PubMed]
- Falati, S.; Gross, P.; Merrill-Skoloff, G.; Furie, B.C.; Furie, B. Real-time in vivo imaging of platelets, tissue factor and fibrin during arterial thrombus formation in the mouse. Nat. Med. 2002, 8, 1175–1180. [Google Scholar] [CrossRef] [PubMed]
- Furie, B.; Furie, B.C. Thrombus formation in vivo. J. Clin. Investig. 2005, 115, 3355–3362. [Google Scholar] [CrossRef] [PubMed]
- Abercrombie, M.; Heaysman, J.E.; Pegrum, S.M. The locomotion of fibroblasts in culture I. Movements of the leading edge. Exp. Cell Res. 1970, 59, 393–398. [Google Scholar] [CrossRef] [PubMed]
- Nechipurenko, D.Y.; Receveur, N.; Yakimenko, A.O.; Shepelyuk, T.O.; Yakusheva, A.A.; Kerimov, R.R.; Obydennyy, S.I.; Eckly, A.; Leon, C.; Gachet, C.; et al. Clot Contraction Drives the Translocation of Procoagulant Platelets to Thrombus Surface. Arterioscler. Thromb. Vasc. Biol. 2019, 39, 37–47. [Google Scholar] [CrossRef] [PubMed]
- Kholmukhamedov, A.; Jobe, S. Procoagulant Platelets Get Squeezed to Define the Boundaries of the Hemostatic Plug. Arter. Thromb. Vasc. Biol. 2019, 39, 5–6. [Google Scholar] [CrossRef] [PubMed]
- Ren, Q.; Barber, H.K.; Crawford, G.L.; Karim, Z.A.; Zhao, C.; Choi, W.; Wang, C.-C.; Hong, W.; Whiteheart, S.W.; Woo, S.S.; et al. Endobrevin/VAMP-8 Is the Primary v-SNARE for the Platelet Release Reaction. Mol. Biol. Cell 2007, 18, 24–33. [Google Scholar] [CrossRef] [PubMed]
- Humbert, M.; Nurden, P.; Bihour, C.; Pasquet, J.-M.; Winckler, J.; Heilmann, E.; Savi, P.; Herbert, J.-M.; Kunicki, T.J.; Nurden, A.T. Ultrastructural Studies of Platelet Aggregates From Human Subjects Receiving Clopidogrel and From a Patient With an Inherited Defect of an ADP-Dependent Pathway of Platelet Activation. Arter. Thromb. Vasc. Biol. 1996, 16, 1532–1543. [Google Scholar] [CrossRef] [PubMed]
- Ball, K.; Pokrovskaya, I.; Storrie, B. Puncture Wound Hemostasis and Preparation of Samples for Montaged Wide-Area Electron Microscopy Analysis. J. Vis. Exp. 2024, e66479. [Google Scholar] [CrossRef] [PubMed]
- Rhee, S.W.; Pokrovskaya, I.D.; Ball, K.K.; Ling, K.; Vedanaparti, Y.; Cohen, J.; Cruz, D.R.D.; Zhao, O.S.; Aronova, M.A.; Zhang, G.; et al. Venous puncture wound hemostasis results in a vaulted thrombus structured by locally nucleated platelet aggregates. Commun. Biol. 2021, 4, 1–13. [Google Scholar] [CrossRef]
- Joshi, S.; Smith, A.N.; Prakhya, K.S.; Alfar, H.R.; Lykins, J.; Zhang, M.; Pokrovskaya, I.; Aronova, M.; Leapman, R.D.; Storrie, B.; et al. Ferric Chloride-Induced Arterial Thrombosis and Sample Collection for 3D Electron Microscopy Analysis. J. Vis. Exp. 2023, e64985. [Google Scholar] [CrossRef]
Figure 1.
Overview of the Region of Interest through representative SBF-SEM raw images at various thrombus formation stages in 5-minute post-puncture wound in a mouse. A Raw image, SBF-SEM, 100 nm XY pixel size in a raw captured image (The solid red arrow indicates the direction of major blood flow inside the vessel, while the dotted red arrow indicates the direction of bleeding from the puncture wound). B Collagen-rich adventitia platelets interface (tan marking indicates the specific interface of interest). All 15 segmented cells were selected from this marked region. C Fifteen cells selected for the analysis from collagen-rich adventitia platelets interface were marked up with 15 different colors (image collection each voxel size is 6 nm x 6 nm x 50 nm). D Wound hole exposed platelet interface (tan marking indicates the specific interface of interest). All 25 segmented cells were selected from this marked region. E Twenty-five cells selected for the analysis from wound hole exposed platelet interface were marked up with 25 different colors (image collection each voxel size is 6 nm x 6 nm x 50 nm).
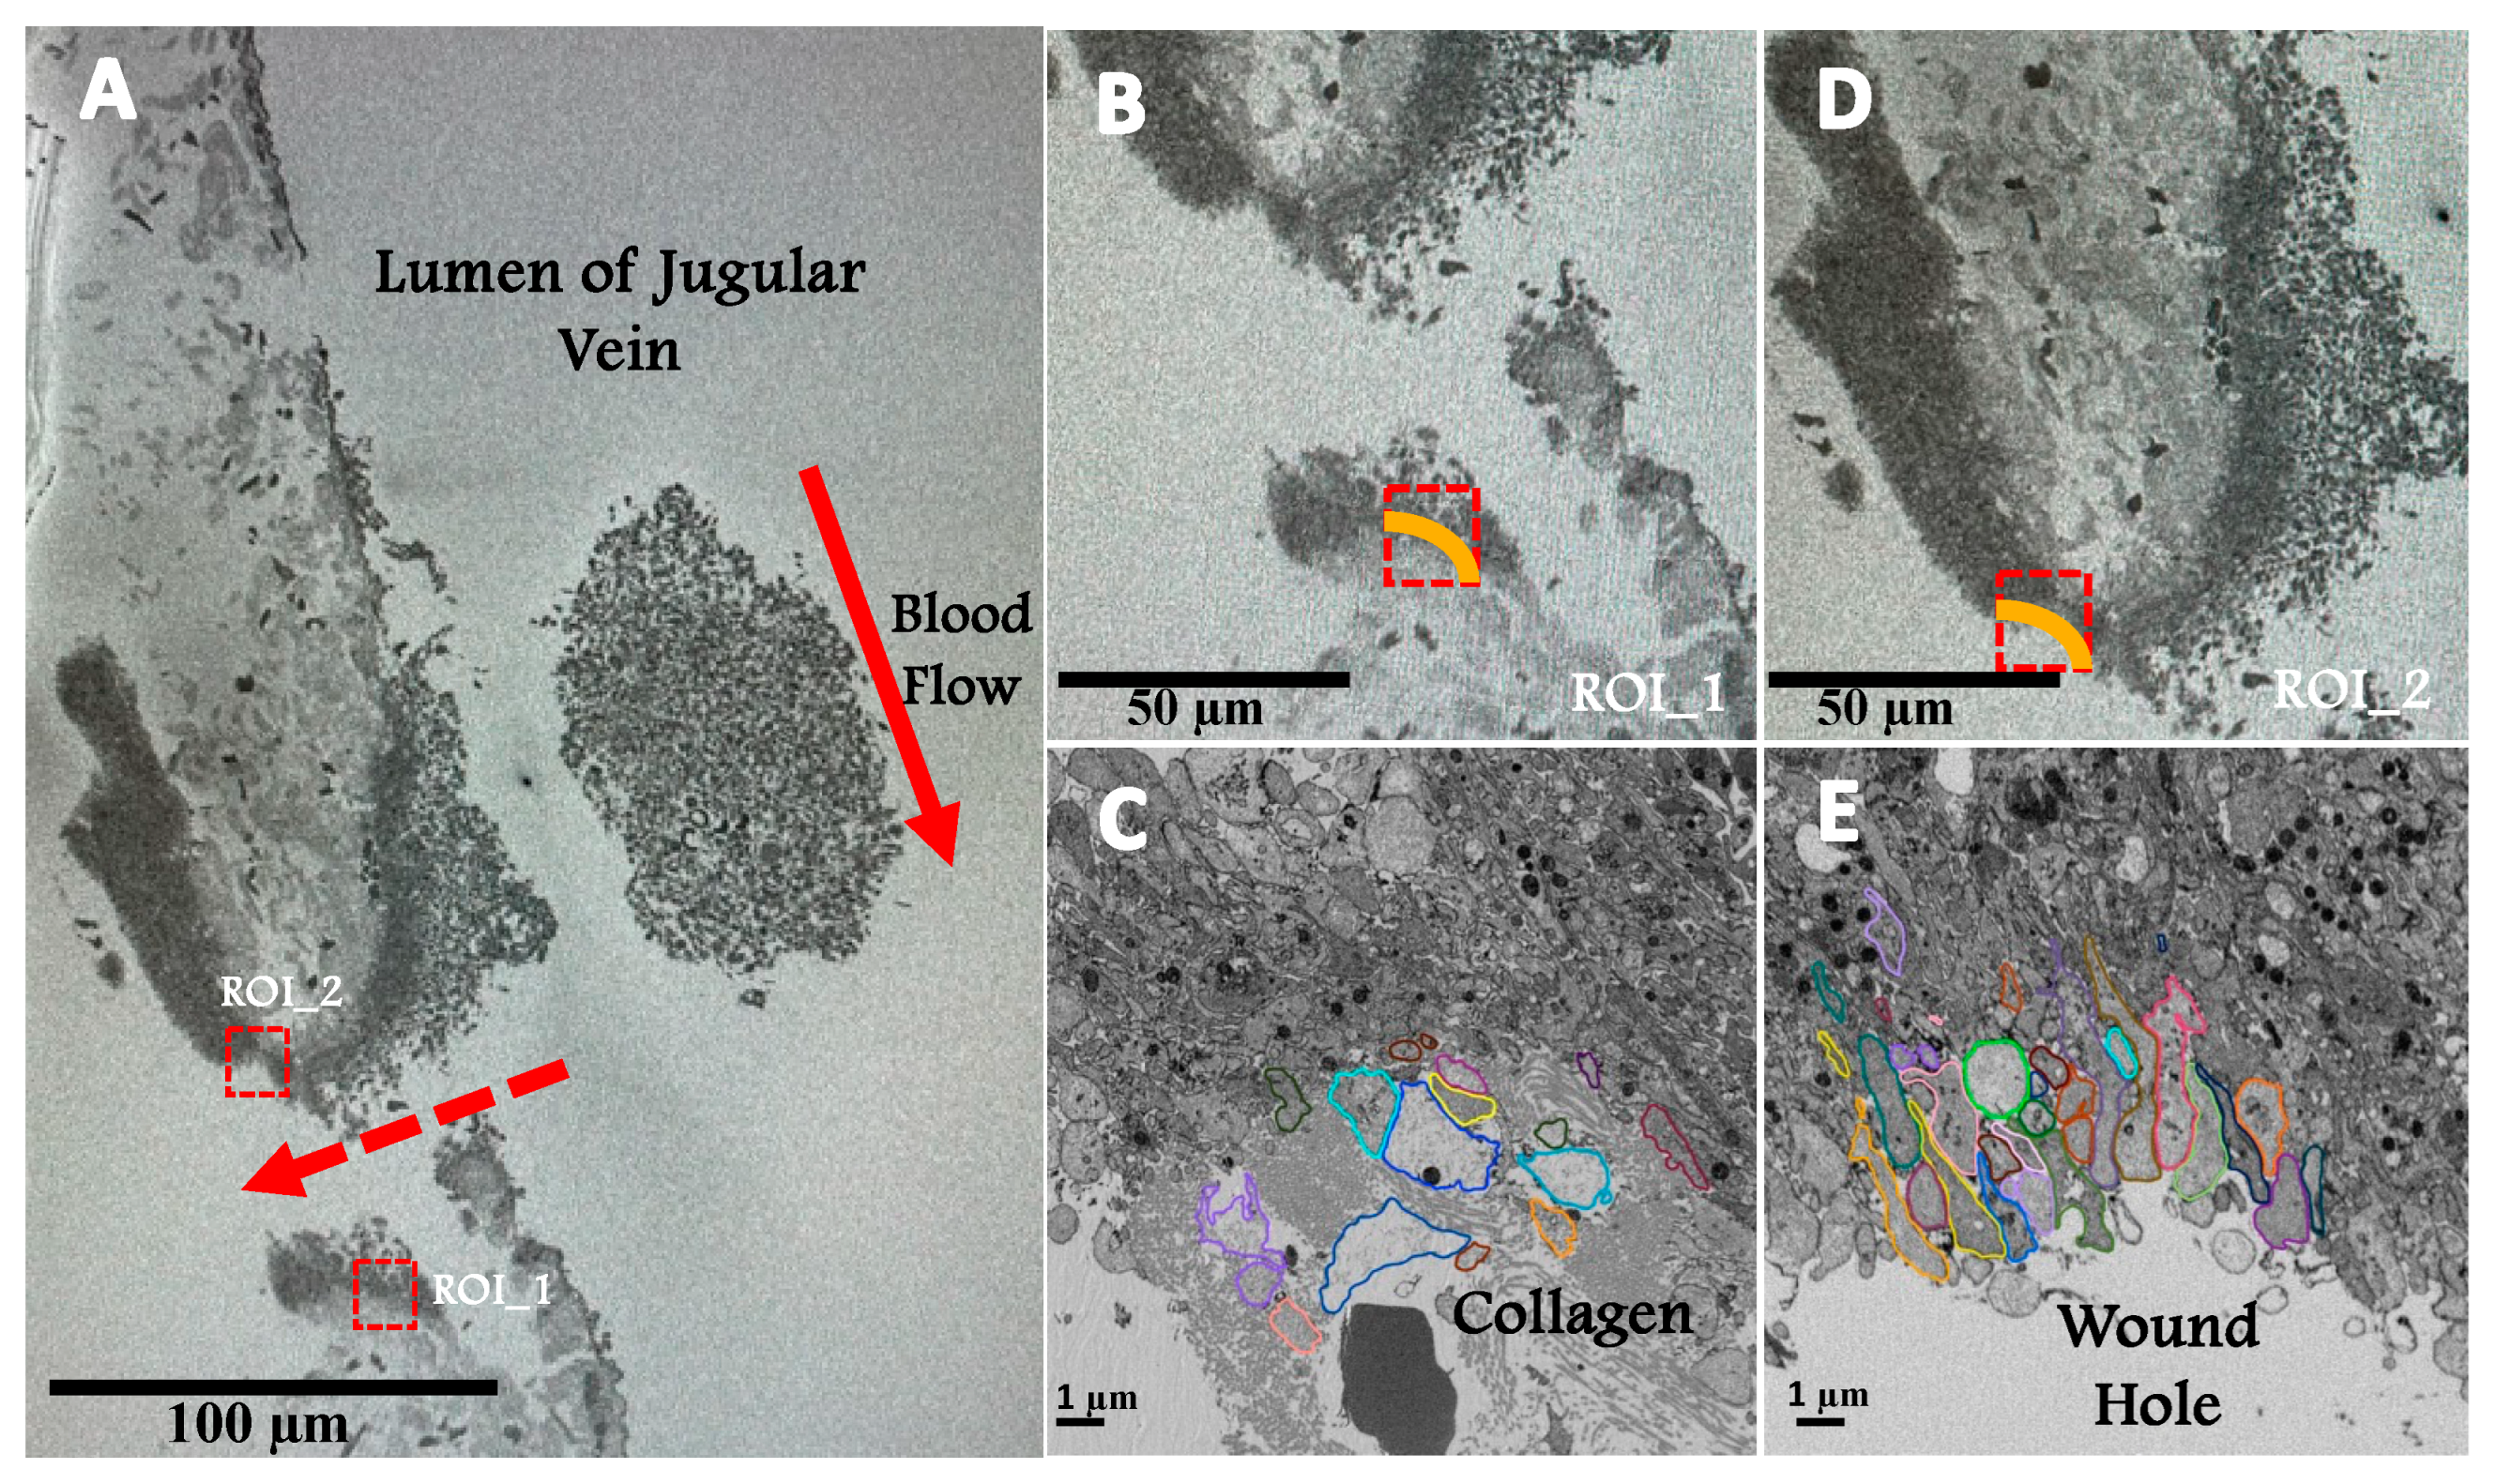
Figure 2.
A Three orthogonal slices delineate a complete collagen-rich adventitia platelet interface SBF-SEM image data sets. B 3D surface rendered model of randomly chosen 15 platelets at the collagen-rich adventitia platelet interface. C The spatial arrangement of surface rendered organelles: condensed alpha-granules, decondensed alpha-granules and mitochondria (organelles have been color-coded: plasma membrane – green, condensed alpha-granules – blue, decondensed alpha-granules – yellow, mitochondria – purple, and light gray – collagen). D Bar plot representing the distribution of organelles across 15 randomly selected platelets at the collagen-rich adventitia platelet interface. E Dot plot summarizing the organelle counts of 15 randomly selected platelets at the collagen-rich adventitia platelet interface. F/F’ Three representative platelets located on the boarder of the collagen-rich adventitia platelet interface G/G’ Three representative platelets surrounded by collagen-rich adventitia. The visualizations were rendered using Amira software for 3D modeling.
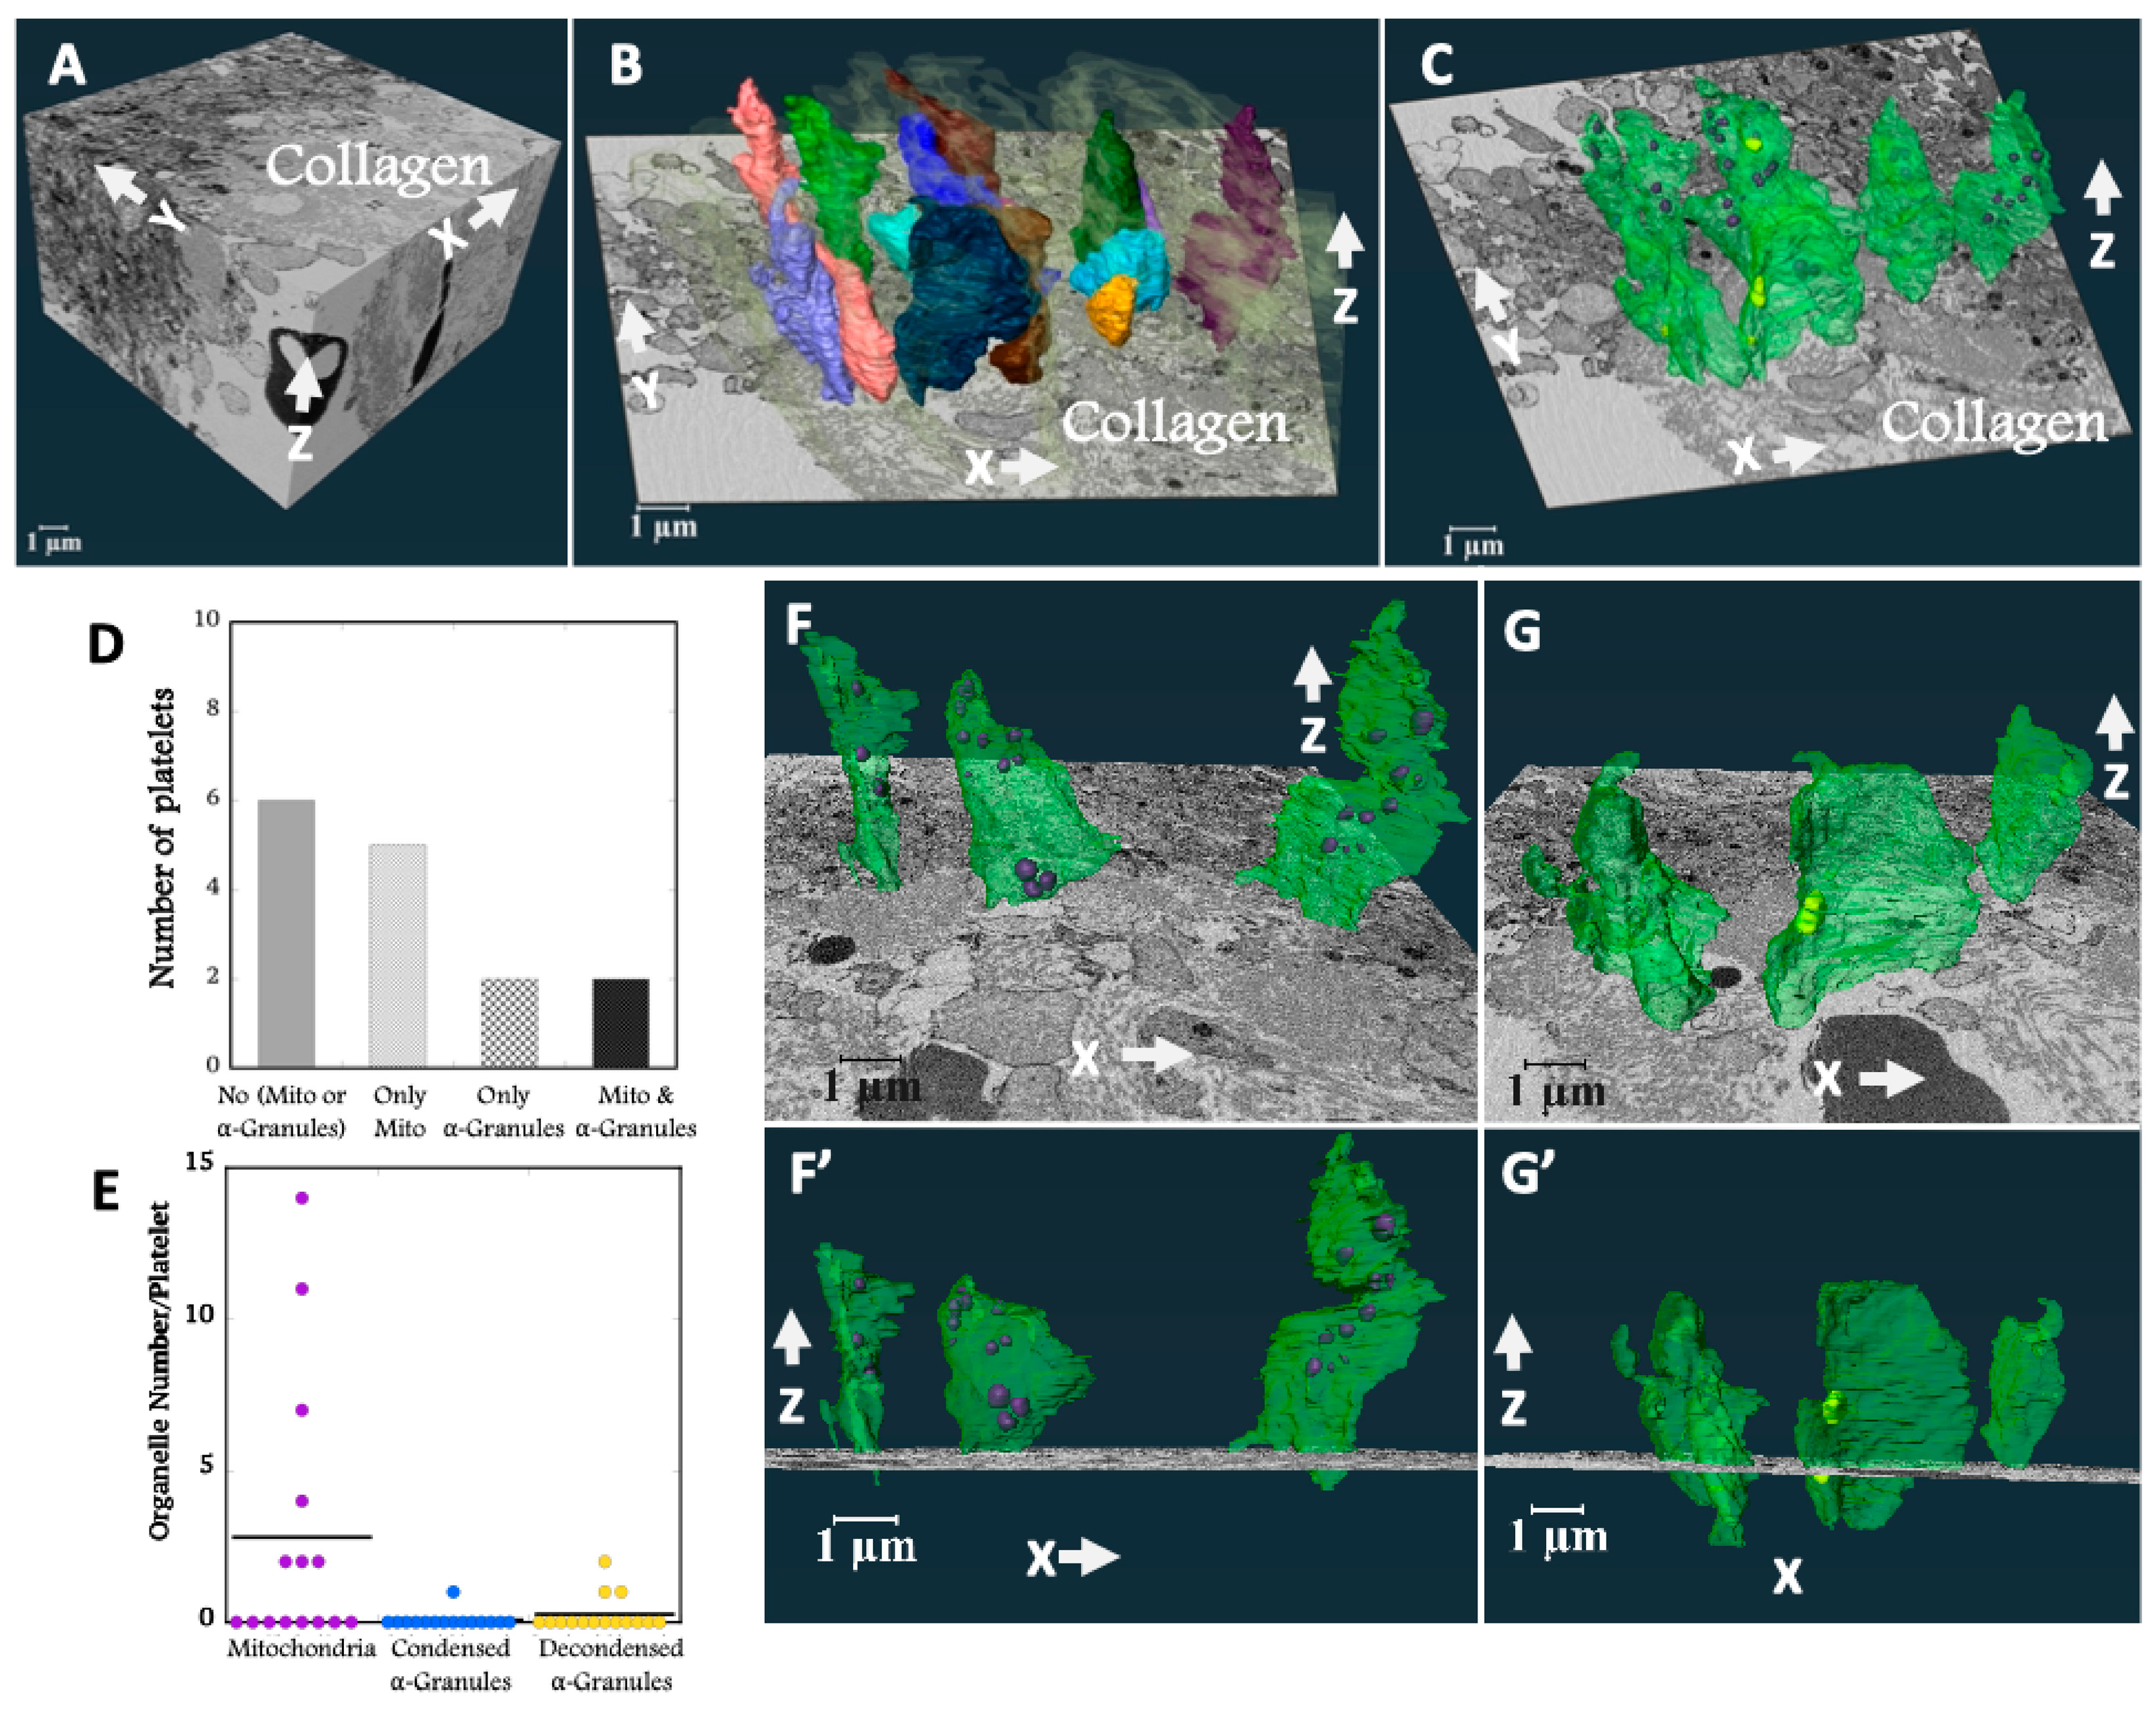
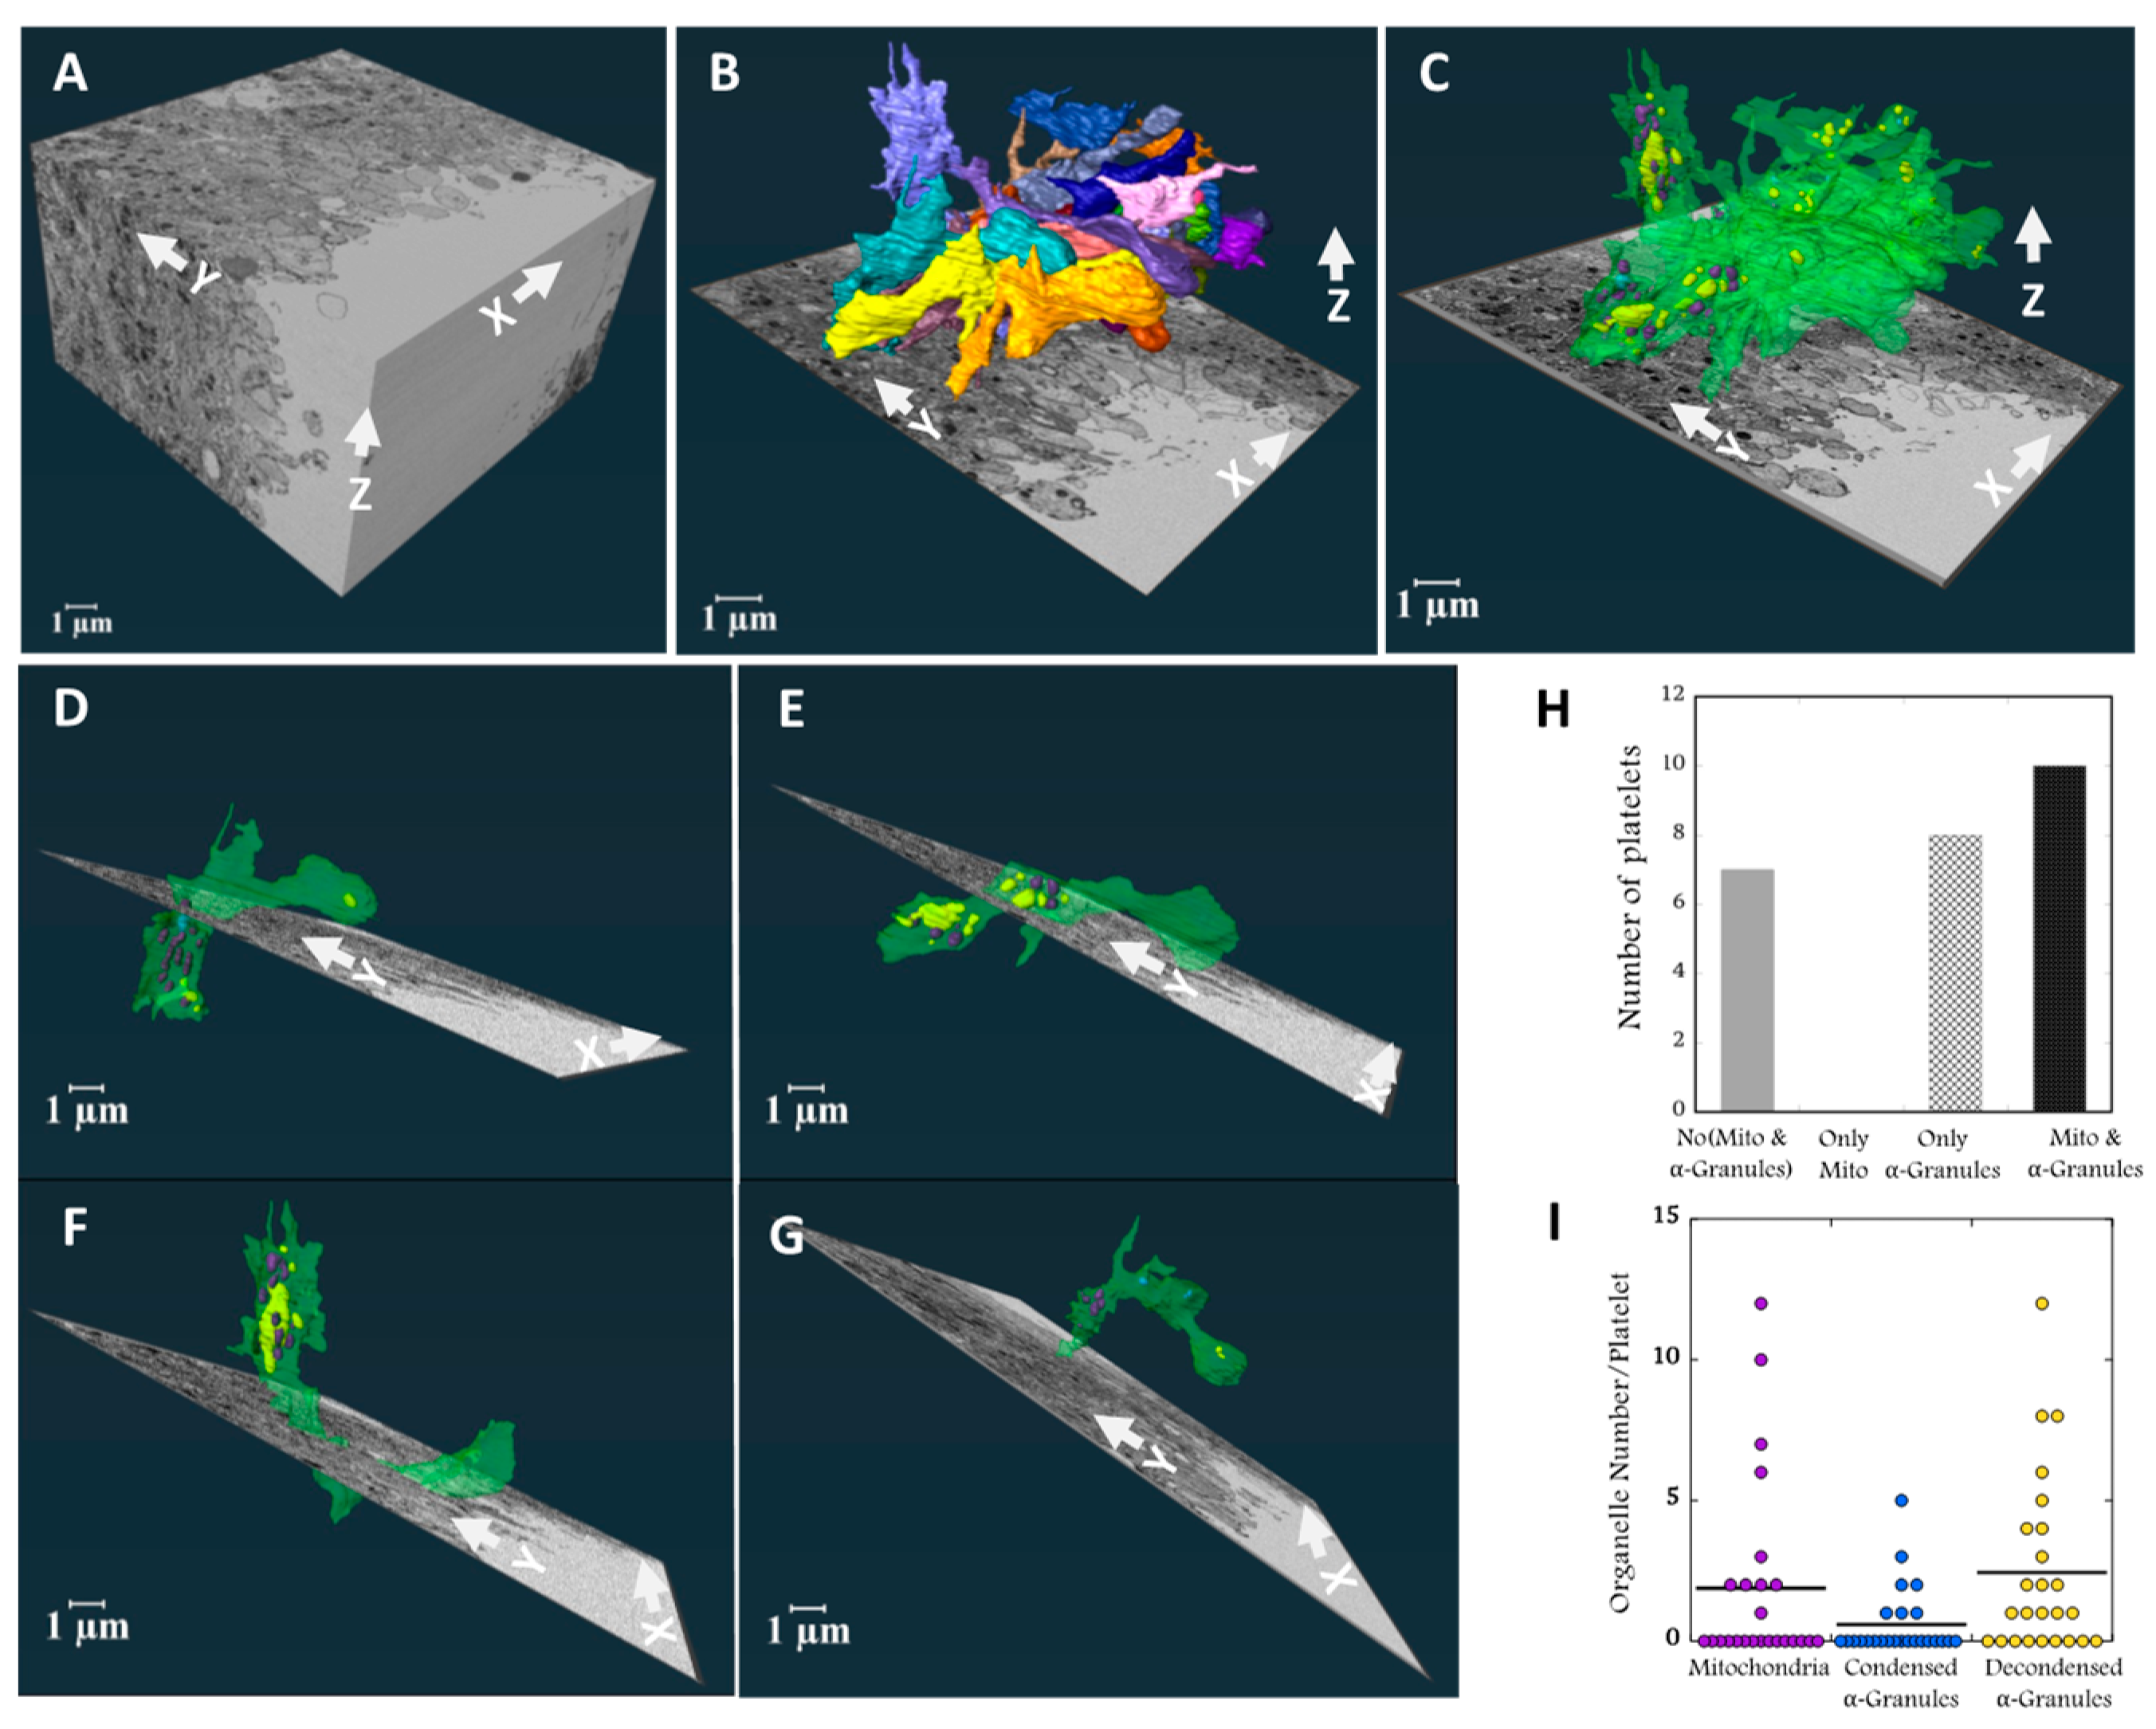
Figure 3.
A Three orthogonal slices delineate a complete wound hole platelet interface SBF-SEM image data sets. B 3D surface rendered model of randomly chosen 25 platelets at the wound hole platelet interface. C The spatial arrangement of surface rendered organelles: condensed alpha granules, decondensed alpha granules and mitochondria (organelles have been color-coded: plasma membrane – green, condensed alpha-granules – blue, decondensed alpha-granules – yellow, and mitochondria – purple). D-G Four representative platelets located at the wound hole platelet interface. The visualizations were rendered using Amira software for 3D modeling. H Bar plot representing the distribution of organelles across 25 randomly selected platelets at the wound hole platelet interface. I Dot plot summarizing the organelle counts of 25 randomly selected platelets at the wound hole platelet interface.
Figure 4.
A 3D surface rendered boot shape cells at the wound hole platelet interface. B The spatial arrangement of surface rendered organelles: condensed alpha granules, decondensed alpha granules and mitochondria of boot shape cells at the wound hole platelet interface. (organelles have been color-coded: plasma membrane – green, condensed alpha-granules – blue, decondensed alpha-granules – yellow, and mitochondria – purple), Organelle count > 3, (Mean = 9.4). C 3D surface rendered tube-like cells at the wound hole platelet interface. D The spatial arrangement of surface rendered organelles: condensed alpha-granules, decondensed alpha-granules and mitochondria of tube-like shape cells at the wound hole platelet interface. (organelles have been color-coded: plasma membrane – green, condensed alpha-granules – blue, decondensed alpha-granules – yellow, and mitochondria – purple), Organelle count < 3, (Mean = 0.9).
Figure 5.
Quantitative platelets parameters summarized in dot plots. A Platelet volume B Platelet surface C Platelet surface area to volume ratio D Long axis on the XY plane of the platelets at the collagen-rich adventitia platelets interface (N =15) and the wound hole exposed platelet interface (N = 25) were plotted using Kaleidagraph software. Student ttest were used to determine p values. * is for p < 0.05 and ** is for p < 0.005.
Figure 6.
Leading edge behavior both within vaulted regions of the puncture wound thrombus in the femoral artery & ex-vivo experiment. A Femoral artery 5-minute post puncture wound thrombus. B Mouse platelets stimulated with 0.1 U/mL thrombin for 300 seconds. Red arrows show leading edge behavior.
Figure 6.
Leading edge behavior both within vaulted regions of the puncture wound thrombus in the femoral artery & ex-vivo experiment. A Femoral artery 5-minute post puncture wound thrombus. B Mouse platelets stimulated with 0.1 U/mL thrombin for 300 seconds. Red arrows show leading edge behavior.
|
Disclaimer/Publisher’s Note: The statements, opinions and data contained in all publications are solely those of the individual author(s) and contributor(s) and not of MDPI and/or the editor(s). MDPI and/or the editor(s) disclaim responsibility for any injury to people or property resulting from any ideas, methods, instructions or products referred to in the content. |
© 2025 by the authors. Licensee MDPI, Basel, Switzerland. This article is an open access article distributed under the terms and conditions of the Creative Commons Attribution (CC BY) license (http://creativecommons.org/licenses/by/4.0/).