Submitted:
29 January 2025
Posted:
30 January 2025
You are already at the latest version
Abstract
Antarctic soil represents an important reservoir of filamentous fungi (FF) species with capability to produce novel bioactive lipids. However, the lipid extraction method is still bottleneck. The objective of the present work was to isolate and identify cultivable FF from Antarctic soils, to assess the most effective methods for fatty acids (FA) extraction, and to characterise the lipids obtained. A total of 18 fungal strains belonging to the genera Botrytis, Cladosporium, Cylindrobasidium, Mortierella, Penicillium, Pseudogymnoascus, Talaromyces, and to the Melanommataceae family were isolated and identified. The Folch, Bligh & Dyer and Lewis extraction methods were assessed, and methyl esters of FA (FAME) were obtained. The Lewis method was the best one in recovering FAME from fungal biomass. A total of 17 FA were identified and their chemical compositions varied depending on fungi species and strains. Oleic, linoleic, stearic and palmitic acids were predominant for all fungal strains in the three methods assessed. From the strains analysed, Cylindrobasidium eucalypti, Penicillium miczynskii, P. virgatum and Pseudogymnoascus pannorum produced high amounts of FA. This suggests that the soils of Antarctica Bay, as well as harbouring known oleaginous fungi, are also an important source of oleaginous filamentous fungi that are still poorly analysed.
Keywords:
Oleaginous fungi
; lipid extraction
; bioactive lipids
1. Introduction
Antarctic territory offers a range of challenging conditions, such as low temperatures, dryness, low nutrient content, high salinity, high UV incidence and freeze-thaw cycles [1,2,3]. This different environment represents a gateway to studies on the taxonomy, ecology, and biotechnology of organisms under extreme conditions. Fungi are ubiquitous and diverse organisms in Antarctica and have been described as growing in different substrates such as plants, soil, rocks, ice, snow, and animals [1,2,3]. To survive in such extreme conditions, fungi might display unusual biochemical pathways able to generate specific or novel compounds with medical biotechnological relevance. Before accessing the fungal biotechnological potential, knowing the fungal species is mandatory [4,5].
As an adaptation, saturated and unsaturated fatty acids (FA) have an important role in regulating biotic and abiotic stresses in Antarctic fungi [6,7]. The diversity and amounts of FA can vary from one to another organism. These is influenced by developmental stages, nutrition, and environmental conditions [6]. Due to their ability to accumulate lipids from 20 to 70% of their dry cell weight, strains of the genera Aspergillus, Cunninghamella, Fusarium, Mortierella, Mucor and Penicillium are known as oleaginous fungi [8,9,10,11,12].
Antarctic fungi are a rich source of new compounds [13,14]. However, until now the potential of Antarctic fungi as a source of FA and their application in biotechnological processes has been little explored. To achieve this target, establishing and optimising the process of FA extraction is crucial, especially for fungi strains obtained from pristine natural environments that have been little investigated.
Although the Bloor [15] method has widely been used for lipid extraction, it is a time-consuming method with several steps and use of different organics solvents (e.g., ethanol, ether, chloroform, petroleum). Folch, Bligh & Dyer and Lewis methods have been used as alternative approaches. Folch method can be used on different types of samples, while Bligh & Dyer method is compatibility for a shorter type of samples [9,16]. Overall, Lewis method is by far the simplest and most effective one to extract lipids from different sources. The method has the advantage of avoiding lipid degradation and allowing subsequent use for analysis, in a single step [17]. The objective of the present work was to isolate and identify cultivable filamentous fungi (FF) from Antarctic soils, to assess the most effective method for lipid extraction, and to characterise the lipids extracted from fungi cell membranes.
2. Results and Discussion
2.1. Soil Chemical Characterisation
Soil samples from Fildes Bay presented values of organic carbon (%OC) (1.7 – 11.9%) and pH (6.2 – 7.4) similar to mineral soils (%OC = c.a. 13%, pH= 6.4 – 7.6), as previously reported by Bockheim [18] and Rosa [19]. Among samples, S7 presented the highest C/N ratio (c.a. 55), while sample S5 presented the lowest C/N ratio (c.a. 2). Notably, samples S8, S4, and S5 presented the highest Phosphorus (P) values, c.a. 187, 274, and 371 mg/kg, respectively. Sample S1 showed the lowest Sodium (Na) values (c.a. 74 mg/kg); while sample S10 showed the highest Na value (c.a. 726 mg/kg) (Table 1).
Soil samples S1, S3, S4, S5, S8, and S9 were collected from soils with herbaceous vegetation of the genera Deschampsia and Colobanthus, or moss and presented pH values below 7.0. In contrast, the soil samples S6, S7, S10, and S11 were taken from soils free of vegetation and presented pH values over 7.0 (Table 1). The presence or absence of vegetation influenced the variation of pH in this set of soils [20,21]. Nevertheless, the variability of chemical characteristics can be affected by other abiotic and/or biotic factors.
The chemical properties of soil depend on the life cycle of the available flora and fauna. Besides, a higher nutrient content (e.g., nitrogen) suggests a greater impact of fauna through the deposition of animal excreta, such as guano [22]. Therefore, the presence of flora influences soil acidification, allowing the availability of nutrients and the metabolic activity of soil microorganisms [23]. Despite the above, both the physical properties of mineral soils and the extreme environmental conditions influence the retention and mobilization of nutrients. As a matter of consequence, nutrient inputs are leached or displaced to other areas, depriving the soil of nutrients [18,19]. Consequently, these characteristics could help explain the differences in C/N ratios and nutrients found among the soils and how these influence the development of life in Antarctic soils.
2.2. Isolation and Identification of Fungi Strains
Eighteen FF strains were isolated from Antarctic and firstly identified by classical macro- and micromorphology at genus level. Strains belonging to the genera Cladosporium, Penicillium, Pseudogymnoascus, and one strain belonging to the Dothideomycete class were classified. According to the molecular classification using ITS, the aforementioned identifications were confirmed at genus level. In contrast, based on the molecular information, the strain belonging to the Dothideomycete class (UFRO22.418) was reclassified into the Melanomataceae family. Some other strains were reclassified by molecular biology into the genera Botrytis, Cylindrobasidium, Talaromyces and Mortierella (Mucoromycota division). Overall, phylogenetic analysis revealed that the total data set included 8 genera and 14 different fungi species (Table 2). Phylogenetic trees are presented in the Figure S1 – S8.
The genera Cladosporium, Penicillium, Pseudogymnoascus, and Mortierella, have been reported as the most cosmopolitan ones in Antarctic soil samples [19,24,25]. In contrast, the genera Botrytis, Cladosporium and Talaromyces are less frequent in Antarctic soils [26,27]. The Melanomataceae family encompass species that have usually been isolated from permafrost (e.g., soil or underwater sediment which continuously remains below 0 °C (Figure S8). Fungi belonging to the Melanommataceae family (e.g., Alpinaria rhododendri) can be find in root and rhizosphere samples [28].
2.3. Lipid Extraction and FAME Production
Establishing fast and efficient protocols for extracting lipids from fungal biomass is a fundamental step to (i) understanding the lipid composition, (ii) selecting the most promising lipid-producer strains and (iii) optimising fungi growth conditions to obtain a higher lipid yield. Lipid extraction steps are even more important when the microorganisms studied come from pristine environments that have been little or never studied before with regard to lipid composition and efficient extraction protocols [9].
In the present study, the Bligh & Dyer, Folch, and Lewis methods were applied to extract lipids from strains of Botrytis, Cladosporium, Mortierella, Penicillium, Pseudogymnoascus and Talaromyces genera, and of the Melanommataceae family. To compare the overall extraction performance of the Bligh & Dyer, Folch and Lewis methods the total lipid extract (TLE%) was calculated. The TLE% values corresponded to the total lipids yield obtained by each method. The best results for TLE% were observed for the Folch and Lewis methods.
According to statistical analysis, no significant differences between Folch and Lewis methods were observed (Table 3). The effectiveness of lipid extraction among each fungal strain was assessed (Table S1). According to data obtained, the Bligh & Dyer, Folch, and Lewis methods led to total lipid extract yields ranging from 0.84 – 15.79%, 2.01 – 28.15% and 3.28 – 17.53%, respectively.
The effectiveness of FAME production among the three methods was assessed. The Lewis method was the best one in recovering FAME from fungal biomass. Significant statistical differences were observed (p-value < 0.05) (Table 3). The effectiveness of FAME production among each fungal strain was also assessed. The Lewis method was the best one yielding FAME ranging from 20.7 – 79.8%; while for Folch and Bligh & Dyer methods the FAME percentage ranged from 1.25 – 37.86% and 5.33 – 55.30%, respectively (Table 3). Unlike the other two methods, in Lewis methods HCl is added to extract and derivatise lipid molecules into FAME. This procedure is made in a single step avoiding losses of lipid molecules.
The lowest lipid extraction yields and FAME abundance obtained with Bligh & Dyer can be explained by the characteristics of the extraction itself. According to Iverson et al. [29] and Forfang et al. [9], the Bligh & Dyer method can lead to an underestimation of the lipid content and FAME abundance. The small amount of solvent used is not enough to drag the total lipid towards the chloroform phase, translating in a small amount of FA that can be converted in FAME. Selecting the best strains, fungi growth parameters and the right extraction method are key points that impacted on the FAME yields.
In the present study, for both Botrytis cinerea UFRO22.77 and UFRO22.262 strains, Lewis method led to the best results. A FAME yield of 45.73% was obtained for B. cinerea UFRO22.262; while for the strain B. cinerea UFRO22.77 the yield obtained was 20.70%. In previous studies a TLE% ranging from 2.70 – 11.90% for lipids composition from B. cinerea were obtained [30]. These variations on TLE% may not only be subject to the strains, but also to the fungi culture parameters [6]. A TLE% yield of 6.7% for B. cinerea with Folch method has also been previously reported. In this case, a FAME yield of 3.1 % for B. cinerea with Bligh & Dyer method was obtained [31,32]. Li et al. [33] analysed lipid composition in the genus Cladosporium and obtained a TLE% of 16.5% with Bligh & Dyer method while a FAME yield from 16 – 34% with Folch method was obtained for Cladosporium herbarum [34].
In the present study, lower yields for FAME were obtained for both Bligh & Dyer and Folch methods. The overall abundance of FAME with the Folch and Bligh & Dyer method ranged from 6.8 – 9.74% and 5.33 – 12.29%, respectively. Meanwhile, with the Lewis method, the FAME yield was over 40% for the Cladosporium strains analysed (C. herbarum UFRO22.307; C. perangustum UFRO22.53; and C. varians UFRO22.551).
The genus Mortierella comprises the major lipid producers’ fungi group. According to previous data [9], for the genus Mortierella a FAME yield from 0.68 – 12.81%, 1.3 – 21.2%, and 25.8 – 28.9% were obtained with the Bligh & Dyer, Folch, and Lewis methods, respectively.
In the present study, FAME obtained from Mortierella strains with Lewis method showed a yield at least twice higher than those obtained with Folch and Bligh & Dyer methods. For Mortierella antartica UFRO22.73, the Lewis method was 40 times more efficient than Folch method. In this case, for the Lewis method the FAME yield was 51.93%; while for the Folch method the FAME yield was 1.25%. For M. turficola UFRO22.261 the FAME yield with Lewis method was 60.34%, 5 times higher than Bligh & Dyer method, that yielded 11.75% of FAME (Table 4).
Previous studies have additionally assessed the production of lipids by different species of the genus Penicillium, emphasising the capability of P. atrovenetum, P. brevicompactum, P. chrysogenum, P. lilacinurn, P. citrinum, and P. funiculosum to produce lipids [35,36,37,38,39,40]. Although this, there are no information available about methods for lipid extraction and FAME recovering from species belonging to the genus Penicillium.
In the present study, Penicillium miczynskii UFRO22.569 and P. virgatum UFRO22.251 were assessed for their capabilities to produce lipids. According to the data obtained herein, Lewis was the best method for lipid extraction and FAME recovering with yield of 65.85 and 51.01% for P. miczynskii UFRO22.569 and P. virgatum UFRO22.25, respectively. FAME yield obtained by Bligh & Dyer method were 28.62% and 6.52% for P. miczynskii UFRO22.569 and P. virgatum UFRO22.251, respectively; while FAME yield obtained by Folch method were 6.52 and 7.90% for P. miczynskii UFRO22.569 and P. virgatum UFRO22.251, respectively.
Melanommataceae family is the largest family of ascomycetes that encompasses a highly diverse range of fungi, including phytopathogenic, endophytic, epiphytic, and saprobic species [28]. No data about lipid composition for this family of fungi is available in the literature yet. In the present study one strain belonging to the Melanommataceae family (UFRO22.418) was assessed for lipid production. According to the data obtained, Lewis was the best method in FAME recovering (63.7%), followed by Bligh & Dyer (55.30%) and Folch methods (37.86%).
To date, no information regarding methods for extraction of lipid content from Cylindrobasidium eucalypti is available in the literature. According to data obtained herein, Lewis method was the most efficient one in recovering FAME from C. eucalypti UFRO22.226 with a yield of 79.8%, followed by Bligh & Dyer (28.28%) and Folch (19.86%). Similarly, just few studies are available for lipid composition of Pseudogymnoascus pannorum. In the present study, lipid compositions for P. pannorum UFRO22.138, UFRO22.172, UFRO22.250, and UFRO22.358 were assessed. According to the results obtained, the Lewis method was the best one for lipid extraction and FAME recovering with a yield varying from 51.00 – 74.00% among the four strains assessed. For these four strains, the best performance in lipid extraction and FAME recovering was followed by Bligh & Dyer (from 15.50 – 34.42%) and Folch (from 2.63 – 13.16%) (Table 4). Overall, to the best of our knowledge this is the first study on the evaluation of FAME extraction methods for Cylindrobasidium eucalypti, Penicillium miczynskii, P. virgatum, and Pseudogymnoascus pannorum.
2.4. Monitoring Lipid Extraction with Infrared Spectroscopy
In order to determine the efficiency of each method in extracting lipids, fungal biomass was subjected to infrared spectroscopy analysis before and after lipid extraction. According to the data obtained in the present study, infrared spectra of biomass after extraction showed a reduced intensity of bands of amides (3275 and 1640 cm−1) and esters (2925, 2855, and 1745 cm−1) (Figure 1). These data are in agreement with previous studies developed using infrared spectroscopy analysis to monitor lipid extraction from filamentous fungi [8,9,41]. According to previous studies, in addition to wavenumbers mentioned above, the lipid content in fungal biomass can generate characteristic bands in the infrared spectra. These bands are related to C–H stretching vibrations, such as: =C–H stretch at 3010 cm−1; C–H stretching in –CH3 and CH2 at 2855, 2925, and 2954 cm−1. Other bands such as C–H bending in CH2 groups (1460 cm−1), C–O stretching in C–O–C groups (1070 –1250 cm−1), and C–H rocking in CH2 group (720 cm−1) can be observed for esters [8,9,41].
In addition to lipids molecules, the fungal cellular content possesses other compounds that absorbs infrared energy in the above-mentioned wavenumber range. After lipid extraction, the presence of bands in this wavenumber range can be attributed to other compounds such as proteins and carbohydrates [41]. In the present study, after lipid extraction with Lewis method, 9 out of 18 (50%) strains (B. cinerea UFRO22.262; C. varians UFRO22.53; Melanommataceae family UFRO22.418; M. trufocola UFRO22.261; M. globulifera UFRO22.317; P. pannorum UFRO22.138 and UFRO22.250; P. virgatum UFRO22.251 and P. pannorum UFRO22.358) presented spectra with decreasing in intensity for bands related to N–H stretching (3275 cm−1) and C=O stretching in amides (1640 cm−1) (Figure 2). Similar results were observed for 6 out of 18 (c.a. 33%) strains for Bligh & Dyer method (Melanommataceae family UFRO22.418; M. globulifera UFRO22.317; P. pannorum UFRO22.172; P. pannorum UFRO22.250; P. virgatum UFRO22.251 and P. pannorum UFRO22.358) (Figure S9 – S26).
The spectra obtained for biomass of P. pannorum (UFRO22.172), extracted with the Bligh & Dyer method, and for biomasses of M. gamsii UFRO22.40 and M. antartica UFRO22.73 extracted with the Folch method showed the biggest band decreasing (Figure S22, S16, and S15, respectively). According to Langseter et al. [41] decreasing in bands related to N–H stretching (3275 cm−1) and C=O stretching in amides (1640 cm−1), and C–O stretching in esters (1200 – 1000 cm−1) may be due to co-extraction of other cellular compounds such as proteins and polysaccharides, which are key components of the fungal cell wall [42]. The authors stated that bands at 3275 cm−1 and 1200 – 1000 cm−1 are due to vibration of N–H, C–O and C–O–C bonds in compounds such as chitin, chitosan, glucans and glucuronans from the fungal cell wall. Bands at 875 and 1260 cm−1 are due to P–O and P=O stretching which could be related to the presence of polyphosphates in the cell walls.
Overall, the results obtained herein are in agreement with previous reports in the literature [8,41,42]. In the present study, the infrared spectroscopy was an efficient technique for monitoring the lipid extraction. The infrared spectroscopy technology used for the analysis does not require prior sample preparation and led to a fast and simple procedure in monitoring lipid extraction from fungi cells.
2.5. Fatty Acid Identification and Quantification
According to the data obtained from the chemical characterisation by GC-MS, 17 different FA were obtained from the fungi strains assessed. Sixteen of them showed long carbon chains (C14 – 24), with only one FA being a medium-chain (lauric acid) (Table 5). Among them, one unsaturated FA (UFA), two polyunsaturated FA (PUFA), and two saturated FA (SFA) were obtained and represented the most abundant lipid molecules in all fungi strains assessed (Figure 2; Tables S2–S5).
These results represent the first report on the FA profiles of different genera and species of filamentous fungi from Fildes Bay, Antarctica. Data obtained are in agreement with data previously reported in the literature [43,44] and offer novel biotechnological perspectives on application of psychrotolerant fungi. The most common and abundant FA in Ascomycetes, Basidiomycetes and Zygomycetes including oleic, linoleic, palmitic, stearic, and linolenic acids, make up 70 – 95% of the total FA content [43,44]. For the fungi assessed in the present study, SFA (e.g., lauric acid, myristic acid, pentadecanoic acid, behenic acid, lignoceric acid), UFA (e.g., nervonic acid), and PUFA (γ-linolenic acid; α-linolenic acid; dihomo-γ-linolenic acid; arachidonic acid; 5,8,11,14,17-icosapentaenoic acid) were detected predominantly in lower concentrations or as a trace (Figure 2; Tables S2–S5).
Botrytis cinerea is found among the most relevant phytopathogen fungal species affecting numerous plant hosts, including many important crops such as carrots, cucumber, tomato, raspberries, and strawberries [45,46]. Despite of this, few studies have been focused on FA profile of B. cinerea and its biotechnological potential. The main fatty acids reported for B. cinerea are palmitic and linolenic acids (c.a. 23 and 55%, respectively) [30].
In the present study, for both strains B. cinerea UFRO22.77 and UFRO22.262 assessed, the FA profiles were slightly different between themselves (Figure 2). For B. cinerea UFRO22.262, oleic and linoleic acids were the most prevalent FA (c.a. 4 and 18%, respectively) (Table S5). Meanwhile, for B. cinerea UFRO22.77, stearic and oleic acids were the most prevalent ones (c.a. 4 and 7%, respectively) (Table S5). In addition, α-linolenic acid was exclusively produced by B. cinerea UFRO22.262. Difference in FA profiles of both B. cinerea strains suggested potential differences in metabolic expression in each fungal strain. These differences in metabolic expression are due to the defensive response to environmental conditions of abiotic and/or biotic origin [47].
The Cladosporium genus comprises saprobic (e.g., C. perangustum), endophytes (e.g., C. varians), plant pathogens, and human allergenic fungi species (e.g., C. herbarum) [34,48]. Just few information about FA profiles of Cladosporium is available in the literature [49,50,51]. Cladosporium sphaerospermum, a widespread mould type, present a FA profile mainly composed of oleic (c.a. 50%) and palmitic acids (c.a. 27%) [49,50,51].
The Cladosporium strains assessed in the present study (C. herbarum UFRO22.307; C. perangustum UFRO22.53; and C. varians UFRO22.551) exhibit different FA composition among strains, which includes linoleic (c.a. 20%) and oleic acid (c.a. 13%) (S5 Table). Considering the psychrotolerant characteristics of fungal strains assessed herein, the obtained data could suggest that environmental conditions may have impact on the patterns of fatty acid profile.
Some species of the genus Cylindrobasidium present important biotechnological application, as biocontrol agents and enzyme producers [52]. The present study is the first report on the characterisation of C. eucalypti regarding its FA profile. Lauric acid was obtained with a concentration of c.a. 30% for C. eucalypti UFRO22.226. This is an important find once lauric acid has significant antimicrobial activity potential. Previous reports have shown a minimal inhibitory concentration from 0.04 – 0.2 mg/mL of lauric acid against pathogens such as Aeromonas hydrophila, Saprolegnia parasitica, Ichthyophthirius multifiliis, and from 0.312 – 0.625 mg/mL against Clostridium difficile [53,54].
The Mortierella genus is widely studied as lipid producer [55]. Among lipids reported for Mortierella genus, arachidonic acid is a PUFA that has been found in high concentration in Mortierella species (c.a. 40%) [10,56]. PUFA such as arachidonic acid was obtained from the strains M. antartica UFRO22.73, M. gamsii UFRO22.40, M. globulifera UFRO22.317, and M. turficola UFRO22.261. Among them, M. turficola UFRO22.261 produced the highest amount of arachidonic and dihomo-γ-linolenic acids, with c.a. 11 and 3%, respectively. Both arachidonic and dihomo-γ-linolenic acids were found in similar concentrations as those reported in the literature (c.a. 5 and 8%) [9]. Despite of this, the data available in the literature for the genus Mortierella is mainly focused on just few model species such as M. alpina [9].
The Trichocomaceae family includes different genera such as Penicillium with great potential for FA production [10,11]. Bardhan et al. [57] assessed a P. citrinum strain as potential feedstock for biodiesel production. According to the authors the FA profile observed was predominantly composed of palmitic (20.25%), oleic (30.09%), and linoleic acids (33.14%). Based on the data obtained herein, P. miczynskii UFRO22.569 and P. virgatum UFRO22.251 showed FA profiles with similar amounts of oleic (c.a. 13 and 15%, respectively), linoleic (c.a. 29 and 14%, respectively), and palmitic acid (c.a. 5% for both strains). Despite of previous studies on FA profiles of Penicillium species, the present study is the first report about FA composition of P. miczynskii and P. virgatum [10,11,57,58,59].
Pseudogymnoascus pannorum (formerly Geomyces pannorum) is a psychrotolerant fungus widely distributed in cold regions of the Earth [89]. Until now, the available studies have compared the behaviour of P. pannorum strains from the polar regions (e.g., the Arctic and the Antarctic) by evaluating the influence of temperature on the FA profile [60,61,62,63,64]. The most common FA reported includes oleic, linoleic, palmitic, and stearic acid [60,61,62,63,64]. In addition, Artic Pseudogymnoascus strains produce a higher concentration of linolenic acid (c.a. 24%) than Antarctic Pseudogymnoascus strains (c.a. 7%). Overall, at low temperatures (c.a. 10 °C), P. pannorum strains tend to increase the concentration of oleic acid (c.a. 31 – 71%) and decrease the concentration of palmitic and stearic acid (c.a. 18 – 9% and 1 – 0.5%, respectively) [60,61,62,63,64].
The FA profiles for the P. pannorum strains studied herein (UFRO22.172, UFRO22.138, UFRO22.250, and UFRO22.358) were in agreement with those reported in the literature. Both oleic and linoleic acids were found in higher amounts than palmitic and stearic acids (Tables S3 – S5). Furthermore, α-linolenic acid was found at low concentration (c.a. 5%). Therefore, the results obtained here suggest that Pseudogymnoascus strains have a more stable metabolism than other fungi assessed in the present study regarding their FA profile.
Talaromyces belongs to the same family as Penicillium genus. When compared with Penicillium strains, T. acaricola UFRO22.140 presented a different FA profile (Figure 2). To date, there are a limited number of studies focused on Talaromyces genera [65]. Talaromyces thermophilus has previously been reported producing oleic and linoleic acids (c.a. 50 and 20%, respectively). Talaromyces acaricola UFRO22.140 strain assessed herein produced oleic and linoleic acids in a concentration of c.a. 19 and 34%, respectively, that are roughly in agreement with data obtained for T. thermophilus by Wright et al. [65]. In addition, T. acaricola produced α-Linolenic acid as a trace. Despite of this, T. acaricola may be a potential source of linoleic acid, an essential FA in the human diet and cardiovascular health [66,67].
In the present study a strain belonging to the family Melanomataceae (UFRO22.418) was assessed for its FA profile. Most species of the Melanommataceae family, such as some species of the genera Alpinaria and Muriformistrickeria are saprobic or hyperparasites. These fungi are found on twigs or bark of different woody in terrestrial, marine, or freshwater habitats. They are widespread in temperate and subtropical regions and also can be found in extreme environmental regions (e.g., Antartica) [19]. No records about bioactive molecules, such as FA, are available in the literature for the Melanommataceae family. Consequently, this is the first report about the FA profile for the Melanommataceae family. The lipid profile of Melanommataceae family (UFRO22.418) was predominantly composed of oleic acid and linoleic acids (c.a. 26 and 20%) followed by palmitic, stearic, and α-linolenic acids (c.a. 5, 5, and 4%, respectively). This present study provides foundational data for further research into the lipid profiles of the Melanommataceae family.
3. Materials and Methods
3.1. Soil Sampling
A total of 10 soil samples were obtained during the 58th Chilean Antarctic Expedition, from January to February 2022. Soil samples were collected from King Jorge Island: S1 (62°12'20.40''S, 58°46'20.16''W), S4 (62°12'39.71''S, 58°47'20.07''W), S5 (62°14'24.90''S, 58°43'29.86''W), S7 (62°13'51.1''S, 58°58'04.6''W), S8 (62°11'29.12''S, 58°56'42.31''W) S9 (62°12'39.82''S, 59°01'08.18''W), S10 (62°12'26.9''S, 59°00'14.1''W), S11 (62°10'09.7''S, 58°51'05.2''W) and from the Nelson Island: S3 (62°14'6.59''S, 59°0'6.19''W), S6 (62°15'39.8''S, 58°55'42.9''W) (Figure 3). For soil sampling a transect of 4x25 m at a depth of 00 – 20 cm was used according to Cruz et al. [68].
3.1.2. Soil Chemical Characterisation
Chemical analysis of soil was performed according to the methodology described by Chávez [69]. Briefly, soil pH was measured using a potentiometer. To obtain the soil pH, the glass electrode was placed into a suspension composed of soil:deionised water (2:5, w/v). Available Phosphorus (P) was determined in an 0.5 M NaHCO3 solution, pH 8.5 [70]. Sodium (Na), Magnesium (Mg), Potassium (K), and Calcium (Ca) were quantified by atomic absorption spectrophotometry (Perkin Elmer, mod. PinAAcle 500). Percentage of Organic Carbon (%OC) was determined by inverse titration by oxidation with K2Cr2O7 in acidic medium [71]. Percentage of Nitrogen (%Nt) was determined based on the Kjeldahl method [72].
3.2. Fungi Isolation
Soil samples (30 g) were suspended in 300 mL of distilled water and 3 serial dilutions (1:10, v/v) were prepared. The stock solution and serial dilutions were inoculated on Petri plates containing each of the following media: Potato Dextrose Agar (PDA) - (g/L): Potato extract 3, Glucose 20, Agar 15, Chloramphenicol 0.1; Dichloran Glycerol Agar 18% (DG18) - (g/L): Glycerol 18%, KH2PO4 1, MgSO4 · 7H2O 0.5, Mycological peptone 5, Dicloran 0.002, Chloramphenicol 0.1, Agar 15, Glucose 10; and Dichloran Rose Bengal Chloramphenicol Agar (DRBC) - (g/L): KH2PO4 1, MgSO4 · 7H2O 0.5, Mycological peptone 5, Dicloran 0.002, Chloramphenicol 0.1, Agar 15, Glucose 10, Rose Bengal 0.025 [68]. Petri plates were incubated at 10 °C for 30 days in the dark. To purify fungal isolates, fragments of fungal colonies were transferred into Petri plates containing PDA medium and incubated at 10 °C for 30 days.
3.3. Fungi Identification Based on Morphological Analysis
For fungal morphological identification, all strains were subculture on PDA (g/L: potato infusion 200, Glucose 20, Agar 15) at 4 °C for 7 – 28 days in the dark. After growth, macro- and microscopic traits of strains were registered using a camera (QIMAGING, Micropublisher, 3.3 RTV) and a IS.1153 PLPHi Euromex Microscopy (Euromex, The Netherland), respectively. Fungal strains were identified at genus level based on macro- and micro-morphological traits with appropriate keys [68,73,74,75,76,77]. All fungi strains isolated in the present study were deposited at the Bank of Microbiological Resources of the Universidad de La Frontera (Temuco, Chile), which is registered at the World Federation for Culture Collection with the number WDCM 1283.
3.4. Fungi Identification Based on Molecular Biology Analysis
Genomic DNA of each fungal strains were extracted using the SDS method as previously described by Rodrigues et al. [78]. The ITS1-5.8S-ITS2 rDNA region was amplified using the primers ITS1 (5´-TCC GTA GGT GAA CCT GCG G-3´) and ITS4 (5´-TCC TCC GCT TAT TGA TAT GCC-3´) designed by White et al. [79]. For ITS reaction 25 μL Taq DNA polymerase Master Mix 2x (VWR Life Science), 2 μL primer ITS1 10 mM, 2 μL primer ITS4 10 mM, 2 μL of genomic DNA and 19 μL of distilled water free of DNases to a final volume of 50 μL was used. PCR parameters used in the thermal cycler was: 94 °C for 3 min, 35 cycles of 94 °C for 1 min, 55 °C for 1 min, 72 °C for 1 min and a final extension at 72 °C for 5 min. PCR parameters used in the thermal cycler was: 95 °C for 3 min, 35 cycles of 95 °C for 1 min, 56 °C for 45 s, 72 °C for 90 s and a final extension at 72 °C for 10 min.
Bands were visualised on 1% (w/v) agarose gel supplemented with SYBR® Safe DNA Gel Stain (Invitrogen) as a staining element and NZYDNA ladder III as a DNA molecular weight marker. PCR products were cleaned using ExoSAP kit (ExoSAP, Portugal) according to instruction of manufacturer. The nucleotide sequences were obtained by Stab Vida Portugal Laboratories. Each sequence was manually edited into the analysis software Genius Prime (https://www.geneious.com) and compared with the GenBank database using the Basic Local Alignment Search Tool (BLAST). Sequences were aligned into the Clustal Omega web server from EMBL-EBI [80]. Phylogenetic analyses were performed by determining the best-fit substitution model and used the Maximum Likelihood method into the IQ-TREE web server [81]. Trees were generated and modified using iTOL [82]. The trees were created according to the data obtained in phylogenetic trees available in the literature [83,84,85,86,87,88,89,90,91] and the ITS sequences available on the GenBank database.
3.5. Fungi Cultivation for Biomass Production
For fungal biomass production, spores and mycelia of strains grown on PDA plates at 10 °C during 10 days were harvested from the agar cultures using a sterile saline solution. A standard liquid medium (SL) was prepared according to the protocol described by Kosa et al. [92]: (g/L) – glucose 30, yeast extract 5, KH2PO4 7, Na2HPO4 2, MgSO4 · 7H2O 1.5, CaCl2 · 2H2O 0.1, FeCl3·6H2O 0.008, ZnSO4 · 7H2O 0.001, CoSO4 · 7H2O 0.0001, CuSO4 · 5H2O 0.0001 and MnSO4 5H2O 0.0001. An amount of spores or mycelia were transferred into Erlenmeyer flasks (250 Ml) containing 150 Ml of SL medium and samples were incubated at 100 rpm for 10 days at 10 °C. Fungi biomasses were harvested, frozen at –80 ˚C and freeze-dried using a L101 (Liobras, São Carlos, SP, Brazil) for five days at –55 ˚C and 0.01 mbar pressure.
3.6. Lipid Extraction from Fungal Biomass
For each fungal strain, 250 mg freeze-dried biomass was weighted, and lipid extractions were performed using the follow 3 methods:
3.6.1. Folch Extraction Method
For the Folch method [93], each freeze-dried biomass was transferred into a 15 mL polypropylene tube and soaked with deionised water to create a moisture content of 80% (w/w). For each 250 mg of freeze-dried biomass 0.2 mL of water was added. Sample was homogenised with 5 mL of chloroform:methanol solution (2:1, v/v) using a thin glass bar. Neat methanol (0.3 mL) was added and homogenised for 30 seconds using a vortex.
A tube (tube A) containing biomass and solvent phase was centrifuged at 2800 g and 20 °C for 10 min. Solvent phase was transferred into a new polypropylene tube (tube B). Neat chloroform (0.6 mL) was added to the tube containing the biomass (tube A) and sample was centrifuged. Chloroform phase was recovered from the tube A and added to the tube B. The solvent phase in tube B was washed with 0.2x its volume with a KCl aqueous solution (0.88%, v/v). Sample was centrifuged and the lower phase (chloroform + lipids) was recovered into a new polypropylene tube. Residual water was removed by addition of anhydrous K2HPO4 to the tube. In order to remove the salt, the solvent phase was transferred into a new tube. Sample was evaporated by using a rotary evaporator (DLAB, RE100-Pro, China) at 80 rpm, 60 °C and 600 mbar, until the elimination of the solvent.
Lipid transesterification was performed as described by Singh et al. [94]. Briefly, 2 mL of hexane and 1 mL of 2 M methanolic potassium hydroxide solution was added to the lipid crude extract and vortex for 30 seconds. Sample was left at 70 ˚C for 20 min and then cooled down in room temperature (20 ˚C). Then, hydrochloric acid (1M, 1.2 mL) was added, followed by addition of 1 mL of hexane. Sample was vortexed for 30 seconds and left at room temperature until separation of phases (approximately 15 min). Residual water was removed by addition of small amount of K2HPO4 to the tube. The upper phase, which was composed of hexane and fatty acids methyl esters (FAME), was recovered and stored in an amber vial at –80 ˚C until further analysis. Yields were determined based on the difference of weight between both dry biomass and total lipid extract [8].
3.6.2. Bligh & Dyer Extraction Method
For the Bligh & Dyer method [95], freeze-dried biomass was transferred into a 15 mL polypropylene tube and soaked in deionised water to create a moisture content of 80% (w/w). For each 250 mg of freeze-dried biomass 0.2 mL of water was added. Sample was homogenised with 0.75 mL of methanol:chloroform solution (2:1, v/v) using a thin glass rod. Initial solvent:freeze-dried sample ratio was 3:1 (v/w). To generate a final solvent:freeze-dried sample ratio of 4:1 (v/w), chloroform (0.25 mL) was added; to create a chloroform:methanol:water ratio of 2:2:1.8 (v/v/v), deionised water (0.25 mL) was added to the sample.
A tube (tube A) containing biomass and solvent phase was centrifuged at 2800 g and 20 °C for 10 min. Solvent phase was transferred into a new polypropylene tube (tube B). Sample was centrifuged to separate the methanol-water and chloroform phases. The lower phase (chloroform + lipids) was recovered into a new polypropylene tube. Residual water was removed by addition of anhydrous K2HPO4 to the tube. In order to remove the salt, the solvent phase was transferred into a new tube. Sample was evaporated by using a rotary evaporator (DLAB, RE100-Pro, China) at 80 rpm, 60 °C and 600 mbar, until solvent elimination. Transesterification was performed according to the methodology described by Singh et al. [94], as shown above. Yields were determined based on the difference of weight between both dry biomass and total lipid extract [8].
3.6.3. Lewis Direct Transesterification Extraction
For the Lewis method [17], freeze-dried biomass sample (250 mg) was transferred into a 50 mL polypropylene tube and 25 mL of methanol:hydrochloric acid:chloroform (10:1:1 v/v/v) was added. Sample was vortexed for 30 seconds and then kept at 90 °C for 1 hour. Sample was placed at room temperature until cool down. Deionised water (5 mL) and 10 mL n-hexane:chloroform (4:1, v/v) was added. Sample was vortexed for 30 seconds and centrifuged (2800 g, 20 °C, for 10 min). The upper phase was recovered with a Pasteur pipette and transferred into a 50 mL polypropylene tube. The extraction process was repeated three times. Residual water was removed by addition of small quantity of anhydrous K2HPO4. The solvent phase was transferred into a new tube for salt removal. Sample was evaporated by using a rotary evaporator (DLAB, RE100-Pro, China) at 80 rpm, 60 °C and 600 mbar, until the evaporation of the solvent. FAME was stored at –80 °C in neat hexane until further analysis. Yields were determined based on the difference of weight between both dry biomass and total lipid extract [8].
3.7. Monitoring Lipid Extraction with Infrared Spectroscopy
Lipid extraction was monitored by using an Attenuated Total Reflectance-Fourier Transform Infrared (ATR-FT-IR) Spectrometer (Cary 630 FT-IR, Aligent, Santa Clara, CA, USA). Infrared spectra were obtained at the mid-IR wavelength. Each freeze dyer biomass (before extraction, BE) and residual biomass (after extraction, AE) was directly exposed on the glass of the infrared spectrometer reader. Spectra were obtained in the region from 4000 – 600 cm−1 with a resolution of 4 cm−1. The spectral regions from 3100 – 2800 cm−1 and from 1800 – 700 cm−1 were analysed for the prediction of the lipid profile [8,9] using Origin Pro 8 (Microcal Software, Northampton, MA).
3.8. Chemical Characterisation and Quantification of Lipids by GC-MS and GC-FID
A gas chromatography (GC) coupled to a mass spectrometer (MS) and a GC coupled to a flame ionization detection (FID) system (Agilent, Santa Clara, USA) were used. The GC-MS/GC-FID were equipped with an Agilent 7890B PAL3 autosampler, a 5977A MS mass spectrometer with a EI350 electron impact ionization source. The column used was a SUPELCO SPTM-2560 (100 m x 0.25 mm x 0.2 µm). FA identification and quantification was assessed based on the presence of FAME in the total lipid extract. The correlation of FAME/FA was 1:1. FAME identification and quantification was carried out by GC-MS and GC-FID, respectively [96].
For GC-MS, the follow conditions were followed: injection volume of 1 µl; Injector: 220 °C; Interphase: 280 °C; Injection mode: Split (1:50); Initial temperature of oven: 80 °C; Temperature ramp: 225 – 25 °C min−1, 20 min. The MS-detector conditions were: Helium flux: 1.0 mL/min; Ionization source: 230 °C; Quadrupole: 150 ºC; Modo SCAN: 50 – 600 m/z a 2.66 cycles/seconds. Total quantification was carried out using an FID-detector. The FID-detector conditions were Helium flux: 1.6 mL/min; Detector: 225 °C; Air: 400 mL/min; Hydrogen: 30 mL/min. For identification, the standard kit CRM45885 Supelco 37 was used and for quantification, the standards C18:0 (Stearic acid, S5376 Sigma), C18:1 (Oleic acid, 311111 Sigma) and C18:3 (α-Linolenic acid, 62200 Sigma) were used.
3.9. Statistical Analysis
In the present study, the statistical analysis was developed by using the R studio Software (R version 4.3.1). Non-parametric analysis of the data using the Kruskal–Wallis test and the Dunn post-hoc test with an α value of 0.05 were applied. For the analysis, both the package Stats version 4.3.1 and package FSA version 0.9.5 were applied. Heatmaps and dendrograms were obtained using the package Pheatmap version 1.0.12, package base version 4.3.1 and package Grdevices version 4.3.1. As clustering_method was selected "complete", clustering_distance_cols = "canberra" and clustering_distance_rows = "binary".
4. Conclusions
According to their carbon percentage, the soil samples from Fildes Bay were similar to mineral soils. Despite of this, the presence or absence of vegetation in the place of soil sampling influenced the soil pH. Based on macro- and micro-morphological classical taxonomy, and molecular biology using ITS region, a total of 17 strains were identified at species level (Botrytis cinerea, Cladosporium herbarum complex herbarum, C. perangustum and C. varians complex cladosporioides, C. eucalypti, Mortierella antartica, M. gamsii, M. globulifera, M. truficola, Penicillium miczynskii, P. virgatum, Pseudogymnoascus pannorum, P. pannorum, P. pannorum, P. pannorum and Talaromyces acaricola sect. Islandici) and 1 strain was classified at family level (Melanommataceae). This suggests the need to use other molecular markers for identification at the genus and species levels of certain groups of fungi, such as those belonging to the Melanommataceae family.
In addition, this study provides the first analysis of FA extraction methods and FA identification from C. eucalypti, Penicillium miczynskii, P. virgatum and Pseudogymnoascus pannorum. The data presented herein show that the Lewis method was the best one in recovering FAME from fungal biomass. Although Bligh & Dyer and Folch methods were useful for FA extraction, both methods were less efficient in recovering FAME. The Antarctic filamentous fungi assessed produced a pool of FA emphasising their biotechnological potential as oil producers.
Infrared spectroscopy was a useful method for monitoring the lipid extraction procedures; while the gas chromatography led to a comprehensive characterisation and was able to quantify the FAME obtained. A total of 17 FA was identified, and the FA profile varied among fungi species and strains. The FA profile among the different strains of B. cinerea and P. pannorum analysed in the present study was quite different. In addition to the extraction method used, the abundance of FA extracted also depended on the intrinsic capacity of each fungi species and strain. For the three methods assessed, UFA was the most abundant class of lipid obtained. From which, oleic and linoleic acids were predominant in all the fungal strains, followed by SFA as stearic and palmitic acids.
In the present study, in addition to fungi species well known for their oil-producing potential (e.g., Mortierella spp.), other fungi species that have just little been explored for lipid production in the past, such as C. eucalypti, P. miczynskii, P. virgatum, and Pseudogymnoascus pannorum were observed as FA sources promising alternatives.
Supplementary Materials
The following supporting information can be downloaded at the website of this paper posted on Preprints.org., Figure S1: Phylogenetic tree of genera Botrytis based on ITS sequences; Figure S2: Phylogenetic tree of genera Cladosporium based on ITS sequences; Figure S3: Phylogenetic tree of genera Cylindrobasidium based on ITS sequences; Figure S4: Phylogenetic tree of genera Mortierella based on ITS sequences; Figure S5: Phylogenetic tree of genera Penicillium based on ITS sequences; Figure S6: Phylogenetic tree of genera Pseudogymnoascus based on ITS sequences; Figure S7: Phylogenetic tree of genera Talaromyces based on ITS sequences; Figure S8: Phylogenetic tree of the Melanomataceae family based on ITS sequences; Table S1: Effectiveness of lipid extraction among each fungal strain; Table S2: Average quantification of each fatty acids obtained with Bligh & Dyer, Folch, and Lewis method; Table S3: Fatty acids yield quantified in all extracts, obtained by the Bligh & Dyer method; Table S4: Fatty acids yield quantified in all extracts, obtained by the Folch method; Table S5: Fatty acids yield quantified in all extracts, obtained by the Lewis method; Figure S9: Infrared spectra for fungi biomass; Figure S10: Infrared spectra for fungi biomass; Figure S11: Infrared spectra for fungi biomass; Figure S12: Infrared spectra for fungi biomass; Figure S 13: Infrared spectra for fungi biomass; Figure S14: Infrared spectra for fungi biomass Cylindrobasidium eucalypti (UFRO22.226); Figure S15: Infrared spectra for fungi biomass Mortierella antartica (UFRO22.73); Figure S16: Infrared spectra for fungi biomass Mortierella gamsii (UFRO22.40); Figure S17: Infrared spectra for fungi biomass Mortierella globulifera (UFRO22.317); Figure S18: Infrared spectra for fungi biomass Mortierella truficola (UFRO22.261); Figure S19: Infrared spectra for fungi biomass Penicillium miczynskii (UFRO22.569); Figure S20: Infrared spectra for fungi biomass Penicillium virgatum (UFRO22.251); Figure S21: Infrared spectra for fungi biomass Pseudogymnoascus pannorum (UFRO22.138); Figure S22: Infrared spectra for fungi biomass Pseudogymnoascus pannorum (UFRO22.172); Figure S23: Infrared spectra for fungi biomass Pseudogymnoascus pannorum (UFRO22.250); Figure S24: Infrared spectra for fungi biomass Pseudogymnoascus pannorum (UFRO22.358); Figure S25: Infrared spectra for fungi biomass Talaromyces acaricola sect. Islandici (UFRO22.140); Figure S26: Infrared spectra for fungi biomass Melanommataceae family (UFRO22.418).
Author Contributions
Conceptualization, C.S; methodology, V.G., M.S. and Y.C.; formal analysis, V.G., J.C., M.S., Y.C., J.B., C.A.; J.S., R.P., V.V., P.C., and C.S.; investigation, V.G., M.S., Y.C., E.P., J.B., R.P., V.V., P.C.; data curation, V.G, M.S., Y.C., C.Sa., E.P., J.B., R.P., V.V., P.C.; writing—original draft preparation, V.G., J.C. and C.S.; writing—review and editing, V.G., J.C. and C.S.; visualization, C.S.; supervision, C.S.; project administration, C.S.; funding acquisition, C.S. All authors have read and agreed to the published version of the manuscript.
Funding
The authors thank Instituto Antártico Chileno (INACH) Project RT_16_20 and the collaboration between ANID and INACH/Chile for the improvement of the Chilean Antactic Base Profesor Julio Escudero, which has favoured field work. V.G. thanks to the Universidad de La Frontera for the doctoral grant “Financiamiento para promover la Internacionalización-Programas de Doctorado Pasantías en el extranjero” (RES. EXENTA 1154/2023) with the support of the Ministerio de Educación, through Departamento de Financiamiento Institucional. V.G. thanks for the grant from the Europe Union’s Horizon 2020 research and innovation programme for the TNA-Transnational Access Programme of IS_MIRRI21 (agreement No 871129). C.S. thanks to CAPES/Brazil for the International Visiting Professor Grant at the Postgraduate Program in Biotechnology (Federal University of Technology-Paraná, Ponta Grossa, Brazil).
Institutional Review Board Statement
Not applicable.
Data Availability Statement
Data are contained within the article.
Conflicts of Interest
The authors declare no conflicts of interest.
References
- Pearce, D.A. Extremophiles in Antarctica: Life at low temperatures. In: Adaption of Microbial Life to Environmental Extreme, 2nd ed.; Stan-Lotter, H., Fendrihan, S. Eds. Springer, Vienna, Italy, 2012. [CrossRef]
- Coleine, C.; Stajich, J. E.; Selbmann, L. Fungi are key players in extreme ecosystems. TREE 2022, 37, 517–528. [Google Scholar] [CrossRef]
- Gallardo, V.; Sepúlveda, M.; Costa, J.; Galeano, P.; Cornejo, P.; Santos, C. Distribución geográfica y potencial biotecnológico de hongos filamentosos cultivables en suelos de la Bahía de Fildes (Antártica). Bol. Micol. 2024, 39. [Google Scholar] [CrossRef]
- Godinho, V. M.; Furbino, L. E.; Santiago, I. F.; Pellizzari, F. M.; Yokoya, N. S.; Pupo. D.; et al. Diversity and bioprospecting of fungal communities associated with endemic and cold-adapted macroalgae in Antarctica. ISME 2013, 7, 1434–1451. [Google Scholar] [CrossRef] [PubMed]
- Krishnan, A.; Convey, P.; Gonzalez, M.; Smykla, J.; Alias, S. A. Effects of temperature on extracellular hydrolase enzymes from soil microfungi. Polar Biol. 2017, 41, 537–551. [Google Scholar] [CrossRef]
- Weete, J. D. Lipid biochemistry of fungi and other organisms, 1st ed.; Springer, New York, USA, 1980. [CrossRef]
- Carvalho, C.; Caramujo, M. The Various Roles of Fatty Acids. Molecules 2018, 23, 2583. [Google Scholar] [CrossRef]
- Shapaval, V.; Afseth, N.; Vogt, G.; Kohler, A. Fourier transform infrared spectroscopy for the prediction of fatty acid profiles in Mucor fungi grown in media with different carbon sources. Microb. Cell Fact. 2014, 13, 86. [Google Scholar] [CrossRef] [PubMed]
- Forfang, K.; Zimmermann, B.; Kosa, G.; Kohler, A.; Shapaval, V. FTIR Spectroscopy for evaluation and monitoring of lipid extraction efficiency for oleaginous fungi. Dawson TL, editor. PLOS ONE 2017, 12, e0170611. [Google Scholar] [CrossRef]
- Passoth, V. (2017). Lipids of Yeasts and Filamentous Fungi and Their Importance for Biotechnology. In: Biotechnology of Yeasts and Filamentous Fungi, 1ed; Sibirny, A. Springer, Cham. 2017, 149–204. [CrossRef]
- Athenaki, M.; Gardeli, C.; Diamantopoulou, P.; Tchakouteu, S. S.; Sarris, D.; Philippoussis, A.; et al. Lipids from yeasts and fungi: physiology, production and analytical considerations. J Appl. Microbiol. 2018, 124, 336–367. [Google Scholar] [CrossRef] [PubMed]
- Zhang, X.; Chen, B.; Wang, Z.; Chen, J.; Tyagi, R. D. Lipids produced by filamentous fungi. In: Biomass, Biofuels, Biochemicals, 1st ed.; Soccol, C.R, Pandey, A., Carvalho, J.C., Tyagi, R. D.; 2022, 135–159. [CrossRef]
- Menezes, G. C. A.; Porto, B. A.; Amorim, S. S.; Zani, C. L.; de Almeida Alves, T. M.; Junior, P. A. S.; et al. Fungi in glacial ice of Antarctica: diversity, distribution and bioprospecting of bioactive compounds. Extremophiles 2020, 24, 367–376. [Google Scholar] [CrossRef] [PubMed]
- Santhaseelan, H; Dinakaran, V. T.; Dahms, H-U.; Ahamed, J.M.; Murugaiah, S.G.; Krishnan M, et al. Recent Antimicrobial responses of halophilic microbes in clinical pathogens. Microorganisms 2022, 10, 417. [Google Scholar] [CrossRef]
- Bloor, W. R. The determination of small amounts of lipid in blood plasma. J. Biol. Chem. 1928, 77, 53–73. [Google Scholar] [CrossRef]
- Saini, R. K.; Prasad, P.; Shang, X.; Keum, Y-S. Advances in lipid extraction methods—A Review. Int. J. Mol. Sci. 2021, 22, 13643. [Google Scholar] [CrossRef] [PubMed]
- Lewis, T.; Nichols, P. D.; McMeekin, T. A. Evaluation of extraction methods for recovery of fatty acids from lipid-producing microheterotrophs. J. Microbiol. Methods. 2000, 43, 107–116. [Google Scholar] [CrossRef] [PubMed]
- Bockheim, J. G. Antarctic soil properties and soilscapes. Ant. Terr. Microbiol. 2014, 293–315. [Google Scholar] [CrossRef]
- Rosa, L. H. Fungi of Antarctica. 1st ed.; Springer Cham, 2019; pp. 1–345. [CrossRef]
- Smykla, J.; Drewnik, M.; Szarek-Gwiazda, E.; Hii, Y. S.; Knap, W.; Emslie, S. D. Variation in the characteristics and development of soils at Edmonson Point due to abiotic and biotic factors, northern Victoria Land, Antarctica. CATENA. 2015, 132, 56–67. [Google Scholar] [CrossRef]
- Hong, S.; Gan, P.; Chen, A. Environmental controls on soil pH in planted forest and its response to nitrogen deposition. Environ. Res. 2019, 172, 159–165. [Google Scholar] [CrossRef] [PubMed]
- Souza-Kasprzyk, J.; Paiva, T. de C.; Convey, P.; da Cunha, L. S. T.; Soares, T. A.; Zawierucha, K.; et al. Influence of marine vertebrates on organic matter, phosphorus and other chemical element levels in Antarctic soils. Polar Biol. 2022, 45, 1571–1580. [Google Scholar] [CrossRef]
- Bartlett, J.C.; Convey, P.; Newsham, K. K.; Hayward, S. A. L. Ecological consequences of a single introduced species to the Antarctic: terrestrial impacts of the invasive midge Eretmoptera murphyi on Signy Island. Soil. Biol. Biochem. 2023, 180, 108965. [Google Scholar] [CrossRef]
- Newsham, K. K.; Misiak, M.; Goodall-Copestake, W. P.; Dahl, M. S.; Boddy, L.; Hopkins, D. W.; et al. Experimental warming increases fungal alpha diversity in an oligotrophic maritime Antarctic soil. Front. Microbiol. 2022, 13, 1050372. [Google Scholar] [CrossRef]
- Newsham, K. K. Diurnal temperature fluctuation inhibits the growth of an Antarctic fungus. Fungal Biol. 2023, 128, 2365–2371. [Google Scholar] [CrossRef]
- Souza, L. M. D.; Lirio, J. M.; Coria, S.H.; Lopes, F. A. C.; Convey, P.; Carvalho-Silva, M.; et al. Diversity, distribution and ecology of fungal communities present in Antarctic lake sediments uncovered by DNA metabarcoding. Sci. Rep. 2022, 12, 8407. [Google Scholar] [CrossRef] [PubMed]
- Cavalcante, S. B.; da Silva, A. F.; Pradi, L.; Lacerda, J. W. F.; Tizziani, T.; Sandjo, L. P.; et al. Antarctic fungi produce pigment with antimicrobial and antiparasitic activities. Braz. J. Microbiol. 2024, 55, 1251–1263. [Google Scholar] [CrossRef]
- Tennakoon, D.S.; Thambugala, K. M.; de Silva, N. I.; Song, H-Y. ; Suwannarach, N.; Chen, F-S.; et al. An overview of Melanommataceae (Pleosporales, Dothideomycetes): Current insight into the host associations and geographical distribution with some interesting novel additions from plant litter. MycoKeys. 2024, 106, 43–96. [Google Scholar] [CrossRef] [PubMed]
- Iverson, S. J.; Lang, S. L. C.; Cooper, M. H. Comparison of the Bligh and Dyer and Folch methods for total lipid determination in a broad range of marine tissue. Lipids. 2001, 36, 1283–1287. [Google Scholar] [CrossRef]
- Buonaurio, R.; Della Torre, G.; Bellezza, G. Lipid composition of dicarboximide-sensitive and -resistant strains of Botrytis cinerea Pers. Phytopathol Mediterr. 1989, 28, 22–27. [Google Scholar]
- Cooper, L. L. D.; Oliver, J. E.; De Vilbiss, E. D.; Doss, R. P. Lipid composition of the extracellular matrix of Botrytis cinerea germlings. Phytochemistry. 2000, 53, 293–298. [Google Scholar] [CrossRef] [PubMed]
- Griffiths, R. G.; Dancer, J.; O’Neill, E.; Harwood, J. L. Lipid composition of Botrytis cinerea and inhibition of its radiolabelling by the fungicide iprodione. New Phytol. 2003, 160, 199–207. [Google Scholar] [CrossRef]
- Li, S. L.; Lin, Q.; Li, X. R.; Xu, H.; Yang, Y. X.; Qiao, D. R.; et al. Biodiversity of the oleaginous microorganisms in Tibetan Plateau. Braz. J. Microbiol. 2012, 43, 627–634. [Google Scholar] [CrossRef] [PubMed]
- Sood, M. G.; Singh, J. Component fatty acids of Cladosporium herbarum fat. JCTB. 1985, 35, 11–13. [Google Scholar] [CrossRef]
- Van Etten, J. L.; Gottlieb, D. Biochemical Changes During the Growth of Fungi II. Ergosterol and fatty acids in Penicillium atrovenetum. J. Bacteriol. 1965, 89, 409–414. [Google Scholar] [CrossRef] [PubMed]
- Hamid, S.; Khan, S. A.; Saeed, M.; Bhatty, M. K.; Iqbal, M. Z. Studies on the lipid production by Penicillium lilacinum. Lipid / Fett. 1987, 89, 250–252. [Google Scholar] [CrossRef]
- Naqvi, B.; Hasmi, K.; Khan, F.; Shikh, D.; Mehmood, Z. Production of lipids by fermentation preliminary report. MJIAS. 1997, 10, 13–18. [Google Scholar]
- Qiao, B.; Lu, H.; Cao, Y.; Chen, R.; Yuan, Y. Phospholipid profiles of Penicillium chrysogenum in different scales of fermentations. Eng. Life Sci. 2013, 13, 496–505. [Google Scholar] [CrossRef]
- Ali, T. H.; El-Gamal, M. S.; El-Ghonemy, D. H.; Awad, G. E.; Tantawy, A. E. Improvement of lipid production from an oil-producing filamentous fungus, Penicillium brevicompactum NRC 829, through central composite statistical design. Ann. Microbiol. 2017, 67, 601–613. [Google Scholar] [CrossRef]
- Banu, B.; Kuncham, R.; Azeem, M. A.; et al. Screening and identification of oleaginous moulds for lipid production. J. Environ. Biol. 2017, 38, 697–701. [Google Scholar] [CrossRef]
- Langseter, A. M.; Dzurendova, S.; Shapaval, V.; Kohler, A.; Ekeberg, D.; Zimmermann, B. Evaluation and optimisation of direct transesterification methods for the assessment of lipid accumulation in oleaginous filamentous fungi. Microb. Cell Fact. 2021, 20. [Google Scholar] [CrossRef]
- Chakraborty, A.; Fernando, L. D.; Fang, W.; Dickwella Widanage, M. C.; Wei, P.; Jin, C.; et al. A molecular vision of fungal cell wall organization by functional genomics and solid-state NMR. Nat. Commun. 2021, 12, 6346. [Google Scholar] [CrossRef]
- Stahl, P. D.; Klug, M.J. Characterization and differentiation of filamentous fungi based on Fatty acid composition. Appl. Environ. Microbiol. 1996, 62, 4136–4146. [Google Scholar] [CrossRef]
- de Rossi, P.; Ambrico, A.; Del Fiore, A.; Trupo, M.; Blasi, L.; Beccaccioli, M.; et al. Antarctic fungi: A bio-source alternative to produce polyunsaturated fatty acids (PUFAs). bioRxiv. 2022, 1–25. [Google Scholar] [CrossRef]
- Cheung, N.; Tian, L.; Liu, X.; Li, X. The Destructive fungal pathogen Botrytis cinerea—Insights from genes studied with mutant analysis. Pathogens. 2020, 9, 923. [Google Scholar] [CrossRef] [PubMed]
- Latvala, S.; Haapalainen, M.; Karisto, P.; Kivijärvi, P.; Jääskeläinen, O.; Suojala-Ahlfors, T. Changes in the prevalence of fungal species causing post-harvest diseases of carrot in Finland. Ann. Appl. Biol. 2024, 185, 23–35. [Google Scholar] [CrossRef]
- Luo, F.; Zhong, Z.; Liu, L.; Igarashi, Y.; Xie, D.; Li, N. Metabolomic differential analysis of interspecific interactions among white rot fungi Trametes versicolor, Dichomitus squalens and Pleurotus ostreatus. Sci. Rep. 2017, 7. [Google Scholar] [CrossRef] [PubMed]
- Havaux, X.; Zeine, A.; Dits, A.; Denis, O. A new mouse model of lung allergy induced by the spores of Alternaria alternata and Cladosporium herbarummolds. CEI. 2004, 139, 179–188. [Google Scholar] [CrossRef]
- Carter, G, A. ; Kendall, S. J.; Burden, R. S.; James, C. S.; Clark, T. The lipid compositions of two isolates of Cladosporium cucumerinum do not explain their differences in sensitivity to fungicides which inhibit sterol biosynthesis. Pestic. Sci. 1989, 26, 181–192. [Google Scholar] [CrossRef]
- Zhou, Y.; Behrendt, J.; Sutherland, A. J.; Griffiths, G. Synthetic molecular mimics of naturally occurring cyclopentenones exhibit antifungal activity towards pathogenic fungi. Microbiology. 2011, 157, 3435–3445. [Google Scholar] [CrossRef]
- Salvatore, M. M.; Andolfi, A.; Nicoletti, R. The genus Cladosporium: A rich source of diverse and bioactive natural compounds. Molecules. 2021, 26, 3959. [Google Scholar] [CrossRef]
- Steinrucken, T. V.; Vitelli, J. S. Biocontrol of weedy Sporobolus grasses in Australia using fungal pathogens. BioControl. 2023, 68, 341–361. [Google Scholar] [CrossRef]
- Yang, H-T. ; Chen, J-W.; Rathod, J.; Jiang, Y-Z.; Tsai, P-J.; Hung, Y-P.; et al. Lauric acid is an inhibitor of Clostridium difficile growth in vitro and reduces inflammation in a mouse infection model. Front. Microbiol. 2018, 8, 2635. [Google Scholar] [CrossRef]
- Couto, M. V. S.; da Costa Sousa, N.; Paixão, P. E. G.; dos Santos Medeiros, E.; Abe, H. A.; Meneses, J. O.; et al. Is there antimicrobial property of coconut oil and lauric acid against fish pathogen? Aquaculture. 2021, 545, 737234. [Google Scholar] [CrossRef]
- Zhao, H.; Nie, Y.; Jiang, Y.; Wang, S.; Zhang, T-Y. ; Liu, X-Y. Comparative genomics of Mortierellaceae provides insights into lipid metabolism: Two novel types of fatty acid synthase. J. Fungi. 2022, 8, 891. [Google Scholar] [CrossRef] [PubMed]
- Gao, Y.; Li, C.; Kang, L.; Hang, B.; Yan, M.; Li, S.; et al. A subchronic toxicity study, preceded by an in utero exposure phase, with refined arachidonic acid-rich oil (RAO) derived from Mortierella alpina XM027 in rats. RTP. 2014, 70, 696–703. [Google Scholar] [CrossRef] [PubMed]
- Bardhan, P.; Gohain, M.; Daimary, N.; Kishor, S.; Chattopadhyay, P.; Gupta, K.; et al. Microbial lipids from cellulolytic oleaginous fungus Penicillium citrinum PKB20 as a potential feedstock for biodiesel production. Ann. Microbiol. 2019, 69, 1135–1146. [Google Scholar] [CrossRef]
- Houbraken, J.; Frisvad, J. C.; Samson, R. A. Taxonomy of Penicillium section Citrina. Stud. Mycol. 2011, 70, 53–138. [Google Scholar] [CrossRef] [PubMed]
- Houbraken, J.; Kocsubé, S.; Visagie, C. M.; Yilmaz, N.; Wang, X-C. ; Meijer, M.; et al. Classification of Aspergillus, Penicillium, Talaromyces and related genera (Eurotiales): An overview of families, genera, subgenera, sections, series and species. Stud. Mycol. 2020, 95, 5–169. [Google Scholar] [CrossRef] [PubMed]
- Sazanova, K. V.; Senik, S. V.; Kirtsideli, I. Yu.; Shavarda A., L. Metabolomic profiling and lipid composition of Arctic and Antarctic strains of micromycetes Geomyces pannorum and Thelebolus microsporus grown at different temperatures. Microbiology. 2019, 88, 282–291. [Google Scholar] [CrossRef]
- Finotti, E.; Paolino, C.; Lancia, B.; Mercantini, R. Metabolic differences between two Antarctic strains of Geomyces pannorum. Curr. Microbiol. 1996, 32, 7–10. [Google Scholar] [CrossRef]
- Weinstein, RN.; Montiel, P. O.; Johnstone, K. Influence of growth temperature on lipid and soluble carbohydrate synthesis by fungi isolated from fellfield soil in the maritime Antarctic. Mycologia. 2000, 92, 222–229. [Google Scholar] [CrossRef]
- Konova IV, Sergeeva YaE, Galanina LA, Kochkina GA, Ivanushkina NE, Ozerskaya SM. Lipid synthesis by Geomyces pannorum under the impact of stress factors. Microbiol. 2009, 78, 42–47. [Google Scholar] [CrossRef]
- Pannkuk, E. L.; Blair, H. B.; Fischer, A. E.; Gerdes, C. L.; Gilmore, D. F.; Savary, B. J.; et al. Triacylglyceride composition and fatty acyl saturation profile of a psychrophilic and psychrotolerant fungal species grown at different temperatures. Fungal Biol. 2014, 118, 792–799. [Google Scholar] [CrossRef] [PubMed]
- Wright, C.; Kafkewitz, D.; Somberg, E. W. Eucaryote thermophily: role of lipids in the growth of Talaromyces thermophilus. J. Bacteriol. 1983, 156, 493–497. [Google Scholar] [CrossRef]
- Whelan, J.; Fritsche, K. Linoleic acid. Adv. Nutr. 2013, 4, 311–312. [Google Scholar] [CrossRef]
- Marangoni, F.; Agostoni, C.; Borghi, C.; Catapano, A. L.; Cena, H.; Ghiselli, A.; et al. Dietary linoleic acid and human health: Focus on cardiovascular and cardiometabolic effects. Atherosclerosis. 2020, 292, 90–98. [Google Scholar] [CrossRef] [PubMed]
- Cruz, R.; Santos, C.; Silva de Lima, J.; Aparecida Moreira, K.; de Souza-Motta M., C. Diversity of Penicillium in soil of Caatinga and Atlantic forest areas of Pernambuco, Brazil: an ecological approach. Nova Hedwig. 2013, 97, 543–556. [Google Scholar] [CrossRef]
- Chávez, D.; Machuca, Á.; Fuentes-Ramirez, A.; Fernandez, N.; Cornejo, P. Shifts in soil traits and arbuscular mycorrhizal symbiosis represent the conservation status of Araucaria araucana forests and the effects after fire events. For. Ecol. Manag. 2020, 458, 117806. [Google Scholar] [CrossRef]
- Olsen, S. R, Sommers, L. E. Phosphorus. Agronomy Monographs. 1982, 403–430. [Google Scholar] [CrossRef]
- Walkley, A.; Black, I. A. An examination of the Degtjareff method for determining soil organic matter, and a proposed modification of the chromic acid titration method. Soil Sci. 1934, 37, 29–38. [Google Scholar] [CrossRef]
- Sáez-Plaza, P.; Navas, M. J.; Wybraniec, S.; Michałowski, T.; Asuero, A. G. An overview of the Kjeldahl method of nitrogen determination. Part II. Sample Preparation, Working Scale, Instrumental Finish, and Quality Control. CRC. 2013, 43, 224–272. [Google Scholar] [CrossRef]
- Pitt, J. I. A laboratory guide to common Penicillium species. Mycologia. 1987, 79, 491. [Google Scholar] [CrossRef]
- Kozakiewicz, Z. Ornamentation types of conidia and conidiogenous structures in fasciculate Penicillium species using scanning electron microscopy. Bot. J. Linn. 1989, 99, 273–293. [Google Scholar] [CrossRef]
- Samson, R. A.; Frisvad, J. C. Penicillium subgenus Penicillium: new taxonomic schemes and mycotoxins and other extrolites. Stud. Mycol. 2004, 49, 257. [Google Scholar]
- Simões, M. F.; Pereira, L.; Santos, C. , Lima, N. Polyphasic identification and preservation of fungal diversity: Concepts and applications. Manag. Micro. Res. Environ 2013, 91–117. [CrossRef]
- Hoog, G. S.; Guarro, J.; Gené, J.; Ahmed, S. A. Atlas of Clinical Fungi, 4th edition. Publisher: Westerdijk Institute/Universitat Rovira i Virgili. Utrecht/Reus. 2019. http://atlasclinicalfungi.org.
- Rodrigues, P.; Venâncio A, Lima N. Toxic reagents and expensive equipment: are they really necessary for the extraction of good quality fungal DNA? Lett. Appl. Microbiol. 2017, 66, 32–37. [Google Scholar] [CrossRef] [PubMed]
- White, T. J.; Bruns, T.; Lee, S.; Taylor, J. Amplification and direct sequencing of fungal ribosomal RNA genes for phylogenetics. PCR Protocols. 1990, 315–322. [Google Scholar] [CrossRef]
- Madeira, F.; Pearce, M.; Tivey, A. R. N.; Basutkar, P.; Lee, J.; Edbali, O.; et al. Search and sequence analysis tools services from EMBL-EBI in 2022. Nucleic Acids Res. 2022, 50, W276–W279. [Google Scholar] [CrossRef] [PubMed]
- Trifinopoulos, J.; Nguyen, L-T. ; von Haeseler, A.; Minh, B. Q. W-IQ-TREE: a fast online phylogenetic tool for maximum likelihood analysis. Nucleic Acids Res. 2016, 44, W232–W235. [Google Scholar] [CrossRef] [PubMed]
- Letunic, I.; Bork, P. Interactive Tree Of Life (iTOL) v5: an online tool for phylogenetic tree display and annotation. Nucleic Acids Res. 2021, 49, W293–W296. [Google Scholar] [CrossRef]
- Schubert, K.; Groenewald, J. Z.; Braun, U.; Dijksterhuis, J.; Starink, M.; Hill, C. F.; et al. Biodiversity in the Cladosporium herbarum complex (Davidiellaceae, Capnodiales), with standardisation of methods for Cladosporium taxonomy and diagnostics. Stud. Mycol. 2007, 58, 105–156. [Google Scholar] [CrossRef]
- Wagner, L.; Stielow, B.; Hoffmann, K.; Petkovits, T.; Papp, T.; Vágvölgyi, C.; et al. A comprehensive molecular phylogeny of the Mortierellales (Mortierellomycotina) based on nuclear ribosomal DNA. Mol. Phyl. and Evol. of Fungi. 2013, 30, 77–93. [Google Scholar] [CrossRef] [PubMed]
- Houbraken, J.; Visagie, C. M.; Meijer, M.; Frisvad, J. C.; Busby, P. E.; Pitt, J. I.; et al. A taxonomic and phylogenetic revision of Penicillium section Aspergilloides. Stud. Mycol. 2014, 78, 373–451. [Google Scholar] [CrossRef]
- Sandoval-Denis, M.; Gené, J.; Sutton, D. A.; Wiederhold, N. P.; Cano-Lira, J. F.; Guarro, J. New species of Cladosporium associated with human and animal infections. Mol. Phyl. and Evol. of Fungi. 2016, 36, 281–298. [Google Scholar] [CrossRef] [PubMed]
- Yilmaz, N.; Visagie, C. M.; Frisvad, J. C.; Houbraken, J.; Jacobs, K.; Samson, R. A. Taxonomic re-evaluation of species in Talaromyces section Islandici, using a polyphasic approach. Mol. Phyl. and Evol. of Fungi. 2016, 36, 37–56. [Google Scholar] [CrossRef] [PubMed]
- Beenken, L.; Gross, A.; Queloz, V. Phylogenetic revision of Petrakia and Seifertia (Melanommataceae, Pleosporales): new and rediscovered species from Europe and North America. Mycol Prog. 2020, 19, 417–440. [Google Scholar] [CrossRef]
- He, S.Q.; Wen, Z.H.; Bai, B.; Jing, Z. Q.; Wang, X. W. Botrytis polygoni, a new species of the genus Botrytis infecting Polygonaceae in Gansu, China. Mycologia. 2020, 113, 78–91. [Google Scholar] [CrossRef]
- Villanueva, P.; Vásquez, G.; Gil-Durán, C.; Oliva, V.; Díaz, A.; Henríquez, M.; et al. Description of the first four species of the genus Pseudogymnoascus from Antarctica. Front. Microbiol. 2021, 12, 713189. [Google Scholar] [CrossRef]
- Lin, Y-C. ; Wei, C-L.; Chen, C-Y.; Chen, C-C.; Wu, S-H. Three new species of Cylindrobasidium (Physalacriaceae, Agaricales) from East Asia. Mycol. Prog. 2021, 10, 1297–1308. [Google Scholar] [CrossRef]
- Kosa, G.; Zimmermann, B.; Kohler, A.; Ekeberg, D.; Afseth, N. K.; Mounier, J.; et al. High-throughput screening of Mucoromycota fungi for production of low- and high-value lipids. Biotechnol. Biofuels. 2018, 11. [Google Scholar] [CrossRef] [PubMed]
- Folch, J.; Lees, M.; Stanley, G. H. S. A simple method for the isolation and purification of total lipides from animal tissues. J. Biol. Chem. 1957, 226, 497–509. [Google Scholar] [CrossRef] [PubMed]
- Singh, G.; Sinha, S.; Bandyopadhyay, K. K.; Lawrence, M.; Paul, D. Triauxic growth of an oleaginous red yeast Rhodosporidium toruloides on waste ‘extract’ for enhanced and concomitant lipid and β-carotene production. Microb. Cell Fact. 2018, 17, 182. [Google Scholar] [CrossRef]
- Bligh, E. G.; Dyer, W. J. A rapid method of total lipid extraction and purification. Can. J. Biochem. Physiol. 1959, 37, 911–917. [Google Scholar] [CrossRef]
- Ranilla, L. G.; Zolla, G.; Afaray-Carazas, A.; Vera-Vega, M.; Huanuqueño, H.; Begazo-Gutiérrez, H.; et al. Integrated metabolite analysis and health-relevant in vitro functionality of white, red, and orange maize (Zea mays L.) from the Peruvian Andean race Cabanita at different maturity stages. Front. nutr. 2023, 10. [Google Scholar] [CrossRef]
Figure 1.
Infrared spectra for fungi biomass. (A) Botrytis cinerea (UFRO22.262), (B) C. herbarum (UFRO22.551), (C) M. truficola (UFRO22.261), (D) M. globulifera (UFRO22.317), (E) P. pannorum (UFRO22.138), (F) Melanommataceae family (UFRO22.418) before (black line) and after extraction with the method of Lewis (green line), Bligh & Dyer (blue line), Folch (red line). Control (biomass before extraction) is presented for each strain.
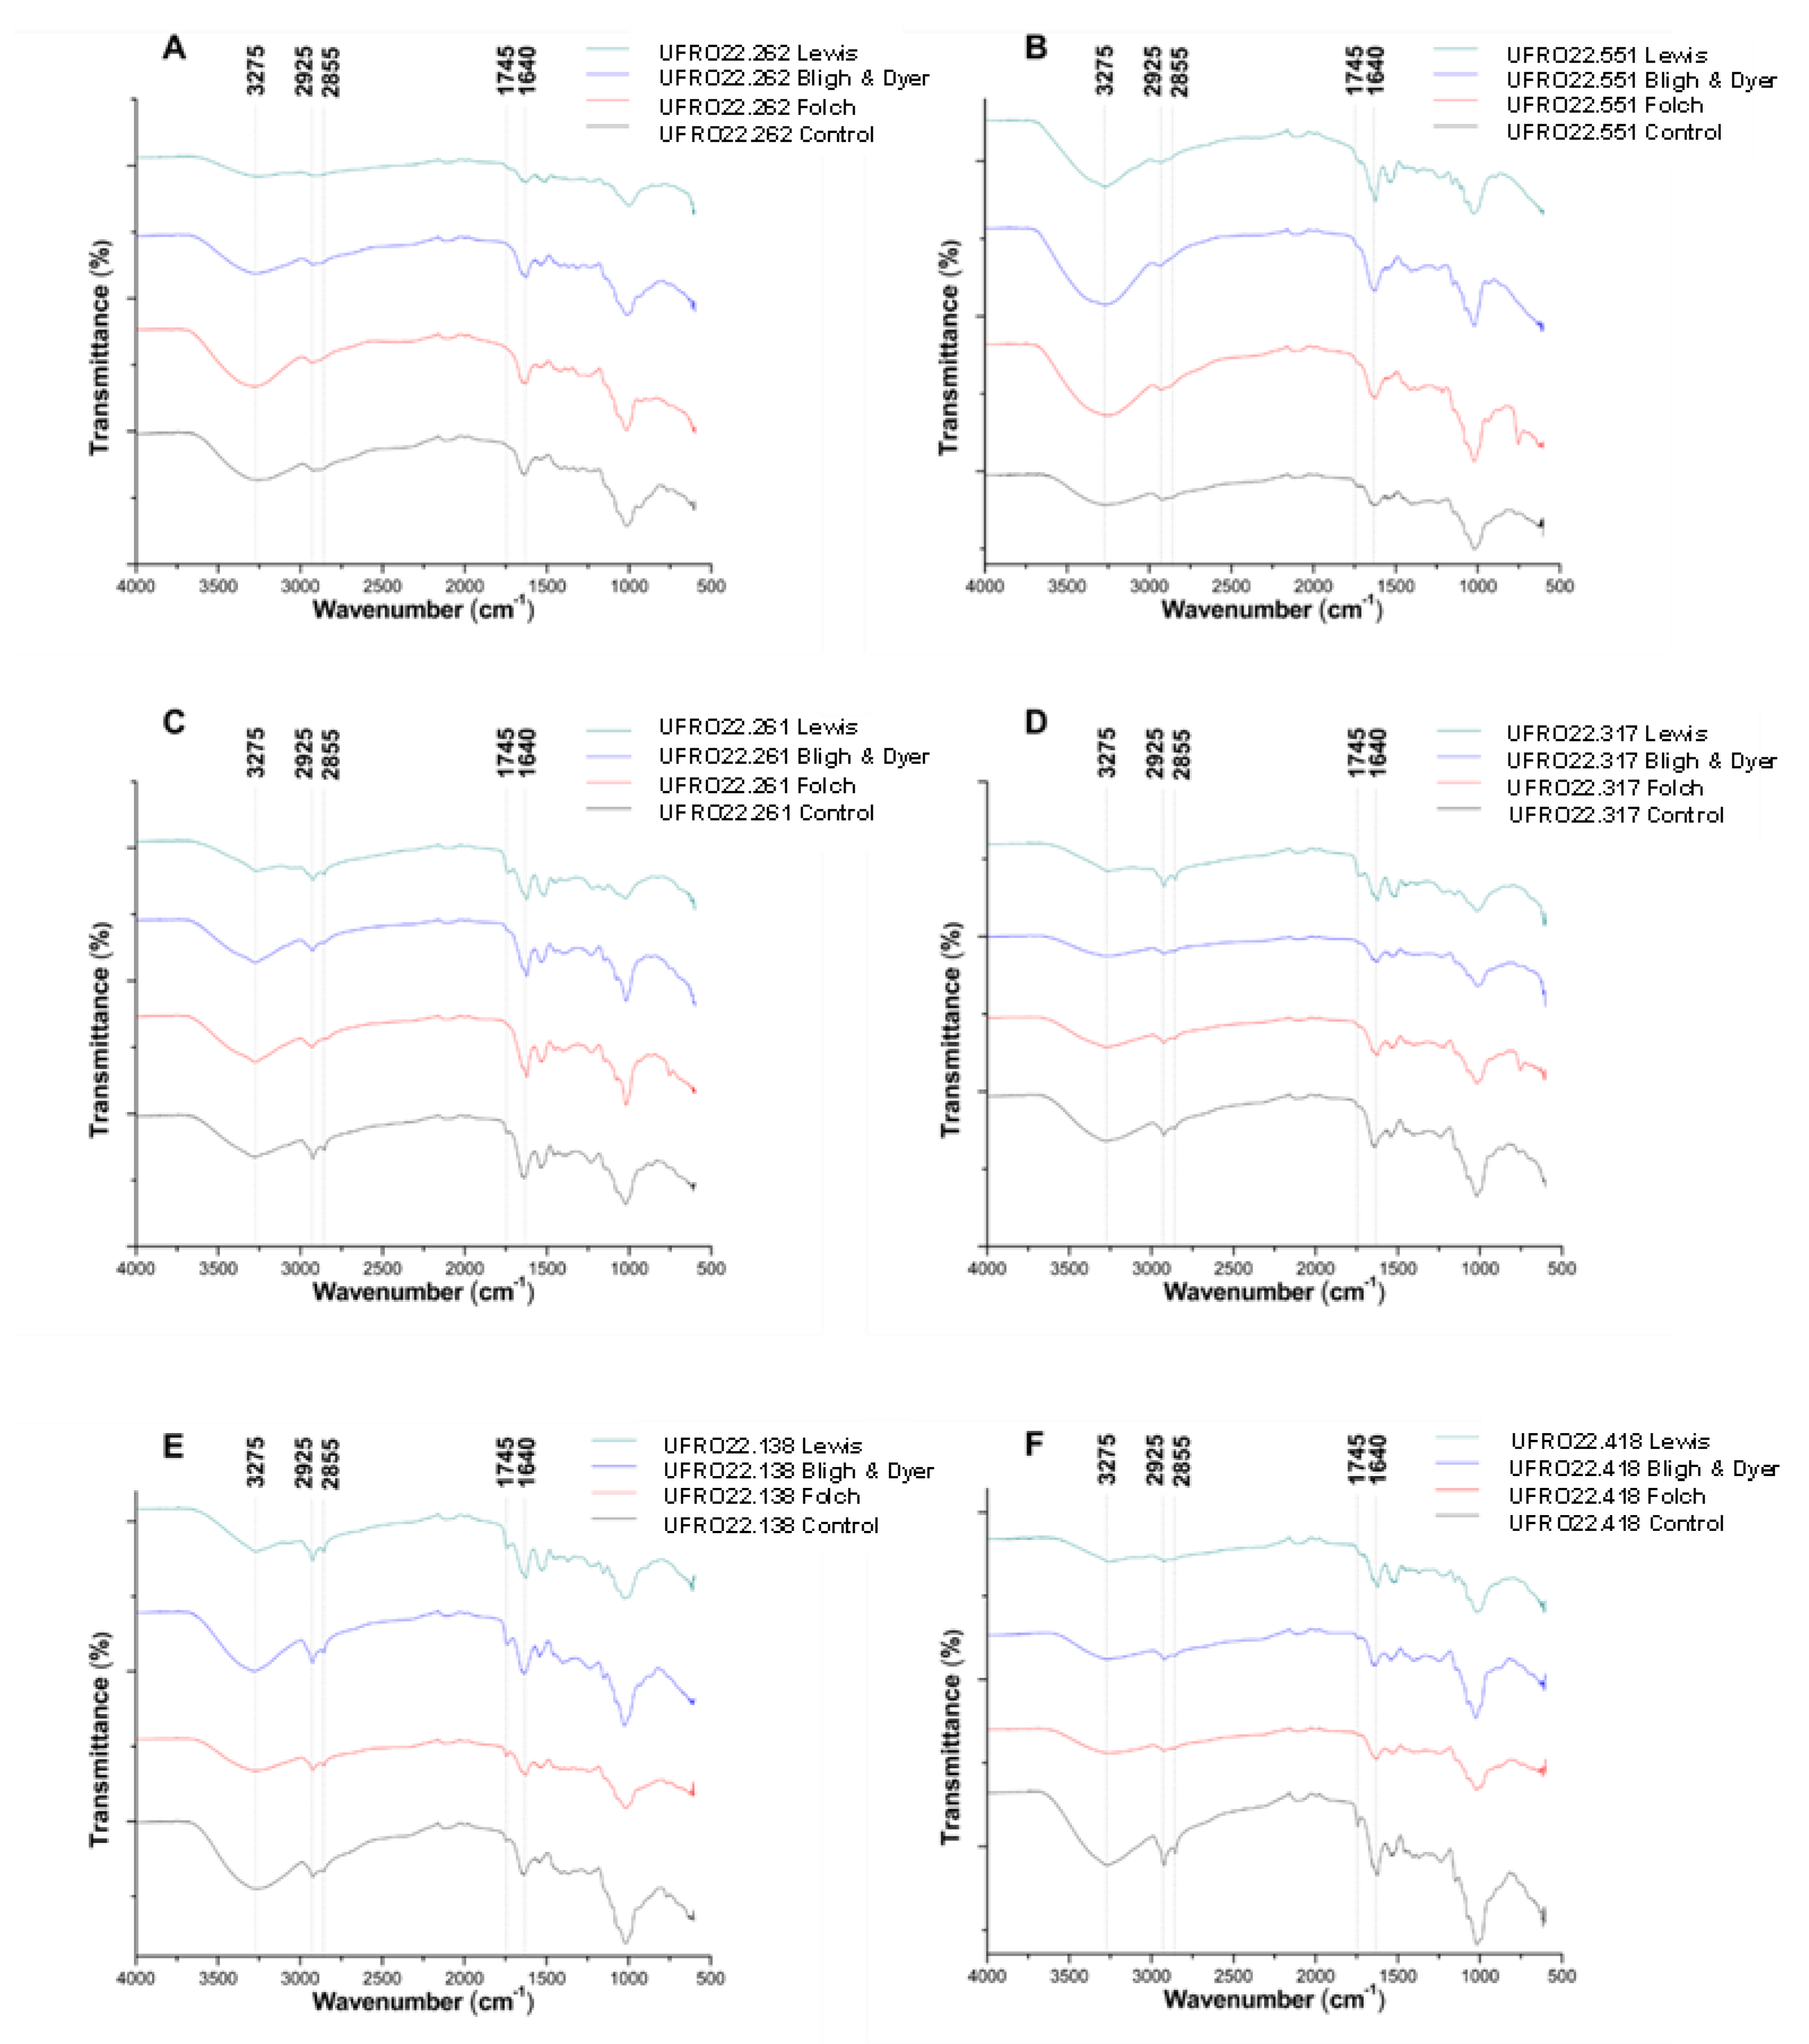
Figure 2.
Heat maps of fatty acids from Antarctic fungi, according to the performance obtained with the methods of Bligh & Dyer (A), Folch (B) and Lewis (C). The left dendrograms group Antarctic fungi according to similarities of their fatty acid profile; while the top dendrograms group fatty acids according to their yield. The colour gradient in each heatmap varies from darkest (high yield) to lightest (trace yield).
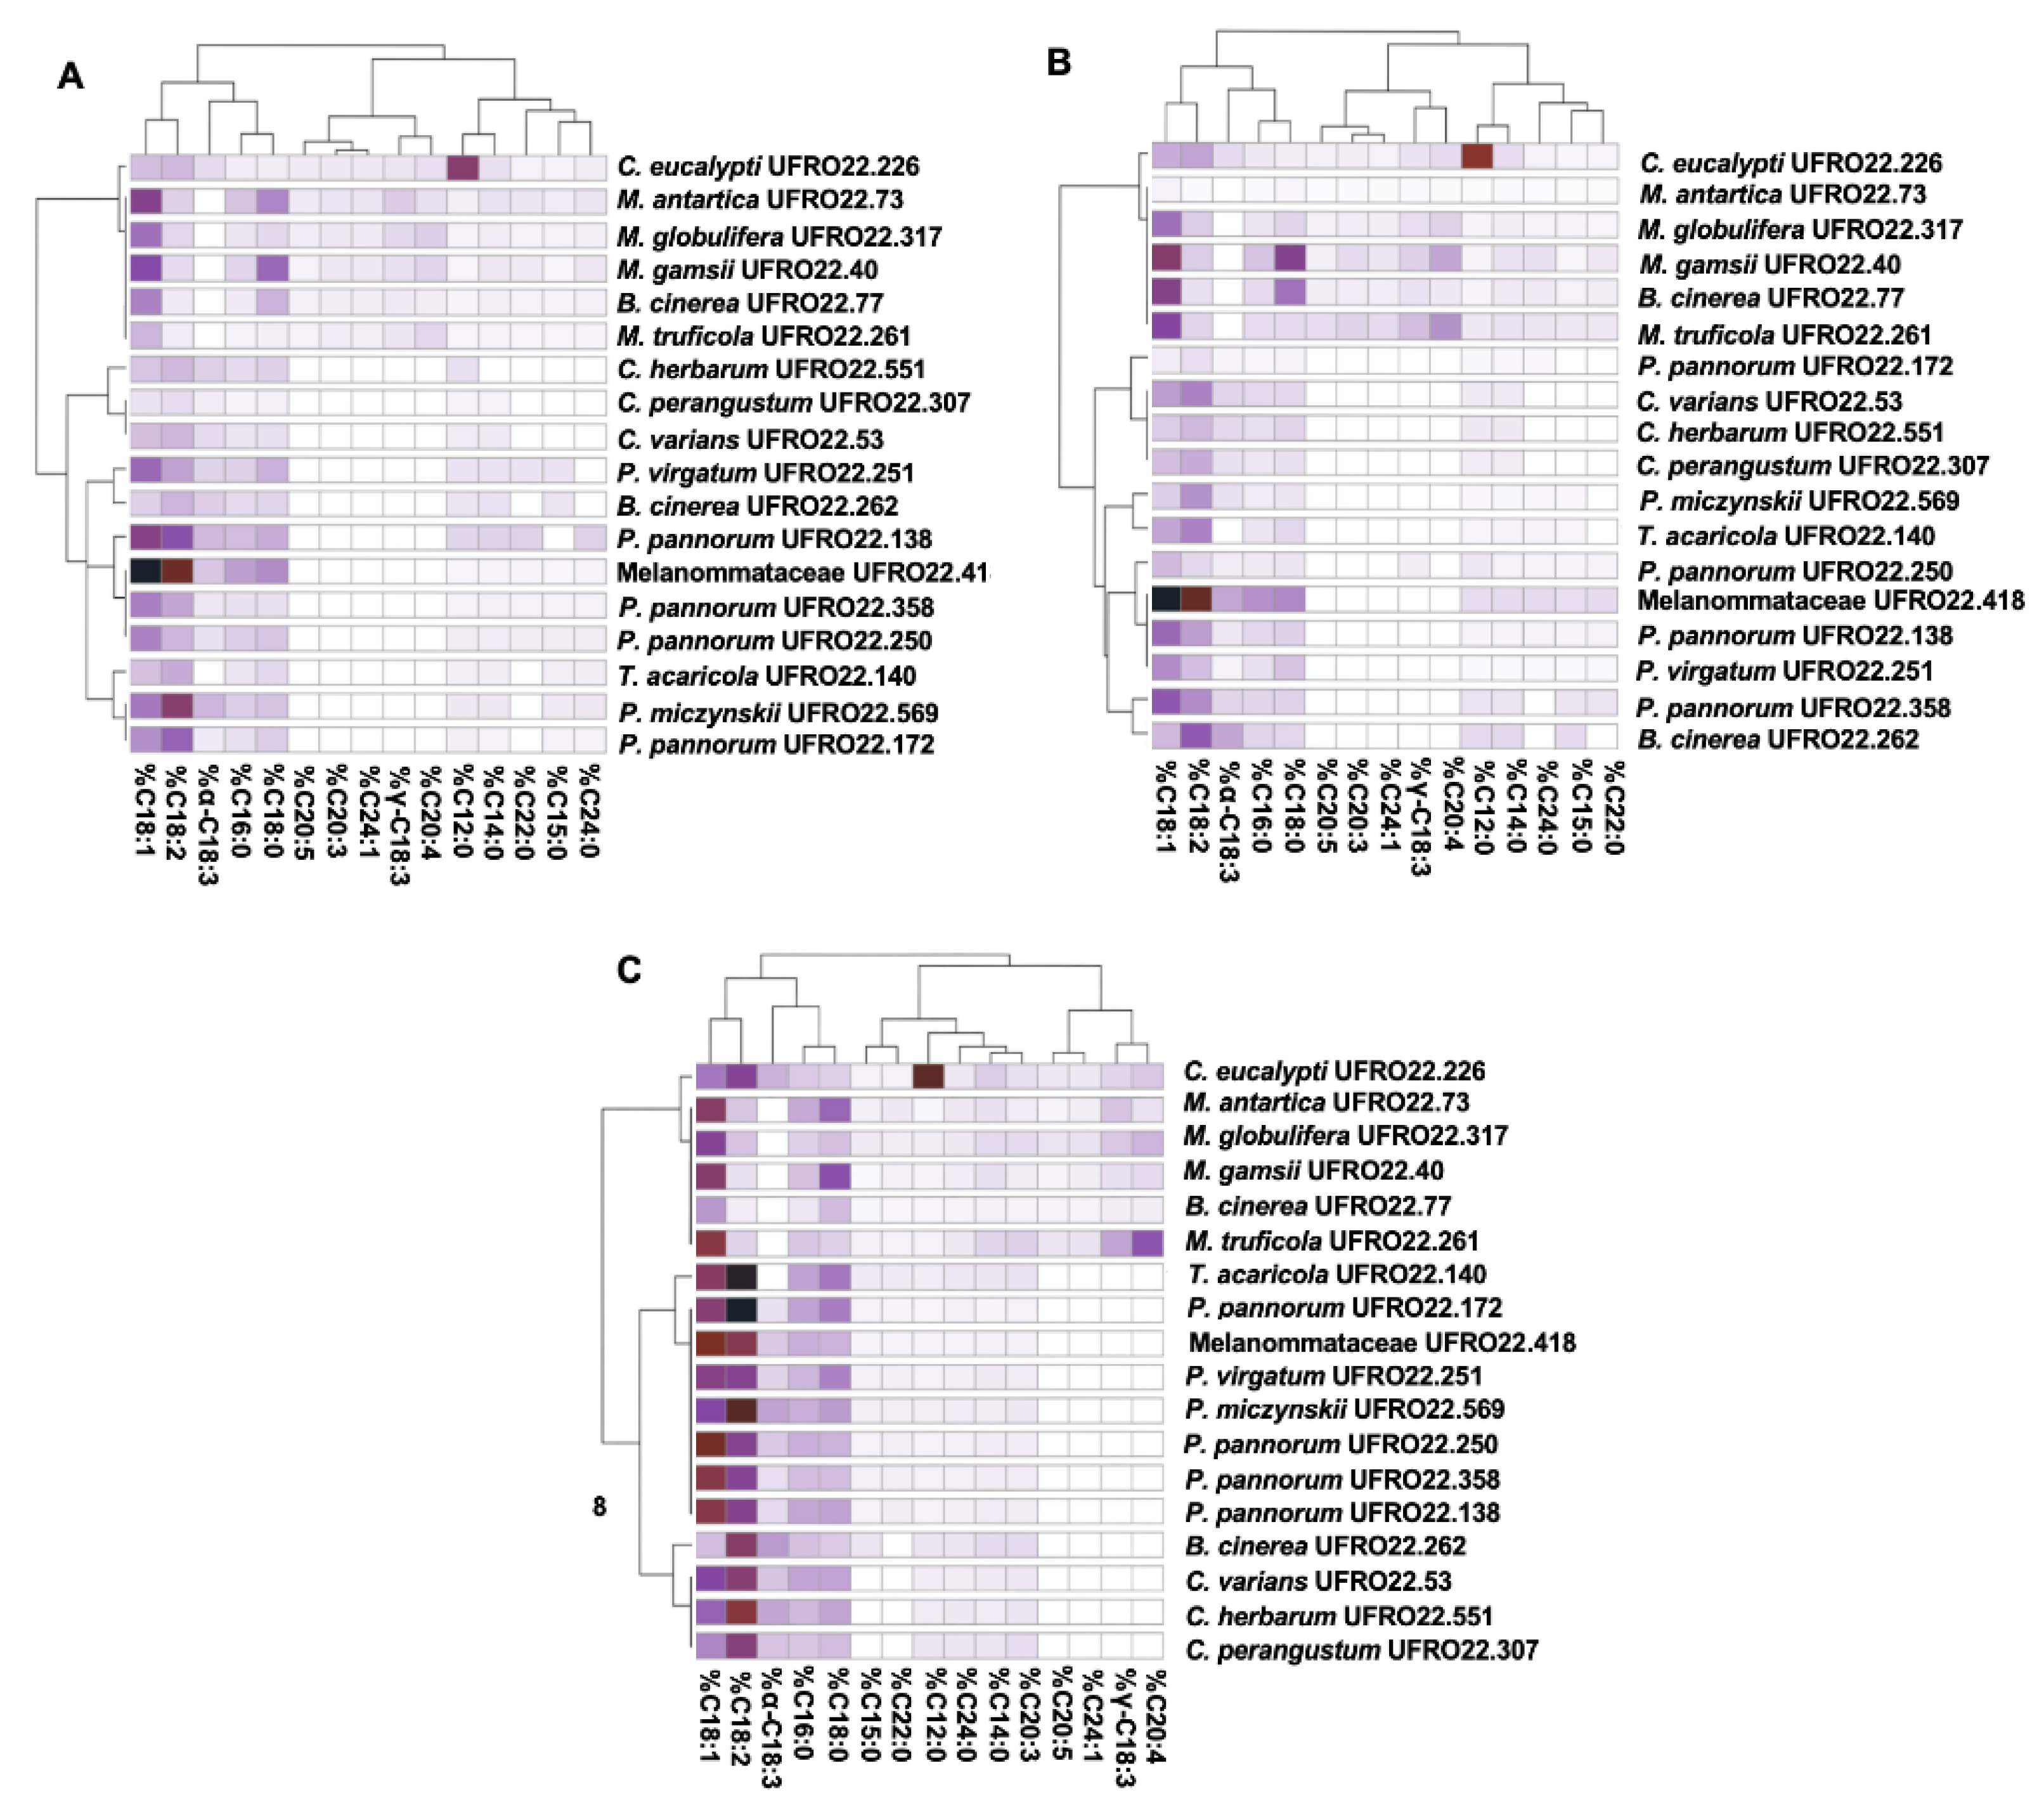
Figure 3.
Map of Fildes Bay with geographic distribution of sampling points used in the present study. Adapted from Gallardo et al. [3}.
Figure 3.
Map of Fildes Bay with geographic distribution of sampling points used in the present study. Adapted from Gallardo et al. [3}.
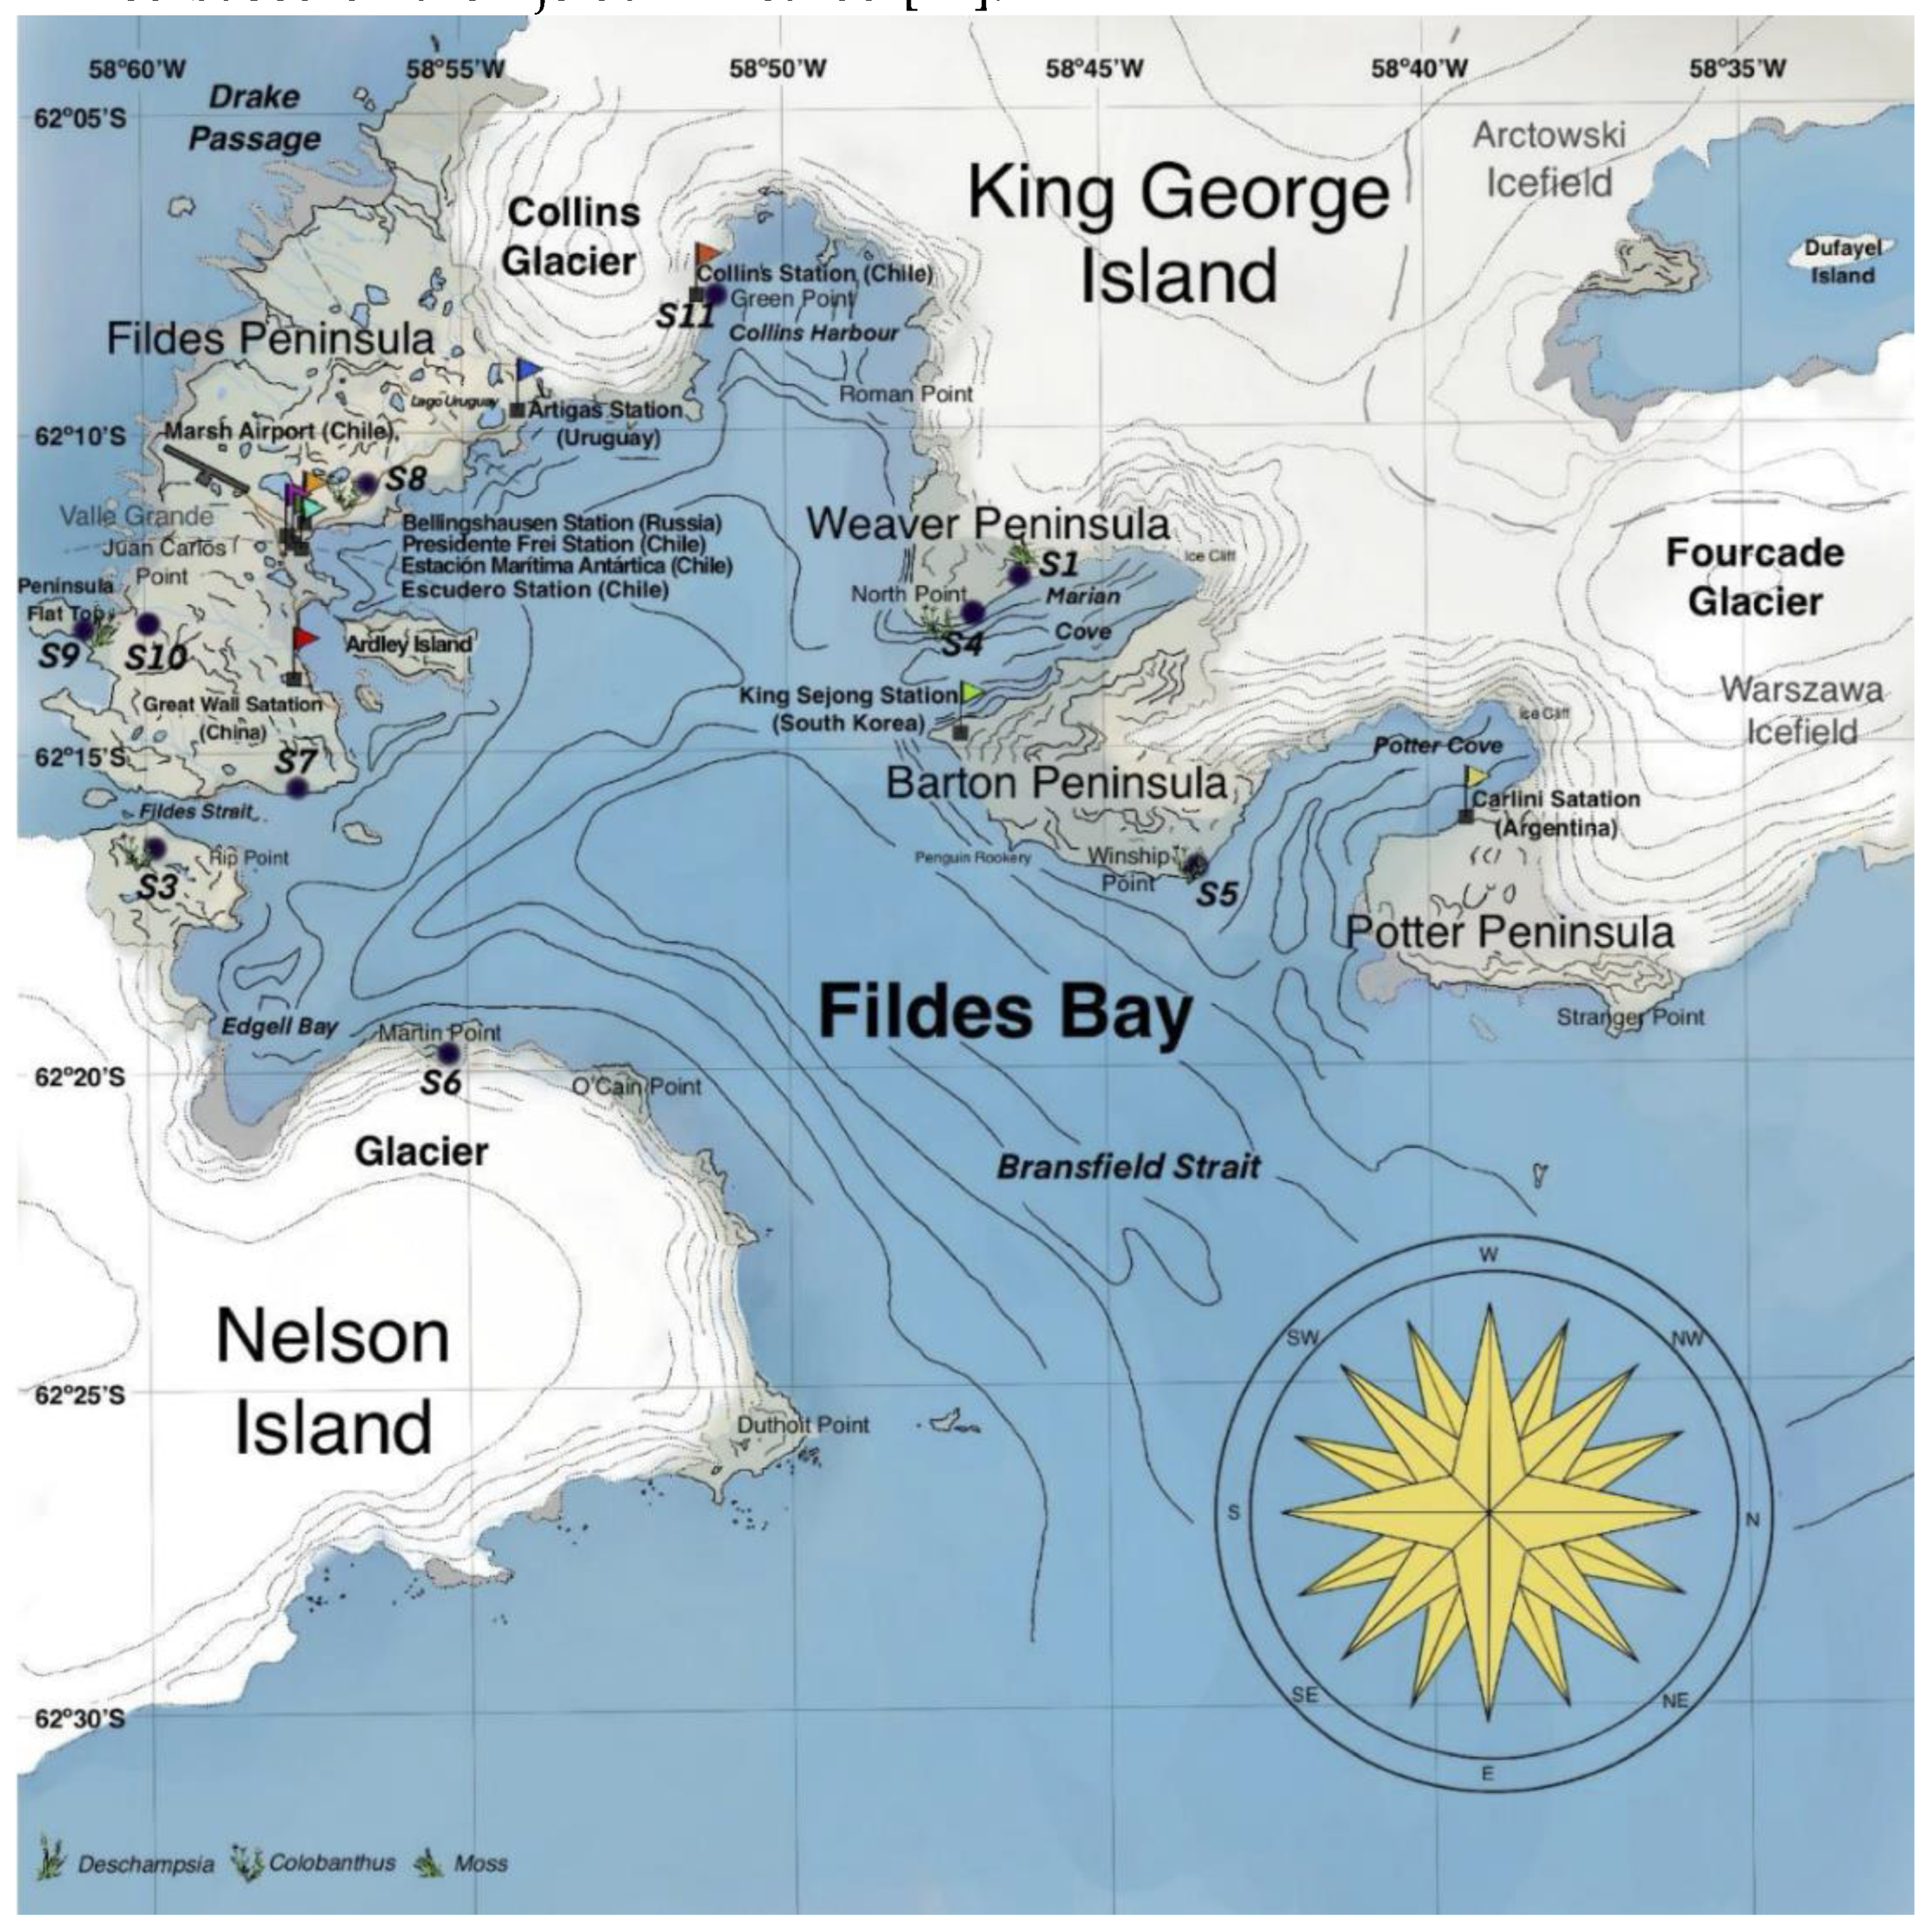

Table 1.
Results of chemical analysis for Antarctic soil samples.
| Sample | Na | K | Ca | Mg | P | pH | C/N | %Nt | %OC |
|---|---|---|---|---|---|---|---|---|---|
| mg/kg | |||||||||
| S1 | 74.4 | 149.3 | 476.4 | 476.4 | 71.4 | 6.5 | 43.7 | 0.1 | 3.0 |
| S3 | 256.2 | 147.8 | 2067.5 | 2067.5 | 125.8 | 6.4 | 20.5 | 0.4 | 7.8 |
| S4 | 254.5 | 138.8 | 757.6 | 757.6 | 274.2 | 6.6 | 26.7 | 0.4 | 9.7 |
| S5 | 180.6 | 136.8 | 4363.4 | 4363.4 | 370.7 | 6.2 | 1.6 | 2.3 | 3.7 |
| S6 | 164.2 | 132.6 | 457.1 | 32.8 | 81.2 | 7.5 | 5.3 | 0.5 | 2.4 |
| S7 | 194.3 | 153.5 | 974.4 | 54.9 | 26.1 | 7.2 | 54.3 | 0.2 | 11.9 |
| S8 | 300.0 | 145.8 | 1058.3 | 1058.3 | 186.7 | 6.9 | 6.5 | 0.4 | 2.7 |
| S9 | 454.0 | 175.5 | 1152.7 | 1152.7 | 62.4 | 6.7 | 6.0 | 1.0 | 5.8 |
| S10 | 726.2 | 265.2 | 1886.2 | 155.5 | 3.6 | 7.4 | 25.4 | 0.2 | 5.9 |
| S11 | 188.3 | 161.0 | 1354.5 | 71.0 | 31.6 | 7.1 | 15.6 | 0.7 | 11.4 |
Table 2.
Antarctic fungal strains isolated and used in the present study.
| UFRO accesses | Taxonomy |
|---|---|
| UFRO22.77 | Botrytis cinerea |
| UFRO22.262 | Botrytis cinerea |
| UFRO22.551 | Cladosporium herbarum complex herbarum |
| UFRO22.307 | Cladosporium perangustum complex cladosporioides |
| UFRO22.53 | Cladosporium varians complex cladosporioides |
| UFRO22.226 | Cylindrobasidium eucalypti |
| UFRO22.73 | Mortierella antartica |
| UFRO22.40 | Mortierella gamsii |
| UFRO22.317 | Mortierella globulifera |
| UFRO22.261 | Mortierella truficola |
| UFRO22.569 | Penicillium miczynskii |
| UFRO22.251 | Penicillium virgatum |
| UFRO22.138 | Pseudogymnoascus pannorum |
| UFRO22.172 | Pseudogymnoascus pannorum |
| UFRO22.250 | Pseudogymnoascus pannorum |
| UFRO22.358 | Pseudogymnoascus pannorum |
| UFRO22.140 | Talaromyces acaricola sect. Islandici |
| UFRO22.418 | Melanommataceae family |
Table 3.
Effectiveness assessment of lipid extraction among methods.
| Bligh & Dyer | Folch | Lewis | ||||||||||
|---|---|---|---|---|---|---|---|---|---|---|---|---|
| X | SD | L | X | SD | L | X | SD | L | ||||
| TLE% | 3.83% | ± | 4.25 | b | 8.64% | ± | 8.36 | a | 7.54% | ± | 3.86 | A |
| FAME | 0.89% | ± | 1.11 | c | 1.13% | ± | 1.62 | b | 4.01% | ± | 1.86 | A |
X: Average; SD: Standard deviation; L: Statistical significance letter.
Table 4.
Effectiveness assessment of FAME extraction among each fungi strain.
| UFRO accesses | Taxonomy | Bligh & Dyer | Folch | Lewis |
|---|---|---|---|---|
| UFRO22.77 | Botrytis cinerea | 16.46% | 15.87% | 20.70% |
| UFRO22.262 | Botrytis cinerea | 13.92% | 13.18% | 45.73% |
| UFRO22.551 | Cladosporium herbarum complex herbarum | 12.29% | 6.94% | 53.58% |
| UFRO22.307 | Cladosporium perangustum complex cladosporioides | 5.33% | 6.80% | 42.73% |
| UFRO22.53 | Cladosporium varians complex cladosporioides | 11.26% | 9.74% | 50.06% |
| UFRO22.226 | Cylindrobasidium eucalypti | 28.28% | 19.86% | 79.80% |
| UFRO22.73 | Mortierella antartica | 30.68% | 1.25% | 51.93% |
| UFRO22.40 | Mortierella gamsii | 26.65% | 23.42 | 46.76% |
| UFRO22.317 | Mortierella globulifera | 19.58% | 11.30% | 45.71% |
| UFRO22.261 | Mortierella truficola | 11.75% | 18.25% | 60.34% |
| UFRO22.569 | Penicillium miczynskii | 28.62% | 6.52% | 65.85% |
| UFRO22.251 | Penicillium virgatum | 22.24% | 7.90% | 51.01% |
| UFRO22.138 | Pseudogymnoascus pannorum | 34.42% | 10.60% | 55.19% |
| UFRO22.172 | Pseudogymnoascus pannorum | 18.09% | 2.63% | 74.00% |
| UFRO22.250 | Pseudogymnoascus pannorum | 17.88% | 6.41% | 59.59% |
| UFRO22.358 | Pseudogymnoascus pannorum | 15.50% | 13.16% | 51.00% |
| UFRO22.140 | Talaromyces acaricola sect. Islandici | 11.55% | 8.04% | 76.23% |
| UFRO22.418 | Melanommataceae family | 55.30% | 37.86% | 63.70% |
Table 5.
Identification by GC-MS of FA obtained from Antarctic fungi by Bligh & Dyer, Folch and Lewis methods.
Table 5.
Identification by GC-MS of FA obtained from Antarctic fungi by Bligh & Dyer, Folch and Lewis methods.
| Fatty acid | Chain length | Time retention (min) |
|---|---|---|
| Lauric acid | C12:0 | 12.008 |
| Myristic acid | C14:0 | 12.790 |
| Pentadecanoic acid | C15:0 | 13.215 |
| Palmitic acid | C16:0 | 13.710 |
| Palmitoleic acid | C16:1 | 14.166 |
| Margaric acid | C17:0 | 14.166 |
| Stearic acid | C18:0 | 14.861 |
| Oleic acid | C18:1 | 15.411 |
| Linoleic acid | C18:2 | 16.262 |
| γ-Linolenic acid | γ-C18:3 | 17.381 |
| α-Linolenic acid | α-C18:3 | 17.381 |
| Behenic acid | C22:0 | 18.201 |
| Dihomo-γ-Linolenic acid | C20:3 | 19.188 |
| Arachidonic acid | C20:4 | 20.096 |
| Lignoceric acid | C24:0 | 21.009 |
| 5,8,11,14,17-Eicosapentaenoic acid | C20:5 | 22.185 |
| Nervonic acid | C24:1 | 22.379 |
Disclaimer/Publisher’s Note: The statements, opinions and data contained in all publications are solely those of the individual author(s) and contributor(s) and not of MDPI and/or the editor(s). MDPI and/or the editor(s) disclaim responsibility for any injury to people or property resulting from any ideas, methods, instructions or products referred to in the content. |
© 2025 by the authors. Licensee MDPI, Basel, Switzerland. This article is an open access article distributed under the terms and conditions of the Creative Commons Attribution (CC BY) license (http://creativecommons.org/licenses/by/4.0/).
Copyright: This open access article is published under a Creative Commons CC BY 4.0 license, which permit the free download, distribution, and reuse, provided that the author and preprint are cited in any reuse.


