
Submitted:
29 January 2025
Posted:
30 January 2025
You are already at the latest version
Abstract
Objective: The air content within the lungs directly influences the dielectric properties of lung tissue; however, existing studies have been conducted under ex vivo conditions and without quantitatively controlling air volume. The study aims to develop an improved model using in vivo measurements to accurately characterize the dielectric properties of rabbit lung tissue across various tidal volumes, based on the Kramers-Kronig (KK) relationships. Methods: In this study, six sets of different tidal volumes (30, 40, 50, 60, 70, 80 mL) were set in the frequency band of 100 MHz~1 GHz to analyze the trend of the dielectric properties, and the dielectric parameters were systematically constructed under the conditions of different tidal volumes. Results: It was found that the conductivity and permittivity of rabbit lung tissue showed a decreasing trend with increasing tidal volume in the measuring frequency band. The traditional Cole-Cole model has limitations in simulating the dielectric properties of in vivo lung tissues. Therefore, by refining and optimizing the model based on the KK relationships, while ensuring physical plausibility, the study successfully reduced the average error between the measured data and the model predictions to less than 5%. Conclusions: It lays the groundwork for investigating the relationship between total air volume within the lungs and their dielectric properties in vivo.
Keywords:
Cole-Cole model
; an improved model
; in vivo
; dielectric properties of lung tissue
; open-ended coaxial probe
1. Introduction
The dielectric properties of biological tissues reveal the interaction mechanism of tissue microstructure and the electromagnetic fields, relating to physiological and pathological conditions, and thus are of great importance in biophysical research and clinical applications [1]. Currently, the study of dielectric properties of biological tissues has become one of hotspots of bioelectromagnetics [2] and bioelectrical impedance imaging [3] research because of its potential and substantial role in revealing the deep-rooted mechanism of life phenomena, optimising and innovating clinical diagnostic methods, and actively promoting the innovative development of related medical devices.
In the field of research on dielectric properties of biological tissues, lung tissue is recognised as the most challenging research object due to its special anatomical structure and physiological functions. Its complex the structure includes a microscopic bronchial tree, numerous alveoli, a rich vascular network, and a lymphatic system [4], which together determine its dielectric properties. In addition, the dielectric properties of lung tissue are highly dynamic, changing with the expansion and contraction of alveoli, air exchange and blood perfusion during the respiratory cycle. In particular, fluctuations in the air content in the alveoli can have a profound effect on the overall dielectric properties of lung tissue [5], i.e. when the alveoli are filled with more air, the overall electrical resistance properties of the lung tissue are significantly altered due to the fact that air is a poor conductor. This phenomenon essentially forms the biophysical basis for the current widely used clinical technique of thoracic electrical impedance tomography (EIT), which provides a bio-physical basis for assessing lung ventilation and fluid distribution by measuring changes in tissue electrical impedance [6]. Therefore, measuring lung tissue in vivo with the changing air content is therefore key to, and a major challenge in, achieving accurate measurements of the dielectric properties of lung tissue.
Several literatures have investigated the dielectric properties of lung tissue in the last decades. The research focus has been mainly on two aspects: on the one hand, the changes in the dielectric properties of lung tissues in pathological states have been analysed in an attempt to reveal the alterations in the dielectric properties of tissues in different lung disease states and their correlation with the disease process. Sun et al. found that the permittivity and conductivity of lung metastatic lymph nodes were higher than those of normal lymph nodes in the frequency range of 1 MHz-4 GHz [7]. Wang et al. found significant differences in dielectric properties between human lung cancer tissues and normal tissues [8]. On the other hand, the dielectric properties of lung tissues under normal physiological conditions have also been investigated. Sebek et al. measured the dielectric properties of isolated porcine and bovine lung tissues in the frequency band of 500 MHz-6 GHz [9]. Colebeck et al. investigated the temperature dependence of the dielectric properties of isolated porcine lungs in the 500 MHz to 20 GHz band [10]. Nopp et al. characterised the air content of the alveoli in the frequency range of 100 Hz-100 MHz by means of an ex vivo inflation factor F determined by the sample mass and volume [11]. However, the lung tissue for these studies was directly stripped from the organism, and under in vitro experimental conditions, key factors such as air exchange a could not be realistically represented due to the loss of support from the original physiological environment. Such a stripped state means that experimental results may not accurately reflect the dielectric properties of lung tissue under natural physiological conditions, thus becoming the biggest shortcoming of ex vivo experimental methods. As a result, current research mainly lacks effective non-invasive in vivo measuring techniques [12], and few studies have in vivo explored the relationship between lung tissue dielectric properties and air content.
At present, measurements targeting the dielectric properties of lung tissue cover both low and high frequency band techniques. Impedance methods are mainly applied to the low frequency band below megahertz, for example, Witsoe et al. used the four-electrode method to measure the dielectric properties of lung tissue from a surface dog at a frequency of 100 kHz [13], but their method causes tissue damage and airtightness disruption, resulting in an inevitable reduction in measurement accuracy, and the effect of the stray capacitance and inductance inherent to the measurement system on the measurement results is exacerbated with the increase in the measurement frequency. Also, the main high-frequency band measurement methods include waveguide transmission method [14,15,16], coaxial transmission reflection method [17,18,19] and resonance measurement method [20,21,22]. e.g.Vidjak et al. found the existence of an air content threshold in isolated sheep lungs using the open-ended coaxial probe technique in the range of 500 MHz to 8 GHz, below this limit, the dielectric properties of the lungs will change drastically with changes in air density [23]. However, this study is still limited by the fact that it is based only on simulation experiments in an ex vivo environment and not on observations under real physiological conditions in living animals. This indicates that although the study reveals the relationship between the dielectric properties of lung tissue in the ex vivo state and air content, additional consideration of the effects of more physiological factors may be required when interpreting the actual situation in vivo. As the classical mode of transmission line method, the open-ended coaxial probe technique for high frequency measurement has the advantages of being non-invasive, not being limited by geometrical structure, and enabling continuous and accurate real-time monitoring of lung tissues in vivo over a wide frequency range, which is crucial for accurately capturing the characteristics of the dynamic changes in the dielectric properties of lung tissues in response to the air content within the lungs during ventilation.
Furthermore, Most previous studies have focused on the modelling of solid tissues, and these models usually assume that tissues have a relatively homogeneous material composition and that their dielectric properties are mainly influenced by the inherent dielectric properties of the tissue itself. However, the lung, as a tissue containing a large volume of air, has dielectric properties that change dynamically as the volume of gas changes during respiration. Therefore, there may be some uncertainty in the applicability and accuracy of modelling methods applicable to solid tissues when applied directly to the lungs. Considering the unique structure of lung tissue and the fluctuation of air content during respiration, existing modelling methods may need to be adapted and improved accordingly.
Prior to this, our research group's work focused on designing and fabricating specialised probes, establishing measurement and calculation methods, and completing preliminary in vivo measurements to obtain data on the dielectric properties of rabbit lung tissue [24]. In this study, we aim to 1) investigate the correlation between in vivo dielectric properties of lung tissue and tidal volume based on rabbits, and 2) to carry out novel and accurate modelling and fitting analysis of dielectric properties of lung tissue in the in vivo state, aiming to reveal the dielectric response of lung tissue at various tidal volume levels. As the first step to explore the interaction between the in vivo dielectric properties of lung tissue and total air content over a wide frequency range, the open-ended coaxial probe was in this study primarily employed to focus on measurements in the high frequency (100 MHz-1 GHz). This study adopts the in vivo measurement technique, which does not cause damage to the lung tissue, and at the same time precisely regulates the tidal volume inside the lungs, aiming to make the experimental conditions as close as possible to the actual physiological state, so as to obtain more accurate and reliable data on the dielectric properties.
2. Methods
2.1. Measurement System and Accuracy Verification
2.1.1. Setup of the Measurement System
2.1.2. System Accuracy Verification
The open-ended coaxial probe as a proven methodology has been extensively validated in terms of measurement means, computational models and characterisation (fitting) models [26]. The aim of this step is to validate the accuracy and reliability of the actual measurement steps and modelling process. Specifically, the validation will be divided into the following two sections:
1)The accuracy of the measurement system is verified using a standard sample of NaCl (sodium chloride) solution with known properties, which provides a reliable reference for calibrating the measurement equipment due to its stable conductivity and permittivity at different concentrations [27]. By comparing experimental data with theoretical values, the accuracy of the measurement system can be evaluated. Since the closer the calibration solution is to the dielectric properties of the tissue, the better the calibration effect is, three NaCl solutions with concentrations of 0.001, 0.0015, and 0.0008 mol/L were selected for the measurement.
2)Ex vivo porcine liver was selected to verify the reliability of the measurement system. This is because porcine liver tissue has stable dielectric properties and is often used as a reference standard in biological tissue studies [28], and its tissue structure and physiological properties are different from those of lung tissue, so that the influence of the air on the measurement results can be excluded. The same experimental set-up and procedures were maintained and 10 replicates of the experiment were performed using isolated porcine liver tissue.
2.2. The Procedures of Rabbit Lung Measurement
Twenty-five adult male rabbits were used in the experiment. The schematic diagram of the experiment is shown in Figure 2. At the beginning of the experiment, the rabbits were mechanically ventilated using volume-controlled ventilation (VCV) mode, and the ventilation parameters were set to include a tidal volume (VT) of 50 mL and an inspiratory/expiratory ratio (I:E) of 1:2. After confirming that the rabbits had reached a deep anaesthesia state, the rabbits were tracheally intubated, and the airway patency was carefully examined. Next, the skin was cut transversely along the raphe of the rabbit's sternum, and then the ribs were cut with scissors about 3 cm on either side of the sternum, the sternum was gently lifted, and the lower part of the sternum was carefully peeled off, taking care to avoid damaging blood vessels, and the anterior wall of the thorax was thoroughly removed to fully expose the left and right lung tissues. To ensure that stable measurement data were obtained, the rabbits were kept at a constant temperature of 38.5-39.5 degrees celsius with thermal blankets during the experiment. According to the actual physiological limitations of the rabbit's lungs, six different tidal volumes were set up, namely 30 mL, 40 mL, 50 mL, 60 mL, 70 mL, and 80 mL. Measurements were taken in order of tidal volume from smallest to largest, with 5-minute intervals for each group and 10-minute elution intervals. After the rabbit had completed full inspiration, the air intake port was closed temporarily to ensure that the lungs remained stable at the end of the inspiratory phase for at least 1 minute, and at this time, the dielectric properties of the rabbit's lung tissues were measured. To ensure the accuracy and reliability of the measurement results, measures such as fixing the position of the rabbit and recording the coordinates of the measurement points in the right lobe of the lungs were taken to minimise the errors introduced by changes in the measurement position, and the measurements were repeated for three times to take the average value.
2.3. Data Analysis
2.3.1. Double-Pole Cole-Cole Model
The expression for the complex permittivity εr, which usually describes the dielectric properties of the tissue, is shown in Eq. (1) [29]:
where, εr' is the relative permittivity of the tissue, which represents the energy of the biological tissue under electromagnetic excitation; ε0 denotes the permittivity of air; ω denotes the angular frequency; and j denotes the imaginary unit; εr is related to the electrical conductivity.
The dielectric properties of biomaterials over a wide frequency range can be expressed by the Cole-Cole model. In this work, measurements were performed in the 100 MHz-1 GHz band. Therefore, when searching for a Cole-Cole fit model, it was expected that the number of poles would be less than 4. To determine the optimal number of poles, the data was fitted to a model with a decreasing number of poles, and it was found that fitting to a bipolar model resulted in a very low fitting error, is shown in Eq. (2) [30]:
where ε∞ takes values between 2.4 and 4.2 depending on the water content of the tissue, and ∆ε1 and ∆ε2 are the changes in the permittivity of the 1st and 2nd dispersion, and τ1 and τ2 are the time constants of the 1st and 2nd dispersion, and α1 and α2 are relaxation factors, and σs is the static conductivity.
2.3.2. An Improved Cole-Cole Model Considering Air Content
In the original Cole-Cole model, the complex permittivity is usually expressed as a complex number containing a real part (related to capacitive behaviour) and an imaginary part (related to energy loss or dielectric loss).During the initial study, it was found that the Cole-Cole model did not fit the in vivo measurements well, possibly due to air factors, so an improved original model was considered. Based on the Double-Pole Cole-Cole model, in order to more accurately model and describe the dielectric properties of lung tissue at different frequencies, this study proposes to set the dispersive permittivity and static conductivity as linear frequency-dependent functions. As shown in Eq. (3), in the improved model, linear frequency-dependent functional coefficients A and B were introduced to give more flexibility in modelling the complex nature of the frequency-dependent changes in the dielectric properties of the lung tissue, especially considering that changes in the air composition within the lung tissue can lead to significant variations in the dielectric properties under different states of ventilation.
2.3.3. An Improved Cole-Cole Model Considering Physical Reasonableness
In the process of revising the model, we note that numerical fitting alone, while giving a better match of the parameters, does not adequately safeguard the physical meaning of the model, especially the key factor of the Kramer-Kronig (KK) relationship [31]. This relationship articulates the intrinsic connection between the real and imaginary parts of the dielectric constant, whereas in this study the two parts were fitted as independent variables in the initial modelling, ignoring their inherent dependence. Therefore, in order to ensure the physical soundness and consistency of the model, we decided to keep the validated real-part fitting results as part of the model and derive new imaginary-part expressions based on the KK relationship as shown in equation (4) and (5) [32].
where Reε(ω) is the real part of the tissue permittivity, and Zimε(ω) is the imaginary part of the tissue permittivity.
Firstly, the KK relation
is linear. A comparison reveals that the real part of the modified model
differs from the real part of the Cole model by a specific fraction . Therefore, the imaginary part of the new model is equal to the imaginary part of the Cole- Cole model plus the part of the Cole model consisting of this part. The additional contribution to the imaginary part obtained after the KK relation is calculated. Specifically, the result of the imaginary part of the new model is approximated by taking the first three terms through a Taylor expansion as shown in equation (6):
Ultimately, we combine the new imaginary part expression with the existing real part expression to form a complete permittivity model as shown in equation (7):
2.3.4. Fitting Effect of the Models
In this experiment, the measured data were fitted to a dielectric parameter model using the Simulated Annealing (SA) algorithm. The algorithm is controlled and improved by a cooling schedule to improve the fit. A measure of the overall accuracy of the fit was calculated from the average fitting error as shown in Eq. (8):
where Zr1 and Zim1 are the real or imaginary parts of the measured complex permittivity.Zr2 and Zim2 are the real or imaginary parts of the calculated complex permittivity(obtained by fitting).
The fit curve R2 is a statistical indicator of the degree of match between the actual measurements and the fitted curve. Its value ranges from 0 to 1. The closer the value is to 1, the higher the degree of fit of the fitted curve to the actual measurements, indicating that the fitted model is more reliable.
In the above Eq. (9), SSres denotes the sum of the squares of the differences between the measured and calculated values, i.e. the error between the measured and calculated values, and SStot denotes the squared difference, which represents the degree of dispersion of the measured values, and the larger it is, the more dispersed it is.
2.3.5. Statistical Analysis
In statistics, a normality test was first executed on the collected data to determine whether the distribution pattern conforms to the law of normal distribution. If the data were tested to be normally distributed, the mean and standard deviation were used to describe the tendency of the data to concentrate and the degree of variability, and parametric statistical methods, such as t-tests, were used to compare whether there was a significant difference between the means of the dielectric properties of the lung tissues at different tidal volumes. However, if the data did not satisfy normal distribution, the median would be used instead of the mean at this point to characterise the concentration trend of the data, in combination with other non-parametric statistics (e.g., quartiles, box plots, etc.) to reflect the variability of the data. Non-parametric methods such as the Kruskal-Wallis test would be used to assess whether there is a significant difference in the dielectric properties of rabbit lung tissue at the six different tidal volumes, with the significance level set at 0.05. Given that dielectric properties are closely related to electromagnetic wave frequencies, this study focused on two specific frequency points, 433 MHz and 915 MHz, which are widely used in the industrial, scientific and medical (ISM) bands, and have important applications in the development of medical devices such as radiofrequency and microwave ablation [7].
3. Results
3.1. System Accuracy Verification
3.1.1. Measurement of Standard Solutions
Firstly, in this study, 0.001 mol/L NaCl solution was selected as the calibration reference standard to fine calibrate. Repeated measurements were carried out for NaCl solutions with concentrations of 0.0015 mol/L and 0.0008 mol/L, respectively, at room temperature of 24 degrees centigrade. As shown in Figure 3, the experimental results show that the measured parameters of the dielectric properties of various concentrations of NaCl solutions show a high degree of consistency with the theoretical predictions, and all the errors are strictly controlled within the threshold value of ±5%, which verifies the reliability of the measurement system used in this study.
3.1.2. Measurement of Ex Vivo Porcine Liver
In the experimental procedure, the dielectric properties of porcine liver tissue were measured using the open-ended coaxial probe. in the specified frequency range (100 MHz to 1 GHz) and the data were fitted using the Double-Pole Cole-Cole model. As shown in Figure 4, the results showed that the average error in fitting the dielectric properties of isolated porcine liver tissue by the Double-Pole Cole-Cole model was within 2%, and the coefficients of determination of the real and imaginary parts of the complex permittivity R2 exceeded 0.90. Thus, the reliability of the measurement system and the Double-Pole Cole-Cole model was verified for liver tissue.
3.2. Dielectric Properties of Lung Tissue with Changing Air Volume
In this experimental study, the dielectric properties of rabbit lung tissue were systematically measured by gradually applying six different levels of tidal volume, aiming to simulate and investigate the changes in the dielectric properties of the lung tissue under different inflation levels. As shown in Figure 5, the results showed that the electrical conductivity and permittivity of the rabbit lung tissue showed a clear trend of decreasing with a gradual increase in tidal volume over the range of frequency bands tested. This finding is in agreement with previous findings by Nopp et al. on the dynamic relationship between air content within lung tissue and its dielectric properties [5], suggesting that the dielectric properties of lung tissue do indeed change regularly with the volume of air within the lung [24]. Further analysis of the data at two representative frequency points (433 MHz and 915 MHz) using the K-W test showed the same trend in conductivity and dielectric constant, and the differences were statistically significant (P<0.01) for the six groups at different tidal volumes.
3.3. Double-Pole Cole−Cole Fitting
In this study, the experimentally obtained data on the dielectric properties of rabbit lung tissue were fitted and analysed using the Double-Pole Cole-Cole model, and the complex permittivity obtained from actual measurements were compared and validated against the model predictions. In order to visualise the process of changes in the dielectric properties of lung tissue with air content, changes in tidal volume were used as a means of simulation to reflect the dielectric behaviour of the lungs under different inflation states. Figure 6 illustrates two extreme tidal volume conditions: on the one hand, it indicates a relatively high intra-alveolar air content at a maximum tidal volume of 80 ml when the lung tissue is in a fully inspiratory state; on the other hand, it indicates a low intra-alveolar air content corresponding to a minimum tidal volume of 30 ml near the end of expiration. According to Table 1, the average fitting error for lung tissue using the Double-Pole Cole-Cole model exceeded 10%, indicating that the model is biased in describing the in vivo dielectric properties of lung tissue with different tidal volumes. According to the definition of the coefficient of determination, the fit of the imaginary part was significantly better than that of the real part, but it still failed to reach the ideal state. The model needs to be further improved for describing the complex dielectric behaviour of lung tissue needs to be found.
3.4. The Improved Cole-Cole Model Considering Air Content
In the present study, the investigation of the dielectric properties of rabbit lung tissue reveals the limitations of the Double-Pole Cole-Cole model in fitting its measured data, showing a certain degree of inconsistency between model predictions and actual tissue properties. Considering the complexity of the microstructure of biological tissues, as well as the possible frequency-dependent effects of intrinsic moisture distribution, ionic concentration, and the distribution of inhomogeneous media such as air in the tissues, the existing models may not be able to adequately describe the dynamics of the dielectric parameters of the lung tissues as a function of frequency. To this end, we transformed the first permittivity (∆ε1) and static conductivity (σs) parameters, which were originally fixed in the Double-Pole Cole-Cole, into linear frequency-dependent functional expressions. In the experiment, the good performance of this modified model was verified (see Figure 7). Model parameters A and B are designed to be small since they are multiplied by frequency values in the formula. In the comparative results in Table 2, the improved model made significant progress in fitting the dielectric properties of lung tissue. Compared to the Double-Pole Cole-Cole model, the improved model significantly reduces the fitting error to no more than 5%, implying that the improved model is able to more accurately describe and predict the changes in the dielectric properties of the lung tissue in different states(see Table 3). The dielectric parameters of in vivo lung tissue at different tidal volumes detailed in Table 3 reflect the dynamic response of the dielectric properties of lung tissue to changes in tidal volume, which provides a solid foundation for subsequent data analysis and mining work. The actual measured values of the lung tissue dielectric properties at the two extreme tidal volume conditions are shown in comparison with the fitted curves of the improved model, which further confirms that the improved model has a higher fitting efficacy and practical value in dealing with the variation of the lung tissue dielectric properties under different respiratory states. The Double-Pole Cole-Cole model is incapable of calculating the dielectric properties of lung tissues under different tidal volumes, and the improved model can accurately fit the dielectric properties of lung tissue under different tidal volume conditions, and thus can more accurately predict the variation patterns of the complex permittivity (including the real part of εr' and the imaginary part of εr'') under various tidal volume states.
3.5. The Improved Cole-Cole Model Considering kk Relationship
Correcting the model with further safeguards for physical significance, we note that the results of the single-frequency point fit show that the real part is fitted as expected, while the imaginary part is not as well fitted, as shown in Figure 8.
From the comparative results in Figure 9, the model also has a better fitting effect in fitting the lung tissue dielectric properties. The fitting error of the model does not exceed 5%, which means that the improved model is equally accurate in describing and predicting the changes in the dielectric properties of lung tissue in different states (see Table 4). Table 5 details the improved dielectric parameters of lung tissue in vivo at different tidal volumes, which are meaningful for statistical analysis. Thus, the model guarantees the accuracy of data fitting while optimising physical plausibility.
4. Discussion
In this study, the non-destructive in vivo measurement technique— the open-ended coaxial probe was used to investigate the dielectric properties of in vivo lung tissue at different tidal volumes in the high-frequency range of 100 MHz to 1 GHz. By accurately regulating the tidal volume inside the lungs, the experimental conditions were ensured to simulate the real physiological state as much as possible, so as to obtain more accurate and reliable data on the in vivo dielectric properties of lung tissues. Also, a novel fitting model was constructed for reflecting the dielectric properties of in vivo lung tissue under physiological state. In the new model, the smaller values of static conductivity σs may be due to the fact that air filling significantly alters the dielectric properties of lung tissue during lung ventilation. The model parameters α1 and α2, which represent the degree of distribution of different relaxation times in the mixture, were found to have values equal to zero in the finite frequency interval from 100 MHz to 1 GHz, which may be attributed to the fact that the main determinants of the dielectric properties of the lung tissues in this frequency range come from the polarisation and relaxation effects of the water molecules, in particular due to counterion polarization and Maxwell Wagner effects [33].
In the course of modelling the dielectric properties of rabbit lung tissue, we compared the numerical model with a model based on the KK relationship. The numerical model is essentially the result of the KK model approximated by a Taylor first-order expansion in the derivation process. As can be seen from the comparison of the formulations of the two models, they actually originate from the same theoretical basis, but the numerical model is a simplified form of the KK model. Therefore, it can be said that the two models are theoretically consistent, only that the KK model retains more details and provides a finer description. As shown in Fig. 8(b), the numerical model does not perform as well as the KK model when fitting the actual measured data. This is mainly due to the fact that the numerical model employs a linear approximation and ignores the effect of higher order terms, which in some cases are crucial for accurately capturing the physical phenomena. In contrast, the KK model is able to better accommodate the lung tissue properties due to its consideration of a more comprehensive set of physical relationships, thus providing more accurate fitting results.
Previous research on lung tissue's dielectric properties has often used isolated samples or indirect measurement methods [9;34-37], which do not adequately reflect the tissue's dynamics under actual physiological conditions. This study contrasts earlier ex vivo data with current in vivo measurements, revealing significant discrepancies, particularly in simulating dynamic changes during respiration. As shown in Figure 10, the real component of the complex permittivity measured in vivo was higher, and the imaginary component was lower compared to past studies. This difference might be attributed to the physiological activities of the lung during ventilation, affecting dielectric properties through variations in air content. When performing in vivo measurements, the imaginary part of the dielectric properties of lung tissue exhibits not a complete absence of dispersion, but rather a rather weak dispersion effect. The disparity between real and imaginary values underscores a fundamental difference in the electromagnetic behavior of lung tissue in vivo versus ex vivo.
The present study only initially investigated the dielectric properties of normal lung tissues, and subsequent studies may be turned to explore the changes in the dielectric properties of pathological lung tissues (e.g., lung nodules, pneumonia, lung cancer, etc.), which is important for understanding the mechanisms of disease development, early diagnosis, and assessment of treatment effects. Some pathological states, such as lung solidification due to pneumonia, may severely affect the air content in the alveoli, thereby altering the dielectric properties of the tissue. By comparing the dielectric properties of normal lung tissue with those of lung tissue in various pathological states, it is possible to identify biomarkers for specific diseases, which can help develop new non-invasive or minimally invasive diagnostic techniques. In addition, understanding the pattern of change in the dielectric properties of these pathological tissues can also help guide and optimise the techniques and methods of using electromagnetic waves (e.g. radiofrequency, microwave, etc.) to treat lung diseases.
The primary limitation of this study is that it only considers the relationship between tidal volume and dielectric properties. Since measuring the functional residual capacity or total lung capacity of rabbits requires placing them in a sealed environment and using methods like body plethysmography or helium dilution, it was not feasible to measure these parameters alongside their dielectric properties due to the limited conditions. Furthermore, to minimize the variation in lung expansion at the same tidal volumes, we selected rabbits with similar features (gender, age, body weight), allowing us to assume that the functional residual capacity or total lung capacity was essentially consistent, or that the lung expansion at the same tidal volumes was similar, thus ensuring the rationality of our measurement data. In future research, a possible solution might be to determine the functional residual capacity or total lung capacity using body plethysmography or helium dilution methods before intubating the rabbits. By assuming these values remain constant in subsequent experiments, it would be possible to establish the relationship between the total air in the lungs and dielectric properties.
The current study mainly focuses on the analysis of lung tissue dielectric properties in the high-frequency (100 MHz to 1 GHz) range, and the measurements and analysis in the low-frequency part (10 Hz to 100 MHz) will be further supplemented and improved in future studies. By integrating the data in the high and low frequency bands, the full-spectrum lung tissue dielectric properties will be constructed, which will not only help to more accurately simulate the changes of the dielectric properties of the lung tissue in the physiological state, but also provide a richer and more accurate theoretical basis and experimental data.
Although there is some variability in the dielectric properties of human and rabbit lung tissues [38], given that this is the initial stage of the study, the focus is on the rabbit experiments to confirm the reliability of the methodology used and to lay the foundation for the subsequent study. The relatively small total volume of lung tissue in rabbits means that the volume of air that can be held within their alveoli will be correspondingly limited. Therefore, we can only set the maximum tidal volume to 80ml; if it is increased further, the rabbit's lungs would be severely damaged. In the future, animal models with larger lung volumes, such as large mammals like pigs, dogs and sheep, can be used. The lung tissues of these animals not only have a large capacity, but also their physiological structures and functions are closer to those of humans, making them more suitable for simulating and studying the air exchange process and the changes in dielectric properties associated with it in the human lung.
5. Conclusions
In this study, we investigated the dielectric properties of living rabbits’ lung tissues at different tidal volumes using the non-destructive in vivo measurement technique —the open-ended coaxial probe in the high frequency range of 100 MHz to 1 GHz. Accurate and reliable data on the dielectric properties of lung tissues were obtained by measuring the real physiological respiratory state, and these data demonstrated the intrinsic law between the change of tidal volume and the dielectric properties of lung tissues. Moreover, an improved Cole-Cole model is proposed in this study, which can effectively resolve the relationship between tidal volume and lung tissue dielectric properties. Through this study, we can lay the foundation for further exploration of the relationship between total pulmonary air and dielectric properties in vivo in animals.
Author Contributions
Yangchun Qin , Liang Zhang and Tixin Han performed the simulations, the data analysis and wrote the paper. Yifan Liu and Xuechao Liu verified the accuracy of the research work on measurements and data analysis. Shuoyao Qu guided the experimental part. Feng Fu, Hang Wang and Zhanqi Zhao provided solution ideas for the difficult points section. Lin Yang and Meng Dai gave advice on the overall direction and structural framework of the article.
Funding
This study was partially supported by the National Natural Science Foundation of China (Grant Nos.52277235 and 52077216), Natural Science Foundation of Shaanxi Province (2023-YBSF-130) and Scientific technological research projects of Air Force Military Medical University (2022ZZXM020) and Joint Founding Project of Innovation Research Institution Xijing Hospital(LHJJ24YG03).
Institutional Review Board Statement
The experimental process strictly adhered to the regulations of the Animal Ethics Committee, and all animal experimental protocols were approved by the Animal Ethics Committee of the Air Force Military Medical University (Ethical Review Approval No. KY20243594-1).
Data Availability Statement
The original contributions presented in the study are included in the article, further inquiries can be directed to the corresponding author.
Conflicts of Interest
The authors declare that the research was conducted in the absence of any commercial or financial relationships that could be construed as a potential conflict of interest.
References
- Matković A, Kordić A, Jakovčević A & Šarolić A Complex Permittivity of Ex-Vivo Human, Bovine and Porcine Brain Tissues in the Microwave Frequency Range. Diagnostics (Basel) 2022, 12.
- Tang D, Jiang L, Xiang N & Ni Z Discrimination of tumor cell type based on cytometric detection of dielectric properties. Talanta 2022, 246, 123524.
- Li Z, Wang W, Cai Z, Han S, Lin S, He L, Chen M, Pan D, Deng G, Duan S, et al. Variation in the dielectric properties of freshly excised colorectal cancerous tissues at different tumor stages Bioelectromagnetics. 2017, 38, 522–532.
- Chaudhry R & Bordoni B. in StatPearls (StatPearls Publishing Copyright © 2024, StatPearls Publishing LLC., 2024).
- Nopp P, Rapp E, Pfützner H, Nakesch H & Ruhsam C Dielectric properties of lung tissue as a function of air content. Phys Med Biol 1993, 38, 699–716.
- Lymperopoulos G, Lymperopoulos P, Alikari V, Dafogianni C, Zyga S & Margari N Applications for Electrical Impedance Tomography (EIT) and Electrical Properties of the Human Body. Adv Exp Med Biol 2017, 989, 109–117.
- Yu X, Sun Y, Cai K, Yu H, Zhou D, Lu D & Xin SX Dielectric Properties of Normal and Metastatic Lymph Nodes Ex Vivo From Lung Cancer Surgeries. Bioelectromagnetics 2020, 41, 148–155.
- Wang J Experimental Study of Dielectric Properties on Human Lung Tissue. Chin J Biomed Eng 2013, 47, 1793–1803.
- Sebek J, Bortel R & Prakash P Broadband lung dielectric properties over the ablative temperature range: Experimental measurements and parametric models. Med Phys 2019, 46, 4291–4303.
- Colebeck E, Asili M, Green R & Topsakal E. in USNC-URSI NRSM 2013.
- Nopp P, Harris ND, Zhao TX & Brown BH Model for the dielectric properties of human lung tissue against frequency and air content. Med Biol Eng Comput 1997, 35, 695–702.
- Fornes-Leal A, Cardona N, Frasson M, Castello-Palacios S, Nevarez A, Beltran VP & Garcia-Pardo C Dielectric Characterization of In Vivo Abdominal and Thoracic Tissues in the 0.5–26.5 GHz Frequency Band for Wireless Body Area Networks. IEEE Access 2019, 31854–31864.
- Witsoe DA & Kinnen E Electrical resistivity of lung at 100 kHz. Med Biol Eng 1967, 5, 239–248.
- Grant & Sheppard The measurement of permittivity of high-loss liquids at microwave frequencies using an unmatched phase changer. J Phys D Appl Phys 1970, 3, 84–90.
- Buckmaster HA & Hansen CH Design optimization of a high precision microwave complex permittivity instrumentation system for use with high loss liquids. IEEE T Instrum Meas 1990, 39, 964–968.
- Stuchly SS & Bassey C Microwave coplanar sensors for dielectric measurements. Meas Sci Technol 1999, 9, 1324–1329.
- Jordan BP & Grant EH Permittivity measurements on low and medium loss liquids using a terminated coaxial line. J Phys D Appl Phys 1970, 3, 1068.
- Bahl IJ & Gupta MH Microwave Measurement of Dielectric Constant of Liquids and Solids Using Partially Loaded Slotted Waveguide (Short Papers). IEEE T Microw Theory 1974, 22, 52–54.
- Mclaughlin BL & Robertson PA Miniature open-ended coaxial probes for dielectric spectroscopy applications. J Phys D Appl Phys 2006, 40, 45.
- Birnbaum G, Kryder SJ & Lyons H Microwave Measurements of the Dielectric Properties of Gases. J Appl Phys 1951, 22, 95–102.
- Works CN Resonant Cavities for Dielectric Measurements. J Appl Phys 1947, 18, 605–612. [CrossRef]
- Hamelin J, Mehl JB & Moldover MR Resonators for accurate dielectric measurements in conducting liquids. Rev Sci Instrum 1998, 69, 255–260.
- Vidjak K, Farina L, Ruvio G, Halloran MO & Cavagnaro M Dielectric Properties of Healthy Ex Vivo Ovine Lung Tissue at Microwave Frequencies. Ieee T Dielect El In 2023, 30, 1162–1169.
- QIN Yangchun ZL, LIU Yifan, FU Feng, YANG Bin, YANG Lin, LIU Xuechao, DAI Meng Dielectric properties of tidal volume changes in rabbit lung tissue in the 100 MHz~1 GHz band. Journal of Biomedical Engineering 2024, 41, 447–454.
- QIN Yangchun YL, FU Feng, DAI Meng, ZHANG Liang. Study on the difference of high frequency dielectric properties of biological tissues measured by air and packed coaxial probe. Journal of Biomedical Engineering 2023, 40, 886–893, http://english.hxyx.com/article/59312.html. [Google Scholar]
- Cook HF The dielectric behaviour of some types of human tissues at microwave frequencies. British Journal of Applied Physics 1951, 2, 295. [CrossRef]
- Stogryn A Equations for Calculating the Dielectric constant of saline water. IEEE T Microw Theory 1971, 19, 733–736. [CrossRef]
- Brace CL 2008 Temperature-dependent dielectric properties of liver tissue measured during thermal ablation: toward an improved numerical model 2008 30th Annual International Conference of the IEEE Engineering in Medicine and Biology Society.
- Cole KS Dispersion and absorption in dielectrics. Chem Phys 1941, 6, 42–52.
- Etoz S & Brace CL Development of Water Content Dependent Tissue Dielectric Property Models. IEEE J Electromag RF 2019, 3, 105–110.
- Gorges E, Grosse P & Thei W The Kramers-Kronig-Relation of effective dielectric functions. Zeitschrift für Physik B Condensed Matter 1995, 97, 49–54.
- Pendry JB, Holden AJ, Robbins DJ & Stewart WJ Magnetism from Conductors, and Enhanced Non-linear Phenomena. IEEE Transactions on Microwave Theory and Techniques 1999, 47, 2075–2084.
- Schwan HP & Foster KR RF-field interactions with biological systems: Electrical properties and biophysical mechanisms. Proceedings of the IEEE 1980, 68, 104–113.
- Gabriel, Lau & Gabriel The dielectric properties of biological tissues: III. Parametric models for the dielectric spectrum of tissues. Phys Med Biol. 1996, 41, 2271–2293.
- Gabriel, C.; Corthout, E. ; Gabriel S The Dielectric Properties of Biological Tissues, I. Literature Survey Phys Med Biol 1996, 41. [Google Scholar]
- Gabriel, S.; Lau, R.W. ; Gabriel C The dielectric properties of biological tissues:, I.I. Measurements in the frequency range 10 Hz to 20 GHz. Phys Med Biol. 1996, 41, 2251–2269. [Google Scholar] [CrossRef] [PubMed]
- Bonello J, Elahi MA, Porter E, O'Halloran M, Farrugia L & Sammut CV An investigation of the variation of dielectric properties of ovine lung tissue with temperature. Biomed Phys Eng Expr 2018, 5.
- Florence. http://niremf.ifac.cnr.it/tissprop/, 1997).
Figure 1.
Experimental system and equipment. (a) The Teflon-filled probe was chosen to prevent errors caused by the penetration of tissue fluids into the probe during measurements, thus ensuring accurate measurements of the dielectric properties of tissue.; (b) A coaxial cable for connection to the vector network analyser; (c) The measurement band of the vector network analyser: 100 MHz~1 GHz.
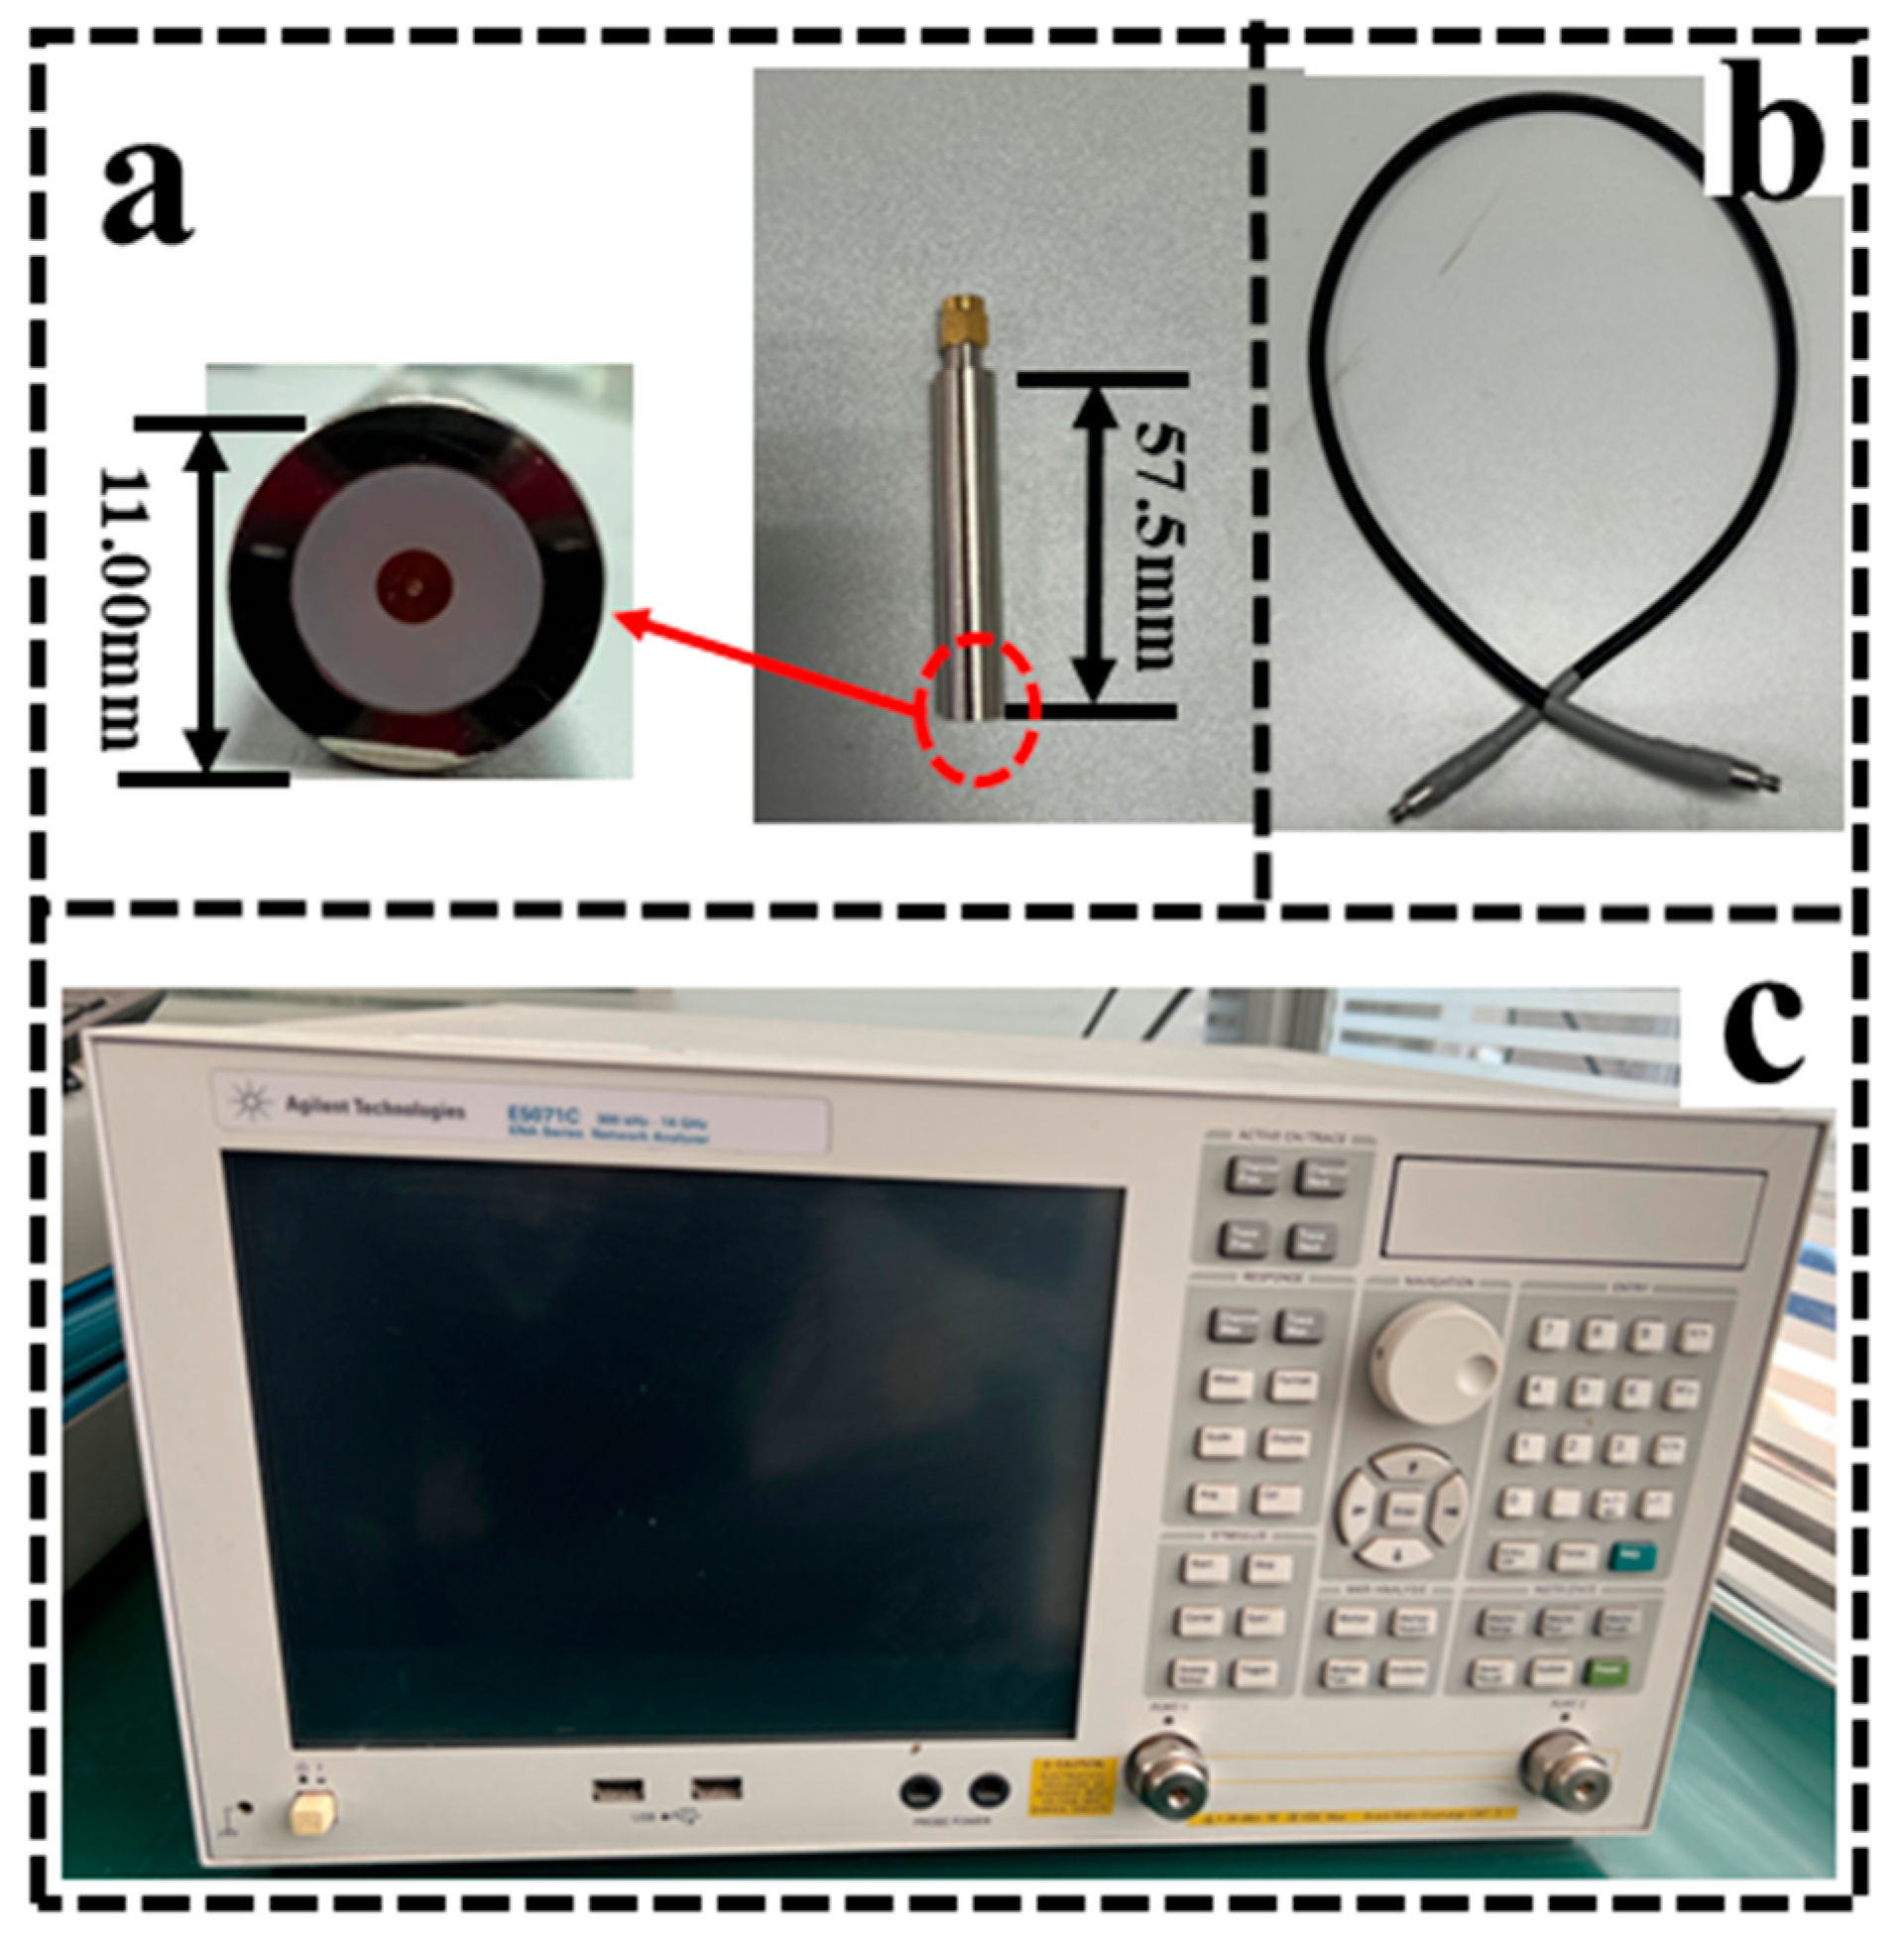
Figure 2.
Experimental diagram of lung tissue measurements in rabbits. (a) Tracheal intubation was used to effectively maintain the rabbits' respiratory patency, as well as to reduce the potential effects caused by airway obstruction, thus improving the accuracy and reliability of the measurement data; (b) The size of the lung tissue being measured is approximately 4 to 5 cm in length and 6 to 8 cm in width.
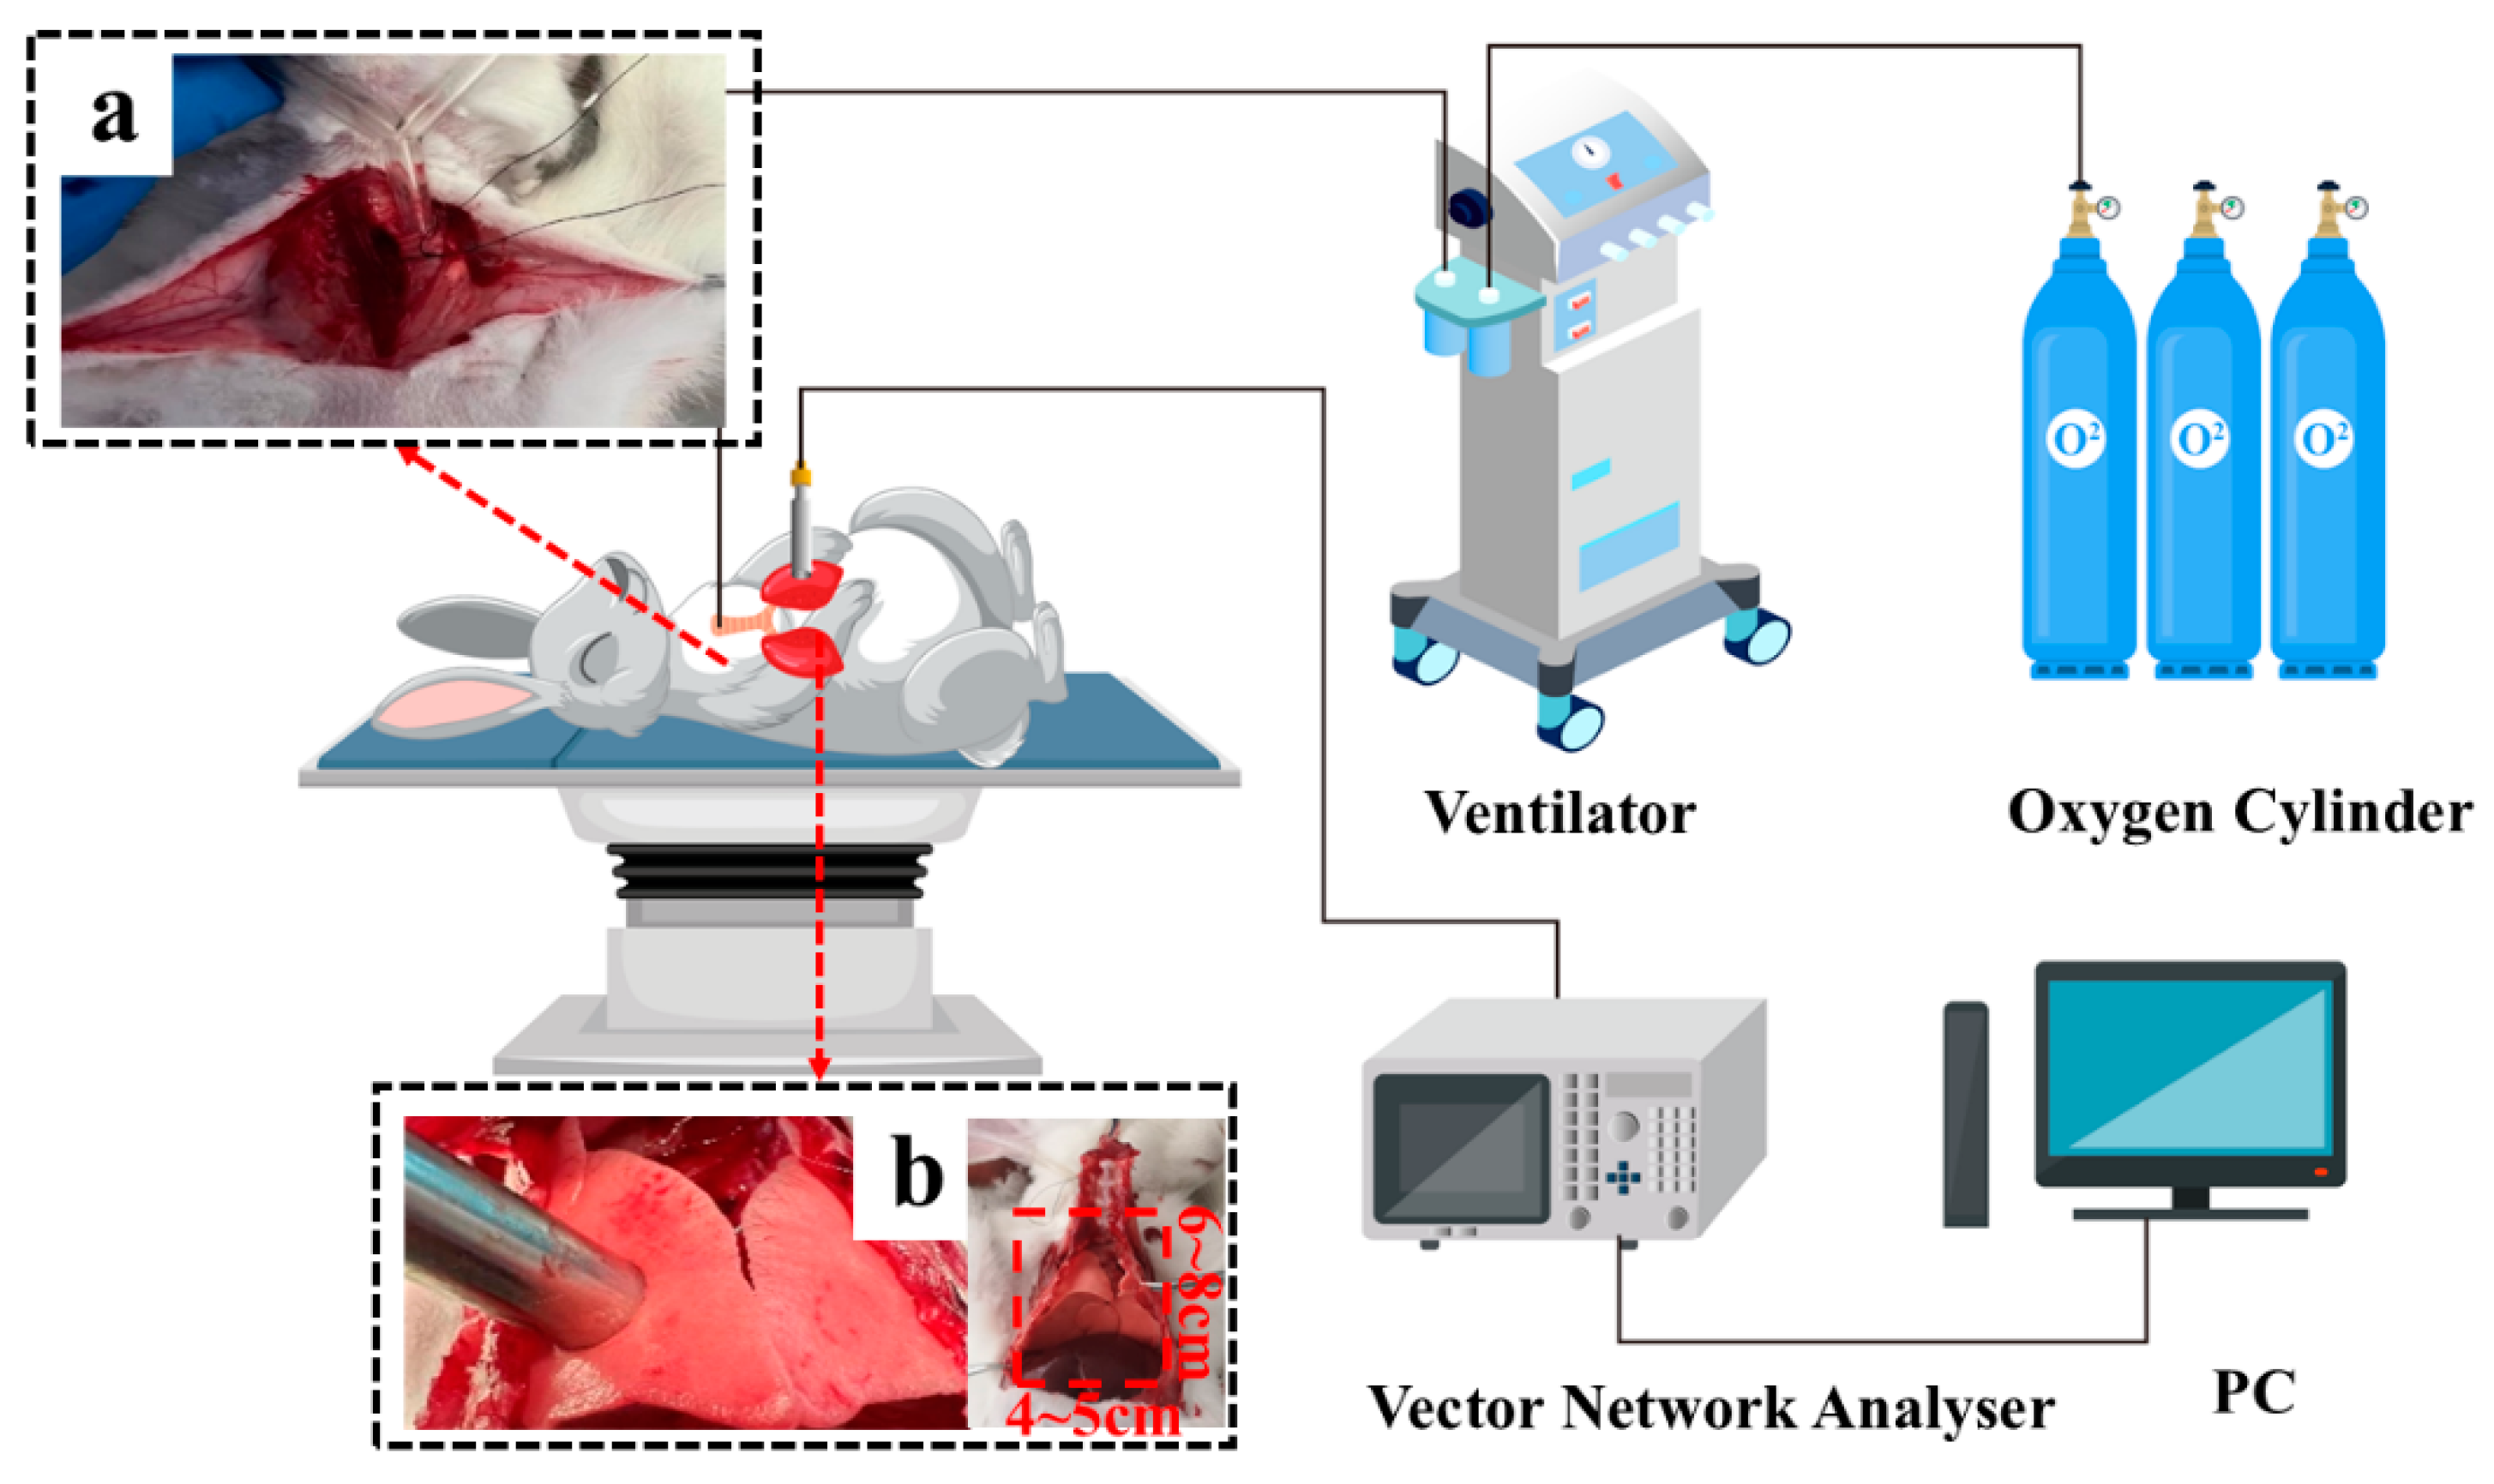
Figure 3.
Relative error of (a) conductivity (b) permittivity. Black solid line: 0.0015mol/L NaCl solution measurements; red solid line: 0.0008mol/L NaCl solution measurements.
Figure 3.
Relative error of (a) conductivity (b) permittivity. Black solid line: 0.0015mol/L NaCl solution measurements; red solid line: 0.0008mol/L NaCl solution measurements.
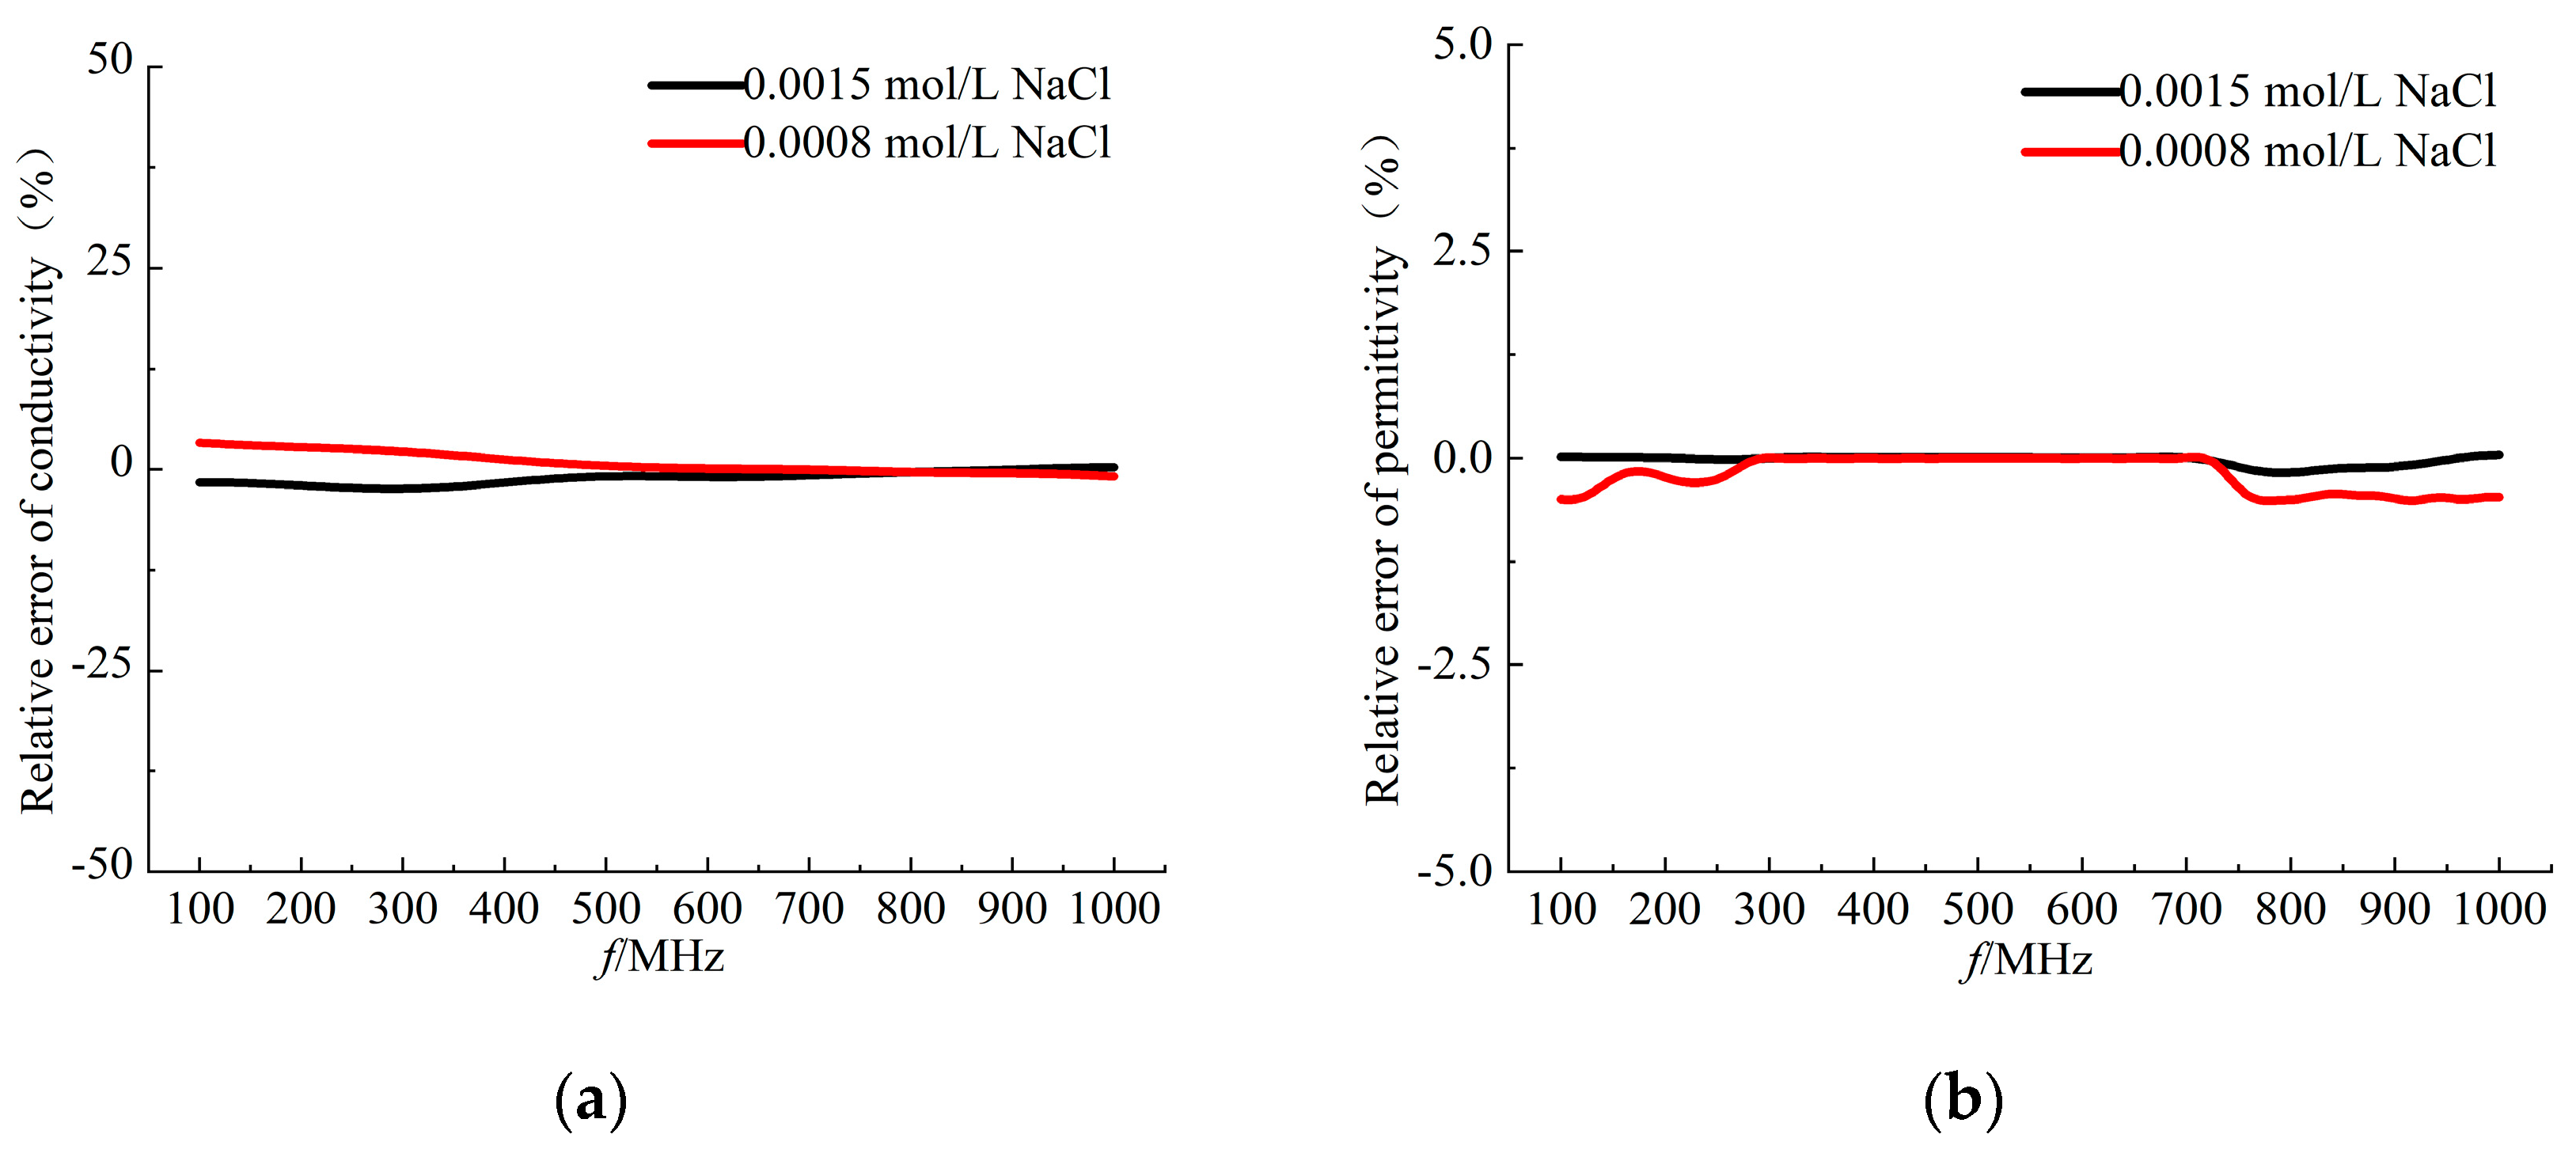
Figure 4.
Cole-Cole fitted curves of (a) the real part of the complex permittivity and (b) the imaginary part of the complex permittivity as a function of frequency. Black solid line: measured data of isolated liver; red dashed line: fitted data of isolated liver.
Figure 4.
Cole-Cole fitted curves of (a) the real part of the complex permittivity and (b) the imaginary part of the complex permittivity as a function of frequency. Black solid line: measured data of isolated liver; red dashed line: fitted data of isolated liver.
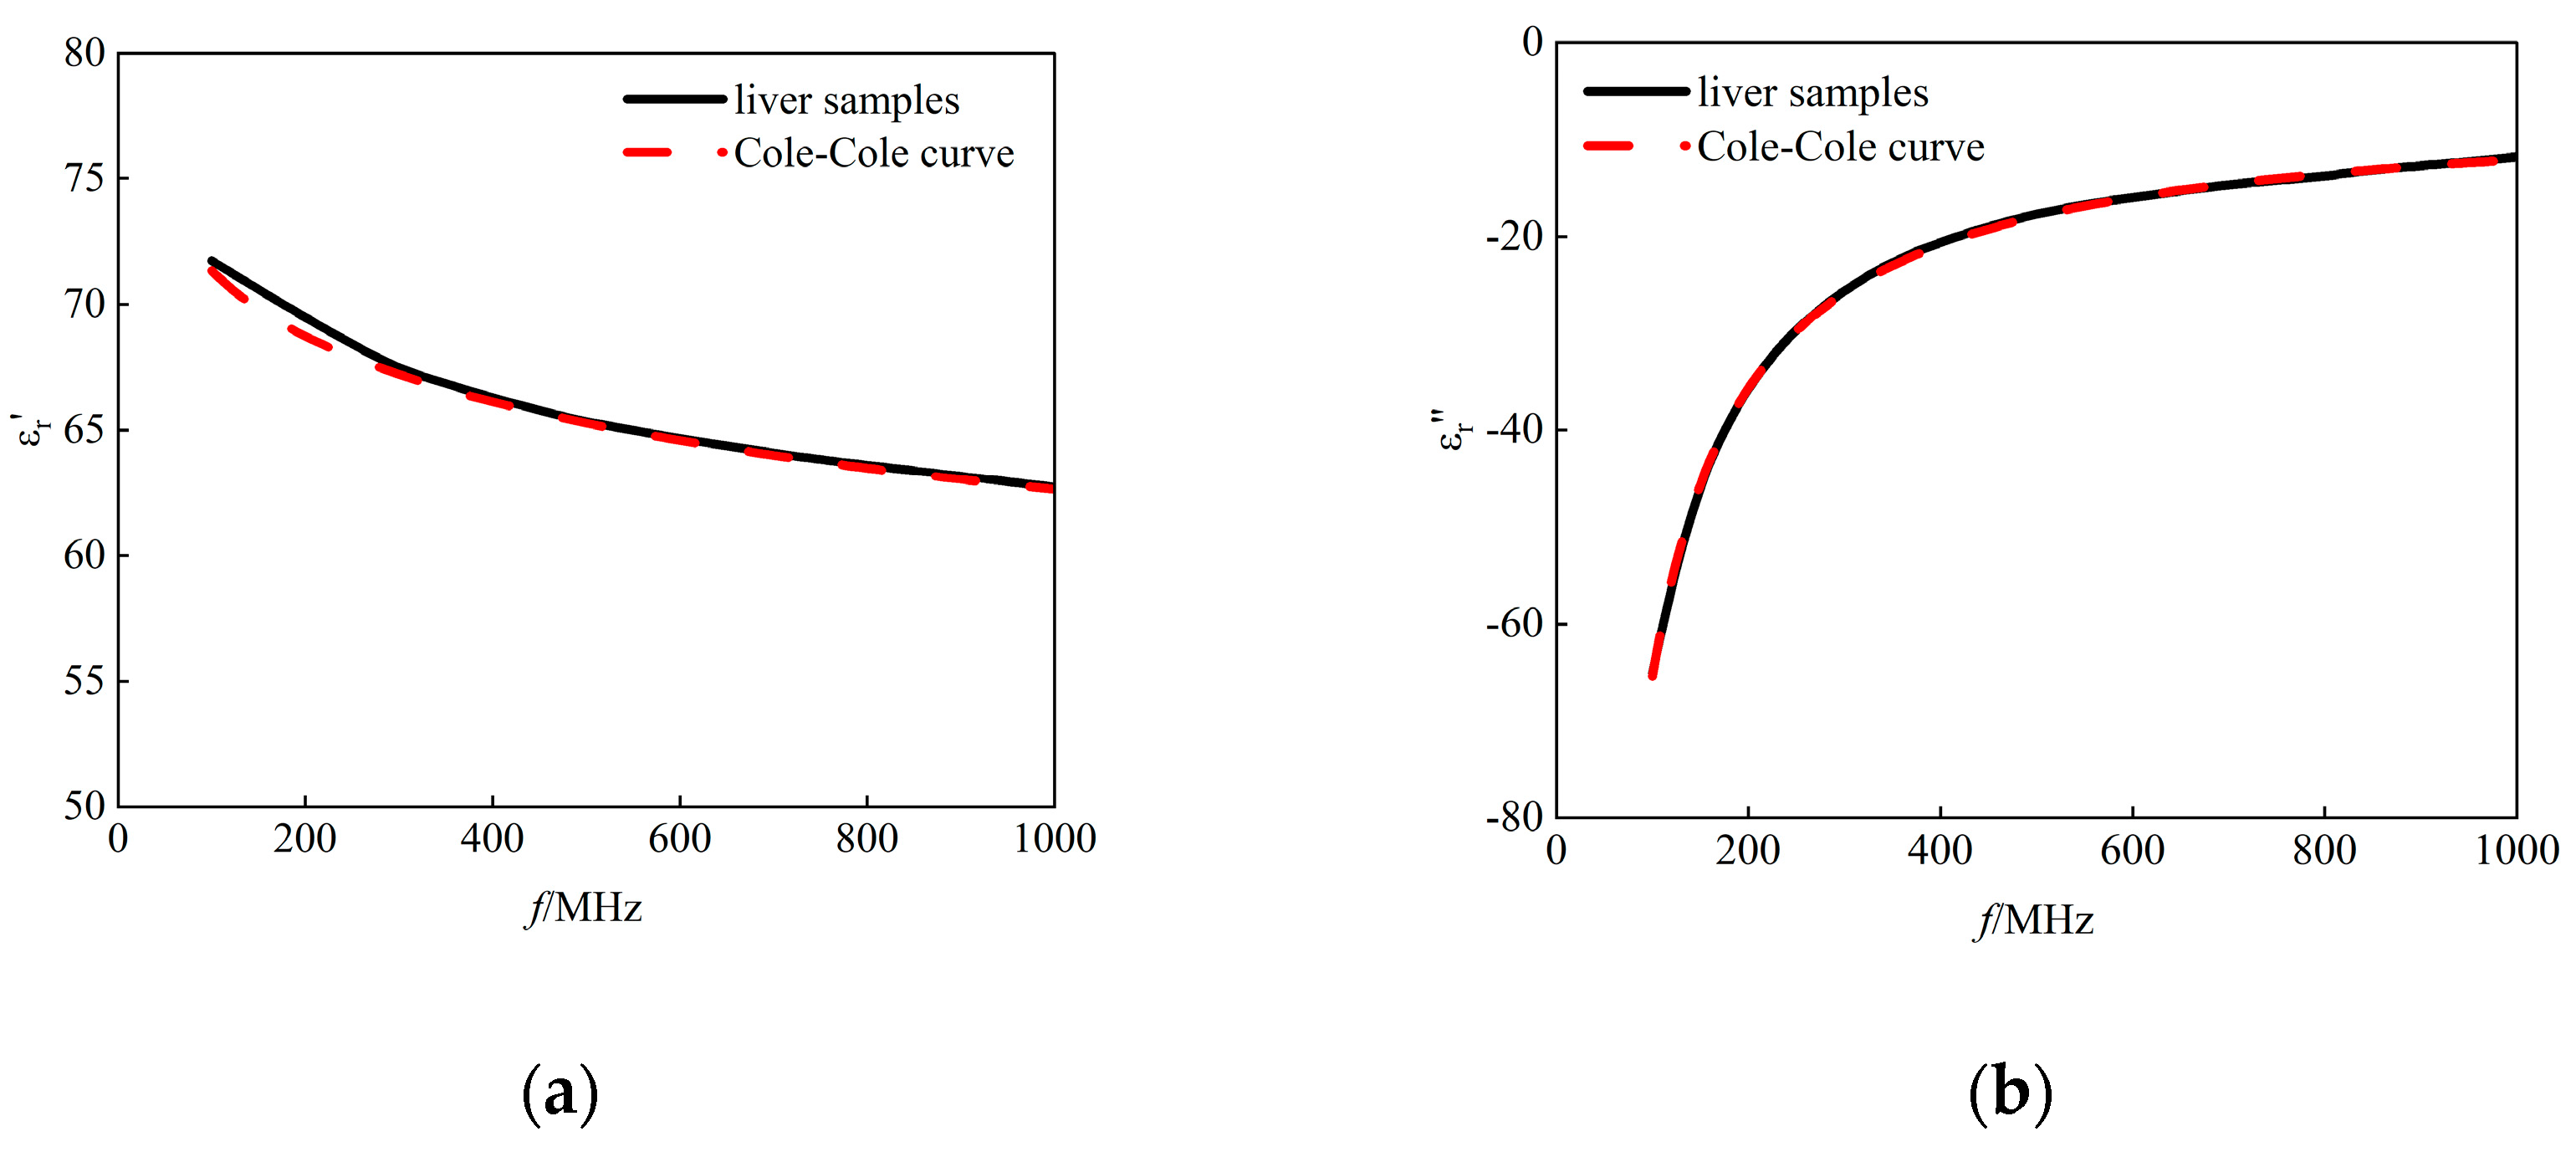
Figure 5.
In measurements of the left lung lobe of the rabbits, each measurement point was repeated three times. Experimental results on the variation of (a)(c) conductivity (b)(d) permittivity with 6 sets of tidal volumes (30 ml, 40 ml, 50 ml, 60 ml, 70 ml, 80 ml respectively). Black box: data distribution of the dielectric properties of lung tissue measured at 433 MHz; Red box: data distribution of the dielectric properties of lung tissue measured at 915 MHz.
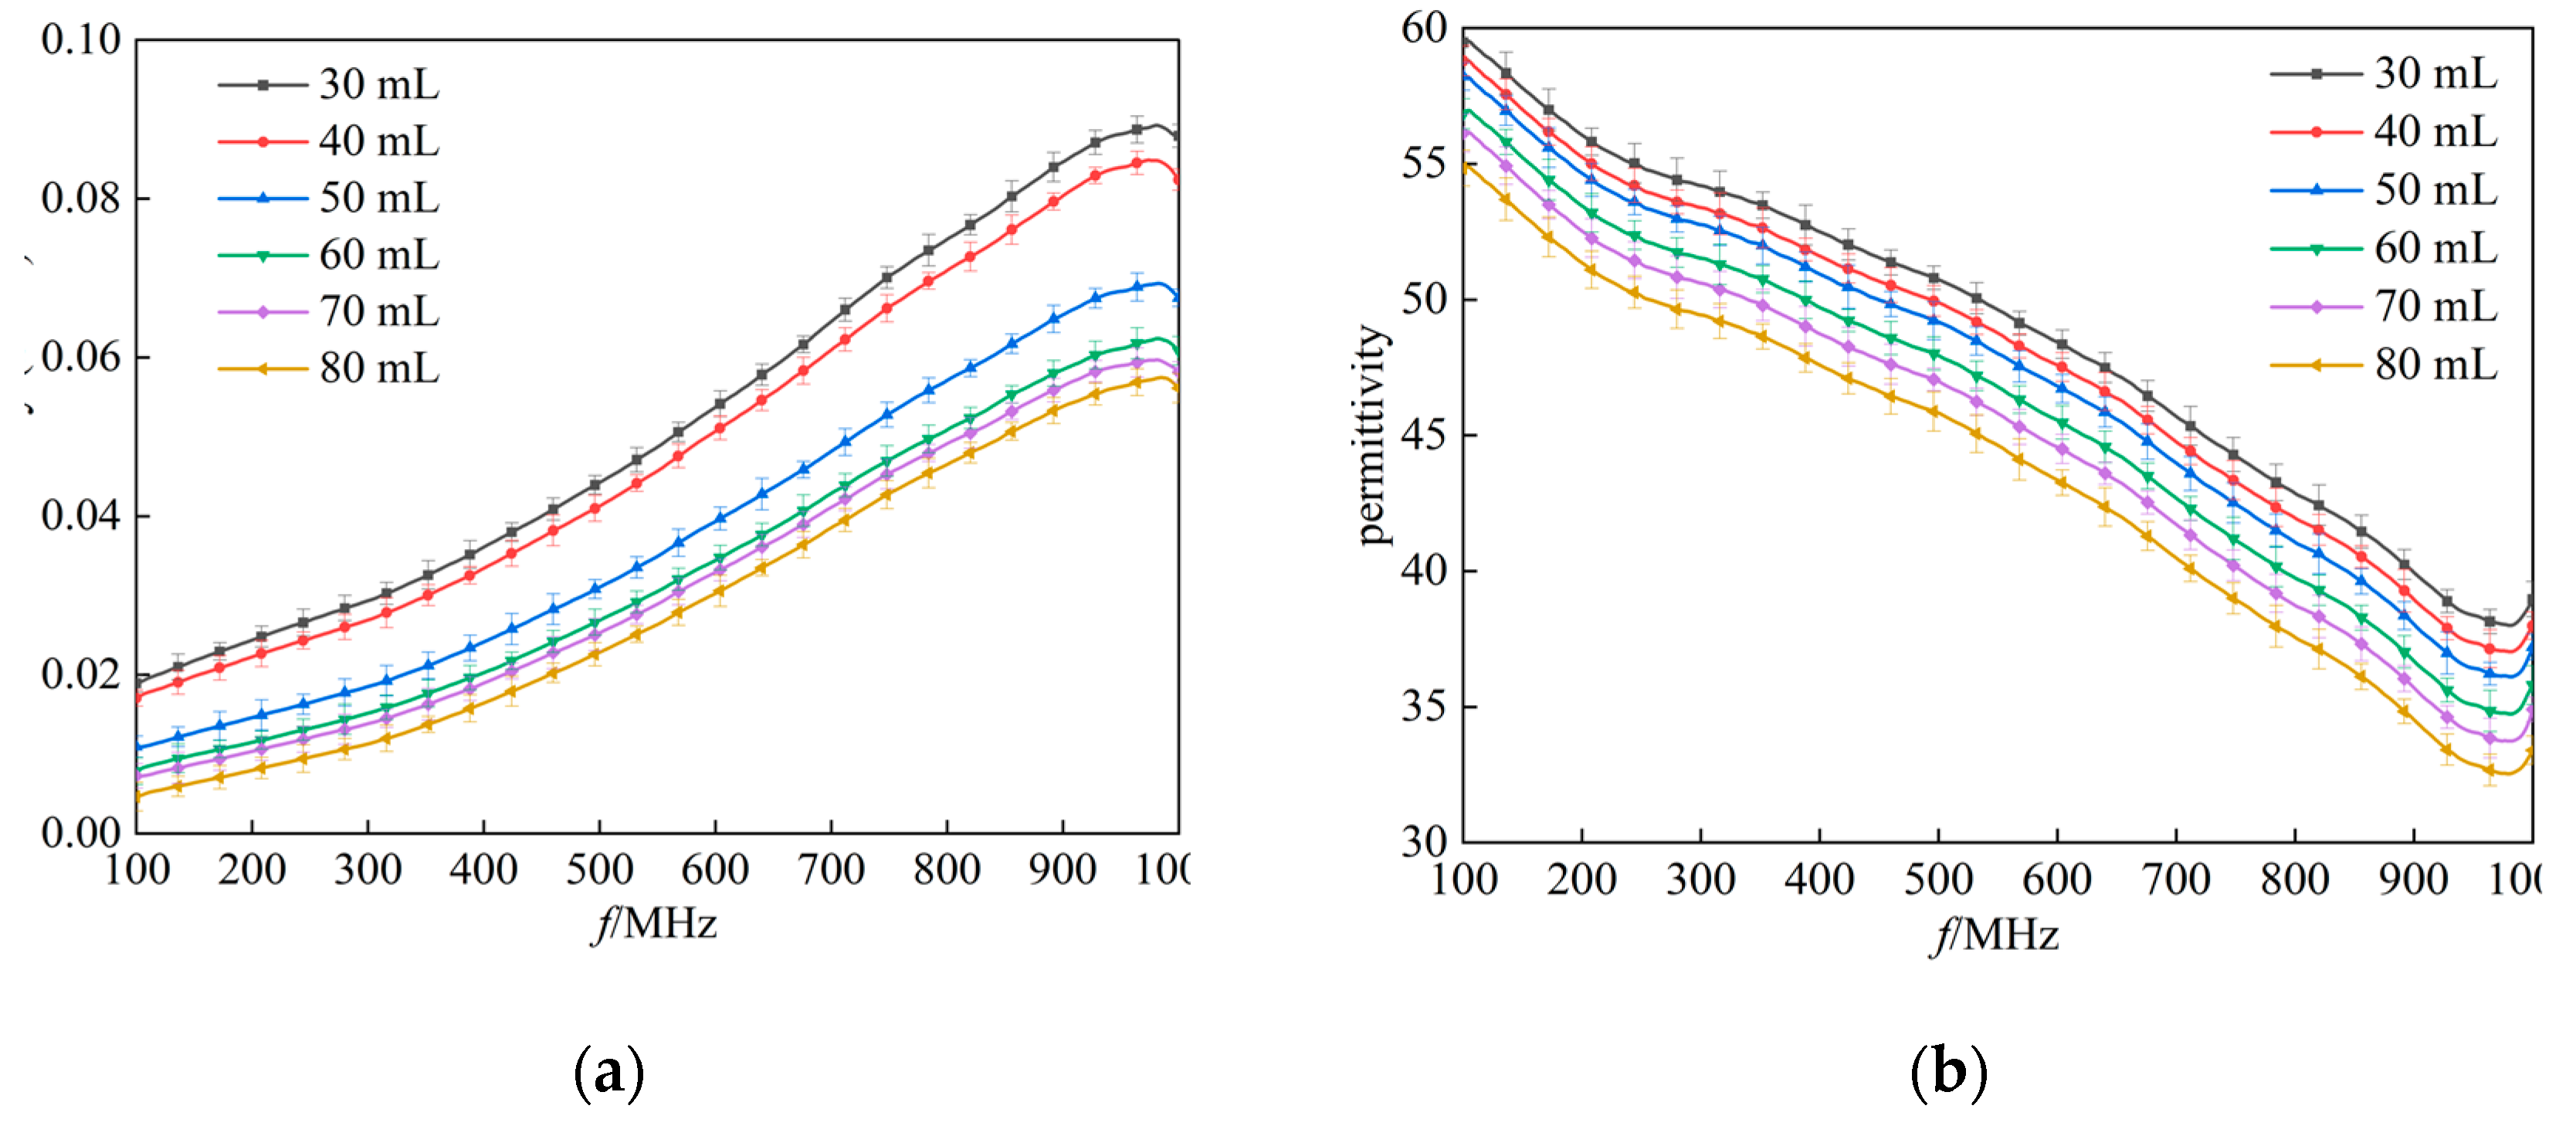
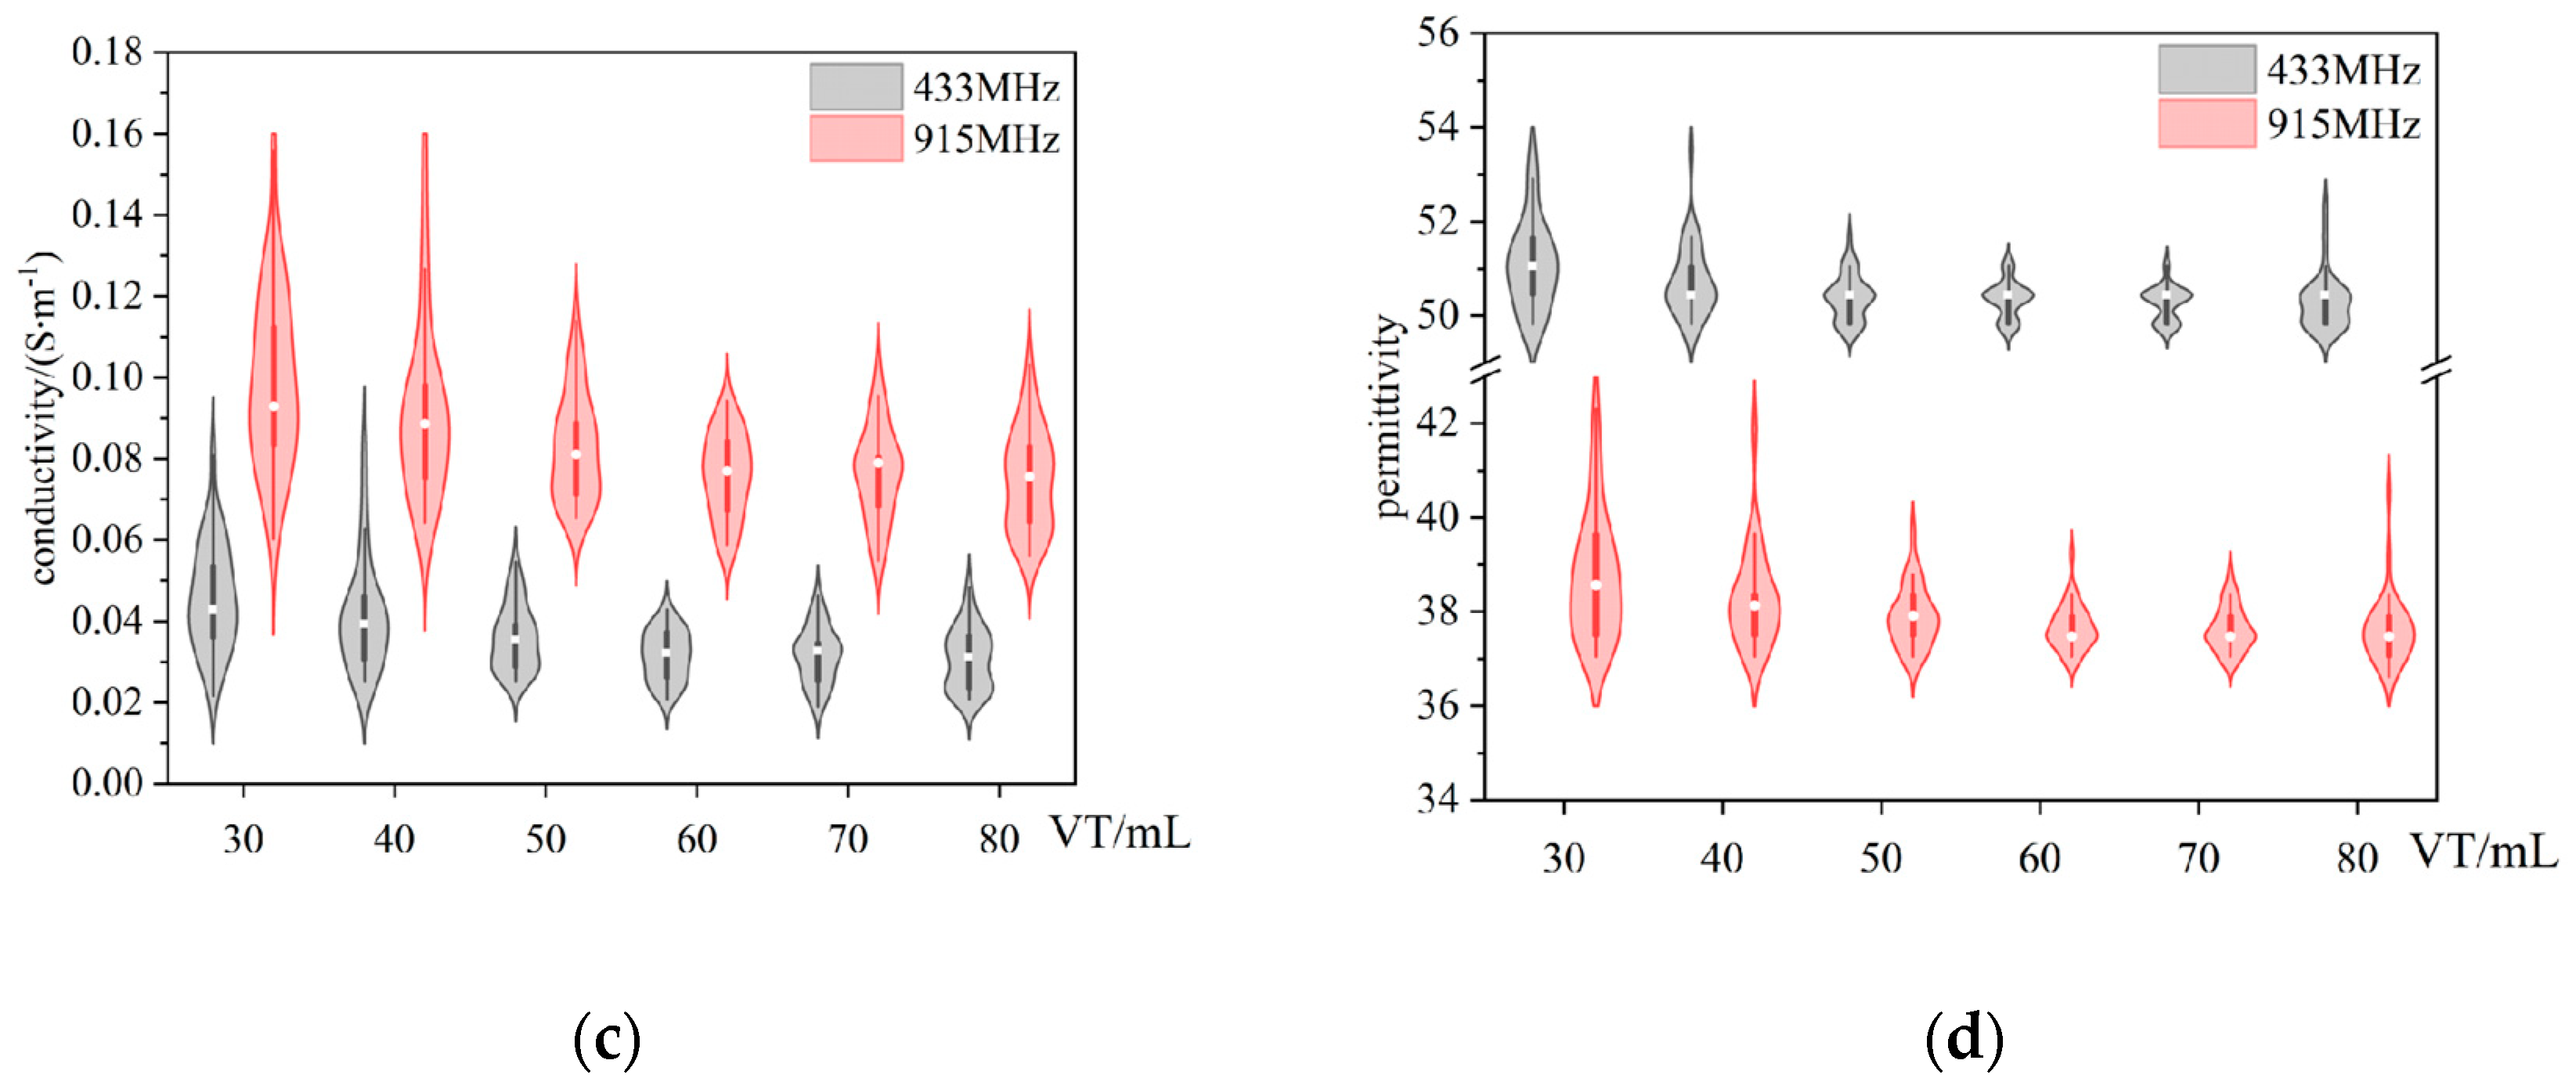
Figure 6.
Cole-Cole fitted curves of (a) the real part of the complex permittivity and (b) the imaginary part of the complex permittivity as a function of frequency. Red solid line: measured data for tidal volume of 80 mL lungs; red dashed line: fitted data for tidal volume of 80 mL lungs; black solid line: measured data for tidal volume of 30 mL lungs; black dashed line: fitted data for tidal volume of 30 mL lungs.
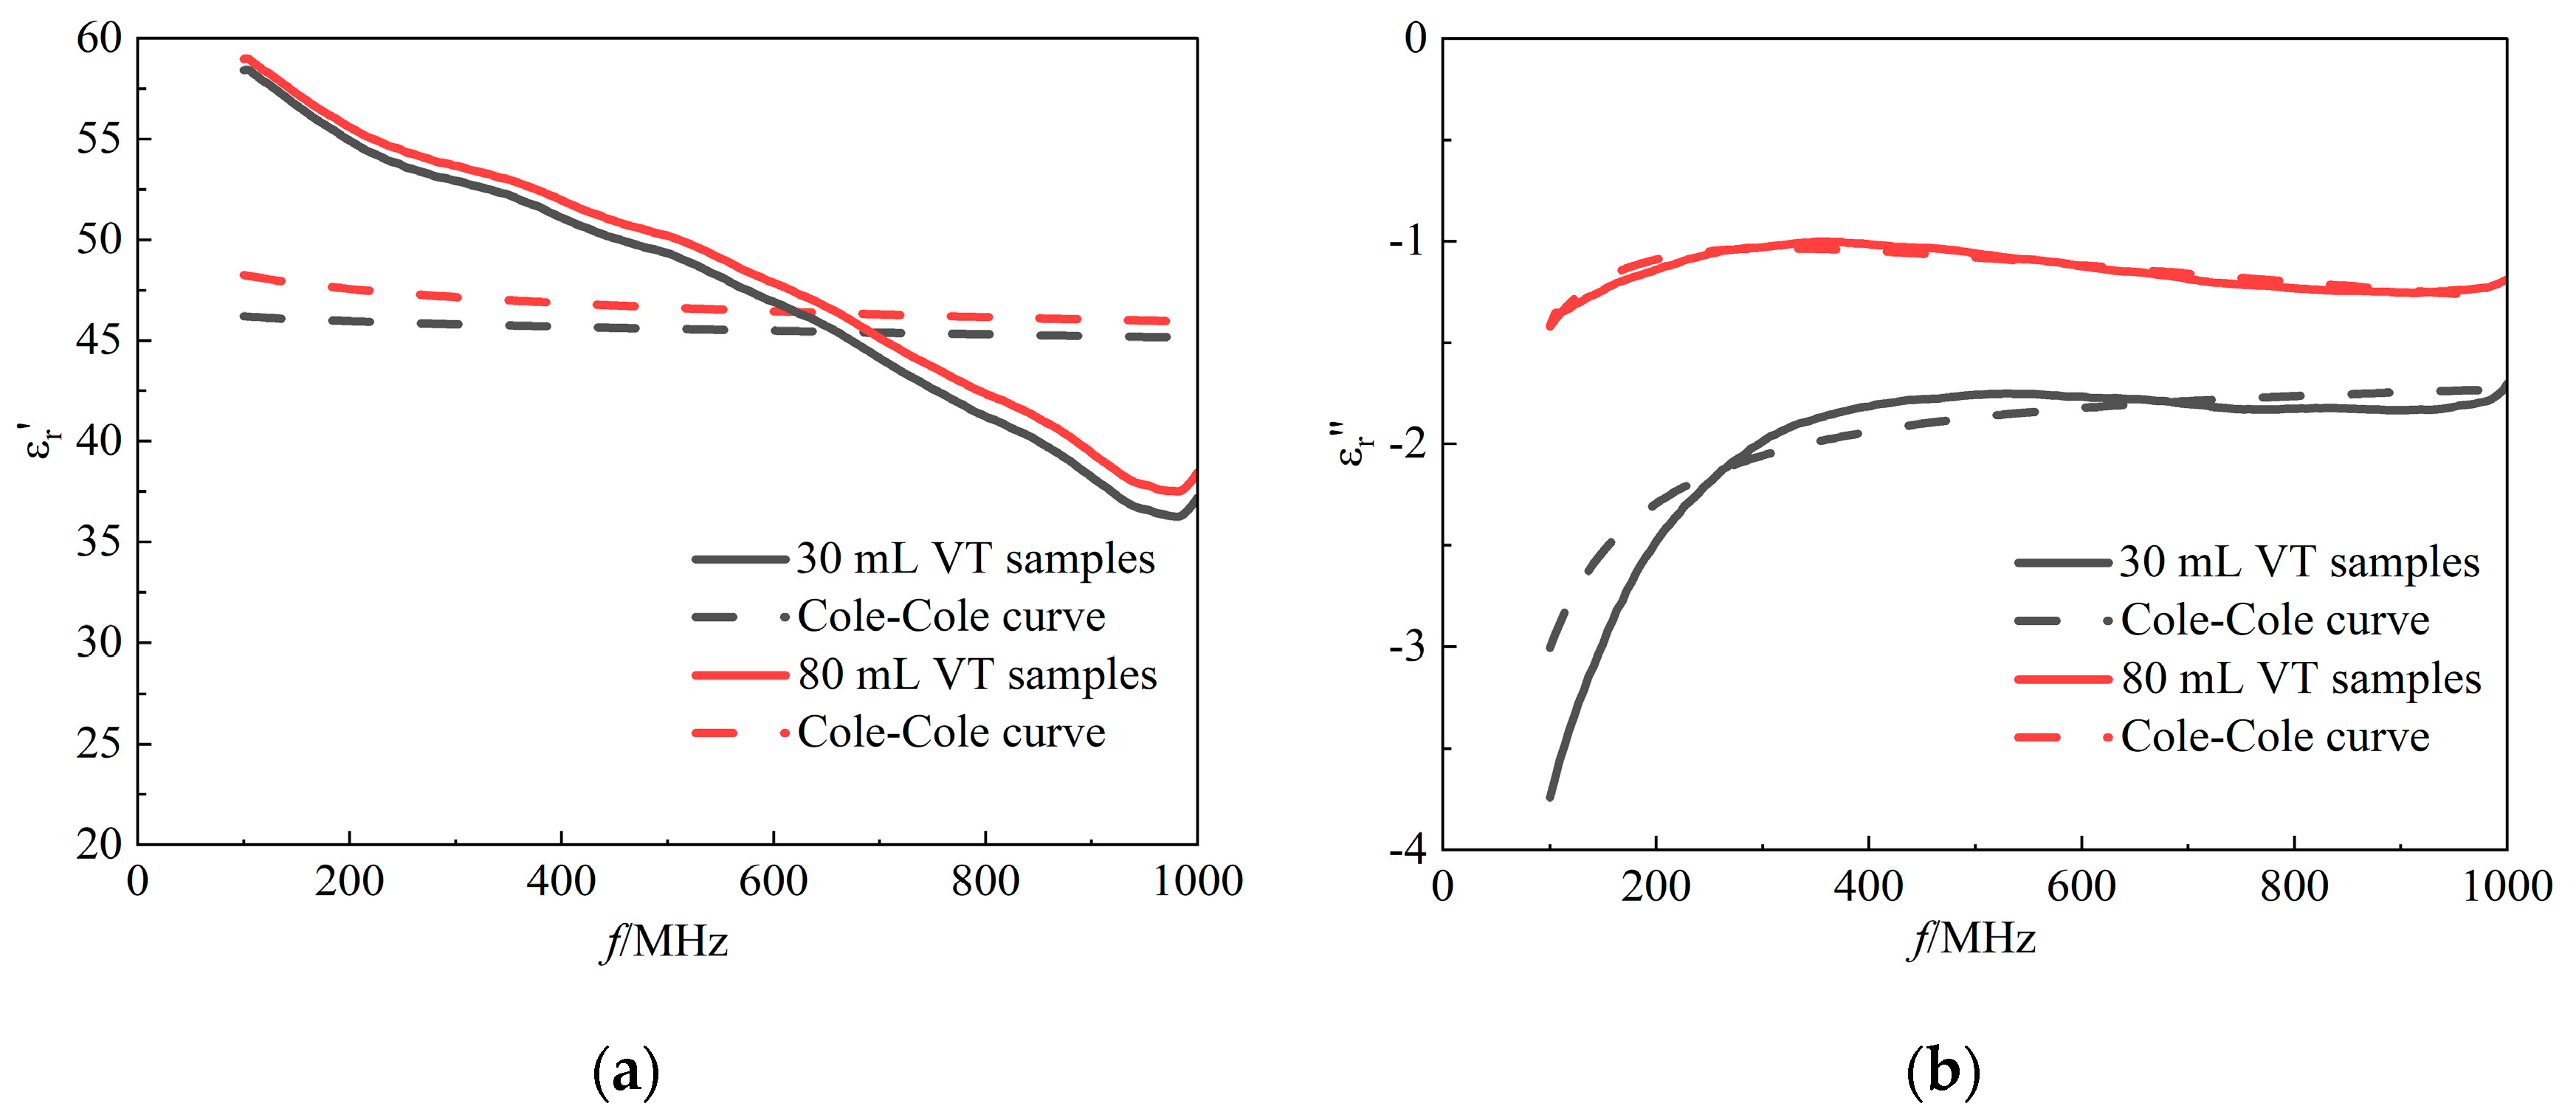
Figure 7.
The improved model fitted curves of (a) the real part of the complex permittivity and (b) the imaginary part of the complex permittivity as a function of frequency. Red solid line: measured data for tidal volume of 80 mL lungs; red dashed line: fitted data for tidal volume of 80 mL lungs; black solid line: measured data for tidal volume of 30 mL lungs; black dashed line: fitted data for tidal volume of 30 mL lungs.
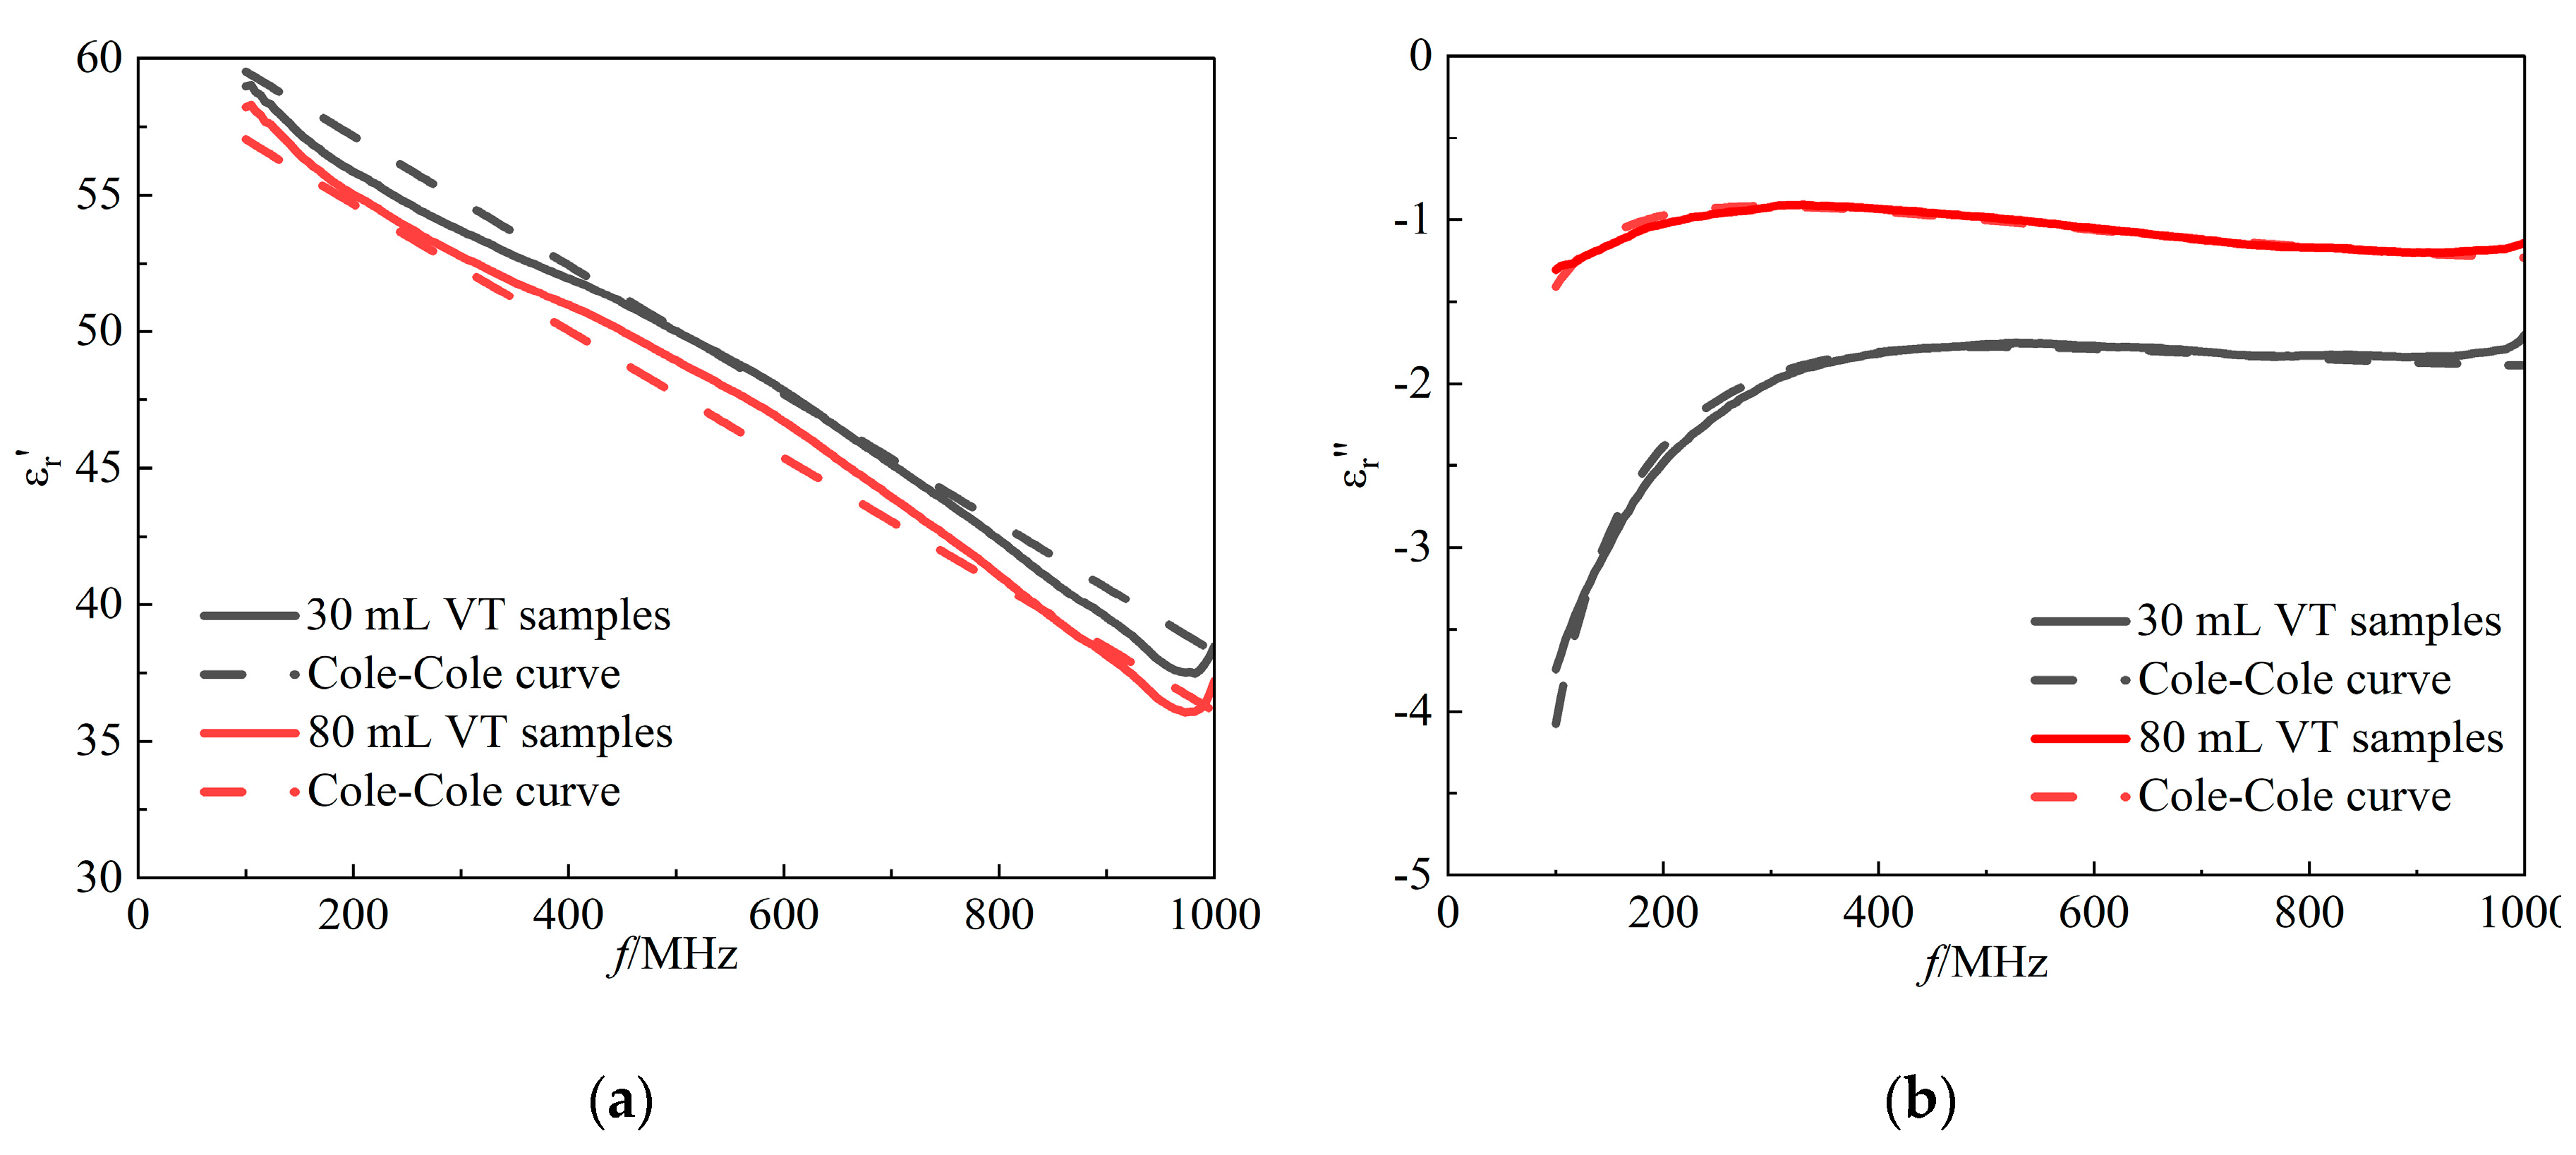
Figure 8.
Single-frequency point-fit curve of (a) the first permittivity ∆ε1 (b) the static conductivity σs.
Figure 8.
Single-frequency point-fit curve of (a) the first permittivity ∆ε1 (b) the static conductivity σs.
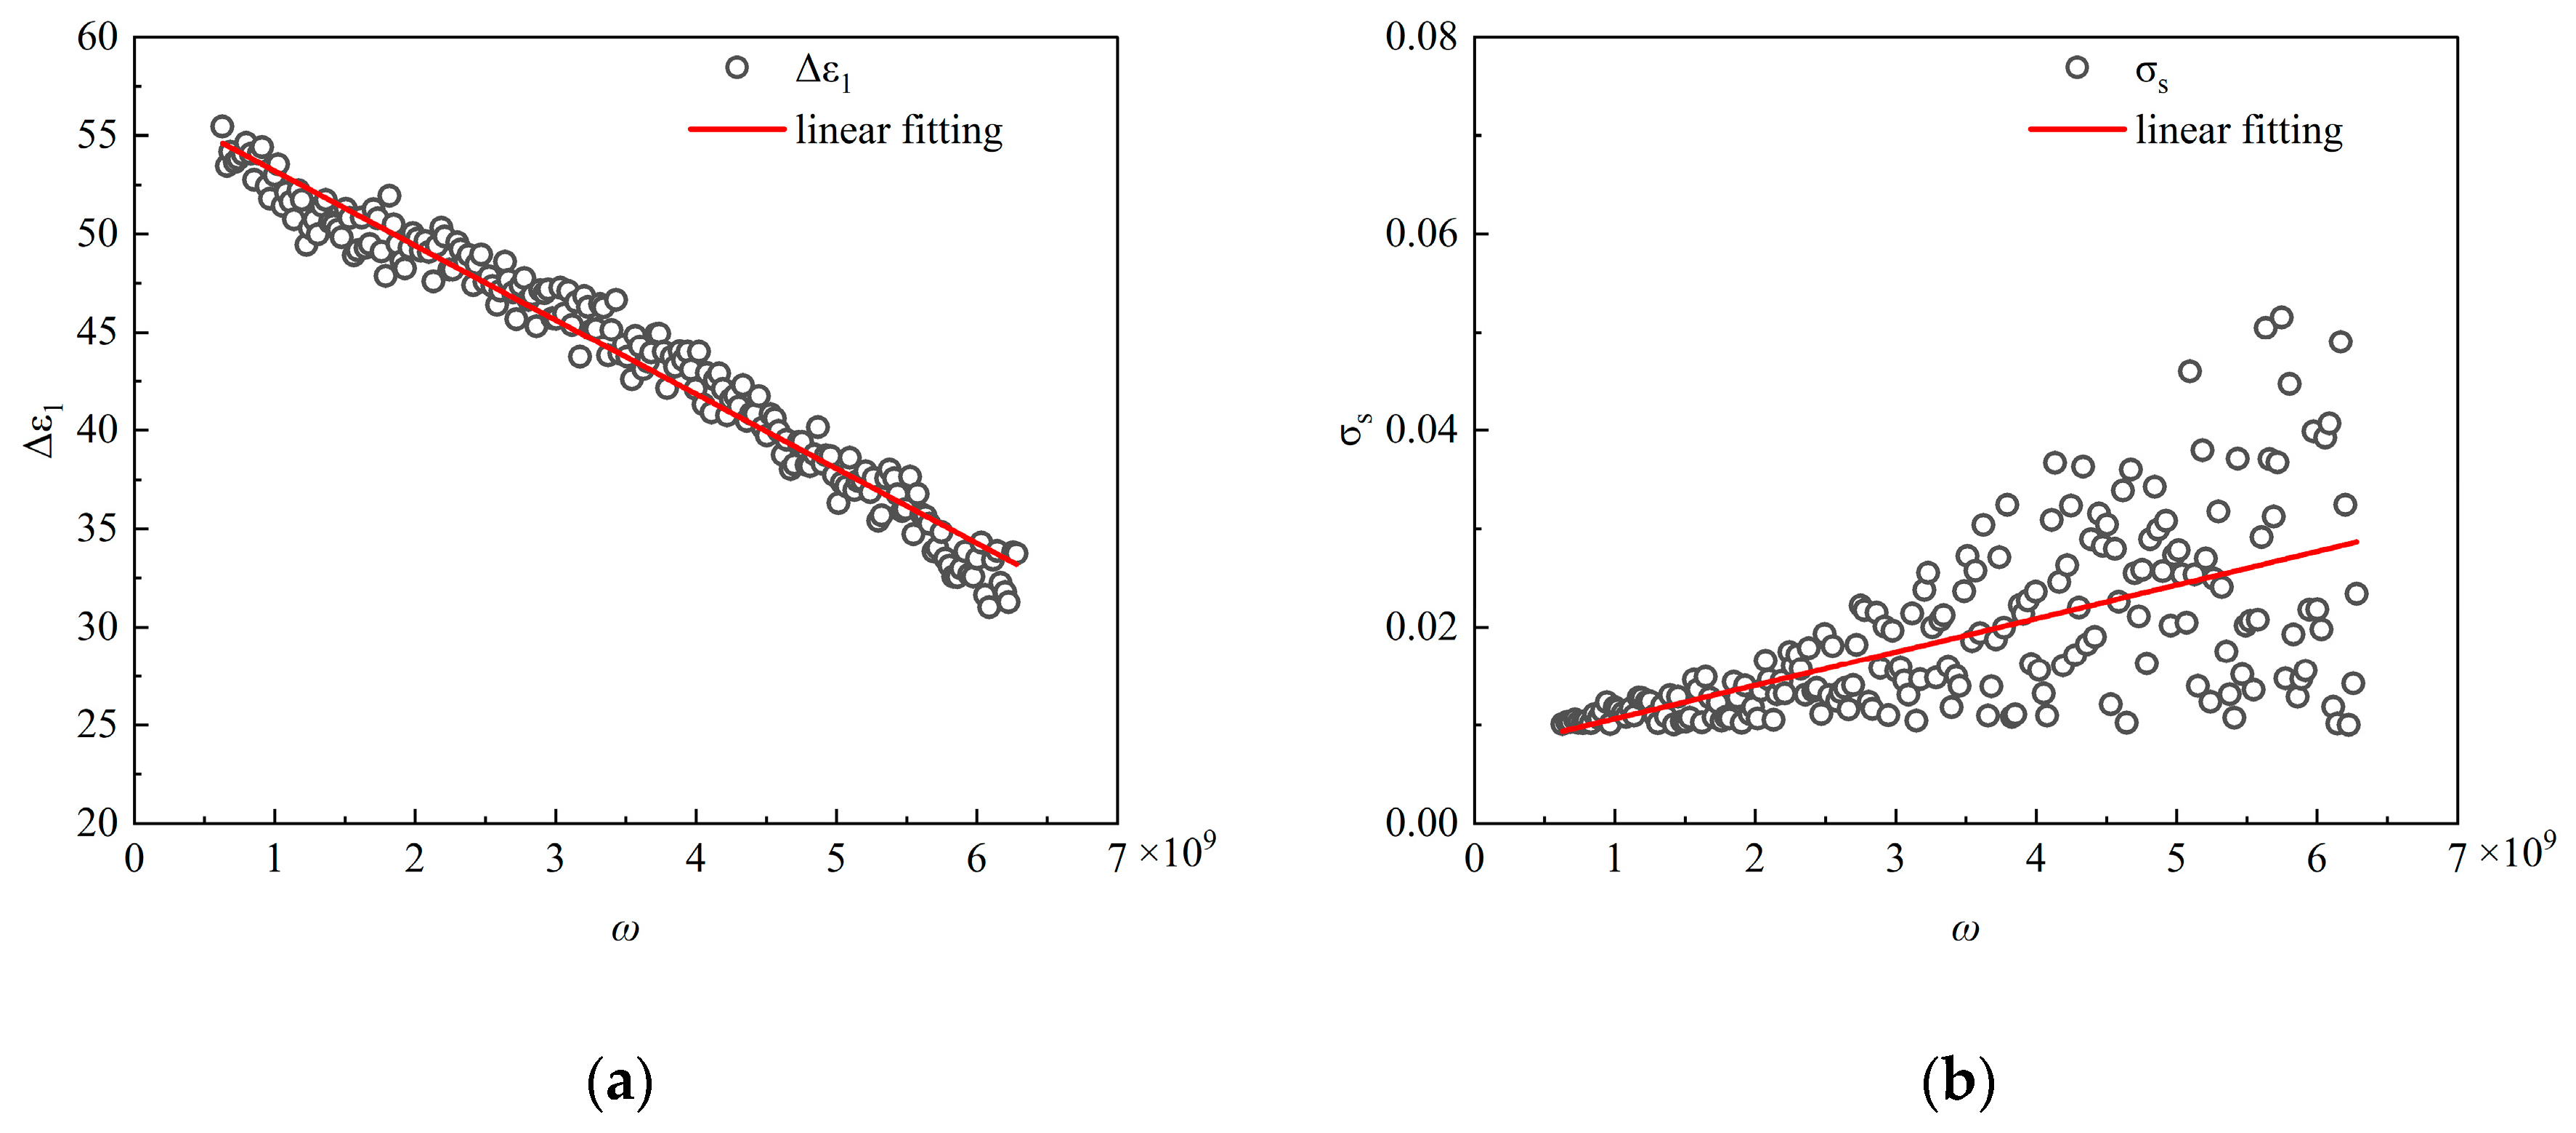
Figure 9.
The improved model fitted curves of (a) the real part of the complex permittivity and (b) the imaginary part of the complex permittivity considering kk relationship. Red solid line: measured data for tidal volume of 80 mL lungs; red dashed line: fitted data for tidal volume of 80 mL lungs; black solid line: measured data for tidal volume of 30 mL lungs; black dashed line: fitted data for tidal volume of 30 mL lungs.
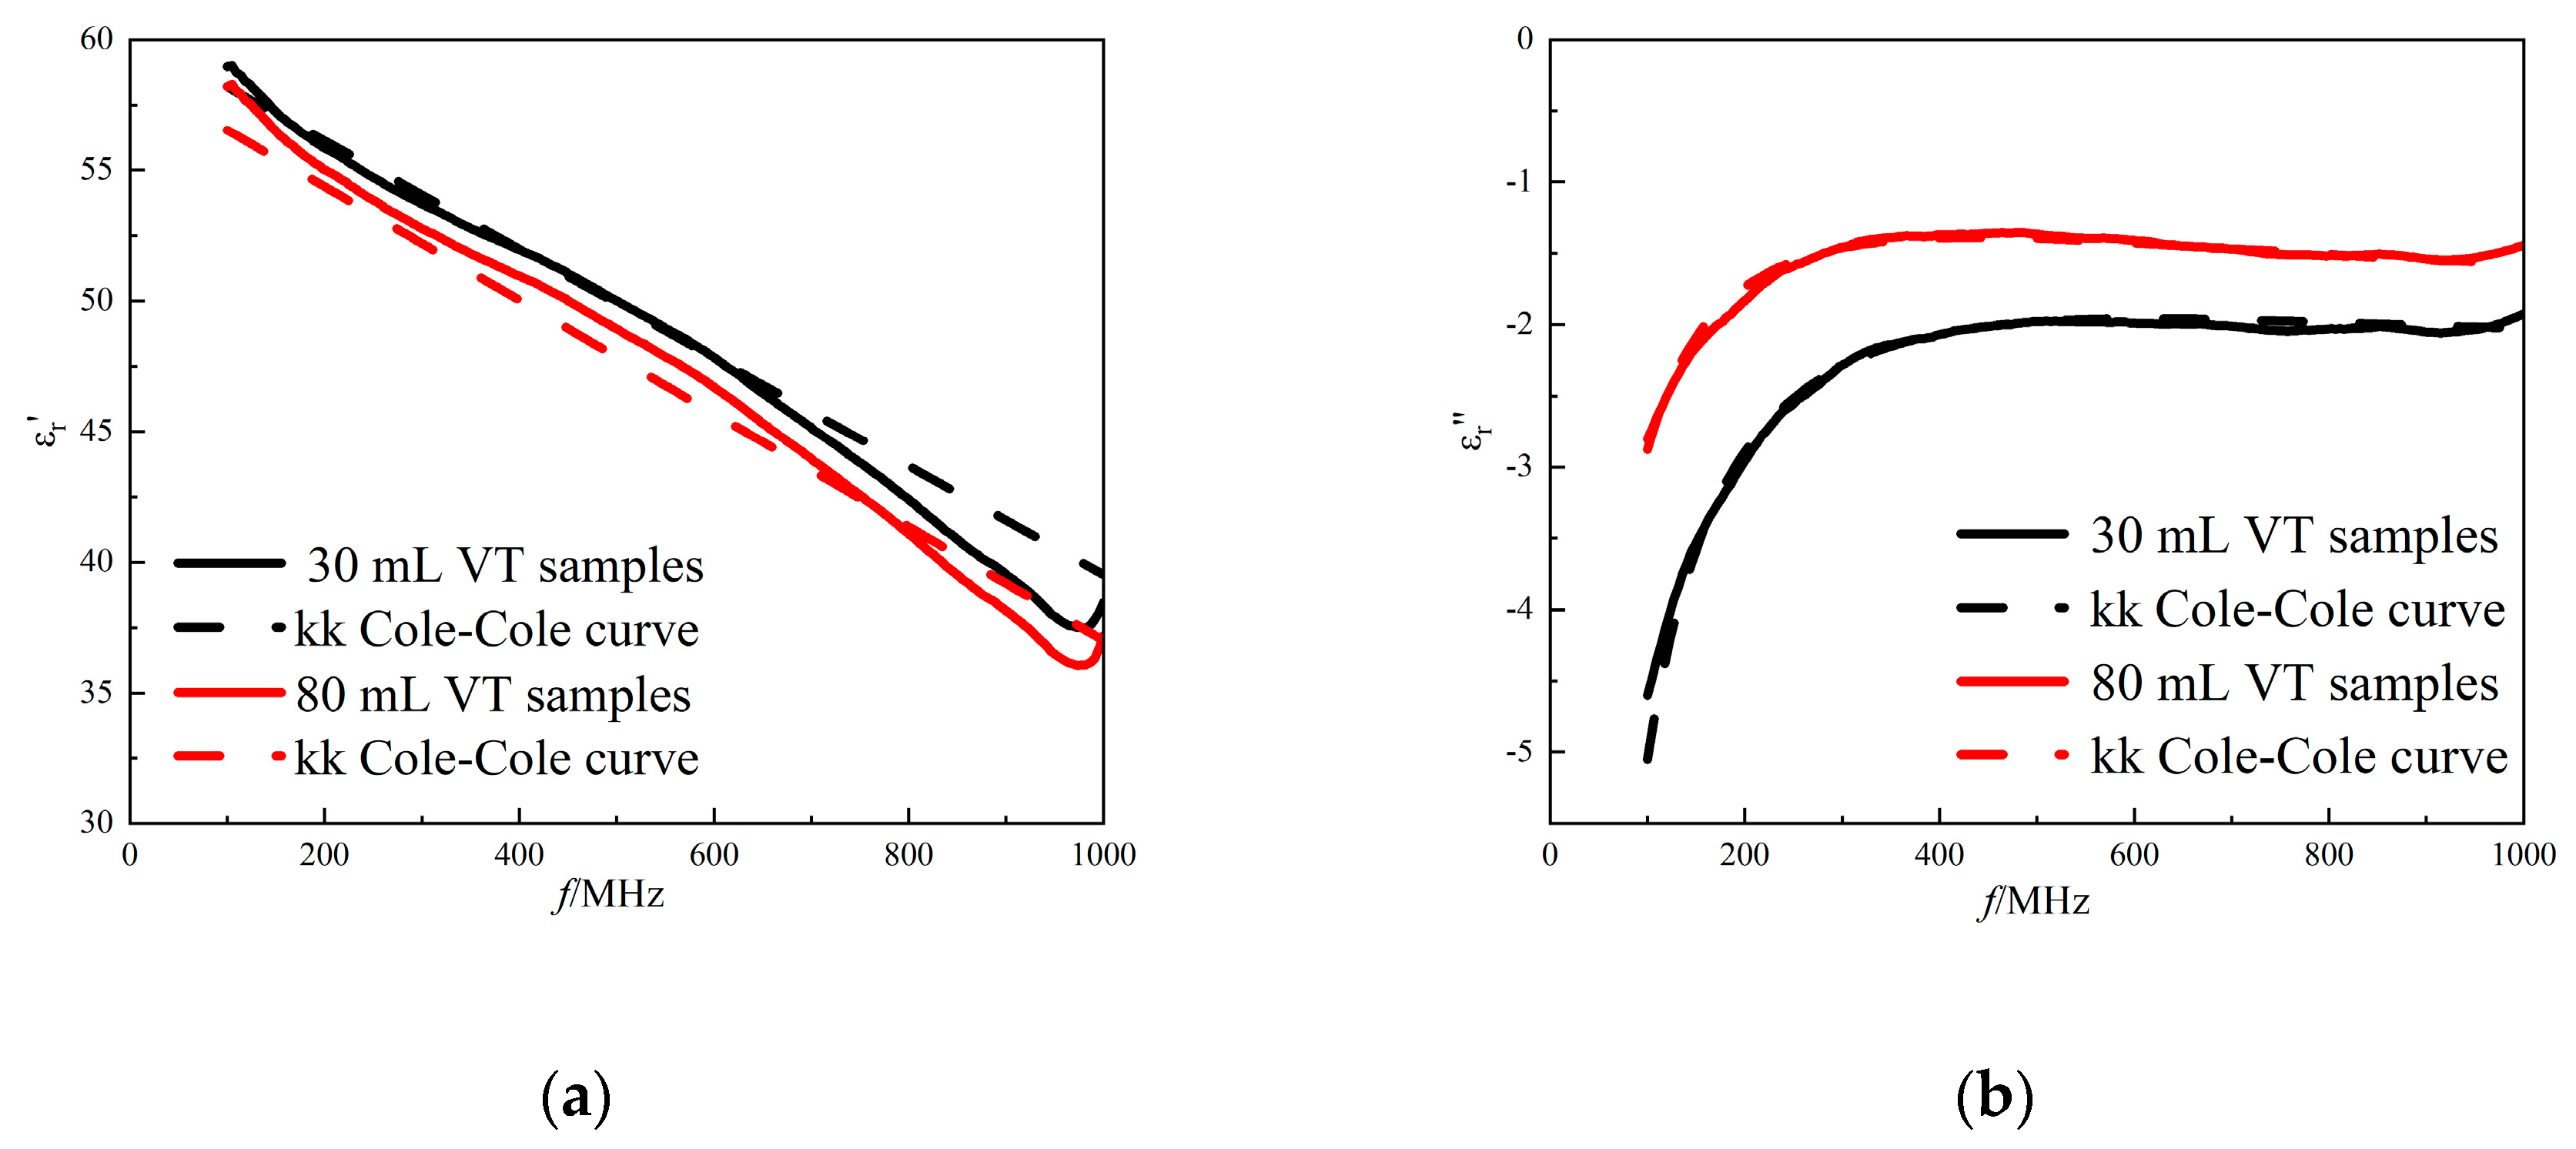
Figure 10.
All lung dielectric properties references. The comparison of real(a) and imaginary(b) parts of the complex permittivities.
Figure 10.
All lung dielectric properties references. The comparison of real(a) and imaginary(b) parts of the complex permittivities.
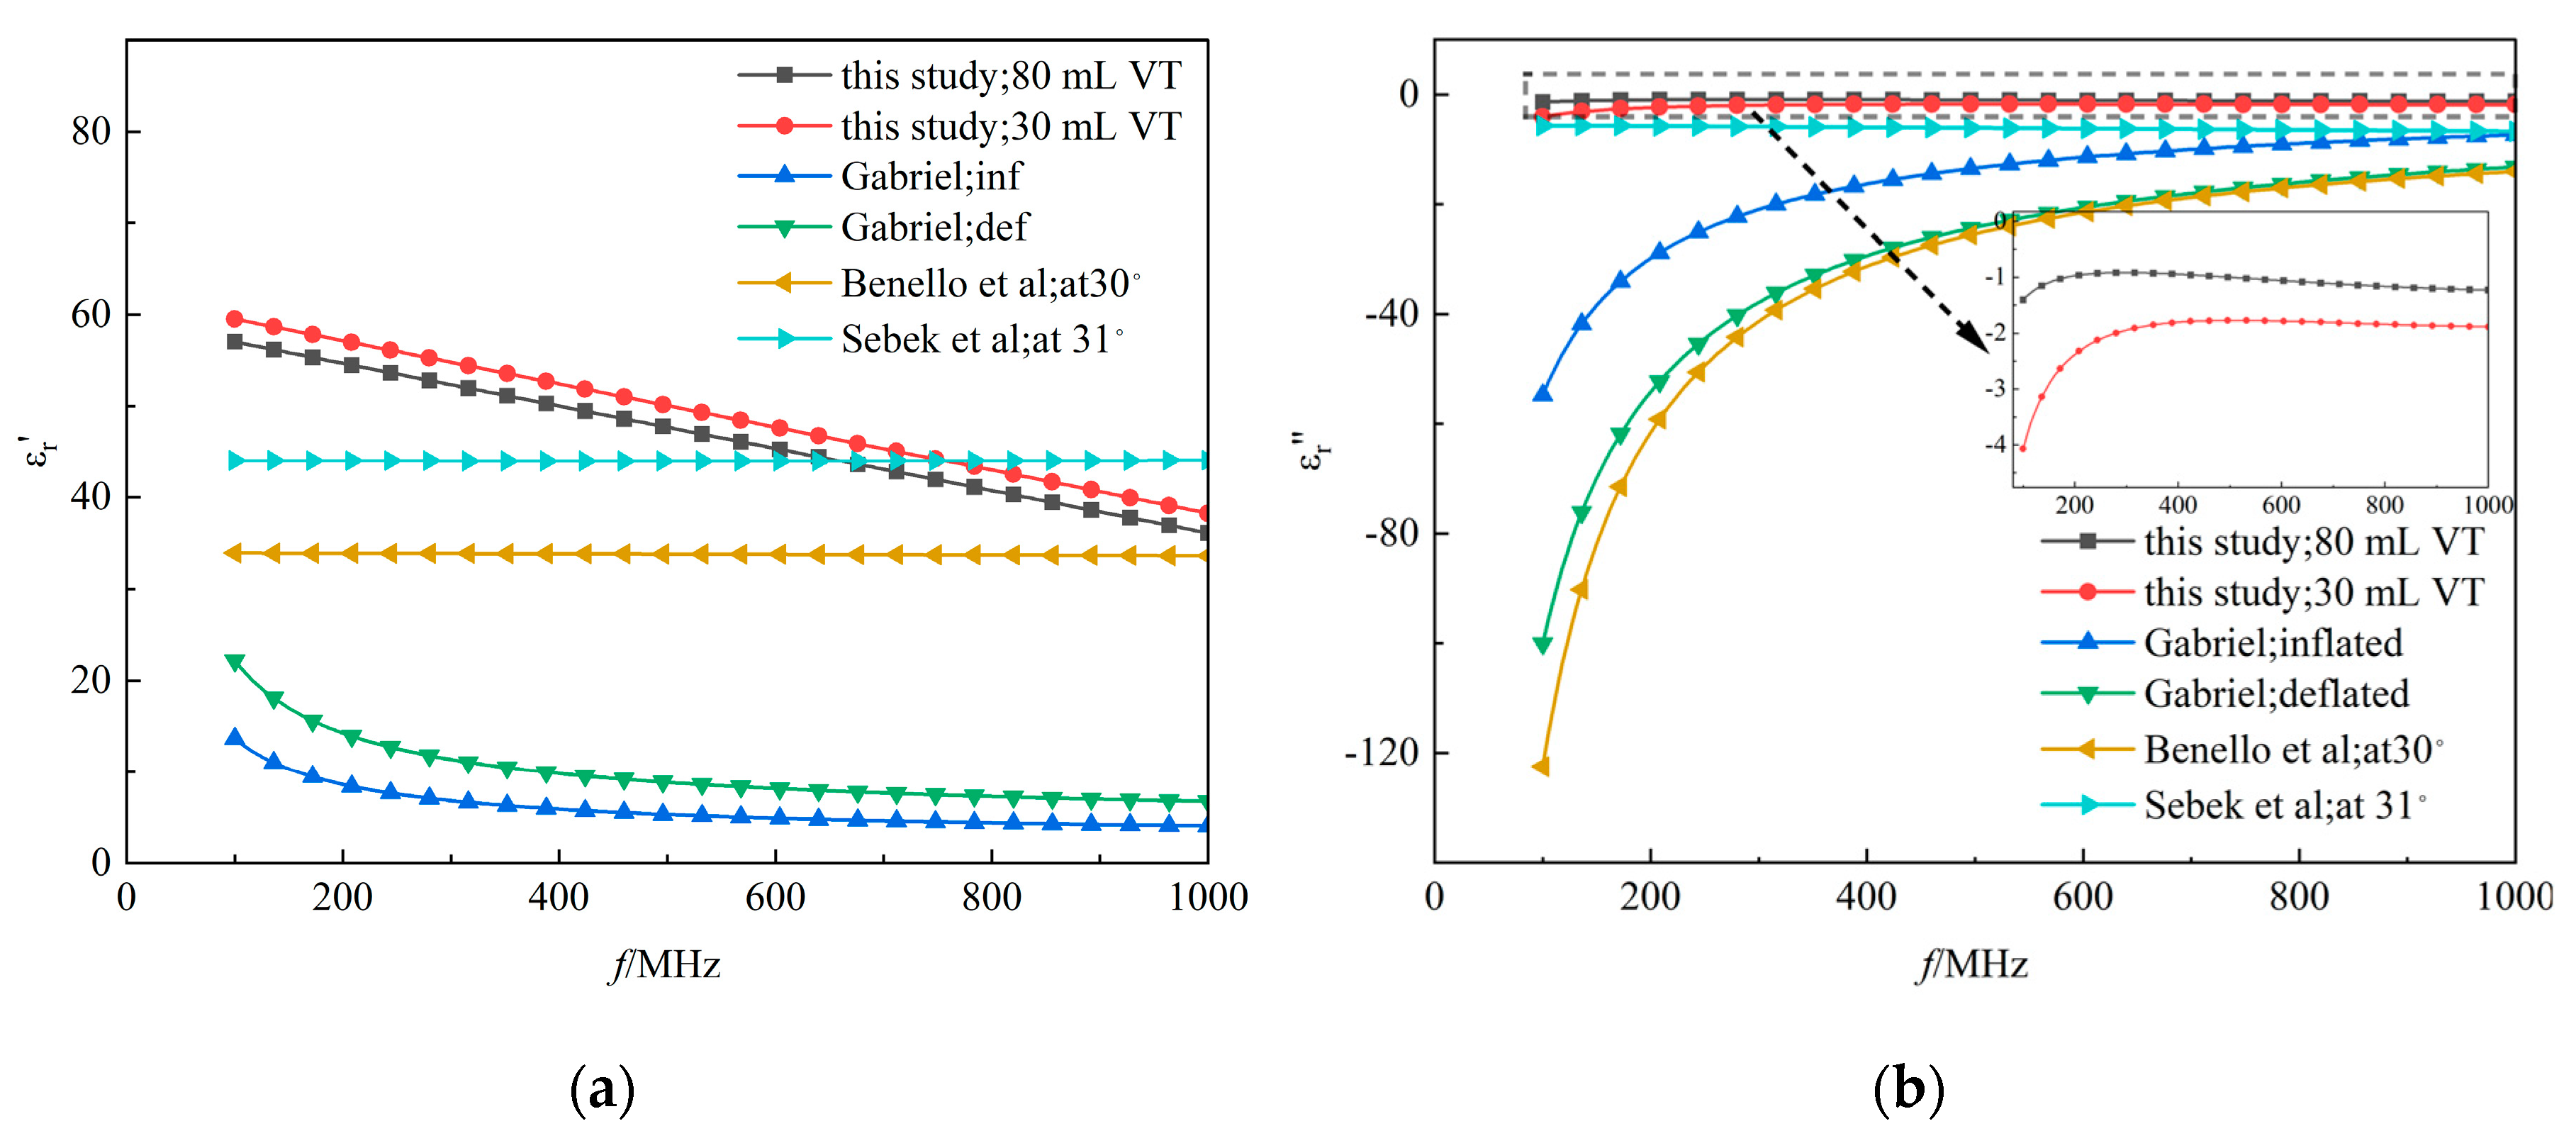

Table 1.
Cole-Cole fitted curves of lung tissue.
| VT(mL) | R21(real part) | R22(imaginary part) | |
| 30 | 12.49% | 0.111 | 0.812 |
| 40 | 15.04% | 0.123 | 0.542 |
| 50 | 14.47% | 0.069 | 0.739 |
| 60 | 15.95% | 0.050 | 0.147 |
| 70 | 15.71% | 0.112 | 0.350 |
| 80 | 12.54% | 0.010 | 0.867 |
Table 2.
Improved fitting curves of lung tissue.
| VT(mL) | R21(real part) | R22(imaginary part) | |
| 30 | 2.69% | 0.975 | 0.977 |
| 40 | 2.78% | 0.972 | 0.983 |
| 50 | 3.30% | 0.960 | 0.968 |
| 60 | 3.46% | 0.948 | 0.960 |
| 70 | 3.94% | 0.929 | 0.960 |
| 80 | 3.32% | 0.977 | 0.904 |
Table 3.
Improved result of lung tissue fitting parameters.
| Parameter VT(mL) | 30 | 40 | 50 | 60 | 70 | 80 |
|---|---|---|---|---|---|---|
| ε∞ | 3.05 | 4.14 | 4.02 | 4.37 | 3.51 | 2.33 |
| ∆ε1 | 58.81 | 57.48 | 59.55 | 59.61 | 59.27 | 56.96 |
| τ1(ps) | 6.74 | 7.04 | 6.57 | 6.01 | 5.71 | 5.00 |
| α1 | 0 | 0 | 0 | 0 | 0 | 0 |
| ∆ε2 | 1879.82 | 116.28 | 1077.62 | 1012.50 | 18.60 | 18.28 |
| τ2(ns) | 799.99 | 52.78 | 589.83 | 6.90 | 11.98 | 269.80 |
| α2 | 0 | 0 | 0 | 0 | 0 | 0 |
| σs(*10-4) | 4.4 | 23 | 1.5 | 3.1 | 8.3 | 6.0 |
| A(*10-9) | -3.75 | -3.90 | -4.21 | -4.32 | -3.73 | -3.69 |
| B(*10-13) | 1.26 | 1.71 | 5.88 | 4.70 | 3.02 | 4.58 |
Table 4.
Improved fitting curves of lung tissue(considering kk relationship).
| VT(mL) | R21(real part) | R22(imaginary part) | |
| 30 | 3.30% | 0.971 | 0.971 |
| 40 | 3.71% | 0.960 | 0.970 |
| 50 | 3.92% | 0.943 | 0.978 |
| 60 | 4.34% | 0.927 | 0.959 |
| 70 | 2.76% | 0.980 | 0.974 |
| 80 | 3.38% | 0.968 | 0.970 |
Table 5.
Improved result of lung tissue fitting parameters(considering kk relationship).
| Parameter VT(mL) | 30 | 40 | 50 | 60 | 70 | 80 |
|---|---|---|---|---|---|---|
| ε∞ | 4.19 | 2.46 | 3.90 | 2.35 | 2.40 | 3.16 |
| a1(*10-9) | -3.57 | -3.90 | -3.88 | -4.66 | -3.75 | -3.83 |
| ∆ε1 | 54.63 | 57.22 | 55.78 | 61.58 | 58.26 | 56.19 |
| τ1(ps) | 5.92 | 5.44 | 6.53 | 5.55 | 5.64 | 6.14 |
| α1 | 0 | 0 | 0 | 0 | 0 | 0 |
| ∆ε2 | 1452.35 | 121.23 | 799.46 | 479.84 | 759.64 | 458.10 |
| τ2(ns) | 960.54 | 81.67 | 424.96 | 457.93 | 463.13 | 870.96 |
| α2 | 0 | 0 | 0 | 0 | 0 | 0 |
| b1(*10-13) | 2.18 | 9.25 | 1.71 | 2.45 | 6.10 | 2.84 |
| σs(*10-4) | 1.68 | 1.25 | 7.80 | 48.15 | 1.71 | 97.71 |
| a2(*10-23) | -1.42 | -1.46 | -0.74 | -0.10 | -0.62 | -0.58 |
| b2(*10-13) | 1.24 | 4.17 | 2.58 | 8.19 | 1.53 | 1.53 |
| c1 | 0 | 0 | 0 | 0 | 0 | 0 |
| τ3(μs) | 1.65 | 10.40 | 1.89 | 131.4 | 2.75 | 3.27 |
Disclaimer/Publisher’s Note: The statements, opinions and data contained in all publications are solely those of the individual author(s) and contributor(s) and not of MDPI and/or the editor(s). MDPI and/or the editor(s) disclaim responsibility for any injury to people or property resulting from any ideas, methods, instructions or products referred to in the content. |
© 2025 by the authors. Licensee MDPI, Basel, Switzerland. This article is an open access article distributed under the terms and conditions of the Creative Commons Attribution (CC BY) license (http://creativecommons.org/licenses/by/4.0/).
Copyright: This open access article is published under a Creative Commons CC BY 4.0 license, which permit the free download, distribution, and reuse, provided that the author and preprint are cited in any reuse.


