
Submitted:
30 January 2025
Posted:
30 January 2025
You are already at the latest version
Abstract
In this work, the primary objective was to achieve a complete and detailed structural assignment of the 1H and 13C nuclear magnetic resonance (NMR) data for kaurenoic acid (KA) (ent-kaur-16-en-19-oic acid), a widely studied natural diterpene with various reported biological activities. To facilitate this, the kaurenoic acid methyl ester (ent-methyl-kaur-16-en-19-oate) was also elucidated, leveraging its slight structural differences and the corresponding variations in chemical shifts. The comprehensive assignment was accomplished through the analysis of spectra obtained from each sample, enabling the measurement of all hydrogen homonuclear coupling constants and the clarification of signal multiplicity in the 1H-NMR spectra. Consequently, NMR techniques such as 1H-NMR, 13C{1H}, g-COSY, g-HSQC, g-HMBC, and J-resolved experiments were employed. Additionally, two different software programs, FOMSC3 and NMR_MultiSim, were utilized to simulate 1H-NMR signals, which further assisted in the complete assignment. Furthermore, different deuterated solvents were used to clarify overlapping regions and enrich the dataset.
Keywords:
diterpenes
; kaurane diterpenes
; complete NMR assignment
; software assisted structural assignment
1. Introduction
Diterpenes are specialized metabolites primarily found in plants and marine organisms, although their occurrence has also been reported in other organisms [1,2]. This is a class of natural products (NP) with great skeleton variety, such as kauranes, pimaranes, abietanes, etc. [3]. Beyond the variety of basic structures, there are infinite possibilities of substituents in those NP, which enables a great number of different substances [4,5]. A considerable number of those compounds displays significant biological and ecological activities [4,6]. Some biological activities are well-defined for diterpenoids, including antiparasitic [7,8], phytotoxic [9], anti-inflammatory [10], antibacterial[4,11], fungicidal [4,12], and antiviral [4,13] effects, among others [4,5,14] reported in the literature.
Several plant families, such as Asteraceae [15], Lamiaceae [16], Araucariaceae [17], Flacourtiaceae [18], and Celastraceae [19], with a certain highlight for Asteraceae [20], have been used as sources for the isolation of various diterpenes, and there is considerable interest in utilizing these substances as prototypes for developing a range of derivatives, which are analyzed and applied in numerous studies of biological activity [4,7,10,13,15].
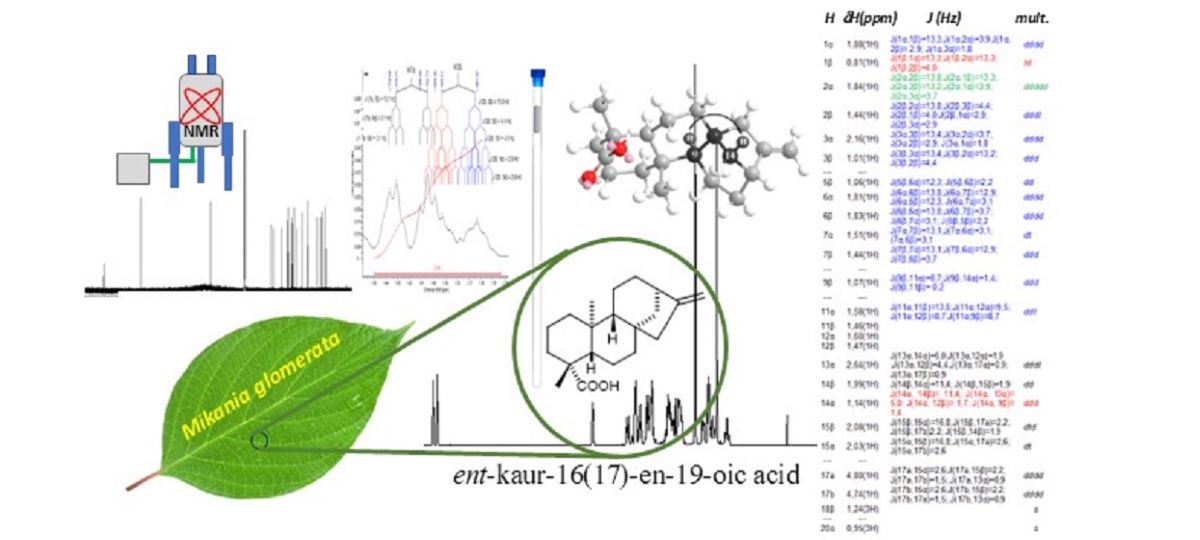
The compound ent-kaur-16(17)-en-19-oic acid (ent-kaurenoic acid - KA) (1) (Figure 1) is a kaurane diterpene with a rigid tetracyclic skeleton. With over eight hundred references returned in a SciFinder search, ent-kaurenoic acid, is one of the most important diterpenes, playing an important role in several kinds of NP works [21,22,23,24,25].
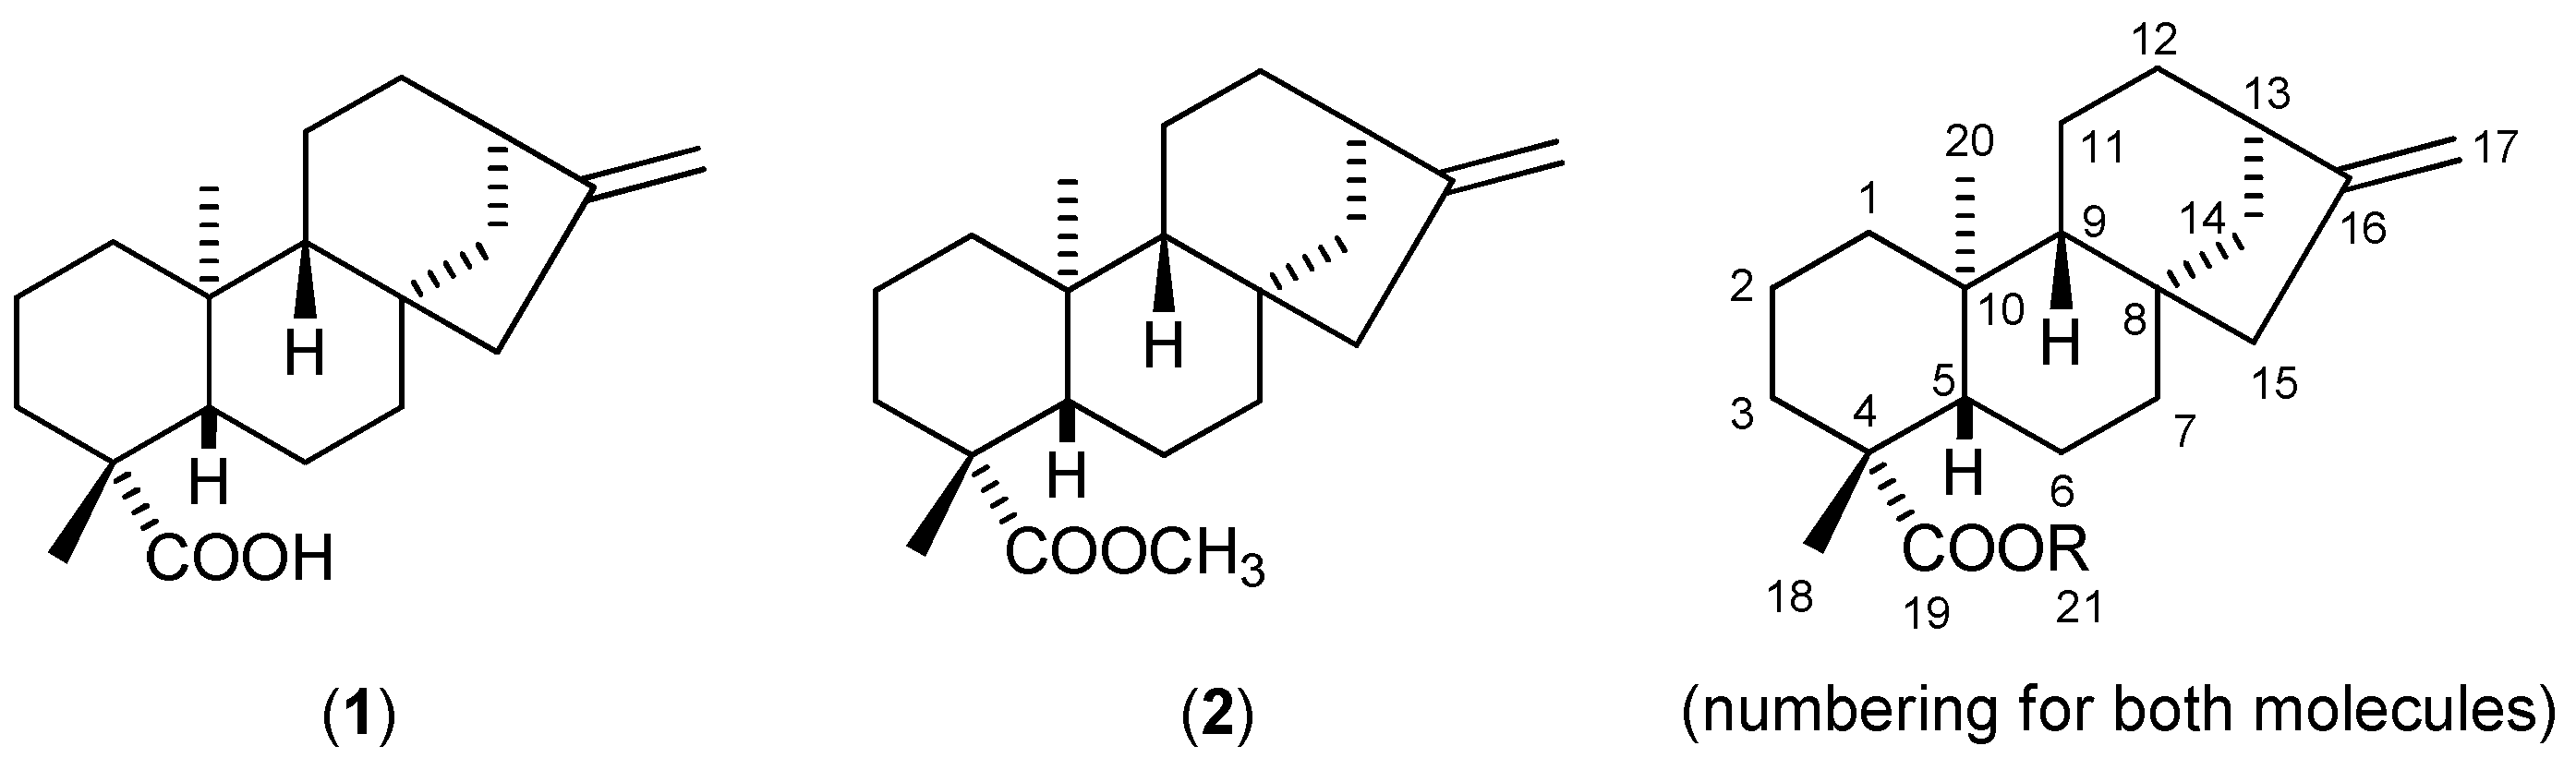
Figure 1.
Chemical structures of ent-kaur-16(17)-en-19-oic acid (kaurenoic acid - KA) (1) and methyl-ent-kaur-16-en-19-oate, its methyl ester - KAMe, (2).
Figure 1.
Chemical structures of ent-kaur-16(17)-en-19-oic acid (kaurenoic acid - KA) (1) and methyl-ent-kaur-16-en-19-oate, its methyl ester - KAMe, (2).
This diterpene can be isolated from various plants native to Central and South America, such as Mikania glomerata Sprengel and Mikania laevigata Schultz Bip. (Asteraceae), popularly known in Brazil as “Guaco” [26]. However, it has also been isolated from a variety of other plants and is a major component in extracts or resins of several species [25,27]. Extracts from some species containing KA exhibit a range of biological activities, such as antifungal [28], anti-asthmatic [29], antimalarial and antispasmodic [30] properties. Kaurenoic acid itself, as an isolated substance, has demonstrated activities in various studies, including anti-inflammatory [31], antibacterial [32] and antitumor [33].
Kaurenoic acid has also become a prominent focus of scientific research to deeply explore and verify its biological properties, understand its pharmacological mechanisms of action, and elucidate them [7,15,24,25,27,31,34]. Thus, kaurenoic acid (1) can be regarded as an interesting prototype for obtaining derivatives [22,23], considering its significant biological activities highlighted in popular medicine and scientific literature.
However, NMR data found in the literature for natural products often exhibit numerous unassigned hydrogen signals and, in most cases, provide little clarification regarding multiplicity and lack of measurement of several coupling constants. Thus, some articles present ambiguous, imprecise, incomplete, or even erroneous data in the literature [35,36,37,38]. This is more common, particularly for less functionalized structures. Due to a significant spectral region with overlapping signals related to the multiple CH2 groups in their structures, the assignment and interpretation of NMR signals are considerably challenging. Furthermore, it is common to encounter re-isolation of substances from several classes in literature without further clarification, relying solely on comparisons with these limited available data [35,39]. For KA, only six hydrogen signals (including olefinic, methyl and bridgehead hydrogens) are frequently used as references to confirm the structure in several works and a substantial part of the structural assignments for this substance is mostly based on 13C-NMR signals rather than 1H-NMR signals [40]. This lack of information, proved by the number of articles dealing with NMR data corrections [41,42,43,44], is a considerable limitation to reach meaningful development in diterpenes structural studies. The coupling constant issue is particularly prevalent in cases where spectra exhibit significant signal overlap, as in some diterpenes, making the accurate interpretation of signals highly complex. The most challenging structural assignments for NP, and for diterpenes, are the ones applied to poorly functionalized molecules. The fewer functions, the more signals overlap and the greater difficulty in totally clarifying 1H NMR signals.
Historically, substances with more complex spectra have not had their data thoroughly detailed in the literature, and it is not common to find complete assignments for those compounds. A detailed approach to studying such signals involves using software to assist in their clarification [44]. Modern instruments allow the application of numerous efficient techniques; however, in certain circumstances, simulating complex splitting patterns becomes essential, particularly for final confirmation. For first-order 1H NMR signals (without distortions), simulations can be performed using the FOMSC3 program (First Order Multiplet Simulator/Checker). For signals exhibiting second-order couplings, the NMR_MultSim program should be used. Both programs were developed at the Laboratory of Organic Synthesis at FFCLRP/USP and are available free of charge [45].
We here present a complete 1H and 13C NMR data assignment for KA, which was performed simultaneously with the assignment for KAMe as a methodology to make the assignment clearer and more reliable. The use of the software FOMSC3 and NMR_MultSim were part of this methodology, as previously published for other types of diterpene [44]. Moreover, different deuterated solvents were used as a strategy to reach hidden information, as well as to provide a larger and more useful dataset.
2. Materials and Methods
Isolation of ent-Kaurenoic Acid
The ent-kaurenoic acid sample used in this study was isolated from a commercial source, Mikania glomerata Spreng (Asteraceae), obtained from the Brazilian company Nutri Ervas, Ltd.a, as described in our previously published work [15].
NMR Experiments
1H NMR, 13C{1H} NMR, DEPT-135, gCOSY, gHSQC, gHMBC, NOESY, and J-resolved experiments were performed. The NMR spectra were recorded on Bruker spectrometers models AVANCE DRX400, 9.4 Tesla (1H SFO1 = 400.21 MHz and 13C SFO2 = 100.63 MHz) and AVANCE DRX500, 11.7 Tesla (1H SFO1 = 500.13 MHz and 13C SFO2 = 125.76 MHz); a 5-mm inverse probe (BBI), operated at 27°C (300 K), was employed. The deuterated solvents used were chloroform-d (CDCl3), methanol-d4 (CD3OD), benzene-d6 (C6D6) and pyridine-d5 (C5D5N), all referenced with 0.03% TMS, all from Sigma-Aldrich. All samples were prepared at concentrations ranging from 3.5 to 25 mg/mL, depending on the pulse sequence of the NMR experiment. When possible, less concentrated samples were prioritized to achieve higher resolution. The 2D experiments were conducted with pulse sequences provided by the spectrometer manufacturer.
NMR Spectra Processing
The NMR experiments conducted were processed using the ACD/Spectrus Processor® software through an academic version obtained free of charge from the internet [46], with no usage restrictions. This program processes the acquired data, enhances spectral signals, and performs measurements in both 1D and 2D NMR experiments. In conjunction with the ACD/Spectrus Processor® software, the SpinWorks® program was also utilized for processing the obtained NMR analyses. This software is freely available and can be accessed via the internet [47].
NMR Signal Simulations
Dataset Comparison to Structure
Aiming to verify if there was a reliable consistency of data with structural features, all the assignment work was carried out in parallel with evaluation of physical molecular models and the use of simple 3D molecular modeling techniques to confirm some structural features hypothesis. For these purposes, the trial license of ChemDraw®3D software, included in the installation package of ChemDraw®Professional was used as well as the ChemDraw® NMR data calculations [48].
3. Results and Discussion
The first approach we employed was through the 1H-NMR experiment using deuterated chloroform, which is the most affordable deuterated solvent and most used for this type of compound.
Figure 1.
1H NMR spectrum of ent-kaurenoic acid (KA) – CDCl3, 500 MHz.
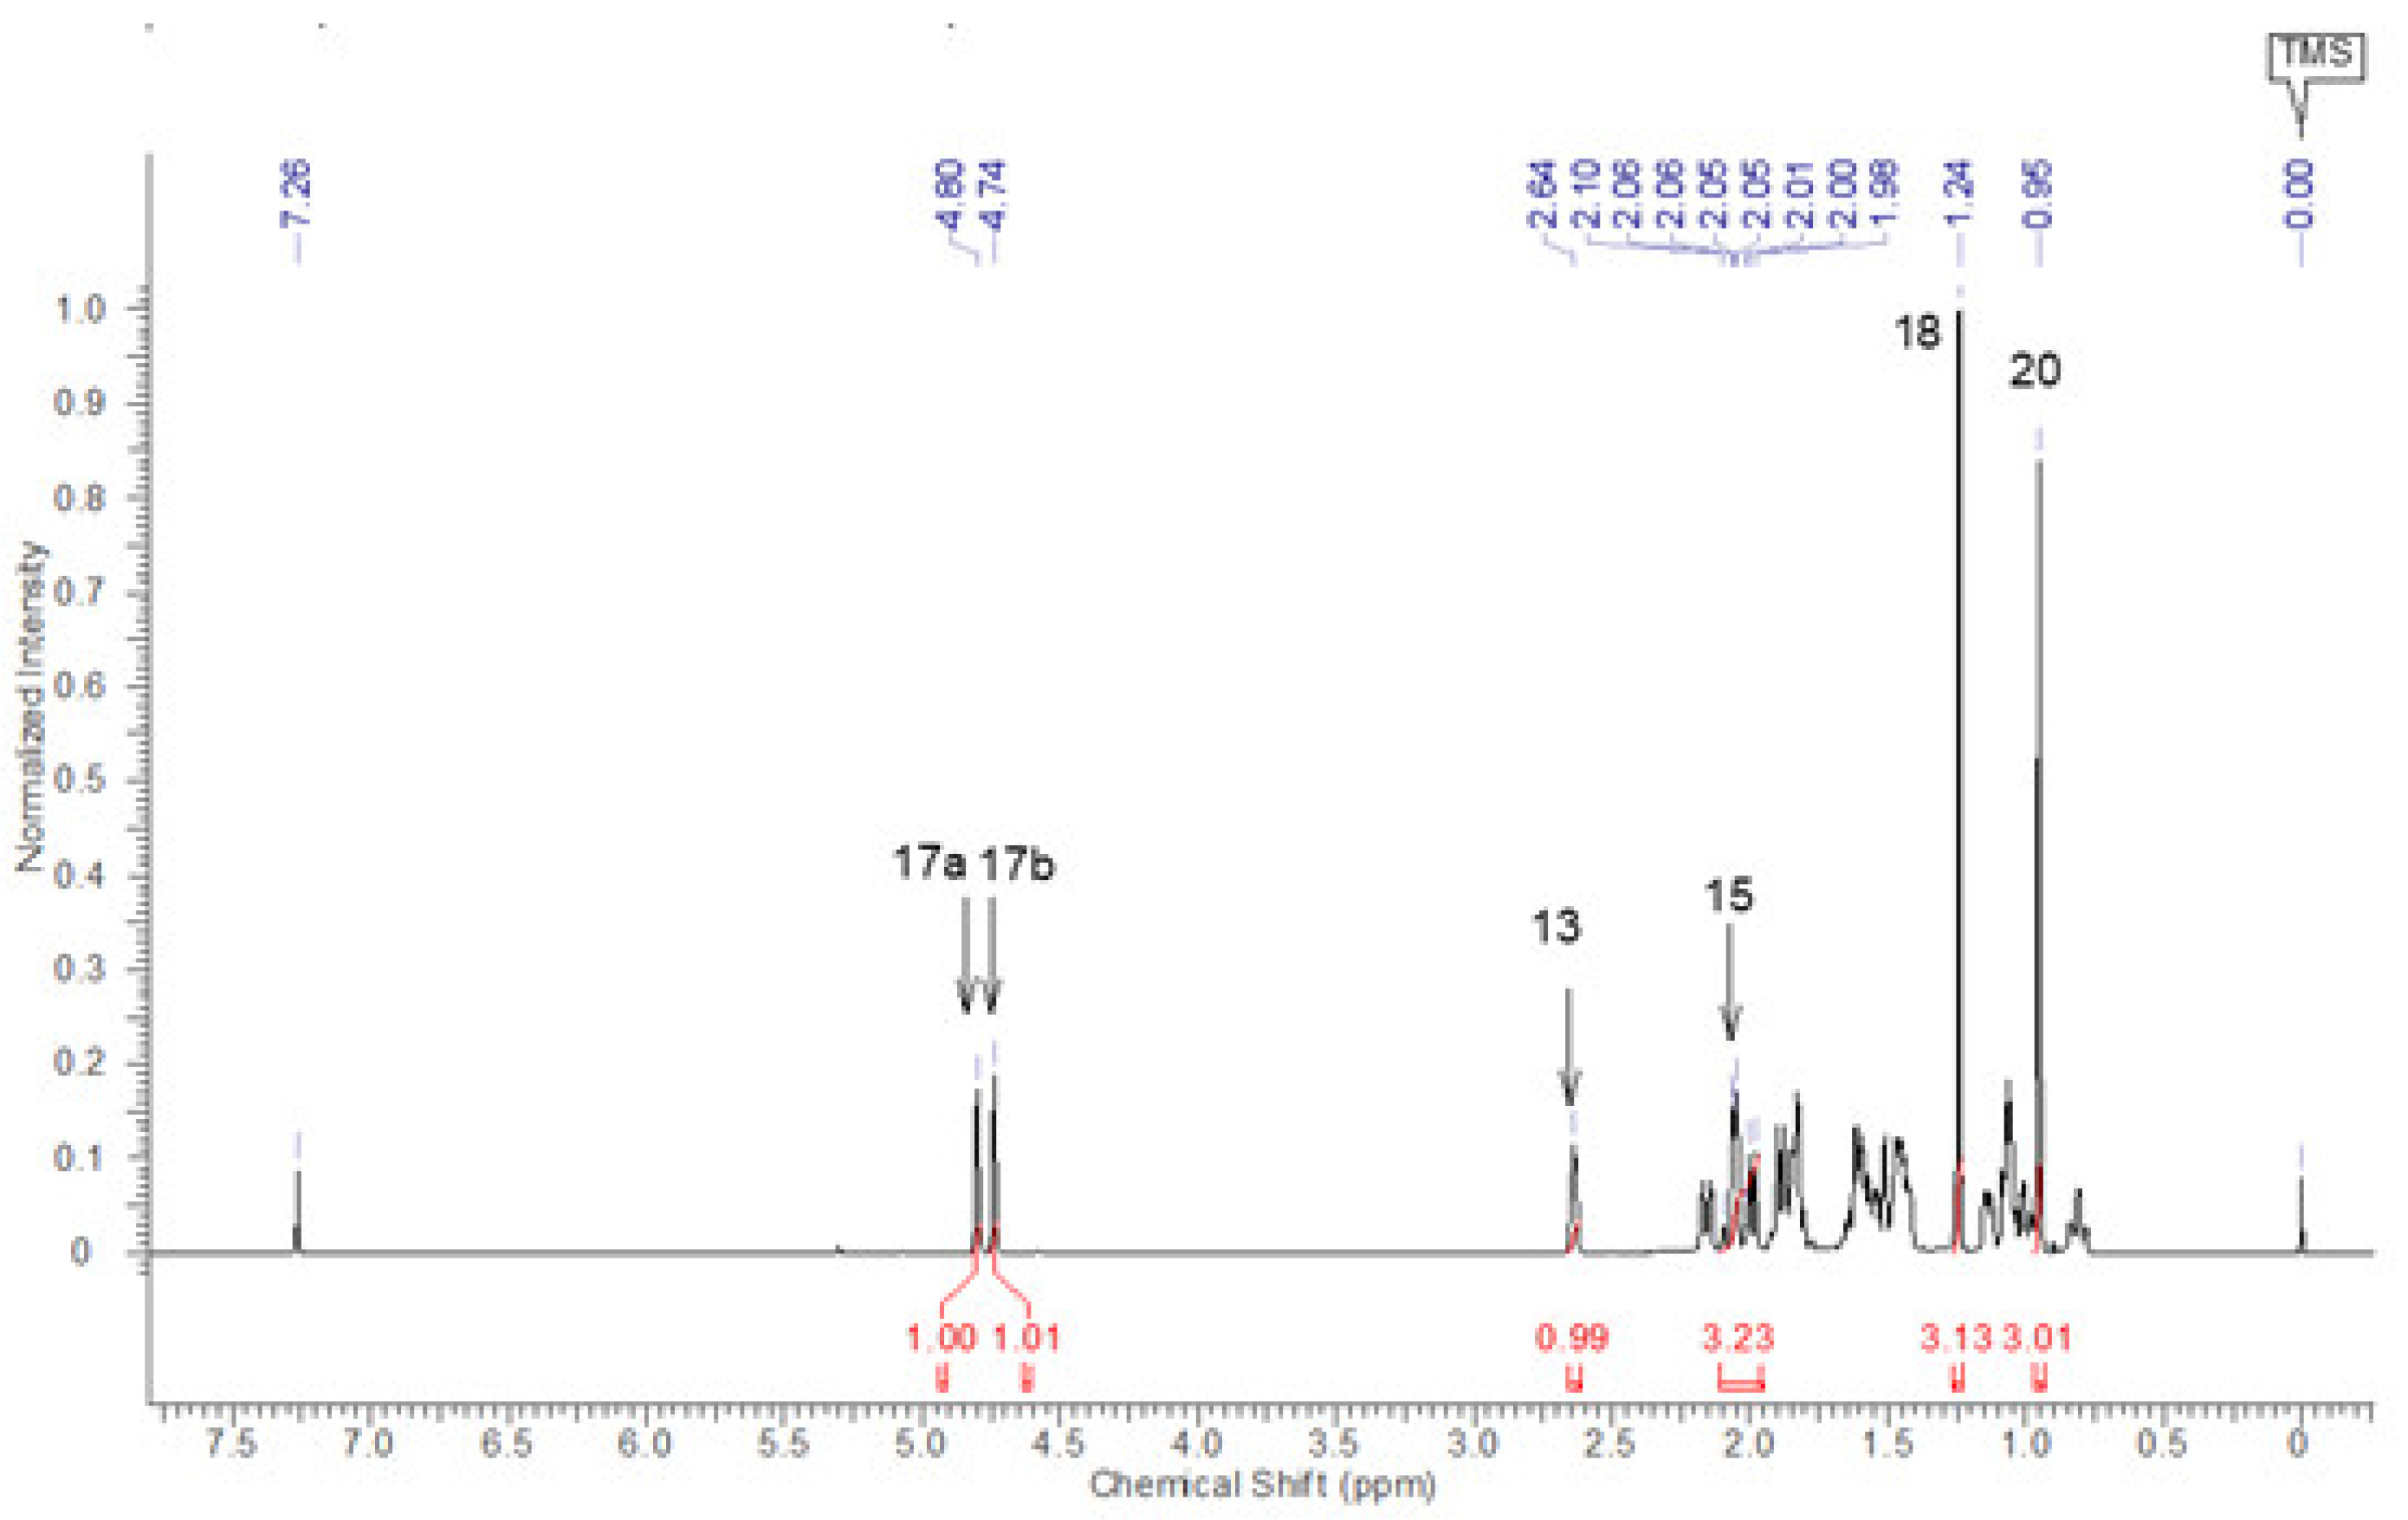
The most easily assigned signals were clearly those of the hydrogens in methyl groups, H-18 and H-20, the olefinic hydrogens (H-17a and H-17b), the bridgehead hydrogen H-13 and the methylene group hydrogens H-15. Only this small group of hydrogens is frequently used for KA structural confirmation, since 13C-NMR signals are prioritized [40] due to their lesser complexity and lack ok signal overlap. Nevertheless, it was planned that these assignments should be at least confirmed, after the completion of this work.
Next step was to thoroughly assign those signals and measure or determine all the involved coupling constants (J values). Some of these can be measured in 1H-NMR spectra, but some had to be obtained through alternative methods. The methodology we developed to address this problem [44] involves the measurement of J values as thoroughly as possible in 1H-NMR spectra; or the use of J-resolved experiments to carry out the measurement; or even use of NMR signals simulation to determine all involved J values [45].
For the first part – measurement carried out on 1H-NMR spectra – a well resolved spectrum is needed, recorded from a very diluted solution of KA in CDCl3. In this case, the work began with the expansion of signals, which were sufficient to allow the achievement of most of the sought-after measurements. Initially, due to previously published assignments [40,49], it was known that H-15 signals were between 2.05 and 2.09 ppm. Nevertheless, some papers described these signals with only one chemical shift. This led to a closer examination of this region of the 1H-NMR spectrum, which is depicted in Figure 2.
At first glance, it is easy to carelessly conclude that the most intense group of peaks above 2.0 ppm in only one signal, with 2H intensity. For this reason, this signal is commonly assigned as H-15 signal, assuming the hydrogens are chemically equivalent. However, the lack of symmetry of this signal proves that it is not a single signal, and a more careful examination, aided by increased intensity reveals the second part of each signal. The distance between the two is exactly 16.8 Hz in both signals, corresponding to the geminal coupling.
In this case, the J values of H-15a and H14b signals can clearly be measured, while not all J values involved in H-15b signal can be precisely determined using only the 1H-NMR spectrum. Nevertheless, even though the correct J values could not be precisely measured or observed, it was clear that this figure shows a probable inconsistency. The observation of a different splitting pattern between H-15a and H-15b, suggested that the last one presents four J values, while the former presents only three. This is somewhat unexpected for two hydrogens on the same carbon, noting that at this point, these hydrogens were considered only H-15a and H-15b, without distinguishing a or b stereochemistry. However, this unequal pattern is entirely possible, considering the rules regarding homonuclear hydrogen coupling. This case underscored the need to carry out the 1H and 13C NMR signals assignment along with a careful check of the molecule’s 3D structure. This was accomplished using physical molecular models together with some 3D simple structural calculations available in appropriate software [48]. In this particular case of position 15 hydrogens, a W coupling between one of the H-15 hydrogens with one of the H-14 hydrogens was verified. Therefore, this H-15 hydrogen was defined as H-15b and it was later possible to define H-14b, as shown in Figure 3. This accomplishment guided the assignment of the relative stereochemistry of CH2 hydrogens for the rest of the molecule. Another three 4JW couplings were found in this molecule highlighted in figures S5, S12, S15, and S41 in the supplementary material.
Even before the J values measurement for signals from H-15 hydrogens, the confirmation of the existence of two signals around 2.06 ppm and their correct assignment to H-15 hydrogens was accomplished by the analysis of g-HSQC spectrum, as shown in Figure 4. All other assignments were carried out using the same methodology.
As demonstrated above, it was crucial to carry out measurements comparing studied values with 3D structures, whether physical (molecular models) or computational. This was done at every step of the work, and the dihedral angles, 3JHH, were always considered using another freely available online software [50].
To contrast this H-15 situation, proceeding with the same first group of hydrogens, the closer examination of signal of H-13 signal, for example, is a case where practically none of the J values could be directly measured at the 1H-NMR signal (Figure 5).
This hydrogen was expected to couple with H-12a, H-12b, H14a and H-14b, not disregarding the possibility of long-distance coupling with H-17a and H-17b.
Howsoever, none of these values could be directly measured in the H-13 signal, despite the high resolution of the spectrum and the intensity of the expansion. The combination of the involved J values does not allow the appearance of peaks in the signal shape, which prevents direct coupling constants measurements. This, and all similar cases, had to be addressed in a special manner, involving signals simulations and comparison between experimental and calculated shapes. For all cases, g-COSY experiments were essential to define the J values that should be searched.
To determine all J values in this kind of signal, it is essential, first, to perform the measurement of all possible hydrogen homonuclear coupling constants in the 1H NMR spectra. The HA-HB coupling constant may not be measurable in HA signal but may be measurable in HB signal. Since the distance in Hz between the first and the last peak of a signal equals the sum of all the coupling constants involved in the signal, it is possible to determine one or two J values without actually measuring them.
Once almost all values are measured or somehow determined, it is possible to use the signal simulation programs like FOMSC3 or NMR_MultSim to verify the accuracy of the coupling constants values. When a signal is simulated and compared to the experimental one, the high resemblance between the individual peaks’ chemical shifts in Hertz and the high similarity of their shapes certify that the values are correct [44].
Although, due to the high signal overlap and, therefore, the high signal distortion in many cases, the values that can be measured from the 1H NMR spectrum in CDCl3 are not sufficient to enable complete and unequivocal determination of hydrogen homonuclear coupling constants for KA. To address this issue, another methodology is proposed: the use of different solvents to record the 1H NMR spectrum. It is known that solvents can affect chemical shifts, but not coupling constants values (J), making this a viable method to clarify real multiplicities. Nevertheless, this is not a linear variation, i.e., some signals shift to higher ppm values and some to lower values. The overall result is that in some cases, there is a reduced overlap, or even a lack of overlap where there was previously an extremely crowded region, hard to elucidate. This enables the isolation of some signals that were previously overlapped, facilitating the measurement of hydrogen homonuclear coupling constants. Figure 6 shows a comparison of signals’ chemical shift variations.
It is evident that there are slight to significant differences in chemical shifts for several signals, when spectra obtained in different solvents are compared. The CH3-20 signal, at 0.9 ppm in chloroform spectrum and at 1.15 ppm in pyridine, is an example of a significant difference. On the other hand, the same signal, when compared in chloroform and in methanol, shows only a slight difference. The combination of this variation of chemical shifts between different spectra enabled the isolation of previously overlapped signals and allowed the measurement of several hidden hydrogen homonuclear coupling constants.
With this measurement capability, it was possible to thoroughly evaluate each part of the 1H-NMR spectrum of KA. This signal evaluation was carried out with the assistance of software, FOMSC3 and MultiSim_NMR, both freely available online [45]. Despite the availability of signals, the remaining high complexity of each spectrum prevents total and precise measurements. The cited software are designed specifically for this problem, as they precisely calculate 1H-NMR spectra when supplied with information such as chemical shifts and coupling constants values. Thus, one is not sure about a specific coupling constant, it is possible to simulate spectra with two or three different and close values and find out which one is correct. The final definition is reached through the comparison of the simulated spectrum with the experimental one. Close values of individual peaks’ chemical shifts, combined with the resemblance of signal shapes, make this decision possible. An example of this procedure is shown in Figure 7.
It is easily observed that the resemblance between simulated and experimental signal’s shapes is remarkably close. Also, the individual peaks’ chemical shifts are also very close, with a maximum difference of 0.5 Hz, proving that signals’ chemical shifts and hydrogen homonuclear coupling constants values assigned are correct. This was fulfilled for each hydrogen, in different solvent for each case, resulting in the dataset shown in Table 1.
The complete comparison of experimental and simulated signals for all cases is provided in supplementary material, figures S2 to S53. Moreover, this material also presents a variety of 3D computational figures showing several verified couplings as each signal is presented. Moreover, there is a 2D-NMR dataset section with Tables S1 to S4, an extensive spectral section and a data comparison section, with Tables S5 to S16. In addition, a summary of the results section is provided and, finally, there is a tutorial section, where the use of the software can be learned from.
As soon as those data were achieved, we intended to compare them to what is provided in the literature. Articles with KA structural identification by NMR, including some used as guide to a variety of authors dealing with this subJect, were searched to evaluate their dataset. A search was made with “kaurenoic acid” and “NMR” as keywords in Sci Finder and Web of Science, articles dealing with KA NMR data were selected. This selection led to 14 references from the last 30 years (references 3 to 16 in supplementary material). This group of references presents 80% of references from the last 14 years and 57% from the last 10 years, indicating that it is a relatively recent material. These references are only cited as a group in supplementary material for organizational reasons, and all their 1H-NMR data were tabulated in tables S9 to S12. These tables present all data for comparison with references and the material has its own bibliography.
In all 14 works, only one has a dataset that could be considered acceptable. Nevertheless, there is no multiplicity clarified for any 1H-NMR signal. In fact, almost none of the signals in any of the works had their multiplicity clarified and the coupling constants measured. In the other 13 articles, including the four most recent ones, there are from 11 to 21 hydrogen chemical shifts missing in the dataset. The one with 11 shifts missing also presents an assignment mistake. Among the others, six of them present inverted values and/or mistaken equal chemical shifts for hydrogens in the same carbon (in CH2 groups). One of those articles appears to have had calibration problems, because several values are distant from all others tabulated.
Therefore, the 1H-NMR data here provided is the largest and most detailed 1H-NMR dataset for kaurenoic acid to our knowledge.
For 13C-NMR assignments, most cases could be clarified Just using g-HSQC and DEPT-135 experiments, as detailed below.
The interesting cases of C-4 / C-13 and C-10 / C-14, which are the closest values in this assignment, are unexpectedly not problematic. This is because they can be easily identified with DEPT-135 experiment (Figure 8). This experiment also was used as confirmation for several other assignments.
The use of g-HSQC experiments, which is exemplified back in Figure 4, was improved by the fact that other solvents were used. Some correlations that could not be verified in the g-HSQC spectrum of one solvent, could be definitely verified in the other. This led to the assignment of most 13C-NMR signals.
For quaternary carbons and some more difficult cases, g-HMBC was required. One of the most intricate of those cases is the correct assignment of C-7 and C-12. Although some works do not even present 13C-NMR data for KA [40], some especially dedicated to structure assign them incorrectly [49]. During the assignments of this work, a careful observation of g-HMBC spectrum provided sufficient information to an unequivocal assignment as can be seen in Figure 9.
After a thorough assignment and meticulous data verification using the 13C-NMR and 2D-NMR spectra, a comprehensive 13C-NMR data table was compiled (Table 2).
The comparison of 13C-NMR data was conducted with the same group of references used for 1H-NMR and is also available in supplementary material (tables S13 to S16). In the case of carbon NMR data, more complete datasets are available due to the inherent simplicity of the data and spectra. Carbon NMR data are more commonly utilized as a reference for structural identification than proton NMR data for certain natural products. Of the thirteen references that present 13C-NMR data for KA, eight are considered to contain complete and well-assigned data. However, one relatively recent reference provides minimal data, with only four carbon assignments. Additionally, two references contain one unassigned carbon, and three others feature erroneous assignment, including inverted values. Therefore, the complete and unequivocal 13C-NMR data assignment for KA presented in this work can be regarded as a significant contribution to the literature. All assignments were corroborated by multiple experiments and 13C-NMR chemical shifts were carefully determined across four different solvents. All 2D-NMR data for kaurenoic acid (1) are presented on tables S1 to S4 in supplementary material.
The same methodology was applied to methyl-ent-kaur-16-en-19-oate, KAMe (2). The idea of using a very similar structure along with KA was to gradually assign both structure signals and to verify differences such as coupling constants values, conformation, and dihedral angles. The plan was to carry out the assignments by comparing both diterpenes. Clearly KA is much more studied and utilized as a research target, which is why it was presented first. Furthermore, KA was the main focus of this work.
As found for kaurenoic acid, KAMe also has Just a few 1H-NMR signals commonly assigned. Some papers describe only six hydrogen assignments, as shown in Figure 10.
With the same attention to detail as carried out for KA, the search for the detailed analysis of 1H and 13C-NMR data for kaurenoic acid methyl ester (KAMe) was conducted. All hydrogen signals were expanded and meticulously analyzed aiming to reach the multiplicity determination and the homonuclear hydrogen coupling constants measurement. This search is exemplified in Figure 11.
The double bond between C-16 and C-17 enables some long-range couplings, which make H-17a and H-17b signals exhibit a dddd multiplicity. Achieving these J values was done by the same methodology as described for KA. More simulated and experimental signal plots can be seen on supplementary material. This case was also conducted with the assistance of the software, and different solvents were used as well. The difference is that for KAMe only CDCl3 and C6D6 were used, but the thoroughness was the same as the previous case. All the 13C-NMR signals were assigned using DEPT-135, g-HSQC and g-HMBC for assignments and verification. In the supplementary material there is a spectral section for KAMe (2), as was done for KA, where a complete set of spectra can be viewed. The 1H and 13C-NMR data obtained for this substance are organized in tables 3 and 4. The dataset presented in this table is also the most complete and detailed set of NMR data for methyl kaurenoate (KAMe), including data obtained in two different solvents, a complete set of hydrogen homonuclear coupling constants values, and the clarification of the entire multiplicity.

Table 3.
Complete 1H-NMR data for ent-kaurenoic acid methyl ester (2) (500 MHz).
| C |
H |
CDCl3 δH (ppm) |
C6D6 δH (ppm) |
Coupling Constants (Hz) | Multiplicity |
| 1 | 1α | 1.88 (1H) | 1.74 (1H) | J(1α,1β)=13.3;J(1α,2α)=3.9;J(1α,2β)=2.9; J(1α,3α)=1.8 | dddd |
| 1β | 0.80 (1H) | 0.65 (1H) | J(1β,1α)=13.3;J(1β,2α)=13.3; J(1β,2β)=4.0 | td | |
| 2 | 2α | 1.85 (1H) | 2.06 (1H) | J(2α,2β)=13.8;J(2α,1β)=13.3; J(2α,3β)=13.2;J(2α,1α)=3.9; J(2α,3α)=3.7 | ddddd |
| 2β | 1.43 (1H) | 1.41 (1H) | J(2β,2α)=13.8;J(2β,3β)=4.4; J(2β,1β)=4.0;J(2β,1α)=2.9; J(2β,3α)=2.9 | dddt | |
| 3 | 3α | 2.17 (1H) | 2.34 (1H) | J(3α,3β)=13.4;J(3α,2α)=3.7;J(3α,2β)=2.9; J(3α,1α)=1.8 | dddd |
| 3β | 1.00 (1H) | 0.88 (1H) | J(3β,3α)=13.4;J(3β,2α)=13.2; J(3β,2β)=4.4 | ddd | |
| 4 | --- | ||||
| 5 | 5β | 1.03 (1H) | 0.85 (1H) | J(5β,6α)=12.3; J(5β,6β)=2.2 | dd |
| 6 | 6α | 1.81 (1H) | 1.86 (1H) | J(6α,6β)=13.8;J(6α,7β)=12.9;J(6α,5β)=12.3; J(6α,7α)=3.1 | dddd |
| 6β | 1.75 (1H) | 1.84 (1H) | |||
| 7 | 7α | 1.52 (1H) | 1.45 (1H) | J(7α,7β)=13.1;J(7α,6α)=3.1; (7α,6β)=3.1 | dt |
| 7β | 1.45 (1H) | 1.32 (1H) | |||
| 8 | --- | ||||
| 9 | 9β | 1.06 (1H) | 0.92 (1H) | J(9β,11α)=8.7; J(9β,11β)= 1.6; J(9β,14α)=1.4 | ddd |
| 10 | --- | ||||
| 11 | 11α | 1.58 (1H) | 1.68 (1H) |
J(11α,11β)=13.5;J(11α;12α)=9.5; J(11α;12β)=8.7;J(11α;9β)=8.7 |
ddt |
| 11β | 1.47 (1H) | ||||
| 12 | 12α | 1.63 (1H) | 1.52 (1H) | ||
| 12β | 1.45 (1H) | 1.49 (1H | |||
| 13 | 13α | 2.64 (1H) | 2,64 (1H) | J(13α,14α)=5.0;J(13α,12α)=1.9 ;J(13α,12β)=4.4,J(13α,17α)=0.9; J(13α,17β)=0.9 | dddt |
| 14 | 14β | 1.97 (1H) | 1.91 (1H) | J(14β,14α)=11.4; J(14β,15β)=1.9 | dd |
| 14α | 1.13 (1H) | 1.09 (1H) | J(14α, 14β)= 11.4; J(14α, 13α)= 5.0; J(14α, 12β)= 1.7; J(14α, 9β)= 1.4 | ddd | |
| 15 | 15β | 2.08 (1H) | 2.07 (1H) | J(15β,15α)=16.8;J(15β,17a)=2.2;J(15β,17b)2.2; J(15β,14β)=1.9 | dtd |
| 15α | 2.02 (1H) | 2.02 (1H) | J(15α,15β)=16.8;J(15α,17a)=2.6; J(15α,17b)=2.6 | dt | |
| 16 | --- | ||||
| 17 | 17a | 4.79 (1H) | 4.98 (1H) | J(17a,15α)=2.6;J(17a,15β)=2.2;J(17a,17b)=1.5; J(17a,13α)=0.9 | dddd |
| 17b | 4.74 (1H) | 4.93 (1H) | J(17b,15α)=2.6;J(17b,15β)=2.2;J(17b,17a)=1.5; J(17b,13α)=0.9 | dddd | |
| 18 | 18β | 1.17 (3H) | 1.11 (3H) | s | |
| 19 | --- | ||||
| 20 | 20α | 0.83 (3H) | 0.85 (3H) | s | |
| 21 | 21α | 3.64 (3H) | 3.35 (3H) | s |
Font colors indicate which solvent used in experiment provided the data.
Table 4.
Complete 13C-NMR data for ent-kaurenoic acid methyl ester (2) (500 MHz).
| C | CDCl3 δC (ppm) |
C6D6 δC (ppm) |
| 1 | 40.7 | 41.3 |
| 2 | 19.1 | 20.0 |
| 3 | 38.1 | 38.7 |
| 4 | 43.9 | 44.3 |
| 5 | 57.1 | 57.5 |
| 6 | 21.9 | 22.8 |
| 7 | 41.2 | 41.9 |
| 8 | 44.2 | 44.7 |
| 9 | 55.1 | 55.7 |
| 10 | 39.4 | 40.0 |
| 11 | 18.3 | 19.1 |
| 12 | 33.1 | 33.8 |
| 13 | 43.8 | 44.8 |
| 14 | 39.6 | 40.3 |
| 15 | 48.8 | 49.7 |
| 16 | 155.8 | 156.0 |
| 17 | 103.1 | 103.9 |
| 18 | 28.7 | 29.1 |
| 19 | 178.1 | 177.7 |
| 20 | 15.2 | 16.1 |
| 21 | 51.0 | 51.0 |
4. Conclusions
The complete and unequivocal assignment of 1H and 13C-NMR data was achieved for two analogous diterpenes – kaurenoic acid and its methyl ester. The accomplishment of this task was carried out using a wide range of NMR experiments. The common 1H and 13C-NMR experiments were complemented by an extensive 2D-NMR search with g-COSY, g-HSQC and g-HMBC experiments. Moreover, J-resolved and double-irradiation experiments, although rarer, were also utilized. In addition, the use of software to assist in this comprehensive assignment was another significant goal. The methodology applied, which has been tested, improved and updated within our research group, has proven to be a robust technique for fully clarifying 1H and 13C NMR data for poorly functionalized molecules. The clarification of NMR data for these molecules has been one of the most challenging assignments to complete.
Supplementary Materials
The following supporting information can be downloaded at the website of this paper posted on Preprints.org.
Author Contributions
Conceptualization, V.C.G. Heleno, A.E. Ferreira and A.C.F.S. Rocha.; methodology, V.C.G. Heleno and A.E. Ferreira; software applying, J.C.S. Pavan and A.E. Ferreira.; validation, V.N. Takahashi, D.C. Sass and V.C.G. Heleno; investigation, A.E. Ferreira and H.J. Dias.; resources, V.C.G. Heleno and P.M. Pauletti; writing—original draft preparation, V.C.G. Heleno and V.N. Takahashi.; writing—review and editing, A.E. Ferreira, D. C. Sass, J.C.S. Pavan and H.J. Dias ; visualization, P.M. Pauletti; supervision, V.C.G. Heleno; project administration, V.C.G. Heleno. All authors have read and agreed to the published version of the manuscript.
Funding
The authors are grateful to the Coordination for the Improvement of Higher Education Personnel (CAPES) – Finance Code 001, the National Council for Scientific and Technological Development (CNPq) – grant numbers: 308348/2018-4 and 303174/2021-8, and the São Paulo Research Foundation (FAPESP) – grant number: 2009/0949-1.
Data Availability Statement
The raw data supporting the conclusions of this article will be made available by the authors on request.
Acknowledgments
The authors also thank MSc Vinícius Palaretti and Prof. Dr. Antonio Gilberto Ferreira for NMR spectra acquisition and recording. This paper is dedicated to Profa. Dra. Katia Jorge Ciuffi, who recently assumed as dean of research and post-graduation in Cruzeiro do Sul Educacional, a successful Brazilian educational group.
Conflicts of Interest
The authors declare no conflicts of interest.
Abbreviations
The following abbreviations are used in this manuscript:
| NMR | Nuclear Magnetic Resonance |
| 1H-NMR | Proton Nuclear Magnetic Resonance |
| 13C-NMR | Carbon Nuclear Magnetic Resonance |
| COSY | Correlation Spectroscopy |
| HSQC | Heteronuclear Single Quantum Coherence |
| HMBC | Heteronuclear Multiple Bond Correlation |
| g | Stands for “gradient” |
| FOMSC3 | First Order Multiplet Simulator/Checker - program |
| NMR_MultSim | NMR Multiplet Simulator - program |
| NP | Natural Products |
| KA | Kaurenoic acid |
| KAMe | Kaurenoic acid methyl ester |
| FFCLRP/USP | Philosophy, Science and Letters Faculty of Ribeirão Preto – University of São Paulo. |
References
- Zhang, F.-L.; Feng, T. Diterpenes Specially Produced by Fungi: Structures, Biological Activities, and Biosynthesis (2010–2020). Journal of Fungi 2022, 8, 244. [Google Scholar] [CrossRef] [PubMed]
- Qiu, P.; Xia, J.; Zhang, H.; Lin, D.; Shao, Z. A Review of Diterpenes from Marine-Derived Fungi: 2009–2021. Molecules 2022, 27, 8303. [Google Scholar] [CrossRef] [PubMed]
- Hanson, J.R. Diterpenoids. Nat Prod Rep 2009, 26, 1156. [Google Scholar] [CrossRef]
- Antoniuk, O.; Maranha, A.; Salvador, J.A.R.; Empadinhas, N.; Moreira, V.M. Bi- and Tricyclic Diterpenoids: Landmarks from a Decade (2013–2023) in Search of Leads against Infectious Diseases. Nat Prod Rep 2024, 41, 1858–1894. [Google Scholar] [CrossRef]
- Saha, P.; Rahman, F.I.; Hussain, F.; Rahman, S.M.A.; Rahman, M.M. Antimicrobial Diterpenes: Recent Development From Natural Sources. Front Pharmacol 2022, 12. [Google Scholar] [CrossRef]
- Cheng, A.; Lou, Y.; Mao, Y.; Lu, S.; Wang, L.; Chen, X. Plant Terpenoids: Biosynthesis and Ecological Functions. J Integr Plant Biol 2007, 49, 179–186. [Google Scholar] [CrossRef]
- Rocha, A.C.F.S.; Morais, G.O.; da Silva, M.M.; Kovatch, P.Y.; Ferreira, D.S.; Esperandim, V.R.; Pagotti, M.C.; Magalhães, L.G.; Heleno, V.C.G. In Vitro Anti-Trypanosomal Potential of Kaurane and Pimarane Semi-Synthetic Derivatives. Nat Prod Res 2022, 36, 875–884. [Google Scholar] [CrossRef]
- Lima, G.S.; Castro-Pinto, D.B.; Machado, G.C.; Maciel, M.A.M.; Echevarria, A. Antileishmanial Activity and Trypanothione Reductase Effects of Terpenes from the Amazonian Species Croton Cajucara Benth (Euphorbiaceae). Phytomedicine 2015, 22, 1133–1137. [Google Scholar] [CrossRef]
- Li, R.-J.; Sun, Y.; Sun, B.; Wang, X.-N.; Liu, S.-S.; Zhou, J.-C.; Ye, J.-P.; Zhao, Y.; Liu, L.; Lee, K.-H.; et al. Phytotoxic Cis-Clerodane Diterpenoids from the Chinese Liverwort Scapania Stephanii. Phytochemistry 2014, 105, 85–91. [Google Scholar] [CrossRef]
- Wan, L.-S.; Shao, L.-D.; Fu, L.; Xu, J.; Zhu, G.-L.; Peng, X.-R.; Li, X.-N.; Li, Y.; Qiu, M.-H. One-Step Semisynthesis of a Segetane Diterpenoid from a Jatrophane Precursor via a Diels–Alder Reaction. Org Lett 2016, 18, 496–499. [Google Scholar] [CrossRef]
- Bardají, D.K.R.; da Silva, J.J.M.; Bianchi, T.C.; de Souza Eugênio, D.; de Oliveira, P.F.; Leandro, L.F.; Rogez, H.L.G.; Venezianni, R.C.S.; Ambrosio, S.R.; Tavares, D.C.; et al. Copaifera Reticulata Oleoresin: Chemical Characterization and Antibacterial Properties against Oral Pathogens. Anaerobe 2016, 40, 18–27. [Google Scholar] [CrossRef] [PubMed]
- Xu, J.; Kang, J.; Cao, X.; Sun, X.; Yu, S.; Zhang, X.; Sun, H.; Guo, Y. Characterization of Diterpenes from Euphorbia Prolifera and Their Antifungal Activities against Phytopathogenic Fungi. J Agric Food Chem 2015, 63, 5902–5910. [Google Scholar] [CrossRef] [PubMed]
- Roa-Linares, V.C.; Brand, Y.M.; Agudelo-Gomez, L.S.; Tangarife-Castaño, V.; Betancur-Galvis, L.A.; Gallego-Gomez, J.C.; González, M.A. Anti-Herpetic and Anti-Dengue Activity of Abietane Ferruginol Analogues Synthesized from (+)-Dehydroabietylamine. Eur J Med Chem 2016, 108, 79–88. [Google Scholar] [CrossRef] [PubMed]
- Burmistrova, O.; Perdomo, J.; Simões, M.F.; RiJo, P.; Quintana, J.; Estévez, F. The Abietane Diterpenoid Parvifloron D from Plectranthus Ecklonii Is a Potent Apoptotic Inducer in Human Leukemia Cells. Phytomedicine 2015, 22, 1009–1016. [Google Scholar] [CrossRef]
- Soares, A.C.F.; Matos, P.M.; Dias, H.J.; Aguiar, G. de P.; dos Santos, E.S.; Martins, C.H.G.; Veneziani, R.C.S.; Ambrósio, S.R.; Heleno, V.C.G. Variability of the Antibacterial Potential among Analogue Diterpenes against Gram-Positive Bacteria: Considerations on the Structure–Activity Relationship. Can J Chem 2019, 97, 568–575. [Google Scholar] [CrossRef]
- Habtemariam, S. The Therapeutic Potential of Rosemary ( Rosmarinus Officinalis ) Diterpenes for Alzheimer’s Disease. Evidence-Based Complementary and Alternative Medicine 2016, 2016. [Google Scholar] [CrossRef]
- Schmeda-Hirschmann, G.; Rodríguez, J.; Theoduloz, C.; Valderrama, J. Gastroprotective Effect and Cytotoxicity of Labdeneamides with Amino Acids. Planta Med 2011, 77, 340–345. [Google Scholar] [CrossRef]
- Xia, L.; Guo, Q.; Tu, P.; Chai, X. The Genus Casearia: A Phytochemical and Pharmacological Overview. Phytochemistry Reviews 2015, 14, 99–135. [Google Scholar] [CrossRef]
- Núñez, M.J.; Reyes, C.P.; Jiménez, I.A.; Hayashi, H.; Tokuda, H.; Bazzocchi, I.L. Ent-Rosane and Abietane Diterpenoids as Cancer Chemopreventive Agents. Phytochemistry 2011, 72, 385–390. [Google Scholar] [CrossRef]
- ALVARENGA, S.A. V.; FERREIRA, M.J.P.; RODRIGUES, G. V.; EMERENCIANO, V.P. A General Survey and Some Taxonomic Implications of Diterpenes in the Asteraceae. Botanical Journal of the Linnean Society 2005, 147, 291–308. [Google Scholar] [CrossRef]
- Zhao, X.; Cacherat, B.; Hu, Q.; Ma, D. Recent Advances in the Synthesis of Ent -Kaurane Diterpenoids. Nat Prod Rep 2022, 39, 119–138. [Google Scholar] [CrossRef] [PubMed]
- Santana, V.C.S.; Rocha, E.C.S.; Pavan, J.C.S.; Heleno, V.C.G.; de Lucca, E.C. Selective Oxidations in the Synthesis of Complex Natural Ent -Kauranes and Ent -Beyeranes. J Org Chem 2022, 87, 10462–10466. [Google Scholar] [CrossRef] [PubMed]
- Pérez, Á.; Quílez del Moral, J.F.; Galisteo, A.; Amaro, J.M.; Barrero, A.F. Bioinspired Synthesis of Platensimycin from Natural Ent -Kaurenoic Acids. Org Lett 2023, 25, 5401–5405. [Google Scholar] [CrossRef] [PubMed]
- Chagas-Paula, D.A.; Oliveira, R.B.; Rocha, B.A.; Da Costa, F.B. Ethnobotany, Chemistry, and Biological Activities of the Genus Tithonia (Asteraceae). Chem Biodivers 2012, 9, 210–235. [Google Scholar] [CrossRef]
- Arruda, C.; Aldana Mejía, J.A.; Ribeiro, V.P.; Gambeta Borges, C.H.; Martins, C.H.G.; Sola Veneziani, R.C.; Ambrósio, S.R.; Bastos, J.K. Occurrence, Chemical Composition, Biological Activities and Analytical Methods on Copaifera Genus—A Review. Biomedicine & Pharmacotherapy 2019, 109, 1–20. [Google Scholar] [CrossRef]
- Rufatto, L.C.; Gower, A.; Schwambach, J.; Moura, S. Genus Mikania: Chemical Composition and Phytotherapeutical Activity. Revista Brasileira de Farmacognosia 2012, 22, 1384–1403. [Google Scholar] [CrossRef]
- Ibrahim, T.S.; Khongorzul, P.; Muyaba, M.; Alolga, R.N. Ent-Kaurane Diterpenoids from the Annonaceae Family: A Review of Research Progress and Call for Further Research. Front Pharmacol 2023, 14. [Google Scholar] [CrossRef]
- Batista, R.; García, P.A.; Castro, M.Á.; Del Corral, J.M.M.; Feliciano, A.S.; Oliveira, A.B. de Iso-Kaurenoic Acid from Wedelia Paludosa D.C. An Acad Bras Cienc 2010, 82, 823–831. [Google Scholar] [CrossRef]
- Cho, J.H.; Lee, J.Y.; Sim, S.S.; Whang, W.K.; Kim, C.J. Inhibitory Effects of Diterpene Acids from Root of Aralia Cordata on IgE-Mediated Asthma in Guinea Pigs. Pulm Pharmacol Ther 2010, 23, 190–199. [Google Scholar] [CrossRef]
- Salatino, A.; Salatino, M.L.F.; Negri, G. Traditional Uses, Chemistry and Pharmacology of Croton Species (Euphorbiaceae). J Braz Chem Soc 2007, 18, 11–33. [Google Scholar] [CrossRef]
- Dalenogare, D.P.; Ferro, P.R.; De Prá, S.D.T.; Rigo, F.K.; de David Antoniazzi, C.T.; de Almeida, A.S.; Damiani, A.P.; Strapazzon, G.; de Oliveira Sardinha, T.T.; Galvani, N.C.; et al. Antinociceptive Activity of Copaifera Officinalis Jacq. L Oil and Kaurenoic Acid in Mice. Inflammopharmacology 2019, 27, 829–844. [Google Scholar] [CrossRef] [PubMed]
- Moon, K.; Hwang, S.; Lee, H.-J.; Jo, E.; Kim, J.N.; Cha, J. Identification of the Antibacterial Action Mechanism of Diterpenoids through Transcriptome Profiling. Front Microbiol 2022, 13. [Google Scholar] [CrossRef] [PubMed]
- Fernandes, V.C.; Pereira, S.I.V.; Coppede, J.; Martins, J.S.; Rizo, W.F.; Beleboni, R.O.; Marins, M.; Pereira, P.S.; Pereira, A.M.S.; Fachin, A.L. The Epimer of Kaurenoic Acid from Croton Antisyphiliticus Is Cytotoxic toward B-16 and HeLa Tumor Cells through Apoptosis Induction. Genetics and Molecular Research 2013, 12, 1005–1011. [Google Scholar] [CrossRef]
- Cotoras, M.; Folch, C.; Mendoza, L. Characterization of the Antifungal Activity on Botrytis Cinerea of the Natural Diterpenoids Kaurenoic Acid and 3β-Hydroxy-Kaurenoic Acid. J Agric Food Chem 2004, 52, 2821–2826. [Google Scholar] [CrossRef]
- Vichnewski, W.; Sarti, S.J.; Gilbert, B.; Herz, W. Goyazensolide, a Schistosomicidal Heliangolide from Eremanthus Goyazensis. Phytochemistry 1976, 15, 191–193. [Google Scholar] [CrossRef]
- Coll, J. NMR Shift Data of Neo -clerodane Diterpenes from the Genus Ajuga. Phytochemical Analysis 2002, 13, 372–380. [Google Scholar] [CrossRef]
- Pinheiro Barros, M.C.; Sousa Lima, M.A.; Braz-Filho, R.; Rocha Silveira, E. 1 H and 13 C NMR Assignments of Abietane Diterpenes from Aegiphila Lhotzkyana. Magnetic Resonance in Chemistry 2003, 41, 731–734. [Google Scholar] [CrossRef]
- Wang, W.G.; Du, X.; Li, X.N.; Yan, B.C.; Zhou, M.; Wu, H.Y.; Zhan, R.; Dong, K.; Pu, J.X.; Sun, H.D. Four New Diterpenoids from Isodon Eriocalyx Var. Laxiflora. Nat Prod Bioprospect 2013, 3, 145–149. [Google Scholar] [CrossRef]
- de Oliveira, A.B.; Saúde, D.A.; Perry, K.S.P.; Duarte, D.S.; Raslan, D.S.; Boaventura, M.A.D.; Chiari, E. Trypanocidal Sesquiterpenes FromLychnophora Species. Phytotherapy Research 1996, 10, 292–295. [Google Scholar] [CrossRef]
- Nascimento, A.M. do; Oliveira, D.C.R. de Kaurene Diterpenes and Other Chemical Constituents from Mikania Stipulacea (M. Vahl) Willd. J Braz Chem Soc 2001, 12, 552–555. [Google Scholar] [CrossRef]
- Lima, K.S.B.; Guedes, M.L.S.; Silveira, E.R. Abietane Diterpenes from Hyptis Crassifolia Mart. Ex Benth. (Lamiaceae). J Braz Chem Soc. [CrossRef]
- Li, Q.; Shang, K.; Wang, J.; Xu, C.-S.; Cai, Z.; Yuan, P.; Wang, C.-G.; Gu, M.-M.; Zhang, Y.; Liao, Z.-X. Identification, Structural Revision and Biological Evaluation of the Phyllocladane-Type Diterpenoids from Callicarpa Longifolia Var. Floccosa. Tetrahedron 2024, 167, 134304. [Google Scholar] [CrossRef]
- Kovatch, P.Y.; Ferreira, A.E.; Ghizonni, G.M.L.; Ambrósio, S.R.; Crotti, A.E.M.; Heleno, V.C.G. Detailed 1 H and 13 C NMR Structural Assignment of Ent -polyalthic Acid, a Biologically Active Labdane Diterpene. Magnetic Resonance in Chemistry 2022, 60, 255–260. [Google Scholar] [CrossRef] [PubMed]
- Ferreira, A.E.; Rocha, A.C.F.S.; Bastos, J.K.; Heleno, V.C.G. Software-Assisted Methodology for Complete Assignment of 1H and 13C NMR Data of Poorly Functionalized Molecules: The Case of the Chemical Marker Diterpene Ent-copalic Acid. J Mol Struct 2021, 1228. [Google Scholar] [CrossRef]
- Constantino, M.G. LSO - NMR Webpage Available online:. Available online: http://artemis.ffclrp.usp.br/NMR.htm (accessed on 27 December 2024).
- ACD Labs ACD Spectrus Processor Available online:. Available online: https://www.acdlabs.com/products/spectrus-platform/spectrus-processor/ (accessed on 5 January 2025).
- Kirk Marat SpinWorks Available online:. Available online: https://umanitoba.ca/science/research/chemistry/nmr (accessed on 5 January 2025).
- Revvity Signals ChemDraw Trials Available online:. Available online: https://revvitysignals.com/trials (accessed on 4 January 2025).
- Enriquez, R.G.; Barajas, J.; Ortiz, B.; Lough, A.J.; Reynolds, W.F.; Yu, M.; Leon, I.; Gnecco, D. Comparison of Crystal and Solution Structures and 1 H and 13 C Chemical Shifts for Grandiflorenic Acid, Kaurenoic Acid, and Monoginoic Acid. Can J Chem 1997, 75, 342–347. [Google Scholar] [CrossRef]
- R. Available online: https://www.stenutz.eu/conf/haasnoot.php (accessed on 17 January 2025).
Figure 2.
1H NMR spectrum expansion of H-14b, H15a and H15b signals from ent-kaurenoic acid (KA) – CDCl3, 500 MHz – exemplifying the J values measurement.
Figure 2.
1H NMR spectrum expansion of H-14b, H15a and H15b signals from ent-kaurenoic acid (KA) – CDCl3, 500 MHz – exemplifying the J values measurement.
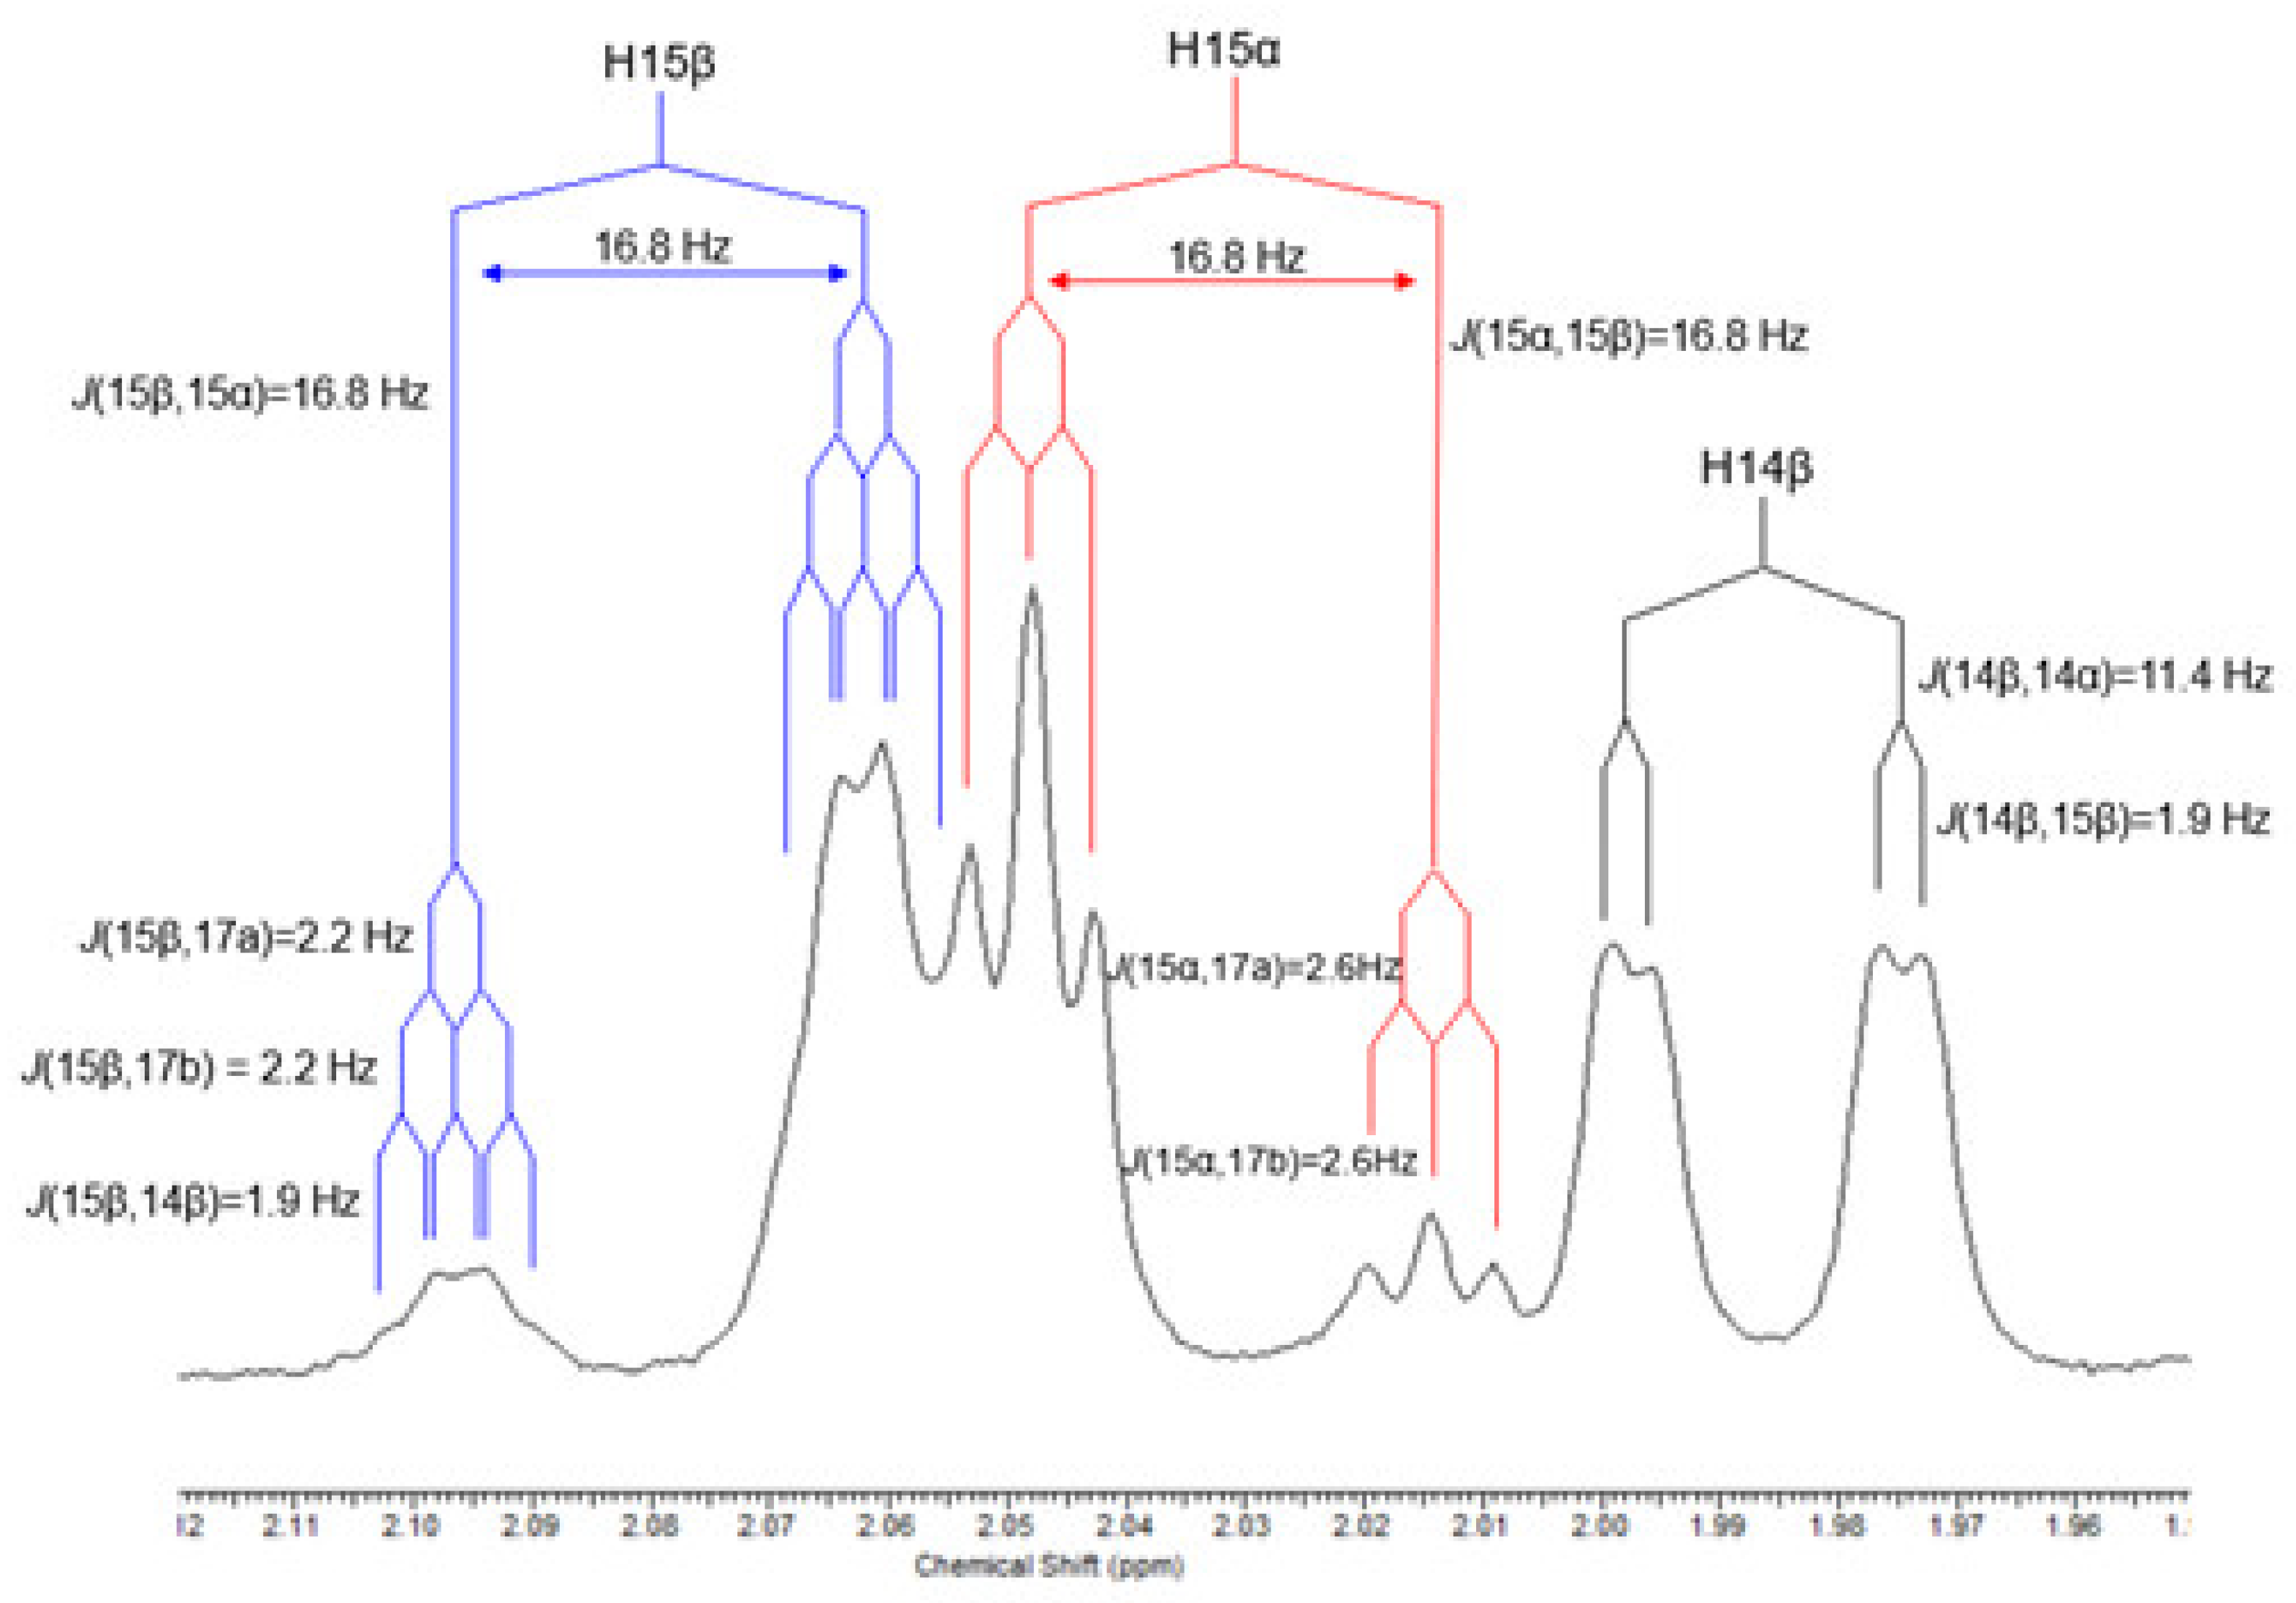
Figure 3.
Example of the use of 3D models to track assignment with (A) 3D image showing 4Jw (15b,14b) and all expected couplings for H15b (A) and H15a (B).
Figure 3.
Example of the use of 3D models to track assignment with (A) 3D image showing 4Jw (15b,14b) and all expected couplings for H15b (A) and H15a (B).
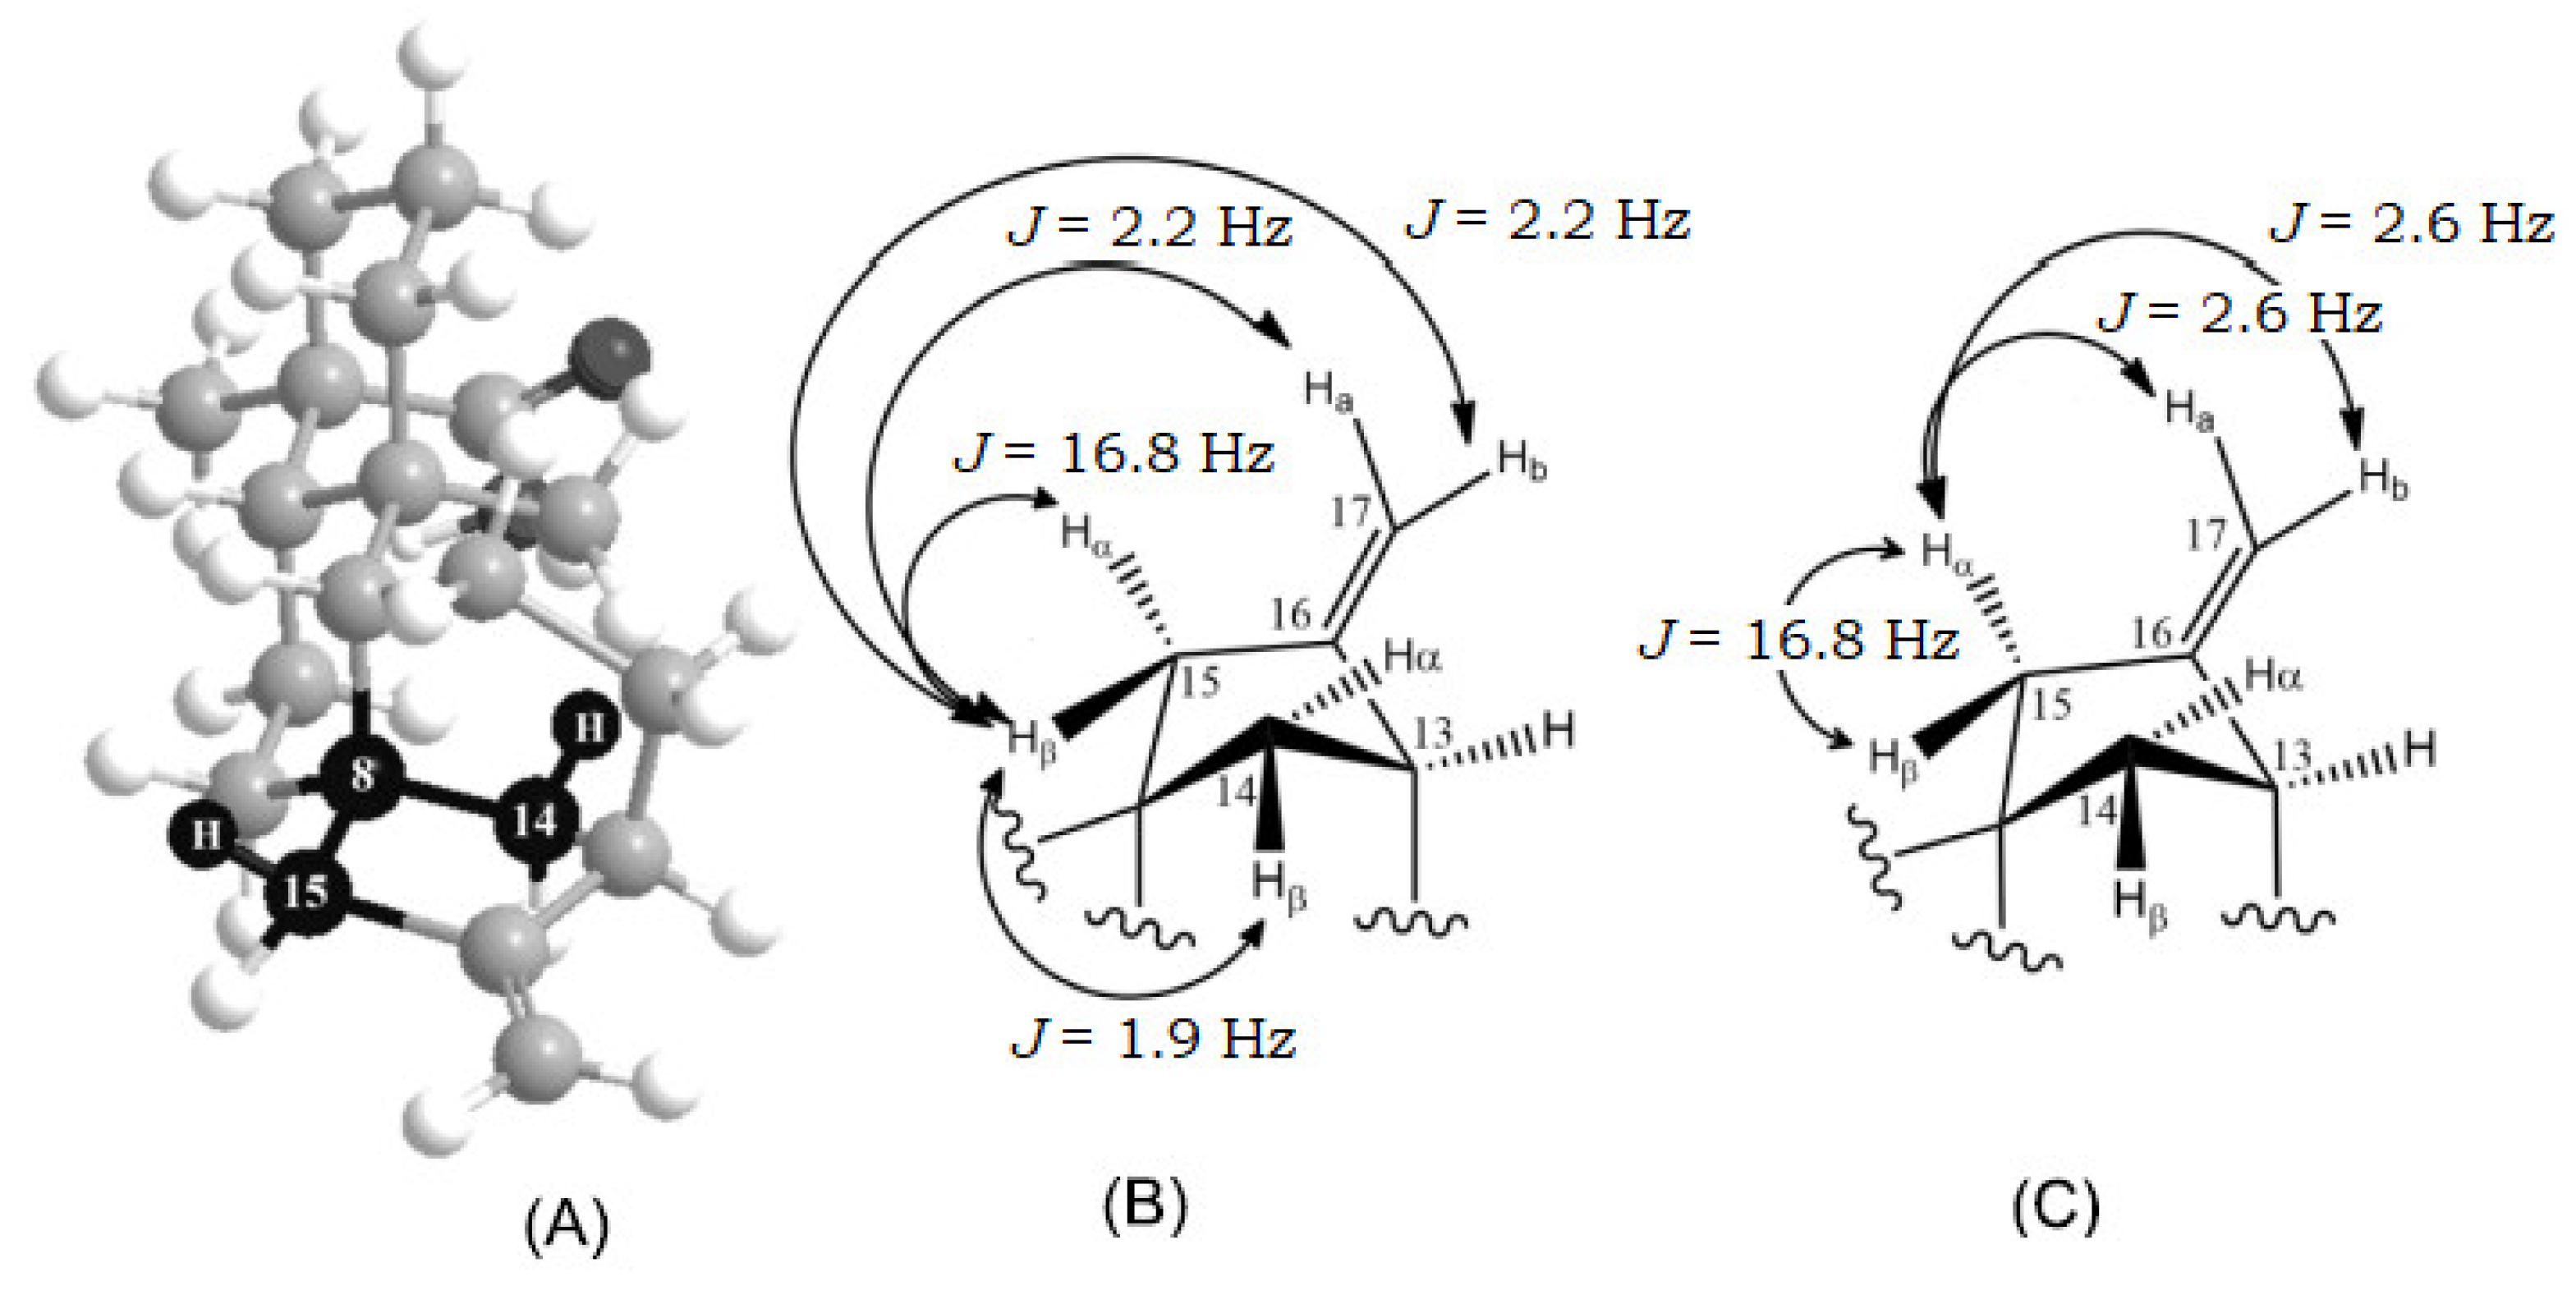
Figure 4.
Expansion of g-HSQC spectrum from ent-kaurenoic acid.
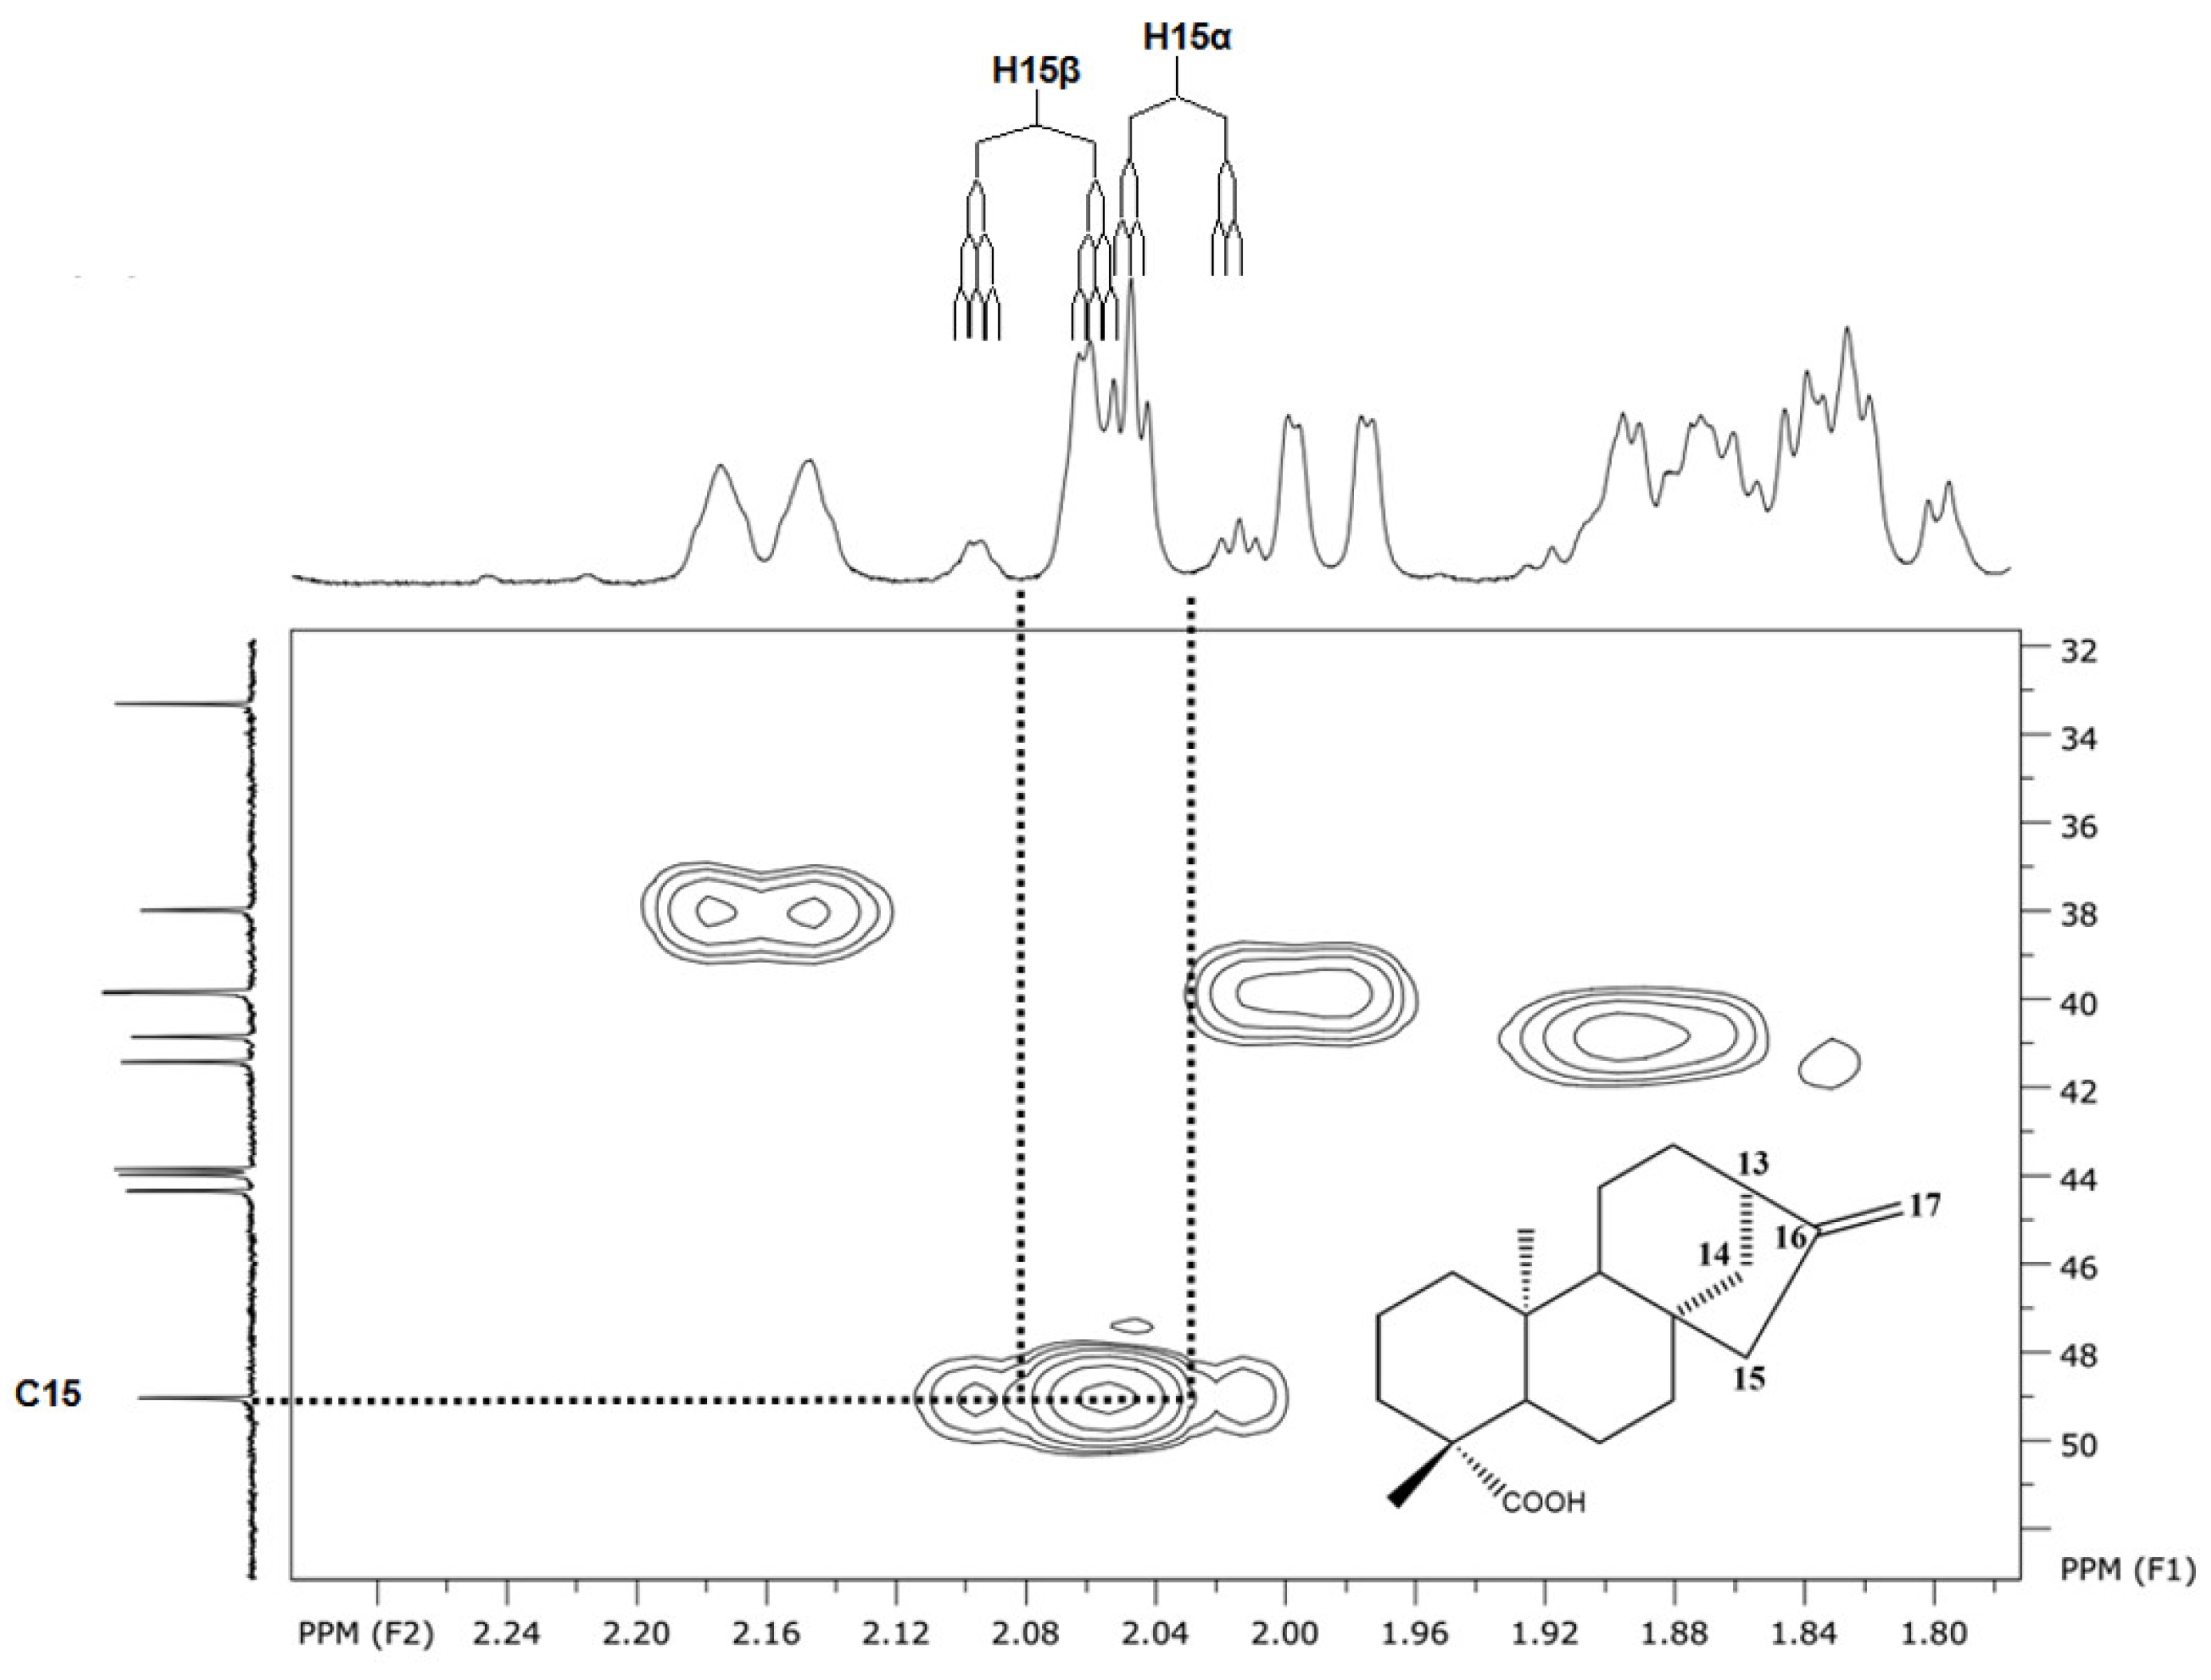
Figure 5.
1H NMR spectrum expansion of H-13 signal from ent-kaurenoic acid (KA) – CDCl3, 500 MHz.
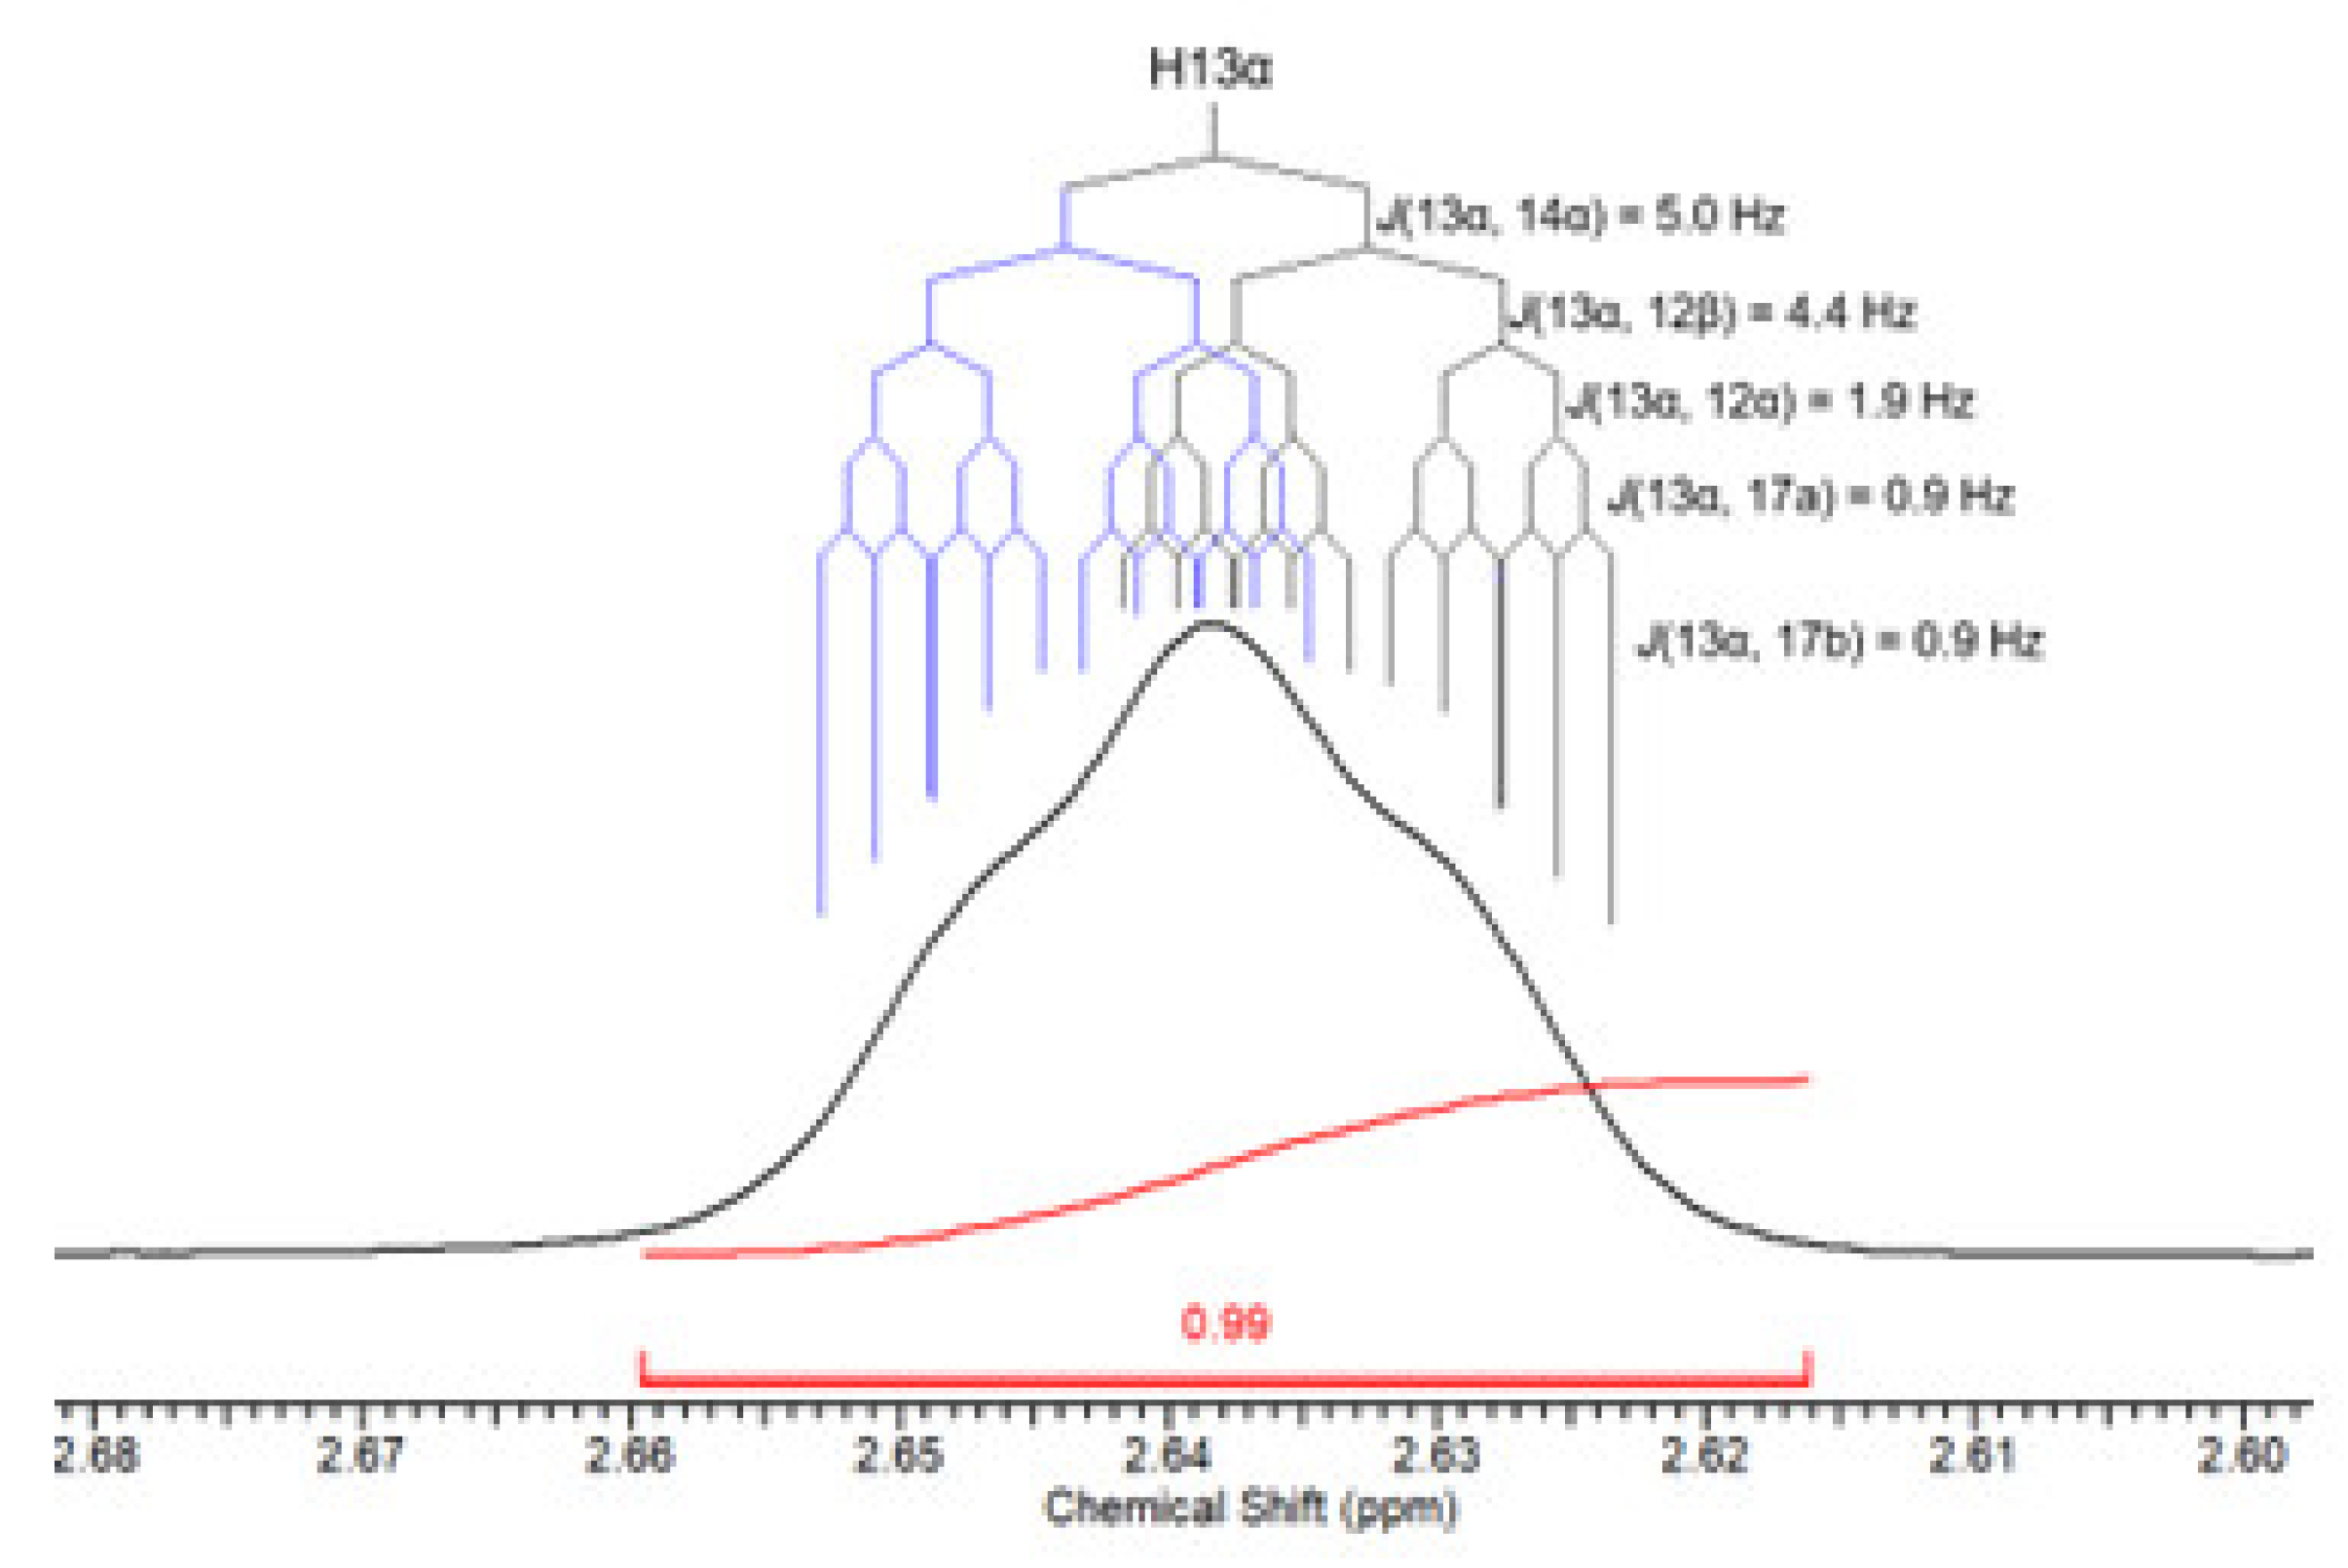
Figure 6.
1H NMR spectra in different solvents for comparison – CDCl3 (A), CD3OD (B), C6D6 (C), C5H5N (D). Methyl signals were cut to fit the figure.
Figure 6.
1H NMR spectra in different solvents for comparison – CDCl3 (A), CD3OD (B), C6D6 (C), C5H5N (D). Methyl signals were cut to fit the figure.
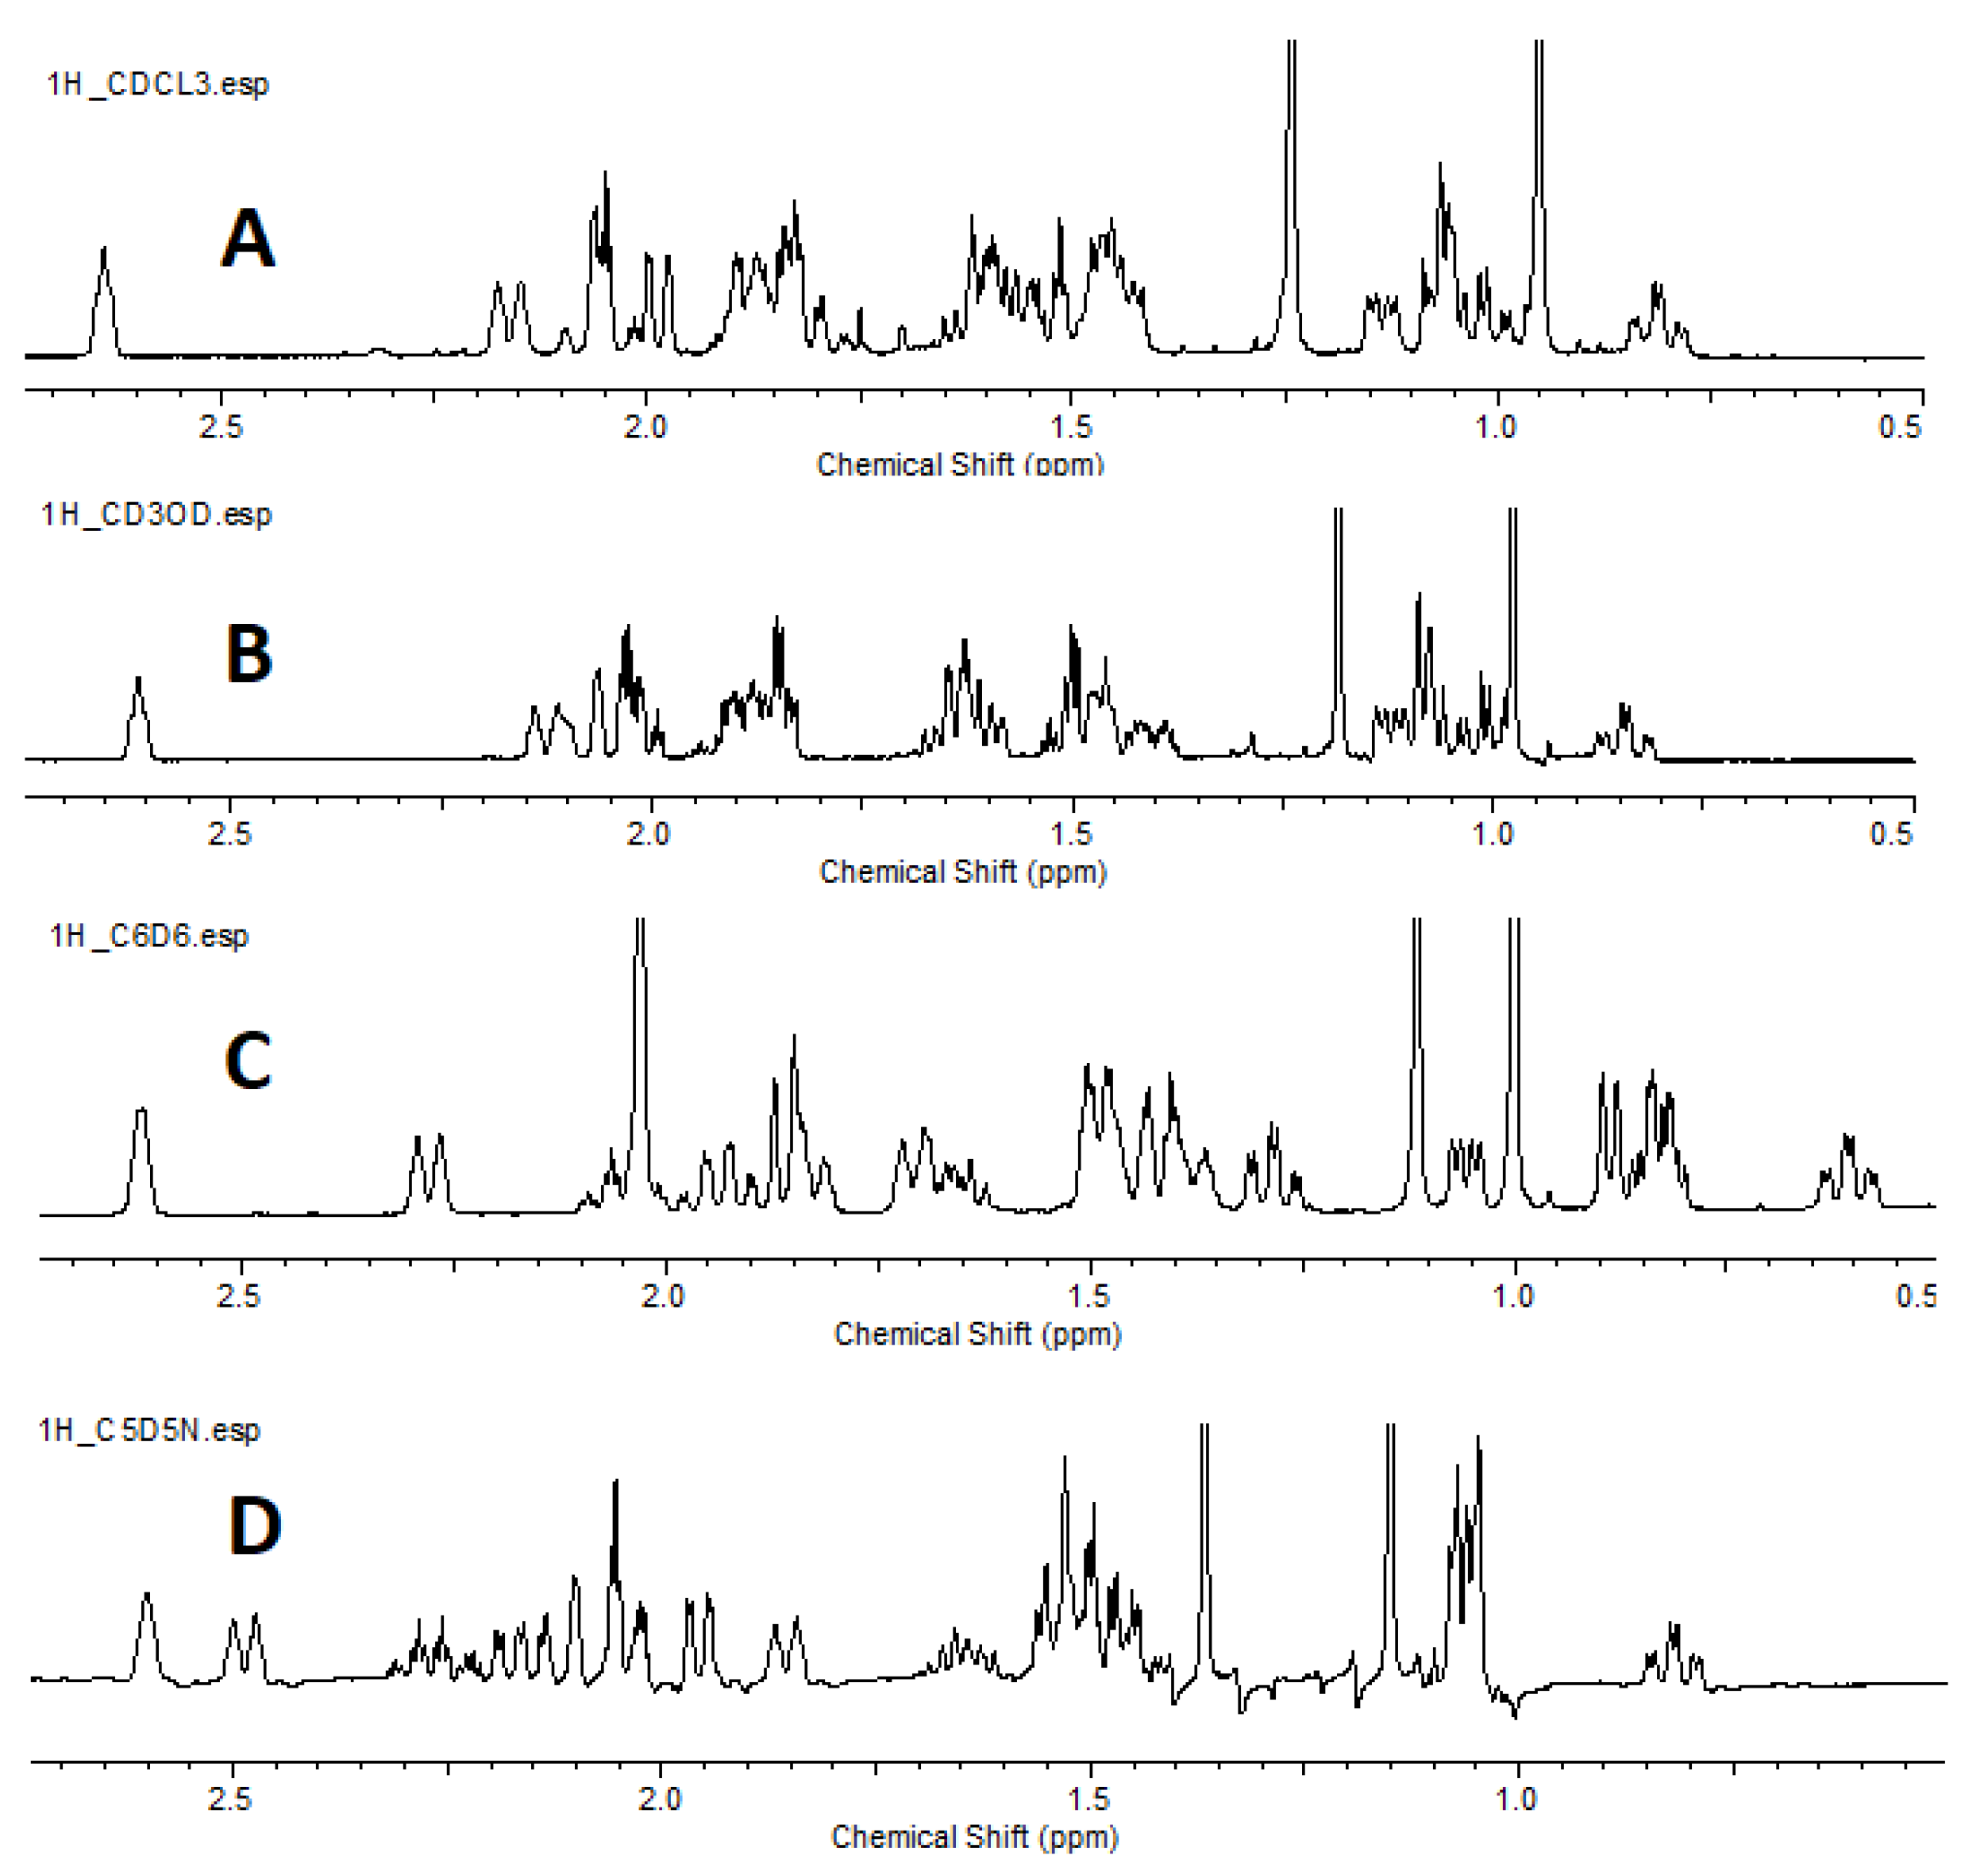
Figure 7.
Experimental versus calculated spectra for hydrogens H-6a and H-14b.
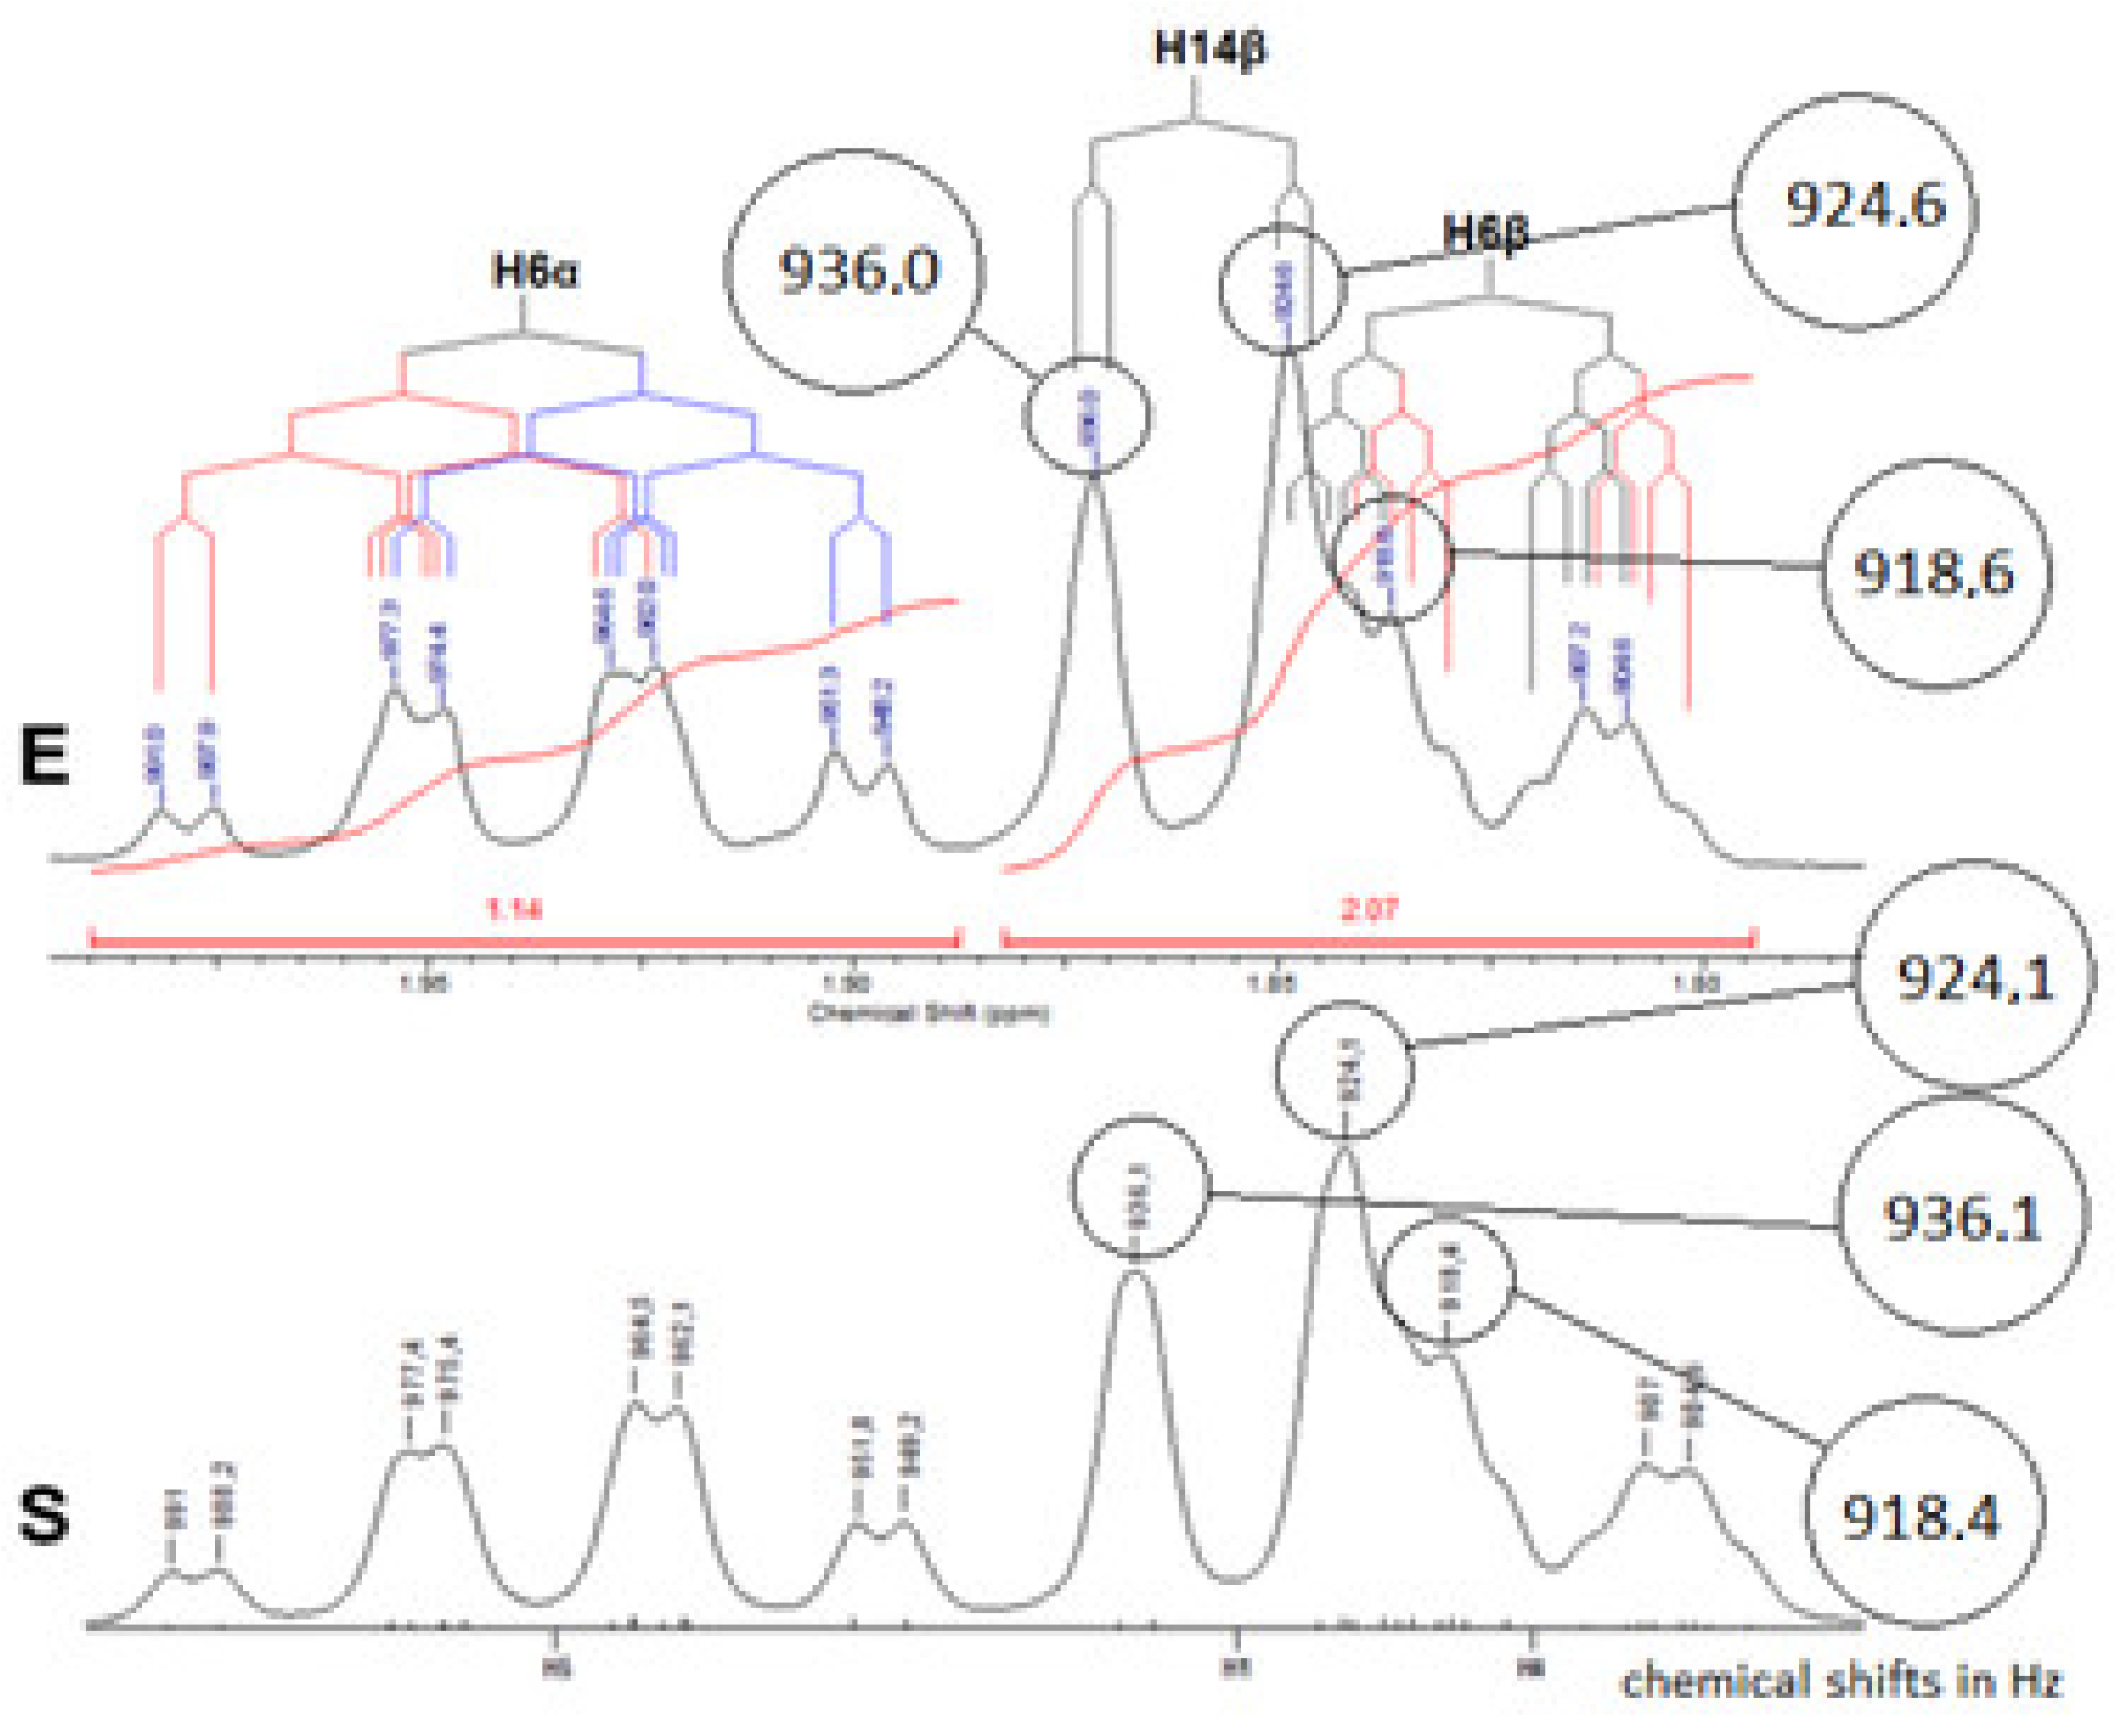
Figure 8.
Example of the use of DEPT-135 experiments.
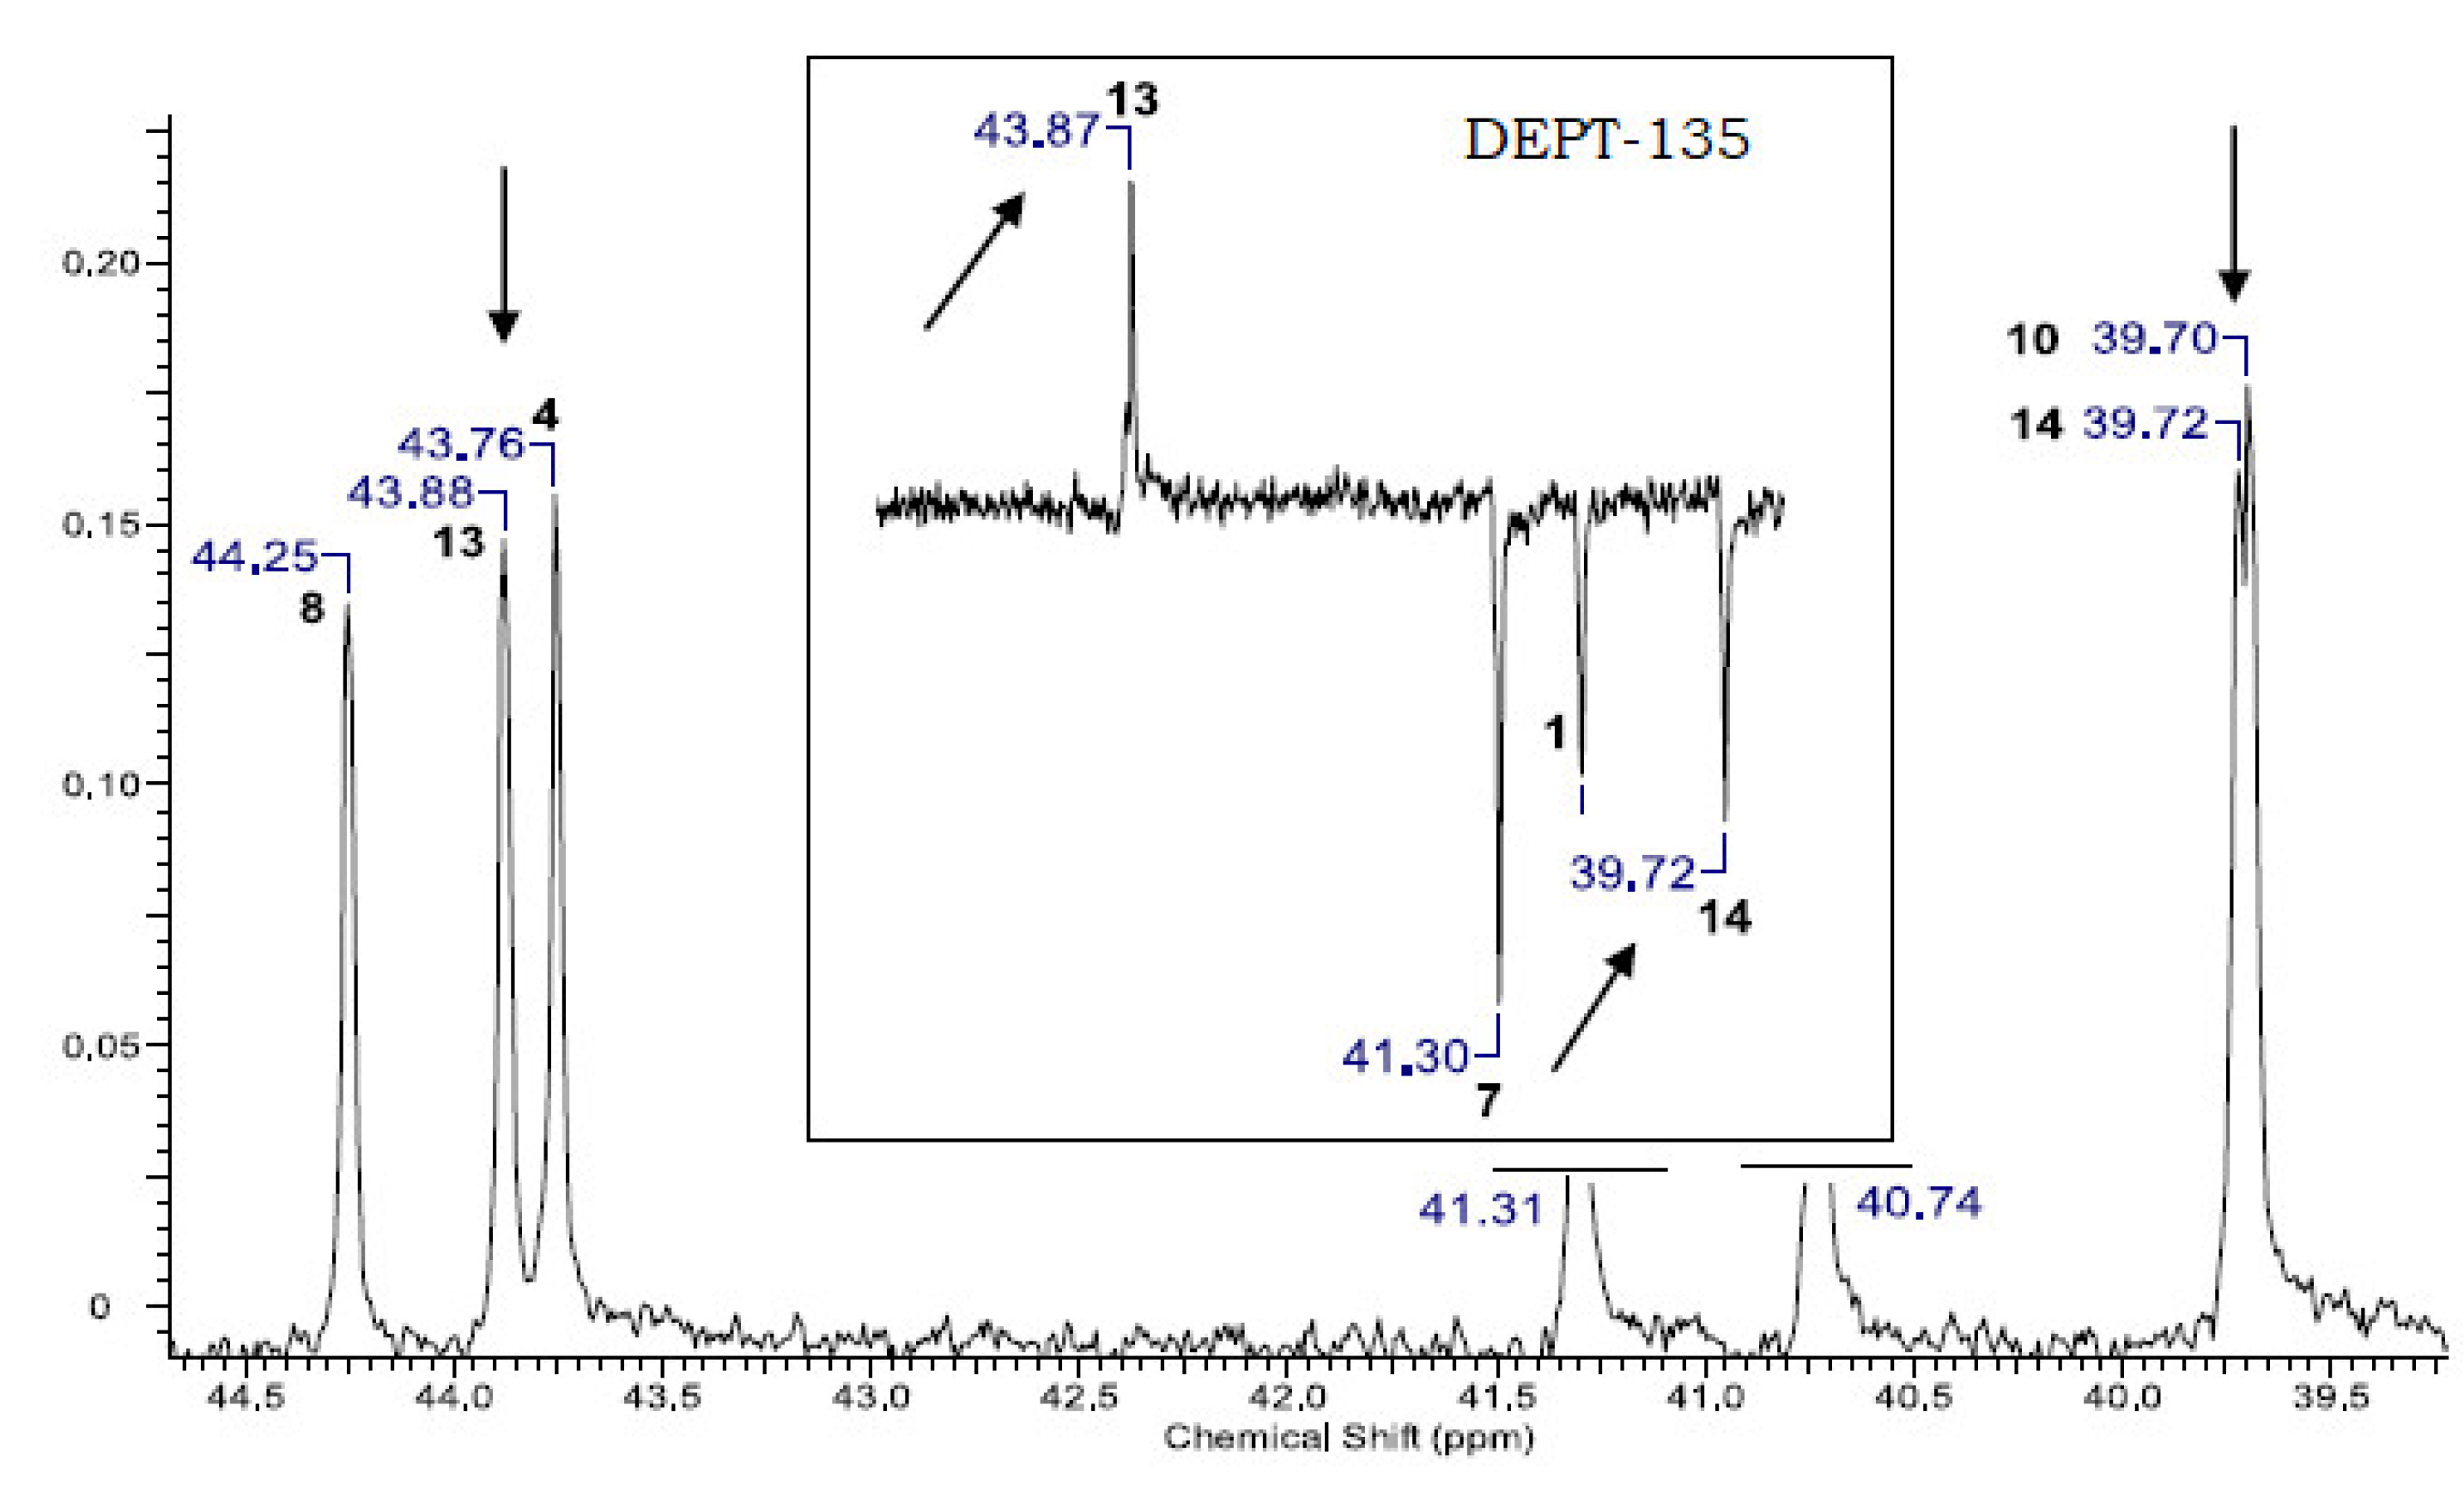
Figure 9.
Application of g-HMBC experiments to clarify the assignment of quaternary carbons. The cases of C-7 (A) and C-12 (B) are highlighted.
Figure 9.
Application of g-HMBC experiments to clarify the assignment of quaternary carbons. The cases of C-7 (A) and C-12 (B) are highlighted.
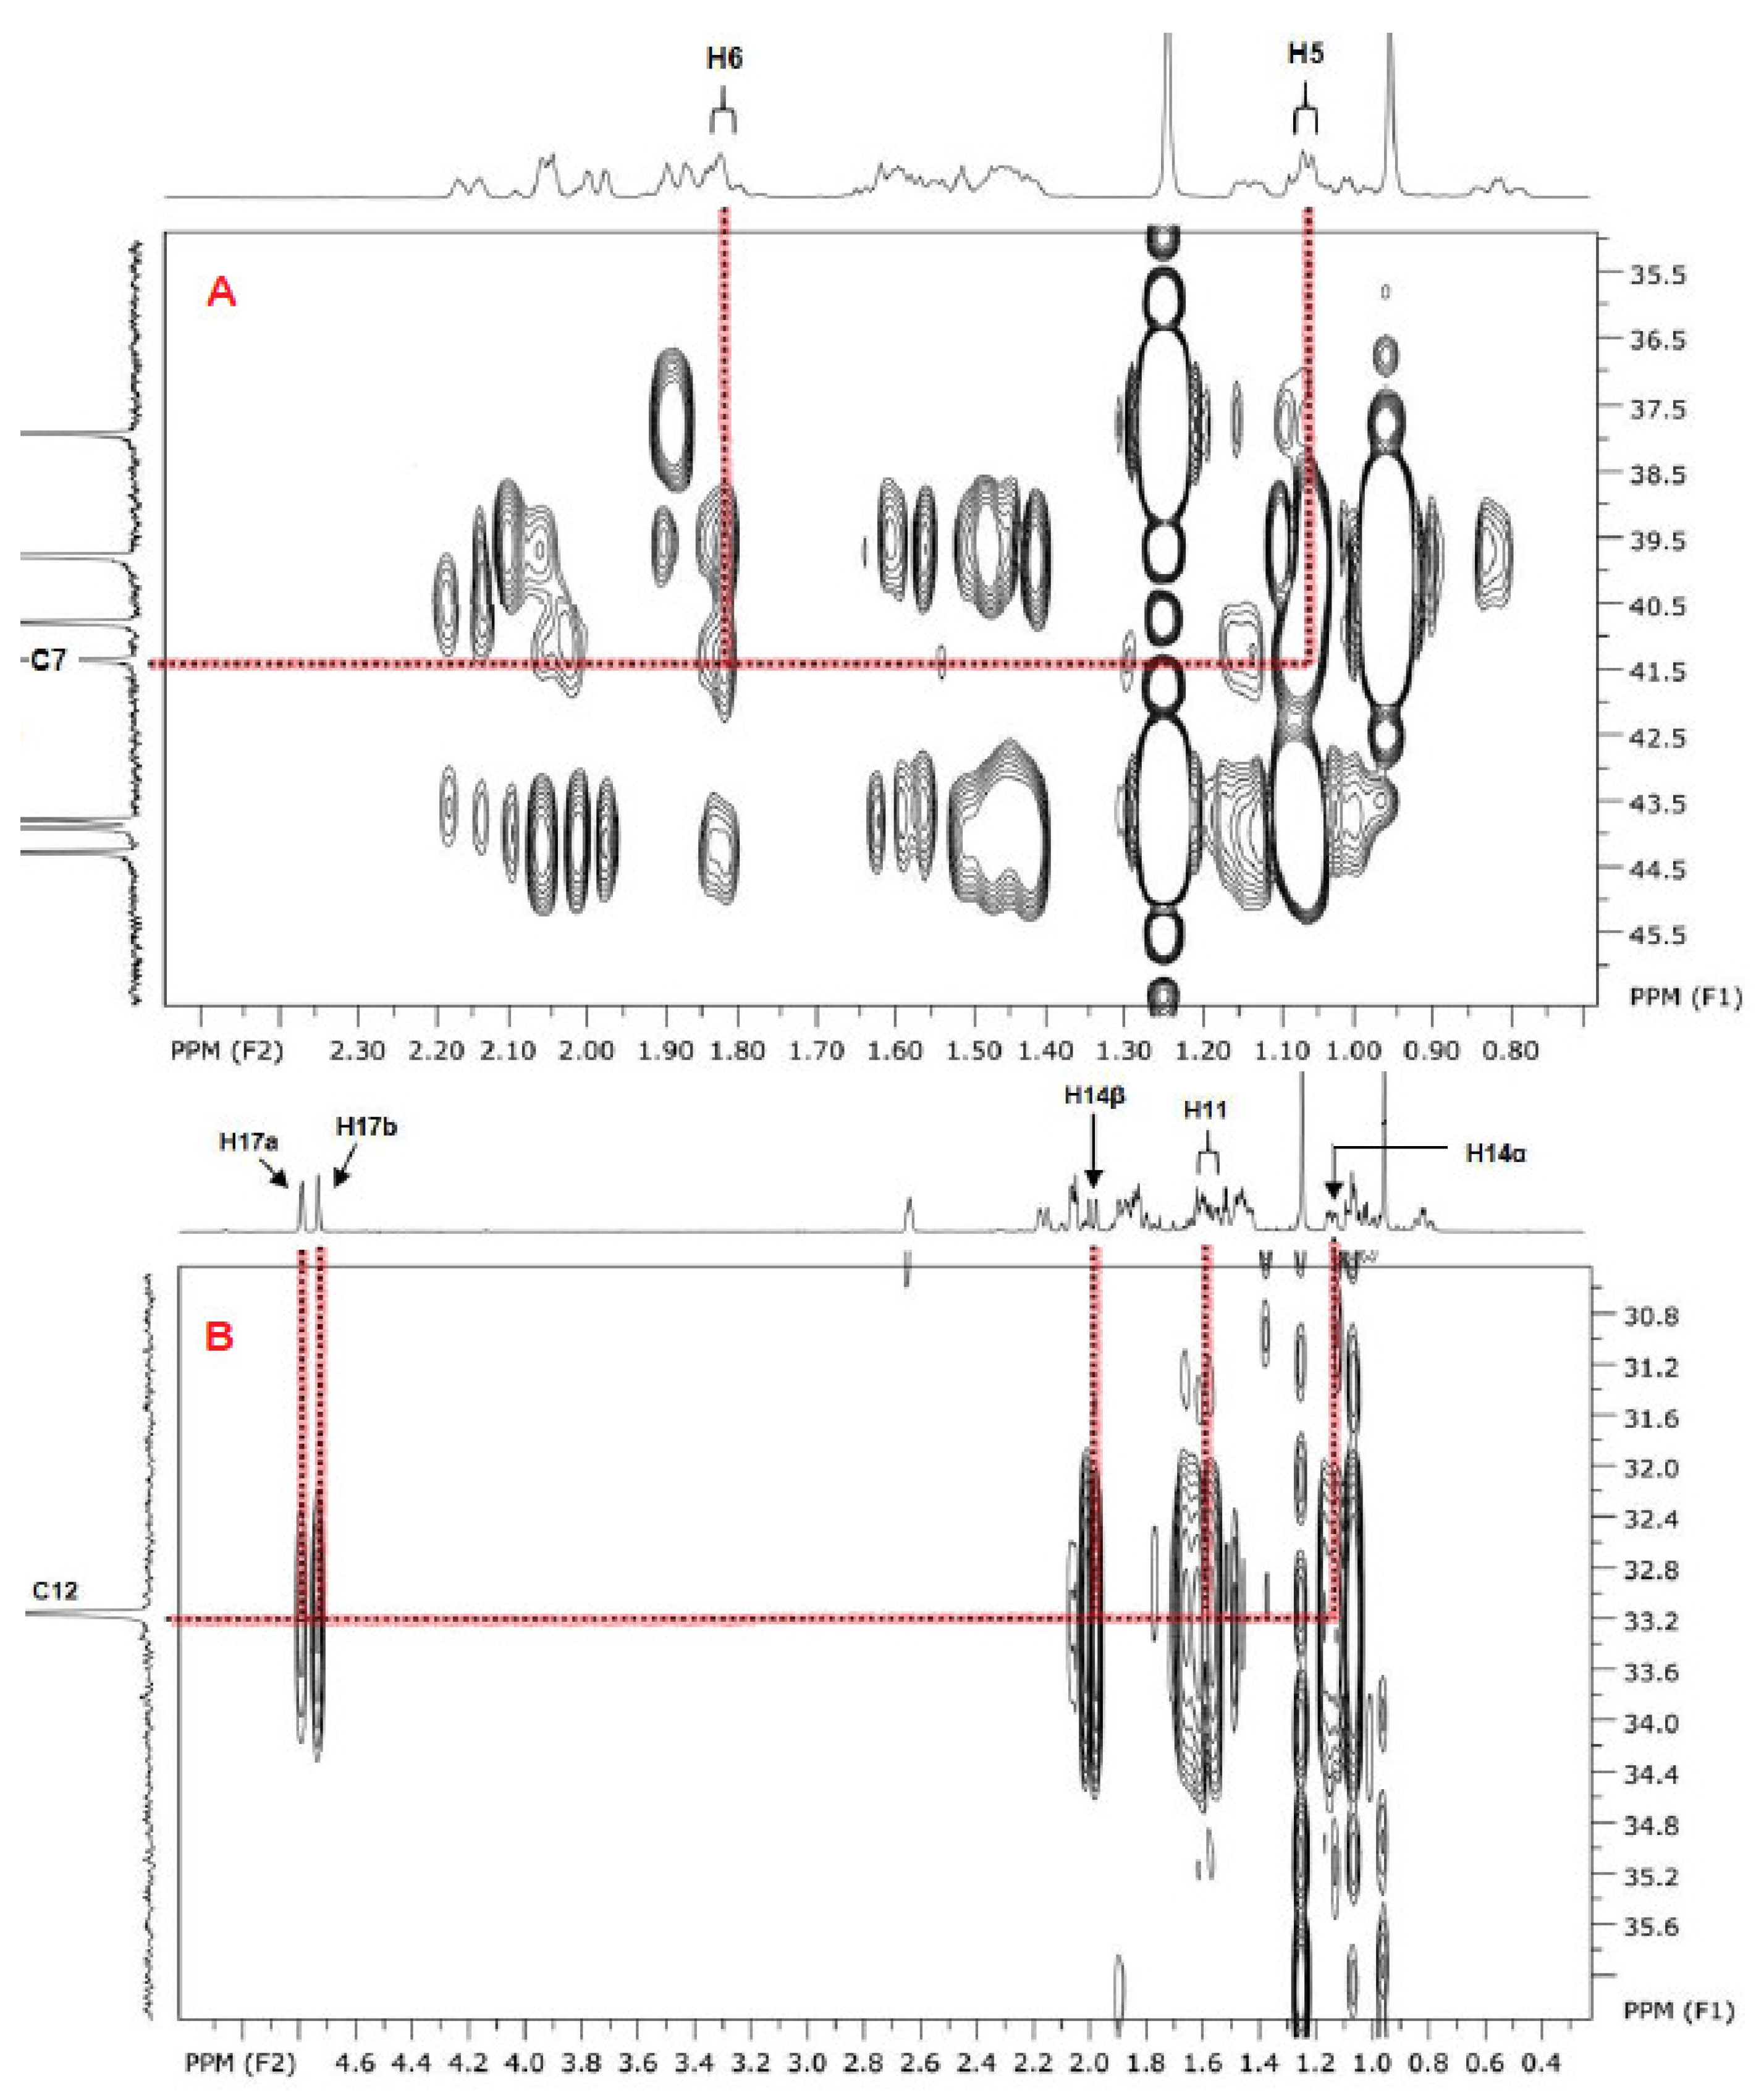
Figure 10.
1H NMR spectrum of ent-kaurenoic acid methyl ester (KAMe) – CDCl3, 400 MHz.
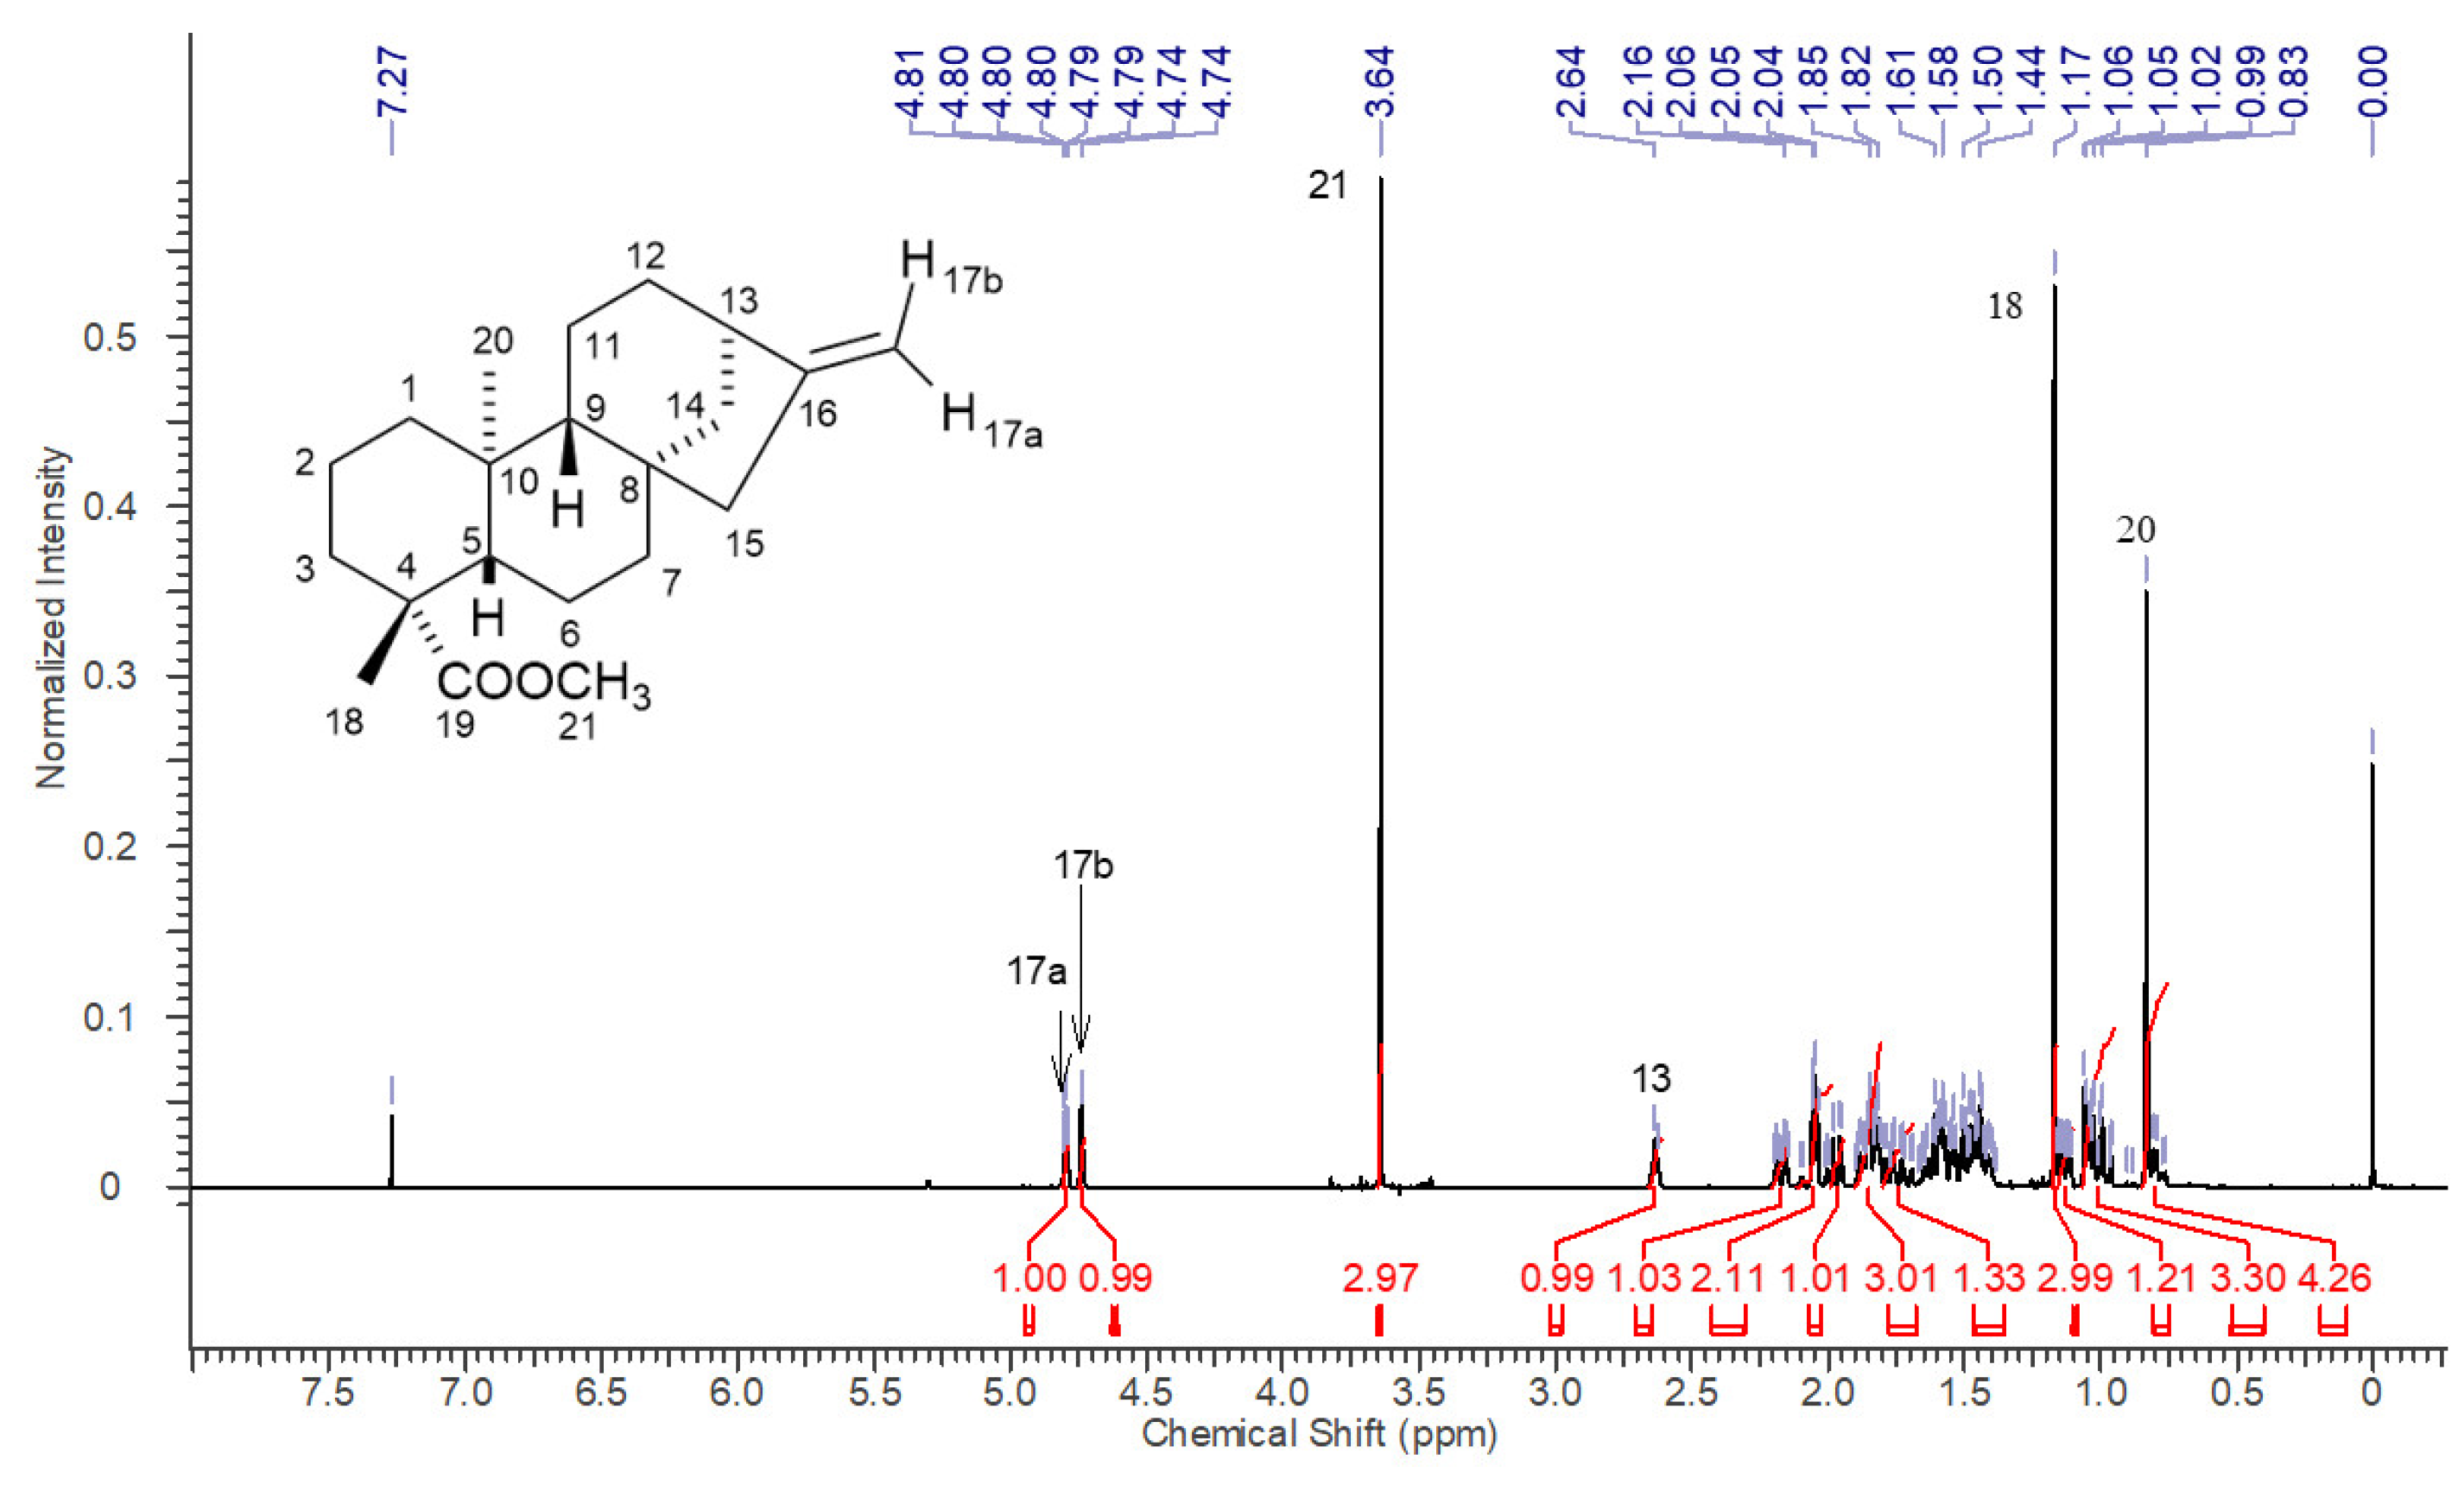
Figure 11.
Expansions of 1H NMR signals H-17a and H-17bs of ent-kaurenoic acid methyl ester (KAMe) – CDCl3, 400 MHz.
Figure 11.
Expansions of 1H NMR signals H-17a and H-17bs of ent-kaurenoic acid methyl ester (KAMe) – CDCl3, 400 MHz.
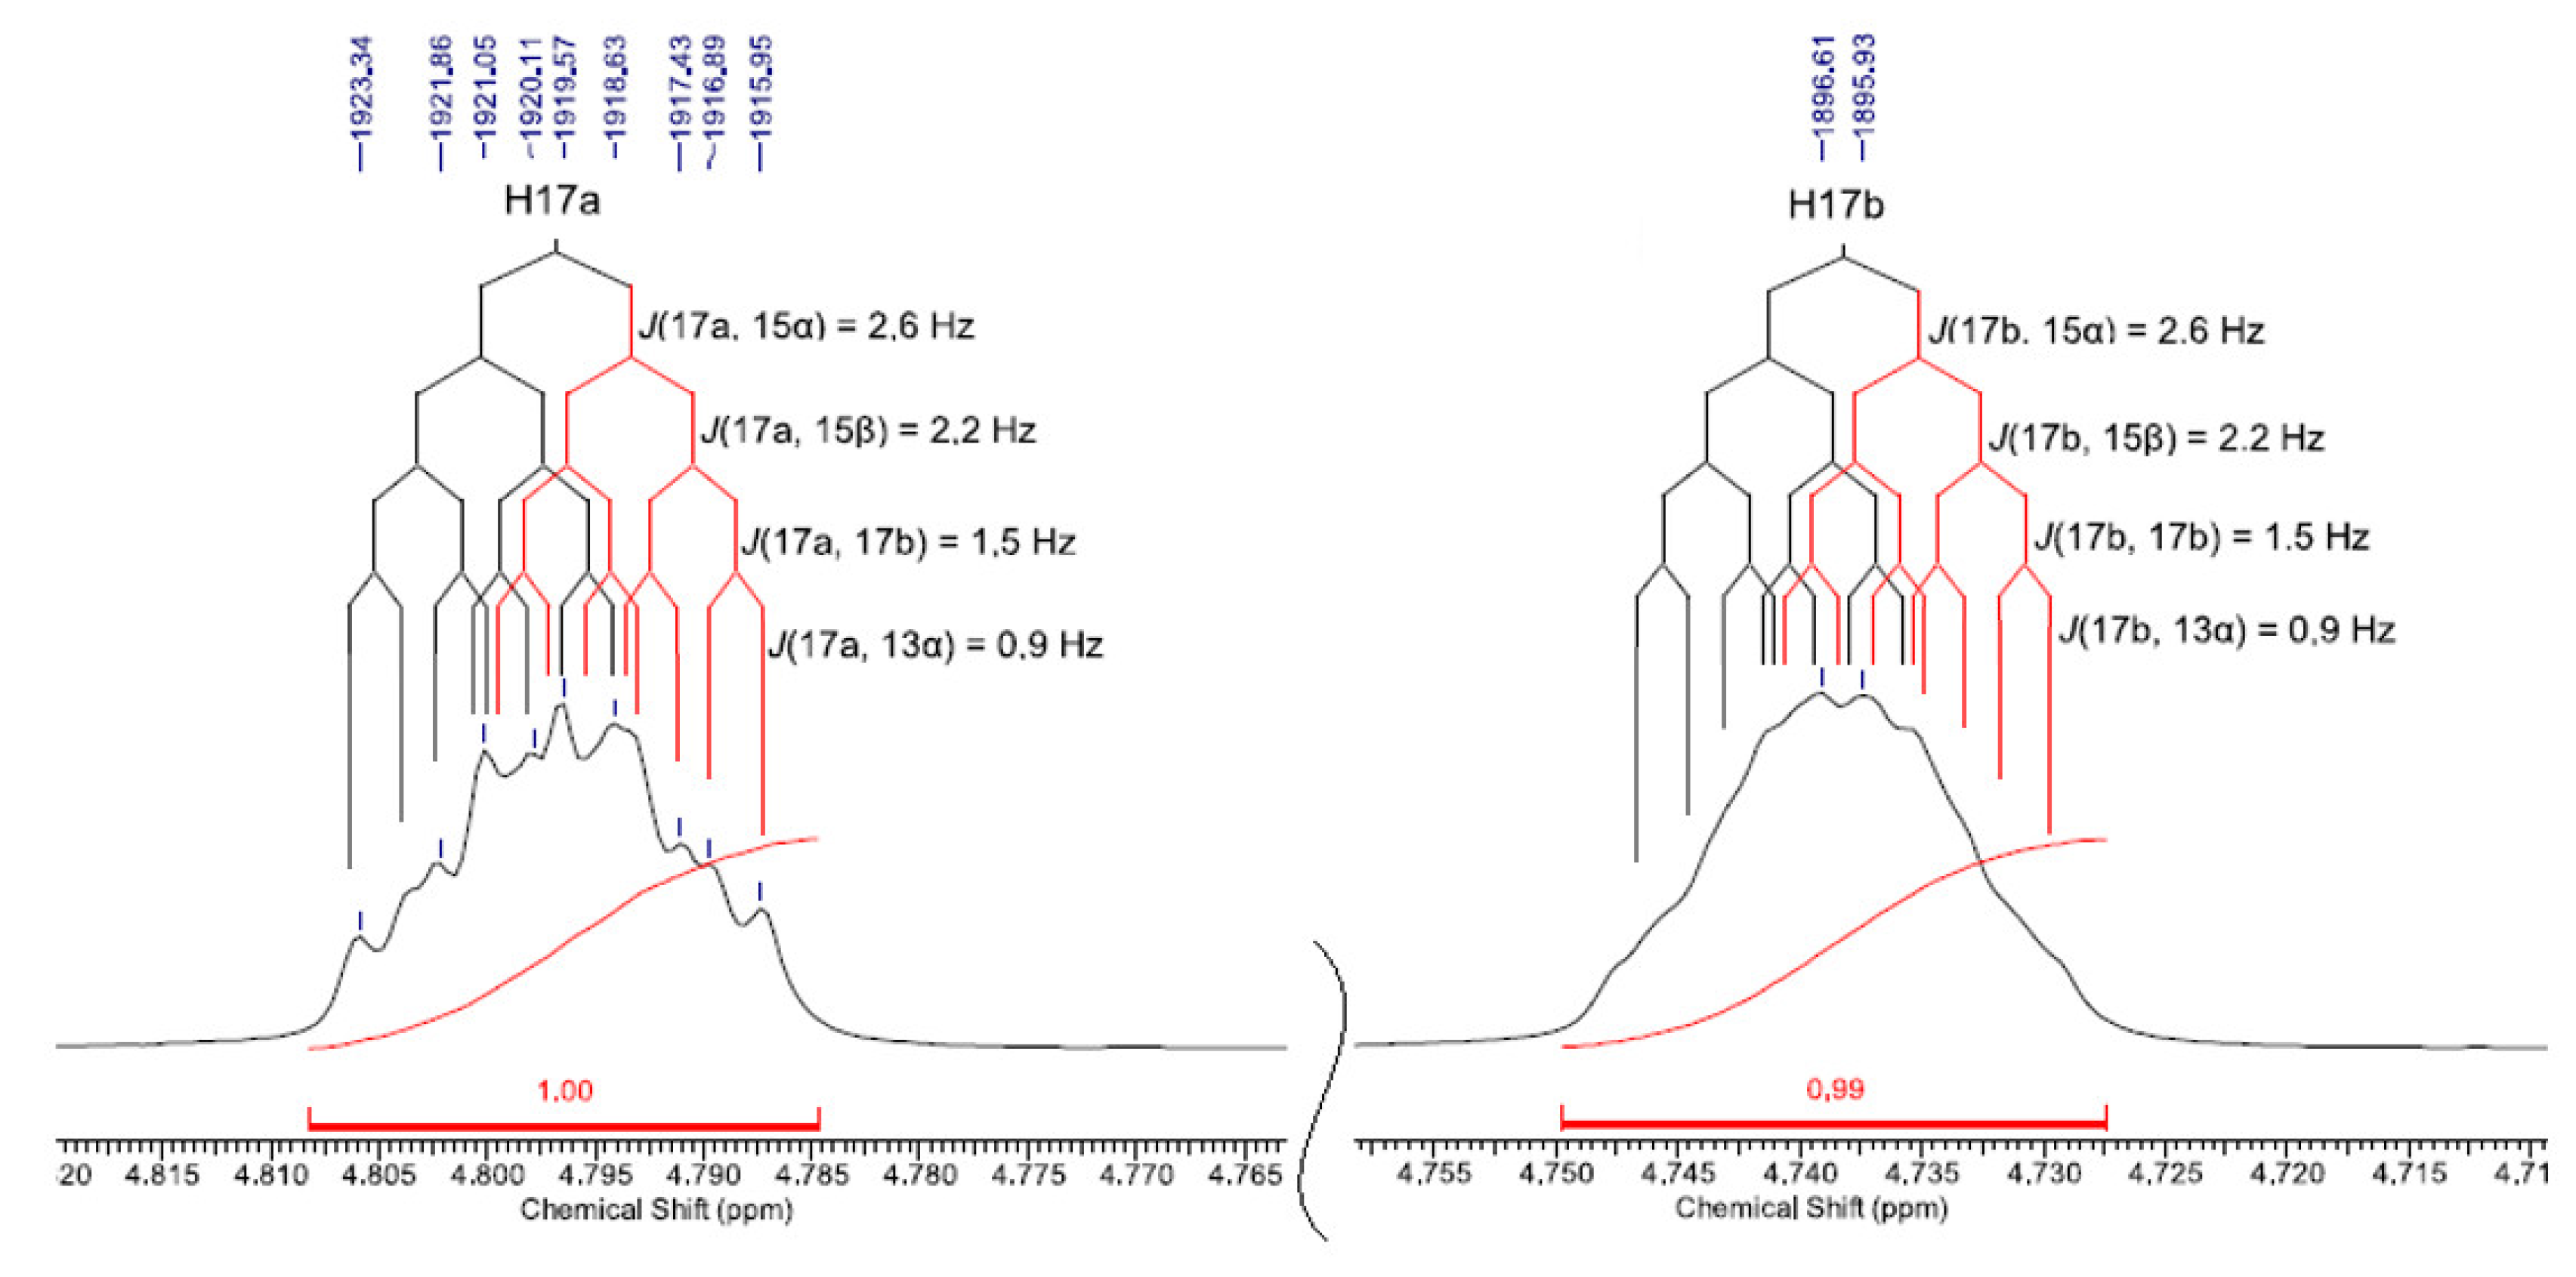
Table 1.
Complete 1H-NMR data for ent-kaurenoic acid (1) (500 MHz).
| C |
H |
CDCl3 δH(ppm) |
CD3OD δH(ppm) |
C6D6 δH(ppm) |
C5D5N δH(ppm) |
Coupling constants (Hz) | Mult. |
| 1 | 1α | 1.88(1H) | 1.89(1H) | 1.71(1H) | 1.85(1H) | J(1α,1β)=13.3;J(1α,2α)=3.9;J(1α,2β)=2.9; J(1α,3α)=1.8 | dddd |
| 1β | 0.81(1H) | 0.84(1H) | 0.60(1H) | 0.82(1H) | J(1β,1α)=13.3;J(1β,2α)=13.3; J(1β,2β)=4.0 | td | |
| 2 | 2α | 1.84(1H) | 1.93(1H) | 2.05(1H) | 2.27(1H) | J(2α,2β)=13.8;J(2α,1β)=13.3; J(2α,3β)=13.2;J(2α,1α)=3.9; J(2α,3α)=3.7 | ddddd |
| 2β | 1.44(1H) | 1.46(1H) | 1.38(1H) | 1.52(1H) | J(2β,2α)=13.8;J(2β,3β)=4.4; J(2β,1β)=4.0;J(2β,1α)=2.9; J(2β,3α)=2.9 | dddt | |
| 3 | 3α | 2.16(1H) | 2.13(1H) | 2.28(1H) | 2.48(1H) | J(3α,3β)=13.4;J(3α,2α)=3.7;J(3α,2β)=2.9; J(3α,1α)=1.8 | dddd |
| 3β | 1.01(1H) | 1.01(1H) | 0.83(1H) | 1.08(1H) | J(3β,3α)=13.4;J(3β,2α)=13.2; J(3β,2β)=4.4 | ddd | |
| 4 | --- | --- | --- | --- | --- | ||
| 5 | 5β | 1.06(1H) | 1.07(1H) | 0.83 (1H) | 1.06(1H) | J(5β,6α)=12.3; J(5β,6β)=2.2 | dd |
| 6 | 6α | 1.81(1H) | 1.85(1H) | 1.94 (1H) | 2.18(1H) | J(6α,6β)=13.8;J(6α,7β)=12.9;J(6α,5β)=12.3; J(6α,7α)=3.1 | dddd |
| 6β | 1.83(1H) | 1.89(1H) | 1.83 (1H) | 2.04(1H) | J(6β,6α)=13.8;J(6β,7β)=3.7;J(6β,7α)=3.1; J(6β,5β)=2.2 | dddd | |
| 7 | 7α | 1.51(1H) | 1.52(1H) | 1.42(1H) | 1.52(1H) | J(7α,7β)=13.1;J(7α,6α)=3.1;J(7α,6β)=3.1 | dt |
| 7β | 1.44(1H) | 1.46(1H) | 1.28(1H) | 1.45(1H) | J(7β,7α)=13.1;J(7β,6α)=12.9;J(7β,6β)=3.7 | ddd | |
| 8 | --- | --- | --- | --- | |||
| 9 | 9β | 1.07(1H) | 1,08(1H) | 0.89(1H) | 1.05(1H) | J(9β,11α)=8.7;J(9β,11β)=1.6;J(9β,14α)=1.4 | ddd |
| 10 | --- | --- | --- | --- | --- | ||
| 11 | 11α | 1.58(1H) | 1.62(1H) | 1.66(1H) | 1.65(1H) |
J(11α,11β)=13.5;J(11α;12α)=9.5; J(11α;12β)=8.7;J(11α;9β)=8.7 |
ddt |
| 11β | 1.46(1H) | 1.42(1H) | 1.45(1H) | 1.54(1H) | J(11β,11α)=13.5;J(11β,12β)=3.4; J(11β,12α)=2.6;J(11β,9β)=1.6 | dddd | |
| 12 | 12α | 1.60(1H) | 1.64(1H) | 1.50(1H) | 1.53(1H) |
J(12α,12β)=14.3; J(12α,11α)=9.5; J(12α,11β)=2.6;J(12α,13)=1.9 |
dddd |
| 12β | 1.47(1H) | 1.62(1H) | 1.47(1H) | 1.49(1H) | J(12β,12α)=14.3;J(12β,11α)=8.7; J(12β,11β)=3.4;J(12β,13α)=4.4;J(12β,14α)= 1.7 | ddddd | |
| 13 | 13α | 2.64(1H) | 2.61(1H) | 2.62(1H) | 2.60(1H) | J(13α,14α)=5.0;J(13α,12β)=4.4; J(13α,12α)=1.9;J(13α,17a)=0.9; J(13α,17b)=0.9 | dddt |
| 14 | 14β | 1.99(1H) | 2.01(1H) | 1.86(1H) | 1.96(1H) | J(14β,14α)=11.4; J(14β,15β)=1.9 | dd |
| 14α | 1.14(1H) | 1.12(1H) | 1.06(1H) | 1.06(1H) | J(14α,14β)=11.4;J(14α,13α)=5.0; J(14α,12β)= 1.7; J(14α, 9β)=1.4 | dddd | |
| 15 | 15β | 2.08(1H) | 2.08(1H) | 2.03(1H) | 2.12(1H) | J(15β,15α)=16.8;J(15β,17a)=2.2; J(15β,17b)2.2; J(15β,14β)=1.9 | dtd |
| 15α | 2.03(1H) | 2.05(1H) | 2.03(1H) | 2.04(1H) | J(15α,15β)=16.8;J(15α,17a)=2.6; J(15α,17b)=2.6 | dt | |
| 16 | --- | --- | --- | --- | --- | ||
| 17 | 17a | 4.80(1H) | 4.78(1H) | 4.97(1H) | 4.92(1H) | J(17a,15α)=2.6;J(17a,15β)=2.2; J(17a,17b)=1.5; J(17a,13α)=0.9 | dddd |
| 17b | 4.74(1H) | 4.72(1H) | 4.93(1H) | 4.88(1H) | J(17b,15α)=2.6;J(17b,15β)=2.2; J(17b,17a)=1.5; J(17b,13α)=0.9 | dddd | |
| 18 | 18β | 1.24(3H) | 1.18(3H) | 1.11(3H) | 1.36(3H) | s | |
| 19 | --- | --- | --- | --- | --- | ||
| 20 | 20α | 0.95(3H) | 0.98(3H) | 1.00(3H) | 1.15(3H) |
s |
Font colors indicate which solvent used in experiment provided the data.
Table 2.
Complete 13C-NMR data for ent-kaurenoic acid (1) (500 MHz).
| C | CDCl3 δC(ppm) |
CD3OD δC(ppm) |
C6D6 δC(ppm) |
C5D5N δC(ppm) |
| 1 | 40.7 | 42.2 | 40.8 | 41.1 |
| 2 | 19.1 | 20.5 | 19.5 | 19.9 |
| 3 | 37.8 | 39.4 | 38.0 | 38.7 |
| 4 | 43.8 | 44.8 | 44.4 | 44.0 |
| 5 | 57.1 | 58.4 | 57.1 | 57.1 |
| 6 | 21.9 | 23.3 | 22.2 | 22.6 |
| 7 | 41.3 | 42.7 | 41.5 | 41.7 |
| 8 | 44.3 | 45.6 | 44.1 | 44.5 |
| 9 | 55.2 | 56.7 | 55.3 | 55.3 |
| 10 | 39.7 | 41.0 | 39.9 | 40.0 |
| 11 | 18.4 | 19.6 | 18,7 | 18.7 |
| 12 | 33.1 | 34.4 | 33.4 | 33.4 |
| 13 | 43.9 | 45.4 | 44.3 | 44.2 |
| 14 | 39.7 | 40.9 | 39.9 | 39.9 |
| 15 | 49.0 | 50.3 | 49.4 | 49.3 |
| 16 | 155.9 | 157.0 | 155.7 | 156.0 |
| 17 | 103.0 | 103.8 | 103.6 | 103.5 |
| 18 | 29.0 | 29.7 | 29.0 | 29.4 |
| 19 | 184.1 | 181.9 | 185.1 | 180.1 |
| 20 | 15.6 | 16.5 | 16.0 | 16.1 |
Disclaimer/Publisher’s Note: The statements, opinions and data contained in all publications are solely those of the individual author(s) and contributor(s) and not of MDPI and/or the editor(s). MDPI and/or the editor(s) disclaim responsibility for any injury to people or property resulting from any ideas, methods, instructions or products referred to in the content. |
© 2025 by the authors. Licensee MDPI, Basel, Switzerland. This article is an open access article distributed under the terms and conditions of the Creative Commons Attribution (CC BY) license (http://creativecommons.org/licenses/by/4.0/).
Copyright: This open access article is published under a Creative Commons CC BY 4.0 license, which permit the free download, distribution, and reuse, provided that the author and preprint are cited in any reuse.


