
Submitted:
29 January 2025
Posted:
29 January 2025
You are already at the latest version
Abstract
Background and Objective:
A lifestyle-associated disease, Diabetes Mellitus, mandates compliance with established policies by physicians and patients to achieve optimal glycemic control. Collaborative care from healthcare providers and patients is essential for effective management, which slows disease progression, improves quality of life, and reduces medication costs. This study assessed the effectiveness of pharmacist-led education initiatives on clinical outcomes and direct treatment costs for patients who have diabetes in two public hospitals in Malaysia.
Methods: Four hundred diabetes patients included in the study that were randomly allocated to two corresponding groups. Another group as the control group, consisting of two hundred patients, received standard treatment, whereas the patients in intervention group, including two hundred patients, received pharmacist-led care via Diabetic Medication Therapy Adherence Clinics (DMTAC) with conventional treatment. Pharmacists provided educational interventions emphasizing dietary adjustments, lifestyle modifications, the significance of physical activity, and appropriate medication storage. Among these, 143 control patients and 156 intervention patients completed the one-year study, which comprised two follow-up visits. Clinical outcomes and treatment expenses were evaluated and the analysis of data was performed utilizing version 24 SPSS. Descriptive statistics were presented as mean ± standard deviation, including normality assessed using the skewness, kurtosis and Kolmogorov-Smirnov test. Two-way ANOVA or Independent t-tests were applied for hypothesis testing when data showed normal distribution.
Results: After the research, group receiving intervention had a much higher decrease in HbA1c levels relative to the control group (3.59% versus 2.17%; p < 0.001). The intervention group had considerable decreases in systolic blood pressure (9.29 mmHg) and similarly in diastolic blood pressure (7.58 mmHg; with p < 0.005). Additionally, levels of cholestrol in the intervention group improved significantly (0.13 mmol/L; p < 0.001). Moreover, treatment expenses for the pharmacist-led intervention group shown a substantial reduction (p < 0.001). By the second follow-up, the additional cost per patient since baseline was RM 236.07 in the control group, compared to only RM 47.33 per patient in the intervention group with pharmacist involvement.
Conclusion: Pharmacist-led interventions led to a significant improvement in HbA1c levels. While medication expenses increased in both groups from the initial follow-up, the control group exhibited significantly greater increase levels than the intervention group.
Keywords:
Diabetes mellitus
; cost of medication
; Glycated haemoglobin (HbA1c)
; Pharmacist led educational intervention
; lifestyle modification
1. Introduction
The impact of pharmacists is extensively documented worldwide in ensuring the suitability and efficacy of pharmacotherapy, as well as enhancing patient adherence to treatment regimens (American Pharmacists Association, 2016). A lifestyle-related condition termed as Diabetes mellitus, requires rigorous glycemic regulation. This relies not only on physician adherence to clinical guidelines for managing diseases but also significantly on patient compliance with prescribed pharmaceutical regimens (Polonsky & Henry, 2016). Patient adherence to prescribed medicine, precise dosing schedules, proper usage, and the appropriate storage of insulin devices are essential considerations for achieving compliance. The compliance of patients can be enhanced through proficient counseling and education delivered by healthcare experts, as the consequences of unmanaged diabetes lead to numerous issues. (Polonsky & Henry, 2016). Global studies demonstrate that healthcare practitioners' engagement in patient education results in improved outcomes in diabetes mellitus management. (Jeong et al., 2018). However, it remains essential to assess the diverse elements of pharmacist-led interventions through counselling of patients on every dimensions and outcome of the condition of diabetes mellitus.
Currently, there is no known cure for Type 2 Diabetes Mellitus (T2DM). However, the condition can be managed to slow down the progression of diabetic complications and enhance the quality of life for patients (Marín-Peñalver et al., 2016). Maintaining proper glycemic control is essential in dropping the risk of microvascular and macrovascular complications in diabetic patients (Iqbal et al., 2019). The primary goal of T2DM management is to minimize the occurrence of acute and chronic microvascular and macrovascular complications (CPG Malaysia, 2015). The global prevalence of T2DM is steadily increasing (Sugawara & Nikaido, 2014), with adults in developing countries being at a particularly higher risk of developing the condition (Paz-Pacheco, 2011).
The global prevalence of diabetes continues to rise annually and is projected to reach up to 642 million cases by 2040 (Zheng et al., 2018). Approximately 90% of all diabetes cases are belonged to T2DM, and is contributing to a growing economic burden on global healthcare systems (Korean Diabetes Association, 2016). The prevention of T2DM is the ultimate solution and has proven to be cost-effective (Andreas Liebl et al., 2015). However, providing cost-effective treatment options for all T2DM patients still remains crucial (Andreas Liebl et al., 2015; Massi-Benedetti, 2002). Poor glycemic control can lead to various microvascular complications of diabetes in all diabetic patients, which may eventually progress to macrovascular complications (Boehme et al., 2015; Long & Dagogo-Jack, 2011). Management of these complications is the main expenditure in the cost of treatment required for all patients of T2DM (Liebl et al., 2002; Williams et al., 2002). The global healthcare expenditure in 2010 for the treatment and prevention of diabetes and its complications amounted to USD 376 billion, with projections estimating it will increase to USD 490 billion by 2030 (Zhang et al., 2010).
Numerous studies conducted in Malaysia have estimated the expenses related to multiple aspects of diabetes care. Inpatient expenses for diabetes treatment at Ministry of Health (MOH) facilities without experts came to about RM1,951.00 annually, according to a study by Sharifa Ezat and colleagues. On the other hand, the inpatient cost for diabetes care at Ministry of Health (MOH) facilities increases to about RM 1,974.44 annually when experts are available (Sharifa Ezat WP et al., 2009). The annual expense of ambulatory care for each patient's follow-up, excluding any diabetic problems, was estimated to be around RM 459 by Mustapha et al. in another study. However, in the presence of diabetic complications, the cost exceeded RM 4,000 per year per patient (Mustapha et al., 2017). The study conducted by Stratton and team demonstrated that each 1% reduction in mean HbA1c is associated with a 21% reduction in the risk of microvascular complications (Stratton et al., 2000). Consequently, effective glucose management is necessary to evade or delay the development of complications by diabetes, which can eventually result in lower T2DM treatment expenses.
An ambulatory care facility run by pharmacists in partnership with doctors, the Diabetes Medication Therapy Adherence Clinic (DMTAC) in the country of Malaysia helps diabetic patients improve their glycemic control and medication compliance. During the minimum of eight follow-up visits, diabetic patients enrolled in the DMTAC program receive medication adherence evaluations, drug-related problem detection and resolution, medication counseling, clinical outcome assessment, and diabetes education provided by the pharmacist. In addition to the usual consultations with physicians, patients registered in the DMTAC services also receive additional educational sessions from the pharmacist (Ministry of Health Malaysia, 2014).
According to previously published research, Malaysian diabetic patients' lack of understanding of the disease has led to inadequate disease control in the nation. Patients with diabetes require collaborative care from healthcare practitioners who must also educate them about the condition and the significance of modifying their lifestyles. There is inadequate study evidence and scientific data to support the impact of educational interventions on clinical consequences measures in patients with diabetes across several public hospitals across Malaysia. Furthermore, that is inadequate data to justify the efficacy of educational interventions on the direct medicinal expenditures of therapy spent by the Malaysia’s Ministry of Health, as well as their impact on diabetic complications. Moreover, the influence of pharmacist-led educational interventions by the government DMTAC program on treatment outcomes, the direct medication expenses incurred by the Malysia’s Ministry of Health, and the implications from such interventions to improve the management of diabetes complications’s signs and symptoms have not been examined at public hospitals in Malaysia. The necessity for an in-depth investigation is underscored by these comprehensive interpretations to evaluate the influence of engagement by the pharmacist across entirely critical diabetic domains in diabetic patients.
As right now, no prospective follow-up study has been undertaken at multicenter public hospitals to explicitly investigate the role of pharmacist in the diabetic patients management using the DMTAC concept across Malaysia's public healthcare system. No research has been undertaken to assess the impact of DMTAC services throughout Malaysia on the treatment expenses generated by public hospitals. The objective of this investigation is to determine the correlation between the effectiveness of educational interventions governed by pharmacists through DMTAC services at the Malaysian public hospitals and the clinical consequences of diabetes mellitus, specifically examining the impact of these interventions on the direct treatment costs spent by the government for diabetes management.
2. Methodology
2.1. Study Population & Study Approvals
This randomized controlled trial (RCT) was conducted at two distinct tertiary care hospitals in the city Kedah of Malaysia. The study was registered as a multicenter clinical trial in compliance with World Health Organization guidelines (ACTRN12621001128886) on the Australian New Zealand Clinical Trials Registry. Additionally, the present study was also approved and registered with the National Medical Research Register (NMRR-17-2381-38042). The approval for conduct and publish was also taken from the authorities of local study center and the MREC Committee under Ministry of Health Malaysia (KKM/NIHSEC/P18-1307[13]).
Sample size required for this study has been designed based on a 2016 research by Mubashra et al. [21]. The sample size calculation intended to compare average blood glucose levels between the study arms. It determined that approximately 65 participants per group would be required to detect a 0.80% difference in HbA1c levels (8.48% vs. 9.27%) with power of 80%, 0.05 level of alpha, and a standard deviation (σ) of 1.61. The ultimate sample size was adjusted to 80 diabetic patients per arm in order to account for a 20% dropout rate. The null hypothesis was tested using the independent t-test, with a level of significance on 0.05.
2.2. Procedure and Randomization
Patients of diabetes were recruited in the study groups as per the determined sample size, subsequent to obtaining the approval of study. A recruitment period of three to four months was established, depending upon influx of patients at designated study locations. Initially, six hundred consent was obtained through an Informed Consent Form (ICF), eligible patients with type 2 diabetes were enrolled. Patient information was then recorded in Microsoft Excel, and a randomization process was conducted to ensure unbiased distribution into control and intervention groups. To further minimize potential bias, a secondary randomization was performed within each group to select 200 patients in both the control and intervention groups., as detailed in the study flow chart. The specifics of both study arms are outlined below.
Control Group: Adult diabetic patients receiving standard care at the outpatient diabetic clinics of the specified study hospitals were included in the control group.
Intervention Group: Adult diabetic patients receiving standard care at outpatient diabetic clinics were included in the interventional group. Additionally, they received educational intervention from pharmacists at the selected study hospitals.
Relevant data were obtained from diabetic clinics for the control and DMTAC for the intervention groups at each follow-up. Baseline data at the beginning of the investigation incorporates clinical disease outcomes and medication costs for each diabetic patient. Improvements in clinical outcomes and medication costs were recorded individually from patient files during every follow-up. Two follow-up visits for each group were recorded to assess changes in direct medication cost relative to the baseline observations. Figure 1 below illustrates the entire flow chart of the present study.
2.3. Data Collection Measures
A pre-validated tool was employed to collect patient information and data in the study. The first instrument employed was a data collecting form, which included demographic information of patients and disease-specific clinical outcomes such as Fasting Blood Glucose (FBS), Glycated Hemoglobin (HbA1c), blood pressure, and lipid profile status of individuals with diabetes. The medication costs were obtained from the formulary of the selected study hospitals. The medication cost was computed for a six-month duration based on the daily dosage and treatment regimen. The hospital authorities graciously provided the medication price list, with the consent of the hospital directors.
2.4. Validation of Tools for Data Collection
The data collection form's content validity was evaluated through a panel of specialists, comprising 2 specialists from the clinic of diabetics and 2 chief pharmacists from both study locations. The main instrument for data collection was distributed to clinical specialists for assessment of the relevance, representation, and suitability of all sections of the data collection tool. Each recommendation from the specialists was incorporated into the final data collection tool.
Face validation involved delivering the data collection instrument to a group of 15 individuals, who evaluated its clarity and comprehensibility. The face validation group consisted of 15 individuals: five endocrinologists from each study location, five specialists from an established public institution, and 5 faculty members from the Pharmacy Faculty at a private medical university within Kedah, Malaysia. They were asked to evaluate aspects including readability, clarity, language, and typographical problems. The instrument for data collection was completed following a sequence of discussions with these specialists.
2.5. Data Requisite for Study Tool
Throughout the trial period, medical records of all participating diabetic patients who provided written consent were reviewed, and data collection form was used to record their disease and treatment outcome. The data collection instrument intended for the present study was segmented into 3 sections.
The data collection form was segmented into three sections. The first section collected demographic data, including patient characteristics, social factors, and medical and medication history. The second section focused on clinical outcomes, capturing lab values, improvements in signs and symptoms, and the progression of diabetic complications during each follow-up visit. The third section recorded medication costs, including the cost of diabetes treatment, treatment for comorbidities, and costs related to diabetic complications. All data were collected from the patients' hospital medical files during each follow-up visit. The improvements in both study groups were documented and analyzed at each follow-up.
2.6. Statistical Analysis
The data was analyzed utilizing version 24 SPSS. Continuous data has been analyzed using mean ± standard deviation (SD), while counts and percentages were used to present categorical data that is N (%) for descriptive statistical analysis. The data normality assumption of skewness and kurtosis was evaluated. Additionally, the Shapiro-Wilk test and Kolmogorov-Smirnov test (KS-test) were employed on the collected data to assess its normalcy. If the data had a normal distribution, the One-way ANOVA and independent t-test statistic were employed to assess the null hypothesis. Using Partial Eta Squared (η2), the effect size of a two-way ANOVA was evaluated. Cohen classifies η2 as follows: a minor effect is indicated by 0.01 ≤ η2 ≤ 0.06, a medium effect is indicated by 0.06 ≤ η2 ≤ 0.14, and a large effect is defined by η2 ≥ 0.14. Statistic significance was determined by a p-value of less than 0.05.
2.7. Confidentiality and Data Management
All subject identities were recorded in an encrypted database and were exclusively corresponding to a study identifying number for this investigation. Identification numbers were utilized in place of patient identifiers on the subject datasheets. The entire dataset was entered into a computer that was encrypted. The data from the computer was transmitted to a USB flash drive after the study was finished, and the computer's data was subsequently removed. In compliance with the requirements of MREC Malaysia, investigators will retain USB flash drives and any hardcopy data for at least three years following the conclusion of the study. The USB flash drive and its contents will be entirely erased following the storage period. Participants weren't allowed from accessing the data of their investigation, as it would be combined into a database. Patients were allowed to communicate directly with the investigators in order to request access to the study's findings.
3. Results
The present investigation enrolled a total of 400 diabetic adult patients at the baseline, among which only 299 diabetics succeed in successfully fulfilled the requirement of completing 2 follow up visits for study duration of 1 year for present study. At baseline, a statistical analysis was conducted on all demographic variables of the included patients to identify variations during the recruitment process, and thereby reducing the likelihood of bias in the study.
The study groups baseline characteristics, as illustrated in Table 1, indicate that no statistically significant differences (p > 0.05) were found in the demographics of the patients who were included. Furthermore, the intervention group and the control group did not exhibit any significant differences in their educational backgrounds.. A negligible difference was noted in the age and duration of the disease in the present investigation.
3.1. Clinical Outcome Measurements
The study evaluated changes in glycaemic control under blood glucose levels (RBS) and fasting blood glucose levels (FBS), alongside systolic (BP systolic) and diastolic (BP diastolic) blood pressure, glycated hemoglobin (HbA1c), total cholesterol, triglycerides, and High-Density Lipoprotein Cholesterol (HDL-C), and Low-Density Lipoprotein Cholesterol (LDL-C)
The baseline did not reveal any significant differences between the control group (CG) and the intervention group (IG). The alterations in the aforementioned parameters of the patients are illustrated in Table 2 and Table 3 at six-month intervals (follow-up 1) and one year from baseline (follow-up 2). The changes observed in the control and intervention groups are illustrated in Table 2. Similarly, the observed changes in the intervention group are illustrated in Table 3 below.
3.2. Cost of Medication Measure
The statistical significance of all the characteristics that influence the cost of medication was assessed at the baseline to identify any discrepancies. The differences were found to be statistically insignificant. Consequently, It had been demonstrated that there was no considerable distinction between characteristics of groups under investigation that could potentially influence the cost of medication. Table 4 illustrates each statistical difference. The medication cost for diabetic patients in both study arms was determined for a period of three months using baseline data, as the medicines were issued by hospitals for a specific period of time. Table 4 contains the cost of medication for both study groups.
Insulins were available in the selected study hospitals in three different types, each with a varied duration of action. Nevertheless, patients at baseline were only prescribed intermediate and long-acting insulins. These insulins were also priced differently; the cost of long-acting insulin was RM 25.66 per 100 units., while intermediate-acting insulin was priced at RM 31.55 per 100 units. In a similar way, oral antidiabetics' cost fluctuated in accordance with the medications that were available. The single-active drug tablet were less expensive; however, the combination of two medications in a single tablet was more costly.
The cost of medication for the control group over a three-month period was RM 763.90 at baseline, whereas the intervention group's expense was RM 783.01. The intervention group had a significantly greater number of patients with intermediate-acting insulin than the control group, which resulted in a slight variation. This may have been the explanation for the patients' inclusion in the intervention group. Intermediate-acting insulin was priced higher than long-acting insulin. In a similar way, the prices of all available medications varied.
Moreover, small variation was observed in both study groups for diabetic complication medication. The intervention group had a mean cost of RM 347.49, whereas the control group had an average price of RM 350.21. Nevertheless, The costs of diabetic complications lacked a statistically significant relationship (p=0.253) between the two groups.
Likewise, a statistically insignificant correlation was seen in both study groups (p=0.150) in other miscellaneous drugs. Additional supportive medications, including calcium lactate, bisacodyl, omeprazole, and certain antihistamines and antiemetics, are present in these miscellaneous drugs.
Medication costs in the intervention group continued to decrease significantly at the first follow-up as a result of lifestyle modification and pharmacist intervention. On the other hand, in the control group, there was little variation in the cost of medication. The cost of insulin increased as a result of the change in treatment of some patients who were not showing any response to pharmacological therapy in the control group's insulin from long-acting to intermediate-acting.
Intermediate-acting insulin costs approximately RM 31.55 per 100 units, while long-acting insulin costs approximately RM 25.66 per 100 units. Furthermore, some patients in the control group were shifted to a combination medication of oral antidiabetics and insulin when they weren't responding to the prescribed pharmaceutical treatment.
Insulin consumption costs were significantly different between the two groups during the first follow-up (p=0.009). The cost of oral antidiabetic medicines were additionally considerably greater in the control group compared to the intervention group (p=<0.001). In contrast, the intervention the group's use of Non-Steroidal Anti-inflammatory Drugs and other medications remained declined during follow-up 1. However, the control group of the present study experienced a rise in their consumption during the same period. Table 5 demonstrates these changes.
There was a statistically significant difference between the two study groups at the second follow-up of the current investigation regarding the cost of all stated variables for the medication cost. In the control group, some patients had to change their medication regimen since their bodies weren't responding to the insulin they had previously given. Some of them able to increase the daily unit dosages of insulin. Conversely, physicians in both study locations transitioned a portion of the participants to intermediate-acting insulins. Therefore, the cost of medication per patient will ultimately increase if the unit dose is increased or the insulin is changed.
In both study groups, there was a statistically significant increase in the cost of insulin per patient (p=<0.001), as illustrated in Table 6. The control group spent an average of RM 918.62 on insulin for each patient, while the mean cost of insulin per patient in the intervention group was approximately RM 811.94. That increment was due to the fact that for each patient baseline in the control group was approximately RM 154.72. The intervention group, on the other hand, had a far lower baseline of only RM 28.93 per patient.
However, the control group had an increase in the cost of multivitamins and minerals during the follow-up period from the baseline, resulting in a cost of RM 2.59 per patient. However, the intervention group experienced a decrease of up to RM 0.37 per patient from the current study's baseline data. Same change have been found in Nonsteroidal Anti-Inflammatory Drug as well as in other supportive medications such as bisacodyl, omeprazole, calcium lactate, and certain antihistamines and antiemetics.
The modifications are illustrated in Table 6 as follows.
4. Discussion
The present study was the first of its kind in Malaysia to investigate the pharmacists' contributions to medication cost reduction. It was conducted over a year in two distinct tertiary care hospitals. As far as we are aware, no research has been conducted in Malaysia to determine the impact of pharmacist led intervention on the expense of medication therapy in any public tertiary care hospital. Only few studies have attempted to assess the full cost of diabetes mellitus therapy in Malaysia. Nevertheless, not a single one of these studies observed at how dietary or educational modifications affected the efficacy of diabetes medications.
Two parallel arms, control and the intervention group, formed the current investigation. Patients received the standard/usual treatment in the control group, whereas the pharmacist led educational intervention was given to interventional group. The Diabetes Medication Therapy Adherence Clinic (DMTAC) pharmacist provided continuous patient education to diabetic patients in the intervention group, covering topics such as disease management, diet modification, lifestyle modifications, physical activities, and treatment adherence. The consumption and utilization of drugs can be reduced with the assistance of these educational interventions. Consequently, the Malaysian Health Ministry's objective of establishing DMTAC departments in all public tertiary care institutions was to reduce the cost of treatment. (Pharmaceutical Services Division Ministry of Health, 2014)
Statistical significance was assessed for all characteristics that influenced the cost of medication at the baseline to identify the variances among the two study groups. In both study cohorts, no statistically significant differences were observed in the factors that could affect medication expenses. At baseline and at each three-month follow-up, the medication expenses for both groups were calculated, as the hospitals were only administering medications for a three-month period. The expense of medications includes the cost of insulin, oral antidiabetics, medications for complications and diabetic co-morbidities, minerals and multivitamins, as well as Non-Steroidal Anti-Inflammatory Drugs and other drugs administered to patients. Further various medications include medicinal agents such as omeprazole, bisacodyl, calcium lactate, some antihistamines, and certain antiemetics.
At baseline, the drug costs for both study groups were similar. Two study groups did not differ significantly with respect to the cost of medications; for instance, in the control group, the average cost of inulin was RM 763.90. Conversely, RM 783.01 per patient was the average cost in the intervention group (p=0.258). The group receiving the intervention exhibited a slight variation, as it contained more patients utilizing intermediate-acting insulin than the control group. The cost of intermediate-acting insulin was greater than that of long-acting insulin. The prices of various insulins varied; long-acting insulin was priced at RM 25.66 per 100 units, while intermediate-acting insulin was priced at RM 31.55 per 100 units. The expense of oral antidiabetics fluctuated based on the available medication list. The individual active medicine tablets were less expensive; however, the combination tablet containing two pharmaceuticals was costly. (Malaysian Ministry of Health Medicines Formulary 2019).
On an average, the cost to treat diabetic complications was RM 350.21 per patient in the control group and RM 347.49 per patient in the intervention group (p=0.253). The average price was calculated for each medicine used. Though, a few alterations were seen in the medicine costs. However, no statistically significant association (p=0.253) was observed between the costs of diabetic complications in either study group. A Non-significant statistical association (p=0.150) was detected in both study groups regarding other miscellaneous medications.
The average cost of insulin in the control group went to RM 110.53 from the baseline at follow-up 1. Conversely, the mean increase in insulin expenditure for the intervention group was approximately RM 33.39 per patient. A statistically significant variation (p=0.009) in the cost of insulin was noted during the second follow-up among the study groups. The expense of insulin in the control group additionally increased. Potential cause of this was the alteration in insulin. The alteration in insulin directly increases medication expenses (Wang et al., 2010) as specific people unresponsive to long-acting insulin therapy were transitioned to intermediate-acting insulin in the control group. The long-acting insulin price was approximately RM 25.66 per 100 units, whereas the intermediate-acting insulin price was RM 31.55 per 100 units.
The mean prescription expense for antidiabetics (oral) in the study group which serve as control increased from the baseline by approximately RM 17.03. However, the rise in the study group which serve as interventional group per patient was around RM 2.78. The expense of oral antidiabetic medications was markedly (p=<0.001) elevated in the control group compared to the intervention group at follow-up 2. The likely explanation for this might be because participants in the control group, who shown a lack of responsiveness to the prescribed oral antidiabetic pharmacotherapy combined with the insulin, were then switched to a combined regimen of oral antidiabetics. The price of an active drug which was single shown to be less than that of a combination of two or three active compounds in the same tablet formulation; for instance, the price of a 500mg metformin tablet was 0.10 each. In contrast, the price of metformin 1g combined with sitagliptin 50mg was RM 1.88 per tablet.
However, utilization of NSAIDs and other medications persisted in declining during the second follow-up for the intervention group, whereas concurrently, their usage grew in the study group control. In contrast, in the study group serving as an intervention group, prescription costs continued towards decline throughout the second follow-up, facilitated by lifestyle changes, physical activity, and dietary modifications, alongside pharmacist educational intervention. However, in the control group, the pharmaceutical costs exhibited minor fluctuations. The cost of drugs increased in both of the study groups during the second follow-up.
In the current study, the rise in medicine prices in the control group thrice more than in the intervention group. The results of the second follow-up of our investigation aligned with a study conducted in India by Dussa and colleagues, which indicated that pharmacist involvement reduced hospitalization costs for diabetic patients (Dussa et al., 2017). But the reported study's deficiencies was its single-centre design, which involved only one population undergoing intervention. Our investigation included two distinct patient groups.
At follow-up 2, a statistically significant difference was observed between the two study groups for the total pharmaceutical costs across all included cost parameters in the present investigation. A statistically significant difference (p=<0.001) in insulin expenses per patient was seen between the two study groups. The average price of insulin in the control group was RM 896.02, but the average price per patient in the intervention group was roughly RM 818.85. The increase in the price occurred because the baseline per patient was around RM 154.72 in the control group, whereas in the intervention group, the increase per patient was only RM 28.93 from the baseline. Likewise, the cost of multivitamins and minerals increased in the last follow-up following baseline, attaining RM 2.59 per patient in the control group. In the intervention group, it decreased by as much as RM 0.37 per patient relative to the baseline data of the current study being conducted. Identical variations have been noted in NSAIDs and other adjunctive medications such as omeprazole, bisacodyl, calcium lactate, some antihistamines, and specific antiemetics. The possible explanation for this variance or rise in drug costs in the control group, could be similar, relative to the intervention group. In the control group, certain individuals who weren't responsive to the insulin which was prescribed, required to change the pharmacological regimen. Several individuals succeeded in increasing the daily unit dosages of insulin.
On the other hand, some people by physicians in both study locations advised the switch to intermediate-acting insulins. Consequently, an increase in the unit dose or a modification of the insulin will ultimately elevate the prescription costs per patient. A similar rationale could be behind an increase in the prices of other medications as well. Following pharmacist intervention, the intake of additional oral antidiabetics, multivitamins and minerals, NSAIDs, and other medications was limited during follow-up 2 for the intervention group, subsequent to consultations between DMTAC pharmacists and physicians, as patients in the intervention group adopted a more balanced diet due to the pharmacist-led educational initiatives provided by DMTAC.
The prescription costs in the intervention group included in the DMTAC program were markedly lower than those in the control group of the present study. The only difference between the two groups was the extent to which pharmacists were involved in the intervention group; otherwise, both groups used the same healthcare facilities and physicians. The participating pharmacists in Malaysia are not compensated for their DMTAC services. This service provides pharmacists with extra value. This indicates that pharmacists at Malaysian hospitals do not receive additional compensation for DMTAC services. The principal objective of DMTAC services in Malaysia was to reduce the cost of diabetes mellitus treatment in the country. (Ministry of Health Malaysia, 2014). In other words, it may be stated that the Government can achieve significant savings without paying additional expenses from the Ministry through the engagement of pharmacists. Everyone in Malaysia with diabetes mellitus should be able to benefit from this service, not limited to particularly few individuals. It should be available at all hospitals in the country.
The research regarding the cost-effectiveness of educational interventions by pharmacists was inadequate. There is a lack of research on the cost-effectiveness of diabetic medical therapy assessment and care (DMTAC) services and pharmacist interventions in Malaysian tertiary care facilities. The results of this study showed that when pharmacists aren't involved, an additional RM 236.07 per patient was spent by the second follow-up in comparison to baseline. However, the additional cost per patient was RM 47.33 when the pharmacist was involved. The cost variation was considerable between the two study groups. The results of the current study aligned with those of the research conducted in New Jersey to assess the pharmacist-led MTDM program. (Maeng et al., 2018). The study by Maeng et al. indicates that the within a year, the MTDM program reduced hospitalization rates by as much as 19.6 percent, while also bringing down average healthcare expenses per patient by around 13%.
Likewise, multiple investigations have demonstrated that management of medication with a clinical pharmacist leads to enhanced clinical outcomes and reduced overall drug costs. (Cranor et al., 2003; Fox et al., 2009; Romanelli et al., 2015). Cranor and colleagues conducted a pre−post cohort analysis revealing that pharmacist assistance throughout seven follow-ups resulted in a reduction of total average direct medical costs by around $1,200 to $1,872 per patient over one year compared to baseline. (Cranor et al., 2003). All the aforementioned studies shown a beneficial impact of pharmacist intervention in reducing prescription costs for diabetic patients and the healthcare system overall. The positive impact that pharmacists have on the health care systems of a variety of countries worldwide is evidenced by the interventions that they provide in each of the studies discussed above. Nevertheless, pharmacist intervention is not standardized globally. The pharmacist intervention program is unique to each country and contains a variety of elements. It is challenging to determine which component of the intervention program had the greatest impact on the desired outcomes. Therefore, more investigations are required to establish the most effective and feasible approach by correlating the impact of the various elements during educational interventions on clinical outcome measures.
5. Conclusion
In general, healthcare professionals are at the front line to provide compliance therapy for diabetes mellitus according to the Clinical Practice Guidelines (CPG) in the healthcare centres recruited for this study for both study groups. Yet, the participation of pharmacists in the form of interventions results in improved control of clinical outcomes of diabetes mellitus. This study's results confirm that DMTAC is an effective program in Malaysia. This study suggests that diabetics, along with patients with uncontrolled diabetes, should be involved in pharmacist-led interventional programs to prevent further clinical complications along with enhancement of their health-related quality of life.
Acknowledgements
King Khalid University's Deanship of Scientific Research generously supported this study, and the authors are very grateful.
Funding information: Funding for this research project, designated as RGP. 1/247/44, was provided by the deanship of King Khalid University, and the authors are grateful to them.
Conflicts of interests: Nil.
References
- Joshi, R.; Alim, M.; Kengne, A.P.; Jan, S.; Maulik, P.K.; Peiris, D.; Patel, A.A. Task Shifting for Non-Communicable Disease Management in Low and Middle Income Countries – A Systematic Review. PLOS ONE 2014, 9, e103754. [Google Scholar] [CrossRef]
- Romieu, I.; Dossus, L.; Barquera, S.; Blottière, H.M.; Franks, P.W.; Gunter, M.; Hwalla, N.; Hursting, S.D.; Leitzmann, M.; Margetts, B.; et al. Energy balance and obesity: What are the main drivers? Cancer Causes Control 2017, 28, 247–258. [Google Scholar] [CrossRef] [PubMed]
- Leitner, D.R.; Frühbeck, G.; Yumuk, V.; Schindler, K.; Micic, D.; Woodward, E.; Toplak, H. Obesity and Type 2 Diabetes: Two Diseases with a Need for Combined Treatment Strategies - EASO Can Lead the Way. Obes. Facts 2017, 10, 483–492. [Google Scholar] [CrossRef] [PubMed]
- Roglic, G. WHO Global report on diabetes: A summary. International Journal of Noncommunicable Diseases. 2016 Apr 1;1(1):3.
- National Health and Morbidity Survey 2018 : Elderly Health Volume II : Institute for Public Health, National Institutes of Health (NIH) Ministry of Health Malaysia (NMRR-17-2655-39047).
- da Silva, J.A.; de Souza, E.C.F.; Böschemeier, A.G.E.; da Costa, C.C.M.; Bezerra, H.S.; Feitosa, E.E.L.C. Diagnosis of diabetes mellitus and living with a chronic condition: participatory study. BMC Public Heal. 2018, 18, 69. [Google Scholar] [CrossRef] [PubMed]
- American Diabetes Association. Diagnosis and classification of diabetes mellitus. Diabetes care. 2014 Jan 1;37(Supplement 1):S81-90.
- Trikkalinou A, Papazafiropoulou AK, Melidonis A. Type 2 diabetes and quality of life. World journal of diabetes. 2017 Apr 15;8(4):120.
- Ginsberg, B.H. Factors Affecting Blood Glucose Monitoring: Sources of Errors in Measurement. J. Diabetes Sci. Technol. 2009, 3, 903–913. [Google Scholar] [CrossRef] [PubMed]
- Sherwani, S.I.; Khan, H.A.; Ekhzaimy, A.; Masood, A.; Sakharkar, M.K. Significance of HbA1c Test in Diagnosis and Prognosis of Diabetic Patients. Biomark. Insights 2016, 11, BMI–S38440. [Google Scholar] [CrossRef] [PubMed]
- Li, S.-C.; Jin, J.; Sklar, G.E.; Oh, V.M.S. Factors affecting therapeutic compliance: A review from the patient’s perspective. Ther. Clin. Risk Manag. 2008, 4, 269–286. [Google Scholar] [CrossRef]
- Khan, A.; Iqbal, M.; Sulaiman, S.S. A review of pharmacist-led interventions on diabetes outcomes: An observational analysis to explore diabetes care opportunities for pharmacists. J. Pharm. Bioallied Sci. 2019, 11, 299–309. [Google Scholar] [CrossRef]
- Megari, K. Quality of life in chronic disease patients. Health psychology research. 2013 Sep 24;1(3).
- World Health Organization. Measuring quality of life: The World Health Organization quality of life instruments (the WHOQOL-100 and the WHOQOL-BREF). WHOQOL-measuring quality of life. 1997.
- A Kiadaliri, A.; Najafi, B.; Mirmalek-Sani, M. Quality of life in people with diabetes: a systematic review of studies in Iran. J. Diabetes Metab. Disord. 2013, 12, 54. [Google Scholar] [CrossRef]
- Jing, X.; Chen, J.; Dong, Y.; Han, D.; Zhao, H.; Wang, X.; Gao, F.; Li, C.; Cui, Z.; Liu, Y.; et al. Related factors of quality of life of type 2 diabetes patients: a systematic review and meta-analysis. Heal. Qual. Life Outcomes 2018, 16, 189. [Google Scholar] [CrossRef] [PubMed]
- Whalley, D.; Globe, G.; Crawford, R.; Doward, L.; Tafesse, E.; Brazier, J.; Price, D. Is the EQ-5D fit for purpose in asthma? Acceptability and content validity from the patient perspective. Heal. Qual. Life Outcomes 2018, 16, 160. [Google Scholar] [CrossRef] [PubMed]
- Lee, W.J.; Song, K.-H.; Noh, J.H.; Choi, Y.J.; Jo, M.-W. Health-Related Quality of Life Using the EuroQol 5D Questionnaire in Korean Patients with Type 2 Diabetes. J. Korean Med Sci. 2012, 27, 255–260. [Google Scholar] [CrossRef] [PubMed]
- Pinto, E.B.; Maso, I.; Vilela, R.N.R.; Santos, L.C.; Oliveira-Filho, J. Validation of the EuroQol quality of life questionnaire on stroke victims. Arq. de Neuro-Psiquiatria 2011, 69, 320–323. [Google Scholar] [CrossRef]
- EQ-5D-5L user guide: basic information on how to use the EQ-5D-5L instrument. EuroQol Research Foundation 2019. Version 3.0 Updated September 2019.
- Butt, M.; Ali, A.M.; Bakry, M.M.; Mustafa, N. Impact of a pharmacist led diabetes mellitus intervention on HbA1c, medication adherence and quality of life: A randomised controlled study. Saudi Pharm. J. 2016, 24, 40–48. [Google Scholar] [CrossRef]
- Collins, C.; Limone, B.L.; Scholle, J.M.; Coleman, C.I. Effect of pharmacist intervention on glycemic control in diabetes. Diabetes Res. Clin. Pr. 2011, 92, 145–152. [Google Scholar] [CrossRef]
- Scott, D.M.; Boyd, S.T.; Stephan, M.; Augustine, S.C.; Reardon, T.P. Outcomes of pharmacist-managed diabetes care services in a community health center. Am. J. Heal. Pharm. 2006, 63, 2116–2122. [Google Scholar] [CrossRef] [PubMed]
- Johnson, C.L.; Nicholas, A.; Divine, H.; Perrier, D.G.; Blumenschein, K.; Steinke, D.T. Outcomes from DiabetesCARE: A pharmacist-provided diabetes management service. J. Am. Pharm. Assoc. 2008, 48, 722–730. [Google Scholar] [CrossRef] [PubMed]
- American Diabetes Association. Standards of medical care for patients with diabetes mellitus. Puerto Rico Health Sciences Journal. 2013 Nov 27;20(2).
- Lee, W.J.; Song, K.-H.; Noh, J.H.; Choi, Y.J.; Jo, M.-W. Health-Related Quality of Life Using the EuroQol 5D Questionnaire in Korean Patients with Type 2 Diabetes. J. Korean Med Sci. 2012, 27, 255–260. [Google Scholar] [CrossRef] [PubMed]
- Sakamaki, H.; Ikeda, S.; Ikegami, N.; Uchigata, Y.; Iwamoto, Y.; Origasa, H.; Otani, T.; Otani, Y. Measurement of HRQL Using EQ-5D in Patients with Type 2 Diabetes Mellitus in Japan. Value Heal. 2006, 9, 47–53. [Google Scholar] [CrossRef]
- Solli, O.; Stavem, K.; Kristiansen, I. Health-related quality of life in diabetes: The associations of complications with EQ-5D scores. Heal. Qual. Life Outcomes 2010, 8, 18–18. [Google Scholar] [CrossRef] [PubMed]
- Thomas, S.; Beh, L.; Nordin, R. Health care delivery in Malaysia: changes, challenges and champions. J. Public Heal. Afr. 2011, 2, e23. [Google Scholar] [CrossRef] [PubMed]
Figure 1.
Flow chart of the study.
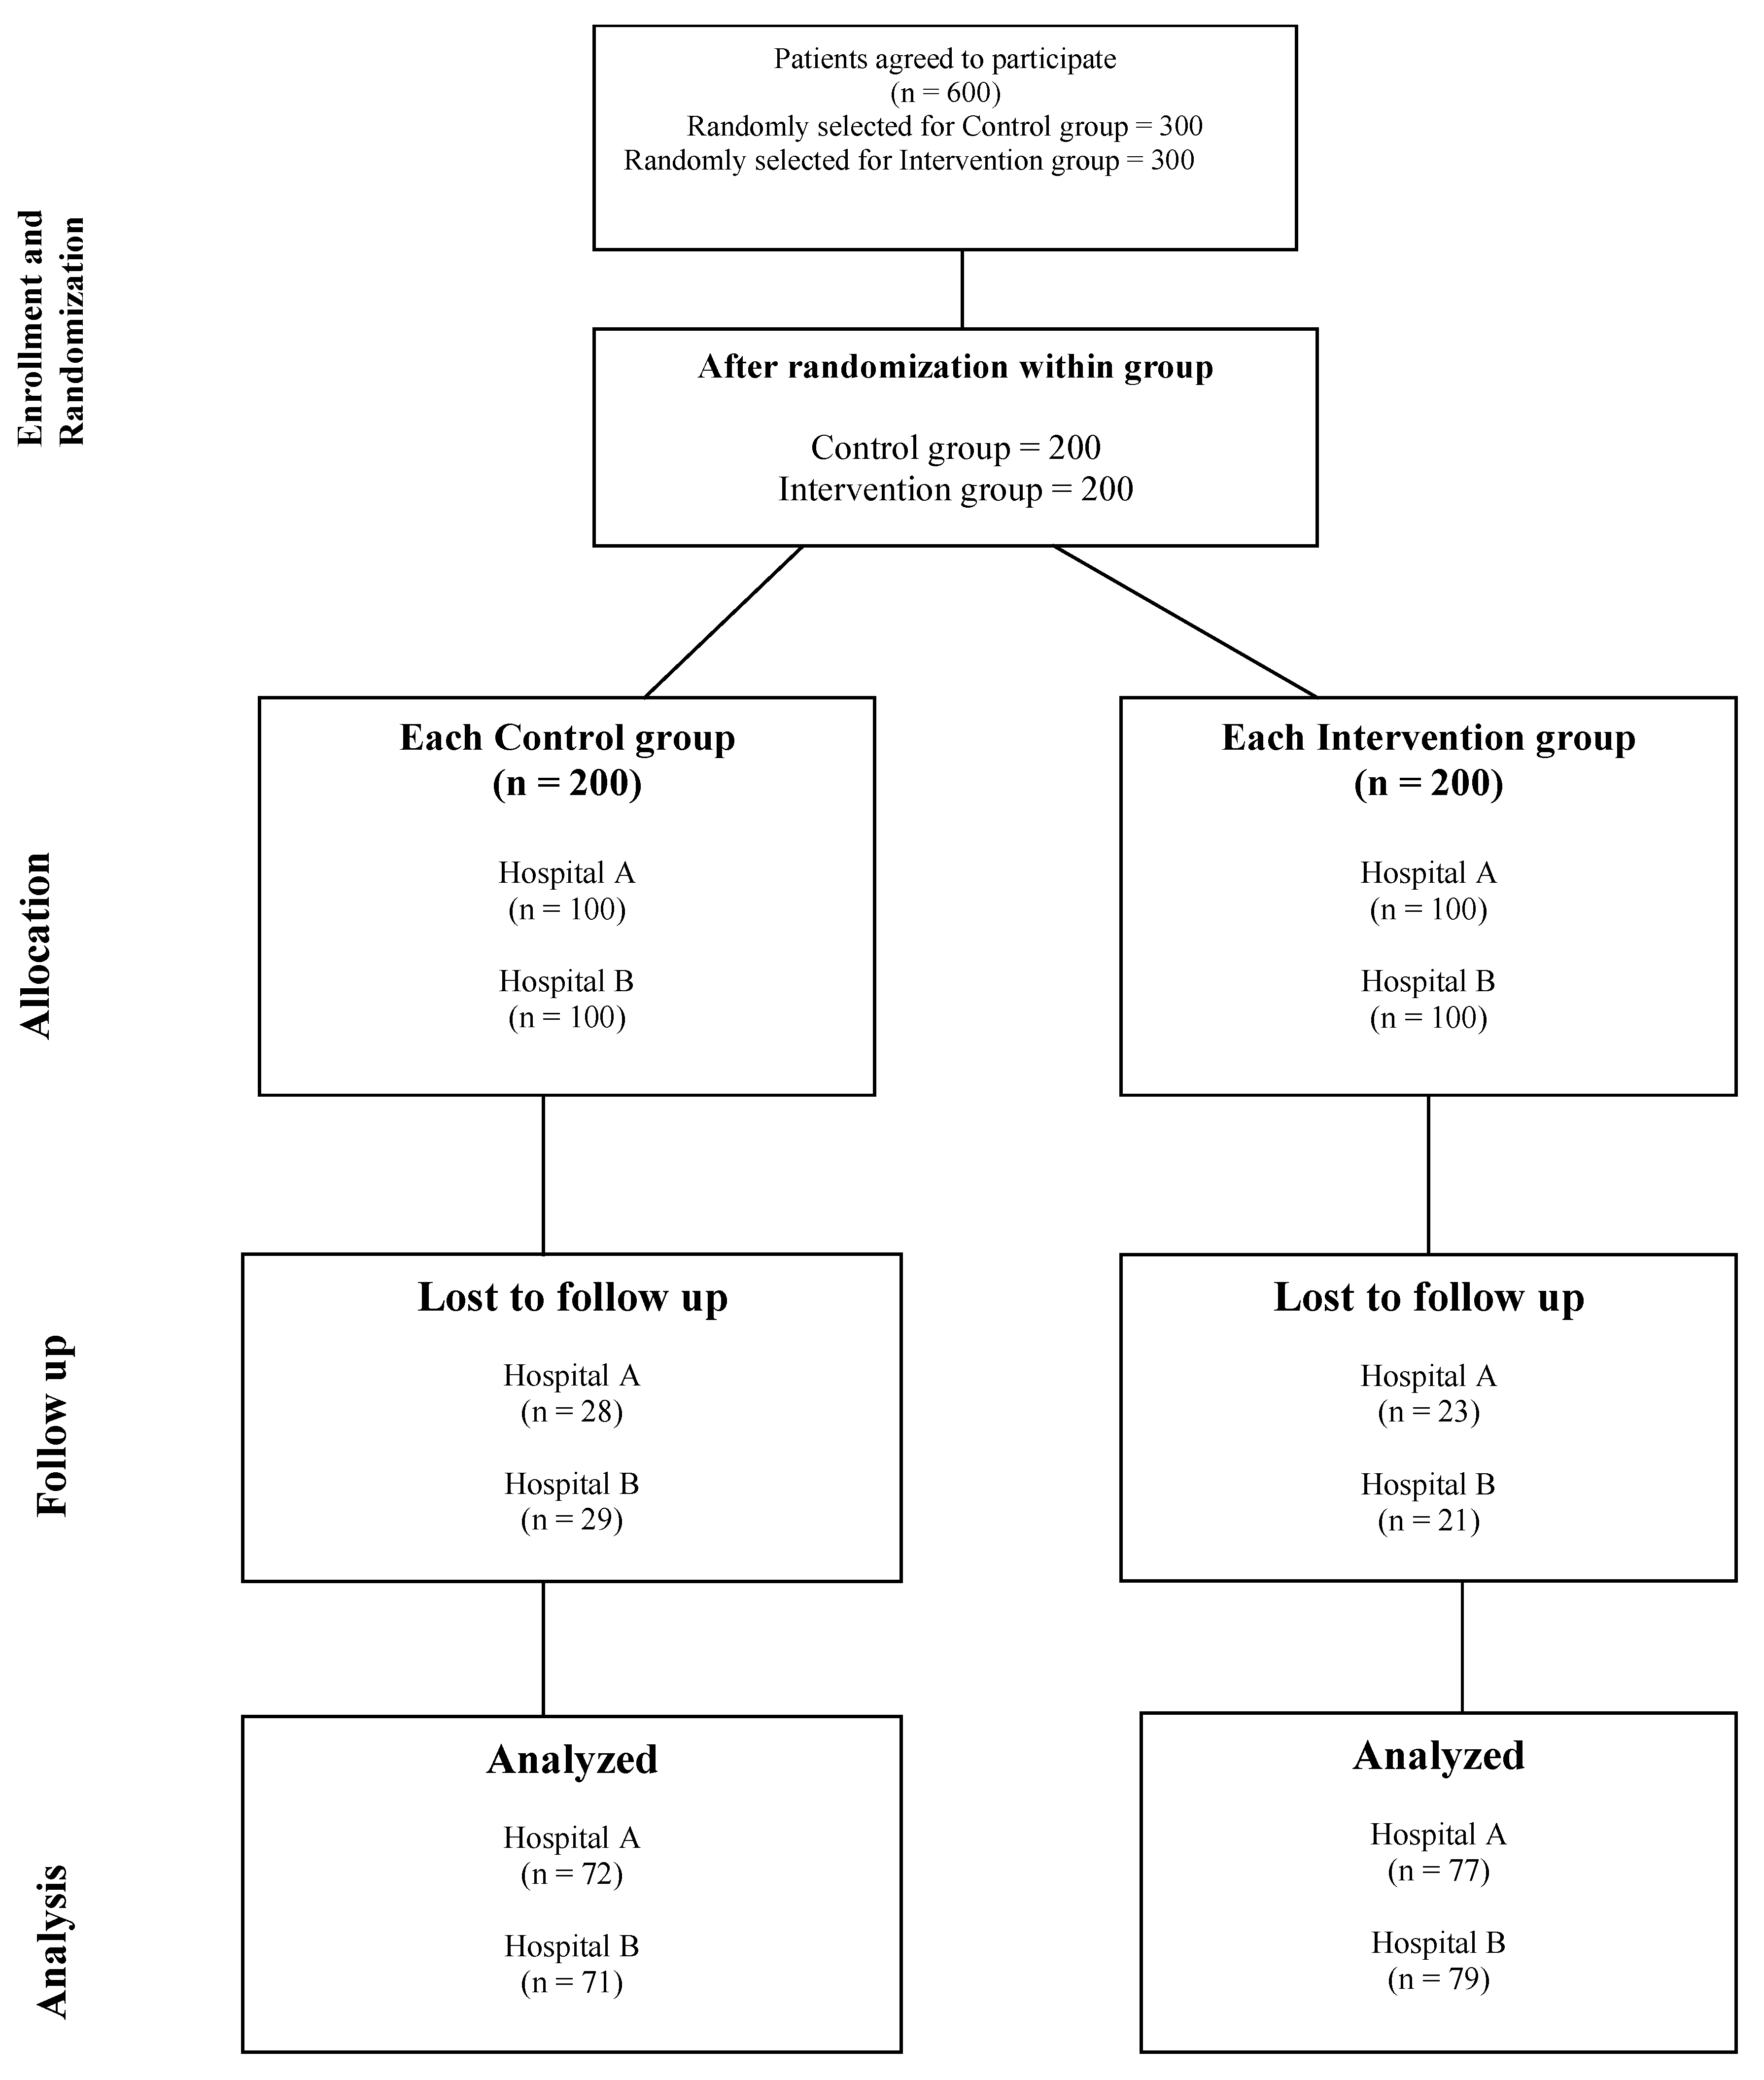

Table 1.
The baseline demographics characteristics + clinical variables of study subjects.
| Variables | Frequency | p-value | ||
| CG n(%) | IG n(%) | |||
| Hospital Name | 0.819* | |||
| Hospital A | 71 (48.6) | 75 (51.4) | ||
| Hospital B | 70 (47.3) | 78 (52.7) | ||
| Gender | 0.136* | |||
| Male | 74 (52.5) | 67 (47.5) | ||
| Female | 67 (43.8) | 86 (56.2) | ||
| Ethnicity | 0.400* | |||
| Malay | 104 (46.0) | 122 (54.0) | ||
| Chinese | 25 (52.1) | 23 (47.9) | ||
| Indian | 12 (60.0) | 8 (40.0) | ||
| Age (mean, SD) | <0.001# | |||
| - | 58.68±6.08N=141 | 61.63±6.17N=153 | ||
| Duration of diabetes (years, SD) | 0.032# | |||
| - | 9.62±2.35 | 10.24±3.23 | ||
| Disease outcomes | ||||
| HbA1c (%) | 11.15±1.33 | 11.68±1.50 | 0.061 | |
| FBS (mmol/L) | 14.63±1.38 | 14.44±1.53 | 0.265 | |
| Residence status | 0.438* | |||
| Urban | 66 (46.2) | 77 (53.8) | ||
| Rural | 75 (49.7) | 76 (50.3) | ||
| Employment status | 0.587* | |||
| Unemployed | 67 (46.2) | 78 (53.8) | ||
| Employed | 74 (49.0) | 77 (51.0) | ||
| Type of daily diet | 0.328* | |||
| Vegetarian | 79 (50.6) | 77 (49.4) | ||
| Non-vegetarian | 62 (44.9) | 76 (55.1) | ||
| Smoking status | 0.635* | |||
| Yes | 26 (51.0) | 25 (49.0) | ||
| No | 115 (47.3) | 128 (52.7) | ||
| Exercise status | 0.178* | |||
| Yes | 41 (54.7) | 34 (45.3) | ||
| No | 100 (45.7) | 119 (54.3) | ||
| Type of antidiabetic therapy | 0.882* | |||
| Oral only | 82 (48.8) | 86 (51.2) | ||
| Insulin | 44 (47.8) | 48 (52.2) | ||
| Oral + insulin | 15 (44.1) | 19 (55.9) | ||
* Chi-square test; #one-way ANOVA test.
Table 2.
Differences in outcomes in the control group (N=143).
| Outcome Measure | Baseline | Follow-up after 6 months of baseline | Follow-up after 1 year of baseline |
||||
|---|---|---|---|---|---|---|---|
| Mean ±SD | Mean Difference | p-value | Mean ±SD | Mean Difference | p-value | ||
|
FBS (mmol/L) |
14.63±1.37 | 12.09±1.34 | - 2.54 | <0.001 | 11.79±1.33 | - 0.30 | 0.067 |
|
RBS (mmol/L) |
17.65±1.34 | 15.93±1.35 | - 1.72 | <0.001 | 16.81±1.39 | + 0.88 | 0.347 |
| HbA1c (%) | 11.15±1.32 | 10.10±1.04 | - 1.05 | <0.001 | 9.72±1.02 | - 0.38 | 0.003 |
|
BP Systolic (mmHg) |
132.71±6.09 | 131.63±5.98 | - 0.08 | 0.365 | 135.13±5.99 | + 0.58 | 0.276 |
|
BP Diastolic (mmHg) |
84.37±5.63 | 85.17±5.05 | + 0.80 | 0.455 | 84.24±5.49 | - 0.93 | 0.064 |
|
T. Cholesterol (mmol/L) |
5.67±0.35 | 5.43±0.29 | - 0.24 | 0.004 | 5.41±0.30 | - 0.002 | 0.457 |
|
Triglyceride (mmol/L) |
1.88±0.18 | 1.70±0.14 | - 0.18 | 0.001 | 1.76±0.12 | - 0.06 | 0.345 |
|
LDL-C (mmol/L) |
2.81±0.17 | 2.73±0.12 | - 0.08 | 0.352 | 2.74±0.12 | + 0.01 | 0.542 |
|
HDL-C (mmol/L) |
1.04±0.02 | 1.17±0.03 | + 0.13 | 0.001 | 1.16±0.03 | - 0.01 | 0.067 |
Paired t-Test was used to find the p-values. p-valueα = p-value between Baseline × after 6 months(follow-up1); p-valueβ = p-value between Follow-up 1 × after 6 month.
Table 3.
Differences in outcomes in the Intervention group (N=156).
| Outcome Measure | Baseline | Follow-up 1 (after 6 months of baseline) |
Follow-up 2 (after 6 months of 1st follow-up) |
||||
|---|---|---|---|---|---|---|---|
| Mean ±SD | Mean Difference | p-valueα | Mean ±SD | Mean Difference | p-valueβ | ||
|
FBS (mmol/L) |
14.44±1.53 | 10.01±1.51 | - 4.43 | <0.001 | 7.63±1.45 | - 2.38 | <0.001 |
|
RBS (mmol/L) |
18.32±1.48 | 13.87±1.45 | - 4.45 | <0.001 | 11.54±1.39 | - 2.33 | <0.001 |
| HbA1c (%) | 11.69±1.50 | 9.94±0.92 | - 1.75 | <0.001 | 8.87±0.79 | - 1.07 | <0.001 |
|
BP Systolic (mmHg) |
136.87±5.60 | 131.27±5.49 | - 5.60 | <0.001 | 129.97±5.31 | - 1.30 | <0.001 |
|
BP Diastolic (mmHg) |
85.49±5.94 | 83.45±5.87 | - 2.04 | 0.001 | 81.31±5.05 | - 2.14 | 0.001 |
|
T. Cholesterol (mmol/L) |
6.16±0.35 | 5.41±0.32 | - 0.75 | <0.001 | 5.34±0.0.29 | - 0.07 | 0.067 |
|
Triglyceride (mmol/L) |
1.97±0.22 | 1.82±0.22 | - 0.15 | 0.001 | 1.71±0.14 | - 0.11 | 0.003 |
|
LDL-C (mmol/L) |
3.45±0.20 | 3.01±0.35 | - 0.44 | <0.001 | 2.72±0.10 | - 0.29 | <0.001 |
|
HDL-C (mmol/L) |
0.91±0.04 | 1.01±0.10 | + 0.1 | 0.001 | 1.02±0.11 | + 0.01 | 0.568 |
Paired t-Test was used to find the p-values. p-valueα = p-value between Baseline × after 6 months(follow-up1); p-valueβ = p-value between Follow-up 1× after 6 months.
Table 4.
The cost of medication for patients at baseline for a 3 month period.
| Parameters | Cost for 3 months Mean± SD C.G (N=143) |
Cost for 3 months Mean± SD I.G (N=156) |
t- statistic (df) |
p-value |
|---|---|---|---|---|
| Insulin | RM 763.90±140.74 | RM 783.01±149.67 |
-1.13 (1, 297) |
0.258 |
| Oral antidiabetics | RM 48.71±6.52 | RM 48.75±6.94 |
-0.04 (1, 297) |
0.963 |
| Diabetic Co-morbidities | RM 78.80±7.55 | RM 78.88±2.97 |
0.91 (1, 297) |
0.908 |
| Diabetic Complications | RM 350.21±21.57 | RM 347.49±19.58 |
1.14 (1, 297) |
0.253 |
| Multivitamins and minerals | RM 15.85±4.20 | RM 15.25±3.22 |
1.38 (1, 297) |
0.167 |
| NSAIDs | RM 2.68±0.73 | RM 2.59±0.55 |
1.25 (1, 297) |
0.211 |
| Others | RM 22.86±5.09 | RM 22.10±3.96 |
1.44 (1, 297) |
0.150 |
C.C= Control group, I.C= Intervention group, p-value between both study groups; One-way ANOVA Test was used to find the p-values. (Post-hoc analysis using Games-Howell’s procedure); The F-statistic is farther from zero than the critical value considered rejects Hypothesis Null; SD = Standard Deviation, df = Degrees of freedom
Table 5.
Medications costs for patients during the first follow-up for a period of three months.
| Parameters | Cost for 3 months Mean± SD C.G (N=143) |
Difference from baseline price | Cost for 3 months Mean± SD I.G (N=156) |
Difference from baseline price |
t- statistic (df) |
p-value |
|---|---|---|---|---|---|---|
| Insulin | RM 874.43±218.33 | RM +110.53 | RM 816.40±163.91 | RM +33.39 |
2.61 (1, 297) |
0.009 |
| Oral antidiabetics | RM 65.74±35.50 | RM +17.03 | RM 51.53±12.68 | RM +2.78 |
4.68 (1, 297) |
<0.001 |
| Diabetic Co-morbidities | RM 81.79±8.91 | RM +2.99 | RM 80.16±5.73 | RM +1.28 |
1.88 (1, 297) |
0.060 |
| Diabetic Complications | RM 361.32±32.13 | RM +11.11 | RM 350.40±23.59 | RM +2.91 |
3.36 (1, 297) |
0.001 |
| Multivitamins and minerals | RM 16.80±4.60 | RM +0.95 | RM 15.38±3.32 | RM +0.13 |
3.06 (1, 297) |
0.002 |
| NSAIDs | RM 2.85±0.79 | RM +0.17 | RM 2.32±0.75 | RM -0.27 |
5.91 (1, 297) |
<0.001 |
| Others | RM 24.34±6.11 | RM +1.48 | RM 21.15±4.23 | RM -0.95 |
5.27 (1, 297) |
<0.001 |
p-value between both study groups after 3-4 months of baseline; Independent Samples t Test. The t-statistic is farther from zero than the critical values considered reject Null Hypothesis. C.I = Confidence Interval (Group Statistics), SD = Standard Deviation, df = Degrees of freedom
Table 6.
Cost of medication for patients at follow up 2 for three months.
| Parameters | Cost for 3 months Mean± SD C.G (N=143) |
Difference from baseline price | Cost for 3 months Mean± SD I.G (N=156) |
Difference from baseline price |
t- statistic (df) |
p-value |
|---|---|---|---|---|---|---|
| Insulin | RM 918.62±230.43 | RM +154.72 | RM 811.94±165.69 | RM +28.93 |
4.62 (1, 297) |
<0.001 |
| Oral antidiabetics | RM 87.03±52.43 | RM +38.32 | RM 56.37±27.67 | RM +7.62 |
6.39 (1, 297) |
<0.001 |
| Diabetic Co-morbidities | RM 85.20±10.26 | RM +6.4 | RM 80.75±6.05 | RM +1.87 |
4.60 (1, 297) |
<0.001 |
| Diabetic Complications | RM 379.84±39.80 | RM +29.63 | RM 359.37±33.21 | RM +11.88 |
4.84 (1, 297) |
<0.001 |
| Multivitamins and minerals | RM 18.44±4.77 | RM +2.59 | RM 14.88±2.06 | RM -0.37 |
8.47 (1, 297) |
<0.001 |
| NSAIDs | RM 3.23±0.97 | RM +0.55 | RM 2.21±0.80 | RM -0.38 |
9.90 (1, 297) |
<0.001 |
| Others | RM 26.72±6.48 | RM +3.86 | RM 19.88±3.73 | RM -2.22 |
11.29 (1, 297) |
<0.001 |
p-value between both study groups after 3-4 months of follow up 3; Independent Samples t Test. The t-statistic is farther from zero than the critical values considered reject Null Hypothesis. C.I = Confidence Interval (Group Statistics), SD = Standard Deviation, df = Degrees of freedom
Disclaimer/Publisher’s Note: The statements, opinions and data contained in all publications are solely those of the individual author(s) and contributor(s) and not of MDPI and/or the editor(s). MDPI and/or the editor(s) disclaim responsibility for any injury to people or property resulting from any ideas, methods, instructions or products referred to in the content. |
© 2025 by the authors. Licensee MDPI, Basel, Switzerland. This article is an open access article distributed under the terms and conditions of the Creative Commons Attribution (CC BY) license (http://creativecommons.org/licenses/by/4.0/).
Copyright: This open access article is published under a Creative Commons CC BY 4.0 license, which permit the free download, distribution, and reuse, provided that the author and preprint are cited in any reuse.


