
Submitted:
28 January 2025
Posted:
28 January 2025
You are already at the latest version
Abstract
Muon collisions are considered a promising mean for exploring the energy frontier, leading to a detailed study of the possible feasibility issues. Beam intensities of the order of 1012 muons per bunch are needed to achieve the necessary luminosity, generating a high flux of secondary and tertiary particles from muons decay that reach both the machine elements and the detector region. To limit the impact of this background on the physics performance tungsten shieldings have been studied. A machine learning-based approach to the geometry optimization of these shieldings will be discussed.
Keywords:
Muon
; Collider
; MDI
; Machine-Learning
1. Introduction
The Muon Collider is a proposed next-generation facility in high-energy physics [1]. Muons, as fundamental particles in the lepton family, are particularly suited for collider applications due to their relatively large mass, about 200 times heavier than electrons, combined with their point-like nature. This makes muons less prone to radiative energy losses compared to electrons when accelerated to high energies, allowing to build a circular facility to explore the multi-TeV center-of-mass energy region. However, one of the primary challenges associated with the Muon Collider arises from the intrinsic instability of muons. They decay in the beam pipe, and the resulting decay products interact with the collider components, generating a flux of photons, neutrons, and charged particles that reach the detector, known as Beam-Induced Background (BIB). Effective mitigation strategies are essential to reduce BIB and ensure the desired detector performance and measurement accuracy. To this purpose a tungsten cone-shaped shield (Nozzle) has been designed inside the detector to absorb the incoming particles and reduce their energy. The original geometry of this object was proposed by MAP [2] for a machine, therefore optimizations for the Muon Collider are required. This contribution aims to describe the activities undertaken and ongoing concerning the Nozzle geometry optimization for the 3 TeV Muon Collider exploiting machine learning (ML) algorithms.
2. Beam-Induced Background
At TeV, the muon decay rate is expected to reach decays per meter per beam for each bunch crossing. This results in a significant flux of particles, estimated to be on the order of per bunch crossing, widely distributed in time relative to the bunch crossing. These particles, known as Beam-Induced Background (BIB), pose a considerable challenge to the detector, particularly the vertex detector near the Interaction Point (IP).
To mitigate the impact of BIB, a nozzle design based on the MAP configuration has been developed. The nozzle features a cone-shaped tungsten core extending from a few centimeters from the IP to the edge of the detector, forming a 6-meter-long structure. Near the IP, the nozzle’s angular aperture is 10° to address the critical impact of BIB on the vertex detector, narrowing to 5° at a distance of 1 meter. To further reduce neutron production from interactions within the tungsten core, the nozzle is coated with borated polyethylene. The detector layout and nozzle geometry are illustrated in Figure 1.
The time of arrival of BIB particles at the detector surface is highly dispersed relative to the bunch crossing. A time-based rejection strategy is employed, using a readout window from ns to ns around the bunch crossing to significantly reduce off-time background events. The composition of the BIB before and after time discrimination is detailed in Table 1, where the first column shows the initial particle flux and the second column the flux remaining after time rejection. Additionally, Figure 2 displays the full time distribution and energy spectra for each particle species, based on the MAP configuration.
The simulation of the BIB which led to the plots shown in Figure 2 has been achieved by implementing the design in Figure 1 (right) together with the beam pipe and all the machine elements in FLUKA [3,4], exploiting the two step simulation:
- Step 1: Muon decays along the beam pipe are simulated and the interaction with the environment are propagated up to the detector area. There the incoming particles are killed in the simulation and their kinematic information are scored.
- Step 2: Particles arriving on the detector surface are propagated inside the nozzles. The flux surviving the interactions inside the Nozzles and reaching the detector is scored as the Beam-Induced Background.
This approach allows saving a significant amount of time since it is not necessary to repeat the first step each time the nozzles geometry changes, considering that only the second step of the simulation takes on average 4 days for a of the expected decays for a bunch crossing, considering only one beam.
3. Nozzle Geometry Optimization
As mentioned in the Introduction, the nozzle geometry was originally designed for a machine. Therefore, it must be adapted to the energy stages currently envisioned for the Muon Collider, namely 3 and in the center of mass. The primary goal of this adaptation is to minimize the Beam-Induced Background (BIB) in the detector, thereby reducing its impact on event reconstruction. Additionally, reducing the nozzle size offers several advantages, particularly cost-wise. Given that tungsten has a density of approximately , depending on the alloy, even a slight reduction in nozzle volume can lead to a substantial decrease in material requirements. This reduction also lowers the overall weight that needs to be supported, simplifying the design of the nozzle’s supporting structure. Finally, decreasing the nozzle volume creates more space for detectors, thereby enhancing the acceptance of the entire experiment. This work discusses the optimization achieved and the studies ongoing for the stage.
3.1. FLUKA Simulation
The first step in the optimization process focused on identifying how the geometry influences the resulting Beam-Induced Background (BIB). To this end, several FLUKA simulations were conducted, varying three key geometrical parameters: the angle of the nozzle tip, the position along the beam axis where the aperture changes, and the base radius. Figure 3 illustrates these parameters.
The simulations used a sample size corresponding to of the expected decays, approximately muons. This sample size ensures a negligible statistical error in the flux of particles entering the detector surface. Figure 4 presents the composition of the BIB for the original nozzle design compared to a tested configuration. For photons, neutrons, and , the statistical error is negligible.
The results indicated that careful optimization of the last meter of the nozzle is critical, whereas material savings can be achieved further from the Interaction Point (IP). However, due to the sensitivity of the geometry—where even small variations result in significant increases in Beam-Induced Background (BIB)—no definitive guidelines for modifications could be established.
Additionally, an assessment of the borated polyethylene coating was made after analyzing the neutron fluence distribution shown in Figure 5. Observations revealed that the highest concentration of particles does not occur on the external surface. Consequently, it was proposed to relocate the coating internally, placing a layer of tungsten on the outside. This configuration would help block photons emitted during neutron capture in the boron.
3.2. Machine Learning Studies
Manual optimization achieved by iterating FLUKA simulations is not the most effective strategy for finalizing the nozzle design due to the extensive computational time required for a single simulation. To address this challenge, an alternative approach leveraging ML algorithms has been adopted.
Building on the insights from the studies summarized in the previous section, a set of geometrical parameters has been identified to redefine the nozzle geometry. Specifically, the borated polyethylene has been incorporated inside the tungsten, and a step has been introduced to reduce material usage in areas where it is not required. The defined parameters are listed below, and the new nozzle design is illustrated in Figure 6:
- : Radius of the nozzle at the end of the final focusing stage.
- : Outer radius of the borated polyethylene section of the nozzle, expressed as a fraction of .
- : Position along the beam axis where the nozzle size is reduced.
- : Magnitude of the step, defined as a fraction of the nozzle’s radial size at position .
- : Position along the beam axis where the angular aperture of the nozzle changes.
- : Angular aperture at the tip of the nozzle.
- : Position along the beam axis of the nozzle tip.
- : Radial coordinate of the nozzle tip.
The first step in this study was to construct a dataset for training the ML algorithms. Given the objective of significantly reducing computational time, the simulated decays were limited to only of a bunch crossing. This approach enabled the creation of a dataset comprising elements within a reasonable timeframe while maintaining adequate statistical accuracy.
Figure 7 compares the photon energy spectrum of the Beam-Induced Background obtained using the original nozzle design with decays simulated (blue) to that of a design studied with ML algorithms and decays simulated (black). The difference in the error bar size is noticeable primarily in the higher-energy region of the spectrum, whereas the relative error in the most densely populated energy range remains around .
The second step of this study aimed to develop a model capable of parametrizing the particle flux entering the detector surface as a function of the geometrical parameters listed above. The integrated flux alone is not an ideal metric, as different particle types impact various detector components differently, and their flux does not vary coherently with changes in nozzle geometry. However, evaluating the effect of each geometry on individual sub-detectors would significantly increase the simulation time, counteracting the primary goal of this study.
To address this challenge, Deep Neural Networks [5], Random Forest [6], and XGBoost [7] regressors were evaluated. Data transformation techniques were also explored, given that the parameters span different phase spaces and small variations in some parameters can lead to large changes in flux. This behavior can negatively affect the performance of ML algorithms.
The performance of the models was assessed by measuring the relative deviation between the predicted flux and the simulated flux on a test dataset, defined as:
where is the flux obtained from low-statistics FLUKA simulations, and is the flux predicted by the trained model.
Among the tested models, XGBoost paired with the Standard Scaler [8] applied to the dataset features (i.e., the parameters) produced the best results. The performance of the model was quantified by fitting the distribution on the test dataset with a Gaussian function, yielding an expected value of with a standard deviation of This demonstrated that the XGBoost model could reliably serve as a surrogate for the FLUKA simulation. Using the trained model, a pseudo-dataset was generated to identify parameter sets that simultaneously minimized the Beam-Induced Background (BIB) and the total volume of the nozzle. The optimized geometry, compared to the original design (Figure 8), was subsequently tested using high-statistics FLUKA simulations.
The new design reduced the photon flux by and the flux by at the cost of an increase in the neutron flux. This trade-off is considered favorable because the primary challenge for event reconstruction is the occupancy in the tracking system, which is primarily affected by the flux and is improved with the optimized nozzle. Furthermore, the hadronic calorimeter, which is impacted by the neutron flux, is located farther from the interaction point, and the neutron flux is distributed over a larger surface area, mitigating its overall impact. Figure 9 reports the energy spectrum of the Beam-Induced Background comparing the new design to the original one.
4. Further Studies
While an initial optimization of the nozzle geometry has been achieved, more advanced ML methods may enhance the design further. The approach described in the previous section has its limitations, as the pseudo-dataset must be manually analyzed to identify an optimal configuration. To address this constraint, two parallel approaches are currently under investigation.
The first approach involves implementing a Bayesian Optimization Loop [9], which iteratively performs FLUKA simulations based on informed predictions of optimal parameters. The second approach leverages a Deep Neural Network (DNN) to approximate the XGBoost model and, by extension, the FLUKA simulations. The goal of this approach is to obtain a differentiable algorithm (the DNN), enabling the application of the Gradient Descent method [10] to analytically determine the configuration that minimizes the chosen metric.
While the Bayesian optimization method is still under study, the DNN-based approach has already been tested. However, it did not yield an improved algorithm because the metric used in the study was the integrated Beam-Induced Background (BIB) flux in the detector. The optimization process led to the selection of the largest possible geometry within the given parameter space, which was suboptimal.
To effectively exploit this method, a more nuanced metric M is required, defined as:
Here:
- : the total fluxes of photons, neutrons, and electrons, respectively, in the detector;
- V: the total volume of the nozzle;
- : parameters reflecting the respective impacts of photons, neutrons, and electrons on the sub-detectors;
- d: a parameter related to the nozzle’s total volume.
Ongoing studies aim to evaluate the parameters and d to accurately reflect the trade-offs between particle fluxes and nozzle volume.
References
- Accettura, C.; et al. Towards a Muon Collider. Eur. Phys. J. C 2023, 83, 864. [Google Scholar] [CrossRef]
- Alexahin, Y.; Gianfelice-Wendt, E.; Kapin, V. Muon Collider lattice concepts. Journal of Instrumentation 2018, 13, P11002. [Google Scholar] [CrossRef]
- Battistoni, G.; Boehlen, T.; Cerutti, F.; Chin, P.W.; Esposito, L.S.; Fassò, A.; Ferrari, A.; Lechner, A.; Empl, A.; Mairani, A.; et al. Overview of the FLUKA code. Annals of Nuclear Energy 2015, 82, 10–18, Joint International Conference on Supercomputing in Nuclear Applications and Monte Carlo 2013, SNA + MC 2013. Pluri- and Trans-disciplinarity, Towards New Modeling and Numerical Simulation Paradigms. [Google Scholar] [CrossRef]
- Ahdida, C.; Bozzato, D.; Calzolari, D.; Cerutti, F.; Charitonidis, N.; Cimmino, A.; Coronetti, A.; D’Alessandro, G.L.; Donadon Servelle, A.; Esposito, L.S.; et al. New Capabilities of the FLUKA Multi-Purpose Code. Frontiers in Physics 2022, 9. [Google Scholar] [CrossRef]
- Yi, H.; Shiyu, S.; Xiusheng, D.; Zhigang, C. A study on Deep Neural Networks framework. In Proceedings of the 2016 IEEE Advanced Information Management, Communicates, Electronic and Automation Control Conference (IMCEC); 2016; pp. 1519–1522. [Google Scholar] [CrossRef]
- Breiman, L. Random Forests. Machine Learning 2001, 45, 5–32. [Google Scholar] [CrossRef]
- Chen, T.; Guestrin, C. XGBoost: A Scalable Tree Boosting System. In Proceedings of the 22nd ACM SIGKDD International Conference on Knowledge Discovery and Data Mining. ACM; 2016; KDD ’16; pp. 785–794. [Google Scholar] [CrossRef]
- de Amorim, L.B.; Cavalcanti, G.D.; Cruz, R.M. The choice of scaling technique matters for classification performance. Applied Soft Computing 2023, 133, 109924. [Google Scholar] [CrossRef]
- Frazier, P.I. A Tutorial on Bayesian Optimization. arXiv 2018, arXiv:stat.ML/1807.02811. [Google Scholar]
- Ruder, S. An overview of gradient descent optimization algorithms. arXiv 2017, arXiv:cs.LG/1609.04747. [Google Scholar]
Figure 1.
Left: The detector used for Muon Collider studies. The nozzles are shown in cyan. Right: Section of left nozzle.
Figure 1.
Left: The detector used for Muon Collider studies. The nozzles are shown in cyan. Right: Section of left nozzle.
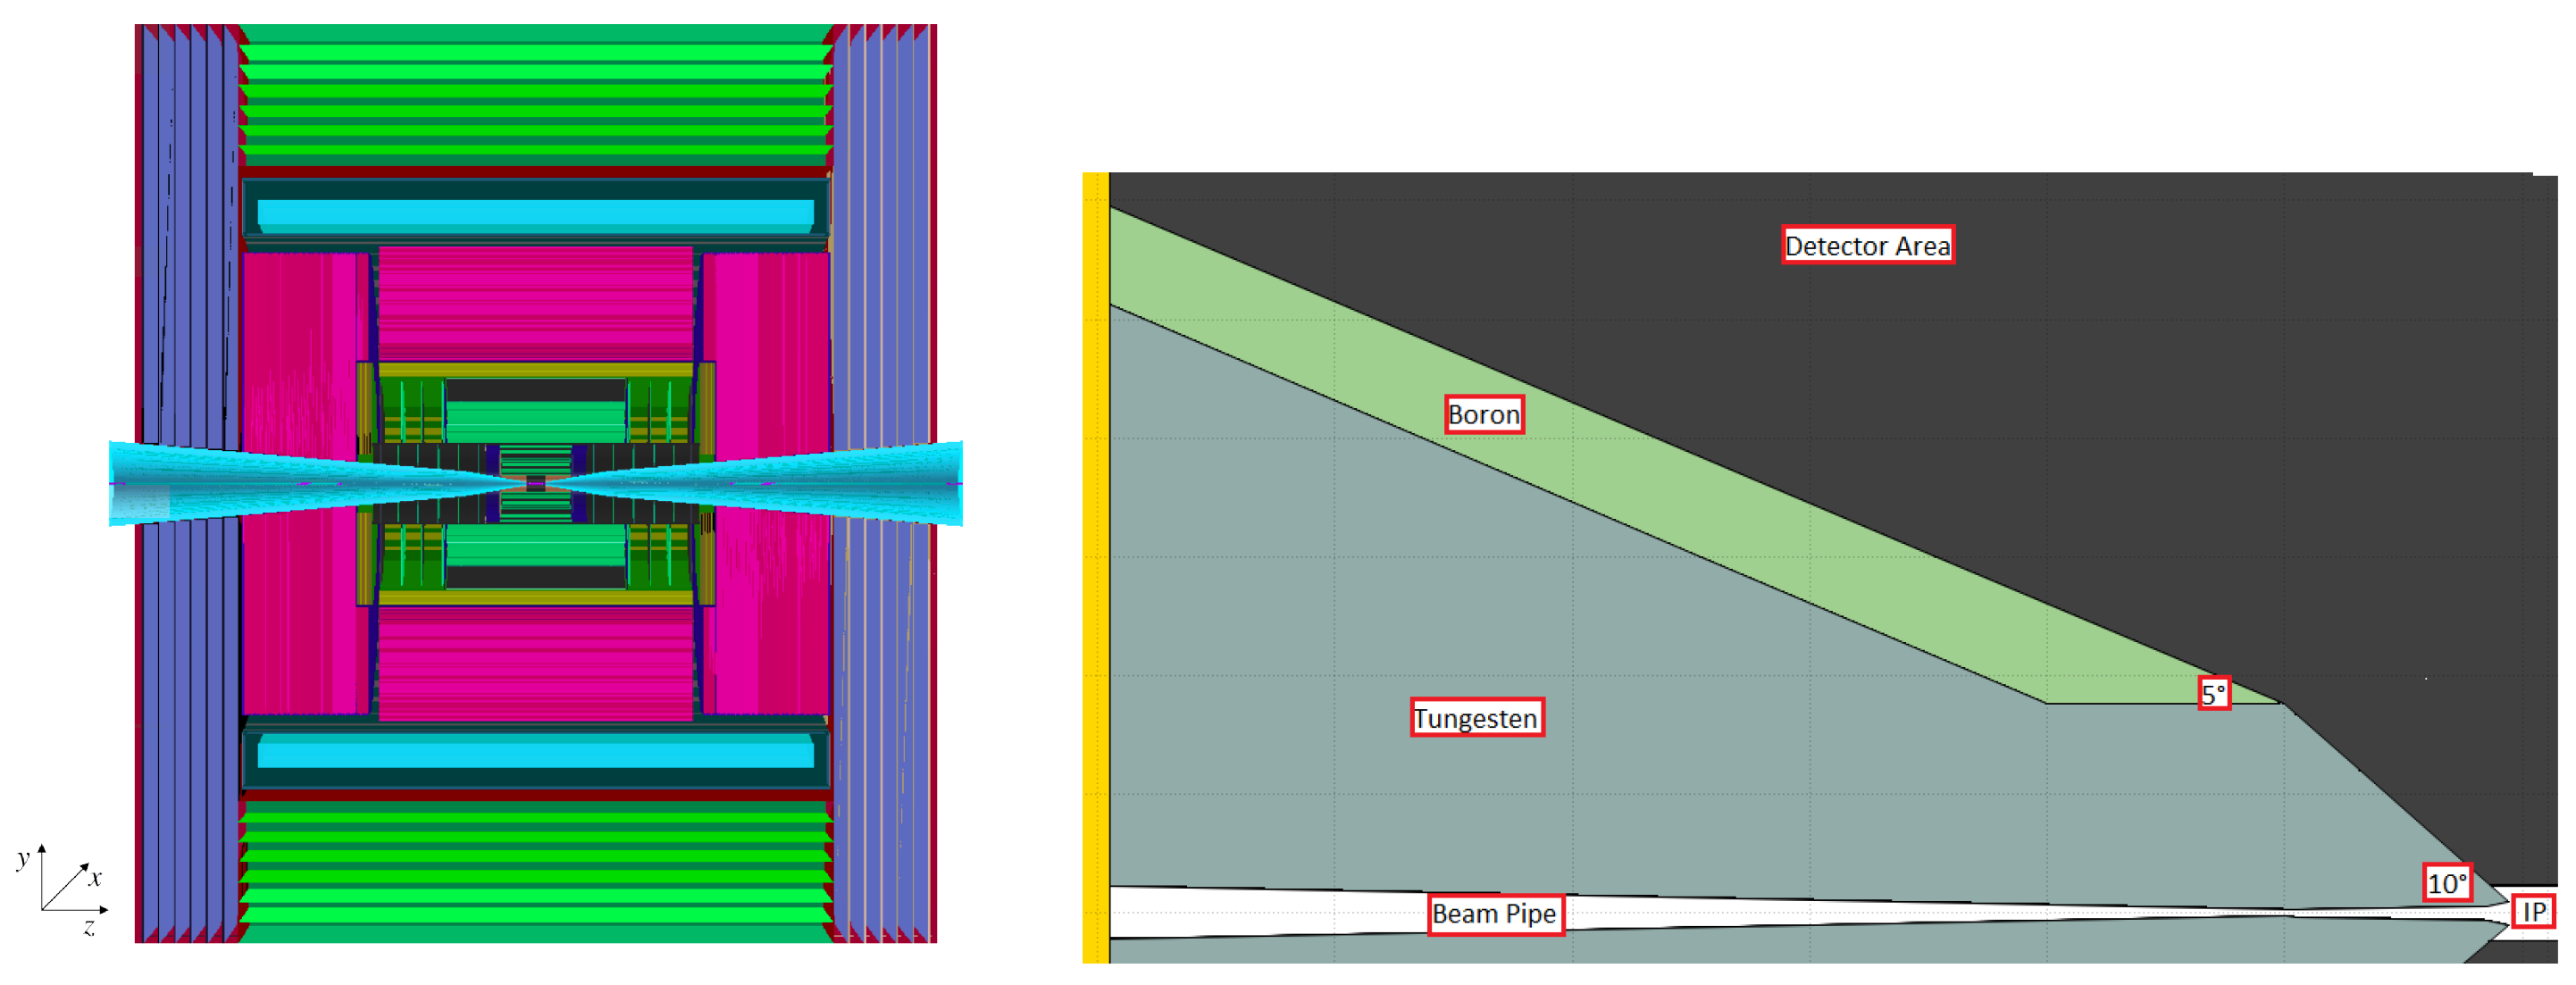
Figure 2.
Left: Arrival times of the main BIB components at the detector relative to the bunch crossing. The light gray band between -1 and 15 ns indicates the assumed readout window for the detector. Right: Energy spectra of the BIB particles that reach the detector within the readout window. The solid and dashed lines refer to the center-of-mass energy of 3 TeV and 1.5 TeV, respectively.
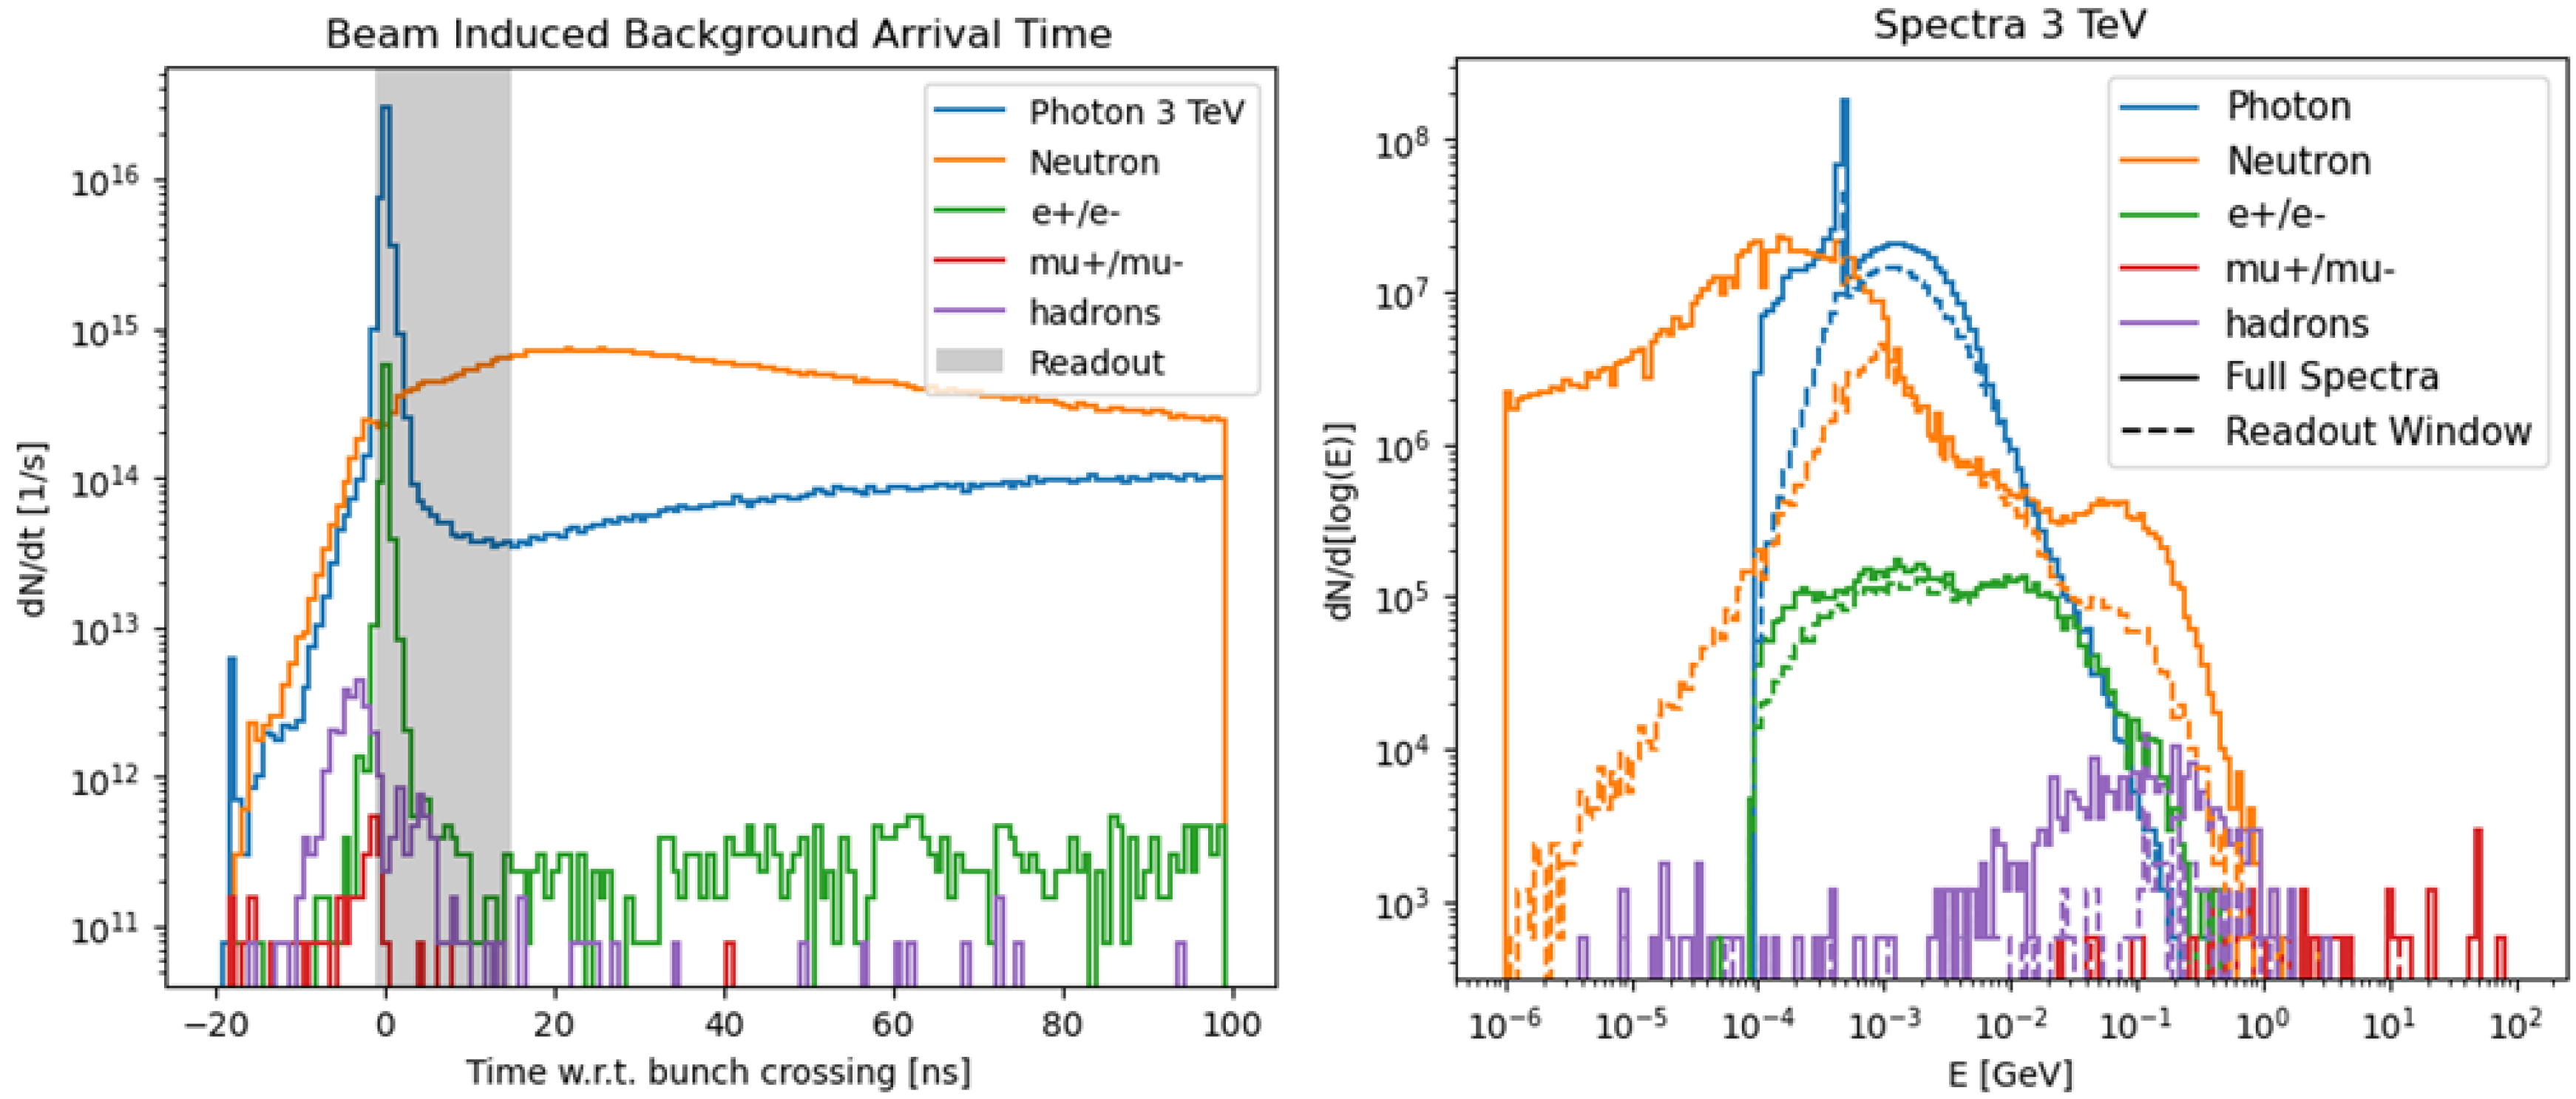
Figure 3.
Geometrical parameters changed during the first studies on the Beam-Induced Background.
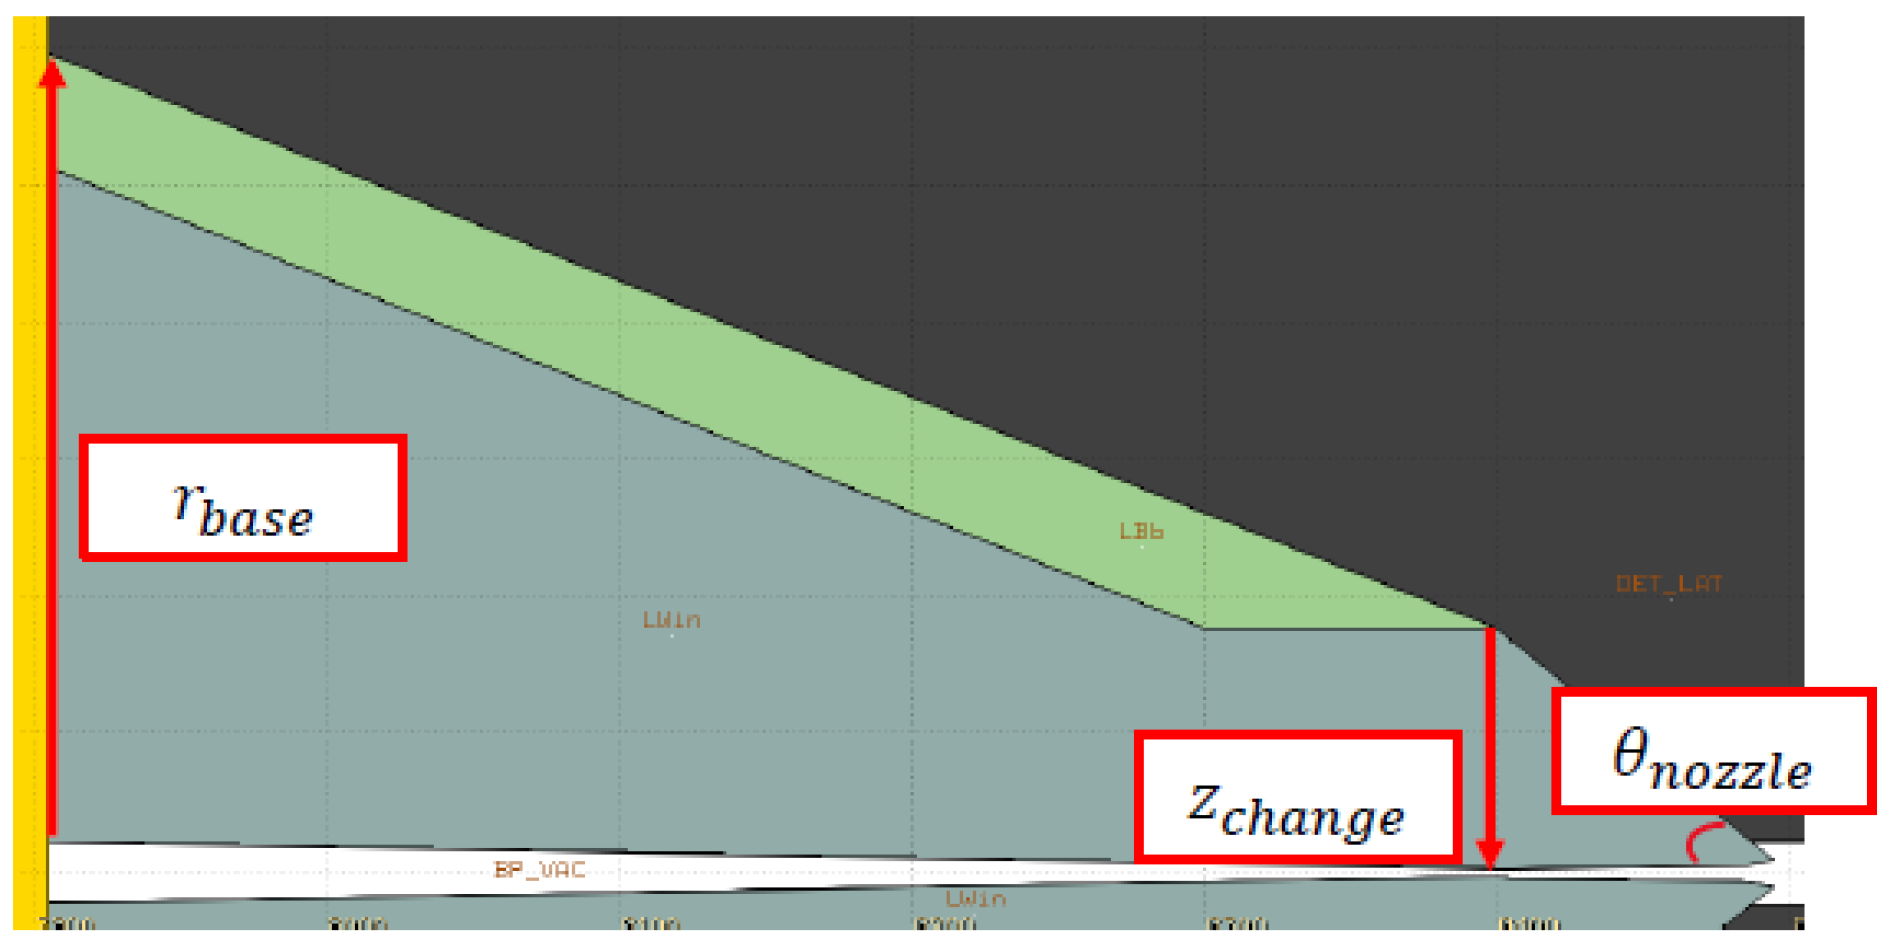
Figure 4.
Components of the Beam-Induced Background with the statistical error obtained with the original nozzle design (solid) and a test configuration (faded).
Figure 4.
Components of the Beam-Induced Background with the statistical error obtained with the original nozzle design (solid) and a test configuration (faded).
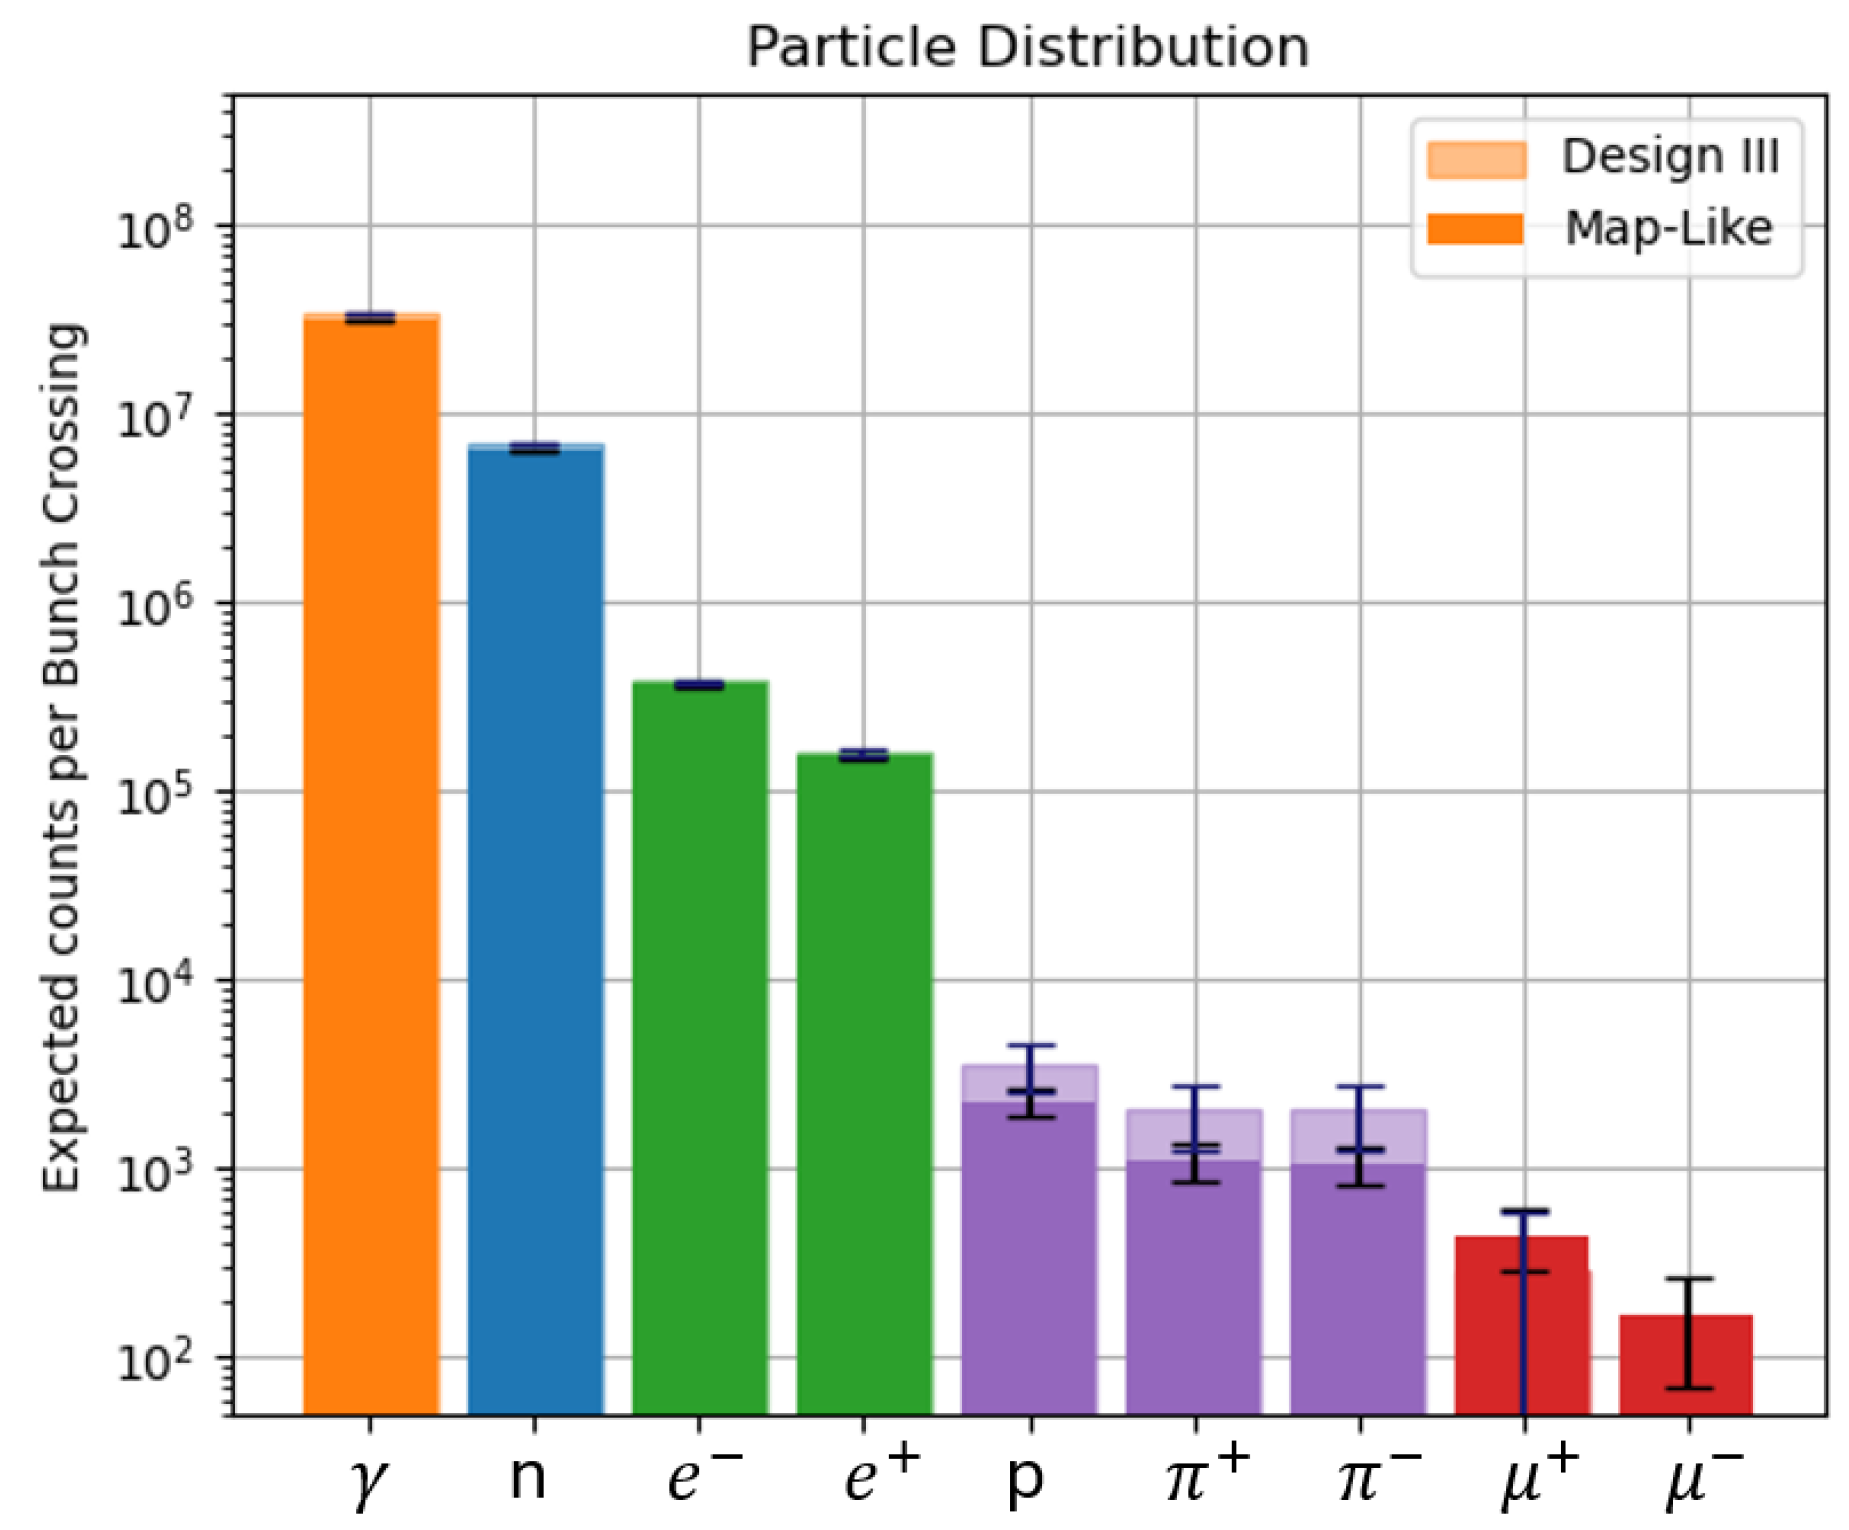
Figure 5.
Neutron fluence in the nozzle. The highest concentration of particle is concentrated in the internal part.
Figure 5.
Neutron fluence in the nozzle. The highest concentration of particle is concentrated in the internal part.
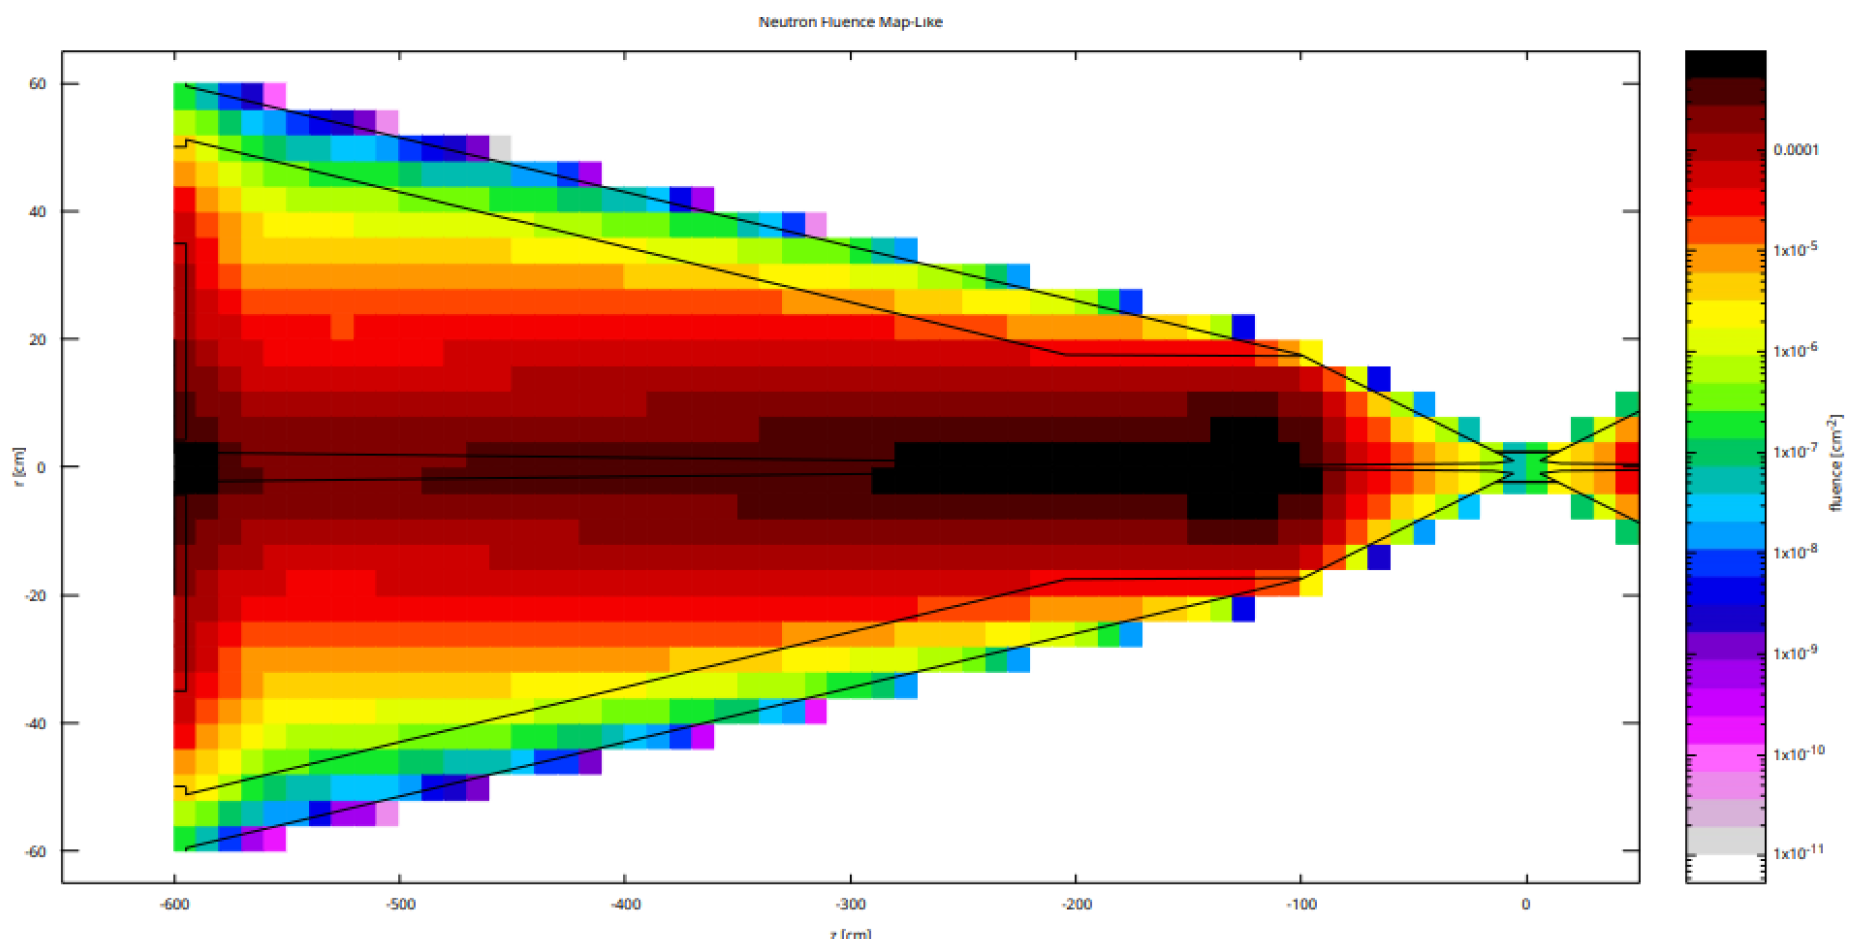
Figure 6.
Geometry layout of the nozzle considered for the Machine-Learning studies. In figure are reported the parameters described in text section.
Figure 6.
Geometry layout of the nozzle considered for the Machine-Learning studies. In figure are reported the parameters described in text section.
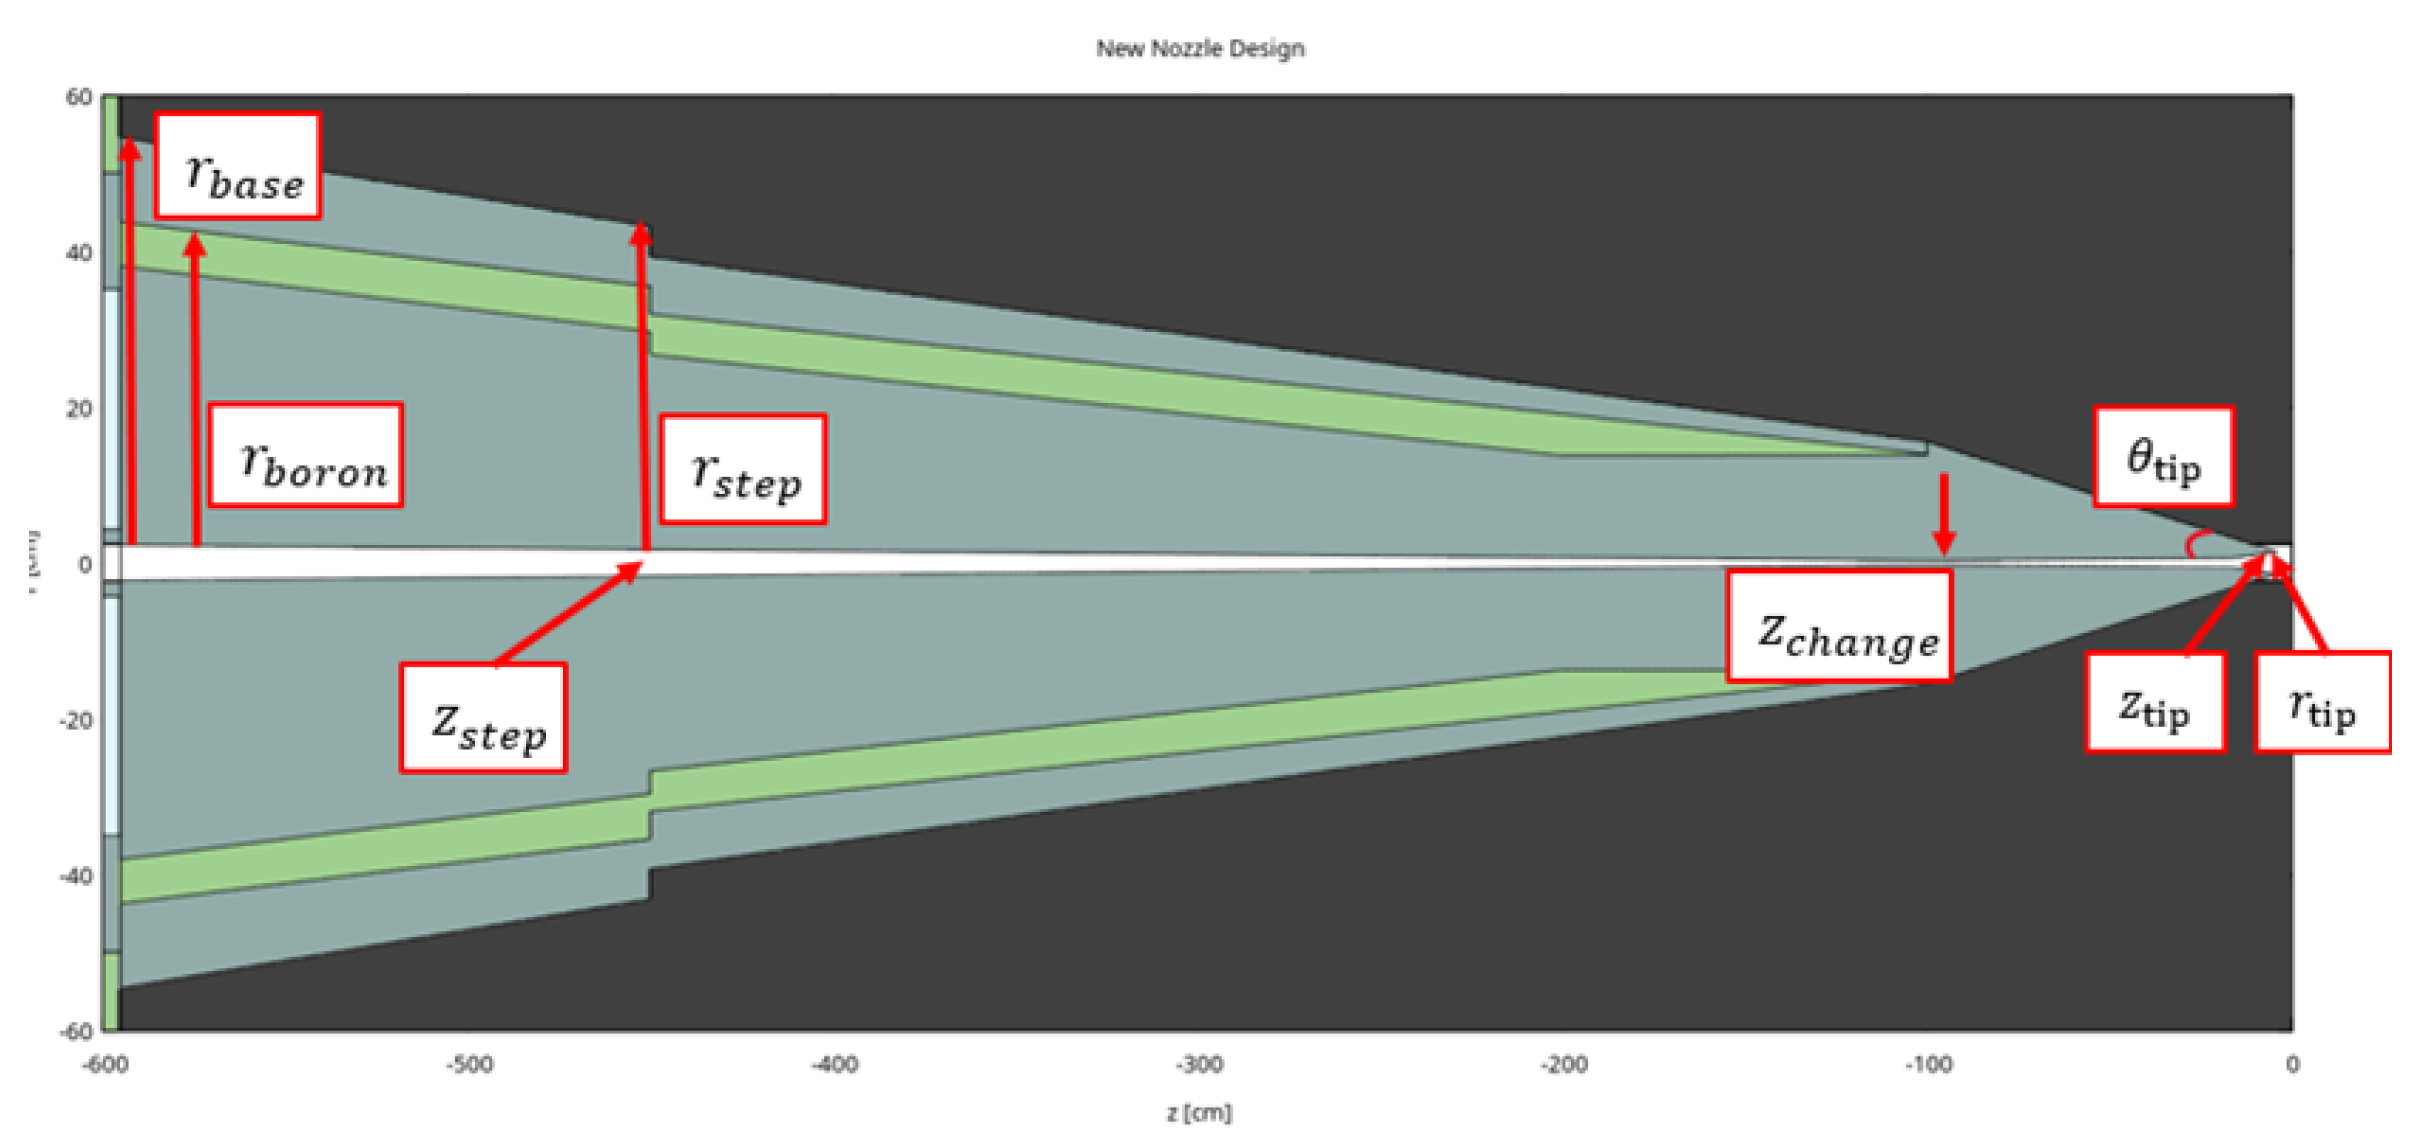
Figure 7.
Photon energy spectrum obtained with original nozzle design and of expected decay simulated (blue) compared to one of the low statistics simulation used for the ML studies (black). The absolute number of photon differs because different configurations are considered.
Figure 7.
Photon energy spectrum obtained with original nozzle design and of expected decay simulated (blue) compared to one of the low statistics simulation used for the ML studies (black). The absolute number of photon differs because different configurations are considered.
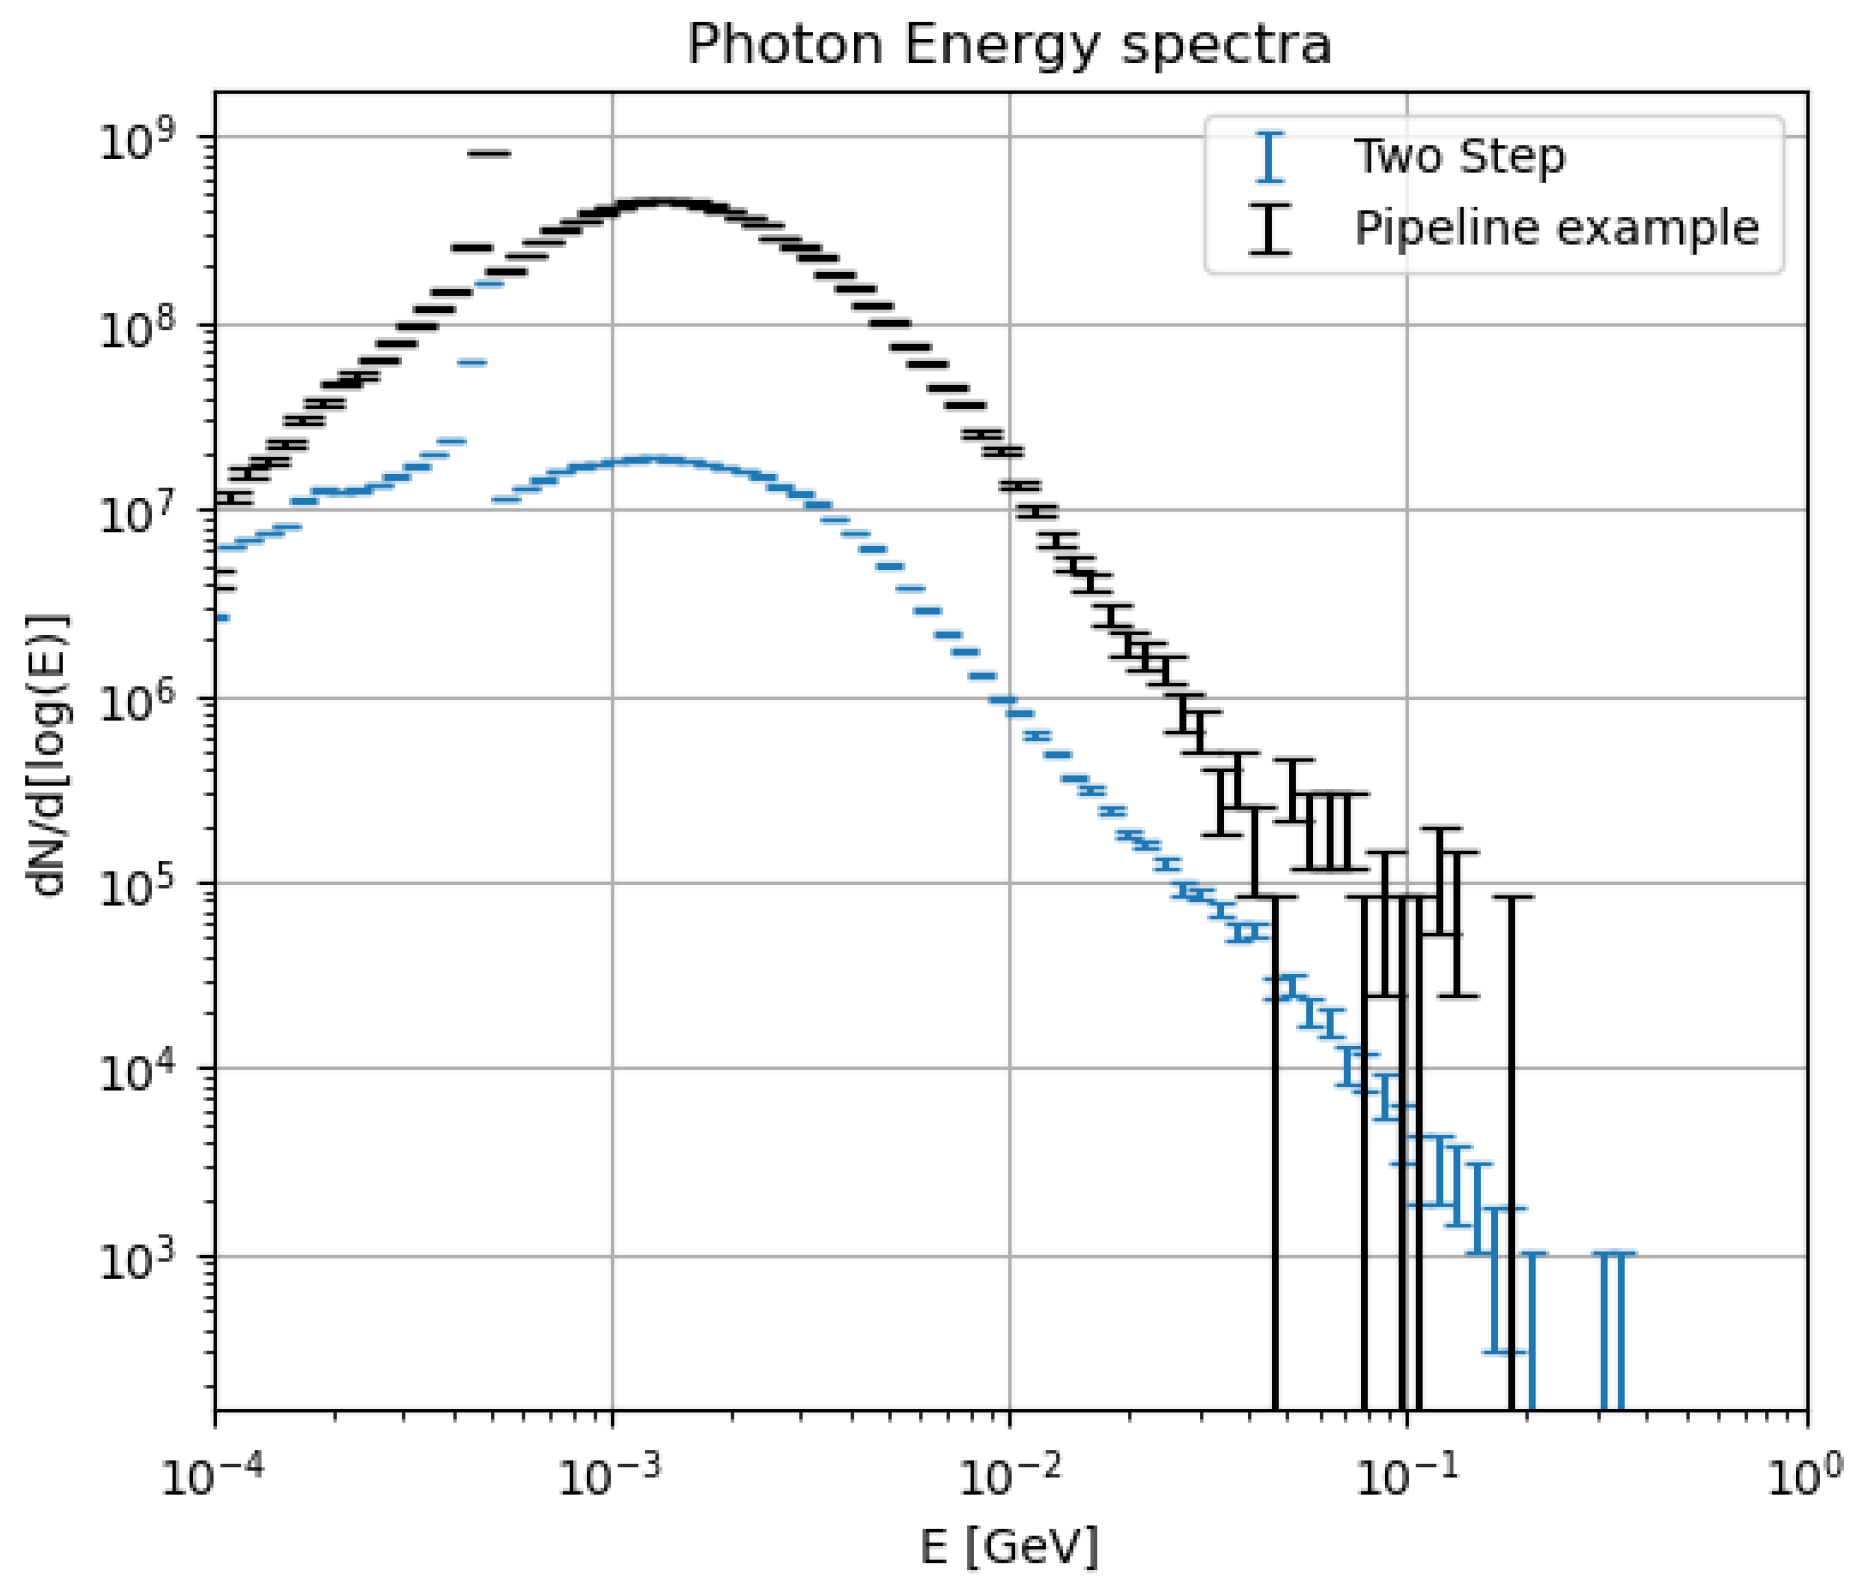
Figure 8.
Comparison of the optimized nozzle geometry (blue) featuring the repositioned borated polyethylene (green) with the original design (dashed red). The vertex and tracker detector layers are also depicted (black).
Figure 8.
Comparison of the optimized nozzle geometry (blue) featuring the repositioned borated polyethylene (green) with the original design (dashed red). The vertex and tracker detector layers are also depicted (black).
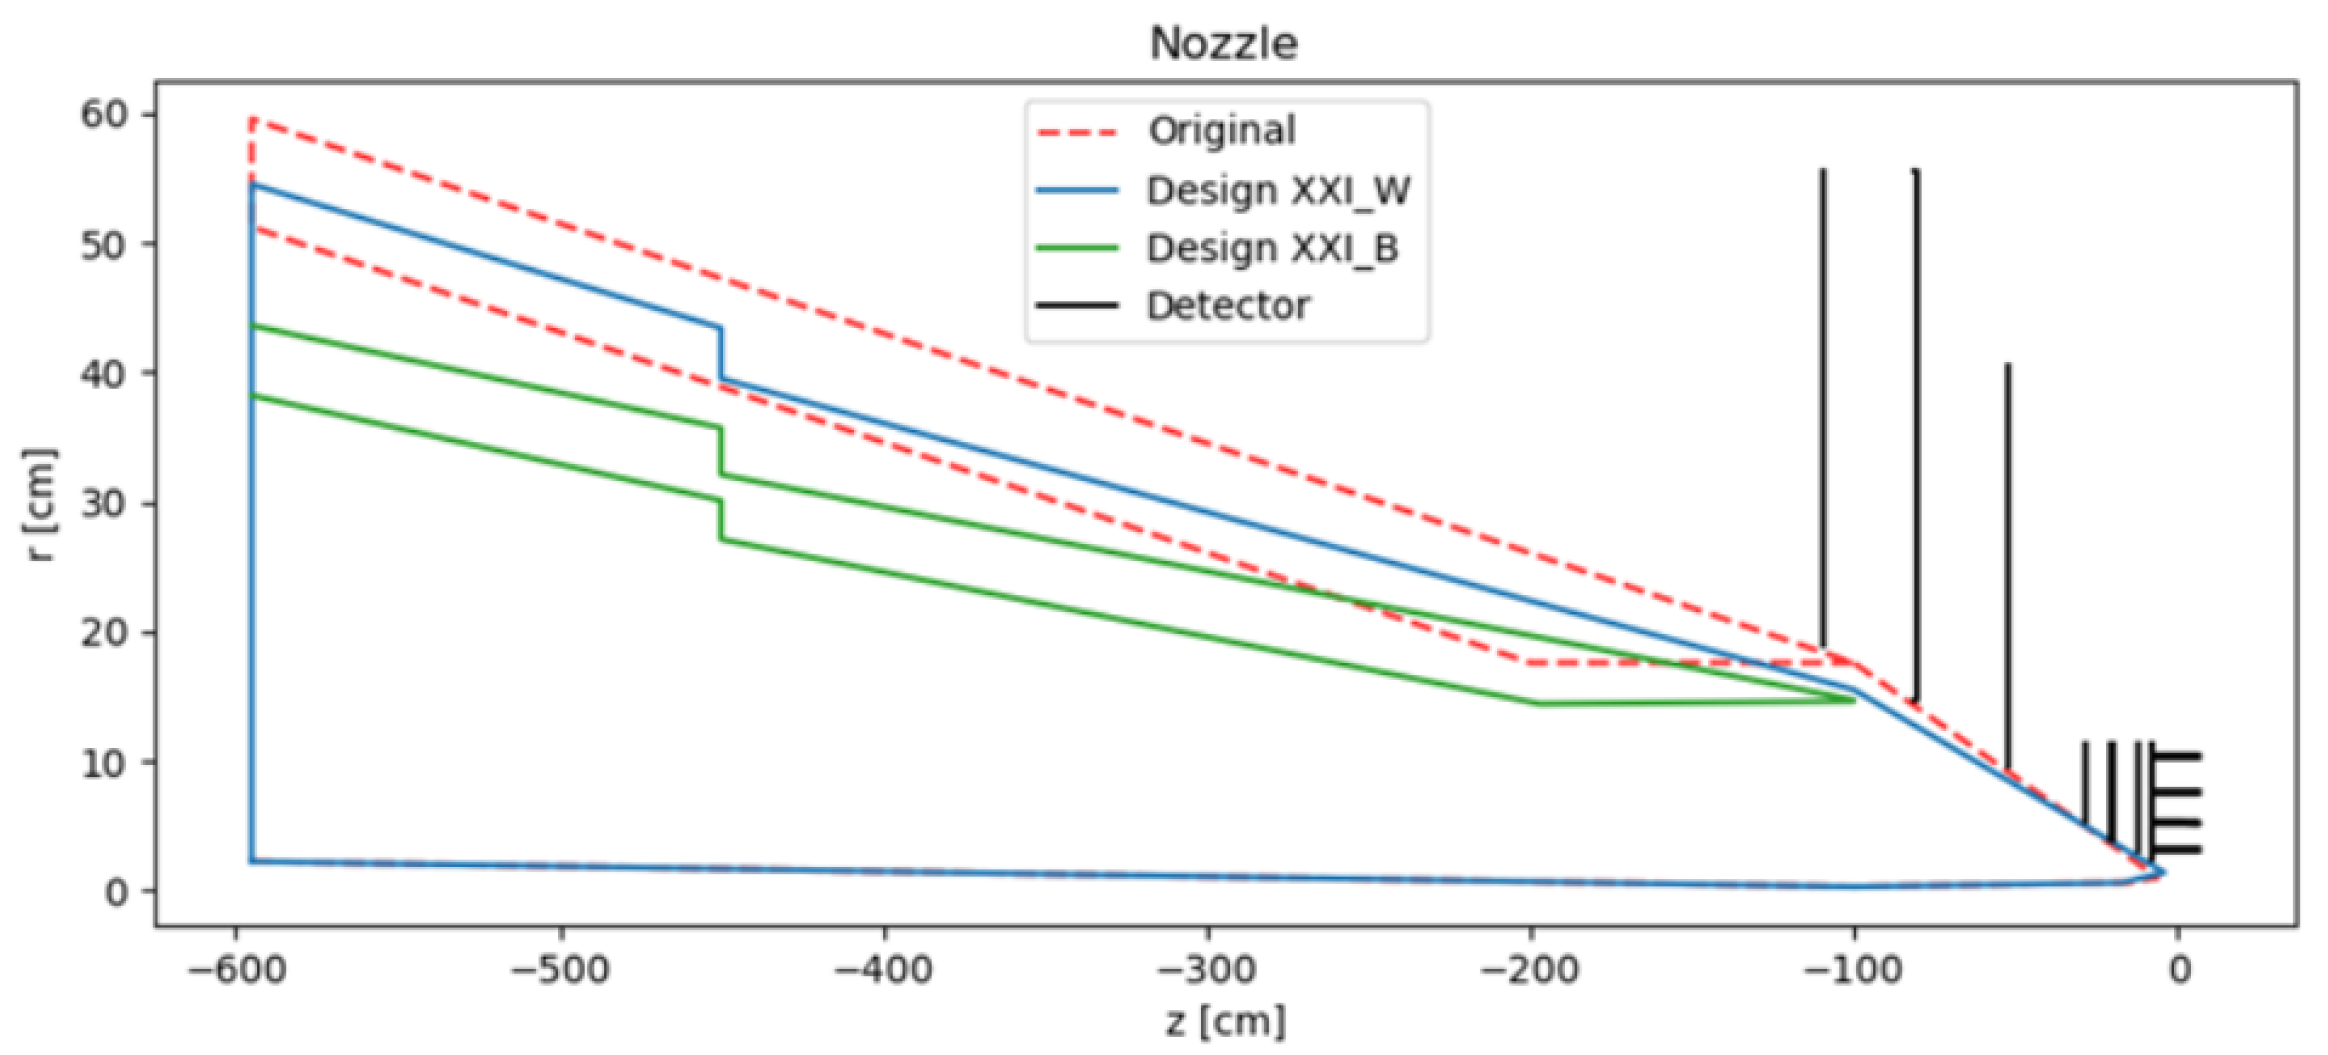
Figure 9.
Energy spectrum of the Beam-Induced Background obtained with the high-statics FLUKA simulation and the optimized design (dashed) compared to the original geometry (solid). The results are obtained after the application of a Readout window of with respect to the bunch crossing.
Figure 9.
Energy spectrum of the Beam-Induced Background obtained with the high-statics FLUKA simulation and the optimized design (dashed) compared to the original geometry (solid). The results are obtained after the application of a Readout window of with respect to the bunch crossing.
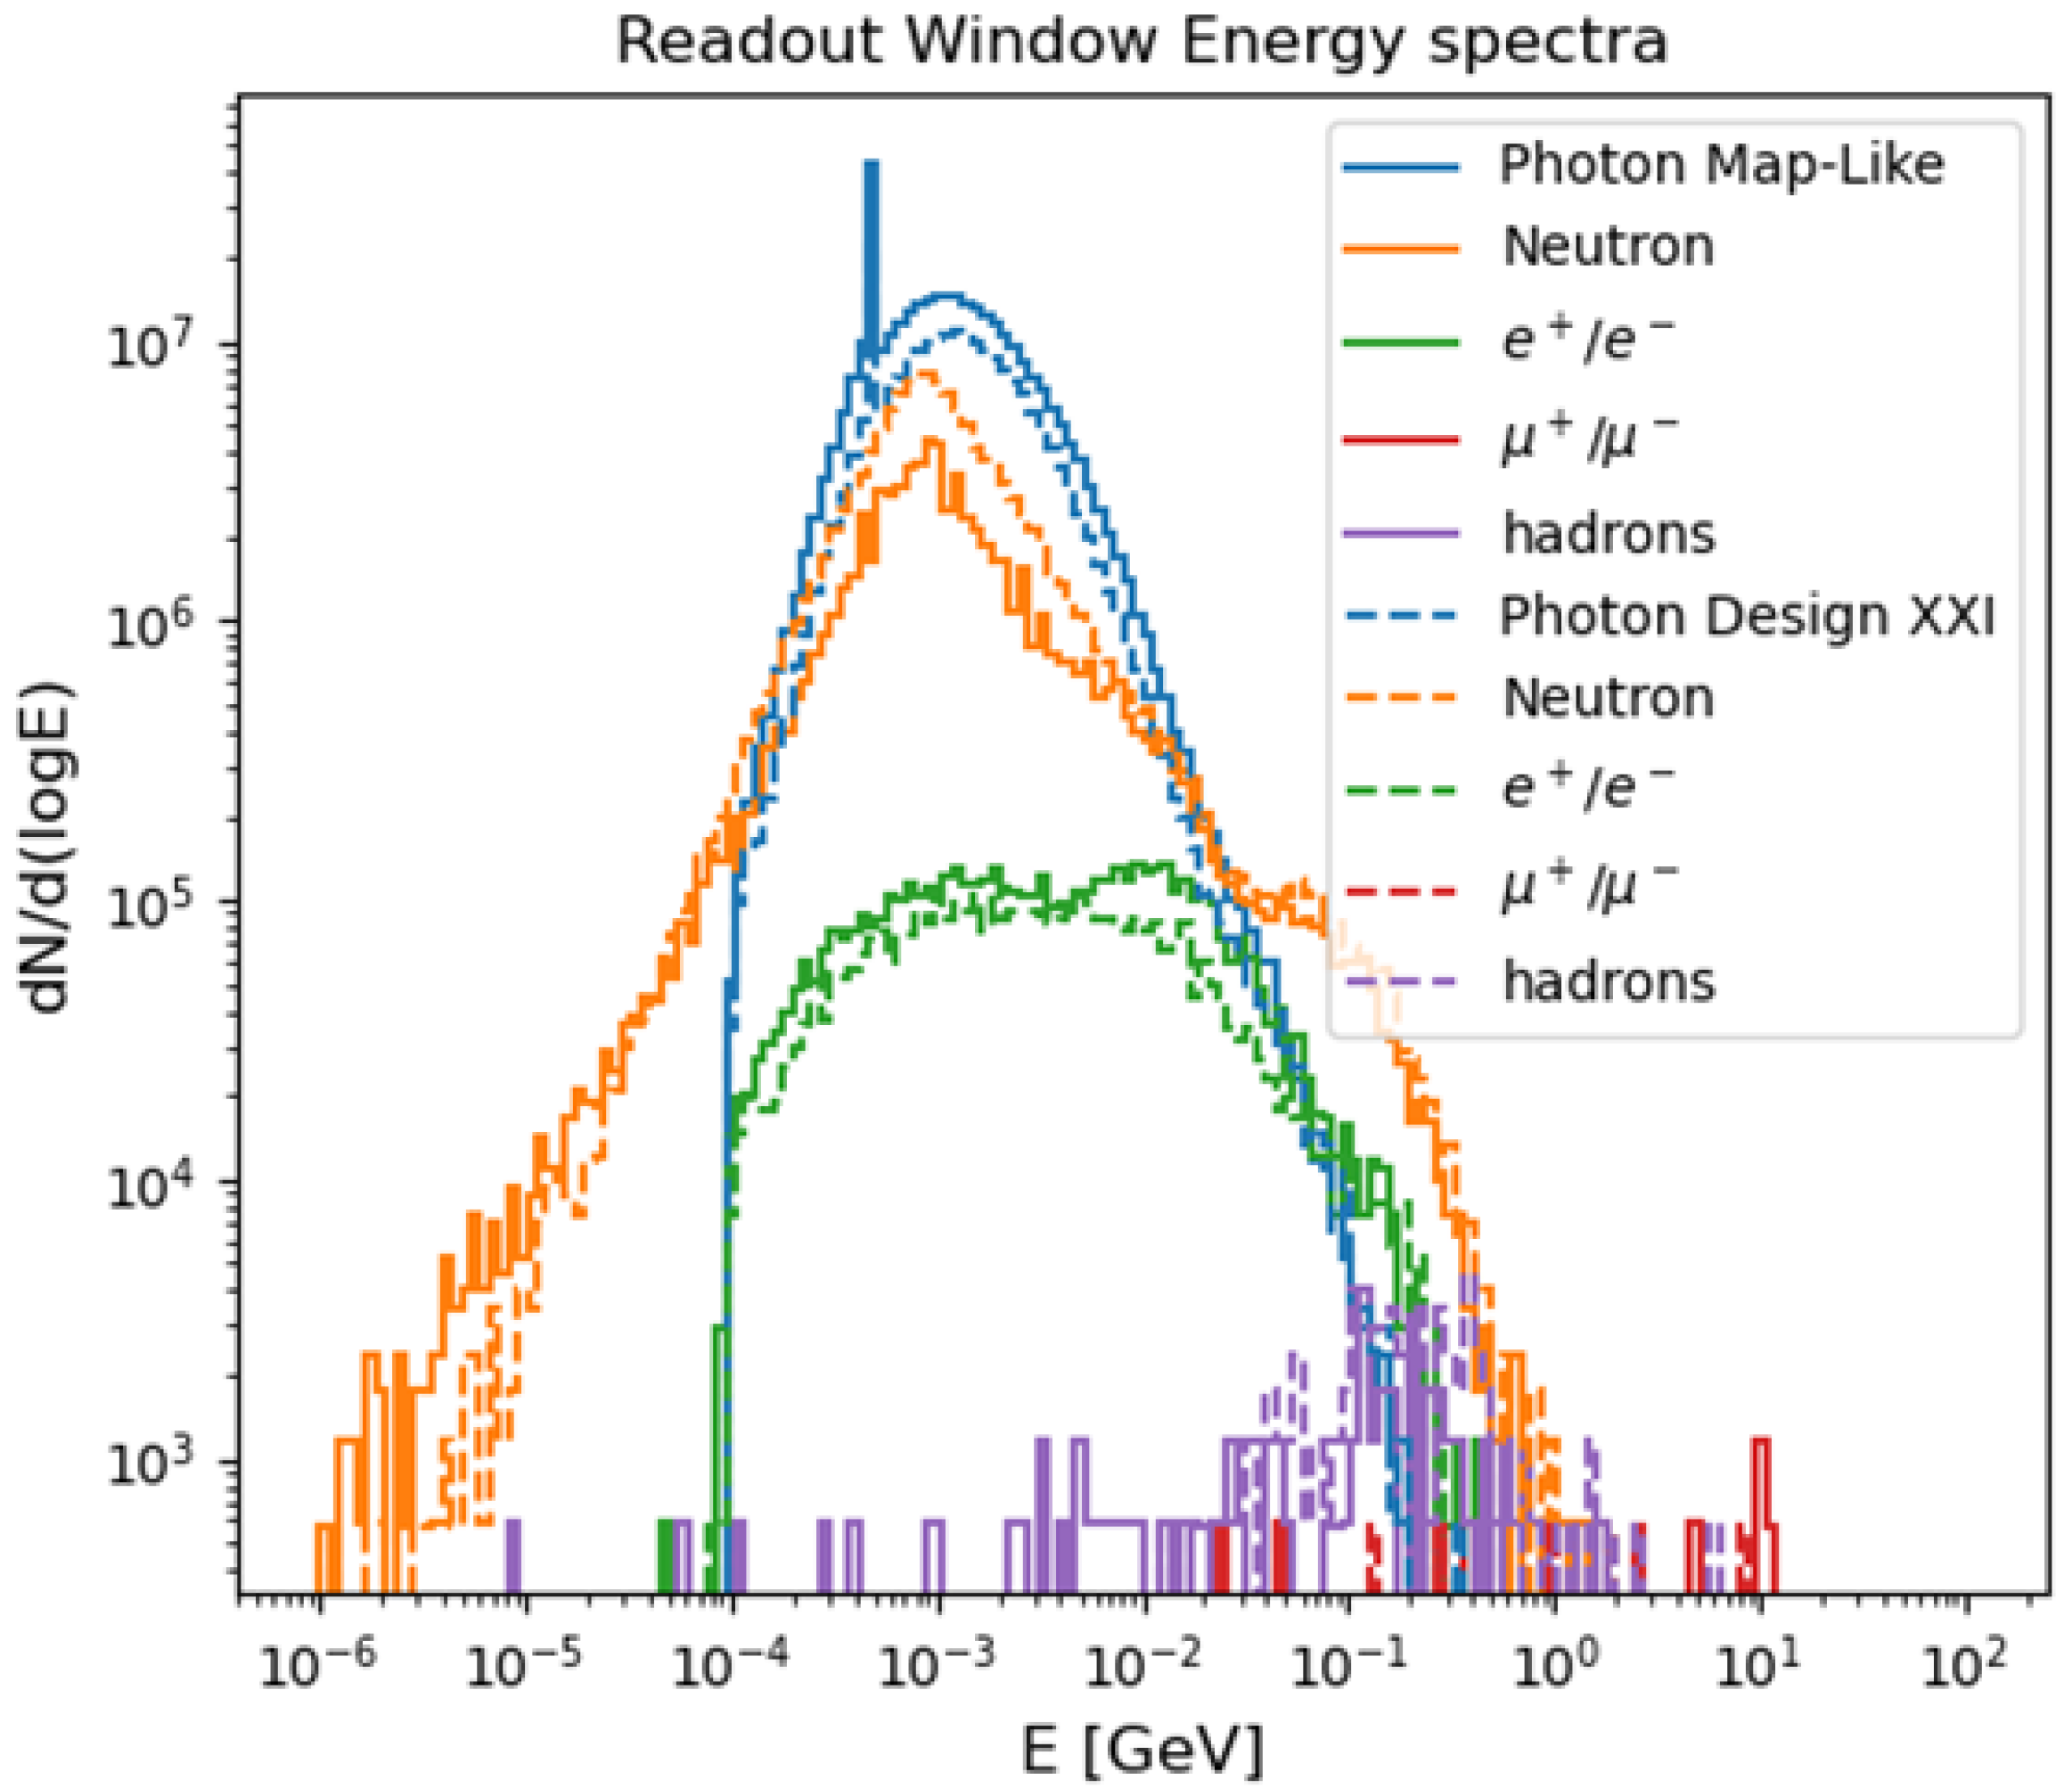

Table 1.
Particle species per Bunch Crossing contributing to the Beam-Induced Background at TeV with the MAP. First column consider the whole flux entering in the detector. Second column considers the application on a Readout Window of with respect to bunch crossing.
Table 1.
Particle species per Bunch Crossing contributing to the Beam-Induced Background at TeV with the MAP. First column consider the whole flux entering in the detector. Second column considers the application on a Readout Window of with respect to bunch crossing.
| Particle Species | Flux | Flux - R.W. |
|---|---|---|
| Photons | ||
| Neutrons | ||
| Electron/Positron | ||
| Hadrons | ||
| Muons |
Disclaimer/Publisher’s Note: The statements, opinions and data contained in all publications are solely those of the individual author(s) and contributor(s) and not of MDPI and/or the editor(s). MDPI and/or the editor(s) disclaim responsibility for any injury to people or property resulting from any ideas, methods, instructions or products referred to in the content. |
© 2025 by the authors. Licensee MDPI, Basel, Switzerland. This article is an open access article distributed under the terms and conditions of the Creative Commons Attribution (CC BY) license (http://creativecommons.org/licenses/by/4.0/).
Copyright: This open access article is published under a Creative Commons CC BY 4.0 license, which permit the free download, distribution, and reuse, provided that the author and preprint are cited in any reuse.


