
Submitted:
24 January 2025
Posted:
27 January 2025
You are already at the latest version
Abstract
Following the abrupt geochemical and geophysical variations that occurred on the island of Vulcano in September 2021, the search for previous multidisciplinary data on decades-long time spans became necessary to contextualize the newly recorded anomalous variations, which represented a serious threat for the local population. Our analyses of ‘vintage’ reports, old documents and analog seismograms broaden our understanding of crustal seismic activity. The results unravel the predominant role of the Vulcano’s hydrothermal system with respect to tectonic processes in the generation of seismicity in the analyzed sector. Earthquakes were generally located offshore and achieved a maximum M4.6. A 3D strain release map and DBSCAN application highlight seismogenic volumes to NW, SW, E offshore the island and trending NNW-SSE inshore, in agreement with structural pattern. Two major volcano unrests in 1985 and 1988 had seismicity mostly confined to the island. In comparison, the longer duration and typology of seismic signals recorded between 2021 and 2022 make this latest episode peculiar in the context of Vulcano’s past seismic activity.
Keywords:
seismic signals
; volcanic unrest
; Vulcano
; seismic monitoring
; decades-long datasets
1. Introduction
Decades-long measures and observations have proved the paramount importance of geophysical and geochemical monitoring on volcanoes worldwide. Recent examples are the 125-day lava flows at Kilawea, Hawaii, in 2018 and the 85-day eruption at La Palma, Canary Islands, in 2021, with their devastating effects and high social impact that made continuous monitoring vital for constraining damage and limiting health problems for local populations (e.g., [1,2]). Records of monitoring measurements can highlight even subtle changes of volcanic unrest and save many lives, such as documented by the evacuation of ~20,000 people before the 1991 eruption of Mount Pinatubo in the Philippines [3]. When eruptive activity is heralded by typical and recurring variations in the monitored parameters, scientists can envisage potential eruptive scenarios, alerting the civil protection and other authorities of impending activity. An example of such timely communications concerns Mount Etna in Italy, where frequent lava fountains (52 in 2021 alone) have led to the design of specific warning systems for similar events (e.g., [4,5,6]).
The Vulcano Island in Italy (the third for dimensions in the Aeolian Archipelago) has a long record of geophysical and geochemical measurements, with pioneering work dating back to the 1800s [7]. Systematic gas samplings, continuous seismic monitoring, and ground deformation measurements started in the 1970s (e.g., [8,9,10]). Since then, a few episodes of volcanic unrest, marked by high fumarole temperatures, changes in gas composition, increased seismic activity and areal dilatation, have occurred without leading to an eruption [11]. However, the Vulcanian eruptive style should have potentially disastrous consequences for the local population (~1000 inhabitants) and for the thousands of tourists which come here every year, especially in summer. The last eruption stemmed from La Fossa Crater (in the northern part of the island; Figure 1), and spanned from 1888 to 1890, causing phreatomagmatic explosions and pyroclastic flows, which swept the flanks of the crater. Meters-large bread-crust bombs were also ejected with no consequence to people, who were already evacuated. Volcanic activity in this as in the other six islands of the Aeolian Archipelago (Figure 1) is a typical expression of a subduction zone, with stratovolcanoes formed by the accumulation, from 400 ky to the Present, of lava flows and pyroclastic deposits with calc-alkaline, shoshonitic, and potassic affinity [12,13,14,15].
The most recent unrest on the island of Vulcano began in September 2021, with anomalous values in geochemical and geophysical parameters slowing returning to the background levels within the end of 2022. Federico et al. [11] provides a comprehensive description of the multidisciplinary data collected by the permanent monitoring networks run by Istituto Nazionale di Geofisica e Vulcanologia (INGV), along with findings from additional temporary measurements. From the seismic viewpoint, two were the main features of the unrest: i) the occurrence of Very Long Period events (VLP; with frequency peak ~0.3 Hz and often superimposed higher frequency peaks up to 5 Hz) and ii) a low to moderate (maximum magnitude ML4.6) tectonic seismicity. The whole picture drawn by the collected geochemical and geophysical parameters highlights the involvement of both magmatic and hydrothermal systems with a high level of unrest. But how did this situation differ from previous unrest episodes that hit the volcano? Based on past seismic monitoring data, this work aims to provide an answer to this question by putting the changes in seismic activity between 2021 and 2022 into context. Using old reports and institutional datasets from different sources, we provide a reconstruction of the occurrence frequency of seismic events from 1985 to 1999 and the hypocentral location of the most energetic ones (M > 2.5) from 1985 to 2019. Based on this data collection, we present a 3D analysis of the strain release in the study area in the considered time span and the application of the DBSCAN code [16], an unsupervised pattern classification method, which provides further insights into the earthquake data.
Overall, this study based on the catalogs shared by [17] constitutes an easy-to-use collection of reference information also for future unrest conditions and in case of sudden seismic changes to interpret.
2. Seismic data analysis
Routinely seismic data analysis for surveillance purposes has been the task of scientific teams, who regularly issued information to Civil Protection. In the years from 1985 to 1999, these experts worked for the Istituto Internazionale di Vulcanologia (IIV), a department of the Italian Consiglio Nazionale delle Ricerche (CNR); afterwards, the analysis was carried out by scientific personnel of the INGV.
To identify the main features of seismic activity on and around the island of Vulcano in the 34 years preceding the last volcano unrest, we collected and examined the available seismic data recorded from 1985 to 2019, most of which were in analog format and/or dispersed in old repositories. Consequently, the data here reported have many sources. The oldest data are from paper documents, namely forms and reports compiled in the 1980s. We also collected information from periodic bulletins, articles and in recent years from the INGV national database (https://terremoti.ingv.it/). A list of the references for the entire collection can be found in [17].
2.1. Seismic network
The Aeolian Islands Seismic Network (AISN) was created in the late 1970s, and was run by IIV staff. In the middle 1980s, AISN encompassed eight stations installed on the islands of Alicudi, Lipari, Vulcano, Stromboli, and in Novara di Sicilia (in the northern part of Sicily) (Figure 1). The stations were originally equipped with short-period (1s) seismometers; the analog signal was transmitted to Lipari where it was acquired on paper and (temporarily) stored on magnetic tapes. These two kinds of support were weekly shipped to IIV in Catania for the analysis and playback of signals.
Over the years the network has undergone several technical upgrades: the installation of new stations, the digitalization of the signal (with sampling frequency of 125 or 100 Hz); direct transmission to the INGV data acquisition center in Catania (from 2000 onwards); replacement of the original analog stations with new digital ones, all equipped with three-component broadband seismometers.
It should be noted that the reuse of the magnetic tapes has led to the loss of past recordings, while most of the seismograms on paper up to the mid-2000s are still available at INGV. Recent raw (digital) seismic data are available in the European Integrated Data Archives (www.eida.ingv.it).
2.2. Dataset
The region of interest focuses on the island of Vulcano, Italy (Figure 1). Based on the criteria originally applied for the routine analysis of seismic data for surveillance purposes, we compiled three catalogs (see [17]) including different types of seismic events based on their magnitude and location, namely:
- earthquakes with M>2.5
- in the Lipari-Vulcano complex
- in the Fossa Crater
2.2.1. Earthquakes with M>2.5
For the earthquakes with magnitude > 2.5, our data collection refers to the following coordinates: latitude from N38.265° to 38.540°, longitude from E14.780° to 15.130° (Figure 1). The time span covered by this data is from 1985 to 2019. For each earthquake, the hypocentral parameters (UTC origin time, latitude in degrees, longitude in degrees, depth in km, azimuthal gap in degrees, and location errors in km, when available), duration magnitude (Md) and local magnitude (ML) are reported.
A comparison between ML and Md is proposed in Supplementary Figure S1. There is a good agreement in the range of magnitude values reported in this catalog; consequently, we will indicate with M the magnitude of the seismic events discussed in the following.
The hypocentral parameters listed in our catalog are referred to the INGV database from 2000 to 2019 ([18] and https://terremoti.ingv.it/). Location data from previous years were not revised, as the original signals in the 1980s and 1990s were in analog format; they were recorded on magnetic tape, which was erased to be reused over time. In addition, some digital recordings have been lost due to the deterioration of the CDs used for their storage.
P- and S-phase pickings were mainly based on the records of the permanent seismic stations run by IIV until 1999 and by INGV ever since. In the 1980s and 1990s, improved earthquake locations were achieved when the magnitude allowed the acquisition of additional phase data from the local seismic networks in the Calabrian and Peloritan areas, thanks to the collaboration with Professor Ignazio Guerra and Professor Antonio Bottari of Calabria and Messina University, respectively.
The collected hypocentral parameters were calculated by means of the Equivalent Velocity Method [19] until the 1980s; since then, HYPO71PC [20] and Hypoellipse 2.0 [21] computer programs have been used. The velocity models used were those of Jeffreys and Bullen [22] and Falsaperla et al. [23], the latter obtained using deep seismic sounding data recorded in the Aeolian Islands, and therefore particularly suitable for the location of the seismic events with origin on the island.
From the analysis of the daily number of earthquakes, it is evident that the occurrence rate of earthquakes with M>2.5 is relatively low (Figure 2) and can be easily overtaken during a single seismic swarm in other volcanic regions, such as Campi Flegrei at the time of writing (https://ingvvulcani.com/2024/05/21/campi-flegrei-sciame-sismico-del-20-maggio-2024/). M4.6 is the maximum magnitude (Figure 2).
The catalog encompasses 179 earthquakes (complete with all hypocentral parameters), only nine of them with M≥3.5 (~5% of the entire sample; Figure 3a). Most focal depths are within the top 15 km (148 foci, ~83%). Relatively few shallow earthquakes (depth <10 km) were recorded since 2000 (Figure 3b-c); however, we cannot exclude that this evidence may be related to the upgrade of the seismic network for the setup of stations on other islands of the Aeolian Archipelago (Figure 1).
2.2.2. Seismic events in the Lipari-Vulcano complex
This catalog includes the hourly occurrence frequency of seismic events with origin within a radius of 10 km around La Fossa Crater (Figure 1 and Figure 4). For a description of the various types of local events, we address interested readers to e.g., [24,25,26,27]. The source mechanism of these signals can be related to: i) brittle failure of rocks (clear arrivals of P- and S-waves, short duration, rapid decay) and ii) fluid dynamics (often emergent onset, unclear seismic phases, relatively long duration compared to amplitude).
The events in this catalog were recorded in at least three stations in the Lipari-Vulcano area in the years from 1985 to 1999. Two main changes in the cumulative number of events mark the 1980s, with the occurrence of two major seismic swarms in 1985 and 1988, respectively (Figure 4). Duration and epicentral location neatly distinguish these seismic unrests from others that occurred in the 1990s. Unlike the short-lived (generally a few hours) episodes of the 1990s, which appear as peaks in Figure 4, the duration covered about four months in 1985 (from April 25 to August 31) and three months in 1988 (from July 2 to September 30). In addition, their foci were mostly confined to the interior of the island (Figure 5).
In the catalog, the 1985 seismic swarm collects 32 locations for seismic events with 1 ≤ M ≤ 2.3 and hypocenters up to 4 km (Figure 5a-c). The seismicity associated with the 1985 unrest was mostly confined in the northern part of Vulcano, a sector of the island heavily affected by fumaroles and high temperature. Seismic events with fluid dynamic origins were numerous during the 1985 unrest [24]; however, Very-Long Period (VLP) events could not be recorded due to the use of instrumental equipment with short-period (1s) geophones.
Despite its shorter duration with respect to the 1985 unrest, the seismic events in 1988 had relatively higher magnitude (1.8 ≤ M ≤ 2.5) with comparable focal depths (<5 km). Also in this case, the epicentral locations (100 events in about three months) were mostly inside the island and roughly outlined a sub-vertical NNW-SSE trend (Figure 5d-e).
The relevance of the 1985 and 1988 seismic unrests is evident from their duration (several months) and location, with seismogenic sources mostly within the island, where the pressure of fluids of the volcanic system acted. These characteristics distinguish these episodes from other seismic swarms, such as those that occurred in 1994, during which 65 events with 1.2 ≤ M ≤ 4 occurred in July and 24 events with 1.7 ≤ M ≤ 3.6 in November (Figure 4); apart from their shorter lifespan, they were mainly located offshore the southwest of the island.
Compared to the past, the duration of the 2021-2022 unrest (~16 months) was much longer than that in 1985 (4 months) and 1988 (3 months). This evidence and the occurrence of numerous VLP events pinpoint the greater relevance of this latest episode.
2.2.3. Seismic events in the Fossa Crater
The reference station for the counting of these seismic events was named VCR until mid-2004 and IVCR ever since. It is located in the northern flank of the Fossa Crater (with coordinates N38.41°, E14.96°), close to a large fumarole field (Figure 1).
Hourly frequency and cumulative count of seismic events at the reference station (IVCR) from 1985 to 1999, are reported in Figure 6. These events are mostly microshocks with short duration (less than a few tens of seconds) and low energy release (<1013 ergs; [25]) linked to fluid dynamics in the shallow hydrothermal system. The count required exceeding an amplitude threshold (20 mm) on the paper drums recordings at the reference station. There was no distinction among the events, as their frequency content varied from 0 to 30 Hz encompassing various types of signals, from Long-Period (LP) to volcano-tectonic events (e.g., [24]).
The hourly frequency of seismic events recorded at the station VCR during the 1985 seismic swarm reached a maximum (1.39) across the entire dataset, and was also more than double that in the 1988 episode (Figure 6). The low values (generally < 3 events/day) of the hourly frequency in the 1990s were only punctuated by short-lived increases with the same maximum value (0.54) on 28 June 1998, and 15 and 17 January 1999.
3. 3D strain release map and DBSCAN application
A validation of our catalog regarding the 1985 and 1988 seismic unrests can be found in multidisciplinary studies, which discuss strong concurrent changes in other geophysical and geochemical parameters. Here we cite two examples. During the 1985 unrest, the radial component of a local tilt borehole station measured progressive inflation at the La Fossa Crater; the trend reversed with the decline of the seismic swarm [28]. Chiodini et al. [29] observed a strict temporal relationship between high carbon dioxide content of fumarolic fluids and local microseismic activity in 1988; they surmised that increased fluid pressure at depth could be a common source of such variations.
Regarding the catalog of earthquakes with M>2.5, the paucity of the number of stations along with the geometry of the seismic network make the magnitude threshold set in the 1980s for surveillance purposes reliable. For the part of the earthquake catalog prior to the 1990s, most information concerning root mean square (rms) values and errors were either missing or vague. Available rms values of the earthquakes from 1991 to 2019 were of 0.21 s on average. The qualitative and quantitative improvement of the data (with the use of broadband stations) allowed a substantial decrease in the horizontal and vertical error, which did not exceed 3.2 km in the years from 2000 to 2019. Conversely, the azimuthal gap remained relatively high due to the objective difficulty to locate small earthquakes, not detectable in distant stations.
To evaluate the overall robustness of hypocentral locations, we propose in the following a 3D map of strain release in the study area and the application of an unsupervised method of pattern recognition.
Our strain release calculation is obtained from the value of the square root of the energy, using the magnitude–energy relationship computed for Italian earthquakes by Di Filippo and Marcelli [30]. Figure 7 depicts a 3D map of the strain release of earthquakes with M>2.5 from 1985 to 2019. The average value was calculated within a regular grid of 0.05° in latitude and longitude in the study area, and reported in logarithmic scale. The strain release values pick in specific sectors, which highlight some seismogenic regions near and below the island of Vulcano (Figure 7). Specifically, relatively high values are reached NW, SW and E offshore of the island, while a NNW-SSE trending zone is found approximately inshore (Figure 7).
The application of pattern recognition to the earthquakes with M>2.5 from 1985 to 2019 provides similar evidence using a technique of unsupervised learning, namely without human supervision (Figure 8). The chosen technique is DBSCAN (Density-Based Spatial Clustering of Applications with Noise; see [16,31]; www.yarpiz.com). A (freely downloadable) version of the DBSCAN classifier running in MATLB can be found in Heris [32]. For our application, we implemented DBSCAN to find patterns in our earthquake catalog using a simple routine from the book by Langer et al. [31]. In this application, we consider a unit volume in our catalog of earthquakes and calculate the density of earthquakes inside this volume. Input parameters were latitude, longitude, depth and magnitude. The technique does not require the number of desired clusters as an input. All points at the margins of a cluster and that cannot be density reached are identified as noise points (see empty dots in Figure 8). A big advantage of DBSCAN with respect to other pattern recognition techniques, such as K-Means, is that it can find clusters of arbitrary shapes. Therefore, there is no assumption of spherical clusters, which can be unrealistic especially in volcanic environments.
Figure 8 highlights four main clusters with different colours, located to the NW (light blue), SW (green) and Est (blue) of Vulcano along with a fourth cluster (red) in direction NNW-SSE from the northern part of the island to the southern margin of the study area.
Overall, our results from the 3D strain release map and DBSCAN application offer a robust indication of the validity of the dataset and can serve as a baseline for future comparative analyses.
4. Discussion
Independent findings from Fault Plane Solutions (FPS) and structural data provide further support to the validity of our dataset. Figure 9 depicts the FPS of the earthquakes in the study period derived from literature [33,34,35] (a numbered list can be found in Supplementary Table S1). The presence of distinct seismogenic source volumes is confirmed by FPS, which highlight right-lateral transpressive motions on nodal planes trending NW–SE and WNW–ESE to the West of the Lipari island and inverse kinematics on NE–SW oriented nodal planes to the East. Right-lateral transtensional kinematics instead characterize seismic events SW of the Vulcano island.
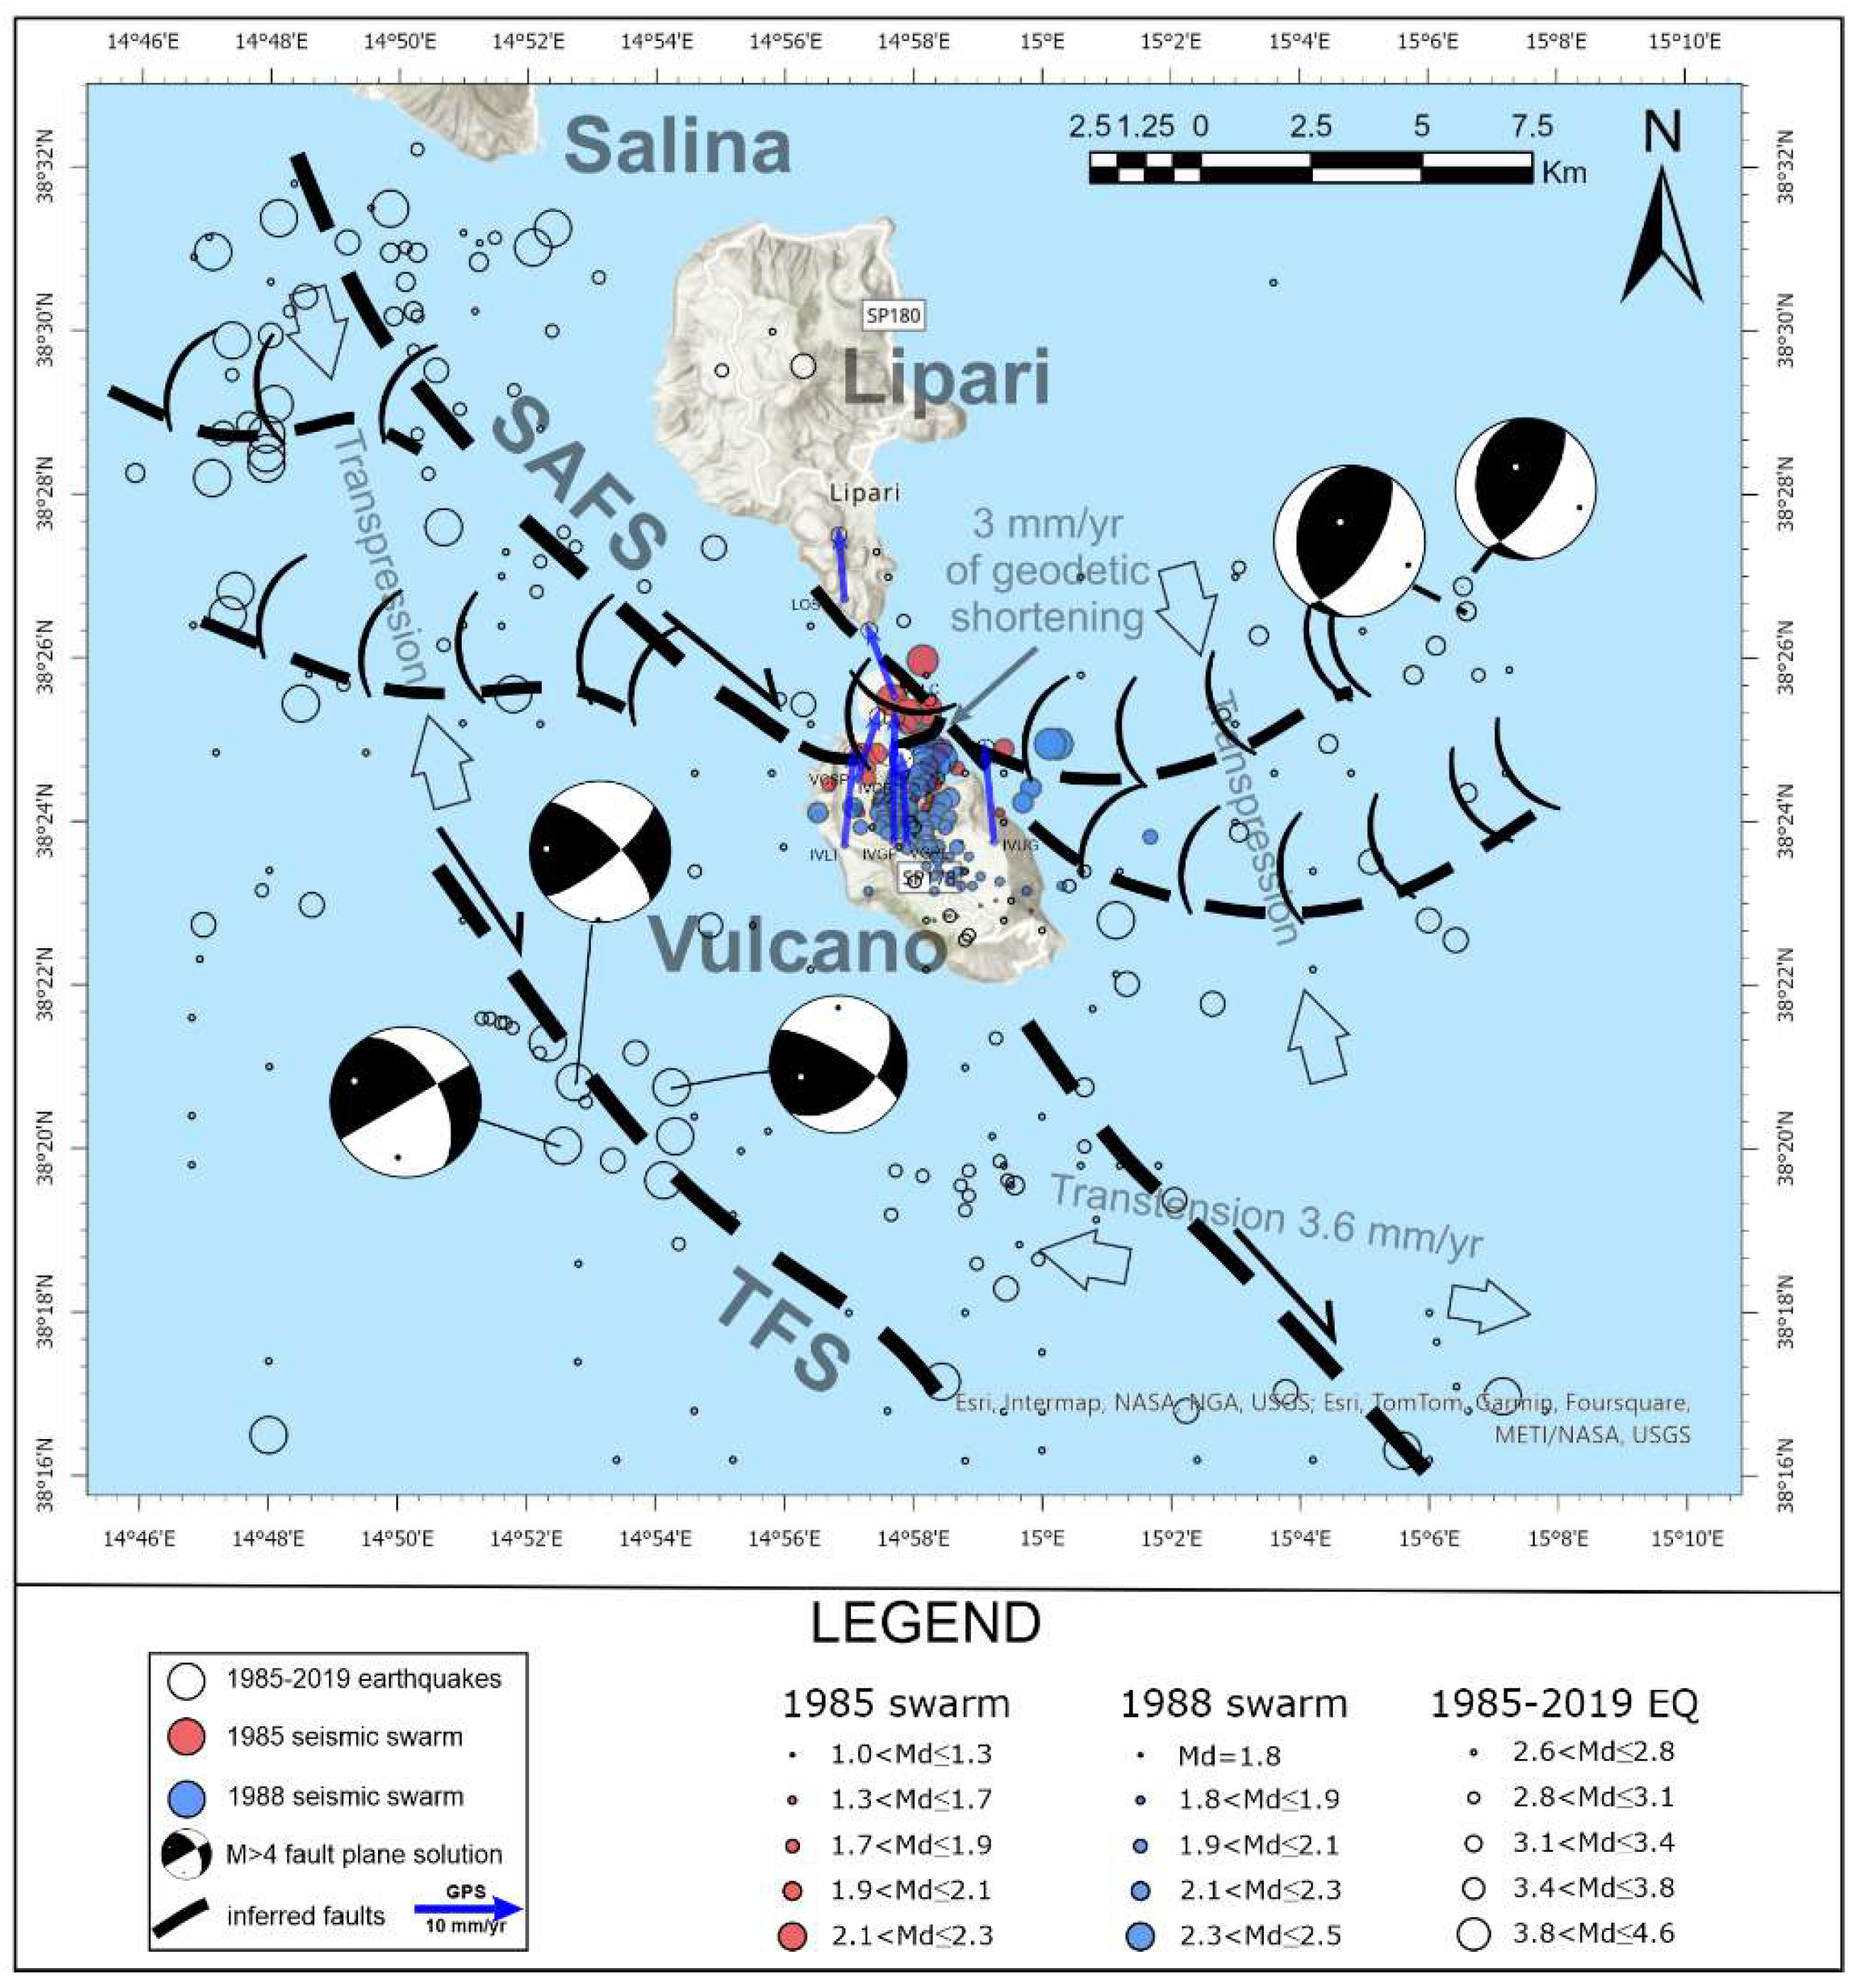
From the structural viewpoint, the sector of the Aeolian Archipelago where the Lipari-Vulcano complex lies is mainly made up of overlapping én-echelon fault segments trending NNW-SSE, with oblique (right-lateral) transtensional kinematics, belonging to the so called Tindari Fault System (TFS in Figure 10; see [36,37,38,39]). The GPS velocity field in the Lipari-Vulcano complex also reveals that a geodetic contraction of about 3mm/yr occurs between the two islands (see [38] and Figure 10). This geodetic shortening along with the transpressional to almost-pure compressive kinematics of some FPS of earthquakes located NW of the Lipari-Vulcano complex (Figure 9), imply a recent positive tectonic inversion along a NW-SE oriented tectonic lineament, the Sisifo-Alicudi Fault System (SAFS in Figure 10, see [38]). Consequently, the Lipari-Vulcano complex currently appears deformed by transpression on its northern sector, which affects Lipari and the northern part of the island of Vulcano (Vulcanello area), while transtension still persists southwards between Vulcano and the Gulf of Patti (Figure 1; [39,40]). Transpressional regimes may have implication on fluids circulation, providing the engine for increased pore pressure in the crustal domain underneath the volcanic complex. Such an increased pore pressure may cause volcanic unrest, with fluids uprising to the surface where transtensional kinematics still persist, as on Vulcano island. In addition, over-pressured hydrothermal fluids can trigger earthquakes in the area by reducing friction along fault planes.
5. Conclusions
The collection of old datasets has the potential to provide context to new data. Our reconstruction of seismic activity from continuous monitoring over the last 34 years was aimed to enable all potential users: i) rapid accessibility to useful, but hitherto scattered, information and ii) accelerate assessment and action in case of future volcano unrests.
Our catalogs also collect data taken from old original reports, such as the number of seismic events and hypocentral parameters of earthquakes; this information is complemented by our strain release calculation. As a further integration, the examined dataset contains files with number of events, hypocentral location, magnitude and strain release of the seismic events, which were located during the important seismic unrests of 1985 and 1988. In our opinion, this is valuable information to compare and highlight seismogenic zones activated during distinct unrests and offers an easy-to-use reference in case of future sudden seismic changes to interpret.
Supplementary Materials
The following supporting information can be downloaded at the website of this paper posted on Preprints.org. Supplementary Figure S1; Supplementary Table S1.
Author Contributions
S.F. conceived this study, applied pattern recognition and wrote the paper; S.F. and S.S. conducted the data collection; S.F., S.S., O.C. performed the seismic data analysis and prepared the figures; G.B. analyzed structural data; all the Authors contributed to the data discussion.
Funding
This research was undertaken within and funded by the project WUnderVul (Toward a Wider Understanding of Vulcano - WUnderVul). WUnderVul belongs to the Progetti Dipartimentali INGV.
Data Availability Statement
The catalogs presented in this study are available in the DataRep (INGV – Osservatorio Etneo OPENDATA Repository at [https://doi.org/10.13127/VULCANO/SEISMICITY_1985-2019]. The data repository chosen allows public access to data without barriers. Raw (digital) seismic data are available in the European Integrated Data Archives (www.eida.ingv.it). The hypocentral parameters listed in our catalog are referred to the INGV database from 2000 to 2019 (https://terremoti.ingv.it/ and Alparone et al. [18]). A list of the references for the entire collection can be found in Bibliography_of_the_data_sources.pdf file, which is integral part of the dataset shared by Falsaperla et al. [17]. A (freely downloadable) version of the DBSCAN classifier running in MATLB can be found in Heris [32].
Acknowledgments
We are grateful to Graziella Barberi, for her support in compiling some hypocentral parameters of the earthquakes, and to Antonino Sicali and Horst Langer, for their valuable help with the graphical software. Numerous researchers and technicians have contributed to the acquisition and analysis of seismic data at IIV and INGV. We gratefully acknowledge their commitment, which made this work possible.
Conflicts of Interest
The authors declare no conflicts of interest.
References
- Patrick, M.R.; Houghton, B.F.; Anderson, K.R.; Poland, M.P.; Montgomery-Brown, E.; Johanson, I.; Thelen, W.; Elias, T. The cascading origin of the 2018 Kīlauea eruption and implications for future forecasting. Nat. Commun. 2020, 11, 1–13. [Google Scholar] [CrossRef] [PubMed]
- Carracedo, J.C.; Troll, V.R.; Day, J.M.D.; Geiger, H.; Aulinas, M.; Soler, V.; Deegan, F.M.; Perez-Torrado, F.J.; Gisbert, G.; Gazel, E.; et al. The 2021 eruption of the Cumbre Vieja volcanic ridge on La Palma, Canary Islands. Geol. Today 2022, 38, 94–107. [Google Scholar] [CrossRef]
- Harlow, D.H.; Power, J.A.; Laguerta, E.P.; Ambubuyog, G.; White, R.A.; Hoblitt, R.P. Precursory seismicity and forecasting of the June 15, 1991, eruption of Mount Pinatubo. Fire and Mud: eruptions and lahars of Mount Pinatubo, Philippines 1996, 223-247.
- D’Agostino, M.; Di Grazia, G.; Ferrari, F.; Langer, H.; Messina, A.; Reitano, D.; Spampinato, S. Volcano monitoring and early warning on Mt. Etna, Sicily based on volcanic tremor: Methods and technical aspects. Complex Monitoring of Volcanic Activity 2013, 53–92. [Google Scholar]
- Cannavò, F.; Cannata, A.; Cassisi, C.; Di Grazia, G.; Montalto, P.; Prestifilippo, M.; Privitera, E.; Coltelli, M.; Gambino, S. A multivariate probabilistic graphical model for real-time volcano monitoring on Mount Etna. J. Geophys. Res. Solid Earth 2017, 122, 3480–3496. [Google Scholar] [CrossRef]
- Langer, H.; Falsaperla, S.; Spampinato, S.; Messina, A. Energy threshold changes in volcanic activity at Mt. Etna (Italy) inferred from volcanic tremor. Sci. Rep. 2022, 12, 17895. [Google Scholar] [CrossRef] [PubMed]
- Mercalli, G.; Silvestri, O. Le eruzioni dell’isola di Vulcano, incominciate il 3 Agosto 1888 e terminate il 22 Marzo 1890. Annali dell’Ufficio Centrale Meteorologico e Geodinamico Italiano 1891, 10, 1–213. [Google Scholar]
- Latter, J.H. Near surface seismicity of vulcano, Aeolian Islands, Sicily. Bull. Volcanol. 1971, 35, 117–126. [Google Scholar] [CrossRef]
- Carapezza, M.; Nuccio, P.M.; Valenza, M. Genesis and evolution of the fumaroles of vulcano (Aeolian Islands, Italy): a geochemical model. Bull. Volcanol. 1981, 44, 547–563. [Google Scholar] [CrossRef]
- Frazzetta, G.; Lanzafame, G.; Villari, L. Deformazioni e tettonica attiva a Lipari e Vulcano (Eolie). Mem. Soc. Geol. It 1982, 24, 293–297. [Google Scholar]
- Federico, C.; Cocina, O.; Gambino, S.; Paonita, A.; Branca, S.; Coltelli, M.; Italiano, F.; Bruno, V.; Caltabiano, T.; Camarda, M.; et al. Inferences on the 2021 Ongoing Volcanic Unrest at Vulcano Island (Italy) through a Comprehensive Multidisciplinary Surveillance Network. Remote. Sens. 2023, 15, 1405. [Google Scholar] [CrossRef]
- Gillot, P.Y. Histoire vulcanique des iles Eoliennes; arc insulaire ou complexe orogenique anulaire? Doc. Trav. IGAL 1987, 14, 35–42. [Google Scholar]
- Gioncada, A.; Mazzuoli, R.; Bisson, M.; Pareschi, M.T. Petrology of volcanic products younger than 42 ka on the Lipari–Vulcano complex (Aeolian Islands, Italy): an example of volcanism controlled by tectonics. J. Volcanol. Geoth. Res. 2003, 122, 191–220. [Google Scholar] [CrossRef]
- Peccerillo, A. The Aeolian arc. In: Peccerillo, A. (Ed.), Plio-Quaternary Volcanism in Italy. Petrology, Geochemistry, Geodynamics. 2005, Springer, Heidelberg, pp. 173–213.
- De Astis, G.; Lucchi, F.; Dellino, P.; La Volpe, L.; Tranne, C.A.; Frezzotti, M.L.; Peccerillo, A. Geology, volcanic history and petrology of Vulcano (central AeolianArchipelago). In: Lucchi, F.; Peccerillo, A.; Keller, J.; Tranne, C.A.; Rossi, P.L. (Eds.), The Aeolian Islands Volcanoes 2013, vol. 37. Geological Society, London, Memoirs, London, pp. 281–348.
- Ester, M.; Kriegel, H.P.; Sander, J.; Xiaowei, X. A density-based algorithm for discovering clusters in large spatial databases with noise. In Proceedings of the Second International Conference on Knowledge Discovery and Data Mining (KDD-96), Portland, OR, USA, 2–4 August 1996; AAAI Press, 1996; pp. 226–231. [Google Scholar]
- Falsaperla, S.; Spampinato, S.; Cocina, O. Catalog of the seismic activity in and around the island of Vulcano, Italy, between 1985 and 2019 (Version 1) [dataset]. Istituto Nazionale di Geofisica e Vulcanologia (INGV) 2023. [CrossRef]
- Alparone, S.; Barberi, G.; D’Amico, S.; Di Grazia, G.; Giampiccolo, E.; Maiolino, V.; Mostaccio, A.; Musumeci, C.; Scaltrito, A.; Scarfì, L.; Tuvè, T.; Ursino, A.; Zuccarello, L.; Ferrari, F.; Spampinato, S. Aeolian Seismic Catalog 2000-2019 (AeolianSC_2000_2019) (Version 1) [Data set]. Istituto Nazionale di Geofisica e Vulcanologia (INGV) 2023. [CrossRef]
- Caccamo, D.; Neri, G. A new analytic procedure to determine hypocentral parameters of local seismic events. Bull. Seism. Soc. Am. 1984, 74, 655–667. [Google Scholar] [CrossRef]
- Lee WH, Lahr, J.C. HYPO71PC (revised): a computer program for determining hypocenter, magnitude and first-motion pattern of local earthquakes. US Geological Survey 1975, Open-file Rep: 75-311.
- Lahr, J.C. HYPOELLIPSE/Version 2.0; a Computer Program for Determining Local Earthquake Hypocentral Parameters, Magnitude, and First Motion Pattern; US Geological Survey 1989, Reston, VA, USA.
- Jeffreys, H.; Bullen, K.E. Seismological Tables: Office of the British Association 1958, Burlington House, London, UK.
- Falsaperla, S.; Neri, G.; Velardita, S. Struttura della crosta superiore dell'area delle isole Eolie. Rend. Osserv. Geofis. Reggino 1985, XXIX, 103–111. [Google Scholar]
- Falsaperla, S.; and Neri, G. Seismic monitoring of volcanoes: Vulcano (southern Italy). Period. Mineral. 1986, 55, 143–152. [Google Scholar]
- Montalto, A. Seismic signals in geothermal areas of active volcanism: a case study from “La Fossa”, Vulcano (Italy). Bull. Volc. 1994, 56, 220–227. [Google Scholar] [CrossRef]
- Alparone, S.; Cannata, A.; Gambino, S.; Gresta, S.; Milluzzo, V.; Montalto, P. Time-space variation of volcano-seismic events at La Fossa (Vulcano, Aeolian Islands, Italy): new insights into seismic sources in a hydrothermal system. Bull. Volcanol. 2010, 72, 803–816. [Google Scholar] [CrossRef]
- Cannata, A.; Diliberto, I.S.; Alparone, S.; Gambino, S.; Gresta, S.; Liotta, M.; Madonia, P.; Milluzzo, V.; Aliotta, M.; Montalto, P. Multiparametric Approach in Investigating Volcano-Hydrothermal Systems: the Case Study of Vulcano (Aeolian Islands, Italy). Pure Appl. Geophys. 2011, 169, 167–182. [Google Scholar] [CrossRef]
- Falsaperla, S.; Frazzetta, G.; Neri, G.; Nunnari, G.; Velardita, R.; Villari, L. Volcano Monitoring in the Aeolian Islands (Southern Tyrrhenian Sea): The Lipari-Vulcano Eruptive Complex. In Volcanic Hazards 1989; Springer: Berlin/Heidelberg, Germany, 1989; pp. 339–356. [Google Scholar]
- Chiodini, G.; Cioni, R.; Falsaperla, S.; Montalto, A.; Guidi, M.; Marini, L. Geochemical and seismological investigations at Vulcano (Aeolian Islands) during 1978–1989. J. Geophys. Res. 1992, 97, 11025–11032. [Google Scholar] [CrossRef]
- DI Filippo, D.; Marcelli, L. Magnitudo ed energia dei terremoti in Italia. Ann. Geophys. 1950, 3, 337–348. [Google Scholar] [CrossRef]
- Langer, H.; Falsaperla, S. & Hammer, C. Advantages and Pitfalls of Pattern Recognition. In Computational Geophysics Vol. 3 (ed. Spichak, V.) 2020, Elsevier B.V. (ISBN: 9780128118429, ISSN: 2468-547X).
- Heris, M.K. Source code for DBSCAN Clustering in MATLAB (URL: https://yarpiz.com/255/ypml110-dbscan-clustering), Yarpiz 2015.
- Neri, G.; Barberi, G.; Oliva, G.; Orecchio, B. Spatial variations of seismogenic stress orientations in Sicily, south Italy. Phys. Earth Planet. Inter. 2005, 148, 175–191. [Google Scholar] [CrossRef]
- Scarfì, L.; Messina, A.; Cassisi, C. Sicily and southern Calabria focal mechanism database: a valuable tool for local and regional stress-field determination. Ann. Geophys. 2013, 56, D0109. [Google Scholar] [CrossRef]
- Scarfì, L.; Barberi, G.; Musumeci, C.; Patanè, D. Seismotectonics of northeastern Sicily and southern Calabria (Italy): New constraints on the tectonic structures featuring in a crucial sector for the central Mediterranean geodynamics. Tectonics 2016, 35, 812–832. [Google Scholar] [CrossRef]
- Lanzafame, G.; Bousquet, J.C. The Maltese escarpment and its extension from Mt. Etna to the Aeolian Islands (Sicily): importance and evolution of a lithosphere discontinuity. Acta Vulcanol. 1997, 9, 113–120. [Google Scholar]
- Billi, A.; Barberi, G.; Faccenna, C.; Neri, G.; Pepe, F.; Sulli, A. Tectonics and seismicity of the Tindari Fault System, southern Italy: Crustal deformations at the transition between ongoing contractional and extensional domains located above the edge of a subducting slab. Tectonics 2006, 25. [Google Scholar] [CrossRef]
- Barreca, G.; Bruno, V.; Cultrera, F.; Mattia, M.; Monaco, C.; Scarfì, L. New insights in the geodynamics of the Lipari–Vulcano area (Aeolian Archipelago, southern Italy) from geological, geodetic and seismological data. J. Geodyn. 2014, 82, 150–167. [Google Scholar] [CrossRef]
- Cultrera, F.; Barreca, G. Ferranti.; Monaco, C.; Pepe, F.; Passaro, S.; Barberi, G.; Bruno, V.; Mattia, M.; Musumeci, C.; Scarfì, L. Structural architecture and active deformation pattern in the northern sector of the Aeolian-Tindari-Letojanni fault system (SE Tyrrhenian Sea-NE Sicily) from integrated analysis of field, marine geophysical, seismological and geodetic data. Ital. J. Geosci. 2017. [Google Scholar] [CrossRef]
- Cultrera, F.; Barreca, G.; Burrato, P.; Ferranti, L.; Monaco, C.; Passaro, S.; Pepe, F.; Scarfì, L. Active faulting and continental slope instability in the Gulf of Patti (Tyrrhenian side of NE Sicily, Italy): a field, marine and seismological joint analysis. Nat. Hazards 2016, 86, 253–272. [Google Scholar] [CrossRef]
Figure 1.
Map of the seismic stations in the Aeolian Islands (red triangles). The dotted and dashed lines mark the epicentral region of interest for the collection of earthquakes in this study and a zoom of the Vulcano island, respectively. Tectonic features and their kinematics from [38,39,40].
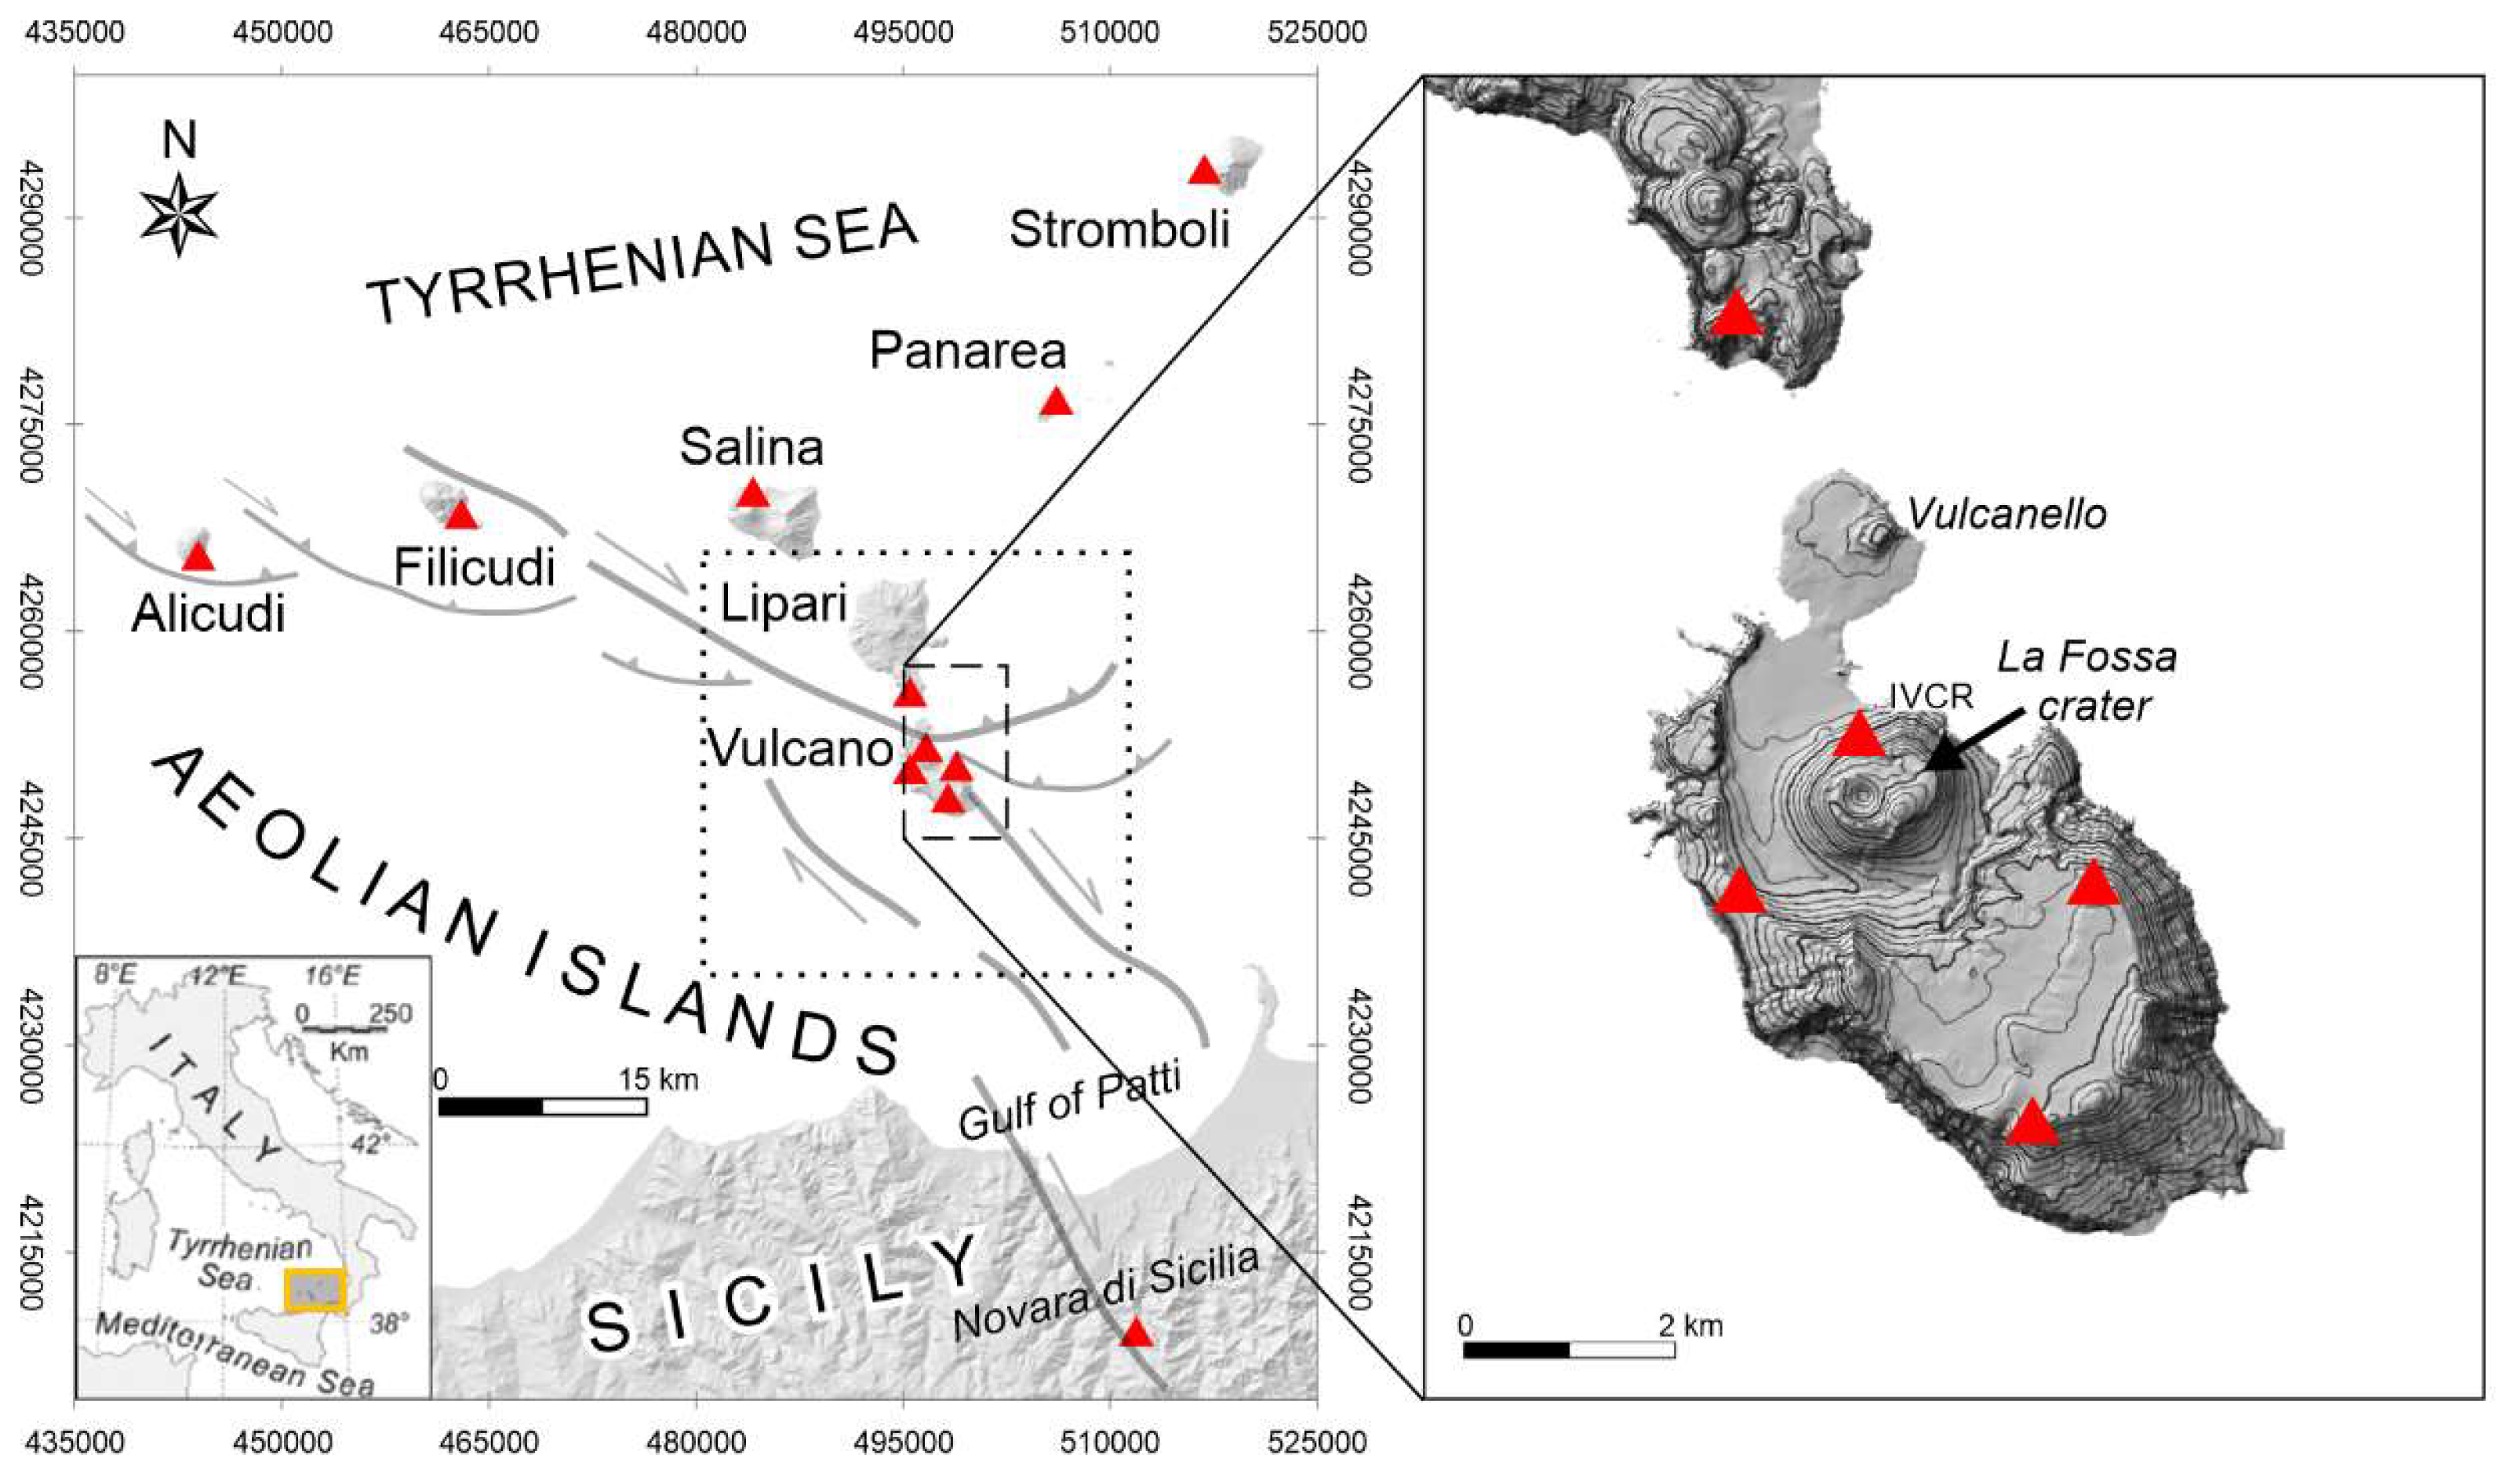
Figure 2.
Number of earthquakes (M>2.5) and cumulative strain release per day from 1985 to 2019. Arrows mark the occurrence of earthquakes with M≥ 3.8.
Figure 2.
Number of earthquakes (M>2.5) and cumulative strain release per day from 1985 to 2019. Arrows mark the occurrence of earthquakes with M≥ 3.8.
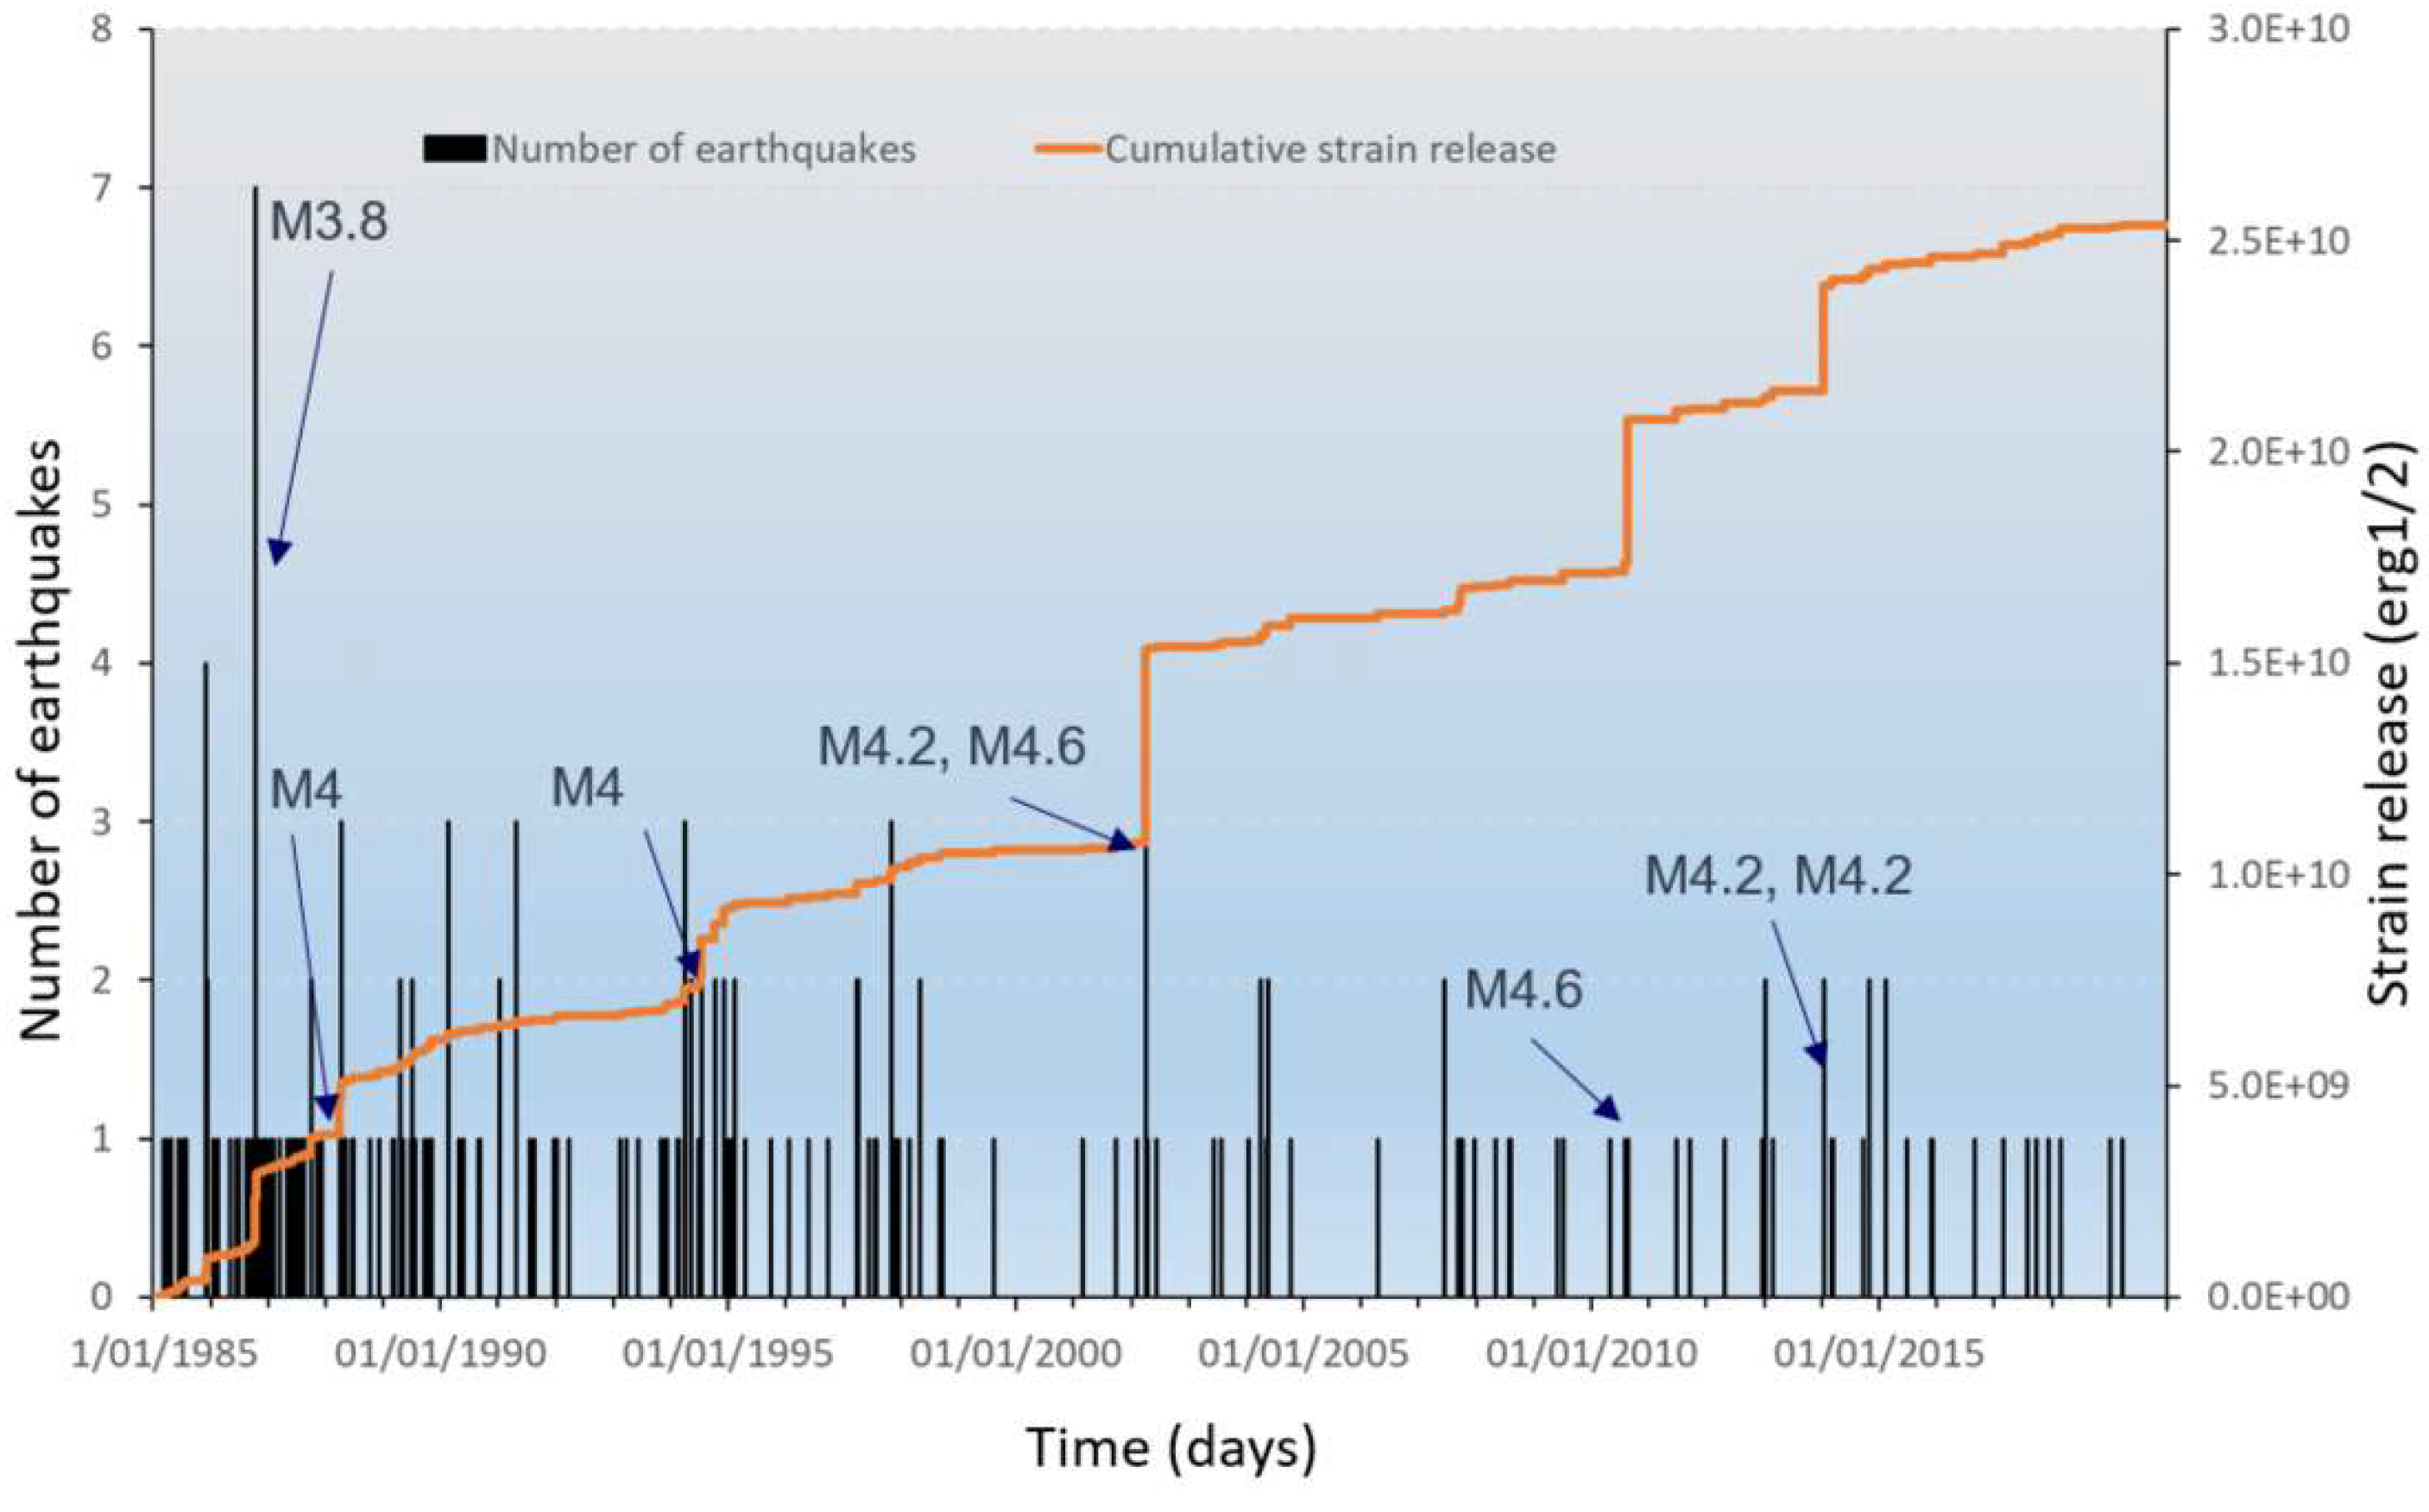
Figure 3.
Magnitude-time, depth-time and depth-magnitude characteristics of the earthquakes from 1985 to 1999.
Figure 3.
Magnitude-time, depth-time and depth-magnitude characteristics of the earthquakes from 1985 to 1999.
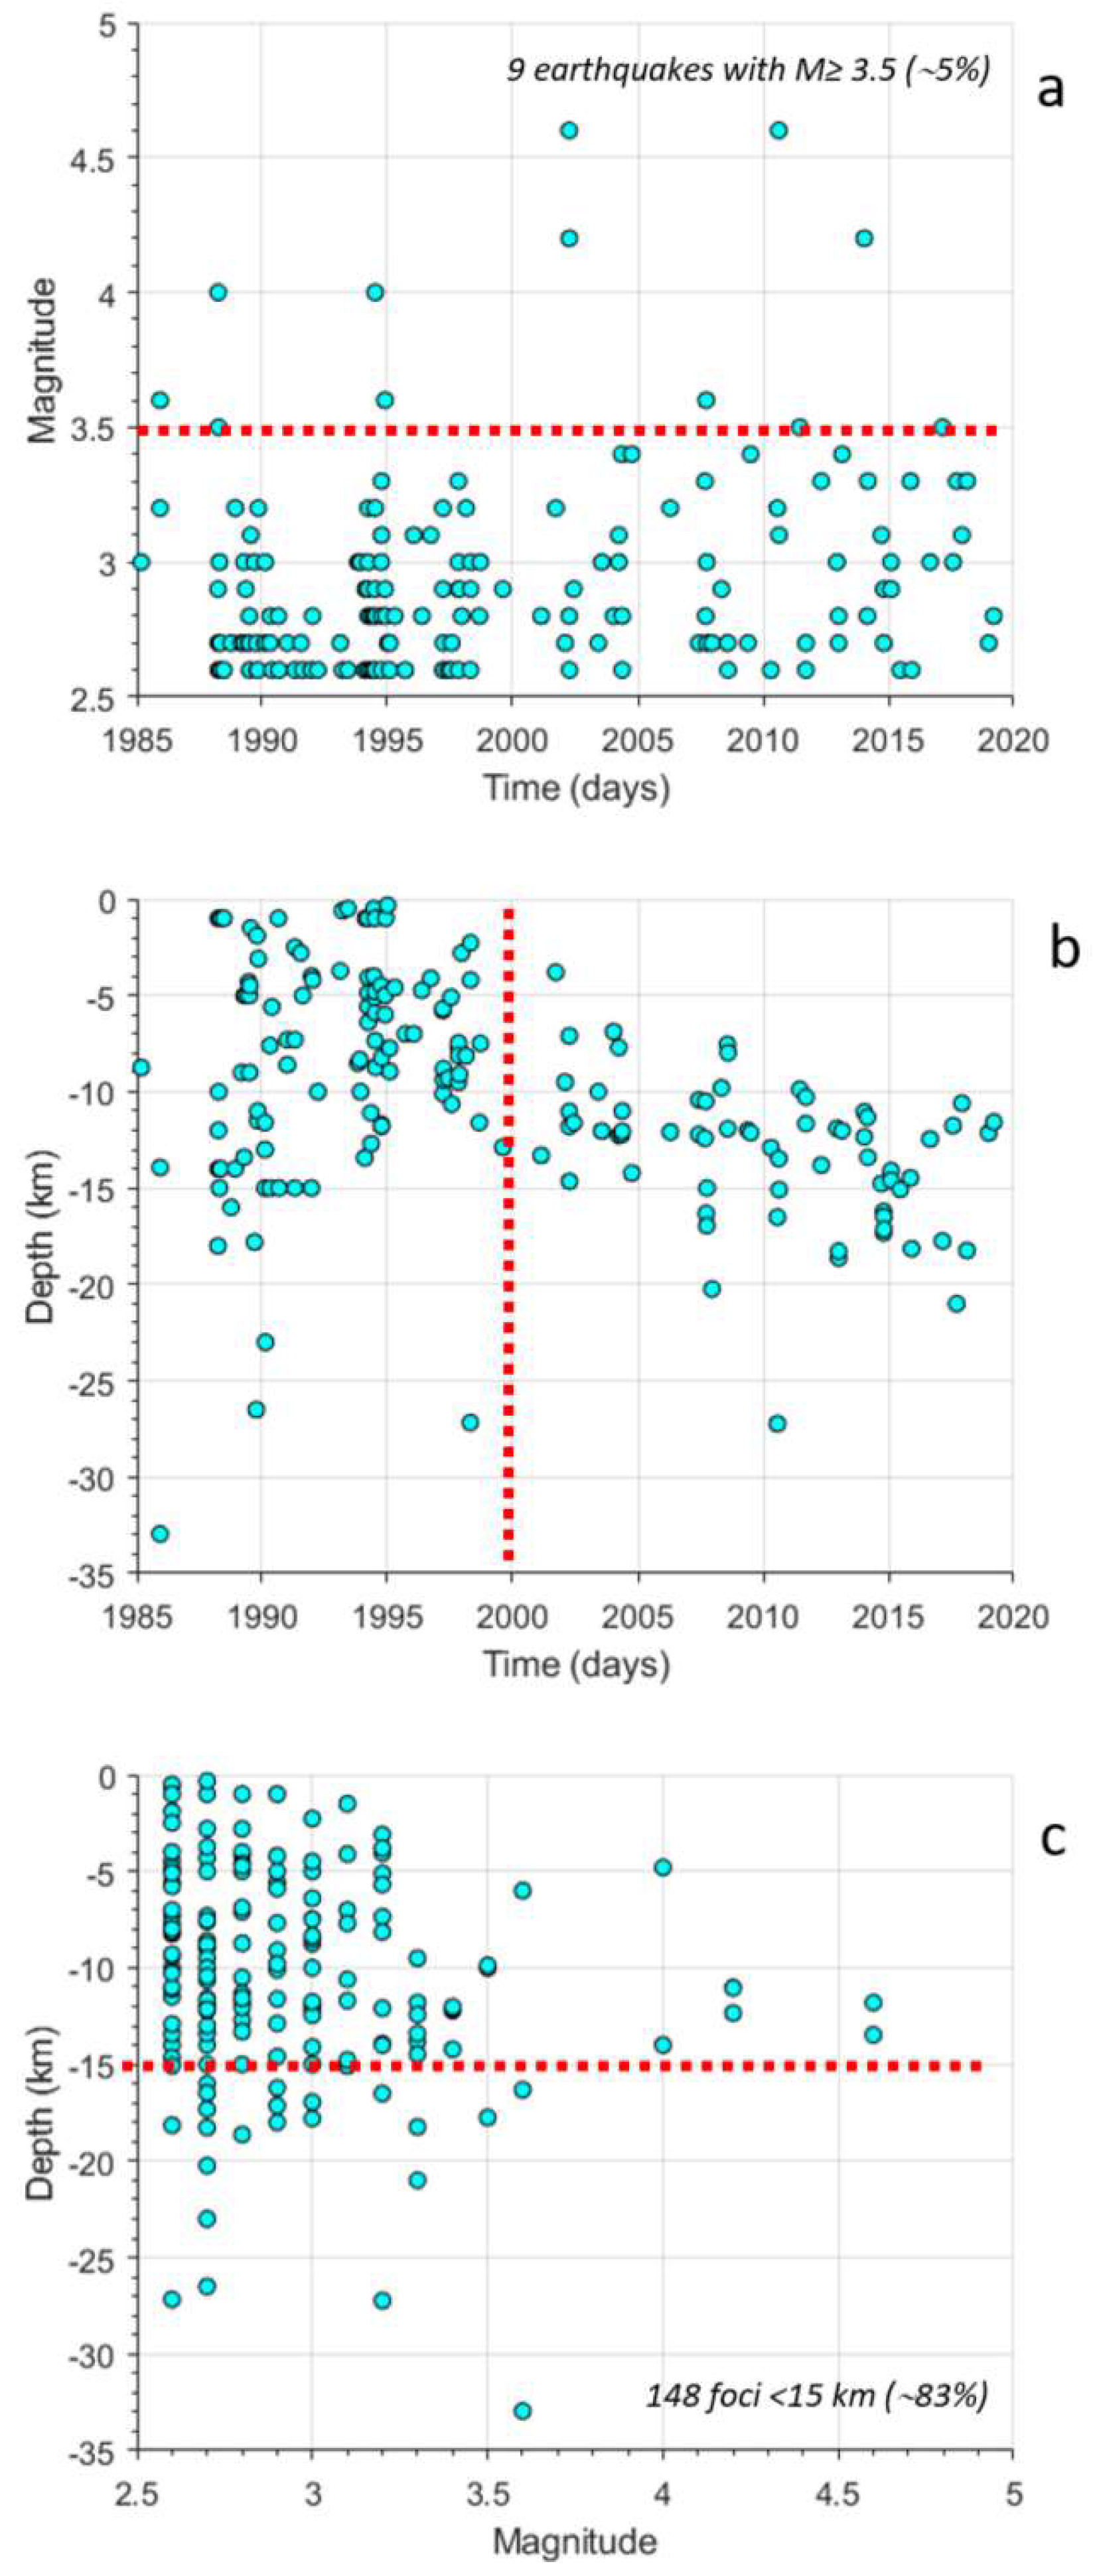
Figure 4.
Hourly frequency of seismic events in the Lipari-Vulcano complex (LIVU) from 1985 to 1999. Colored bands highlight the 1985 and 1988 seismic unrests.
Figure 4.
Hourly frequency of seismic events in the Lipari-Vulcano complex (LIVU) from 1985 to 1999. Colored bands highlight the 1985 and 1988 seismic unrests.
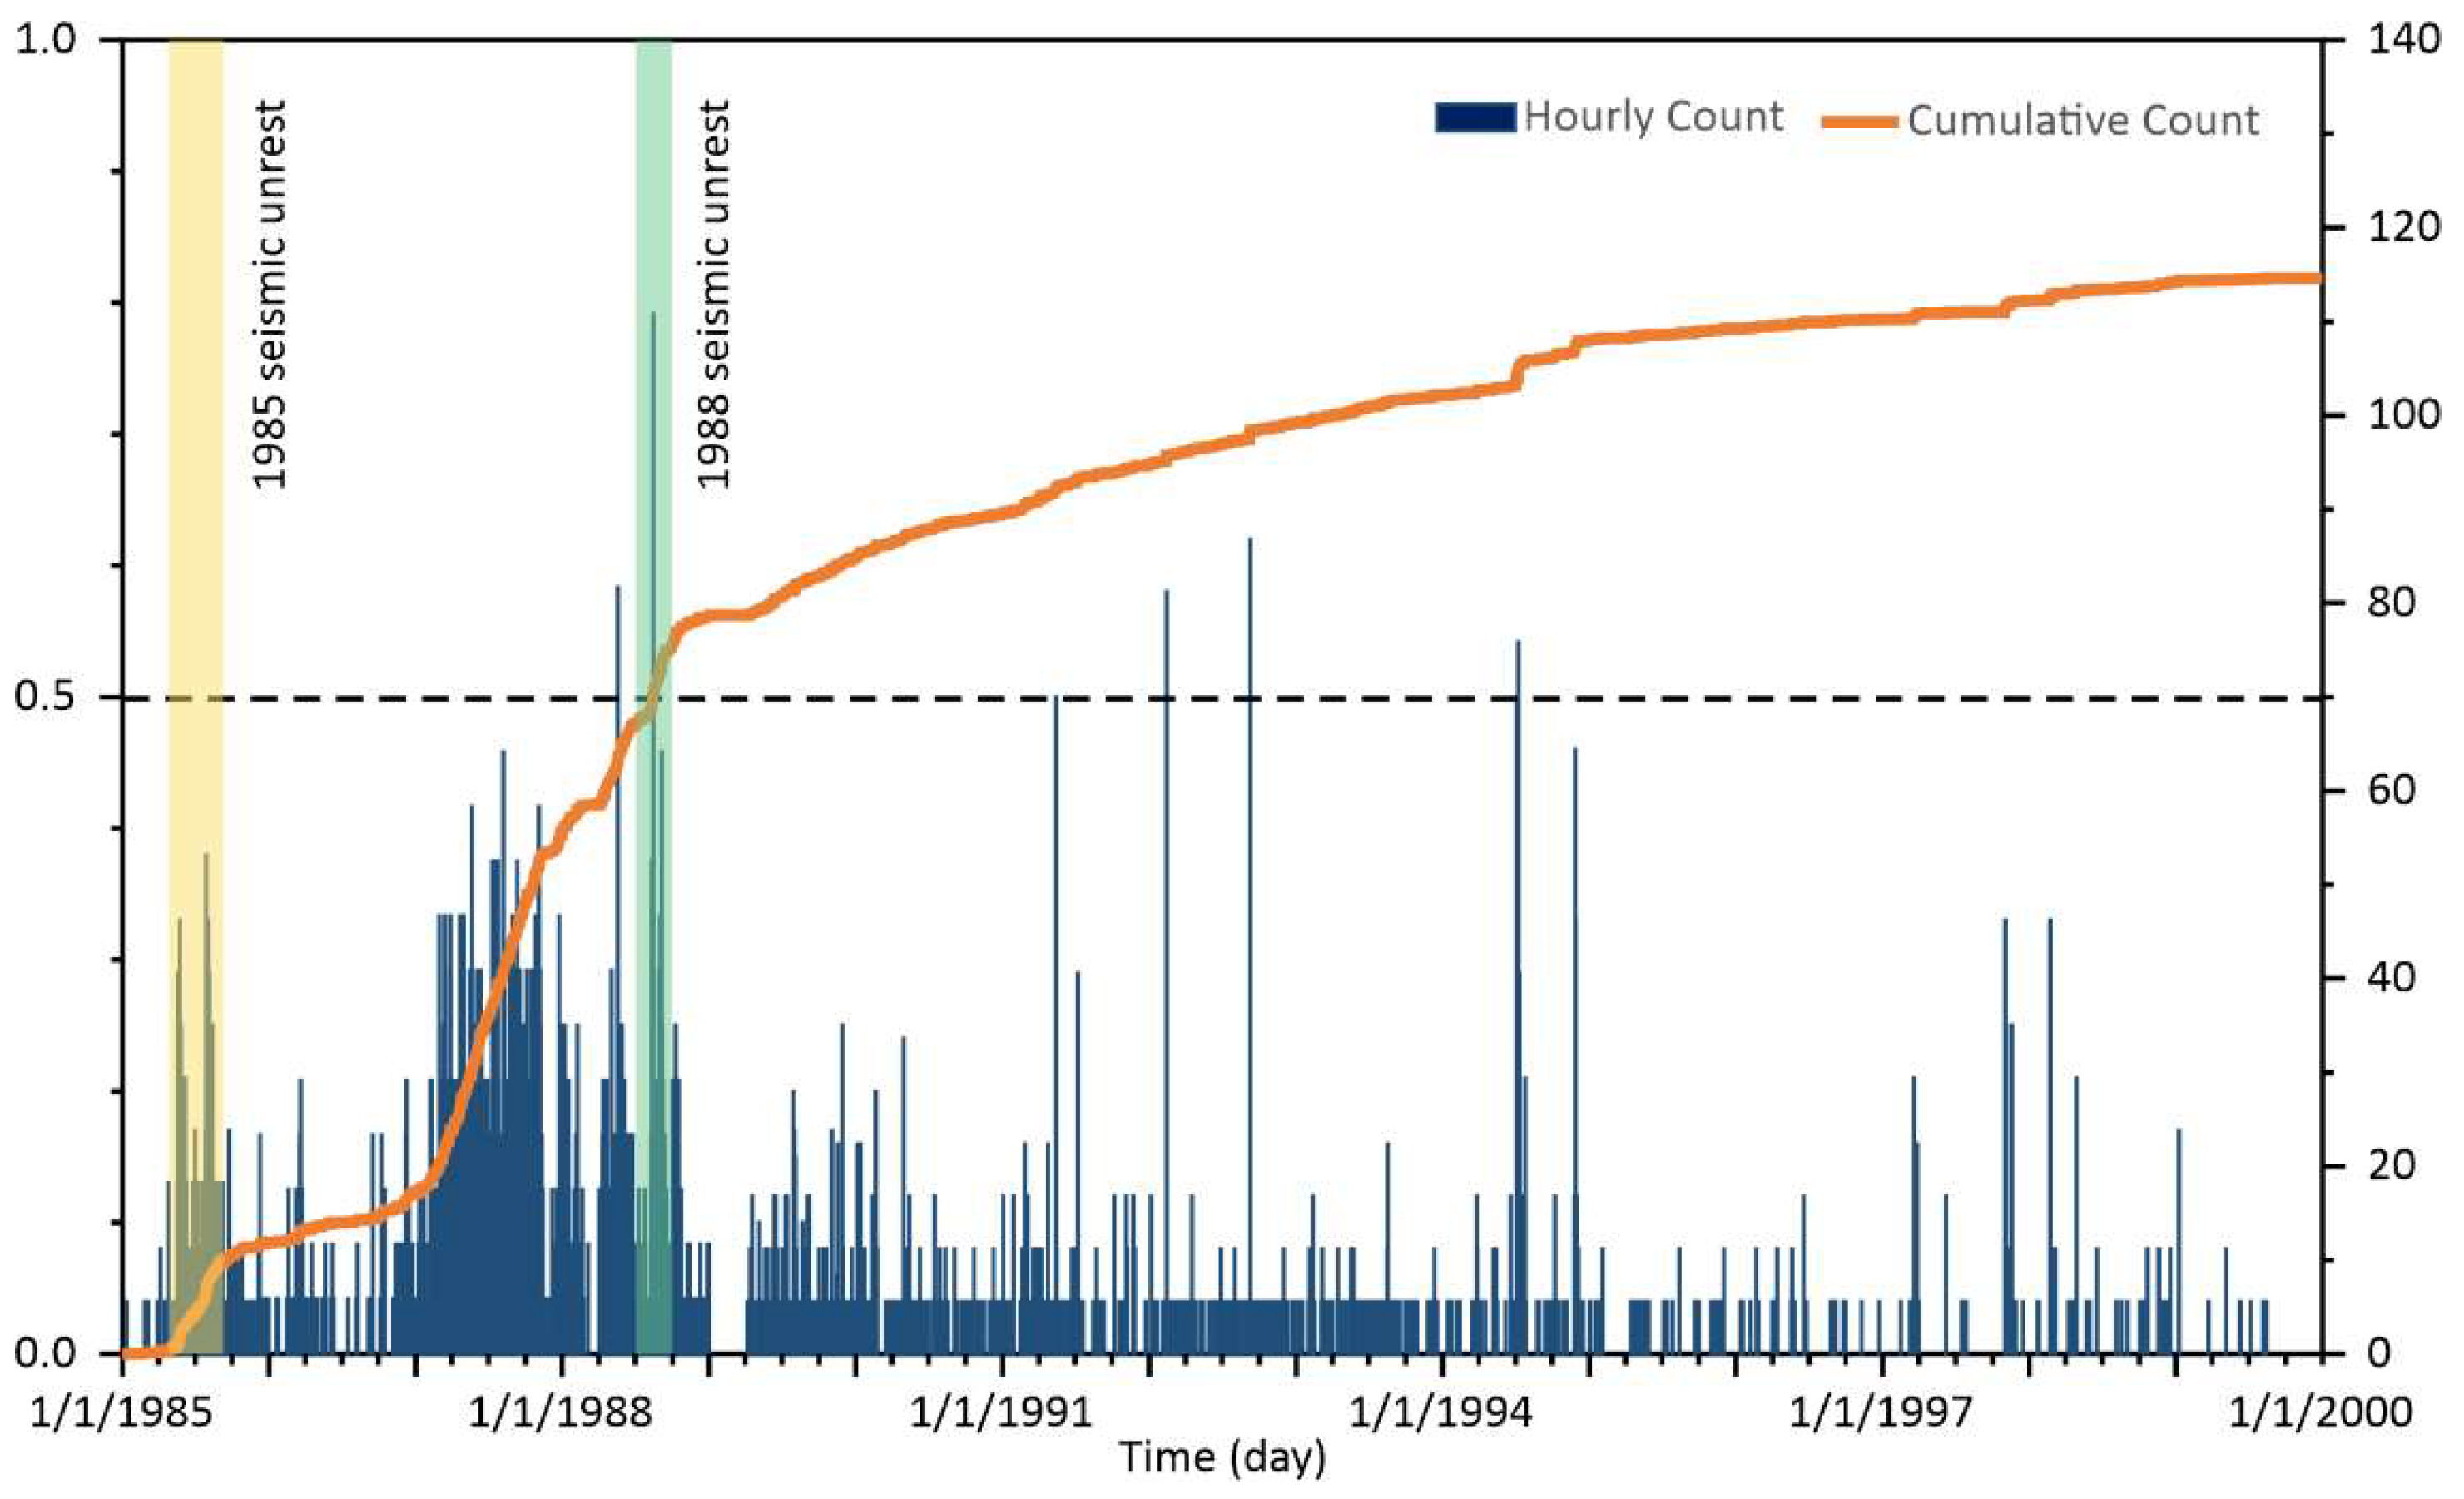
Figure 5.
Seismic unrest in 1985 and 1988: a-c) 32 seismic events with 1≤ M ≤2.3 from April 25 to August 25, 1985. d-f) 100 earthquakes with 1.8 ≤ M ≤ 2.5 from July 2 to September 30, 1988, the epicenters of which roughly delineates a NNW-SSE trend (see dashed line in d).
Figure 5.
Seismic unrest in 1985 and 1988: a-c) 32 seismic events with 1≤ M ≤2.3 from April 25 to August 25, 1985. d-f) 100 earthquakes with 1.8 ≤ M ≤ 2.5 from July 2 to September 30, 1988, the epicenters of which roughly delineates a NNW-SSE trend (see dashed line in d).
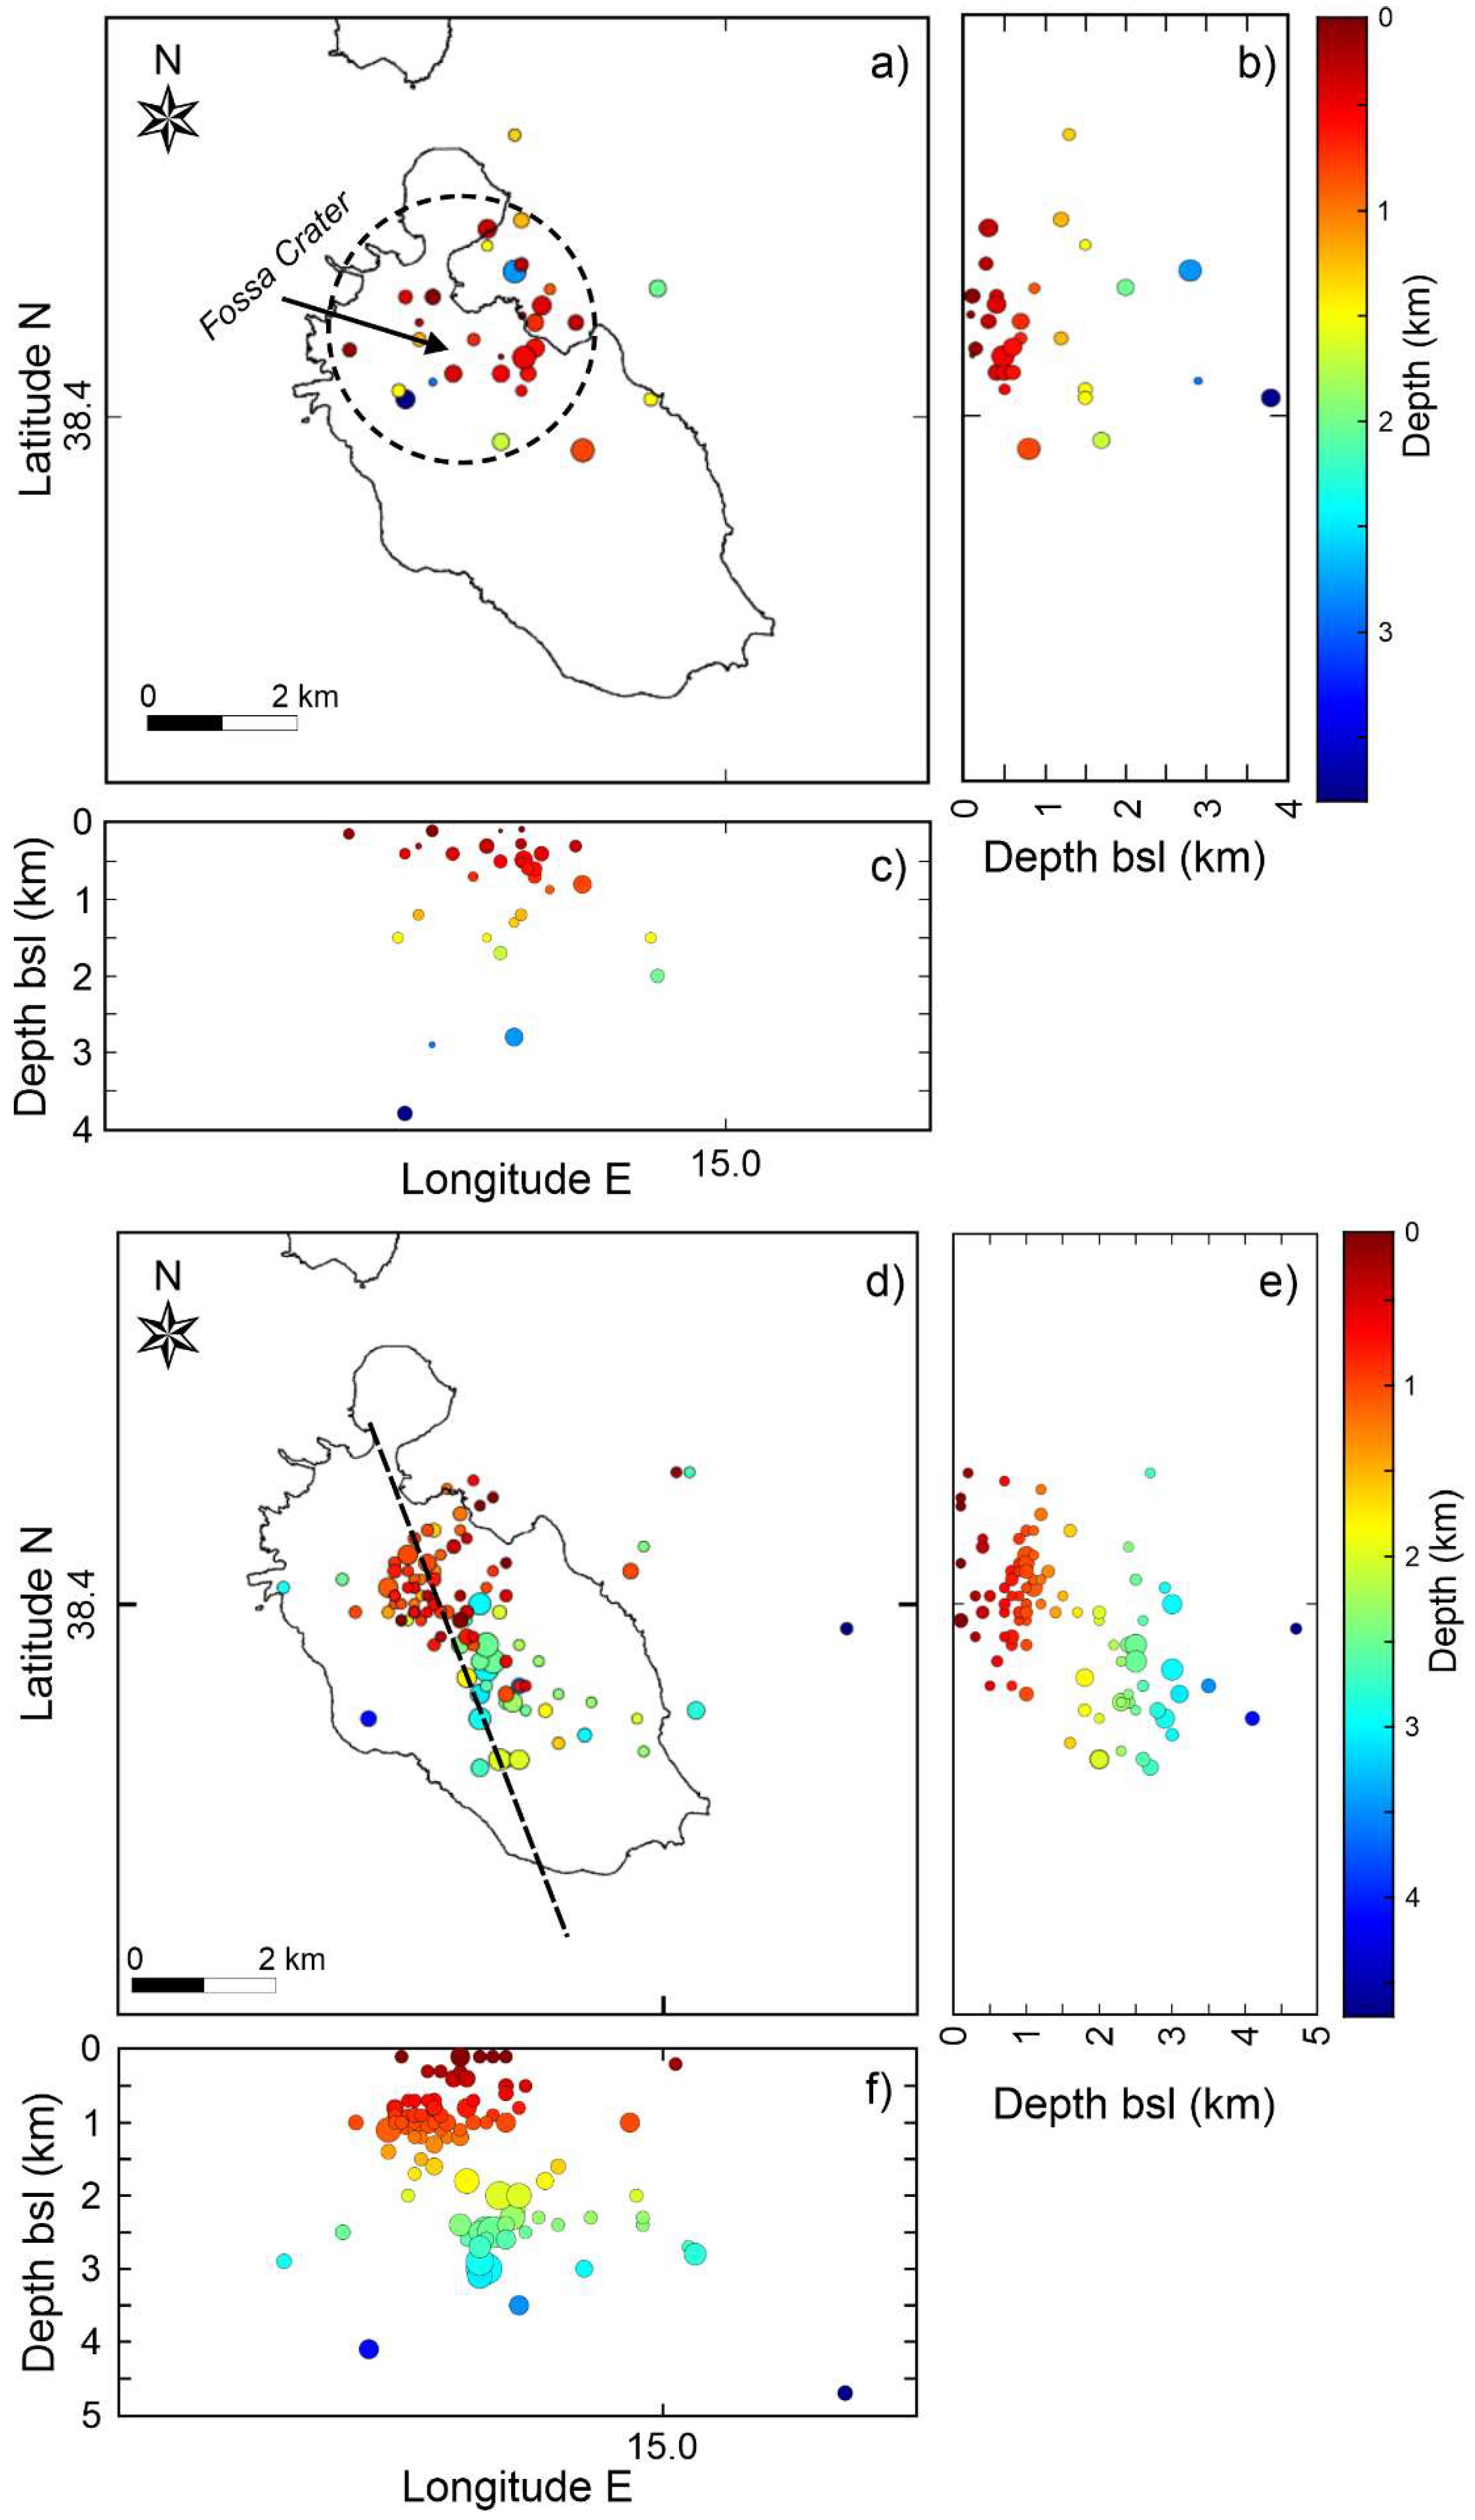
Figure 6.
Hourly frequency and cumulative count of seismic events at the reference station (IVCR) from 1985 to 1999. Colored bands highlight the 1985 and 1988 seismic unrests.
Figure 6.
Hourly frequency and cumulative count of seismic events at the reference station (IVCR) from 1985 to 1999. Colored bands highlight the 1985 and 1988 seismic unrests.
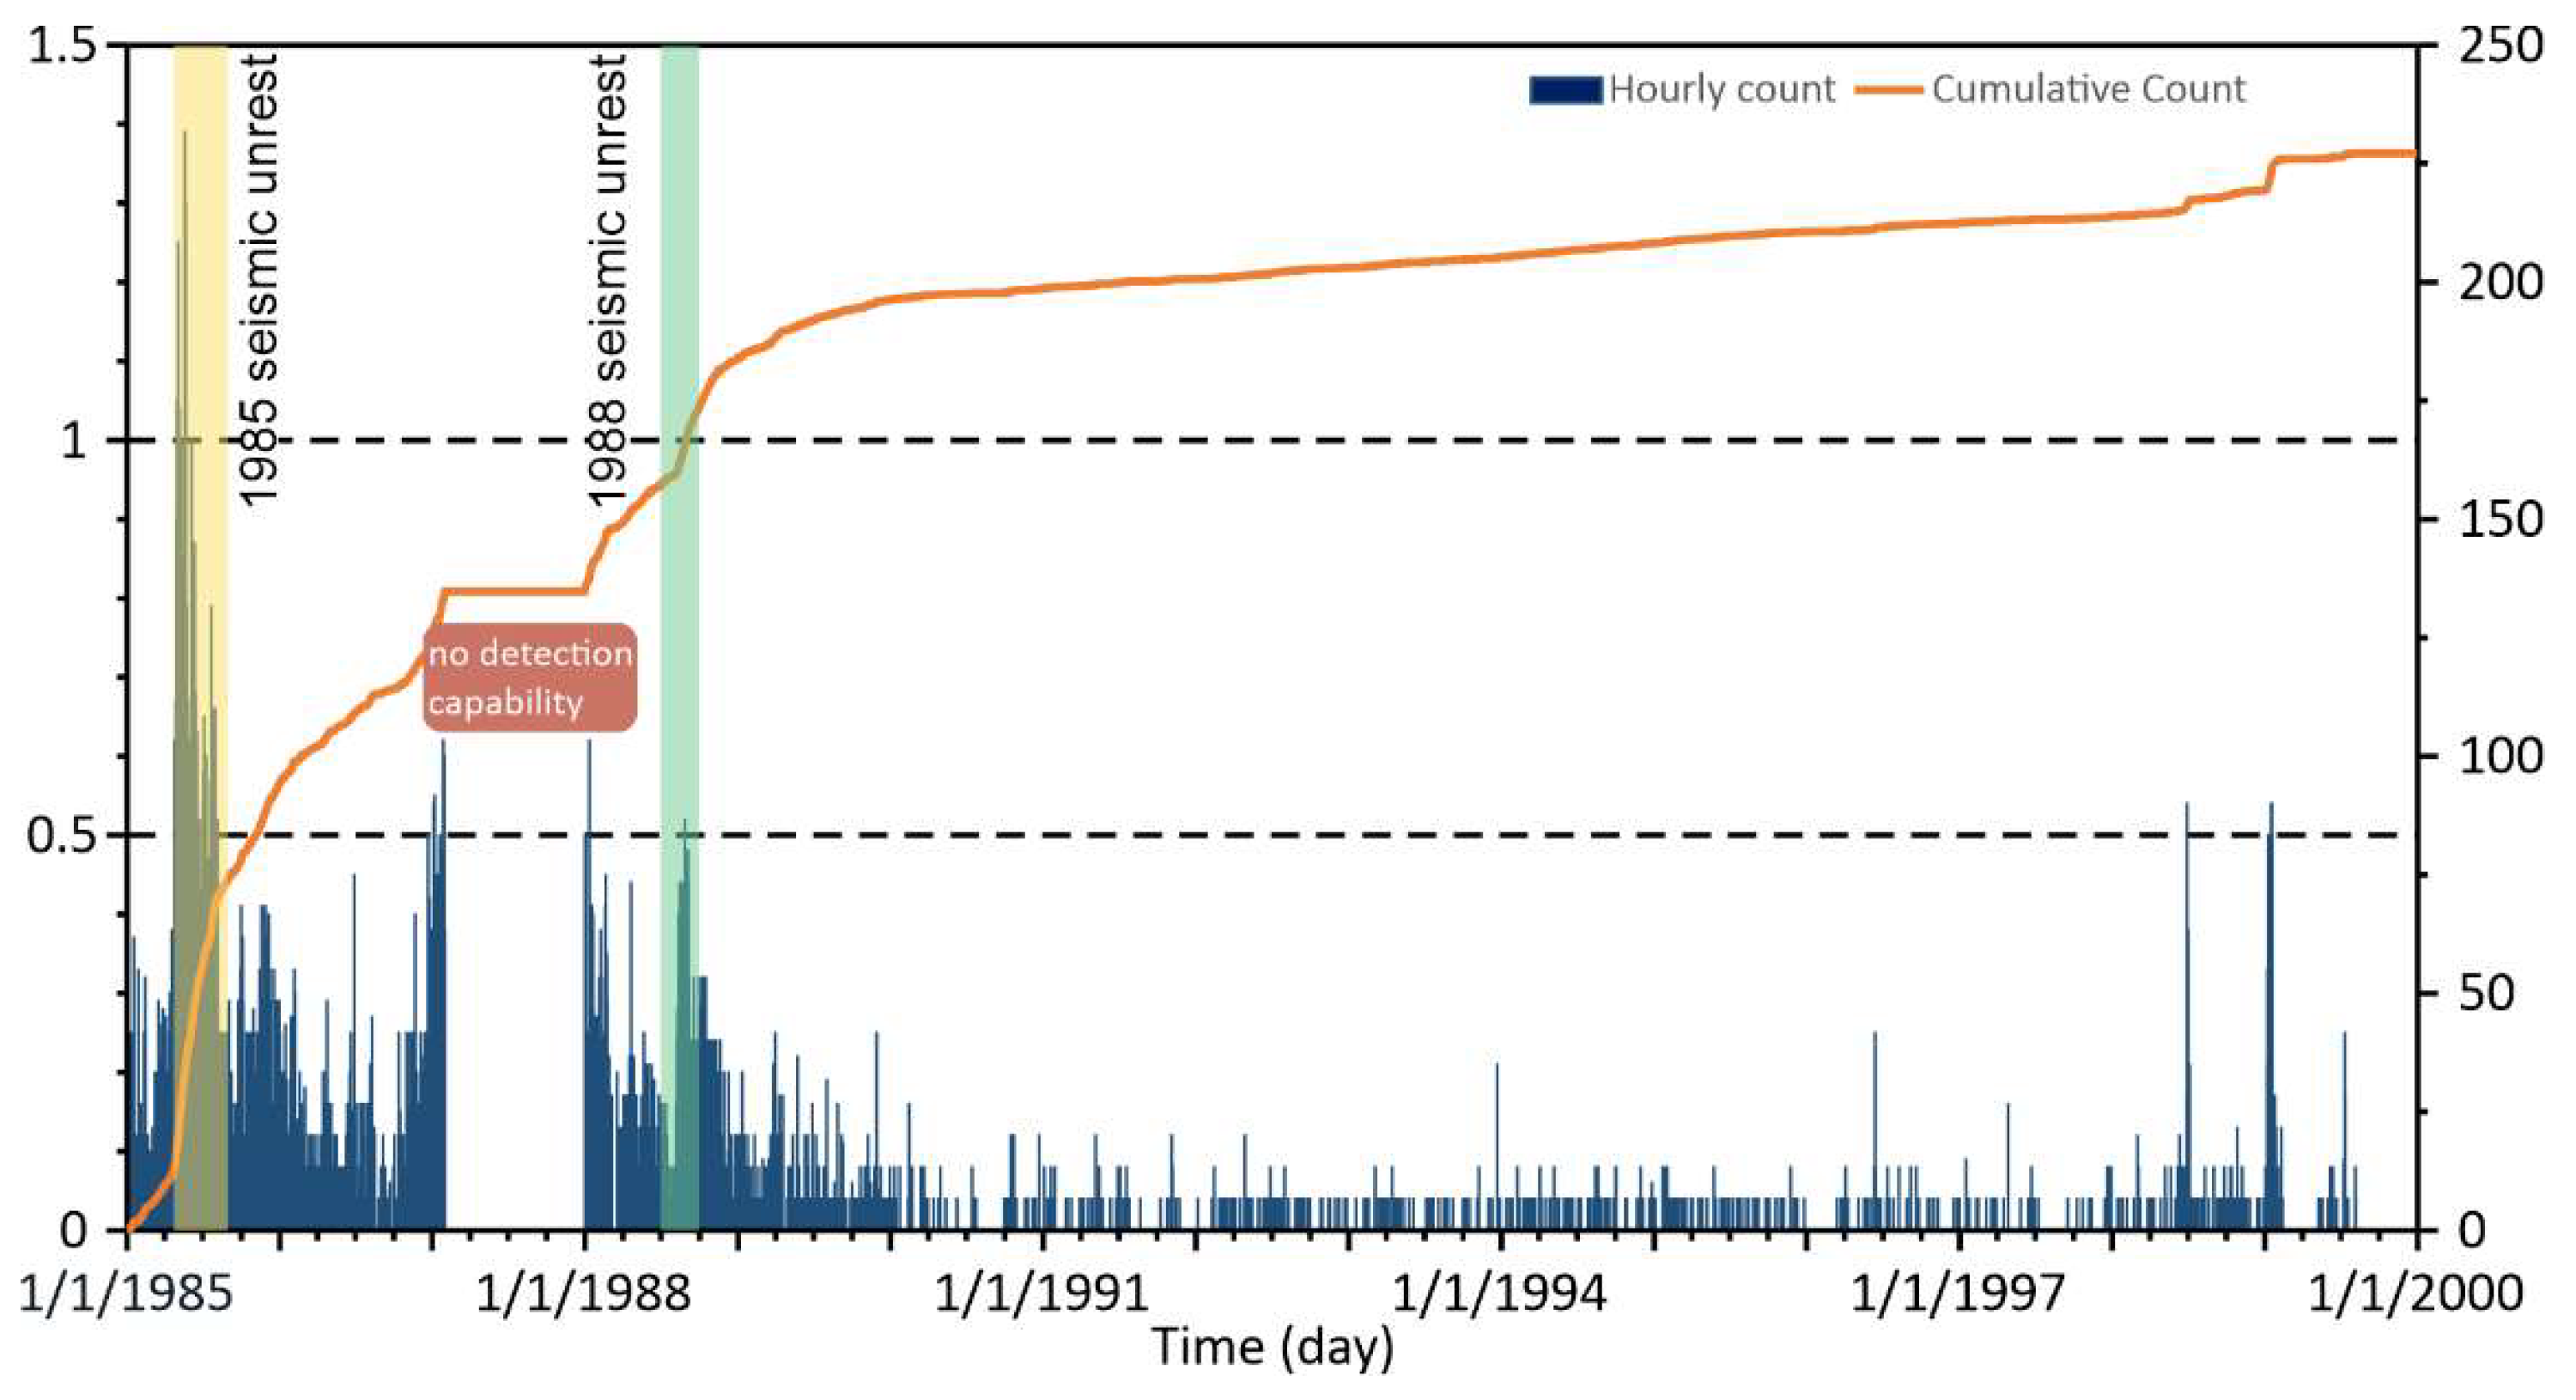
Figure 7.
3D map of the strain release of earthquakes with M>2.5 from 1985 to 2019. The average value was calculated within a regular grid of 0.05° in latitude and longitude in the study area, and reported in logarithmic scale.
Figure 7.
3D map of the strain release of earthquakes with M>2.5 from 1985 to 2019. The average value was calculated within a regular grid of 0.05° in latitude and longitude in the study area, and reported in logarithmic scale.
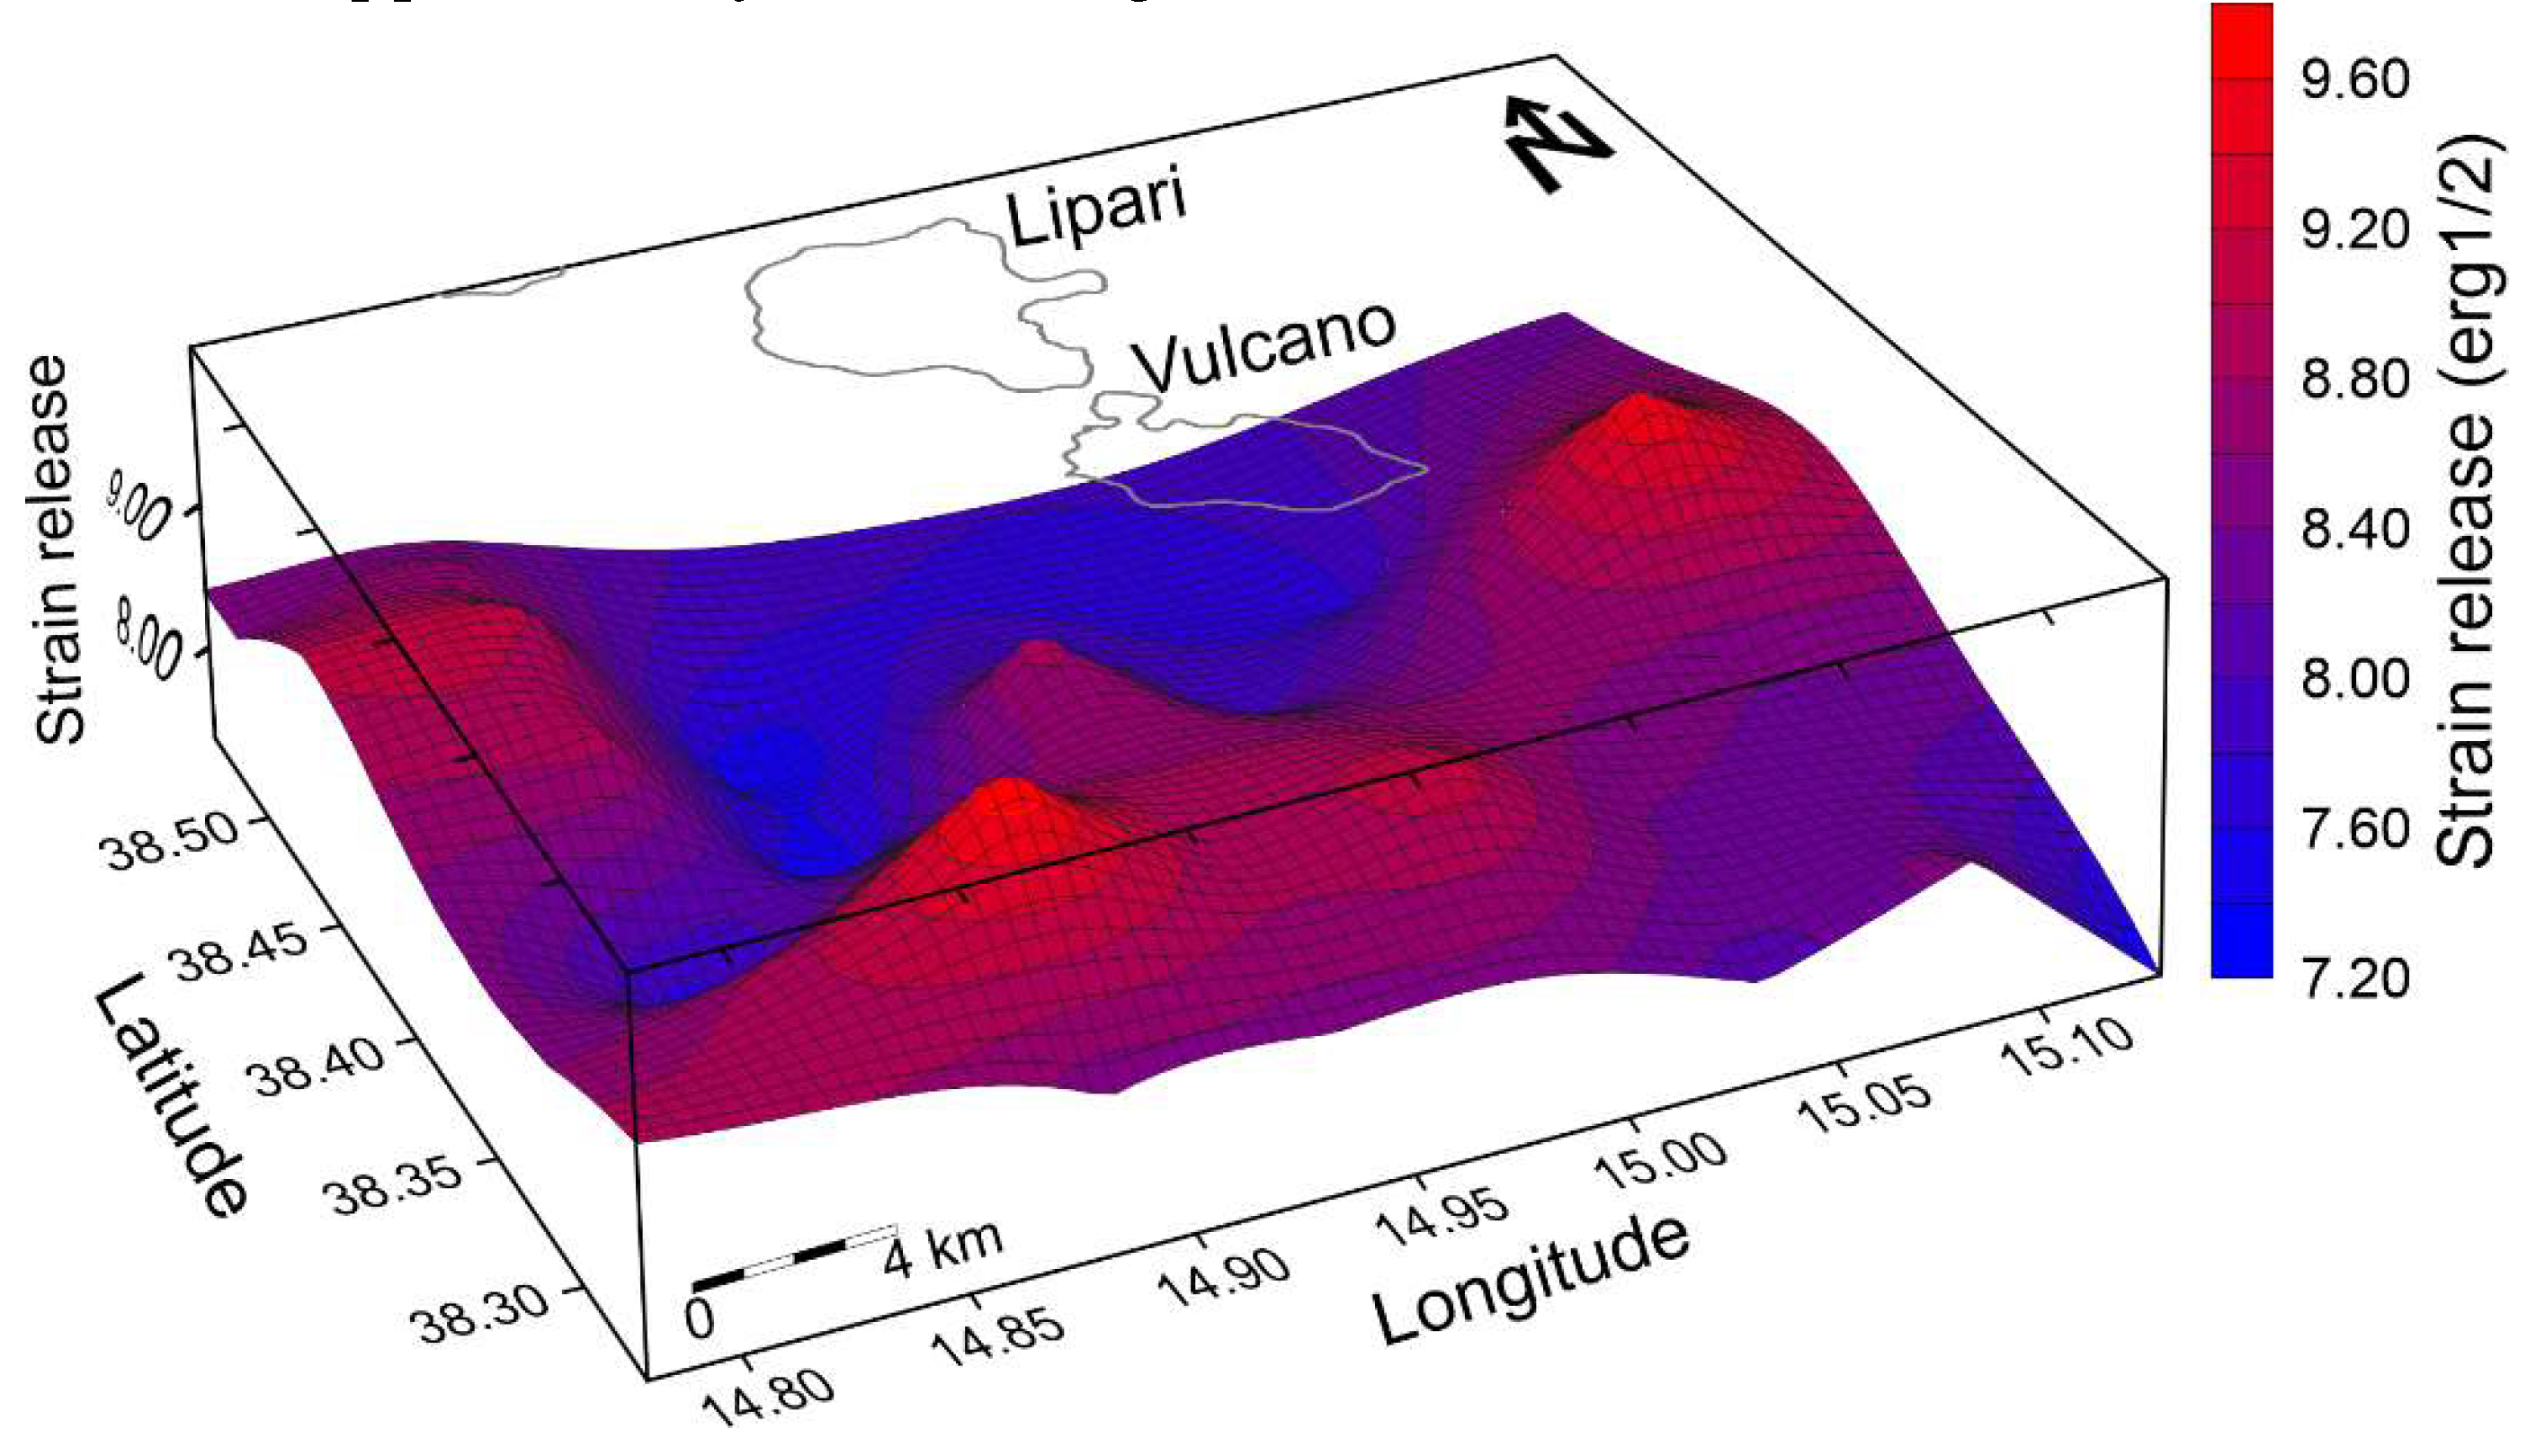
Figure 8.
Application of DBSCAN (Density-Based Spatial Clustering of Applications with Noise) to earthquakes with M>2.5 from 1985 to 2019. The map highlights four well-defined clusters (colored circles) corresponding to as many seismogenic source volumes.
Figure 8.
Application of DBSCAN (Density-Based Spatial Clustering of Applications with Noise) to earthquakes with M>2.5 from 1985 to 2019. The map highlights four well-defined clusters (colored circles) corresponding to as many seismogenic source volumes.
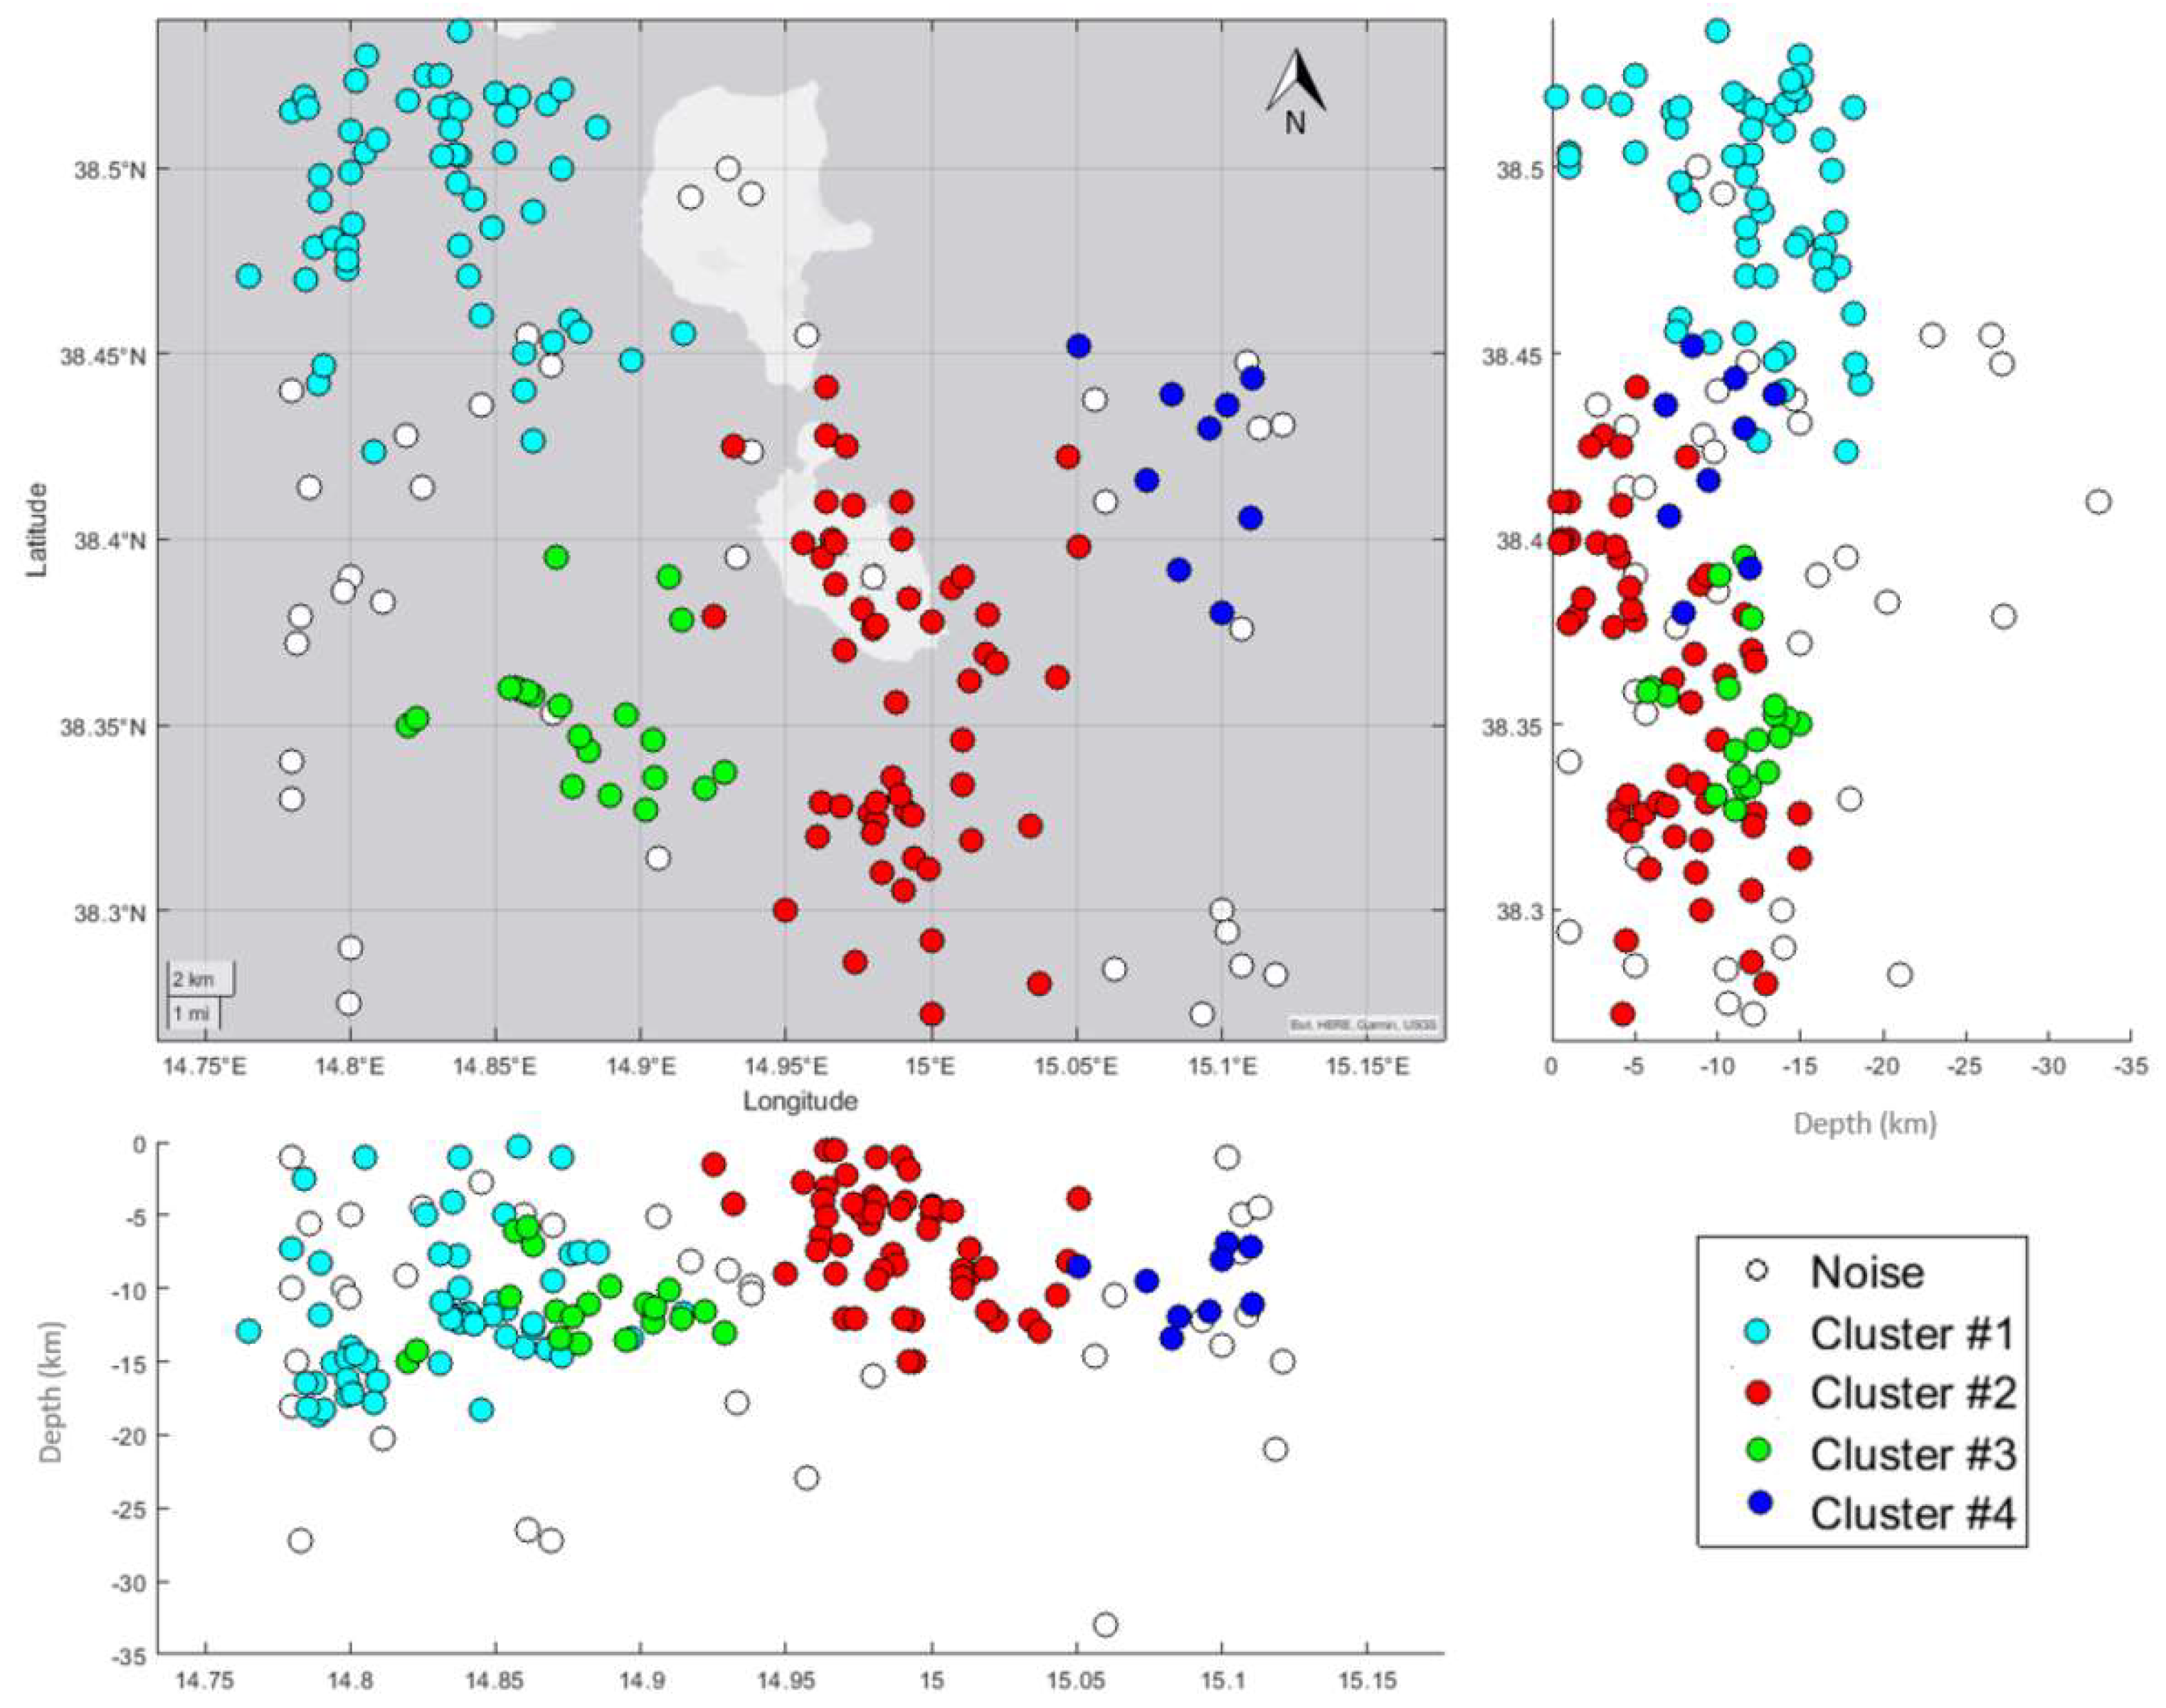
Figure 9.
Focal mechanisms between 1985 and 2019 (from [33,34,35]). A numbered list is provided in Supplementary Table S1.
Figure 9.
Focal mechanisms between 1985 and 2019 (from [33,34,35]). A numbered list is provided in Supplementary Table S1.
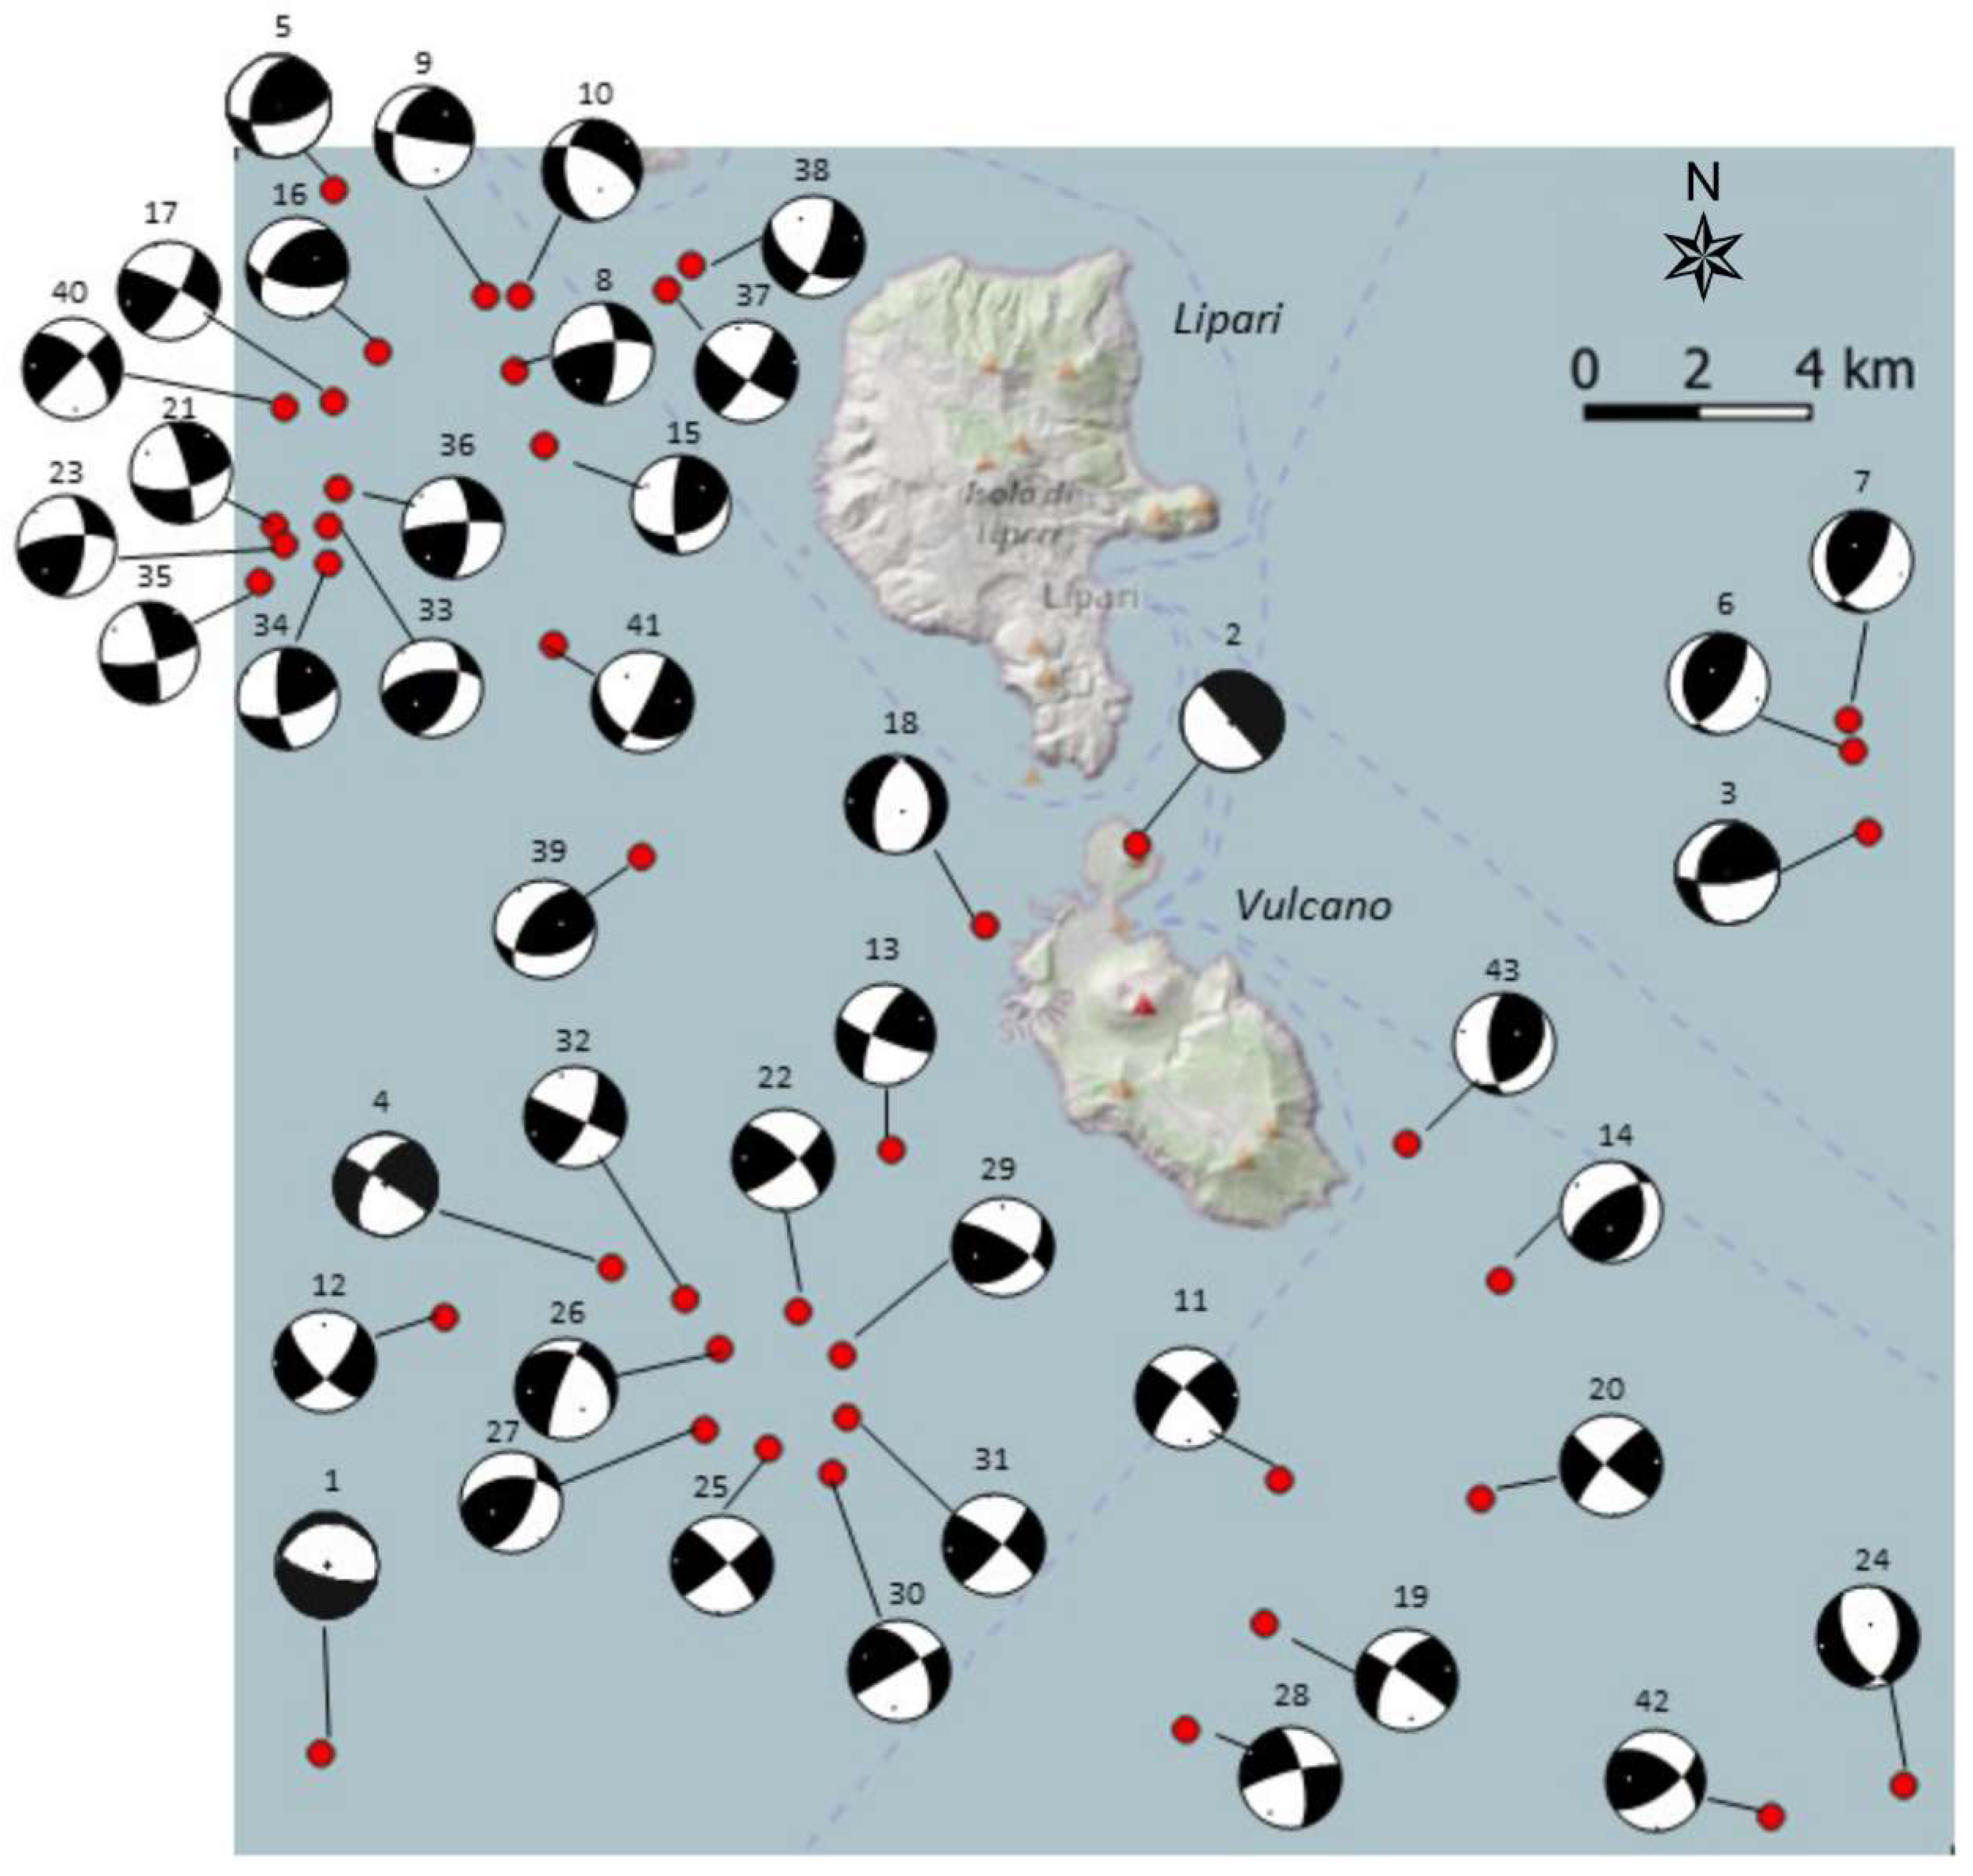
Figure 10.
Structural-kinematic map of the Lipari-Vulcano sector as inferred from M>4 FPS [34,35], GPS velocity field (light blue arrows, see [38]) and offshore seismic profiling in the Gulf of Patti (see [39,40]). The epicentres of the 1985 (red dots) and 1988 (blue dots) seismic swarms are reported.
Disclaimer/Publisher’s Note: The statements, opinions and data contained in all publications are solely those of the individual author(s) and contributor(s) and not of MDPI and/or the editor(s). MDPI and/or the editor(s) disclaim responsibility for any injury to people or property resulting from any ideas, methods, instructions or products referred to in the content. |
© 2025 by the authors. Licensee MDPI, Basel, Switzerland. This article is an open access article distributed under the terms and conditions of the Creative Commons Attribution (CC BY) license (http://creativecommons.org/licenses/by/4.0/).
Copyright: This open access article is published under a Creative Commons CC BY 4.0 license, which permit the free download, distribution, and reuse, provided that the author and preprint are cited in any reuse.


