
Submitted:
24 January 2025
Posted:
27 January 2025
You are already at the latest version
Abstract
In addition to energy storage, adipose tissue communication to other organs plays a key role in regulating organismal physiology. While the link between adipose tissue dysfunction and pathophysiology, including diabetes, chronic inflammation, and infertility, is clear, the molecular mechanisms that underlie these associations have not been fully described. We use Drosophila melanogaster as a model to better understand how adipose tissue communicates to the ovary. In this study, we utilized D. melanogaster’s robust genetic toolkit to examine the role of adipokines known to control larval growth during development, CCHamide-1, CCHamide-2, eiger, Growth-blocking peptide 3, and unpaired 2, in regulating oogenesis. We show that the adult fat body expresses these “larval” adipokines. Our data indicates that ovarian germline stem cell maintenance does not require these adipokines. However, adipocyte-derived CCHamide-1, eiger, Growth-blocking peptide 3, and unpaired 2 influence early and late germline survival as well as ovulation. Thus, this work uncovers several adipokines that mediate fat-to-ovary communication.
Keywords:
Drosophila
; oogenesis
; adipokines
; inter-organ communication
1. Introduction
Obesity, recognized as a disease in the US by the American Heart Association in 2013, is a growing concern for many countries in the world [1]. In 2018, one third of all adults in the US were considered obese [2] and the rates are projected to increase to around 50% by 2030 [3]. Obese adults and children are at higher risk of developing type 2 diabetes, cardiovascular disease, and several cancers [4]. With obesity, the imbalance between energy uptake (overeating) and expenditure (reduced activity), causes increased lipid storage in the adipose tissues [5] and lipid accumulation in non-adipose tissues [6]. Obesity-induced mitochondrial dysfunction, inflammation, and oxidative stress disrupt metabolism and the functions of other organs [4,7,8,9,10]. These smaller disruptions that occur at a cellular and tissue level can impact other organs and tissues on a functional level and lead to comorbidities such as infertility [11], cardiovascular dysfunction [12], and the development of non-alcoholic fatty liver disease [13]. While adipose tissue dysfunction negatively impacts peripheral organ function, the cellular and molecular mechanisms that underlie this association are not well understood. We use the model organism Drosophila melanogaster to uncover how the adipose tissue communicates to other organs.
Drosophila melanogaster is a robust model system that is widely used to study inter-organ communication [14]. Many biological pathways are conserved between humans and flies, with around 85% of human-disease causing genes having homologs in Drosophila [15,16]. Additionally, the genetic toolkit of Drosophila allows tissue- and cell type-specific manipulation of gene expression [17]. The Drosophila fat body, composed of adipocytes and hepatocyte-like oenocytes, plays similar energy storage and endocrine roles as the mammalian adipose tissue [18]. In addition to being used as a model for diet- and genetic-associated obesity [19,20], several Drosophila studies have begun to elucidate the mechanisms employed by the fat body to communicate to other tissues [21]. Not surprisingly, Drosophila adipose tissue serves as a central nutrient-sensing depot that relays information about dietary input to the highly nutrient-responsive ovary.
The Drosophila fat body employs nutrient-sensing pathways, nuclear hormone receptors, nutrient transport proteins, and metabolic enzymes to remotely control the diet-dependent process of oogenesis [22,23,24,25,26,27,28,29]. The Drosophila ovary is made up of 16 to 20 ovarioles, each one being an individual egg-producing unit containing the progressive stages of oocyte development [30]. The apical most part of the ovariole, the germarium, contains germline stem cells (GSCs) whose undifferentiated state is maintained by adherence to and signaling from cap cells (CCs) [31]. GSCs divide asymmetrically to self-renew and generate differentiated cystoblasts that divide four times synchronously with incomplete cytokinesis to form a 16-cell germline cyst. A single-cell layer of epithelial follicle cells surrounds each 16-cell cyst that buds from the germarium to form an individual egg chamber. One of the cells in the cyst becomes the oocyte while the remaining 15 cells become nurse cells that support oocyte development. Each ovariole contains six to eight developing egg chambers [31], with the most developed egg chamber, or mature oocyte, at the posterior end ready for ovulation and fertilization. Previous studies show that GSC maintenance, germline cyst survival, progression through vitellogenesis, and ovulation are regulated by nutrient-sensing pathways, including mechanistic Target of Rapamycin (mTOR), the amino acid response pathway (AAR), insulin/insulin-like growth factor (IIS), and Ras/MAPK signaling [22,24,25]. However, the fat body-derived factors that mediate adipose tissue control of oogenesis are unknown.
In humans, the adipose tissue secretes adipokines, such as leptin, tumor necrosis factors and interleukins to carry out endocrine control of multiple aspects of physiology, such as controlling nutritional intake, insulin sensitivity, and moderating inflammatory responses [32,33,34]. During development in Drosophila, the fat body secretes a variety of adipokines that control overall growth and developmental timing, similar to human adipocyte signaling [21,35,36]. The nutrient-sensitive neuropeptides, CCHamide-1 (CCHa1) and CCHamide-2 (CCHa2), are produced in the gut and fat body [37]. CCHa1 interacts with the anterior dorsal neuron and the pigment dispersing factors in the brain to regulate sleep cycles [38] and stabilize circadian behavioral rhythms [39]. CCHa2 binds to its receptor in the brain (CCHa2R) to promote Drosophila insulin-like peptide (dILP) production [40], with mutations in CCHa2 and CCHa2R resulting in larval growth defects [40]. Drosophila tumor necrosis factor, eiger (egr), is released from the fat body in response to starvation [41]. During starvation, egr binds to its receptor Grindlewald, expressed in the brain, to suppress dILP expression [41] and to Wengen, expressed in the gut enterocytes to restrict lipid catabolism and maintain tissue homeostasis [42]. Growth-blocking peptides (Gbp) regulate immune responses [43] and stimulate dILP production by acting on insulin producing cells (IPCs) in the brain. Knockdown of Gbps in the larval fat body led to smaller sized adults [43]. Unpaired 2 (upd2) is secreted from the fat body in response to dietary fats and sugars [44]. Similar to human leptin, Drosophila upd2 is upregulated with elevated fat stores and is downregulated during reduced nutritional conditions [45,46]. Upd2 regulates how much insulin is released into the circulation from the fly IPCs [47]. Given their role in controlling growth during larval development, we proposed that these adipokines may also mediate fat body control of oogenesis during adulthood. Here we show that the adult fat body expresses CCHa1, CCHa2, egr, Gbp3, and upd2. Adipocyte-specific knockdown of these adipokines leads to a general increase in triglyceride storage. We find that none of these adipokines are required for proper GSC maintenance. However, our evidence indicates that egr, upd2, and CCHa1 are important for germline survival while Gbp3 promotes ovulation. This work identifies fat-derived factors that modulate specific steps of oogenesis, thus filling in the knowledge gap of how the adipose tissue relays information to other organs.
2. Materials and Methods
2.1. Drosophila Strains and Culture Conditions
Fly lines used for this study were obtained from the Bloomington Drosophila Stock Center (BDSC). The following transgenic fly lines were used for these series of experiments: RFP-RNAi (#31417), CCHa1-RNAi (#57562), CCHa2-RNAi (#57183), egr-RNAi (#55276 and #58993), upd2-RNAi (#33949 and #33988), and Gbp3-RNAi (#64108). We used the driver line tubPGal80ts;Lsp2(3.1)Gal4/TM6B for temperature sensitive adipocyte specific knockdown [22] as well as the w1118 line to stimulate oogenesis with our selected progeny. Canton S and Oregon R fly lines were used to determine adipokine presence in adult fat. Extended stocks were kept at room temperature (20-25°C) on a molasses medium (Archon Scientific) and flipped weekly.
2.2. Adipocyte Specific Manipulation of Gene Expression
Crosses were set up in triplicate, with each bottle containing 20 to 30 virgin adult female tubPGal80ts;3.1Lsp2-Gal4/TM6B flies and 10 adult male UAS-transgene-RNAi flies. UAS RFP-RNAi was used as a control in each cross. Flies were kept on a molasses medium diet supplemented with wet yeast. Crosses were kept in an 18°C incubator and flipped every 4 days until progeny emerged. Virgin adult female progeny with both UAS-target-RNAi and tubPGal80ts;Lsp2(3.1)Gal4 were isolated using the balancers as a guide. w1118 male adult flies were added to target female progeny to stimulate oogenesis and kept at 18°C for four days to clear larval fat before moving to 29°C incubator for 10 days for adipokine knockdown in the adipocytes.
2.3. Ovary Immunostaining and Fluorescence Microscopy
After 10 days of transgene expression, ovaries from adult target female flies were dissected in PBS. Ovaries were fixed in 5.3% paraformaldehyde (PFA) (Electron Microscopy Sciences) in PBS for 13 minutes. The ovaries were rinsed twice in 0.5% Triton-X (VWR Life Sciences) in PBS (PBT) and washed three times on a nutator for 15 minutes. Samples were placed in a blocking solution (5% Bovine Serum Albumin, 5% Normal Goat Serum, and 0.5% Trition-X in PBS) and incubated for at least 24 hours. After blocking, primary antibodies mouse alpha spectrin (2 µg/ml, Developmental Studies Hybridoma Bank (DHSB)), mouse anti-Lamin C (2 µg/ml DSHB), and rabbit anti-cleaved Dcp-1 (1:250, Cell Signaling Technology) were diluted in blocking buffer and added to the samples. After an overnight incubation, the primary antibody solution was removed, and the samples were washed three times for 10 minutes each in PBT. A secondary antibody solution containing Alexa-Fluor anti-mouse 488, Alexa-Fluor anti-rabbit 568 and blocking solution were added to each sample (1:250 each) and incubated for two hours shielded from light. Once the secondary antibody solution was removed the samples were washed 3 times in PBT for 15 minutes each protected from the light. After the last wash, all the PBT was removed and the samples were stored in Vectashield with 4’,6-diamidino-2-phenylindole (DAPI). Ovaries were mounted onto glass slides with glass coverslips before analyzing on a confocal microscope.
2.4. Adipocyte Immunostaining and Fluorescence Microscopy
Abdominal carcasses were collected from adult female target progeny after 10 days of transgene activation. The gut, ovaries, and malpighian tubes were removed from the carcasses, leaving only the fat body attached to the carcass. Insect dissection pins (Austerlitz) were used to anchor the corners of the carcasses to the bottom of a Sylgard (DOW Chemical) coated twelve well tissue culture dish. The carcasses were fixed for 20 minutes in 5.3% PFA in PBS. At room temperature, samples were rinsed twice and washed three times for 15 minutes in 0.1% Tween-20 in PBS (PBT). Abdominal carcasses were incubated overnight in blocking solution (5% NGS, 5% BSA, 0.1% PBT in PBS). The carcasses were then incubated with 3 µg/ml mouse anti-alpha spectrin (DSHB) diluted in blocking solution overnight. Samples were then washed three times for 15 minutes in 0.1% PBT before a 2-hour incubation period protected from light with anti-mouse Alexa-Fluor 568 diluted in blocking solution (1:250). To visualize lipid droplets, samples were washed three times in 0.1% PBT before a 30-minute incubation with BODIPY 505/510 (25 ng/ml) at room temperature and protected from light. Samples were then washed with 0.1% PBT and abdominal carcasses were stored in Vectashield containing DAPI. Fat body tissues were removed from the abdominal carcass onto slides prior to imaging.
2.5. Ovarian Analysis
All ovarian analysis was done using a Zeiss LSM 800 confocal microscope using ZEN 2.6 software. Using 63x magnification, cap cells (CC) were counted using nuclear morphology and Lamin C staining. Germline stem cells (GSC) were counted using alpha spectrin labeling of the fusome. Dcp-1+ germaria were counted based on the presence of Dcp-1 in any of the cysts present in the germaria. GSC, CC, and Dcp-1+ germaria were counted at 0 and 10 days of transgene expression. At least 3 biological replicates were analyzed with 50 to 150 germaria counted per timepoint, per sample in each replicate. Rates of GSC loss were statistically verified using two-way ANOVA with interaction (GraphPad Prism 8). Shifts in rates of Dcp-1+ germaria from the control were analyzed using a student’s t-test for statistical significance between the control and transgene samples. A 20x magnification was used to analyze the presence of dying vitellogenic follicles in the ovary samples. The total number of complete ovarioles were counted and the total number of ovarioles that contained Dcp-1 positive staining or pyknotic nuclei at or after stage 8 of vitellogenesis was recorded. The percentages of dying vitellogenic follicles (DVF) in each transgene group were tabulated and analyzed using a student’s T test against the control group.
2.6. Blocked Ovulation Analysis
15 to 20 adipokine knockdown progeny after 4 days of incubation in 18°C were placed into vials with male w1118 flies in molasses media supplemented with wet yeast. Flies were then placed in a 29°C incubator and flipped daily. After the tenth day, the ovaries were dissected from the female progeny and analyzed for blocked ovulation. An ovary was considered blocked if it had more than one stage 14 egg chamber present in any of the ovarioles. A percentage was made using the number of blocked ovaries against the total number of ovaries counted. A Student’s t-test was used to determine if there were statistically significant changes between the transgene samples and the control.
2.7. Measurement of Adipocyte and Lipid Droplet Size
Using the confocal microscope, z-stack images were taken from fat body samples to capture multiple images at 1 µm depth for adipocyte size and lipid droplet size analysis. Using ZEN Blue lite 2.8 software and ImageJ, measurements were taken using a stylus for the largest areas present in the fat body according to the alpha spectrin staining. Around 10-15 measurements were taken per fat body for a total of around 50-150 measurements per sample analyzed. The measurements were averaged, and a Student’s T test was used to determine if there were any statistical differences between the control group and the adipokine knockdown groups. ImageJ was also used to determine lipid droplet size for each of the fat bodies analyzed. The lipid droplets were made visible by the BODIPY staining. Each lipid droplet per sample was measured by automated segmentation using the threshold selection method in ImageJ. The background of each image was subtracted, and the threshold was determined based on a setting that resembled the edges of the lipid droplets. The total measurements were averaged in each biological replicate, and a Student’s T test was done to determine if the distribution between the control group and the adipokine knockdown groups were statistically significant.
2.8. Adipocyte Bradford and Triglyceride Assays
After 10 days of transgene expression, the abdominal carcasses of control and transgene female progeny were dissected. Carcasses were placed in a 1.5 ml microcentrifuge tube and submerged in a triglyceride lysis buffer (140 mM NaCl, 50 mM Tris-HCl, 0.1% Triton-X in water with protease inhibitor cocktail [Research Products International] added). A pestle was used to grind carcasses in lysis solution. Samples were then centrifuged, and the supernatant was removed and placed into a clean, labeled microcentrifuge tube. The Bradford assay and triglyceride assay was done according to the VWR Bradford Method Protein Assay kit (M173-KIT) and Stanbio Liquicolor Triglycerides Kit (STANBIO 2100-225). Measurements were taken in triplicate using SoftMaxPro 6.4 software on a Spectramax i3 Plate Reader. For each biological replicate, all values were converted to µg/ml. Triglyceride to Protein ratios were made by dividing the amount of triglycerides by the amount of protein. Fold change was calculated by dividing the triglyceride/protein ratio of each transgenic sample to the ratio of its RFP-RNAi control for that biological replicate. A Student’s T test was used to determine if the fold changes from the transgenic groups were statistically significant from the control groups.
2.9. RNA Isolation, RT-PCR, and qPCR
After 10 days of transgene expression at 29°C, abdominal carcasses were dissected, in PBS, the ovary, gut and malpighian tubes removed from the carcass. Carcasses with fat bodies attached were stored in RNA Shield (Zymo Research). RNA was isolated from each sample using the Quick RNAi Mini-Prep kit (Zymo Research). 100 ng of RNA was used to synthesize cDNA using the Verso cDNA synthesis Kit (ThermoFisher Scientific). RNA and cDNA quantity and A260/A280 quality was measured using Smartdrop L spectrophotometer (Accuris Instruments). Primers were derived from previously published RT-PCR and qPCR work and FlyPrimerBank (Table S1). Canton S, IV, and Oregon R adult fat body cDNA samples were used for RT-PCR quantification of adipokine presence in adult fat. RT-PCR quantification was done using Econotaq PLUS GREEN (Lucigen) on an iCycler Thermocycler (Bio-Rad). Alpha tubulin primers were used as a control. Knockdown efficiency was quantified using SYBR Green reagents (PowerTrack SYBR Green Master Mix – Applied Biosciences) and a Quantstudio 3 Real-Time PCR System (Applied Biosystems, Thermofisher Scientific) Relative quantification of at least three biological replicates was done using the comparative Ct method. A Student’s T-test was used to determine the statistical significance between the knockdown samples to the control samples.
3. Results
3.1. Adipokines with Roles in Larval Development Are Expressed in the Adult Fat Body
We first asked if the fat body of adult females expresses adipokines known to have a role in larval development. Using RT-PCR, we detect transcripts for unpaired 2 (upd2), eiger (egr), stunted (sun), Growth-blocking peptides 1, 2 and 3 (Gbp1, Gbp2, and Gbp3), CCHamide-1 (CCHa1), and CCHamide-2 (CCHa2) (Figure 1A). To determine if these adipokines regulate oogenesis, we used the adipocyte-specific tubP-Gal80ts;3.1Lsp2-Gal4 driver (3.1Lsp2ts) [22] to express UAS-dsRNA transgenes targeting each adipokine for RNAi-mediated knockdown. Given that nutrient-sensing pathways like IIS and mTOR have been previously shown to function within the fat body to modulate oogenesis [22,24], we focused our analysis on CCHa1, CCHa2, egr, Gbp3, and upd2 based on their known roles in relaying nutrient status [37,40,41,42,43,44]. To determine knockdown efficiency, we used qRT-PCR to measure transcript levels of each adipokine in adult female fat bodies from control and adipokine knockdown flies (Figure 1B-F). Compared to controls, there was significant knockdown for all UAS-dsRNA transgenic lines: CCHa1 (76.7%) (Figure 1B), CCHa2 (58.4%) (Figure 1C), egr line 1 (egr#1 - 62.8%), and egr line 2 (egr#2 – 63.2%) (Figure 1D), and upd2 line 1 (upd2#1 – 56.3%) (Figure 1F). Two RNAi lines showed a moderate to slight reduction in transcript levels: Gbp3 (32.2%) (Figure 1E) and upd2 line 2 (upd2#2 – 1.5%) (F). Of the three trials assessing upd2 transcript level using the second UAS-dsRNA transgene, there was one outlier showing overexpression, thus dampening the effect of knockdown (Tables S2 and S3).
3.2. CCHa1, CCHa2, egr, Gbp3, and upd2 Do Not Cell-Autonomously Control Adipocyte or Lipid Droplet Size
Based on previous work, changes in adipocyte size can be observed by feeding Drosophila a high fat diet [48] and by knocking down certain proteins in the fat body [49]. We asked if our subset of adipokine targets control adipocyte cellular biology by using whole-mount adult fat body immunocytochemistry [50] to assess cell and lipid droplet size (Figure 2A). In control and adipokine knockdown fat bodies, most adipocytes fall within the mid-range size bin (Figure 2B). While the average percentage of large adipocytes tends to be higher with CCHa1RNAi (18.5% ± 3.1), CCHa2 RNAi (17.7 ± 4.5), egr RNAi#1 (18% ± 5.3), egr#2RNAi#1 (20.2% ± 5.3) Gbp3 RNAi (17.3% ± 3.6), upd2 RNAi#1 (18.8% ± 5.2), and upd2 RNAi#2 (14.2% ± 1.9) compared to control (9.7% ± 3.4), there is no significant difference in average adipocyte size (Figure 2B and Table S4). Similarly, lipid droplet size ranges, from very small to very large, were comparable across control and CCHa1, CCHa2, egr, Gbp3, and upd2 knockdown fat bodies (Figure 2C and Table S5). We also measured levels of triglycerides, the major form of stored fat in Drosophila adipocytes [51]. Adipocyte-specific knockdown of each adipokine resulted in higher TAG levels compared to control, with CCHa1, egr, and upd2 knockdown showing a statistically significant increase (1.7- to 2-fold change) (Figure 2D and Table S6). Taken together, these data suggest that the CCHa1, CCHa2, egr, Gbp3, and upd2 adipokines regulate lipid storage in adult female adipocytes.
3.3. Adipocyte-Derived CCHa1, CCHa2, egr, Gbp3, and upd2 Do Not Regulate Ovarian GSC Maintenance
Genetic knockdown of amino acid receptors [22] and scavenger receptors [29] have led to a reduction in the number of GSC in the germarium. Removing adipocyte specific factors from the IIS and TOR signaling pathway has had detrimental effects on GSC maintenance and the process of vitellogenesis [22,24,25]. We asked if CCHa1, CCHa2, egr, Gbp3, and upd2 in adult adipocytes control ovarian GSC number. As observed in previous studies [22,24,25]. The average GSC number declines slightly with age (Figure 3). Upon RNAi-mediated knockdown of CCHa1, CCHa2, egr, Gbp3, and upd2 in adipocytes, the GSC loss associated with age was comparable to that of controls (Figure 3A-D and Table S7). Interestingly, we observed that GSC number remained stable, i.e., did not decrease with age, with CCHa1 and upd2 knockdown in adipocytes; however, there was no statistically significant difference compared to controls (Figure 3A, 3D). Therefore, we conclude that CCHa1, CCHa2, egr, Gbp3, and upd2 originating from adipocytes do not support GSC maintenance.
3.4. Adipocyte-Derived CCHa1, CCHa2, egr, Gbp3, and upd2 Do Not Support Early Germline Survival or the Progression Through Vitellogenesis
Dietary input impacts germline survival early during oogenesis, at the 16-cell cyst stage in the germarium, as well as later during the progression of egg chambers through vitellogenesis [52]. Previous studies have shown that this is in part mediated by communication from the adipose tissue [23,24,25,26,27,28]. For example, adipocyte-specific knockdown of components of the IIS pathway, from the receptor to key players in the downstream effector axes, leads to reduced GSC maintenance [24,25]. Therefore, we asked if CCHa1, CCHa2, egr, Gbp3, and upd2 function within adipocytes to support survival of the early germline. We quantified germline death in germaria from flies in which individual adipokines had been knocked down in adult adipocytes. On average, the percentage of Dcp-1+ germaria was higher with adipocyte knockdown of CCHa1, CCHa2, egr, and upd2, but not Gbp3, when compared to control (Figure 4A and Table S8), with statistically significant increases observed for egr and upd2. Next, we asked if these adipokines function within adipocytes to support survival of the germline later during oogenesis by measuring the number of vitellogenic egg chambers undergoing cell death. On average, the percentage of ovarioles containing a dying vitellogenic egg chamber was higher than the control for adipocyte knockdown of CCHa1, egr, and upd2, but not for CCHa2 or Gbp3 (Figure 4B). For the adipokines that showed higher levels of vitellogenic egg chamber cell death, an approximate 10% increase was observed (Table S9). Altogether, these data indicate that adipocyte-derived egr and upd2 support survival of early and late germline while adipocyte-derived CCHa1 predominantly promotes vitellogenesis.
3.5. Adipocyte-Derived Gpb3 Promotes Ovulation of Mature Oocytes
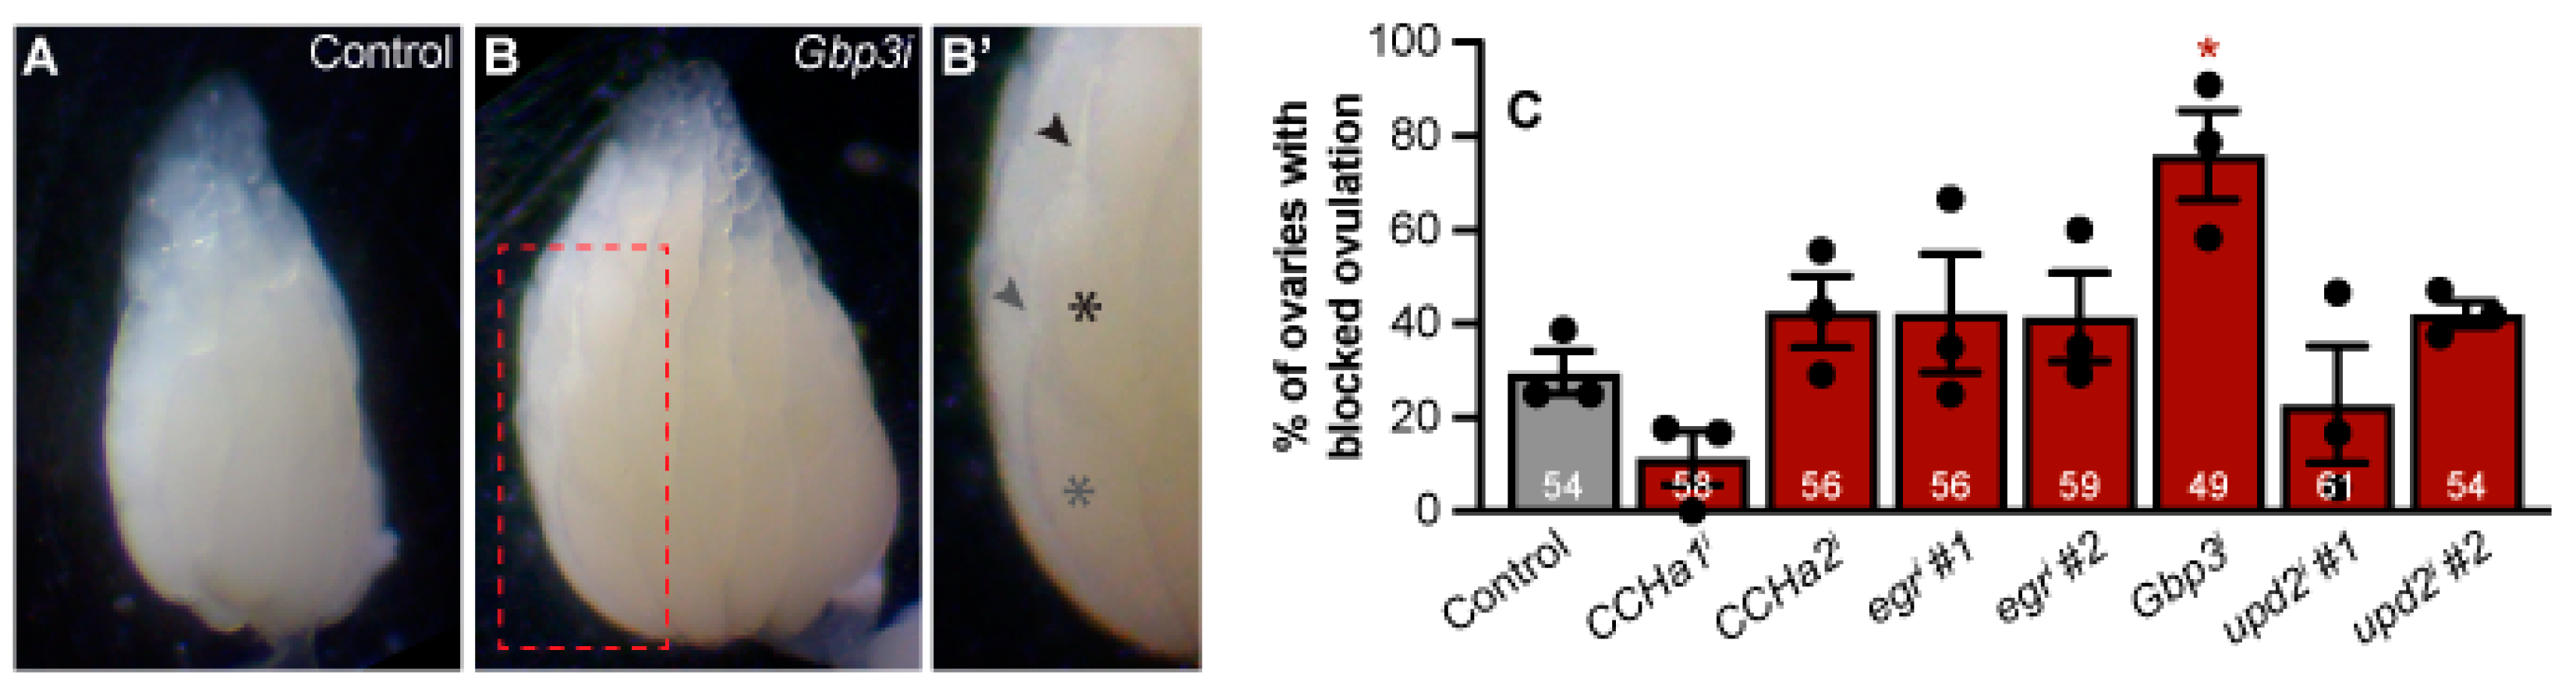
Individual ovarioles in adult Drosophila female ovaries contain only one or zero mature oocytes because of continual ovulation (Figure 5A), the last step of oogenesis that is sensitive to nutritional input [52]. Moreover, ovulation is regulated by mTOR signaling, the integrated stress response, and Ras/MAPK activity within adult adipocytes [22,25,26]. When single ovarioles retain more than one mature oocyte, ovulation is considered to be blocked [22] (Figure 5B, B’). To determine if CCHa1, CCHa2, egr, Gbp3, or upd2 could mediate fat body control of ovulation, we quantified ovulation block in samples with adipocyte-specific knockdown of each adipokine. For knockdown of CCHa1, CCHa2, egr, and upd2, the percentage of ovaries with mature oocyte retention was comparable to controls (Figure 5C). However, adipocyte-specific knockdown of Gbp3 resulted in approximately a 45% increase over controls of blocked ovulation (Figure 5A-C and Table S10). Thus, adipocyte-derived Gbp3 is required to promote ovulation.
4. Discussion
A substantial body of work provides evidence that the fat body relays nutritional information to the ovary [22,23,24,25,26,27,28]. While the fat body secretes many factors [53], the identity of fat body-derived factors that communicate to the ovary are unknown. We took clues from studies of larval development that have identified several adipokines shown to regulate overall growth and postulated that CCHa1, CCHa2, egr, Gbp3, and upd2 might mediate fat-to-ovary communication observed in adult females. Using the Gal80ts/Gal4/UAS gene expression system to knockdown each adipokine in adult adipocytes, we find that all these adipokines, excluding CCHa2, have distinct roles in controlling specific nutrient-sensitive stages of oogenesis. None of the adipokines are required for GSC maintenance (Figure 3) and CCHa2 did not play a role in any of the stages of oogenesis examined. However, egr and upd2 regulate survival of early germline cysts, and along with CCHa1 regulate survival of vitellogenic egg chambers (Figure 4). Lastly, we find the adipocyte-derived Gbp3 specifically controls ovulation (Figure 5). This work continues to advance understanding of how the fat body remotely controls oogenesis, by uncovering adipokines that regulate several aspects of oogenesis.
4.1. Adipocyte to Ovary Communication Is Maintained by Multiple Pathways, with No Single Adipokine Controlling Ovarian Homeostasis
We have observed from earlier work that the ovary is very sensitive to nutritional changes. Depending on the diet fed to flies, the amount of egg production varies. High sugar diets cause Drosophila to lay less eggs over time and increase the number of dying vitellogenic follicles [54]. The changes in diet are facilitated by nutrient signaling pathways, such as insulin and insulin like growth factor signaling, amino acid sensing, and TOR signaling [55]. Knockdown of components of these pathways such as the insulin receptor (InR) [24] and the Ras/MAPK pathway components [25] led to significant increases in cell death in the germaria. egr, upd2, CCHa2, are adipokines that communicate with their own respective receptors in the brain to control the amount of dILP secretion into the hemolymph [40,41,43,45]. Based on our data, no one adipokine is responsible for maintaining ovary stem cell homeostasis, but a reduction in the amount present in the fat body through genetic manipulation can exacerbate cell death in the ovary (Figure 4). There are multiple signaling pathways that interact with the IPCs in the Drosophila brain to regulate metabolism and energy storage. Each target knockdown sample only targeted one adipokine, and the presence of other nutrient sensing adipokines may compensate for the lack of one. A Drosophila model that removes two or more of our targeted adipokines from the fat would give more information as to the compensatory nature of these multiple nutrient sensing pathways. Another genetic system of transgene regulation such as CrispR/Cas9 [56] may need to be used to completely remove a specific adipokine from the fat body, as knockout experiments may highlight which adipokines are essential to ovarian regulation or if a particular gene is part of a sequence of interactions needed to relay nutrient status.
4.2. Gbp3 May Have a Distinct Role for Ovulation Outside of Stem Cell Maintenance
Gbp3, a homolog of Gbp1, has not been intensively studied. Gbp3 knockdown in larval fat resulted in smaller body sizes by weight in adult male and female flies [43]. We observed an increase in adipocyte size and lipid content in Gbp3 adipocyte knockdown female flies, but that may not account for size reductions in the other parts of the fly’s physiology under adipocyte knockdown. When comparing the rates of blocked ovulation of the adipokine knockdown targets, Gbp3 was the most drastic and statistically significant (Figure 5C). Physiological size assessments as well as tests into the signaling networks that regulate proper ovulation will need to be done to determine the cause of the blocked ovulation. The increased blocked ovulation may indicate that Gbp3 levels may influence ovulation on a neuronal or physiological level distinct from overall metabolic status. Gbp1 and Gbp2 will also need to be investigated to determine if the same patterns of blocked ovulation are present or if Gbp3 is unique in this aspect.
4.3. Partial Knockdown of Target Adipokines from the Fat May Not Be Enough to Influence Ovarian Homeostasis
The knockdown of the nutrient signaling adipokines from the fat led to an increase in triglyceride levels, but did not cause any significant changes to the morphology of the adipocyte. On average, all adipokine target knockdowns led to increases in triglyceride/protein ratio when compared to the control (Figure 2D). For some targets like upd2, this is unusual, as upd2 is secreted by the fat body in response to dietary fat and sugar. upd2 activates JAK/STAT signaling in GABAergic neurons, to stop inhibition of the IPCs, which then secrete dILPs to promote growth and fat storage [44,45,46]. upd2 reduction in the fat would slow IPC dILP production, which should result in smaller flies with less triglyceride levels [44]. Our fly model was a temperature sensitive, RNAi mediated knockdown, instead of a homozygous deletion mutant [44], so residual upd2 expression and additional unperturbed nutrient signaling pathways may stabilize body size.
Nutrient sensing is vital for maintaining growth and energy storage in both humans and in Drosophila. Understanding how adipocytes signal nutrient status to other tissues can improve clinical research and spur developments and treatments for obesity and its associated comorbidities. Through this work we examined how reductions of key signaling adipokines in the fat can alter the maintenance and physiology of the ovary. Not one single adipokine studied was crucial for maintaining ovarian homeostasis, but the reduction of them led to increased cell death on average. Future studies should be directed at determining if there are compensatory mechanisms in nutrient signaling. We also observed that Gbp3 adipocyte specific knockdown may destabilize egg laying processes and block ovulation. Investigating Gbp1 and Gbp2 adipocyte specific knockdown’s effect on the ovary may give more insight as to how those adipokines modulate ovarian processes outside of nutrient status.
Supplementary Materials
The following supporting information can be downloaded at the website of this paper posted on Preprints.org. Table S1: qPCR and RT-PCR Primer Lists; Table S2: qPCR Relative Quantification Values; Table S3: Expanded qPCR Data for Comparative Ct Experiments; Table S4: Average Adipocyte Size Binned Distributions and ANOVA; Table S5: Lipid Droplet Bin Distributions and ANOVA; Table S6: Triglyceride and Bradford Fold Changes; Table S7: GSC and CC Count Summarization; Table S8: Average Dcp-1 Positive Germaria Counts; Table S9: Average Number of Dying Vitellogenic Follicles; Table S10: Blocked Ovulation Averages
Author Contributions
Conceptualization, A.R.A.; methodology, C.S., I.H.W., and T.B.; formal analysis, C.S. and A.R.A.; investigation, C.S. and A.R.A.; resources, A.R.A.; data curation, C.S.; writing—original draft preparation, C.S..; writing—review and editing, C.S., I.H.W. and A.R.A.; visualization, C.S. and A.R.A.; supervision, A.R.A.; funding acquisition, C.S. and A.R.A. All authors have read and agreed to the published version of the manuscript.
Funding
This work was partially supported by a SPARC Graduate Research Grant (C.S.) from the Office of the Vice President for Research at the University of South Carolina. This research was funded by the Chan Zuckerberg Initiative DAF grant number 2022-253625, an advised fund of the Silicon Valley Community Foundation.
Data Availability Statement
The original contributions presented in this study are included in the supplementary Excel workbook. Further inquiries can be directed to the corresponding author.
Acknowledgments
The monoclonal antibodies, anti-alpha spectrin (deposited by Branton, D. and Dubreuil, R.) and anti-Lamin C (deposited by Fisher, P.A) were obtained from the Developmental Studies Hybridoma Bank, created by the NICHD of the NIH and maintained at The University of Iowa, Department of Biology, Iowa City, IA 52242. Stocks obtained from the Bloomington Drosophila Stock Center (NIH P40OD018537) were used in this study. We thank members of the Armstrong Laboratory for critical reading of the manuscript.
Conflicts of Interest
The authors declare no conflicts of interest.
References
- De Lorenzo, A.; Romano, L.; Di Renzo, L.; Di Lorenzo, N.; Cenname, G.; Gualtieri, P. Obesity: A Preventable, Treatable, but Relapsing Disease. Nutrition 2020, 71. [Google Scholar] [CrossRef] [PubMed]
- Hales, C.M.; Carroll, M.D.; Fryar, C.D.; Ogden, C.L. Prevalence of Obesity and Severe Obesity Among Adults: United States, 2017-2018. NCHS Data Brief 2020. [Google Scholar]
- Restrepo, B.J. Obesity Prevalence Among U.S. Adults During the COVID-19 Pandemic. Am. J. Prev. Med. 2022, 63, 102–106. [Google Scholar] [CrossRef] [PubMed]
- Kawai, T.; Autieri, M.V.; Scalia, R. Adipose Tissue Inflammation and Metabolic Dysfunction in Obesity. Am. J. Physiol. Cell Physiol. 2021, 320, C375–C391. [Google Scholar] [CrossRef] [PubMed]
- Ahmed, U.; Ashfaq, U.A.; Qasim, M.; Ahmad, I.; Ahmad, H.U.; Tariq, M.; Masoud, M.S.; Khaliq, S. Dysregulation of Circulating MiRNAs Promotes the Pathogenesis of Diabetes-Induced Cardiomyopathy. PLoS One 2021, 16, 1–14. [Google Scholar] [CrossRef] [PubMed]
- Opazo-Ríos, L.; Mas, S.; Marín-Royo, G.; Mezzano, S.; Gómez-Guerrero, C.; Moreno, J.A.; Egido, J. Lipotoxicity and Diabetic Nephropathy: Novel Mechanistic Insights and Therapeutic Opportunities. Int. J. Mol. Sci. 2020, 21. [Google Scholar] [CrossRef] [PubMed]
- Longo, M.; Zatterale, F.; Naderi, J.; Parrillo, L.; Formisano, P.; Raciti, G.A.; Beguinot, F.; Miele, C. Adipose Tissue Dysfunction as Determinant of Obesity-Associated Metabolic Complications. Int. J. Mol. Sci. 2019, 20. [Google Scholar] [CrossRef] [PubMed]
- Pérez, L.M.; Pareja-Galeano, H.; Sanchis-Gomar, F.; Emanuele, E.; Lucia, A.; Gálvez, B.G. ‘Adipaging’: Ageing and Obesity Share Biological Hallmarks Related to a Dysfunctional Adipose Tissue. J. Physiol. 2016, 594. [Google Scholar] [CrossRef]
- Kopelman, P.G. Obesity as a Medical Problem. Nature 2000, 404, 635–643. [Google Scholar] [CrossRef]
- Ahima, R.S.; Lazar, M.A. Adipokines and the Peripheral and Neural Control of Energy Balance. Mol. Endocrinol. 2008, 22. [Google Scholar] [CrossRef]
- Silvestris, E.; de Pergola, G.; Rosania, R.; Loverro, G. Obesity as Disruptor of the Female Fertility. Reprod. Biol. Endocrinol. 2018, 16, 1–13. [Google Scholar] [CrossRef] [PubMed]
- Koenen, M.; Hill, M.A.; Cohen, P.; Sowers, J.R. Obesity, Adipose Tissue and Vascular Dysfunction. Circ. Res. 2021, 128. [Google Scholar] [CrossRef] [PubMed]
- Loomba, R.; Friedman, S.L.; Shulman, G.I. Mechanisms and Disease Consequences of Nonalcoholic Fatty Liver Disease. Cell 2021, 184. [Google Scholar] [CrossRef]
- Musselman, L.P.; Kühnlein, R.P. Drosophila as a Model to Study Obesity and Metabolic Disease. J. Exp. Biol. 2018, 221, jeb163881. [Google Scholar] [CrossRef] [PubMed]
- Yamaguchi, M.; Yamamoto, S. Role of Drosophila in Human Disease Research 2.0. Int. J. Mol. Sci. 2022, 23. [Google Scholar] [CrossRef] [PubMed]
- Droujinine, I.A.; Perrimon, N. Interorgan Communication Pathways in Physiology: Focus on Drosophila. Annu. Rev. Genet. 2016, 50. [Google Scholar] [CrossRef] [PubMed]
- Beumer, K.J.; Carroll, D. Targeted Genome Engineering Techniques in Drosophila. Methods 2014, 68. [Google Scholar] [CrossRef] [PubMed]
- Colombani, J.; Raisin, S.; Pantalacci, S.; Radimerski, T.; Montagne, J.; Léopold, P. A Nutrient Sensor Mechanism Controls Drosophila Growth. Cell 2003, 114, 739–749. [Google Scholar] [CrossRef] [PubMed]
- Hildebrandt, A.; Bickmeyer, I.; Kühnlein, R.P. Reliable Drosophila Body Fat Quantification by a Coupled Colorimetric Assay. PLoS One 2011, 6. [Google Scholar] [CrossRef] [PubMed]
- Kühnlein, R.P. Energy Homeostasis Regulation in Drosophila: A Lipocentric Perspective. Results Probl. Cell Differ. 2010, 52. [Google Scholar] [CrossRef]
- Meschi, E.; Delanoue, R. Adipokine and Fat Body in Flies: Connecting Organs. Mol. Cell. Endocrinol. 2021, 533, 111339. [Google Scholar] [CrossRef] [PubMed]
- Armstrong, A.R.; Laws, K.M.; Drummond-Barbosa, D. Adipocyte Amino Acid Sensing Controls Adult Germline Stem Cell Number via the Amino Acid Response Pathway and Independently of Target of Rapamycin Signaling in Drosophila. 2014. [Google Scholar] [CrossRef] [PubMed]
- Matsuoka, S.; Armstrong, A.R.; Sampson, L.L.; Laws, K.M.; Drummond-Barbosa, D. Adipocyte Metabolic Pathways Regulated by Diet Control the Female Germline Stem Cell Lineage in Drosophila Melanogaster. Genetics 2017, 206, 953–971. [Google Scholar] [CrossRef]
- Armstrong, A.R.; Drummond-Barbosa, D. Insulin Signaling Acts in Adult Adipocytes via GSK-3β and Independently of FOXO to Control Drosophila Female Germline Stem Cell Numbers. Dev. Biol. 2018, 440, 31–39. [Google Scholar] [CrossRef] [PubMed]
- Bradshaw, T.; Simmons, C.; Ott, R.K.; Armstrong, A.R. Ras/MAPK Signaling Mediates Adipose Tissue Control of Ovarian Germline Survival and Ovulation in Drosophila Melanogaster. Dev. Biol. 2024, 510, 17–28. [Google Scholar] [CrossRef] [PubMed]
- Grmai, L.; Michaca, M.; Lackner, E.; Nampoothiri V.P., N.; Vasudevan, D. Integrated Stress Response Signaling Acts as a Metabolic Sensor in Fat Tissues to Regulate Oocyte Maturation and Ovulation. Cell Rep. 2024, 43, 113863. [Google Scholar] [CrossRef]
- Weaver, L.N.; Drummond-Barbosa, D. Maintenance of Proper Germline Stem Cell Number Requires Adipocyte Collagen in Adult Drosophila Females. Genetics 2018, 209, 1155–1166. [Google Scholar] [CrossRef] [PubMed]
- Weaver, L.N.; Drummond-Barbosa, D. The Nuclear Receptor Seven up Functions in Adipocytes and Oenocytes to Control Distinct Steps of Drosophila Oogenesis. Dev. Biol. 2019, 456, 179–189. [Google Scholar] [CrossRef]
- Carrera, P.; Odenthal, J.; Risse, K.S.; Jung, Y.; Kuerschner, L.; Bülow, M.H. The CD36 Scavenger Receptor Bez Regulates Lipid Redistribution from Fat Body to Ovaries in Drosophila. Development 2024, 151. [Google Scholar] [CrossRef]
- Wieschaus, E.; Szabad, J. The Development and Function of the Female Germ Line in Drosophila Melanogaster: A Cell Lineage Study. Dev. Biol. 1979, 68. [Google Scholar] [CrossRef] [PubMed]
- Lin, H.; Spradling, A.C. Germline Stem Cell Division and Egg Chamber Development in Transplanted Drosophila Germaria. Dev. Biol. 1993, 159. [Google Scholar] [CrossRef]
- Coelho, M.; Oliveira, T.; Fernandes, R. Biochemistry of Adipose Tissue: An Endocrine Organ. Arch. Med. Sci. 2013, 9. [Google Scholar]
- Hotamisligil, G.S.; Shargill, N.S.; Spiegelman, B.M. Adipose Expression of Tumor Necrosis Factor-α: Direct Role in Obesity-Linked Insulin Resistance. Science (80-) 1993, 259. [Google Scholar] [CrossRef] [PubMed]
- Kawai, T.; Autieri, M.V.; Scalia, R. Inflammation: From Cellular Mechanisms to Immune Cell Education Adipose Tissue Inflammation and Metabolic Dysfunction in Obesity. Am. J. Physiol. 2020, 320. [Google Scholar] [CrossRef]
- Nijhout, H.F. The Control of Body Size in Insects. Dev. Biol. 2003, 261. [Google Scholar] [CrossRef] [PubMed]
- Colombani, J.; Bianchini, L.; Layalle, S.; Pondeville, E.; Dauphin-Villemant, C.; Antoniewski, C.; Carré, C.; Noselli, S.; Léopold, P. Antagonistic Actions of Ecdysone and Insulins Determine Final Size in Drosophila. Science (80-) 2005, 310. [Google Scholar] [CrossRef] [PubMed]
- Li, S.; Torre-Muruzabal, T.; Søgaard, K.C.; Ren, G.R.; Hauser, F.; Engelsen, S.M.; Pødenphanth, M.D.; Desjardins, A.; Grimmelikhuijzen, C.J.P. Expression Patterns of the Drosophila Neuropeptide CCHamide-2 and Its Receptor May Suggest Hormonal Signaling from the Gut to the Brain. PLoS One 2013, 8. [Google Scholar] [CrossRef] [PubMed]
- Fujiwara, Y.; Hermann-Luibl, C.; Katsura, M.; Sekiguchi, M.; Ida, T.; Helfrich-Förster, C.; Yoshii, T. The CCHamide1 Neuropeptide Expressed in the Anterior Dorsal Neuron 1 Conveys a Circadian Signal to the Ventral Lateral Neurons in Drosophila Melanogaster. Front. Physiol. 2018, 9. [Google Scholar] [CrossRef]
- Kuwano, R.; Katsura, M.; Iwata, M.; Yokosako, T.; Yoshii, T. Pigment-Dispersing Factor and CCHamide1 in the Drosophila Circadian Clock Network. Chronobiol. Int. 2023, 40. [Google Scholar] [CrossRef] [PubMed]
- Sano, H.; Nakamura, A.; Texada, M.J.; Truman, J.W.; Ishimoto, H.; Kamikouchi, A.; Nibu, Y.; Kume, K.; Ida, T.; Kojima, M. The Nutrient-Responsive Hormone CCHamide-2 Controls Growth by Regulating Insulin-like Peptides in the Brain of Drosophila Melanogaster. PLoS Genet. 2015, 11. [Google Scholar] [CrossRef]
- Agrawal, N.; Delanoue, R.; Mauri, A.; Basco, D.; Pasco, M.; Thorens, B.; Léopold, P. The Drosophila TNF Eiger Is an Adipokine That Acts on Insulin-Producing Cells to Mediate Nutrient Response. Cell Metab. 2016, 23, 675–684. [Google Scholar] [CrossRef] [PubMed]
- Loudhaief, R.; Jneid, R.; Christensen, C.F.; Mackay, D.J.; Andersen, D.S.; Colombani, J. The Drosophila Tumor Necrosis Factor Receptor, Wengen, Couples Energy Expenditure with Gut Immunity. Sci. Adv. 2023, 9. [Google Scholar] [CrossRef] [PubMed]
- Koyama, T.; Mirth, C.K. Growth-Blocking Peptides As Nutrition-Sensitive Signals for Insulin Secretion and Body Size Regulation. PLOS Biol. 2016, 14, e1002392. [Google Scholar] [CrossRef]
- Rajan, A.; Perrimon, N. Drosophila Cytokine Unpaired 2 Regulates Physiological Homeostasis by Remotely Controlling Insulin Secretion. Cell 2012, 151, 123–137. [Google Scholar] [CrossRef] [PubMed]
- Rajan, A.; Housden, B.E.; Wirtz-Peitz, F.; Holderbaum, L.; Perrimon, N. A Mechanism Coupling Systemic Energy Sensing to Adipokine Secretion. Dev. Cell 2017, 43, 83–98.e6. [Google Scholar] [CrossRef] [PubMed]
- Brent, A.E.; Rajan, A. Insulin and Leptin/Upd2 Exert Opposing Influences on Synapse Number in Fat-Sensing Neurons. Cell Metab. 2020, 32, 786–800.e7. [Google Scholar] [CrossRef]
- Flier, J.S.; Maratos-Flier, E. Leptin’s Physiologic Role: Does the Emperor of Energy Balance Have No Clothes? Cell Metab. 2017, 26. [Google Scholar] [CrossRef] [PubMed]
- Abuhattum, S.; Kotzbeck, P.; Schlüßler, R.; Harger, A.; Ariza de Schellenberger, A.; Kim, K.; Escolano, J.C.; Müller, T.; Braun, J.; Wabitsch, M.; et al. Adipose Cells and Tissues Soften with Lipid Accumulation While in Diabetes Adipose Tissue Stiffens. Sci. Rep. 2022, 12. [Google Scholar] [CrossRef] [PubMed]
- Pathak, H.; Varghese, J. Edem1 Activity in the Fat Body Regulates Insulin Signalling and Metabolic Homeostasis in Drosophila. Life Sci. Alliance 2021, 4. [Google Scholar] [CrossRef]
- Ott, R.K.; Williams, I.H.; Armstrong, A.R. Improved Whole-Mount Immunofluorescence Protocol for Consistent and Robust Labeling of Adult Drosophila Melanogaster Adipose Tissue. Biol. Open 2024, 13. [Google Scholar] [CrossRef]
- DiAngelo, J.R.; Birnbaum, M.J. Regulation of Fat Cell Mass by Insulin in Drosophila Melanogaster. Mol. Cell. Biol. 2009, 29, 6341–6352. [Google Scholar] [CrossRef] [PubMed]
- Drummond-Barbosa, D.; Spradling, A.C. Stem Cells and Their Progeny Respond to Nutritional Changes during Drosophila Oogenesis. Dev. Biol. 2001, 231, 265–278. [Google Scholar] [CrossRef]
- Droujinine, I.A.; Meyer, A.S.; Wang, D.; Udeshi, N.D.; Hu, Y.; Rocco, D.; McMahon, J.A.; Yang, R.; Guo, J.J.; Mu, L.; et al. Proteomics of Protein Trafficking by in Vivo Tissue-Specific Labeling. Nat. Commun. 2021, 12. [Google Scholar] [CrossRef] [PubMed]
- Nunes, R.D.; Drummond-Barbosa, D. A High-Sugar Diet, but Not Obesity, Reduces Female Fertility in Drosophila Melanogaster. Dev. 2023, 150. [Google Scholar] [CrossRef] [PubMed]
- Efeyan, A.; Comb, W.C.; Sabatini, D.M. Nutrient-Sensing Mechanisms and Pathways. Nature 2015, 517, 302–310. [Google Scholar] [CrossRef]
- Tang, J.X.; Chen, D.; Deng, S.L.; Li, J.; Li, Y.; Fu, Z.; Wang, X.X.; Zhang, Y.; Chen, S.R.; Liu, Y.X. CRISPR/Cas9-Mediated Genome Editing Induces Gene Knockdown by Altering the Pre-MRNA Splicing in Mice. BMC Biotechnol. 2018, 18. [Google Scholar] [CrossRef] [PubMed]
Figure 1.
RNAi-mediated knockdown of adipokines expressed in adult adipocytes. (A) RT-PCR analysis of larval adipokine expression in adult female fat bodies (MW = molecular weight ladder; tubulin used as a loading control). (B-F) qRT-PCR analysis of mRNA expression in fat body tissue from females with RNAi-mediated knockdown of CCHa1 (B), CCHa2 (C), egr (D), Gbp3 (E), and upd2 (F) compared to an RFP-RNAi control (Ctrl). Data shown as mean ± SEM. *p < 0.05, **p < 0.01, ***p < 0.001, ****p < 0.0001 Student’s, two-tailed t-test.
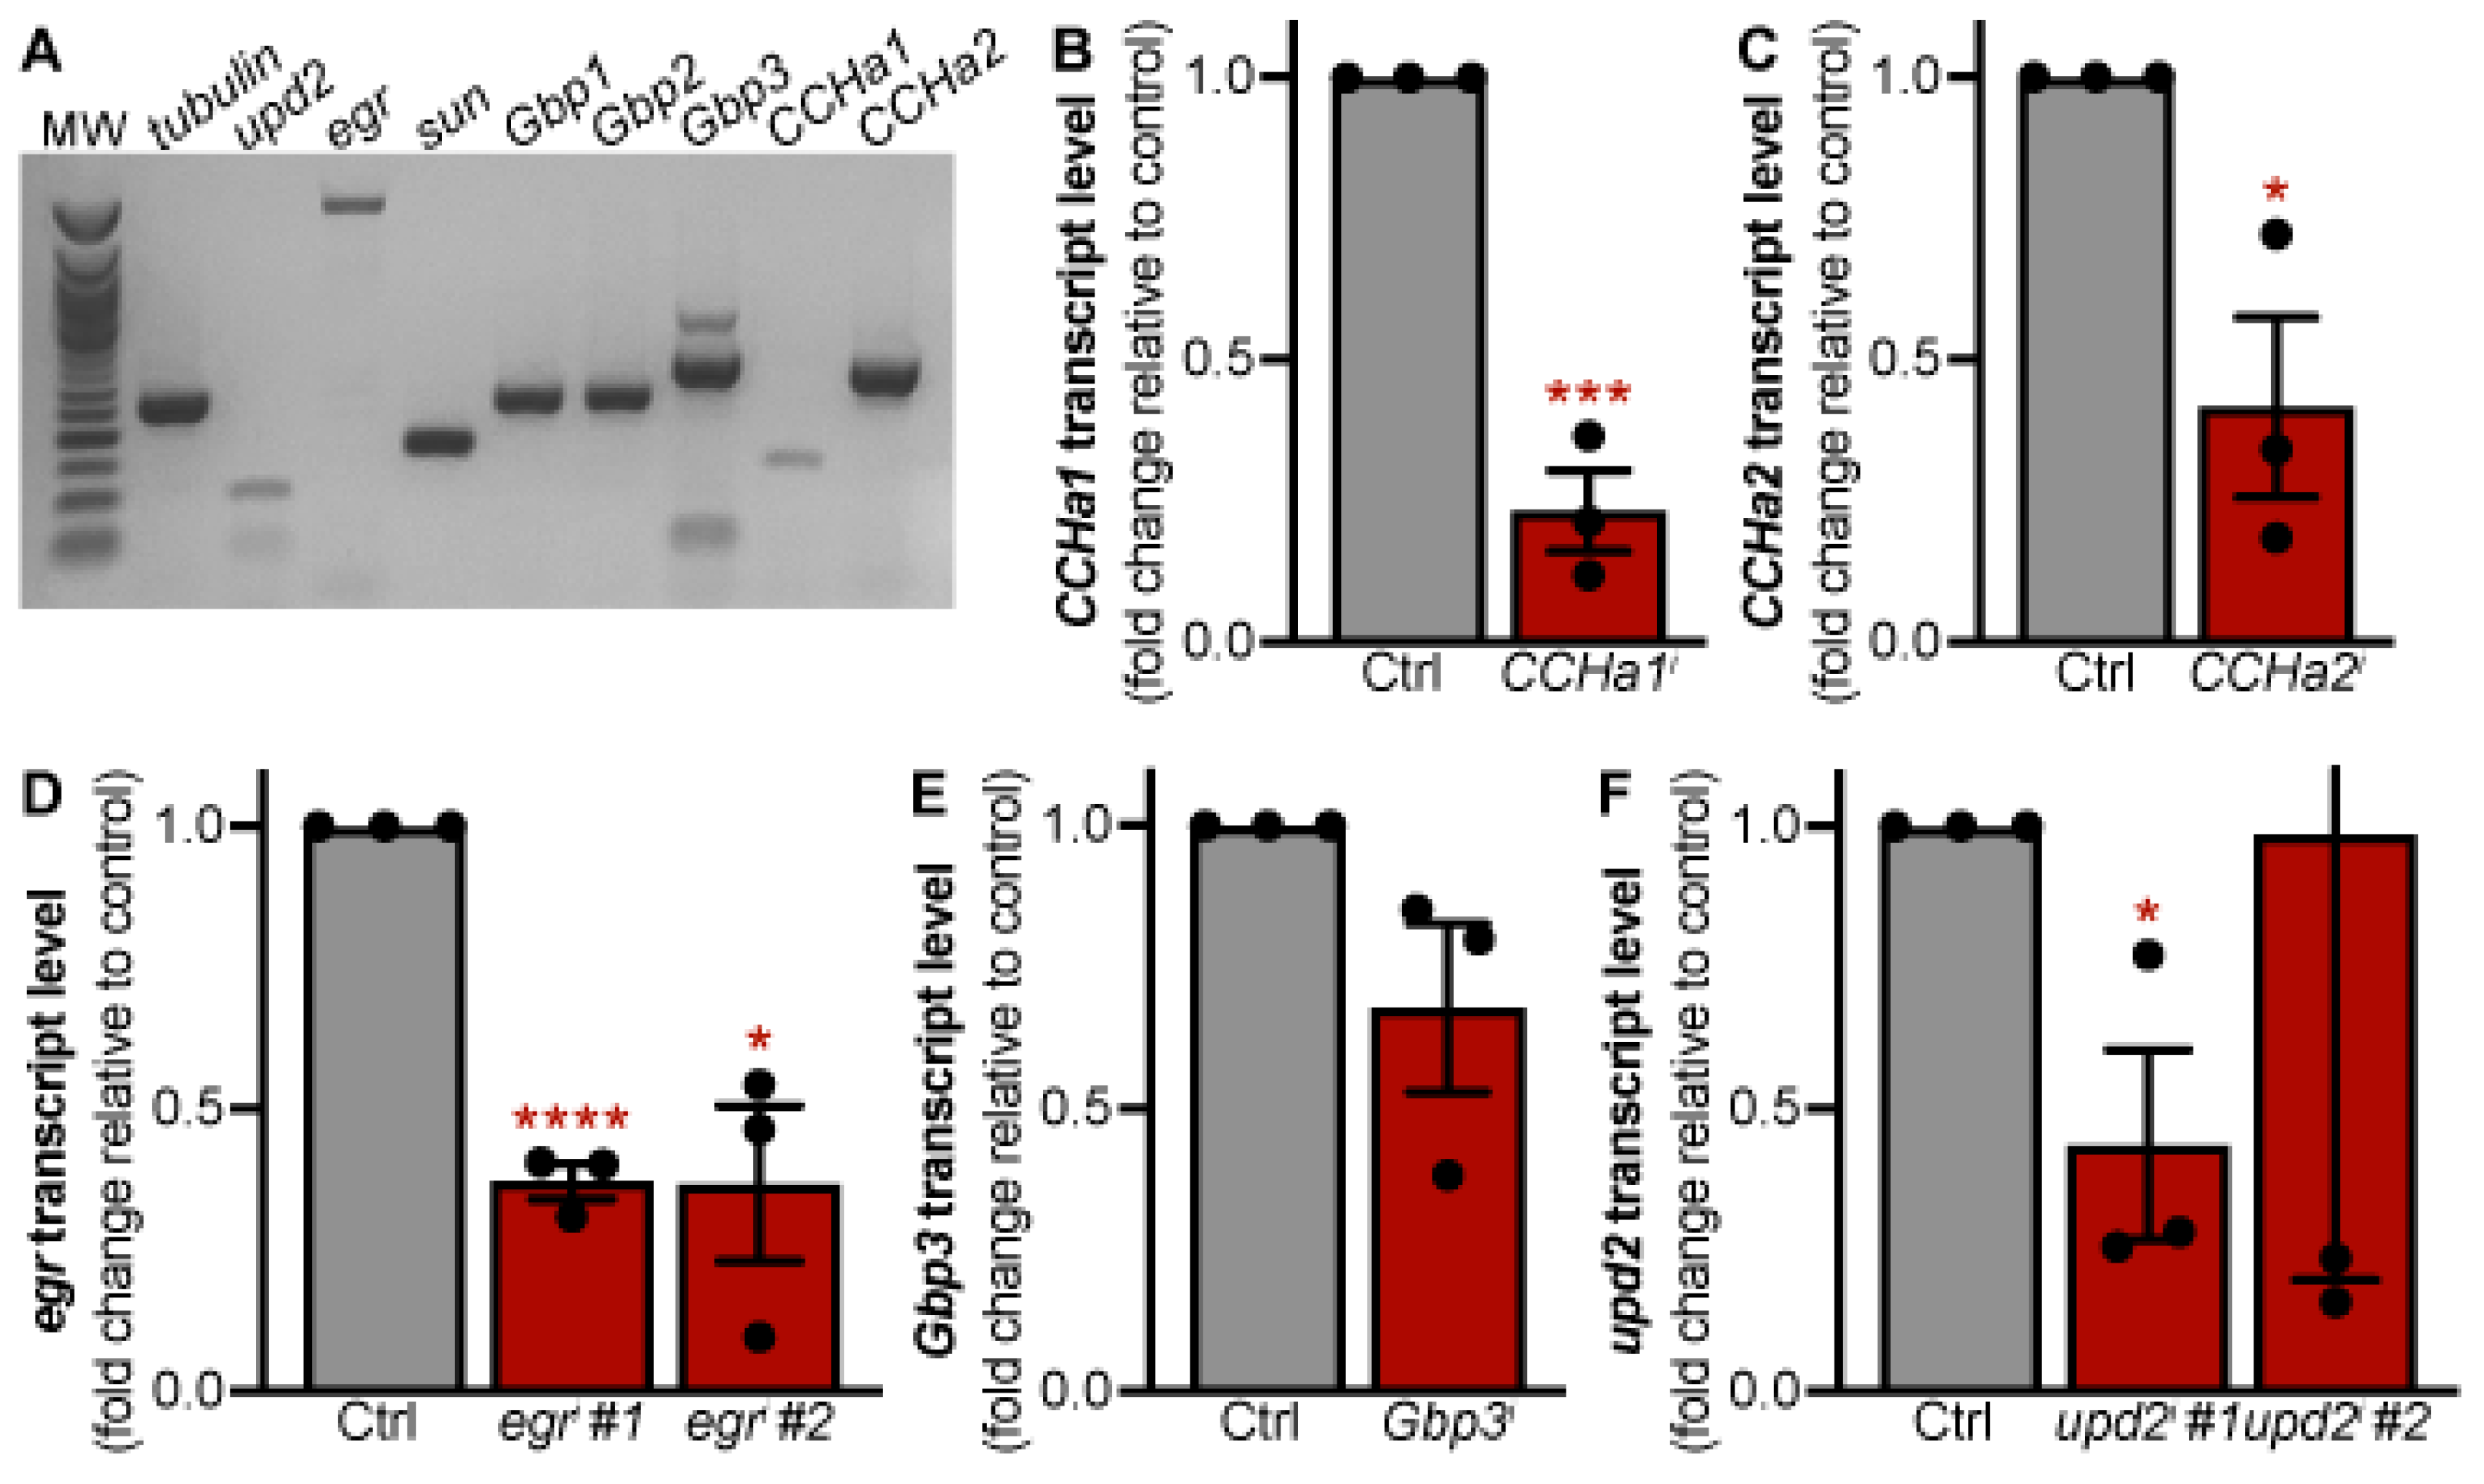
Figure 2.
CCHa1, CCHa2, egr, Gbp3, and upd2 control lipid storage but not adipocyte size. (A) Representative image of adipocytes from females labeled with alpha spectrin (magenta, cell membranes), BODIPY (yellow, lipid droplets), and DAPI (cyan, nuclei). (B) The percentage of adipocytes within small (100-400 bin), medium (500-1000), and large (greater than 1100) size bins measured in arbitrary units. Total number of adipocytes measured per sample indicated at the bottom of each bar. Error bars represent the SEM across biological replicates for each bin. No statistical significance observed between the controls and target knockdown sample bins as assessed via ordinary one-way ANOVA with multiple comparisons (each knockdown condition compared to control). (C) The percentage of lipid droplets within very small (less than 10), small (10-20), medium (30-50), large (60-90), and very large (greater than 100) size bins measured in arbitrary units. Error bars represent the SEM across biological replicates for each bin. No statistical significance observed between the controls and target knockdown sample bins as assessed via ordinary one-way ANOVA with multiple comparisons (each knockdown condition compared to control). (D) Fold change triglyceride to protein ratio relative to control for each adipokine knockdown from five biological replicates (individual data points). Data represented as mean ± SEM. *p < 0.05, **p < 0.01, Student’s two-tailed t-test.
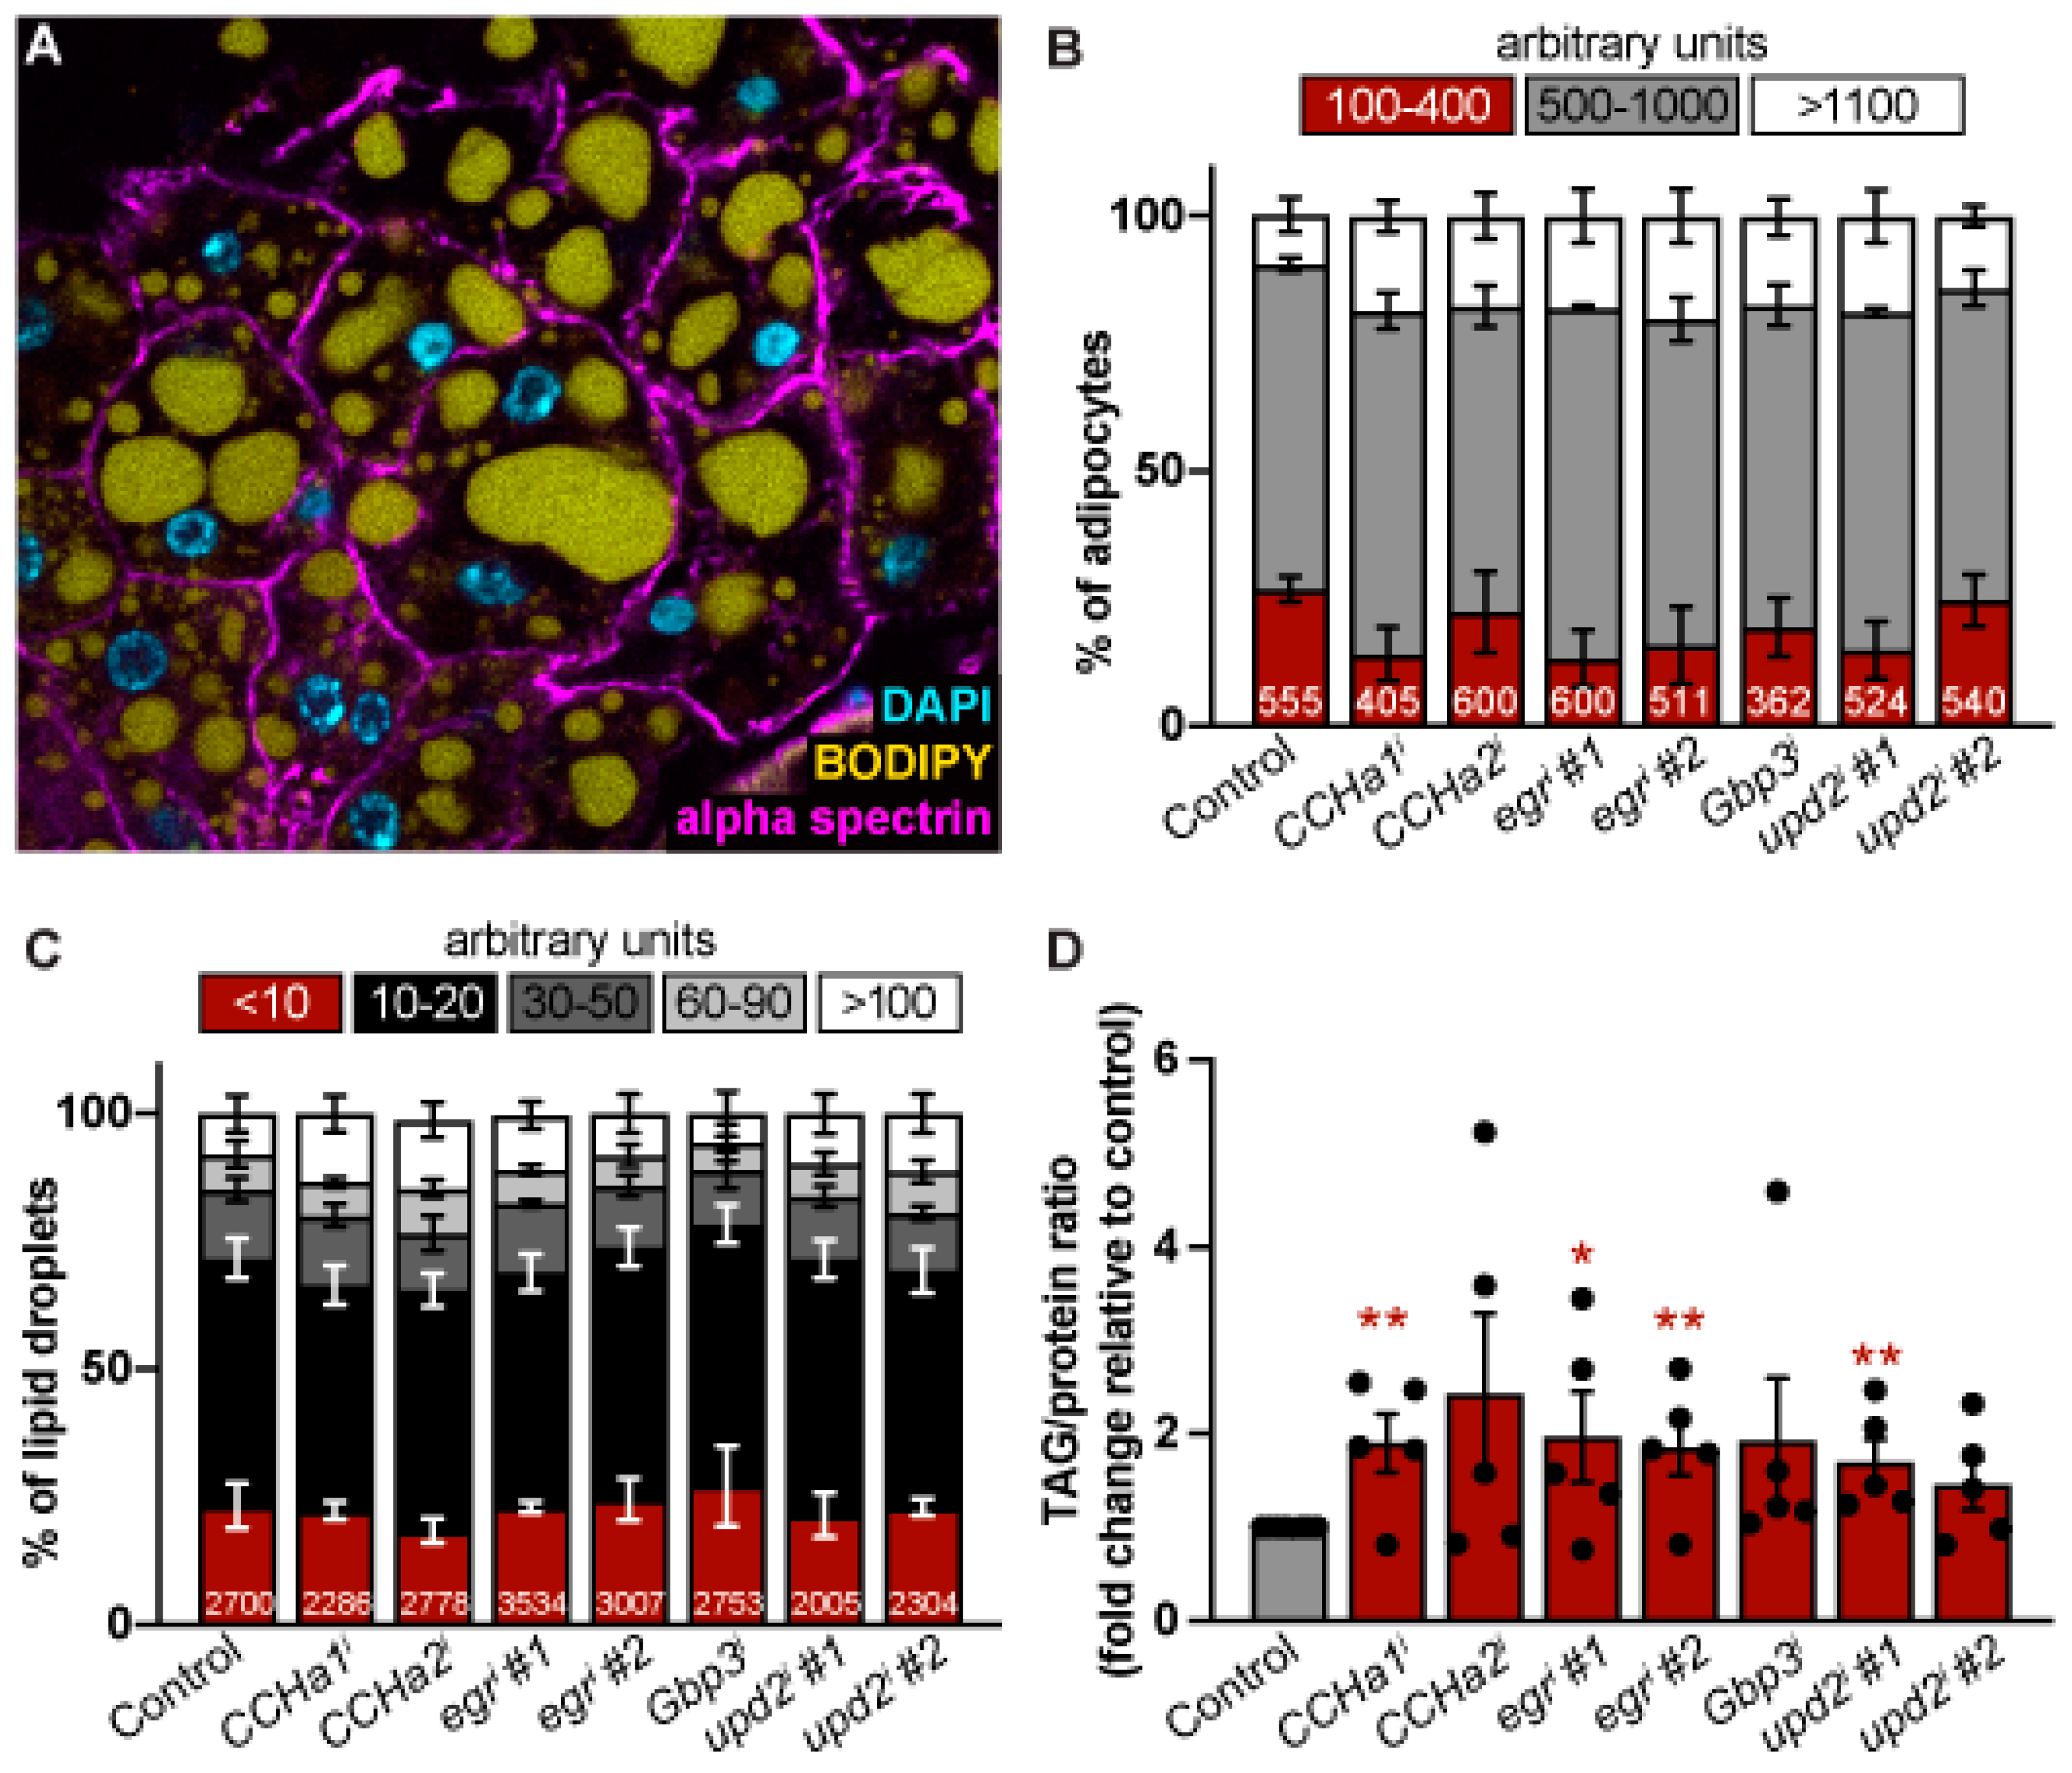
Figure 3.
Adult adipocyte-specific knockdown of CCHa1, CCHa2, egr, Gbp3, and upd2 does not affect ovarian GSC number. The average number of GSCs were counted in ovaries from the control group and from adipocyte-specific RNAi groups CCHa1i and CCHa2i (A), egri (B), Gbp3i (C), and upd2i (D). Data represented as mean ± SEM for two to seven biological replicates. The total number of germaria counted for 0 and 10 days of transgene expression are given in Table S7. No statistically significant differences in GSC number were observed using two-way ANOVA with interaction.
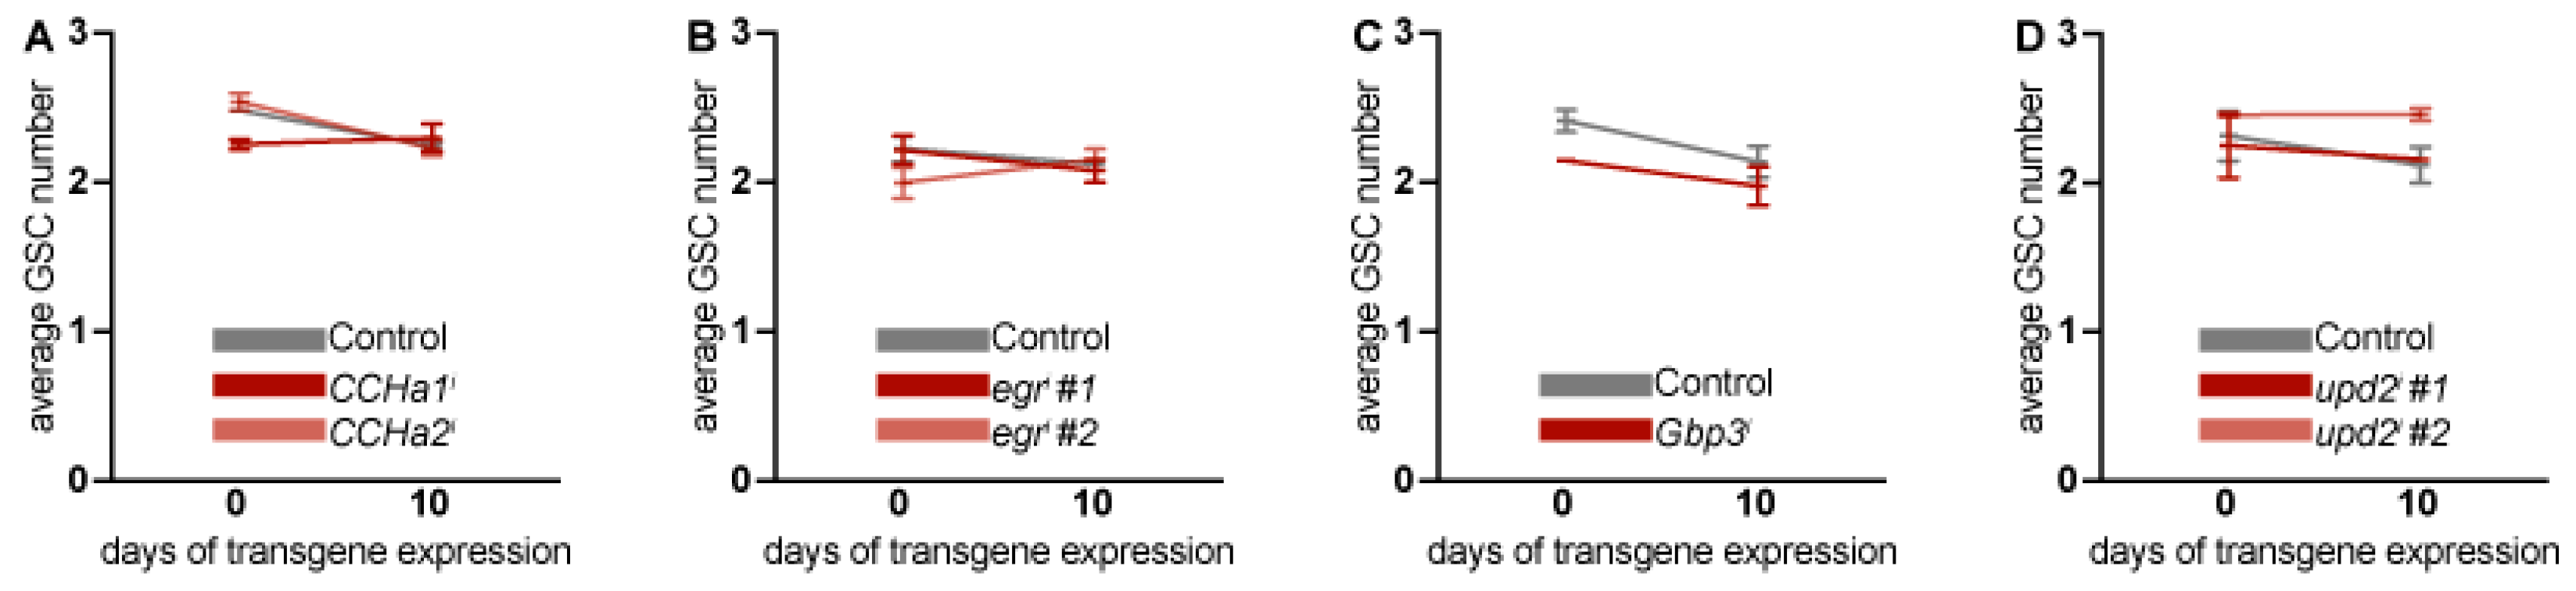
Figure 4.
Adipocyte-derived CCHa1, egr, and upd2 promote germline survival at nutritional checkpoints. (A) Percentage of germaria with Dcp-1 immunoreactivity in the germline after 10 days of adipokine knockdown. The total number of germaria analyzed over four independent trials indicated at the bottom of each bar. Data shown as mean ± SEM. *p < 0.05, Student’s two-tailed t-test (B) Percentage of ovarioles with dying vitellogenic follicles based on Dcp-1 positive immunoreactivity after 10 days of adipokine knockdown. The number of ovarioles examined over five independent trials are shown at the bottom of each bar. Data shown as mean ± SEM. *p < 0.05, **p < 0.01, Student’s two-tailed t-test.
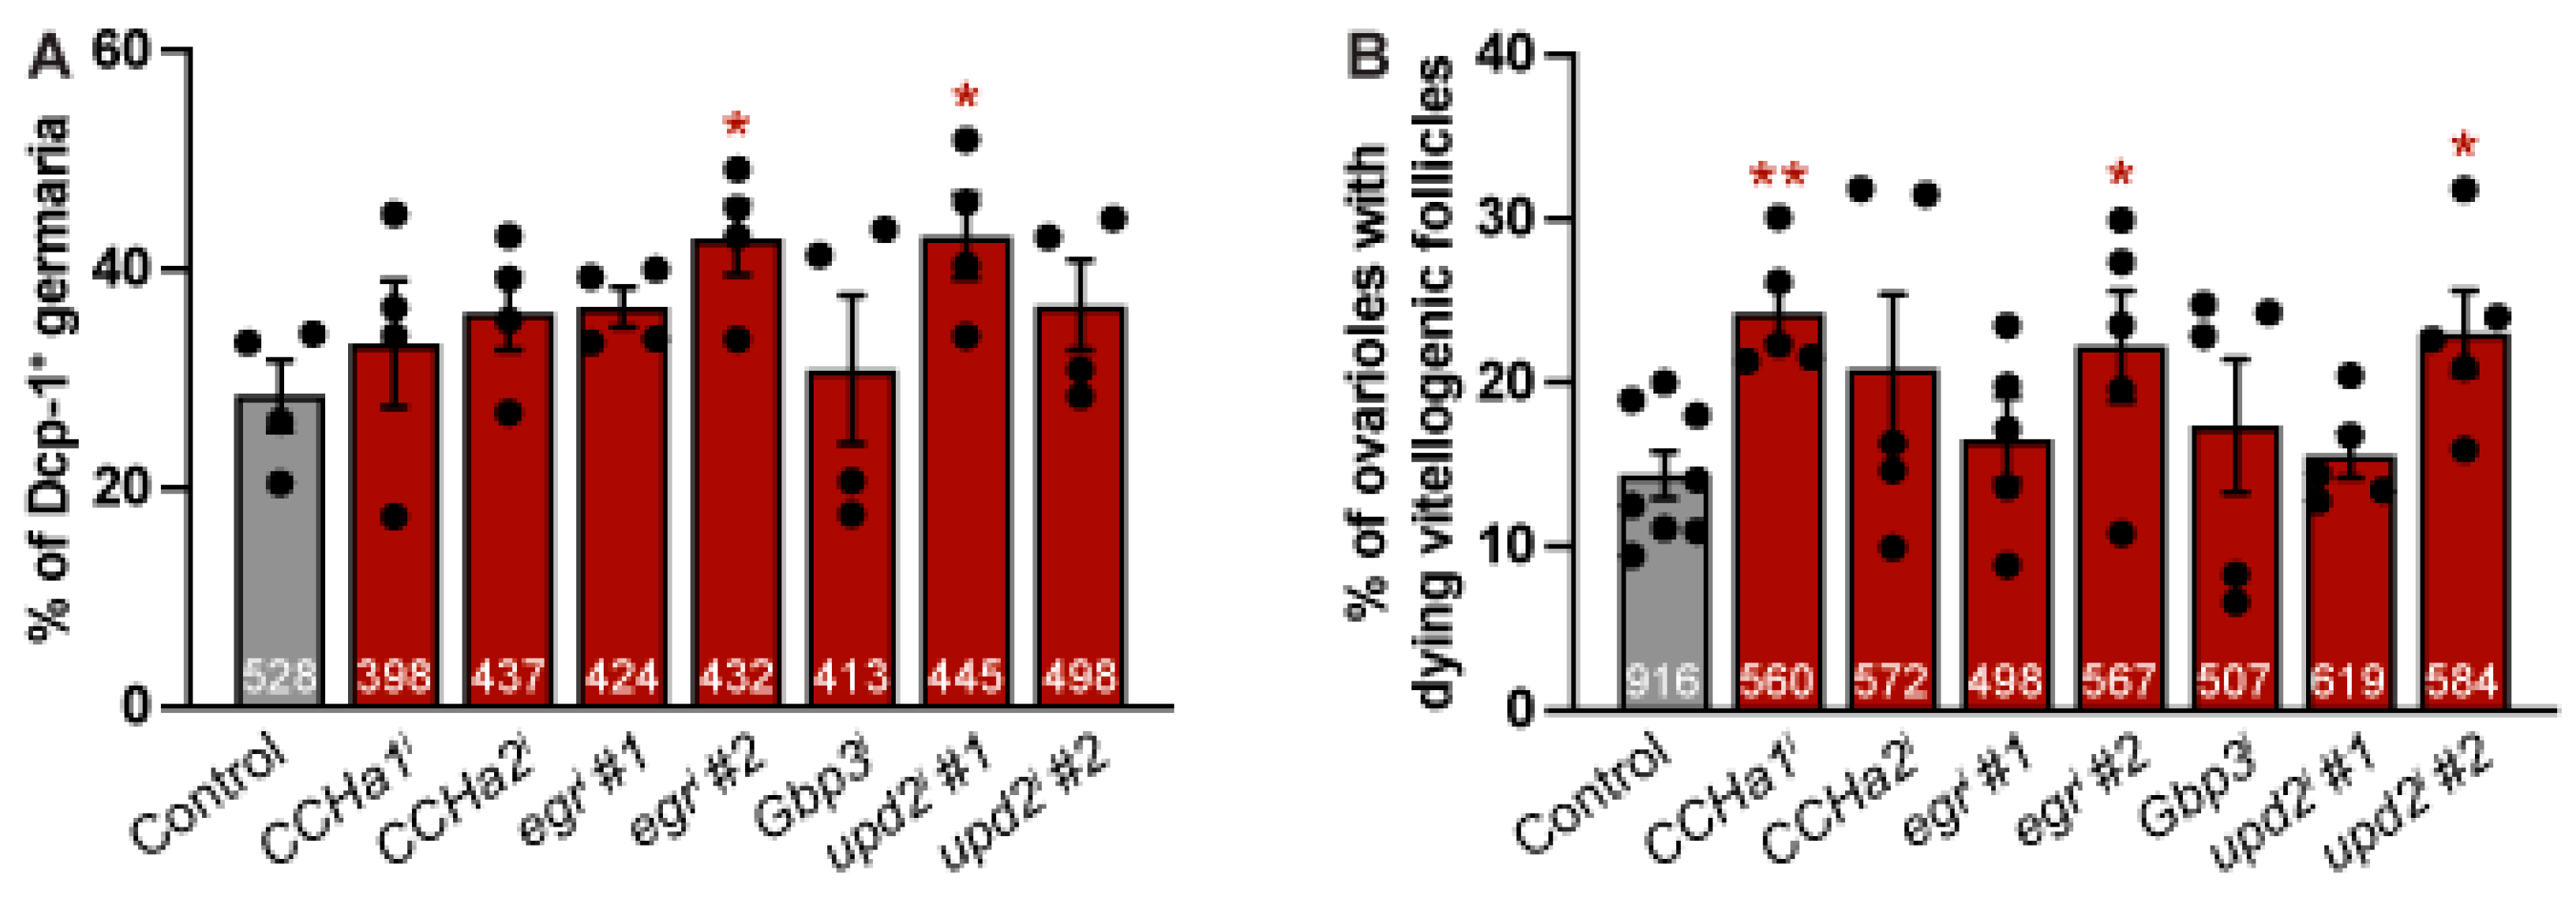
Figure 5.
Gbp3 in adipocytes promotes ovulation. (A-B’) Representative stereomicroscope images of ovaries from controls (A) and Gbp3 knockdown (B) females. (B’) Region highlighted by the dotted outline in B blown up, labeling two oocytes (asterisks) in one ovariole and their corresponding dorsal appendages (arrowheads). (C) Percentage of ovaries showing blocked ovulation. The total number of ovarioles counted over three biological replicates indicated inside each bar. Data shown as mean ± SEM. *p < 0.05, Student’s two-tailed t-test.
Disclaimer/Publisher’s Note: The statements, opinions and data contained in all publications are solely those of the individual author(s) and contributor(s) and not of MDPI and/or the editor(s). MDPI and/or the editor(s) disclaim responsibility for any injury to people or property resulting from any ideas, methods, instructions or products referred to in the content. |
© 2025 by the authors. Licensee MDPI, Basel, Switzerland. This article is an open access article distributed under the terms and conditions of the Creative Commons Attribution (CC BY) license (http://creativecommons.org/licenses/by/4.0/).
Copyright: This open access article is published under a Creative Commons CC BY 4.0 license, which permit the free download, distribution, and reuse, provided that the author and preprint are cited in any reuse.


