Submitted:
24 January 2025
Posted:
25 January 2025
You are already at the latest version
Abstract
Grapevine downy mildew, caused by Plasmopara viticola, is one of the most destructive vineyard diseases worldwide, with the potential to devastate up to 90% of harvests under adverse conditions. Traditional chemical-based control strategies are increasingly restricted due to environmental concerns and the development of resistant pathogen strains, prompting the search for sustainable alternatives. This study evaluated the efficacy of two yeast-based biostimulants (YE1 and YE2) in mitigating P. viticola infections in Vitis vinifera cv Cabernet Sauvignon under open field conditions. Field trials were designed to monitor the effects of these bioproducts on grapevine metabolism, with a focus on the biosynthesis of phenolic compounds linked to plant defense responses. Both biostimulants demonstrated significant efficacy against downy mildew, achieving protection levels above 93% during critical growth stages. Metabolic analyses of leaves revealed distinct impacts of YE1 and YE2 on secondary metabolite dynamics. YE1 primarily stimulated the accumulation of flavonols, such as quercetin glycosides and kaempferol glucoside, which contribute to pathogen resistance through antimicrobial activity and ROS detoxification. In contrast, YE2 enhanced the biosynthesis of caftaric and coutaric acids, known for their antioxidant and antimicrobial properties. The stilbene piceid was also induced at early stages by treatments, indicating its role in enhancing plant defenses. The results suggest that these yeast-based bioproducts act as elicitors, effectively enhancing grapevine immunity and reducing reliance on synthetic inputs. This study provides novel insights into the metabolic mechanisms underlying the efficacy of yeast-based biostimulants against downy mildew and offers practical guidance for their strategic application.
Keywords:
Grapevine
; Plasmopara viticola
; yeast-based biostimulants
; caftaric and cumaric acids
; flavonoids
; stilbenes
1. Introduction
Grapevine downy mildew, caused by the pathogen Plasmopara viticola, [(Berk. Et Curt.) Berlese and De Toni] represents one of the most devastating diseases of vineyards worlwide and can destroy up to 90% of harvests [1] in adverse environmental conditions, with significant economic losses.
Traditional management strategies for downy mildew rely on chemical fungicides, even if their wide application has negative environmental impacts and can contribute to the development of resistant strains. In this regard, the European Union has restricted the use of chemicals, pushing researchers and companies to develop new sustainable strategies to contrast P. viticola [2,3,4].
Biostimulants are a group of substances or microorganisms that can be applied to plants or to the surrounding environment to stimulate physiological processes, enhancing growth, crop productivity, nutrient use efficiency, stress tolerance, and sustainability in agricultural practices. These compounds differ from fertilizers and pesticides as they do not directly provide essential nutrients or control pests and diseases but activate plant natural defenses to biotic and abiotic stresses [5,6,7,8,9].
Yeast-based biostimulants have been demonstrated to be effective against different plant diseases and are commercialized as resistance inducers in the context of sustainable agriculture [2,10,11,12,13,14]. The mechanisms of yeasts as plant-protection agents include the production of volatile compounds, killer toxins, and lytic enzymes, competitions for space and nutrients, mycoparasitism, and induction of plant immunity, by triggering complex signaling cascades that result in the activation of complementary defense pathways and Induced Systemic Resistance (ISR) [15,16,17,18].
A commercial yeast-based biostimulant effective against grape fungal pathogens is represented by Cerevisane®, which is composed of cell walls of S. cerevisiae strain LAS117 [19,20]. Cerevisane® has been proved to contrast downy mildew artificial inoculation, in a controlled environment, behaving like MAMPs (Microbe-Associated Molecular Patterns), molecules present on the surface of pathogens that are recognized by plant receptors and plant basal resistance [21], as it triggers the expression of genes and pathways implicated in the resistance response to fungi and other stresses in transcriptomic analyses. In more details, Cerevisane® activates the expression of genes implicated in the metabolism of salicylic acid (SA), jasmonate (JA), and ethylene (ET), the biosynthesis of defense compounds, including pathogenesis-related proteins (PRs), phenylalanine ammonia-lyase, stilbenes, lipoxygenase, LRR (leucine-rich repeat receptor) kinases, signal transduction protein kinases, and ROS (reactive oxygen species) scavenging enzymes, and the production of secondary metabolites like phenylpropanoids, terpenoids, and lignin. In addition, it also induces the expression of genes implicated in photosynthetic processes [22]. Despite these promising findings, there is still a need for comprehensive investigations to elucidate the mechanisms underlying the effect of yeast-based formulations on grapevine resistance to downy mildew, particularly in open fields.
In the present work, field experimentations have been conducted to monitor the efficacy of yeast-based biostimulants in contrasting P. viticola infection on cv Cabernet Sauvignon. To this aim, the effect on plant metabolism and on the biosynthesis of the secondary metabolites implicated in defense response, like phenolic compounds, has been evaluated assessing leaves chemical composition.
The results represent new insights for the understanding of the specific interactions between yeast-based biostimulants, grapevine, and the pathogen in open fields, providing new valuable basis for the development of targeted and sustainable management strategies to mitigate the impact of downy mildew in vineyards.
2. Materials and Methods
2.1. Plant Materials and Experimental Design
Field trials were conducted on fifteen years old plants of Vitis vinifera cv Cabernet Sauvignon, susceptible to P. viticola [23], grown in the experimental vineyard at Research Centre for Viticulture and Enology, Arezzo, Italy (coordinates N43°28’43.863’’; E11°49’18.967’’).
Vines were placed in two rows, each measuring 100 meters in length, and were trained on a vertical shoot positioning trellis system with spur-pruning. The vines were planted with a spacing of 0.9 by 3 meters.
A completely randomized experimental design was employed, with four biological replicates, each comprising six plants, per treatment.
Seasonal weather trends have been recorded by a meteorological station (Metos, Pessl instruments ltd., Austria), located in close proximity to the vineyard.
The meteorological data, combined with phenotypic growth stage information, were elaborated by the decision support system (DSS) Vite.net (Horta s.r.l., Italy) to predict primary and secondary infection incidences during the growing season (Figure 1).
The treatments consisted in two yeast derivative-based preparations: YE1, an experimental formulation provided by Enologica Vason (Italy), and YE2, Romeo, a commercial preparation containing Cerevisane® (Syngenta, Switzerland). Untreated control (NT) was included in the evaluation. Table 1 outlines the three treatments applied.
The products were applied to the aerial parts of the plants using a backpack sprayer pump (WJR 2525, Honda, Japan) at a rate ranging from 6 to 10 hL/ha, depending on the developmental stages to prevent dripping.
During the period not included in the experimentation, the defence protocol involved the application of sulfur (Thiopron, UPL Italia srl, Italy) and copper oxide (Rame Caffaro Blu WG, Sumitomo Chemical Italia srl, Italy), according to DSS disease alerts.
To ensure a significant pathogen pressure, the first treatment with biostimulants was performed after several primary infections as indicated by the DSS [24].
In 2019, three treatments have been conducted every seven days from fruit setting. In the subsequent weeks, the climate remained hot and dry, preventing new infections and no further treatment was necessary.
In 2020, favorable weather conditions, during the first stages of plant development, facilitated the onset of early primary P. viticola infections. Starting from the end of May, seven treatments have been performed, with intervals ranging from 7 to 10 days (Table 2).
2.2. Phenological and Phytopathological Evaluations
Phenological phases have been evaluated according to BBCH scale [25]. Each phase has been assigned when at least 50% of plants showed the same phenological phase (Table 3).
Overall, the data indicate that the entire phenological cycle of the grapevine in 2020 was consistently earlier than in 2019. This trend suggests a shift towards earlier development stages, which could be attributed to different climatic conditions. Notably, 2020 was characterized by a relatively warm and dry spring, which likely contributed to the accelerated phenological development.
For each repetition, P. viticola infections have been weekly evaluated from the first grapevine developmental phases on 100 randomly selected, from the whole canopy, clusters and leaves to determine the following indices:
1. Intensity: index scale from 0 to 5 according to Townsend-Heuberger formula [26].
2. Diffusion: percentage of affected organs.
3. Efficiency of the product: according to Abbott’s formula [27].
The observations have been conducted during all phenological phases.
2.3. Chemical Composition of Leaves
Chemical analyses were conducted on 15 leaves, selected from between the 4th and 7th internodes of each of the four replicates, one week after each treatment, when the highest display of defense responses have been reported [22,28]. Two g of tissue were collected from each leaf sample using a round hole punch. Leaf discs were added to 25 mL of a methanol and water solution (80:20) and homogenized with an ULTRA-TURRAX® disperser (IKA-Werke GmbH & Co. KG, Germany). After 30 minutes on an orbital shaker, samples were centrifuged, and the supernatants were poured into a 50 mL volumetric flask. The pellets were resuspended in 25 mL of the methanolic solution for a second extraction. After pooling the supernatants, the final volume was adjusted to 50 mL. Twenty mL of the extract were vacuum dried in a rotary evaporator at 35 °C and reconstituted in 2 mL of a solution of methanol and formic acid (97:3). After filtration (0.45 µm), the samples were analyzed by an Agilent HPLC-DAD (Agilent Technologies, USA) consisting of: autosampler Series 1260, quaternary pump Series 1100, thermostat for column Serie 1100, solvent degasser Serie 1100, and diode array detector (DAD) Series 1200. The separation was performed using a Luna® Omega 5 µm Polar C18 Column (Phenomenex, Torrance, CA, USA). Injection volume was 20 µL and the compounds have been separated using two elution solutions: El. A, including water and acetic acid (98:2), and El. B, consisting of acetonitrile and acetic acid (98:2). The solutions have been mixed during the run according to the scheme reported in Table 4.
Chromatograms have been recorded at 280 nm for flavanols, 320 nm for hydroxy cinnamyl tartaric acids and stilbenes, while 360 nm for flavonols.
Commercial standards of phenolic compounds (Extrasynthese, Genay, France) were used as references to calculate individual retention times and to recognize absorption spectra and contents.
2.4. Statistical Analyses
Statistical analyses and graphic design of leaf chemical composition were performed using the Tidyverse R package [29]. One-way ANOVA was applied to evaluate the effects of treatments during sampling. Fisher test was utilized to check for significant differences between means, with a confidence level of 95%. One-way ANOVA was applied to evaluate the efficacy of biostimulants on preventing downy mildew symptoms. Duncan’s multiple range test was used to rank the samples based on the mean values of the chemical analyses, with a 95% confidence level.
3. Results
3.1. Effects of Treatments Against P. viticola
In 2019, the P. viticola attacks were scarce (Figure 1), and only three treatments have been conducted from the second decade of June, when the evolution of epidemic conditions was more favorable (Table 2).
P. viticola symptoms emerged after fruit setting, 4 days after Tr3 (Treatment 3). The presence of infection was recorded only in untreated plants, with intensity and diffusion of 3.5% and 7.8%, respectively on leaves, and 8.3% and 15%, respectively on clusters (Table 5).
No further infections occurred until harvest.
In 2020, predictive models indicated limited primary infections and development of secondary infections during a small period from the end of Spring to the beginning of Summer (Figure 1): in general, the first symptoms appeared after May 23rd with higher values of intensity and diffusion, in comparison to 2019. Slight infection was observed at Tr3 (12/06), with intensity of 2.0% and 2.6% in leaves and clusters, respectively. The intensity and diffusion index increased in mid-July (16/07, after Tr6), reaching 21% intensity and 35.5% diffusion for leaves, and 12.8% intensity and 23% diffusion for clusters (Table 6).
In both years, all treatments effectively controlled the disease, achieving 100% efficacy in both leaves and clusters in 2019 and during the initial evaluation in 2020. However, across the experiment in 2020, efficacy reached 97.9% for YE1 and 98.6% for YE2 in leaves, and from 94.9% for YE1 and 95.3% for YE2 in clusters, during the second survey. In August, after veraison, efficacy ranged from 93.7% for (YE1) and 94.2% for YE2 (Table 6).
3.2. Leaves Chemical Composition
3.2.1. Hydroxycinnamoyl Tartaric Acids: Caftaric Acid and Coutaric Acid
Caftaric acid is the most abundant hydroxy-cinnamyl tartaric acid in the tested leaves. In 2019, YE2 induced the accumulation of this compound over time, with the most significant differences between treatments occurring after Tr3, when YE2 leaves stood out for their high concentration (1675 µg/g). In 2020, the concentration of caftaric acid doubled during the observation period, reaching an average of 2,078 µg/g. However, no differences attributable to the different treatments emerged between the trials (Figure 2).
In 2019, the mean concentration of coutaric acid, the second most abundant hydroxy cinnamyl tartaric acid in V. vinifera leaves, reached its highest value at Tr2, with the highest levels for NT (131 µg/g) and YE2 (125 µg/g). After Tr3, coutaric acid concentration unvaried under YE2, while the amounts dropped for the other treatments (YE1: 79 µg/g; NT: 87 µg/g). As observed for caftaric acid, in 2020, almost double concentrations of coutaric acid were observed at Tr7 (average, 159 µg/g), compared to the initial treatment (average, 76 µg/g), with no differences attributable to the application of the different compounds (Figure 3).
3.2.2. Flavonoids
Flavonols are the most abundant class of phenolic compounds in V. vinifera leaves. Together with caftaric acid, quercetin glycosides showed the highest concentrations. In 2019, the amount of quercetin glycosides slightly increased during the experimental time, and higher concentrations were detected in YE1 (7,609 µg/g) leaves at Tr1 and in YE2 (8,654 µg/g) at Tr3. In 2020, quercetin concentration grew rapidly and, at Tr7, leaves from YE1 reached the highest content (10,843 µg/g; Figure 4).
In 2019, the concentration of kaempferol 3-glucoside unvaried throughout the whole experimental time, although significant differences between treatments were observed at Tr1 and Tr2. Specifically, YE1 exhibited the highest concentrations (141 µg/g) at Tr1, while untreated samples displayed the lowest contents (110 µg/g) at Tr2. At the final assessment, all samples converged to a similar kaempferol concentration (96 µg/g).
An increasing trend during time has been observed in 2020, with higher accumulation in YE1 (403 µg/g) samples at Tr7, in comparison to the other samples (Figure 5).
Among flavans, catechin and epicatechin were detected in leaf extracts. Even if the concentration of catechin was unaffected by treatments, two distinct trends emerged: in 2019, the mean catechin content decreased from 299 µg/g to 121 µg/g over the experimental time; while, in 2020, catechin content remained stable between Tr2 and Tr5 (average, 272 µg/g), while increased to higher levels (average, 343 µg/g) at Tr7 (Figure 6).
In 2019, the average content of epicatechin, which was significantly lower than catechin, unvaried over time (Figure 7), with NT showing the highest average levels at Tr2 (16 µg/g) and Tr3 (15 µg/g), while the lowest content was observed for YE1 at Tr2 (10 µg/g). In 2020, epicatechin concentrations were very similar in the first two sampling time. Analyses conducted at Tr7 revealed an increase in leaves. No significant differences were observed among samples in the first two sampling time-points. However, at Tr7, the YE2 leaf treatment stood out for lower concentrations (51 µg/g), while NT and YE2 had a similar content (~75 µg/g) (Figure 7).
3.2.3. Stilbenes
In 2019, the highest average piceid concentration was observed after Tr1, with YE1 and YE2 showing the highest levels (Figure 8).
Subsequently, piceid content decreased in all the trials. However, at Tr3, YE1 maintained a higher level of resveratrol glucoside, in comparison to the other samples.
In 2020, the accumulation of resveratrol glucoside exhibited a consistent and gradual trend after Tr5. As for 2019, YE2 leaves showed the highest concentrations in the first two time-points and subsequently decreased to the lowest values in Tr7. As for YE1, piceid accumulation remained constant and gradual throughout the experimental time. Noteworthy, differences were observed at Tr7 when NT leaves exhibited concentrations of piceid double than the ones recorded for the other trials (Figure 8).
4. Discussion
Biostimulants based on microbial extracts have been demonstrated to act as Plant Resistance Inducers (PRIs), triggering the cross talk of the two defense pathways SAR (Systemic Acquired Resistance) and ISR (Induced Systemic Resistance) [30,31]. Among these compounds, yeast derivatives are effective against pathogens in different species like barley, wheat, citrus, and tomatoes [32,33,34]. In grapevine, Cerevisane© reduces downy mildew symptoms by stimulating both SA and JA/ET signaling pathways in controlled and field conditions, respectively for cvs Italia [22] and Barbera [28]. However, the response of grapevines to biostimulants, including yeast-based compounds, can be influenced by specific genetic backgrounds which may have distinct physiological traits that can affect the beneficial effects of these compounds [9]. Noteworthily, the impact of biostimulants on plant physiology and metabolism must be considered when planning treatments to limit metabolic costs, as the shift of primed state of defense is stimulate when plants are challenged by pathogens, at the expense of growth and production [35,36].
In this study, a customized treatment system for cv Cabernet sauvignon has been implemented in field trials. Two distinct Saccharomyces cerevisiae-based bioproducts, YE1 and YE2, were utilized, and the treatment arrangements were based on predictive models of P. viticola infection.
Overall, YE1 and YE2 demonstrated significant effectiveness against downy mildew, ensuring comprehensive protection for both leaves and clusters in the two years under consideration. The results agree with the effects of Cerevisane© in reducing the symptoms of artificial inoculation of downy mildew on cv Italia, in controlled conditions [22].
In 2020, despite maintaining high defense across all treatments, a decrease in the elicitor activity of biostimulants was observed during maturation phases. This is likely attributed to the sources of variability in the defense status of vines at the time of treatments and the virulence of P. viticola in field conditions. In natural environments, different biotic and abiotic stresses can affect the efficacies of biostimulants [37]. However, even during ripening, the efficacy level did not drop below 93.7%, providing robust evidence supporting the effectiveness of the treatments in preventing downy mildew infection. From this perspective, the present results further confirm the efficacy of yeast-based biocompounds in countering the attack of natural P. viticola populations in vineyards.
The effect of YE1 and YE2 has been explored at metabolic level on leaf extracts. Interesting findings emerged regarding the average content of phenolic compounds and their evolution over time. The variations in the chemical composition of leaves during the experimental time, regardless of the treatments, agree with literature results on the dynamic nature of phenolic compounds during plant development [38,39]: quercetin and piceid increased over time, catechin showed descending trends, while coutaric acid and kaempferol glucoside reached a maximum before returning to initial values. On the other hand, the amounts of epicatechin and caftaric acid unvaried across the whole experiment. The protocols developed in this study were able to modify these general dynamics, even if interpretation of the results is challenging due to limited relevant literature. In general, the protective action of YE2 might be explain by its specific activation of the biosynthesis of caftaric and coutaric acids, compounds with known antioxidant and antimicrobial effects [40,41]. This is consistent with findings in other grapevine varieties for which these compounds are stimulated under pathogen attacks: cv Alvarinho challenged by esca disease and cvs Tempranillo and Tempranillo blanc challenged by E. nectator [42,43].
Differentially from YE2, YE1 likely acts against P. viticola by activating the accumulation of the flavonols quercetin glycosides and kaempferol glucoside. Such compounds are potent antimicrobial agents against a wide range of pathogens including downy mildew [42,43,44] and act by taking part to ROS detoxification [45] and cell wall reinforcement after pathogen attacks [46].
Stilbenes, known for their antimicrobial and antioxidant properties, are synthesized as part of plant defense response against pathogen attacks and environmental stressors [47]. They also contribute to the basal defense against downy mildew [48]. In 2019, piceid levels increased following treatments, with significant differences observed, particularly at Tr1 for YE1. A similar trend was noted in 2020. This suggests that the positive effects of treatments in enhancing defenses against downy mildew are likely linked to the activity of these compounds. However, over time stilbenes levels increased markedly in NT compared to both YE1 and YE2. This may indicate that, after the treatments, the plants reached a natural state of reduced sensitivity, increasing their resistance to potential attacks. Similar activation of genes involved in stilbenoid biosynthesis has been reported in the leaves of mycorrhized Vitis vinifera cultivars Chasselas and Pinot Noir, as well as in the interspecific hybrid Divico infected with P. viticola and Botrytis cinerea [49]. This suggests that our yeast-based bioproducts act as elicitors, similarly to mycorrhizae, by potentiating plant defense responses.
Based on epidemic development models and results from both field and laboratory experiments, it is plausible to attribute a role in vine defense to the used yeast-based treatments, underlying their preventive use as valuable measures to contrast downy mildew attack in open fields.
5. Conclusions
This study represents the first example of establishing tailored, time- and cost-effective approaches to combat natural populations of downy mildew in field conditions. These approaches minimize metabolic energy waste for plants and highlight the distinct metabolic effects of two yeast-based bioproducts in protecting grapevines from Plasmopara viticola in open fields. The analysis of leaf extracts offers valuable insights into the biochemical processes involved in phenolic compound synthesis in grapevines, providing further evidence of their role in tissue maturation.
Our results offer practical guidance on the use of YE1 and YE2 to enhance grapevine defences in open fields. The protocols implemented in this study successfully influenced the dynamics of defence compounds. When integrating epidemic development models with the results from both field and laboratory experiments, it is possible to attribute an effect on plant defences to the biostimulants used. This supports their strategic preventive application before a potential downy mildew attack. Specifically, YE1 could be effectively employed during the early stages of growth, up until flowering, with weekly treatments to establish robust plant defences prior to a downy mildew outbreak.
Notably, the use of these biostimulants allowed for an adequate level of disease control, reducing the reliance on synthetic substances or copper. In 2019, three treatments replaced synthetic inputs; while in 2020, seven treatments achieved similar results, significantly lowering chemical input use.
In summary, this study provides valuable insights into the effects of yeast-based biostimulants on the biosynthesis of defence compounds, offering practical recommendations for vine growers to design tailored strategies for managing downy mildew in open fields. However, only a subset of secondary metabolites was examined. Additional experiments are needed to enlarge the characterization of the impact of these biostimulants on the entire secondary metabolism of grapevines, thus providing broader information for practical vineyard management applications.
Author Contributions
Conceptualization, M.E.M.D., S.P., and C.B.; Methodology, M.E.M.D. and S.P.; Investigation, M.E.M.D. and S.P.; Data Curation, M.E.M.D., S.P., and C.B.; Writing – Original Draft Preparation, S.P. and C.B.; Review, R.P.; Writing – Review & Editing, G.Z.; Supervision, M.E.M.D.; Project Administration, M.E.M.D.; Funding Acquisition, M.E.M.D. All authors have read and agreed to the published version of the manuscript.
Funding
This research was financed by private funding by Enologica Vason s.p.a.
Conflicts of Interest
The authors declare no conflict of interest. The funders had no role in the design of the study; in the collection, analyses, or interpretation of data; in the writing of the manuscript; or in the decision to publish the results.
Abbreviations
The following abbreviations are used in this manuscript:
| DAD | diode array detector |
| DSS | decision support system |
| ET | ethylene |
| JA | jasmonate |
| LRR | leucine-rich repeat receptor |
| MAMPs | Microbe-Associated Molecular Patterns |
| NT | untreated control |
| PRs | pathogenesis-related proteins |
| ROS | reactive oxygen species |
| SA | salicylic acid |
| Tr | treatment |
| YE1 | Treatment with yeast-based biostimulant 1 – Yeast derivative |
| YE2 | Treatment with yeast-based biostimulant 2 – Romeo |
References
- Toffolatti, S.L.; Russo, G.; Campia, P.; Bianco, P.A. , Borsa, P. ; Coatti, M.; et al. A time-course investigation of resistance to the carboxylic acid amide mandipropamid in field populations of Plasmopara viticola treated with anti-resistance strategies. Pest Manag. Sci. 2018, 74, 2822–2834. [Google Scholar] [CrossRef]
- Reglinski, T.; Lyon, G.D.; Newton, A.C. Induction of resistance mechanisms in barley by yeast-derived elicitors. Ann. Appl. Biol. /: 509-517. https, 1111. [Google Scholar]
- Bahuguna, A.; Sharma, S.; Rai, A.; Bhardwaj, R.; Sahoo, S.K.; Pandey, A.; Yadav, B. Advance technology for biostimulants in agriculture. In: New and Future Developments in Microbial Biotechnology and Bioengineering. Elsevier, 2022, 17, 393-412. [CrossRef]
- Koledenkova, K.; Esmaeel, Q.; Jacquard, C.; Nowak, J.; Clément, C.; Ait Barka, E. Plasmopara viticola the Causal Agent of Downy Mildew of Grapevine: From Its Taxonomy to Disease Management. Front. Microbiol. 2022, 13, 889472. [Google Scholar] [CrossRef]
- Ricci, M.; Tilbury, L.; Daridon, B.; Sukalac, K. General Principles to Justify Plant Biostimulant Claims. Front. Plant Sci. 2019, 10, 494. [Google Scholar] [CrossRef]
- Hamid, B.; Zaman, M.; Farooq, S.; Fatima, S.; Sayyed, R.Z.; Baba, Z.A.; Sheikh, T.A.; Reddy, M.S.; El Enshasy, H.; Gafur, A.; et al. Bacterial Plant Biostimulants: A Sustainable Way towards Improving Growth; Productivity; and Health of Crops. Sustainability 2021, 13, 2856. [Google Scholar] [CrossRef]
- Cataldo, E.; Fucile, M.; Mattii, G.B. Biostimulants in Viticulture: A Sustainable Approach against Biotic and Abiotic Stresses. Plants. [CrossRef]
- Jindo, K.; Goron, T.L.; Pizarro-Tobías, P.; Sánchez-Monedero, M.Á.; Audette, Y.; Deolu-Ajayi, A.O.; van der Werf, A.; Goitom Teklu, M.; Shenker, M.; Pombo Sudré, C.; Busato, J.G.; Ochoa-Hueso, R.; Nocentini, M.; Rippen, J.; Aroca, R.; Mesa, S.; Delgado, M.J.; Tortosa, G. Application of biostimulant products and biological control agents in sustainable viticulture: A review. Front. Plant Sci. 2022, 13, 932311. [Google Scholar] [CrossRef] [PubMed]
- Monteiro, E.; Gonçalves, B.; Cortez, I.; Castro, I. The Role of Biostimulants as Alleviators of Biotic and Abiotic Stresses in Grapevine: A Review. Plants 2022, 11, 396. [Google Scholar] [CrossRef]
- Reglinski, T.; Lyon, G.D.; Newton, A.C. The control of Botrytis cinerea and Rhizoctonia solani on lettuce using elicitors extracted from yeast cell walls. Z. Pflanzenk. Pflanzen. 1995, 102, 257–266. [Google Scholar]
- Suzuki, H.; Reddy, M.S.S.; Naoumkina, M.; Aziz, N.; May, G.D.; Huhman, D.V.; et al. Methyl jasmonate and yeast elicitor induce differential transcriptional and metabolic re-programming in cell suspension cultures of the model legume Medicago truncatula. Planta 2005, 220, 696–707. [Google Scholar] [CrossRef] [PubMed]
- Tumpa, F.H.; Khokon, M.A.R. Foliar Application of Chitosan and Yeast Elicitor Facilitate Reducing Incidence and Severity of Alternaria Leaf Blight of Tomato and Brinjal. Res. J. Plant Pathol. /: 4. http.
- Hussein, M.; Kamberoglu, M.A. The response to potato virus X infection of tomato plants treated with ISR2000. Eur. J. Plant. Pathol. /: 807–815. https, 1007. [Google Scholar]
- Shahzadi, A.; Tahir, N.; Usman, M.K.; Elabiyi, C.O.; Raza, A.; Ouedraogo, A. Protecting Plants from Disease and Increasing Their Yields Through the Use of Yeasts as a Biological Agent. Int. J. Res. Adv. Agri. Sci. /: 1-13. Retrieved from https.
- Moon, H.N.; Lee, G.Y.; Yun, H.S.; Kwon, C.A. Non-proteinaceous yeast derivaties induces Arabidopsis defense responses independently of salicylic acid. J. Plant Biol. 2015, 58, 38–43. [Google Scholar] [CrossRef]
- Narusaka, M.; Minami, T.; Iwabuchi, C.; Hamasaki, T.; Takasaki, S.; Kawamura, K.; Narusaka, Y. Yeast cell wall extract induces disease resistance against bacterial and fungal pathogens in Arabidopsis thaliana and Brassica crop. PLOS One. [CrossRef]
- Lee, G.; Lee, S.H.; Kim, K.M.; Ryu, C.M. Foliar application of the leaf colonizing yeast Pseudozyma churashimaensis elicits systemic defense of pepper against bacterial and viral pathogens. Scientific Rep. 2017, 7, 39432. [Google Scholar] [CrossRef] [PubMed]
- Kowalska, J.; Krzyminska, J.; Tyburski, J. Yeasts as a Potential Biological Agent in Plant Disease Protection and Yield Improvement—A Short Review. Agriculture 2022, 12, 1404. [Google Scholar] [CrossRef]
- Martin, A.; Farabullini, F.; Pizzi, M. ROMEO™, Cerevisane based product for control of the main pathologies of grapevine and other crops: main features and first experimental results. Acta Italus Hortus, /: 38–45. https.
- Zanzotto, A.; Morroni, M. Major biocontrol studies and measures against fungal and oomycete pathogens of grapevine. Biocontrol of major grapevine diseases: leading research, 1. [CrossRef]
- Bittel, P.; Robatzek, S. Microbe-associated molecular patterns (MAMPs) probe plant immunity. Curr. Opin. Plant Biol. 2007, 10(4), 335–341. [Google Scholar] [CrossRef]
- De Miccolis Angelini, R.M.; Rotolo, C.; Gerin, D.; Abate, D.; Pollastro, S.; Faretra, F. Global transcriptome analysis and differentially expressed genes in grapevine after application of the yeast-derived defense inducer cerevisane. Pest Manag. Sci. 2019, 2020–2033. [Google Scholar] [CrossRef]
- Boso, S.; Alonso-Villaverde, V.; Gago, P.; Santiago, J. L.; Martínez, M.C. Susceptibility to downy mildew (Plasmopara viticola) of different Vitis varieties. Crop Protection 2014, 63, 26–35. [Google Scholar] [CrossRef]
- Rossi, V.; Salinari, F.; Poni, S.; Caffi, T.; Bettati, T. Addressing the implementation problem in agricultural decision support systems: the example of vite.net®. Computer Agric. [CrossRef]
- Lorenz, D.H.; Eichhorn, K.W.; Bleiholder, H.; Klose, R.; Meier, U.; Weber, E. Phenological growth stages of the grapevine (Vitis vinifera L. ssp. vinifera)—Codes and descriptions according to the extended BBCH scale. Australian J. Grape Wine Res. [CrossRef]
- Townsend, G.R.; Heuberger, J.W. Methods for estimating losses caused by diseases in fungicide experiments. Plant Dis. Rep. 1943, 27, 340–343. [Google Scholar]
- Fleming, R.; Retnakaran, A. Evaluating Single Treatment Data Using Abbott’s Formula With Reference to Insecticides. J. Econ. Entomol. 1985, 78(6), 1179–1181. [Google Scholar] [CrossRef]
- Taibi, O.; Fedele, G.; Salotti, I.; Rossi, V. Infection risk-based application of plant resistance inducers for the control of downy and powdery mildews in vineyards. Agronomy, 2959. [Google Scholar] [CrossRef]
- Wickham, H.; Averick, M.; Bryan, J.; Chang, W.; McGowan, L.D.A.; François, R.; Garrett, G. , Hayes, A.; Henry, L.; Hester, J.; Kuhn, M.; Pedersen, T.L.; Miller, E.; Bache, S.M; Müller, K.; Ooms, J.; Robinson, D.; Seidel, D.P.; Spinu, V.; Takahashi, K.; Vaughan, D.; Wilke, C.; Woo, K.; Yutani, H. (2019). Welcome to the Tidyverse. J. Open Source Software, 2019, 4(43), 1686. [Google Scholar] [CrossRef]
- Gozzo, F.; Faoro, F. Systemic acquired resistance (50 years after discovery): moving from the lab to the field. J. Agri. Food Chem. 2013, 61(51), 12473–12491. [Google Scholar] [CrossRef] [PubMed]
- Pieterse, C.M.; Zamioudis, C.; Does der, D.V.; Van Wees, S.C. Signalling networks involved in induced resistance. Ind. Resistance Plant Def. [CrossRef]
- Steiner, U.; Schönbeck, F. Induced disease resistance in monocots. Ind. Resistance Dis. Plants. Developments in Plant Pathology, 86-110. [CrossRef]
- Bargmann, C.; Schönbeck, F. Acremonium kiliense as inducer of resistance to wilt diseases on tomatoes/Acremonium kiliense als Resistenzinduktor gegenüber Welkekrankheiten der Tomate. Zeitschrift für Pflanzenkrankheiten und Pflanzenschutz/Journal of Plant Diseases and Protection.
- Lopes, M.R.; Klein, M.N.; Ferraz, L.P.; da Silva, A.C.; Kupper, K.C. Saccharomyces cerevisiae: A novel and efficient biological control agent for Colletotrichum acutatum during pre-harvest, Microbiol. Res., 2015,175, 93-99. [CrossRef]
- Conrath, U.; Beckers, G.J.; Langenbach, C.J.; Jaskiewicz, M.R. Priming for enhanced defense. An. Rev. Phytopathol. [CrossRef]
- Nogueira Júnior, A.F.; Tränkner, M.; Ribeiro, R.V.; Von Tiedemann, A.; Amorim, L. Photosynthetic cost associated with induced defense to Plasmopara viticola in grapevine. Front. Plant Sci. [CrossRef]
- Delaunois, B.; Farace, G.; Jeandet, P.; Clément, C.; Baillieul, F.; Dorey, S.; Cordelier, S. Elicitors as alternative strategy to pesticides in grapevine? Current knowledge on their mode of action from controlled conditions to vineyard. Env. Sci. Pollution Res. 4837; 21. [Google Scholar] [CrossRef]
- Balasundram, N.; Sundram, K.; Samman, S. Phenolic compounds in plants and agri-industrial by-products: Antioxidant activity, occurrence, and potential uses. Food Chem. [CrossRef]
- Babenko, L.M.; Smirnov, O.E.; Romanenko, K.O.; Trunova, O.K.; Kosakivska, I.V. Phenolic compounds in plants: Biogenesis and functions. Ukr. Biochem. J. 2019, 91, 5–18. [Google Scholar] [CrossRef]
- Baiano, A.; Terracone, C. Varietal differences among the phenolic profiles and antioxidant activities of seven table grape cultivars grown in the south of Italy based on chemometrics. J. Agricult. Food Chem. 2011, 59(18), 9815–9826. [Google Scholar] [CrossRef]
- Sova, M. Antioxidant and antimicrobial activities of cinnamic acid derivatives. Mini Reviews in Medicinal Chemistry. [CrossRef]
- Lima, M.R.M.; Felgueiras, M.L.; Cunha, A.; Chicau, G.; Ferreres, F.; Dias, A.C.P. Differential phenolic production in leaves of Vitis vinifera cv Alvarinho affected with esca disease. Plant Physiol. Biochem. 2017, 112, 45–52. [Google Scholar] [CrossRef]
- del Mar Hernández, M.; Río, C.C.; Gonzálezb, S.I.B.; Menéndeza, C.M. Phenolic profile changes of grapevine leaves. Pest Manag. Sci. 2023, 1–7. [Google Scholar] [CrossRef]
- Dai, G.H.; Andary, C.; Mondolotcosson, L.; Boubals, D. Involvement of phenolic-compounds in the resistance of grapevine callus to downy mildew (Plasmopara-Viticola). Eur. J. Plant Pathol. 1995, 101, 541–547. [Google Scholar] [CrossRef]
- Shomali, A.; Das, S.; Arif, N.; Sarraf, M.; Zahra, N.; Yadav, V.; Aliniaeifard, S.; Chauhan, D.K.; Hasanuzzaman, M. Diverse Physiological Roles of Flavonoids in Plant Environmental Stress Responses and Tolerance. Plants 2022, 11, 3158. [Google Scholar] [CrossRef] [PubMed]
- Adrian, M.; Trouvelot, S.; Gamm, M.; Poinssot, B.; Héloir, M. C.; Daire, X. Activation of grapevine defense mechanisms: theoretical and applied approaches. Plant defence: biological control, 2012; 12. [Google Scholar] [CrossRef]
- Jeandet, P.; Delaunois, B.; Conreux, A.; Donnez, D.; Nuzzo, V.; Cordelier, S.; Clement, C.; Courot, E. Biosynthesis, metabolism, molecular engineering, and biological functions of stilbene phytoalexins in plants. Biofactors. [CrossRef]
- Ciaffi, M.; Paolacci, A.R.; Paolocci, M.; Alicandri, E.; Bigini, V.; Badiani, M.; Muganu, M. Transcriptional regulation of stilbene synthases in grapevine germplasm differentially susceptible to downy mildew. BMC Plant Biol. 19. [CrossRef]
- Bruisson, S.; Maillot, P.; Schellenbaum, P.; Walter, B.; Gindro, K.; Deglène-Benbrahim, L. Arbuscular mycorrhizal symbiosis stimulates key genes of the phenylpropanoid biosynthesis and stilbenoid production in grapevine leaves in response to downy mildew and grey mould infection. Phytochem., 2016, 131, 92–99. [Google Scholar] [CrossRef] [PubMed]
Figure 1.
Graphic representation of predictive models from Output DSS «vite.net®" of primary and secondary P. viticola infections across the two growth seasons considered. To define the epidemiological trend during each year, the parameters Germination, Release, Dispersion, Infection, and End of Incubation were considered for primary infection; to define the downy mildew risk in relation to secondary infections, the parameters Sporulation and Availability of sporangia were considered.
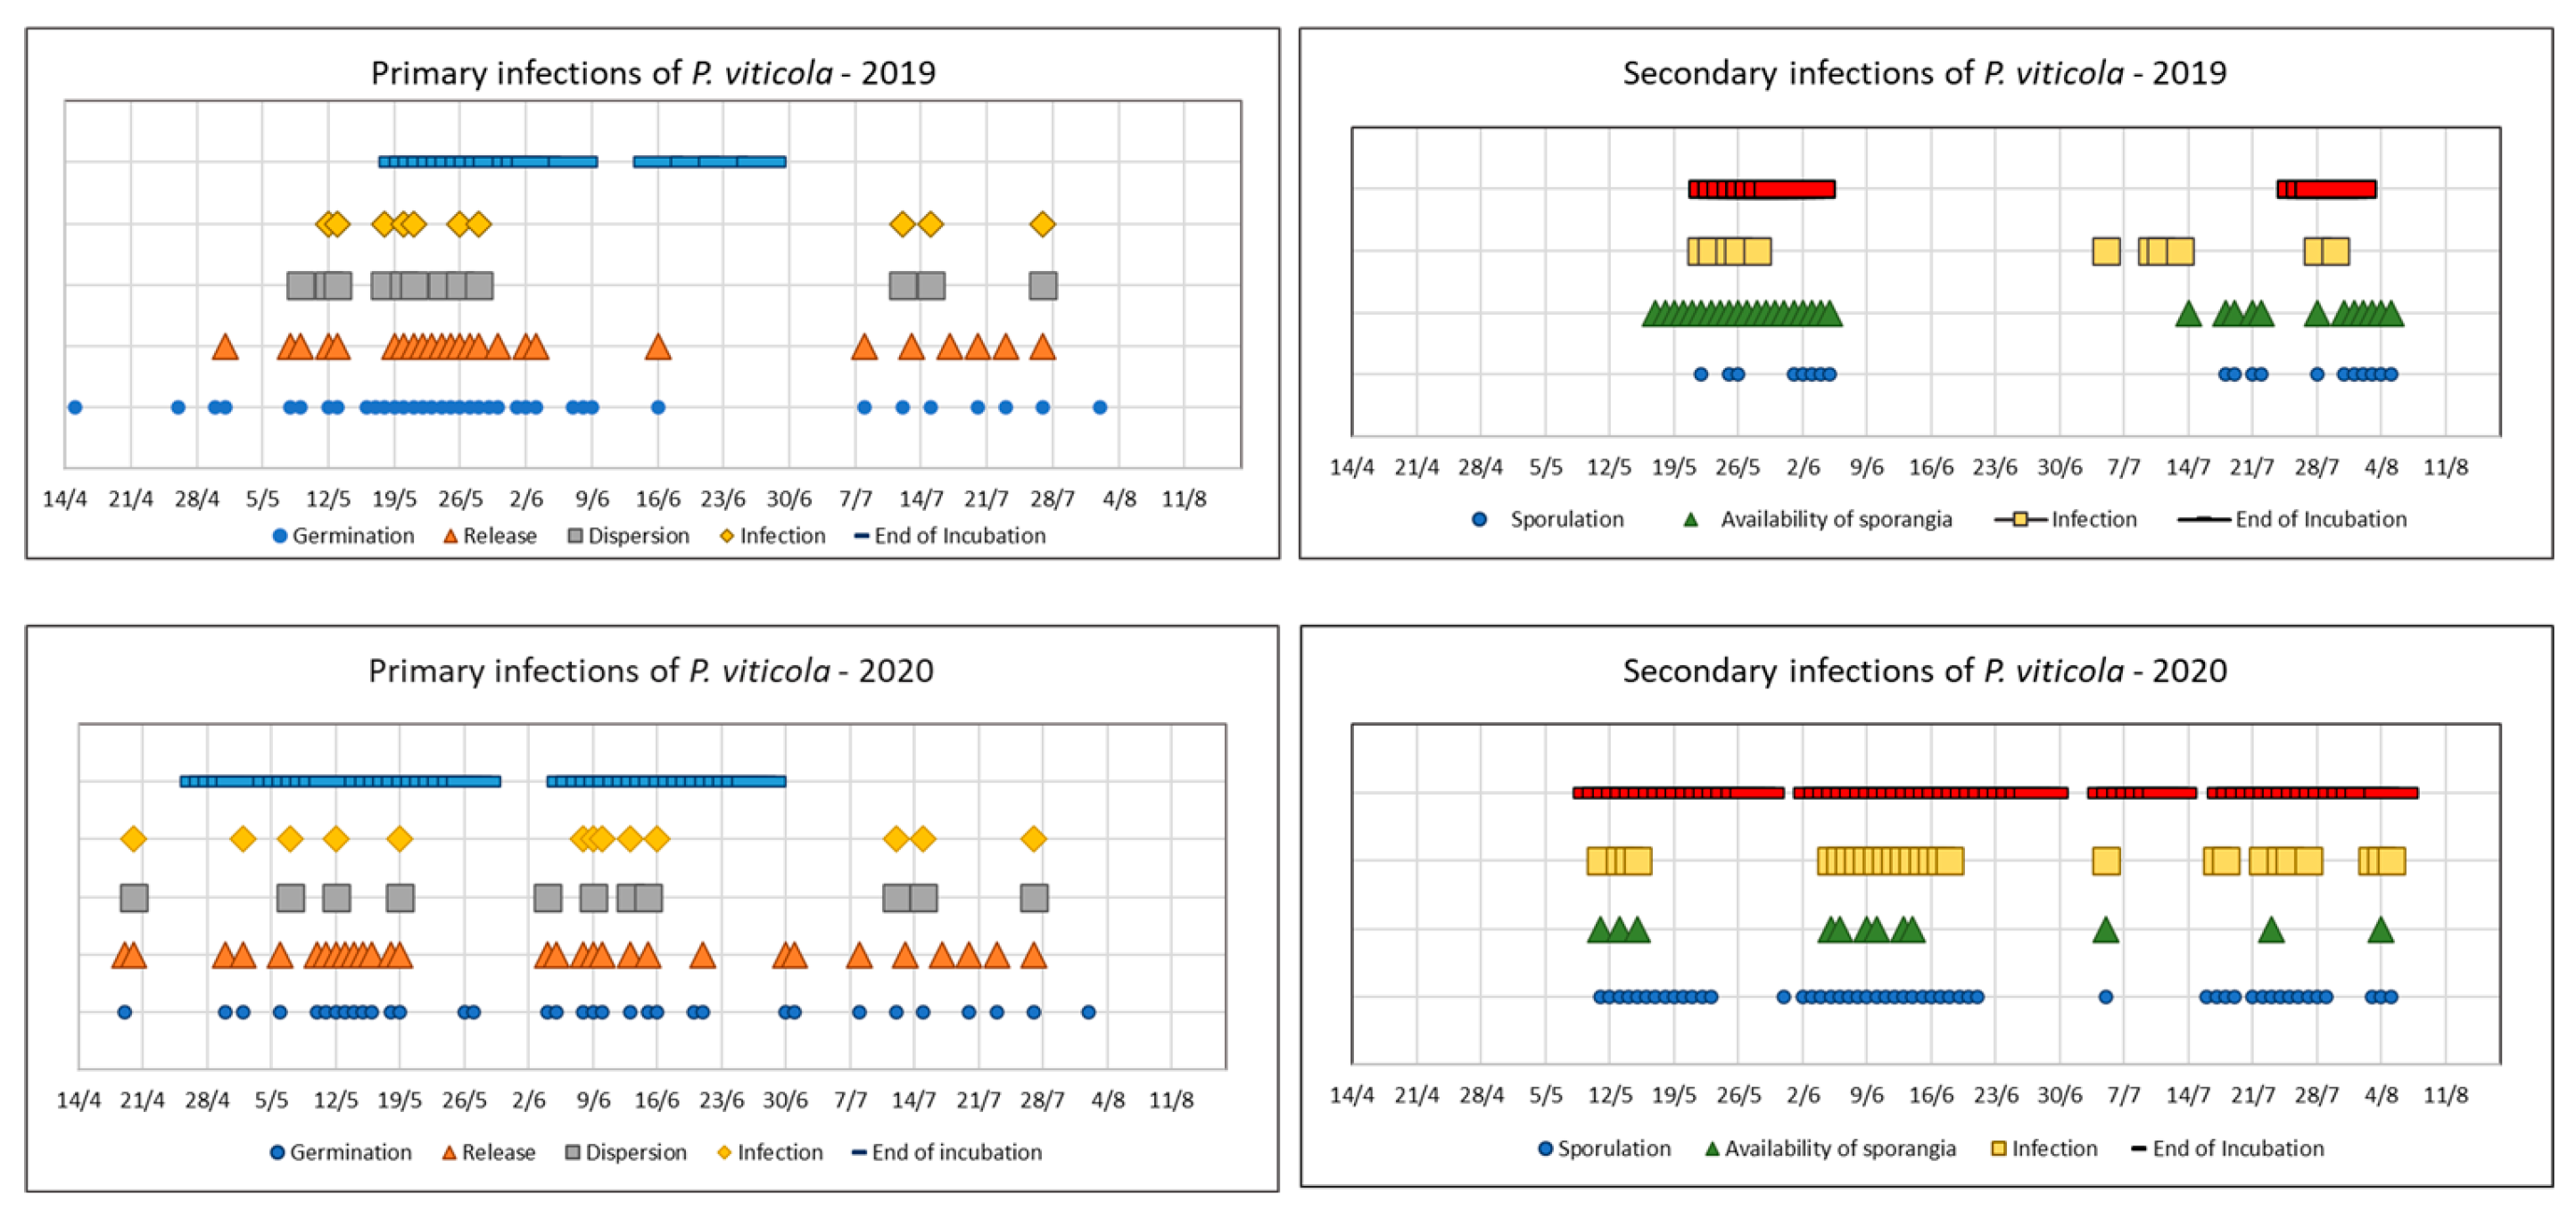
Figure 2.
Trends in caffeic acid content (µg/g) for the years 2019 and 2020. Error bars represent standard deviations. Asterisks indicate the significance of ANOVA results: ns = not significant, ** = significant at p<0.01.
Figure 2.
Trends in caffeic acid content (µg/g) for the years 2019 and 2020. Error bars represent standard deviations. Asterisks indicate the significance of ANOVA results: ns = not significant, ** = significant at p<0.01.
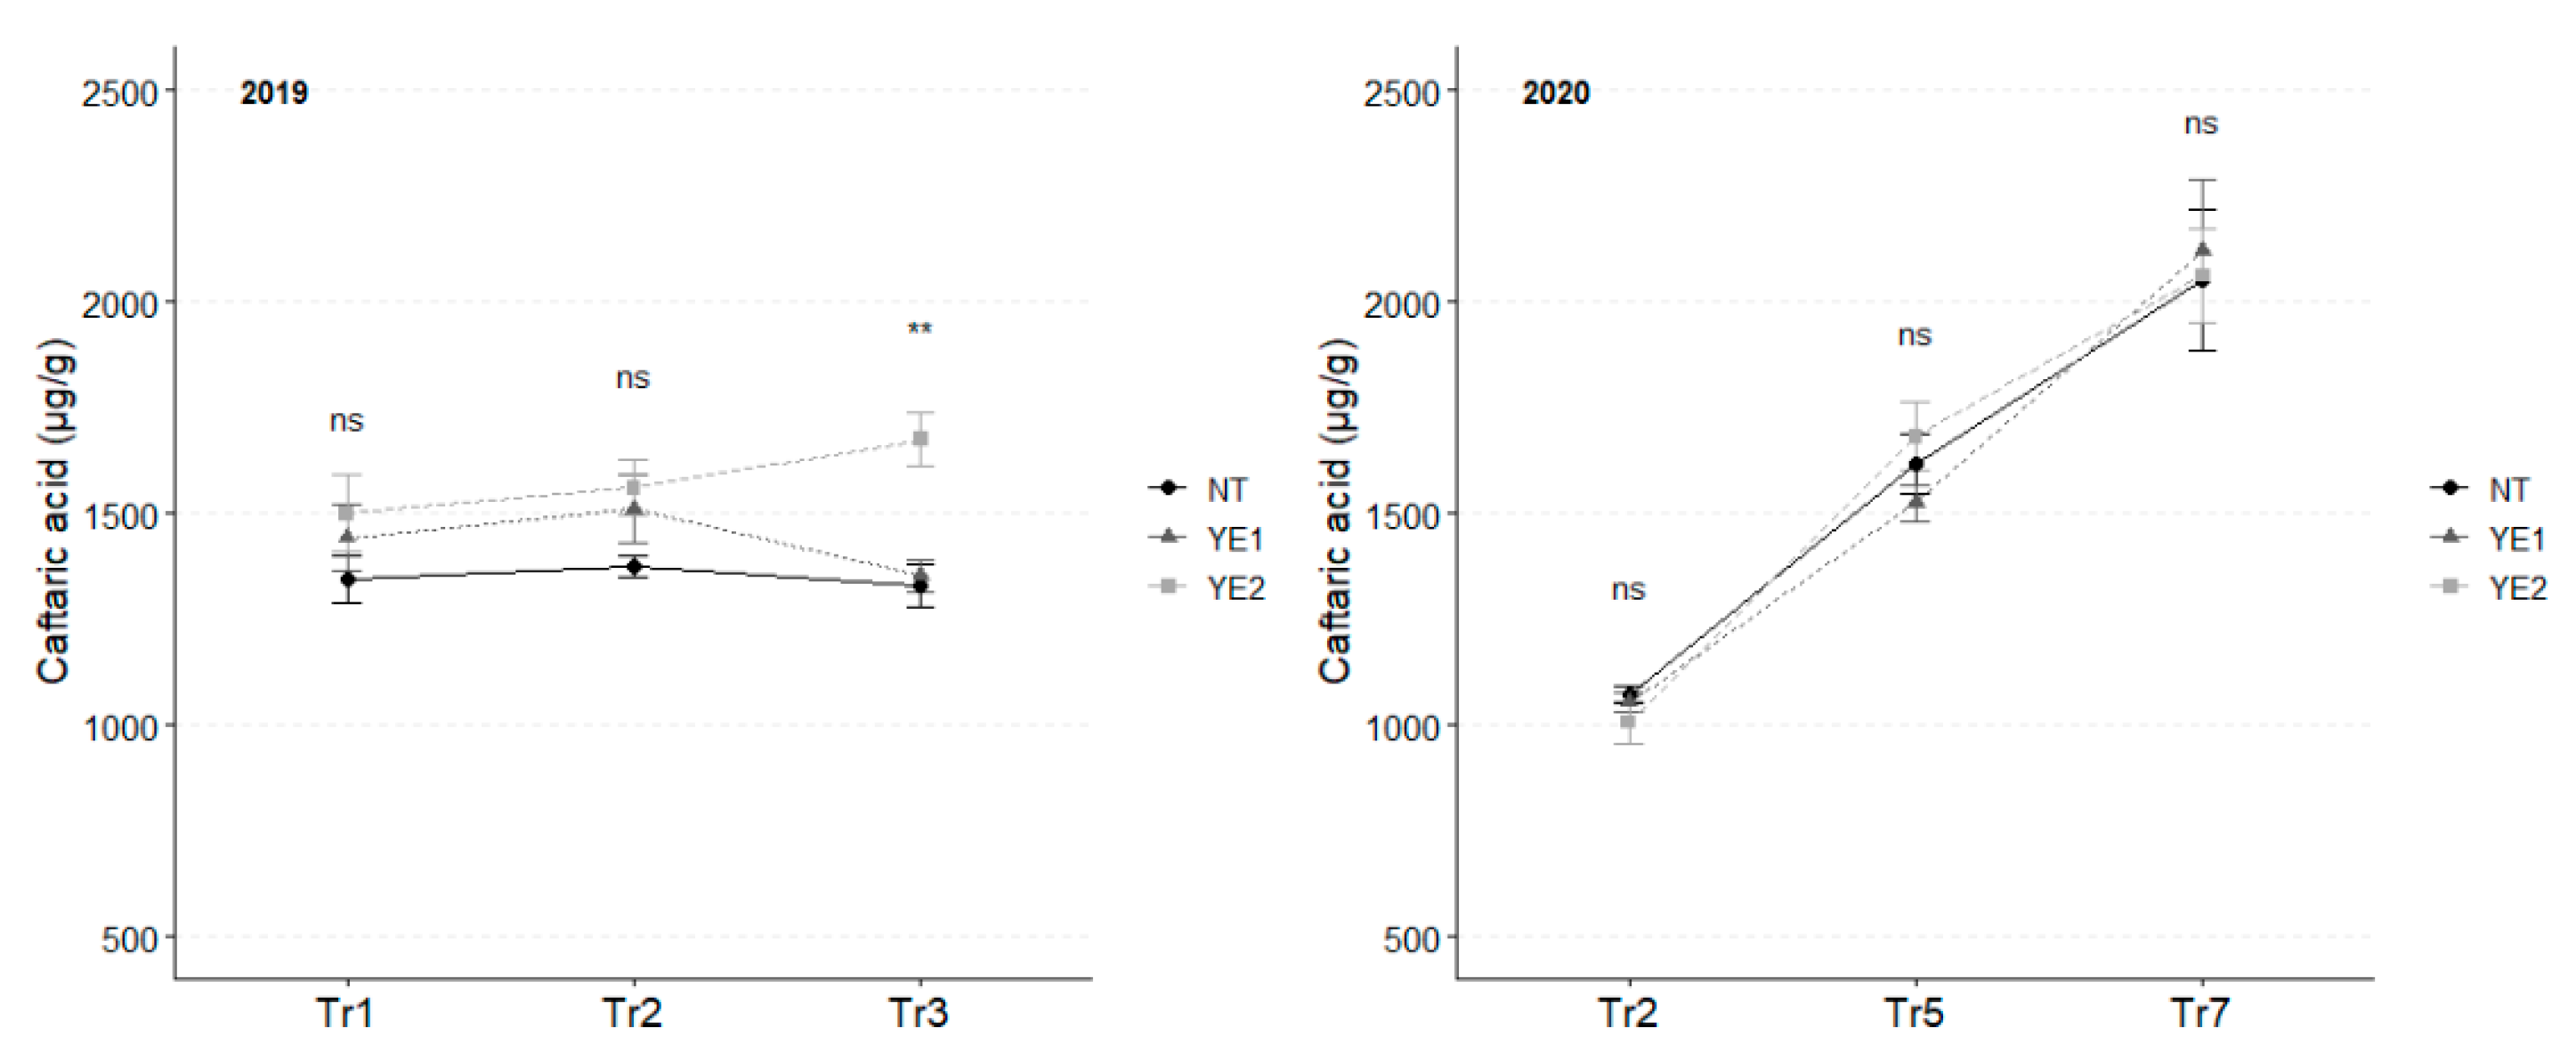
Figure 3.
Trends in coumaric acid content (µg/g) for the years 2019 and 2020. Error bars represent standard deviations. Asterisks indicate the significance of ANOVA results: ns = not significant, * = significant at p<0.05, *** = significant at p<0.001.
Figure 3.
Trends in coumaric acid content (µg/g) for the years 2019 and 2020. Error bars represent standard deviations. Asterisks indicate the significance of ANOVA results: ns = not significant, * = significant at p<0.05, *** = significant at p<0.001.
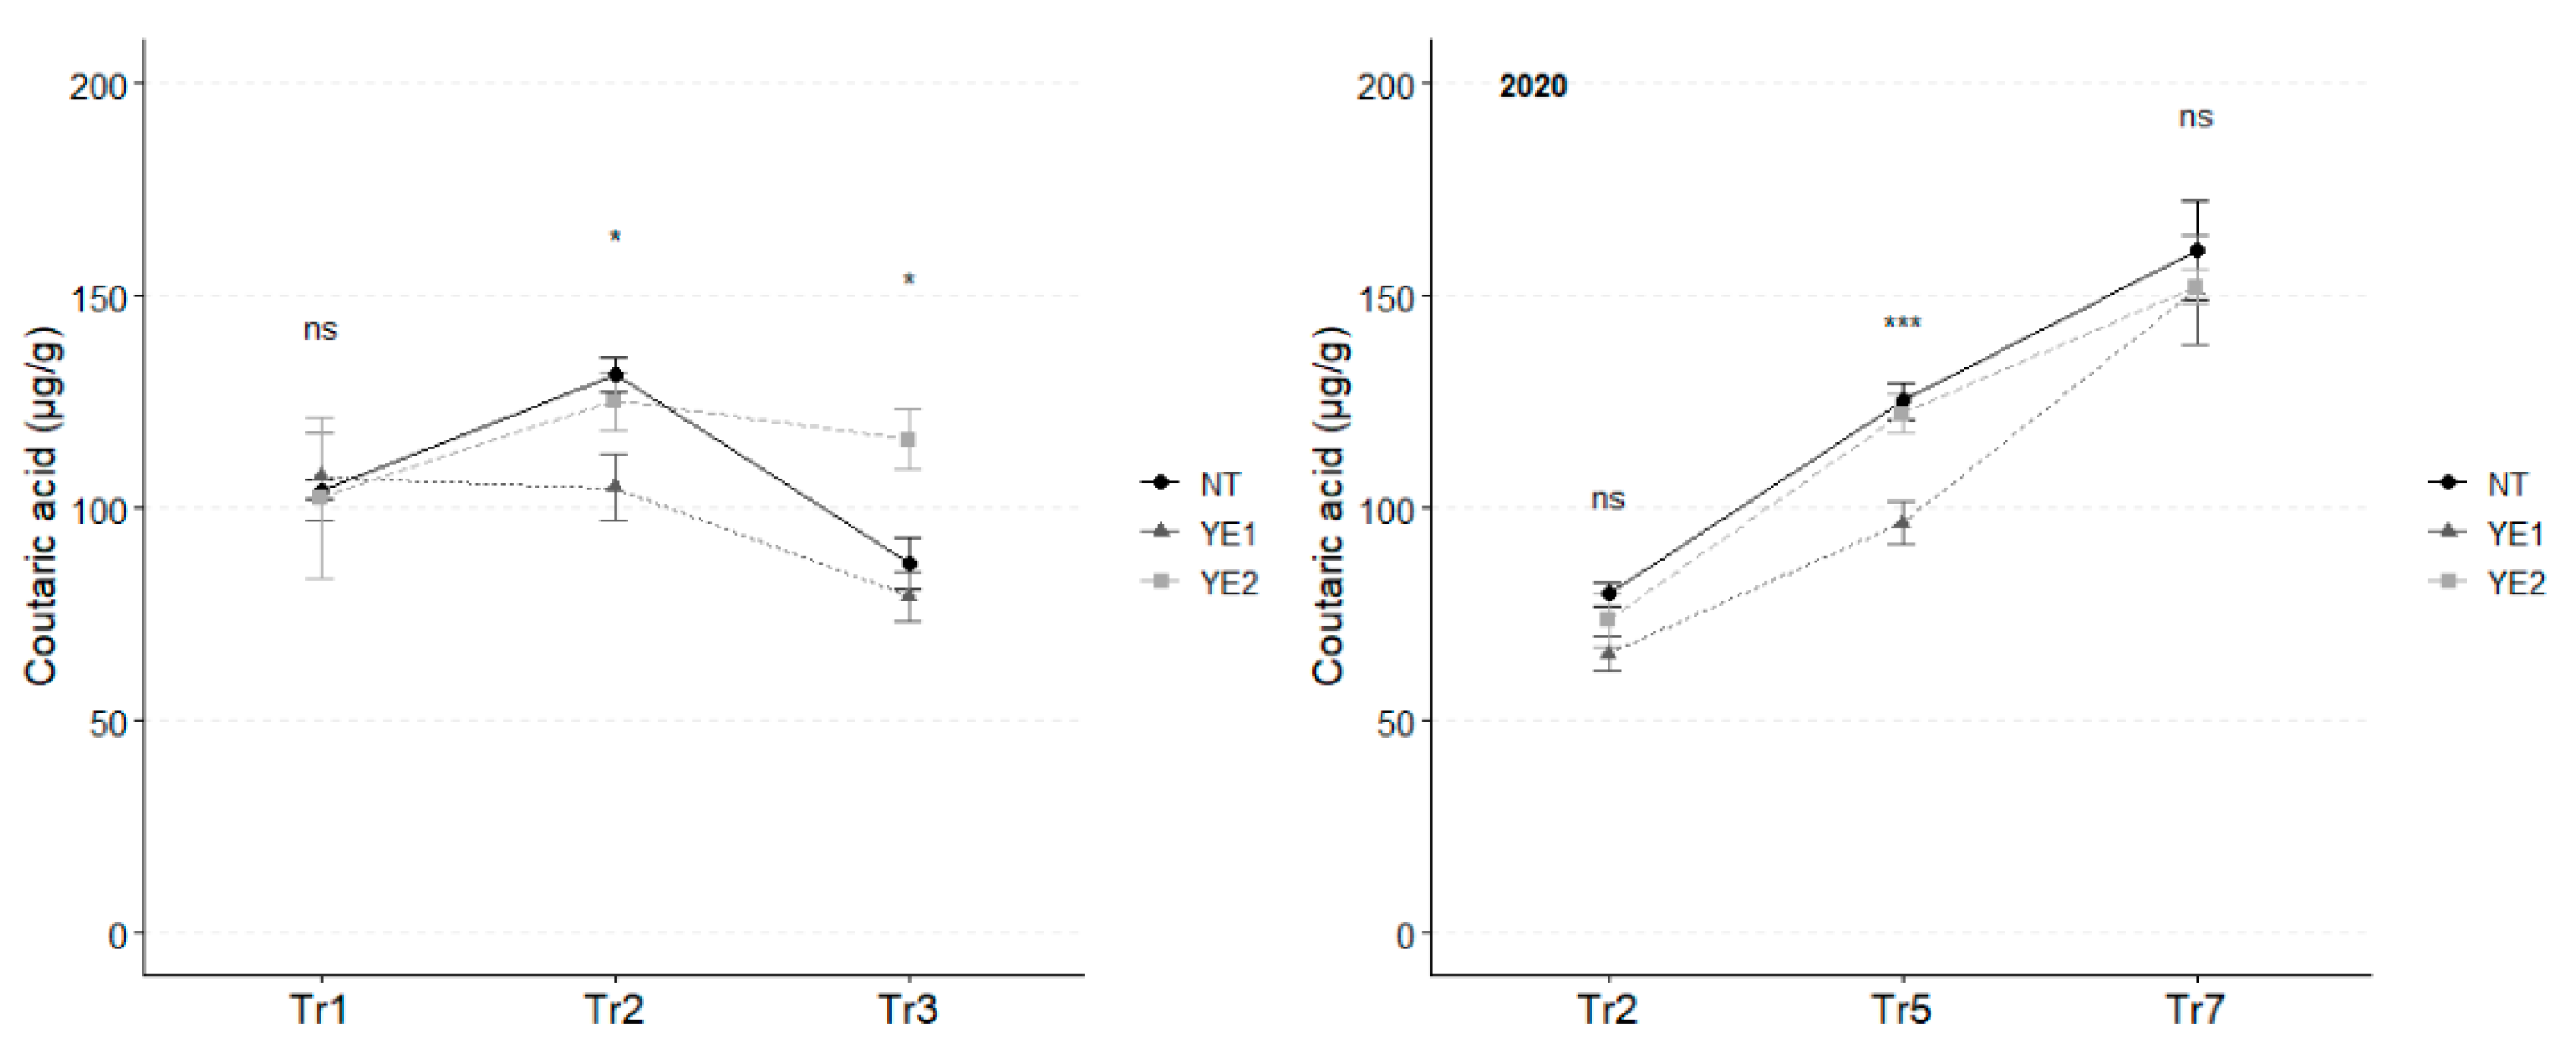
Figure 4.
Trends in quercetin glycosides content (µg/g) for the years 2019 and 2020. Error bars represent standard deviations. Asterisks indicate the significance of ANOVA results: ns = not significant, * = significant at p<0.05, ** = significant at p<0.01.
Figure 4.
Trends in quercetin glycosides content (µg/g) for the years 2019 and 2020. Error bars represent standard deviations. Asterisks indicate the significance of ANOVA results: ns = not significant, * = significant at p<0.05, ** = significant at p<0.01.
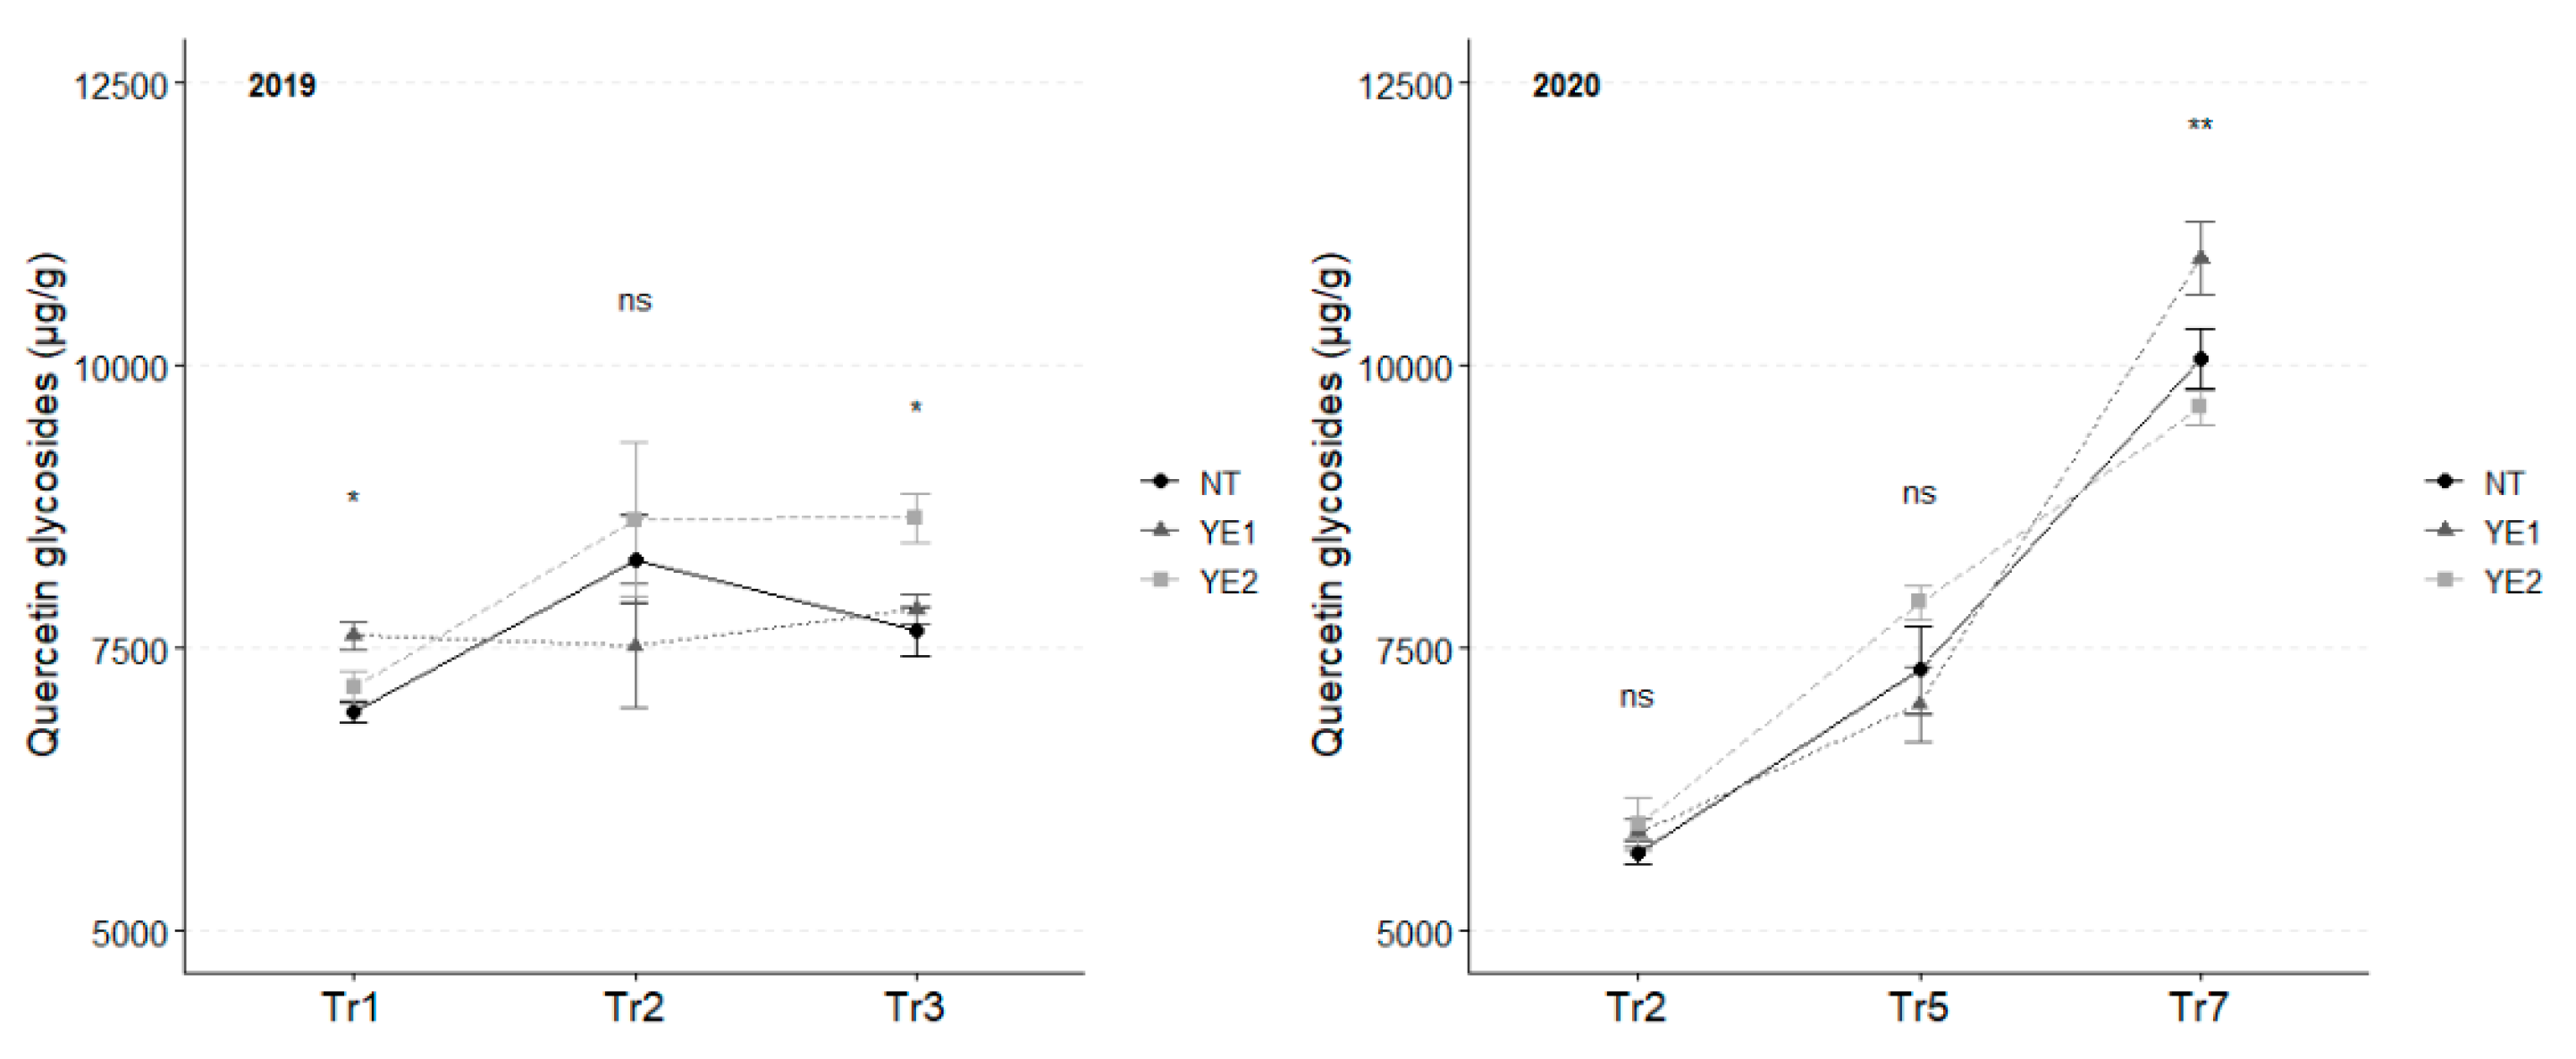
Figure 5.
Trends in kaempferol 3-glucoside content (µg/g) for the years 2019 and 2020. Error bars represent standard deviations. Asterisks indicate the significance of ANOVA results: ns = not significant, * = significant at p<0.05, *** = significant at p<0.001.
Figure 5.
Trends in kaempferol 3-glucoside content (µg/g) for the years 2019 and 2020. Error bars represent standard deviations. Asterisks indicate the significance of ANOVA results: ns = not significant, * = significant at p<0.05, *** = significant at p<0.001.
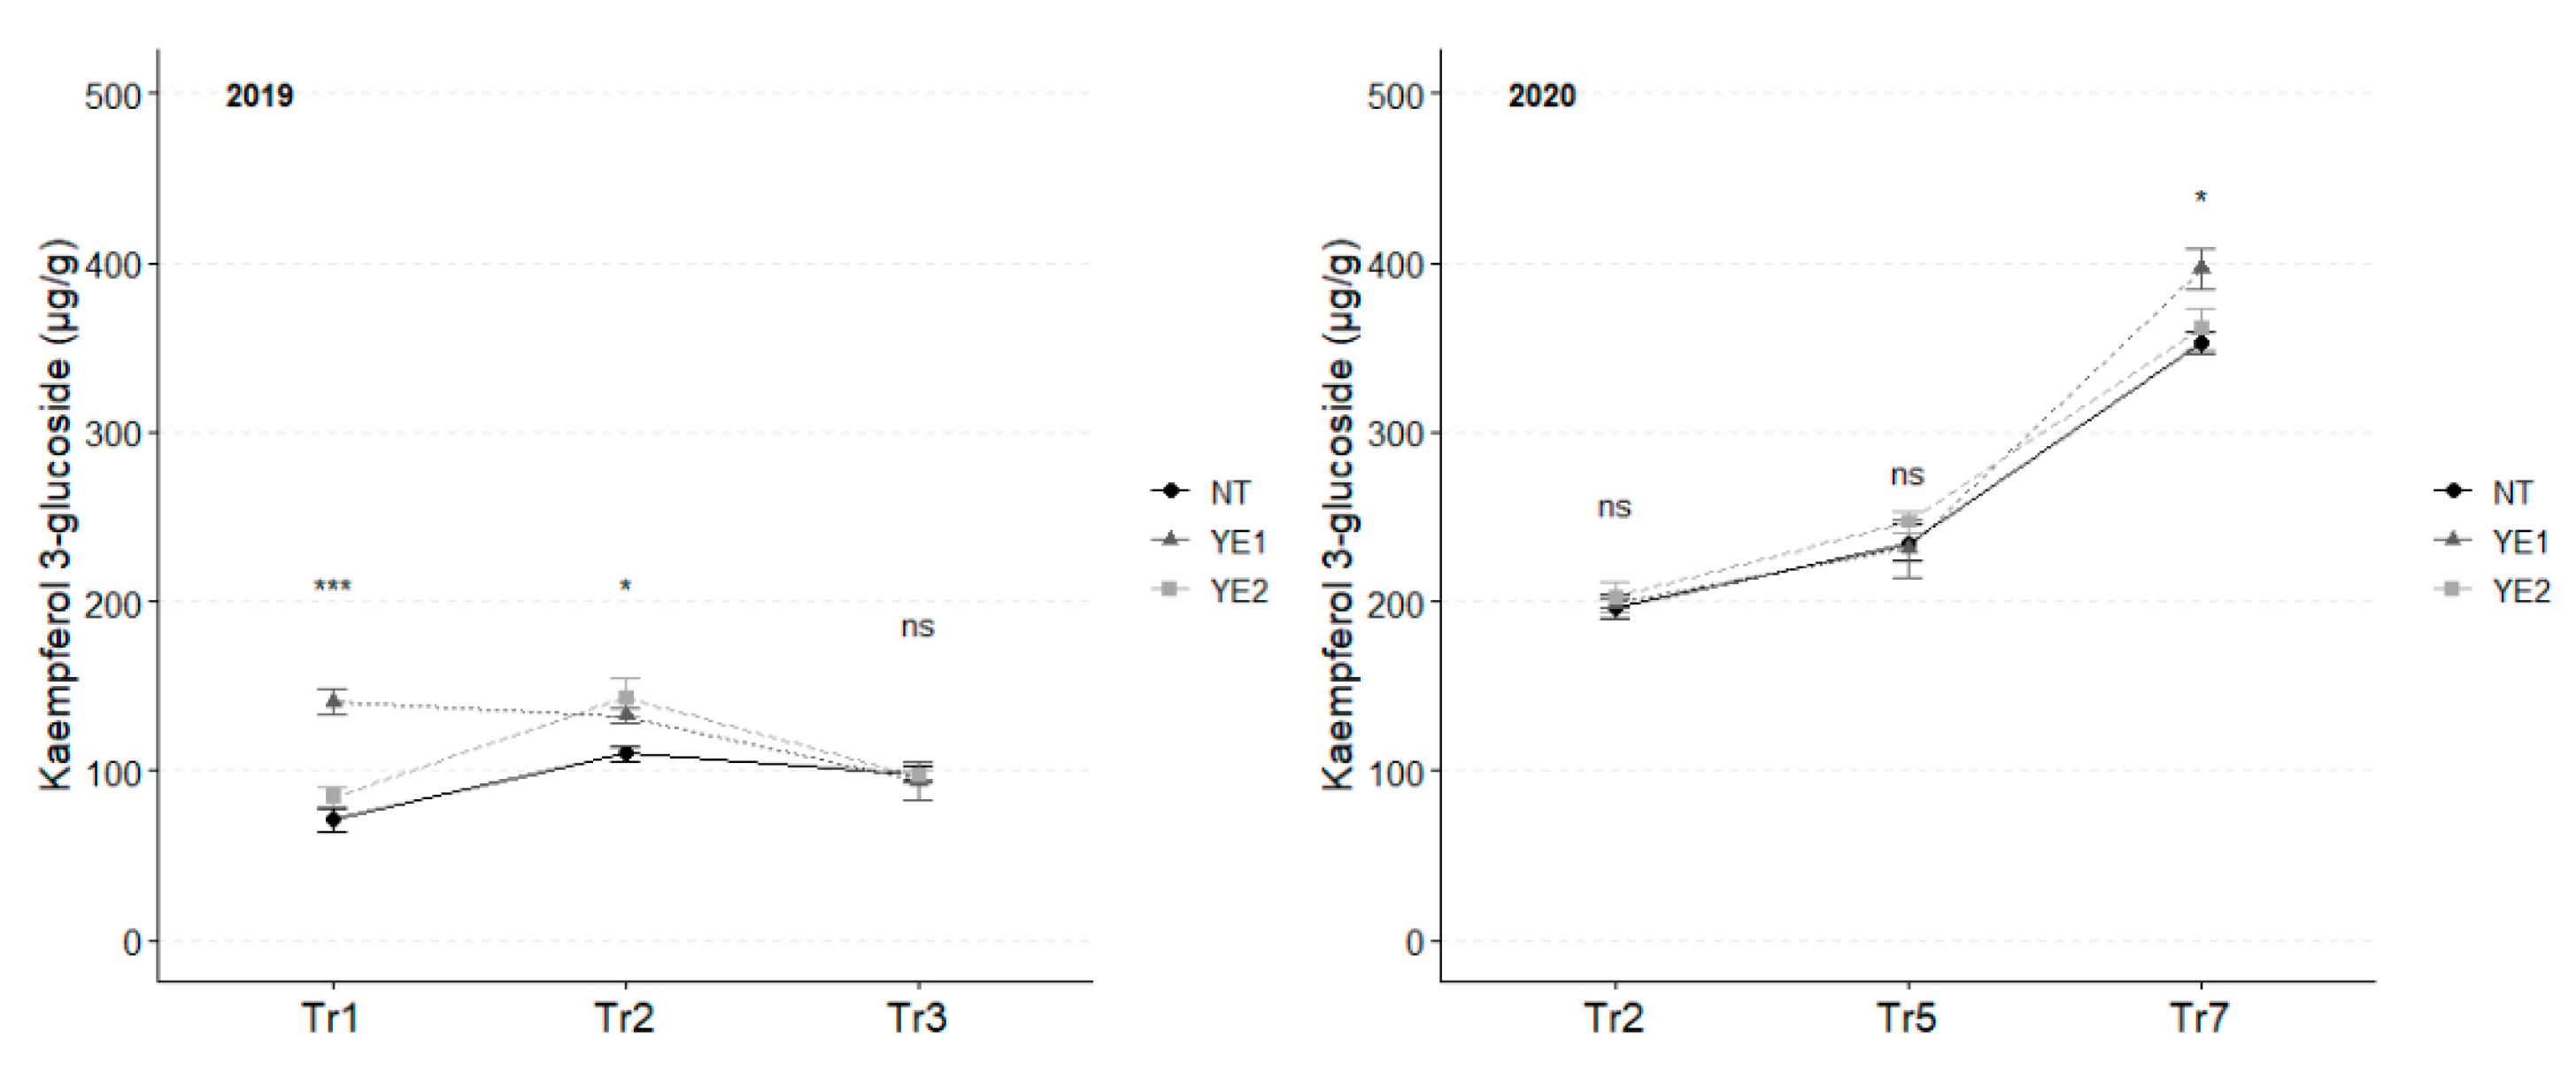
Figure 6.
Trends in catechin (µg/g) for the years 2019 and 2020. Error bars represent standard deviations. Superscripts indicate the significance of ANOVA results: ns = not significant.
Figure 6.
Trends in catechin (µg/g) for the years 2019 and 2020. Error bars represent standard deviations. Superscripts indicate the significance of ANOVA results: ns = not significant.
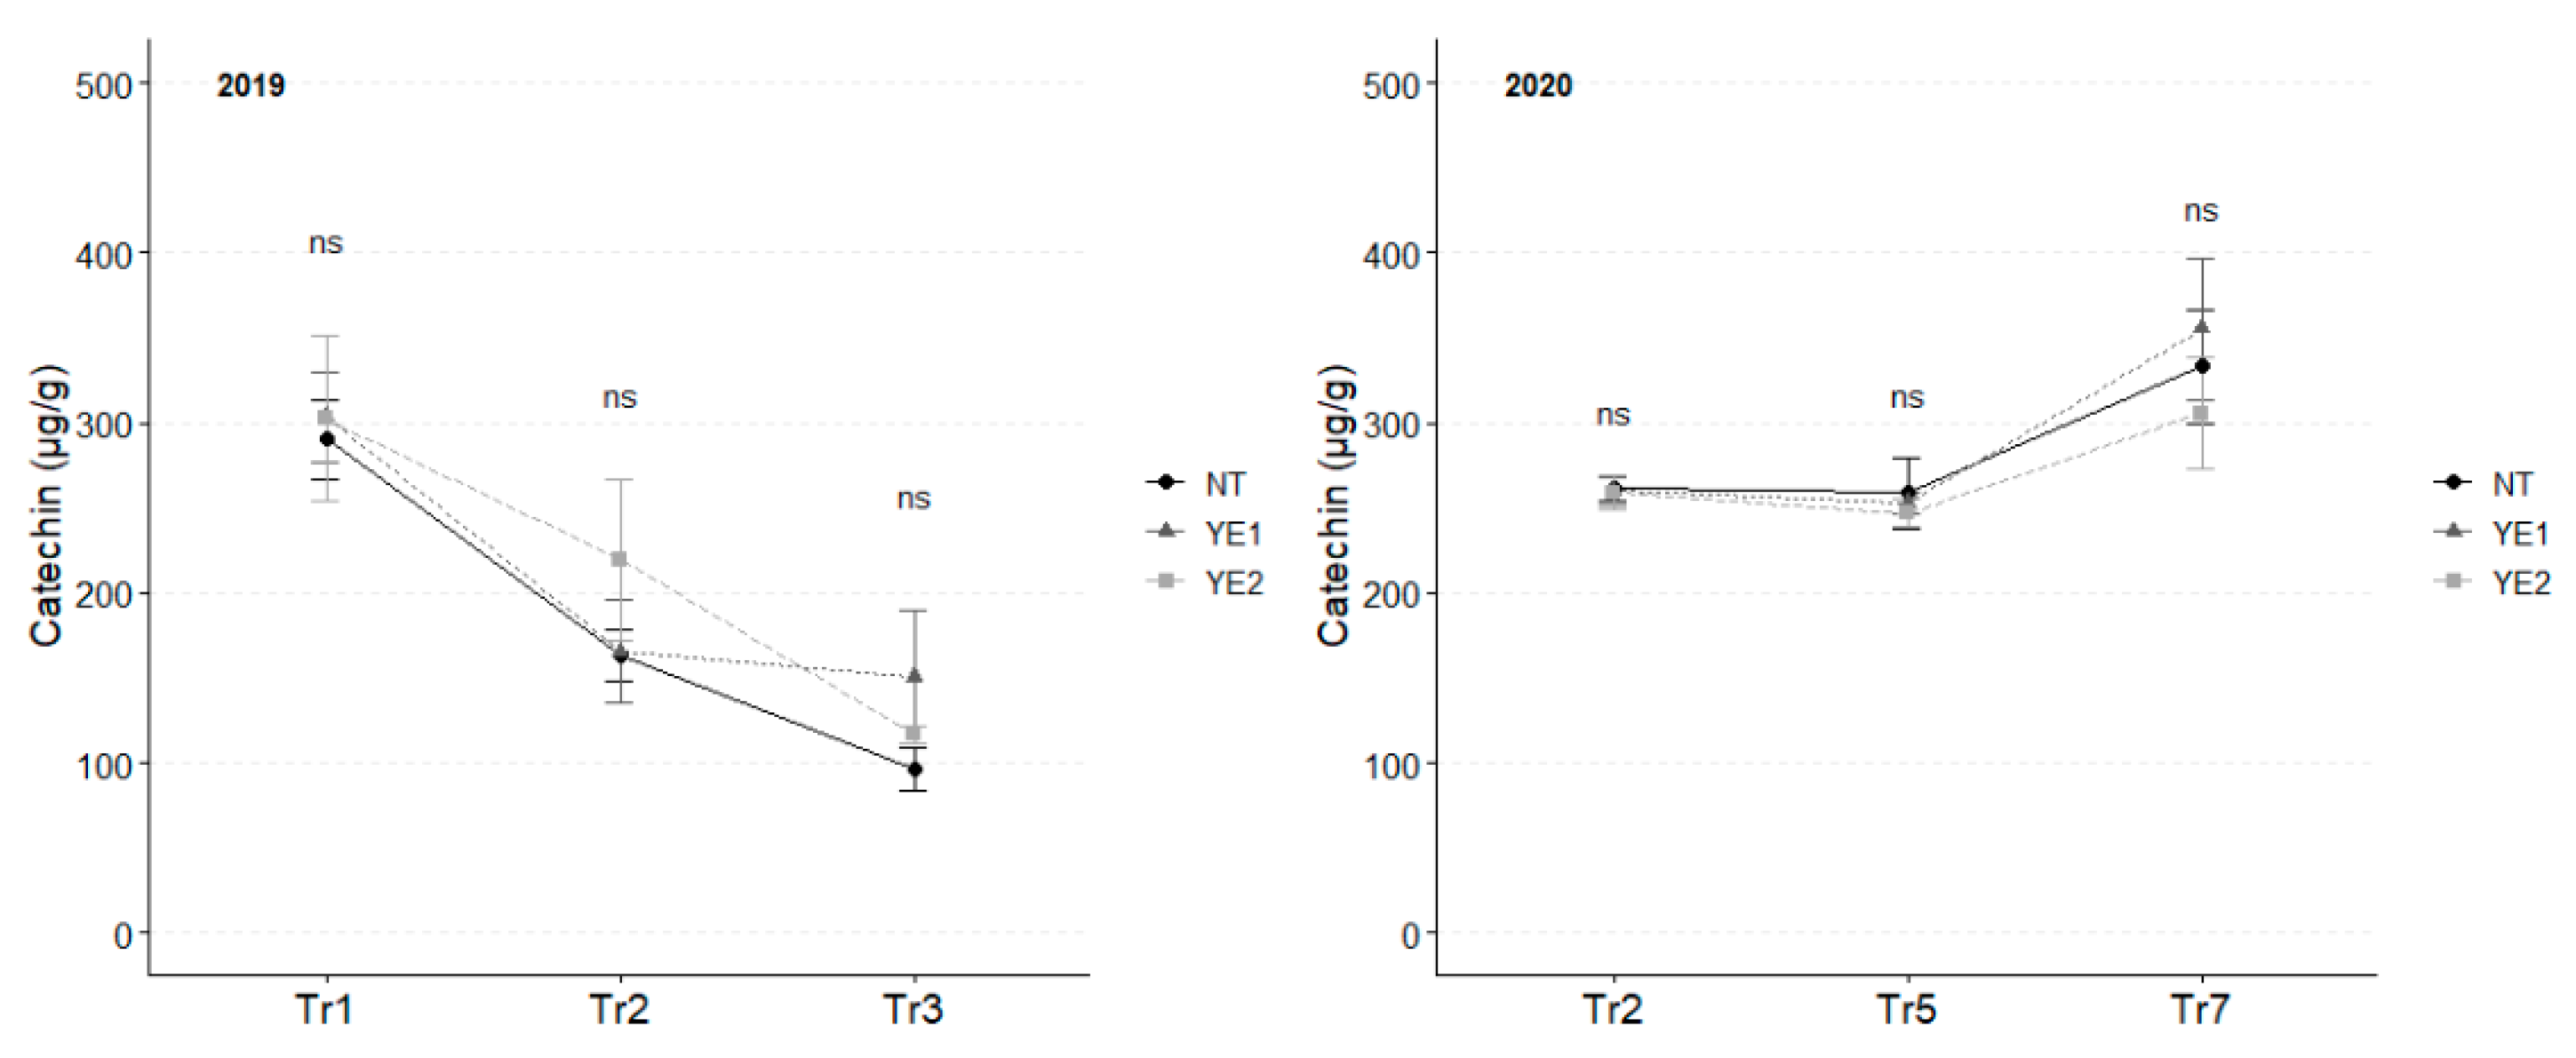
Figure 7.
Trends in epicatechin content (µg/g) for the years 2019 and 2020. Error bars represent standard deviations. Asterisks indicate the significance of ANOVA results: ns = not significant, * = significant at p<0.05, ** = significant at p<0.01.
Figure 7.
Trends in epicatechin content (µg/g) for the years 2019 and 2020. Error bars represent standard deviations. Asterisks indicate the significance of ANOVA results: ns = not significant, * = significant at p<0.05, ** = significant at p<0.01.
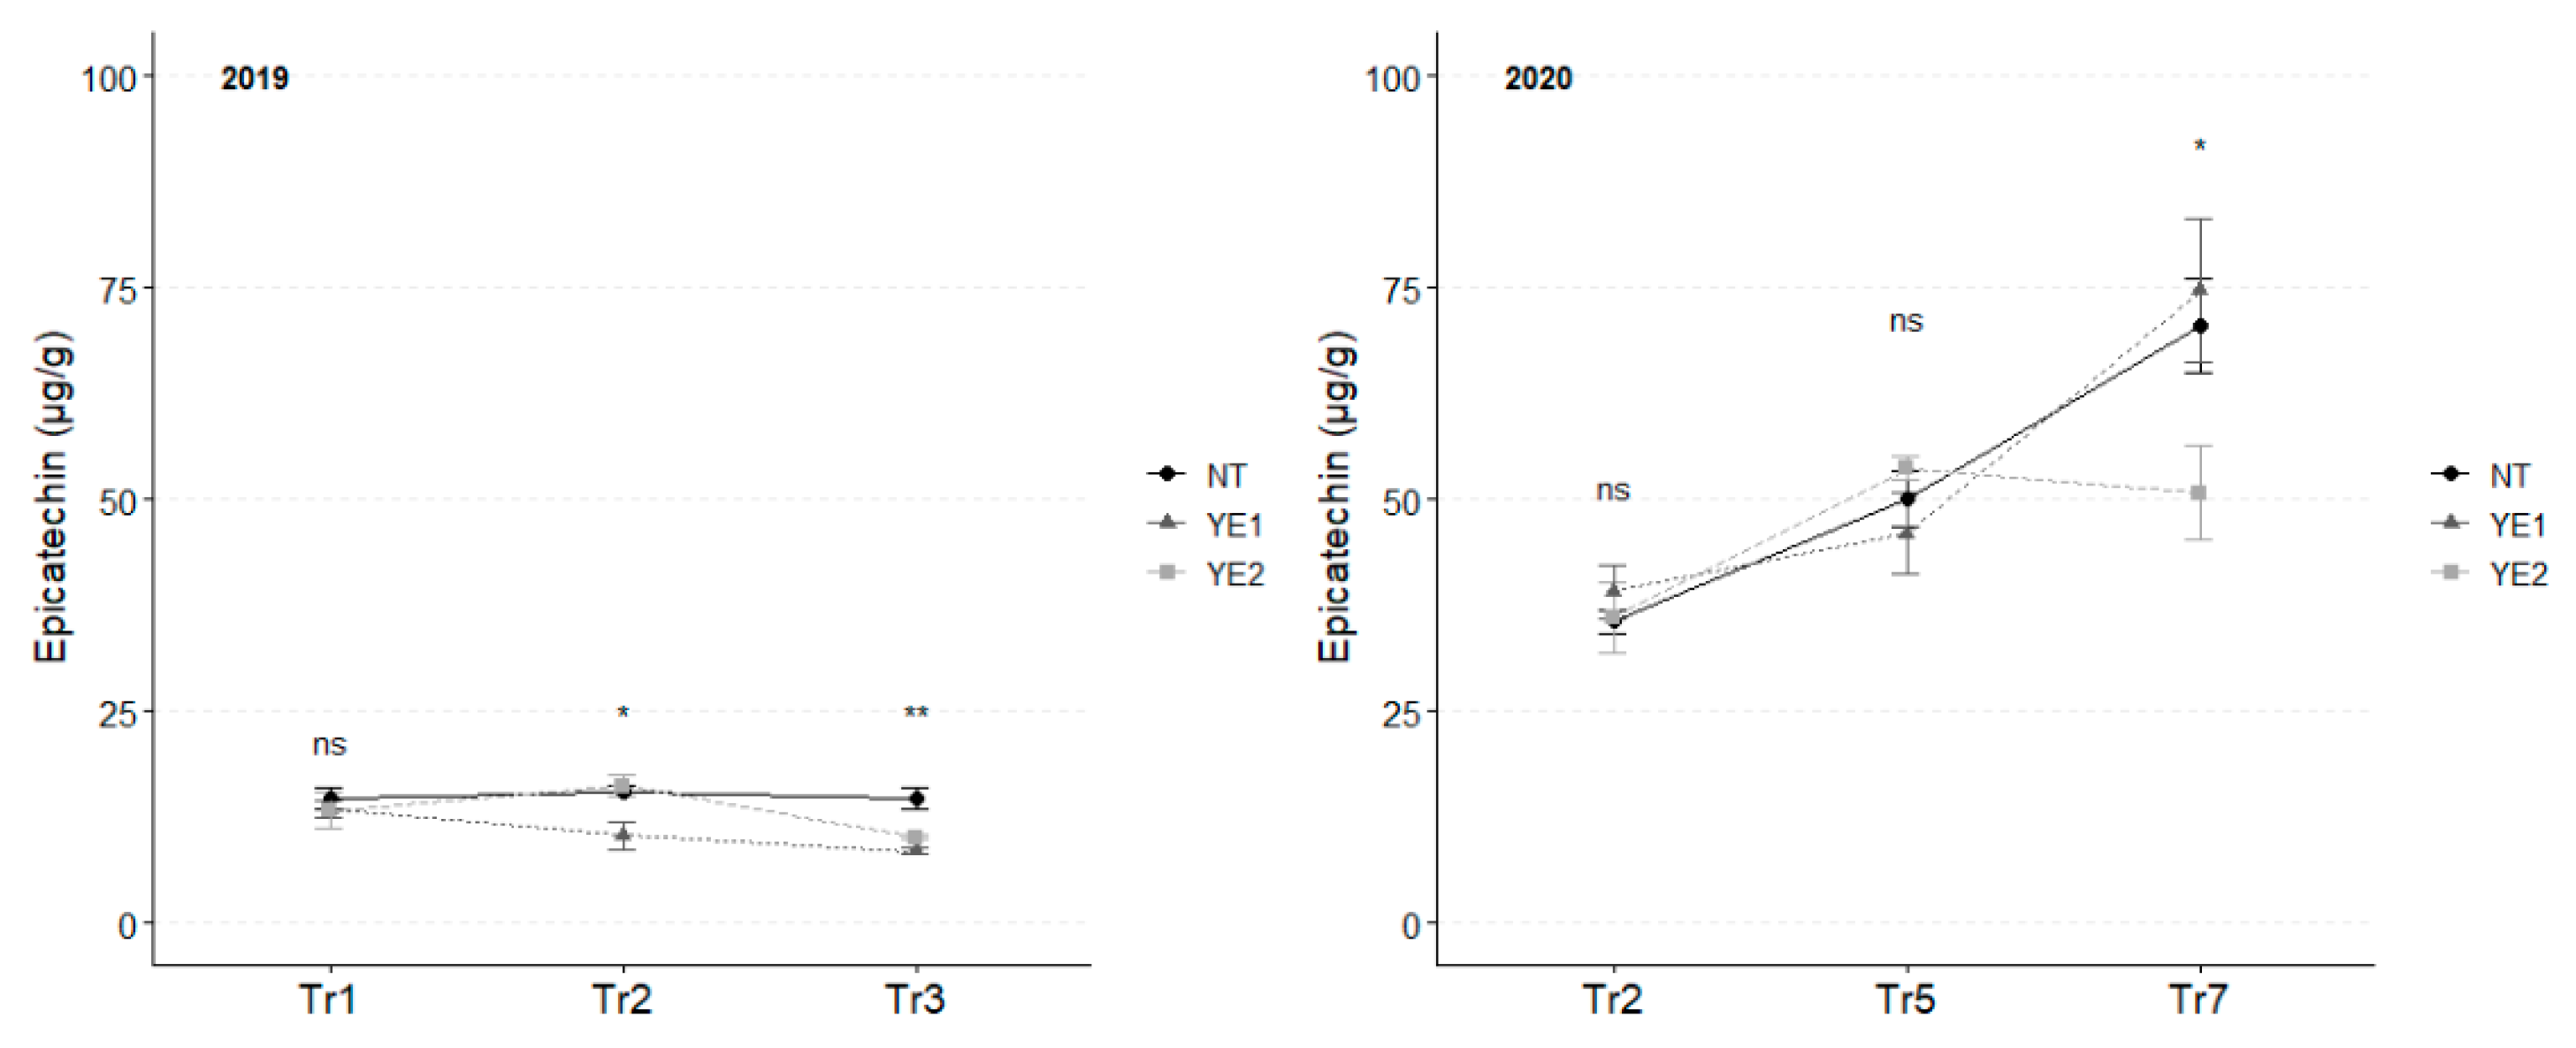
Figure 8.
Trends in piceid content (µg/g) for the years 2019 and 2020. Error bars represent standard deviations. Asterisks indicate the significance of ANOVA results: ns = not significant, * = significant at p<0.05, ** = significant at p<0.01, *** = significant at p<0.001, **** = significant at p<0.0001.
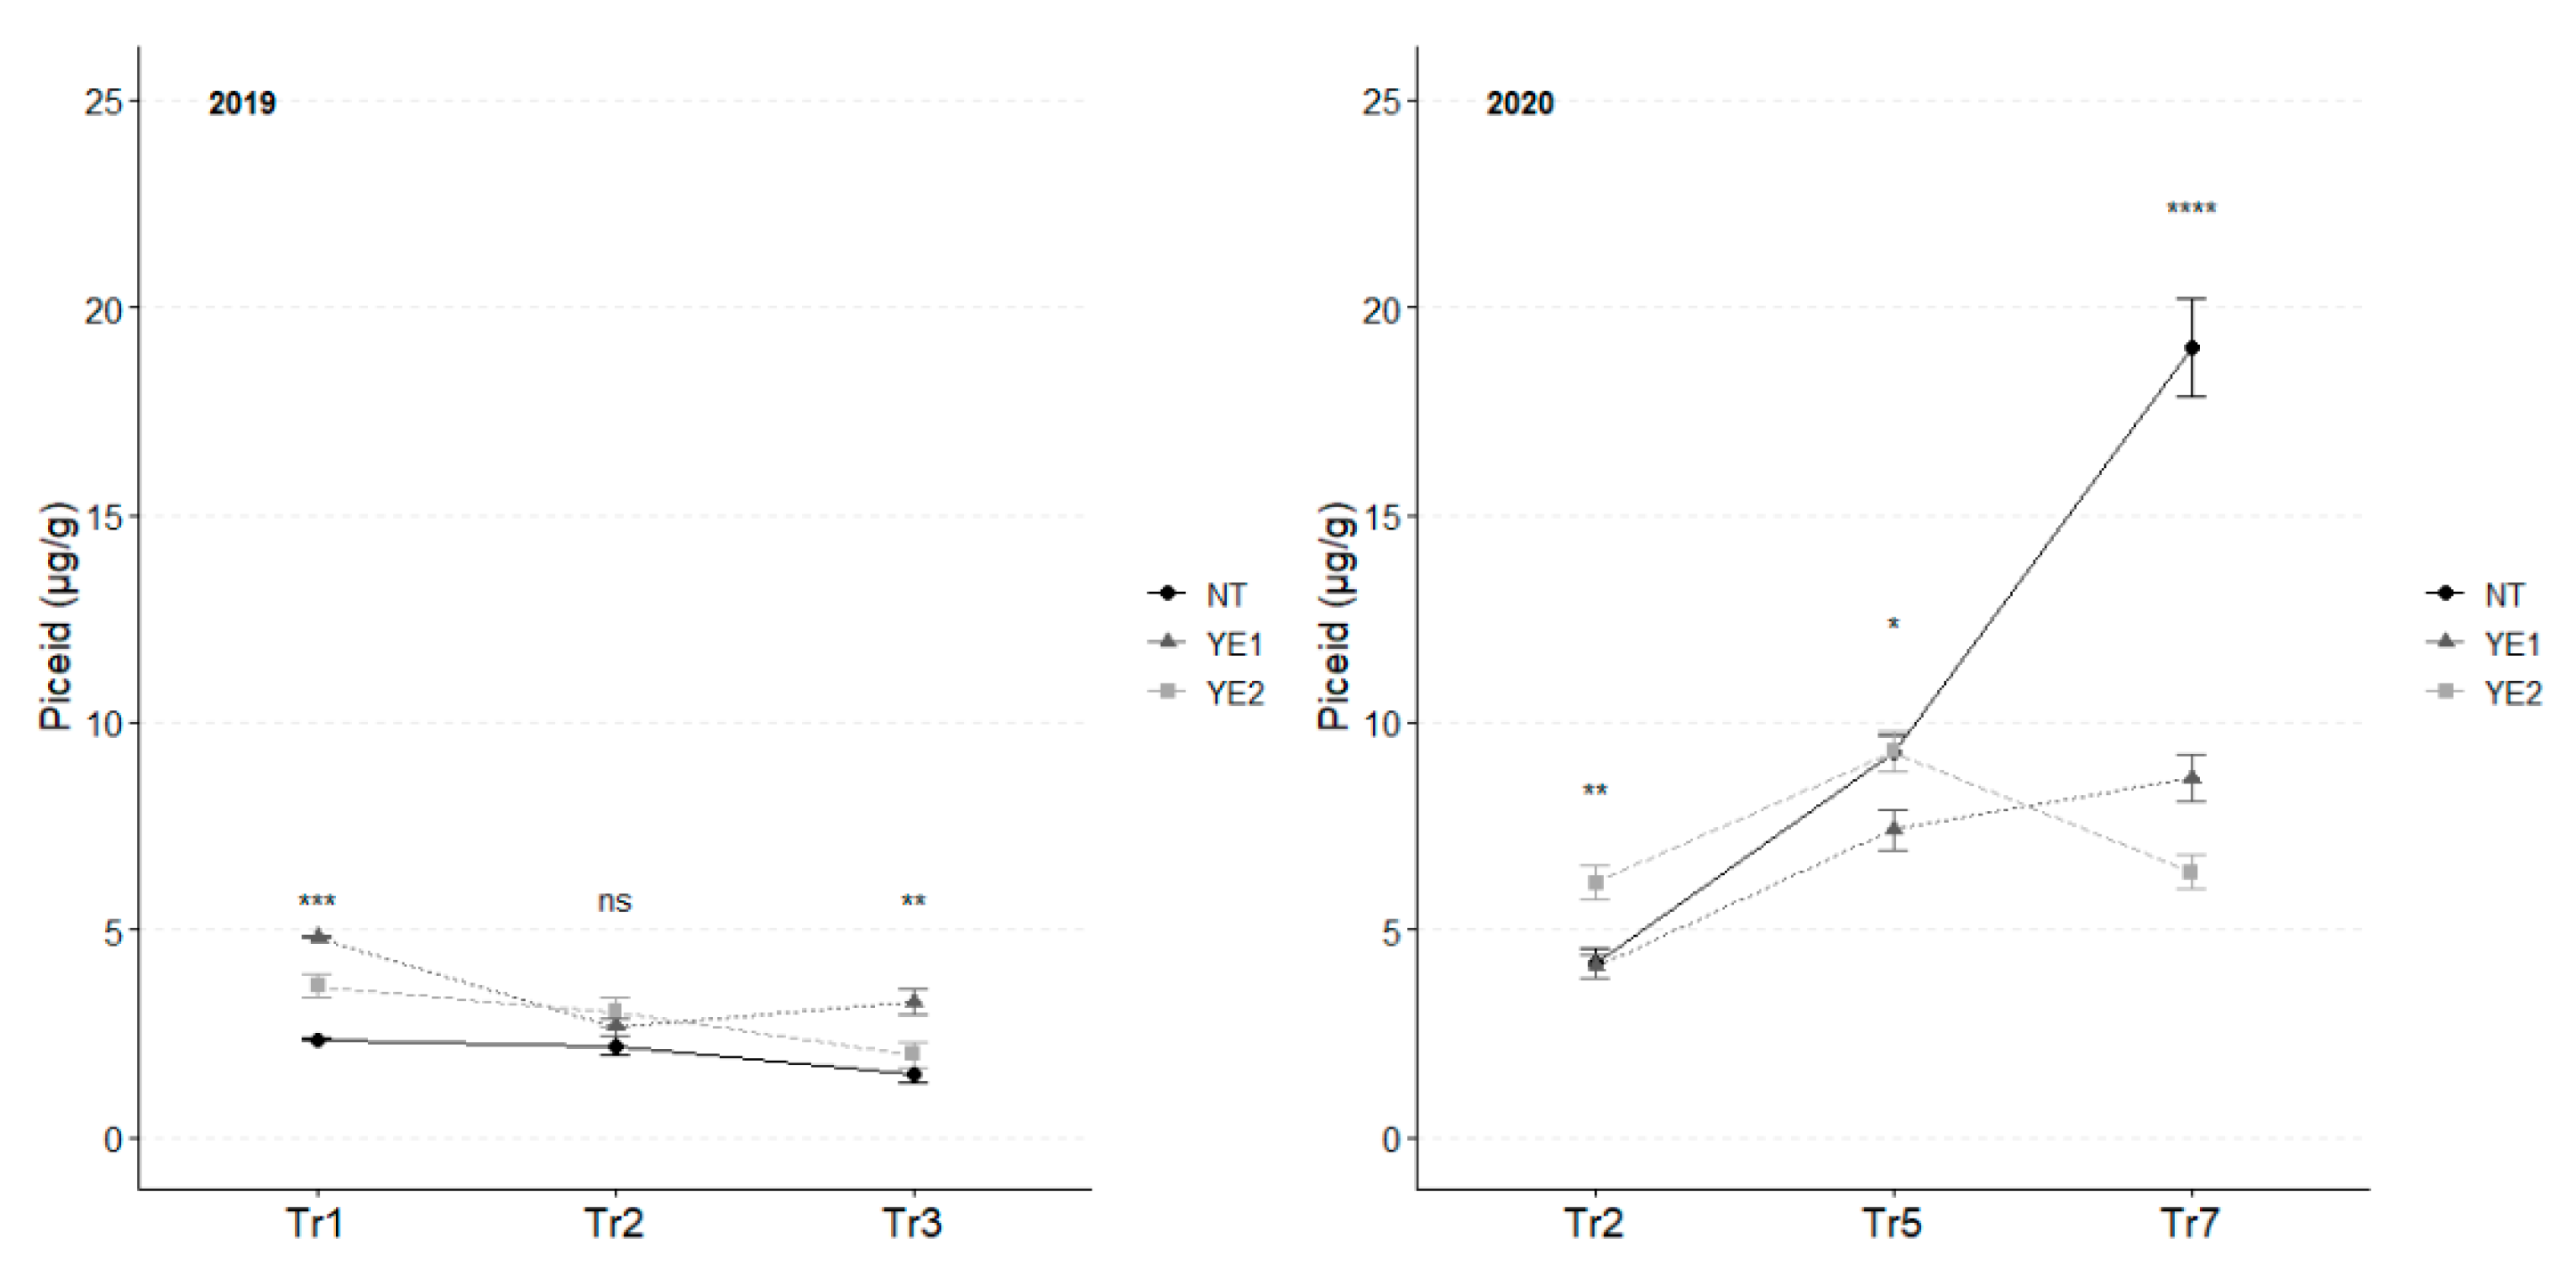

Table 1.
List of the treatments performed. For each treatment the product name, active principle/principles, and dose are indicated.
Table 1.
List of the treatments performed. For each treatment the product name, active principle/principles, and dose are indicated.
| Defense protocol | Active principle | Dose (kg/ha) |
| NT | Untreated control | |
| YE1 | Yeast derivative | 0.80 |
| YE2 | Romeo | 0.25 |
Table 2.
Dates of treatments with resistance inducers and leaf sampling (*) for chemical analyses.
| Year | Timing of treatments | ||||||
| Tr1 | Tr2 | Tr3 | Tr4 | Tr5 | Tr6 | Tr7 | |
| 2019 | 24/06* | 01/07* | 08/07* | - | - | - | - |
| 2020 | 23/05 | 01/06* | 12/06 | 22/06 | 02/07* | 11/07 | 16/07* |
Table 3.
Timings indicating each phenological phase according to BBCH scale (in brackets) [24].
Table 3.
Timings indicating each phenological phase according to BBCH scale (in brackets) [24].
| Year | Phenological phase | |||||
| Bud burst (09) | Flowering (65) | Fruit set (71) | Majority of berries touching (79) | Veraison (81) | Ripening (89) | |
| 2019 | 12/04 | 18/06 | 24/06 | 16/07 | 25/07 | 08/10 |
| 2020 | 05/04 | 08/06 | 15/06 | 02/07 | 20/07 | 01/10 |
Table 4.
Elution and flow gradient program during HPLC analyses.
| Time (min) | El. A (%) | El. B (%) | Flow (mL/min) |
| 0 | 100 | 0 | 0.8 |
| 5 | 95 | 5 | - |
| 35 | 82 | 18 | - |
| 50 | 80 | 20 | 0.9 |
| 60 | 57 | 43 | - |
| 80 | 35 | 65 | - |
| 95 | 0 | 100 | 1.2 |
| 100 | 0 | 100 | 1.2 |
| 101 | 100 | 0 | 0.8 |
Table 5.
Evaluation of P. viticola infection in 2019. Intensity, diffusion, and efficacy were considered. Different letters indicate a significant difference in efficacy according to Duncan’s multiple range test, with p≤0.05.
Table 5.
Evaluation of P. viticola infection in 2019. Intensity, diffusion, and efficacy were considered. Different letters indicate a significant difference in efficacy according to Duncan’s multiple range test, with p≤0.05.
| 2019 – 12th July | ||||||
| Treatment | Leaves | Clusters | ||||
| Intensity (%) | Diffusion (%) | Efficacy (%) | Intensity (%) | Diffusion (%) | Efficacy (%) | |
| NT | 3.5 | 7.8 | 0 b | 8.3 | 15.0 | 0 b |
| YE1 | 0 | 0 | 100 a | 0 | 0 | 100 a |
| YE2 | 0 | 0 | 100 a | 0 | 0 | 100 a |
Table 6.
Evaluation of P. viticola infection in 2020. Intensity, diffusion, and efficacy were considered. Different letters indicate a significant difference in efficacy according to Duncan’s multiple range test, with p≤0.05.
Table 6.
Evaluation of P. viticola infection in 2020. Intensity, diffusion, and efficacy were considered. Different letters indicate a significant difference in efficacy according to Duncan’s multiple range test, with p≤0.05.
| 2020 – 12th June | ||||||
| Treatment | Leaves | Clusters | ||||
| Intensity (%) | Diffusion (%) | Efficacy (%) | Intensity (%) | Diffusion (%) | Efficacy (%) | |
| NT | 2.0 | 5.5 | 0 b | 2.6 | 6.5 | 0 b |
| YE1 | 0 | 0 | 100 a | 0 | 0 | 100 a |
| YE2 | 0 | 0 | 100 a | 0 | 0 | 100 a |
| 2020 – 16th July | ||||||
| Treatment | Leaves | Clusters | ||||
| Intensity (%) | Diffusion (%) | Efficacy (%) | Intensity (%) | Diffusion (%) | Efficacy (%) | |
| NT | 21.0 | 35.5 | 0.0 b | 12.8 | 23.0 | 0.0 b |
| YE1 | 0.5 | 2.0 | 97.9 a | 0.6 | 2.5 | 94.9 a |
| YE2 | 0.3 | 1.5 | 98.6 a | 0.5 | 2.0 | 95.3 a |
| 2020 – 3rd August | ||||||
| Treatment | Clusters | |||||
|
Intensity (%) |
Diffusion (%) |
Efficacy (%) |
||||
| NT | 13.6 | 26.0 | 0.0 c | |||
| YE1 | 0.8 | 2.5 | 93.7 b | |||
| YE2 | 0.8 | 3.5 | 94.2 a | |||
Disclaimer/Publisher’s Note: The statements, opinions and data contained in all publications are solely those of the individual author(s) and contributor(s) and not of MDPI and/or the editor(s). MDPI and/or the editor(s) disclaim responsibility for any injury to people or property resulting from any ideas, methods, instructions or products referred to in the content. |
© 2025 by the authors. Licensee MDPI, Basel, Switzerland. This article is an open access article distributed under the terms and conditions of the Creative Commons Attribution (CC BY) license (https://creativecommons.org/licenses/by/4.0/).
Copyright: This open access article is published under a Creative Commons CC BY 4.0 license, which permit the free download, distribution, and reuse, provided that the author and preprint are cited in any reuse.


