Preprint
Article

This version is not peer-reviewed.

Evaluation of Fresh and Hardened Properties of Concrete Comprising E-Waste

Submitted:

22 January 2025

Posted:

23 January 2025

You are already at the latest version

Abstract

Owing to rapid urbanization and population expansion, an increase in plastic utensils leads to an increase in plastic waste. Research in the domain of the recycling and repurposing of plastic waste in the construction industry offered a solution to decrease plastic waste as relief for environmental damage and protecting natural resources. This study is about replacing natural coarse aggregate in concrete with plastic coarse aggregate (PCA), which is made from electronic waste. Natural coarse aggregates (NCA) are replaced by PCA as 10%, 15%, and 20%. Rheological and mechanical properties i.e., workability, concrete density, compressive strength, and split tensile strength are investigated. The durability of concrete is assessed by water absorption, abrasion resistance, Sorptivity, Sulphuric attack resistance, and thermal conductivity. scanning electron microscopy is performed for the confirmation of durability claims. The analysis revealed that the use of produced PCA enhances the workability of concrete; nevertheless, the compressive and tensile strengths were reduced as 18.58% and 3.7%, respectively. PCA is treated with sand and silica fumes (SF) in order to attain targeted strength. It helped to reduce the negative effects of PCA on the strength properties of the concrete. PCA is concluded as a substitute for NCA having equivalent strength with enhanced performance of concrete.

Keywords: 
;  ;  ;  

1. Introduction

Concrete is a structural material used in construction that is made up of a hard, chemically inert particle component known as aggregate that binds together via cement in presence of water. Concrete is distinguished by the type of aggregate or cement used, the unique features it exhibits, or the procedures employed to manufacture it. The nature of conventional structural concrete is primarily influenced by the water-to-cement ratio as all else being equal, the smaller the water content, the stronger the concrete. The mixture should contain just enough water to guarantee that each aggregate particle is entirely enveloped by the cement paste, that the gaps between the aggregate are filled, and that the concrete is liquid enough to be poured and distributed properly. Concrete is manufactured in large quantum as compared to any other synthetic substance. In construction, we use around 35 billion tons of concrete and mortar annually. There is widespread agreement that the unusual recent rise in cement and concrete consumption on a worldwide scale is attributable to a small number of emerging-market entities [1,2]. Natural resources are depleting as a result of the ongoing massive concrete consumption, resulting in significant environmental consequences. According to the global aggregates construction industry, it was predicted that there would be a rise in demand for aggregates of up to 59% by the time 2025.
Rapid industrialization, on the other hand, has resulted in waste management and disposal challenges due to the emergence of a throw-away society. About 420.3 million metric tons of electronic waste were produced globally from 2014 to 2022 [3]. E-waste generation has accelerated in recent decades due to a number of causes, including rising purchasing power and the accessibility of electronics, making it the fastest-growing waste stream globally. Projections indicate that by 2030, yearly global e-waste creation will have climbed by almost 30%, continuing the current trajectory. According to the United Nations, in 2021, each person on earth will produce an average of 7.6 kg of e-waste, which means the world will produce 57.4 million tons of e-waste. Only 17.4% of all discarded electronics are recycled through formal, controlled routes, with the majority of e-waste ending up in landfills [4]. The majority of the remaining waste's fate is unclear, which means vast quantities of precious recoverable raw materials are probably burned or dumped. E-waste in landfills contaminates the groundwater and the soil. Due to the significant number of hazardous materials, including mercury, lead, bromine, and arsenic, that our devices carry, the informal and unregulated treatment of e-waste poses a considerable risk to the health and wellbeing of both workers and communities as a whole. The reuse of E-waste as a substitute for aggregate in concrete production can help in mitigating and addressing the environmental pollution problems related to plastic. Recycling E-waste is an effective technique for minimizing solid waste, reducing the hazardous and harmful environmental impacts. Compared to natural aggregates, e-waste aggregates are light weight, thus minimizing fuel consumption and associated costs during transportation. Moreover, the production costs are relatively low[5]. Therefore, plastic concrete can be used as a lightweight building material with various advantages, ease of handling when consumed, reduction of production costs, and provision of adequate insulation. In addition, since the seismic force depends on the weight of the structure itself, the use of plastic aggregate reduces the weight of the concrete structure and minimizes the impact of earthquakes.
Ali et al. [6] replaced natural fine aggregate with plastic fine aggregate at same w/c ratio and reported that an increase in workability as the replacement level was increased from 10% to 20%. As the replacement level was increased from 10% to 20%, the increase in slump was reported to be from 100 mm to 163 mm. The lower water absorption capacity of plastic aggregates compared to natural aggregates, the relatively smooth surface texture of plastic sand, and the proper gradation of plastic fine aggregate (PFA) like natural sand are all factors that contribute to the higher workability of concrete. Also, the workability of concrete mixes with silica fume as a cement substitute was lower than that of concrete mixes with only PFA substitution. As the replacement levels of silica fume and plastic fine were increased from 10% to 20%, the slump value decreased to 50 mm to 12.5 mm. Abbas et al. [7] the workability of the sand coated recycled plastics HDPE and E-wastes has decreased as compared to uncoated plastic aggregate. The deposition of sand on the surface of the plastic aggregates changed their nature from hydrophobic to hydrophilic, resulting in lower workability of concrete. According to the results of a research performed by Manjunath [8], adding 15% of shredded electronic waste to concrete as a partial substitute for coarse aggregate has the potential to lower the material's compressive strength by as much as 34%. Saxena et al. [9] conducted research on the impact resistance, energy absorption, and residual compressive strength of concrete made of recycled plastic waste. They arrived at the conclusion that the combined effect of plastic as either a coarse or fine aggregate decreased the compressive strength of the concrete because of the inadequate coherent bond observed between the cementitious material and the plastic. On the other hand, the combination increased the impact resistance due to the ductile behavior of PA. This was the conclusion that they came to after conducting the research. According to [10] there is a problem with adhesion between the cement paste and the E-waste aggregate in addition to the hydrophobicity of plastic, there is a decrease of the amount of water entering the concrete specimen during the hydration process during curing. The smooth texture of E-waste aggregate is the cause of the reduction in strength. Additionally, the quantity of water increases because plastic aggregate has a low capacity for absorbing water. Strength reduction depends on different factors so the reason may be different for strength reduction. As compared to NCA plastic aggregate has low stiffness and strength. The percentage of e-waste that was replaced with NCA resulted in a drop in split tensile strength by 23.5%, 30.9%, and 32.4%, at 10%, 15%, and 20%, respectively. The split tensile strength of the concrete decreased proportionately as the amount of recycled electronic waste aggregate included inside the concrete increased. Both the tensile and compressive strength values of the material saw a decrease of between 23 and 32% and between 6 and 17%, respectively. This issue may be traced back to the formation of a fragile connection between the aggregate composed of e-waste and cement. Authers [11,12] reported the impact of plastic waste such as high-density polyethylene (HDPE) and polyethylene terephthalate (PET) on concrete performance. The replacement rate of plastic waste was 0-10% (by volume) of course aggregate. The results show that when the coarse aggregate was replaced by his PET aggregate by 10%, the smallest decrease in CS was 35% and a21% increase in split tensile strength was observed. Additionally, a 4% decrease in fresh unit density was reported. According to Kumar et al. [13], the mechanical characteristics of concrete were noticeably diminished when compared to control concrete when coarse aggregate was partially replaced with plastic aggregate up to 50% with an increment of 10%. The compressive strength and flexure strength of concrete containing 15% E-waste aggregate were found to be, respectively, reduced by 20.35% and 15.69% with respect to the control mix by Rathore et al.'s investigation into the effects of different percentages of E-waste plastic, i.e., 5%, 10%, 15%, 20%, 25%, and 30% on the behavior of concrete. They stated that the substitution of E-waste is unsatisfactory for construction purposes by more than 15%.
Durability is a key feature of structural concrete, in addition to its strength traits. Durability tests were also conducted to look at the features of plastic concrete's durability, and the findings showed that concrete containing plastic aggregate and treated plastic aggregate is acceptable and performs better than control concrete.

2. Research Significance

According to a quick review of the literature, non-manufactured E-waste aggregates including cleaning, sorting, and grinding or shredding the E-waste have been the main focus of the many forms of plastic concrete study. According to the literature assessment, there hasn't been a thorough investigation into the behavior of concrete with manufactured plastic coarse aggregate and recycled plastic aggregate. This study focused on utilizing the manufactured PCA through the proper heating procedure of shape and size comparable to NCA. Previous research has shown that adding plastic to concrete has reduced its strength properties. The decrease in strength was caused by the poor bond between recycled PA and cement paste as well as by the hydrophobic nature of PA particles. The primary factor contributing to a reduction in strength properties is a lack of strong bonding between plastic aggregates and cement paste. To increase the strength of concrete recycled PA is treated with sand and SF because varying the surface friction improved binding properties of plastic concrete and ultimately strength of concrete.

3. Material

OPC (Type-I was employed as the binding material for this project, as specified by ASTM C150 [14]. Both the physical and chemical properties of OPC are shown in Table 1. Naturally available sand of the Margalla quarry and natural coarse aggregates of pathargarh brand were used in this research work. Granulometry analysis of natural coarse aggregates and plastic coarse aggregates is shown in Figure 1. The particle size distribution of NCA and PCA was determined using ASTM C33/C33M [15]. The maximum and minimum nominal size of NCA are 19 mm and 4.75 mm, respectively. All concrete mixtures were made with regular tap water that was devoid of organic matter. General properties of the various materials employed in the current work are listed in Table 2.
E-waste is the source of plastic utilized to manufacture artificial aggregate. The electronic trash consisted of locally accessible debris from LCDs, laptops, monitors, refrigerators, and printers, and the salvaged plastic was ABS plastic. The plastic aggregates in this research are generated via distinct steps of processing. To begin, the plastic was washed to get rid of any dust or mud that may have gotten on it. The second process involves shredding or flaking tiny pieces of plastic from E-waste using an electric crusher. Third, e-waste flakes were heated in a kiln to remove any remaining impurities. ABS material melts at roughly 100 to 115 °C. The kiln temperature was adjusted at 200 °C to assure proper melting [16,17]. Plastic flakes were cooled in water after melting to make plastic boulders. Finally, plastic aggregates were created by crushing the plastic boulders. The maximum size of PA is 19 mm. Schematic diagram of manufacturing process of plastic aggregate is shown in Figure 3.
Sand treatment for plastic aggregate was done in hot sand. The sand was first heated in a pan for 15 minutes, then it was added and well mixed with the hot sand until it covered the whole surface of the plastic. Silica fume treatment of plastic aggregate was done in the same way. During this process proper safety precautions should be taken. The shapes of PA both treated and untreated are shown in Figure 2.

4. Experimental Methods

Previous research indicated that adding plastics to concrete decreased its strength properties and considered it inappropriate for use in load-bearing infrastructures. Concrete made using recycled plastic aggregate is less strong and more brittle than conventional concrete because of the poor bonding between the cement and plastic aggregates. To improve the bonding capacities of recycled plastic aggregates and cement, sand and silica afume coating on the surface of recycled plastics was carried out to enhance the strength of concrete containing recycled plastics. Use of a super plasticizer called SP-675 at a rate of 0.5% by weight of cement to improves its workability status. A total of 50 concrete cylinders of size 150 × 300 mm and 40 concrete cubes of 150 × 150 mm and 20 cubes of 100 × 100 mm and 10 concrete slabs of 200 × 200 and 10 concrete prisms 50 × 50 mm were considered including control mixes and 10%, 15%, and 20% replacement of natural coarse aggregates with sand coated and silica fume coated E-wastes aggregate as a partial replacement with or without sand and silica fume of E-wastes aggregates. The concrete mix ratio used for current research work is 1:1.5:3. The water cement ratio adopted is 0.45. A total eleven types of tests are performed on concrete samples to determine the fresh and hardened properties of concrete made with 3 types of recycled plastic aggregates (PA and PSA and PSFA electronic wastes). The total number of samples tested in the current study along with standards is shown in Table 3.
After rheological and harden properties the concrete is then accessed for it durability.Firstly, rehological properties concrete including workability as per ASTM C143 along with fresh and dry densities of the green concrete were evaluated following ASTM C138 and BS EN 12390-7. Secondly, harden pproperties i-e compressive and tensile strength of concrete cylinders were then accessed following the protocol of ASTM C39 and ASTM C496 using 28 days normal water cured specimens. Lastly, age dependent, durability driven properties of the specimens were investigated covering water absorption and sorptivity for permiablity assessment, abration resistence, resistance against acid attack, thermal performce and forensic analysis based on electron microscopy.

5. Results & Discussion
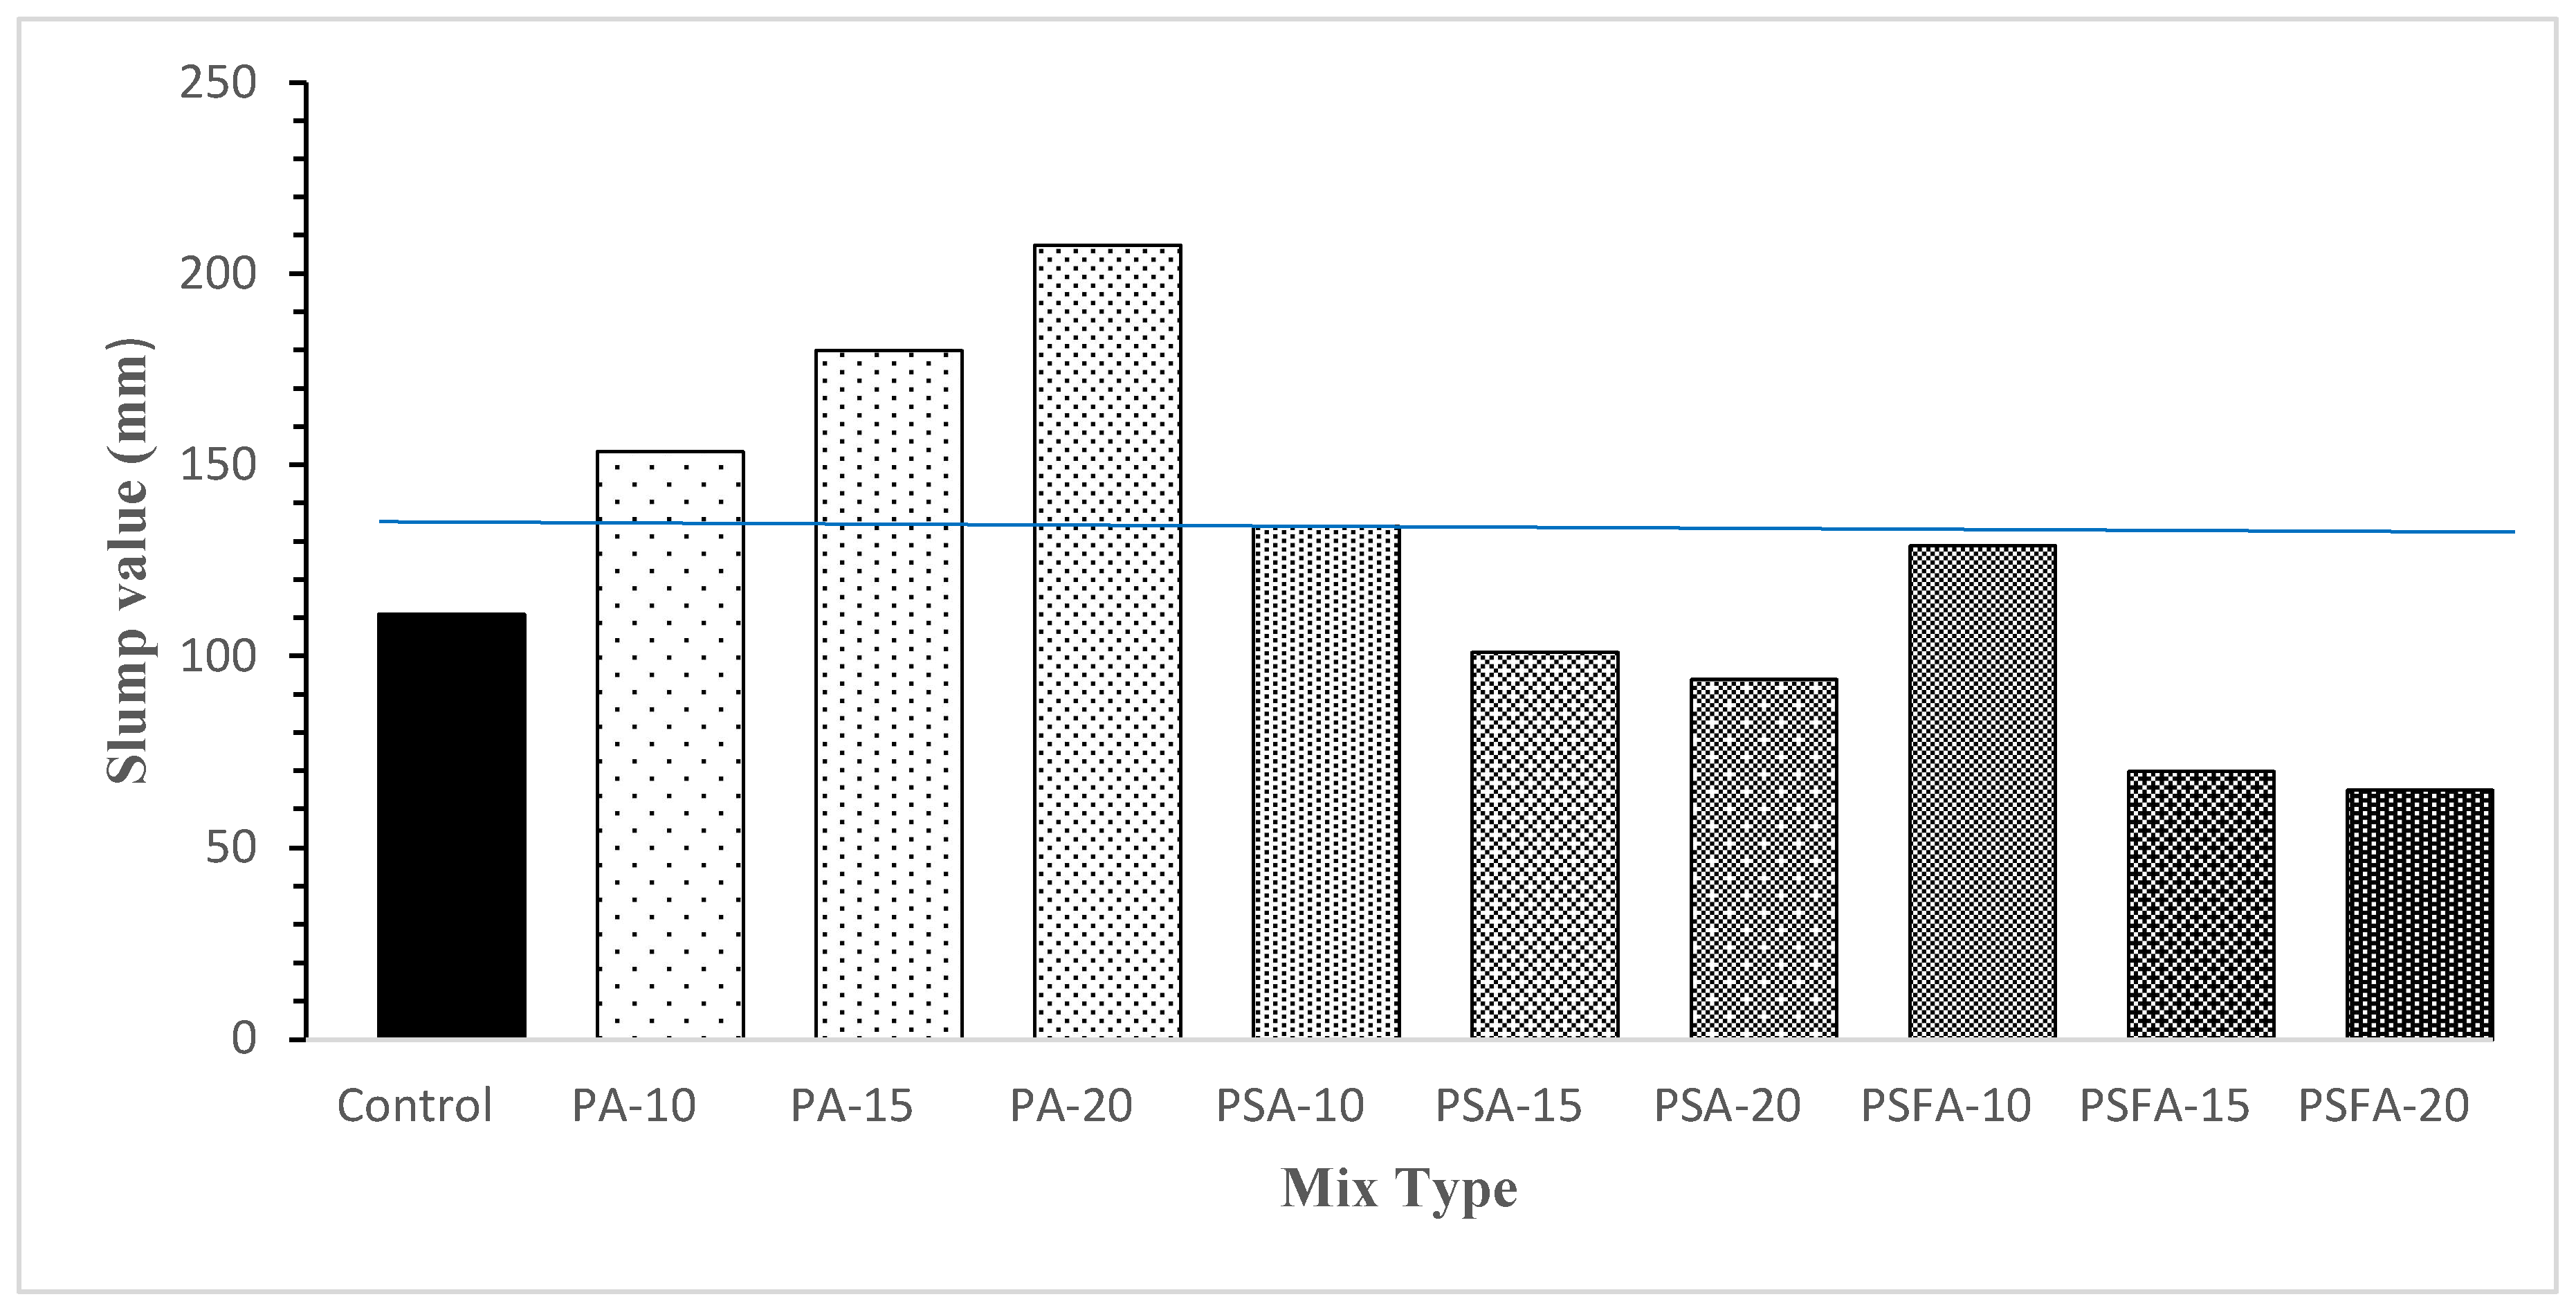
5.1. Workability

The workability of freshly mixed concrete refers to its quality of being easy to mix, place, compact, and finish. The workability of concrete is assessed using slump tests in accordance with ASTM C143/C143M [18]. The test results of plastic aggregate (PA), PA treated with sand (PSA) and PA treated with silica fume (PSFA) are presented in Figure 4. This increased workability of concrete may be ascribed to the low water absorption capacity of PA compared to NA, the comparatively smooth surface texture of PA, and the same grading of PCA and NA. A comparable improvement in workability was observed by Ahmad et al. [26]. However, few researchers have shown that the uneven size and form of shredded PA reduces the workability of concrete containing PA. In this research, produced PCA with suitable size and shape control was employed, leading to greater workability as compared to mineral aggregate concrete. The test findings reveal that for a constant W/C ratio, slump values rise as the proportion of PA increases. In terms of control mix, the workability of PA rises by 27.45%, 38.33%, and 46.5% for 10%, 15%, and 20% PCA substitution, respectively. The workability of PSA and PSFA decreases with an increasing percentage of PCA. The lowered workability values were related to change in nature of PA from hydrophobic to hydrophilic, which not only enhances bonding qualities with cement paste but also absorbs more water than untreated PA, which are more water repellant and hydrophobic. The same result was also reported by Abbas et al. [7]

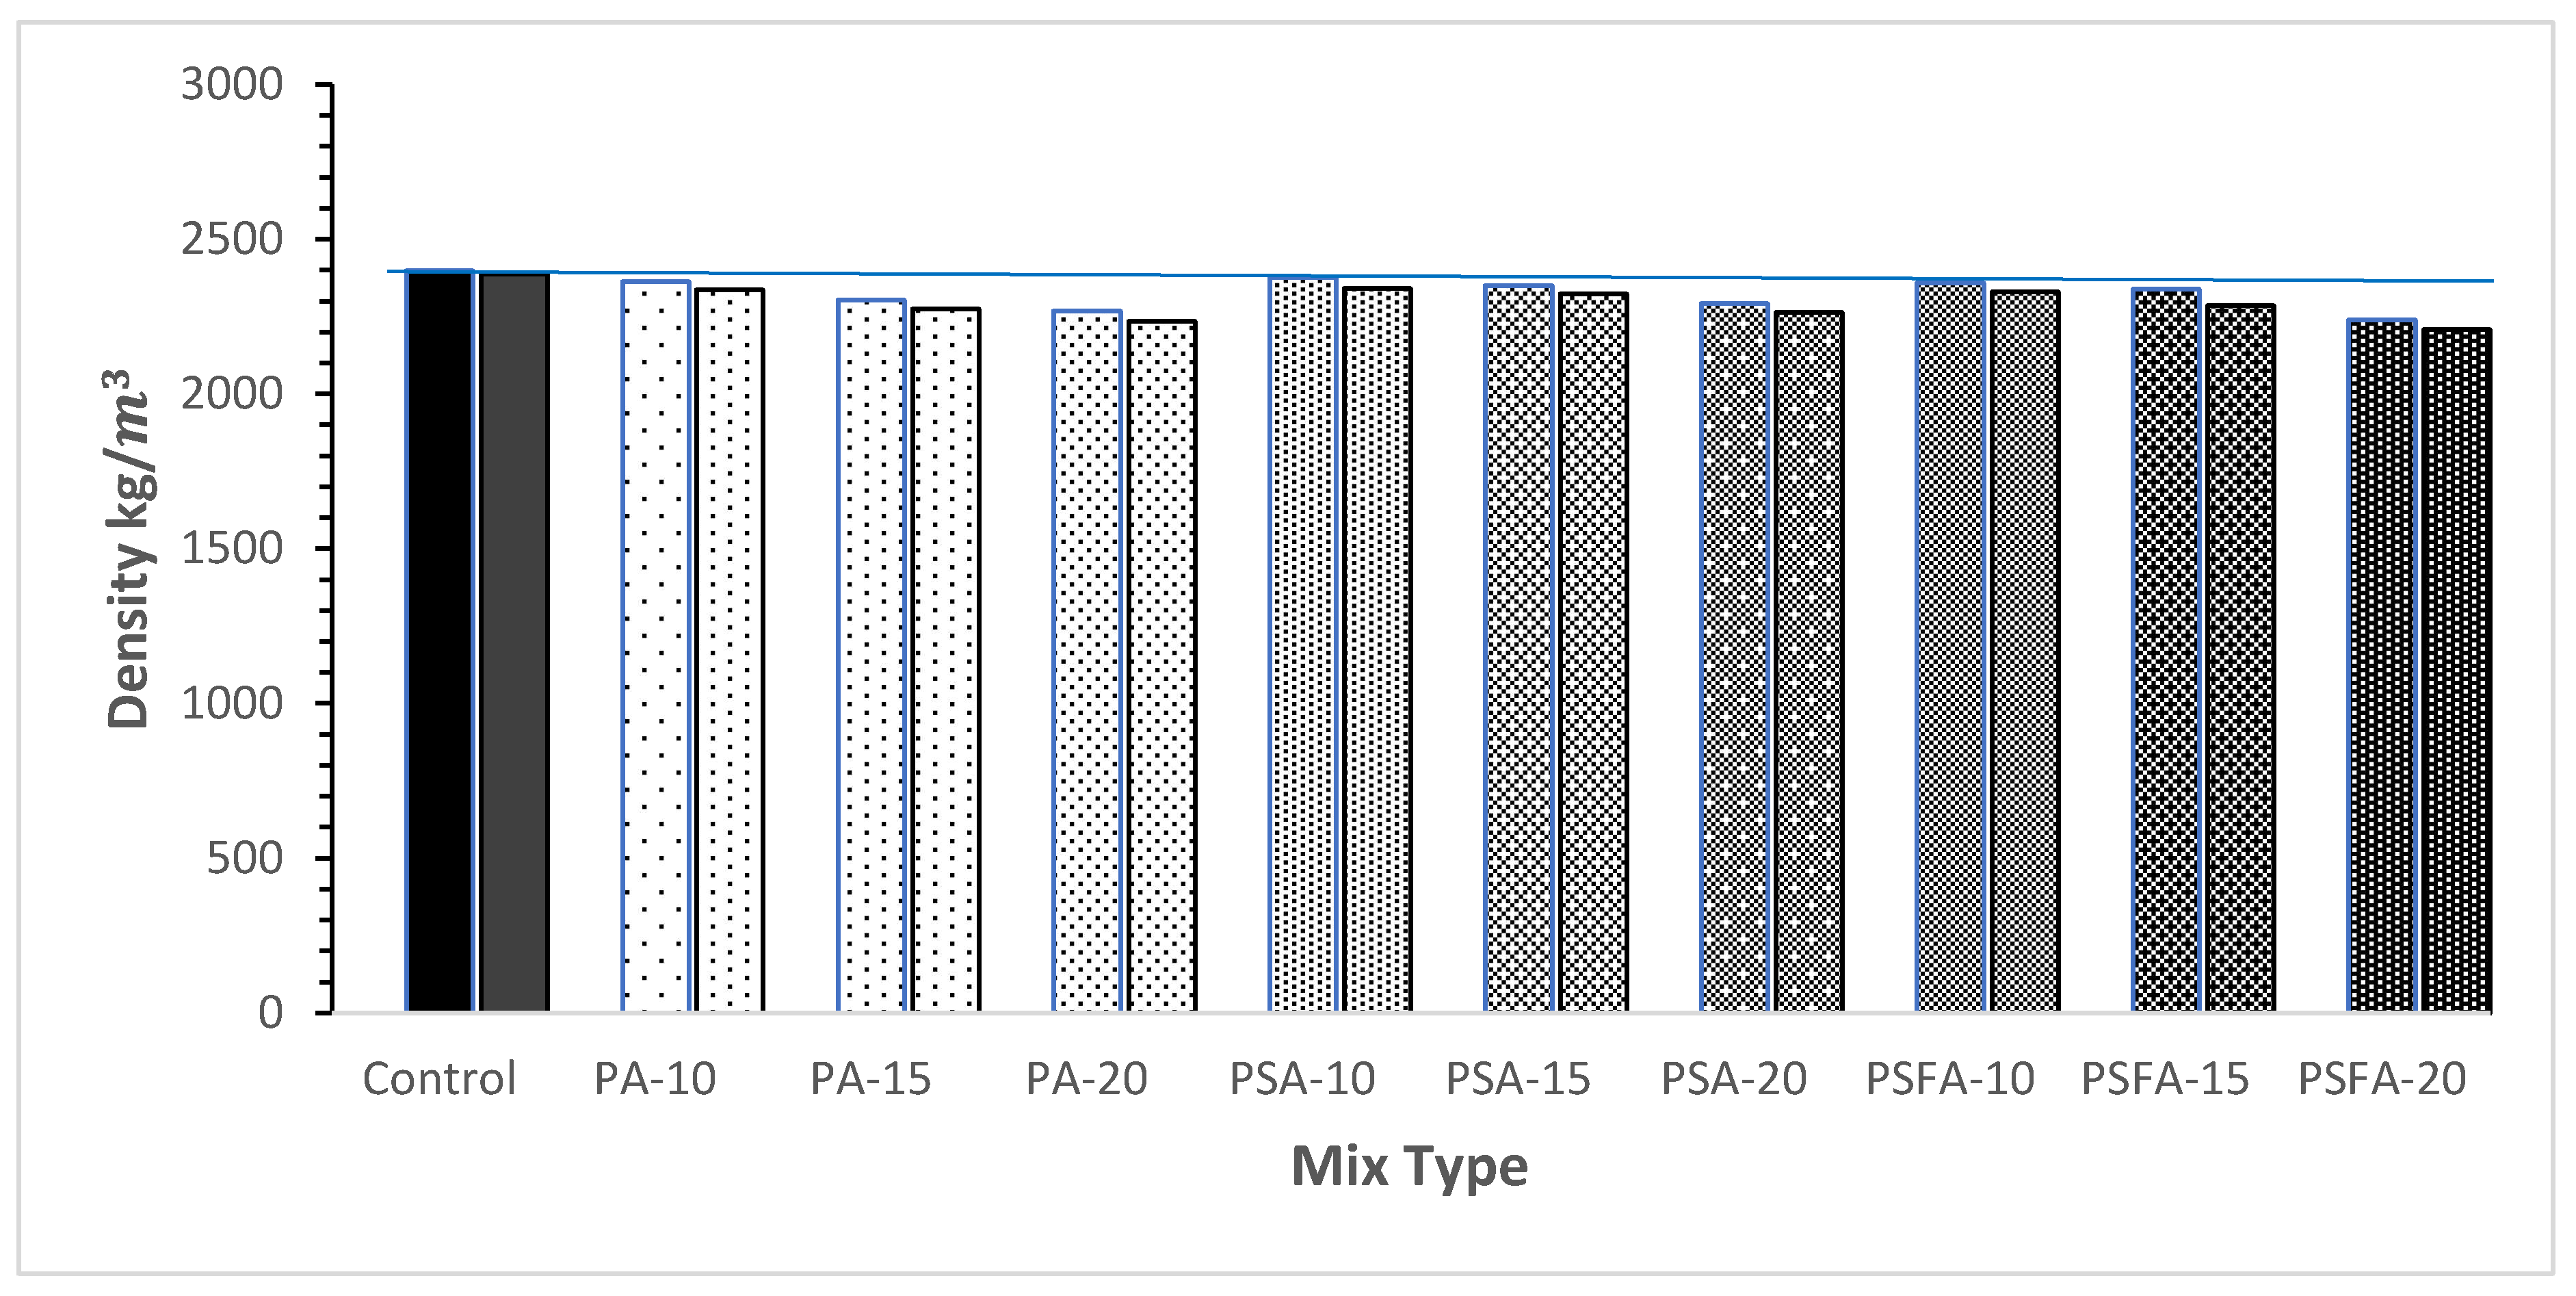
5.2. Fresh and Dry Density

Concrete's fresh and dry densities depend on the unit weight of the materials and mix proportions. The fresh and dry density of concrete containing PCA was lower than that of the control sample because PCA had a lower unit weight. The findings of the fresh and dry concrete densities are shown in Figure 5. The fresh density of concrete with untreated PA was 2362.99 kg/ m 3 , 2303.33 kg/ m 3 , 2268.55 kg/ m 3 at replacement ratio of 10%, 15% and 20%. The drop in fresh density of untreated PA is 1.5%, 4.4%, and 5.4% relative to the control mixture. The maximum fresh density drop with 20% untreated PA is 5.4%. The fresh density of treated PA with sand is higher than that of untreated PA and treated PA with SF. At maximum replacement ratio of 20% the fresh density of treated PA with sand is 1.2% greater than the untreated PA and 2.5% higher than treated PA with SF. Heru et al. [27] reported that concrete made with untreated PCA is usually 10–14% lighter than concrete made with sand-treated PCA. The fresh density of PA treated with silica fume also decreases with increasing percentage of PA. The maximum reduction in fresh density at 20% of treated PA with SF is 7.5% in comparison with control mix. In previous research the similar trend of decreasing in fresh density of concrete incorporating with PCA was reported Alagu Sankareswari et al. [28]

5.3. Mechanical Property of Concrete

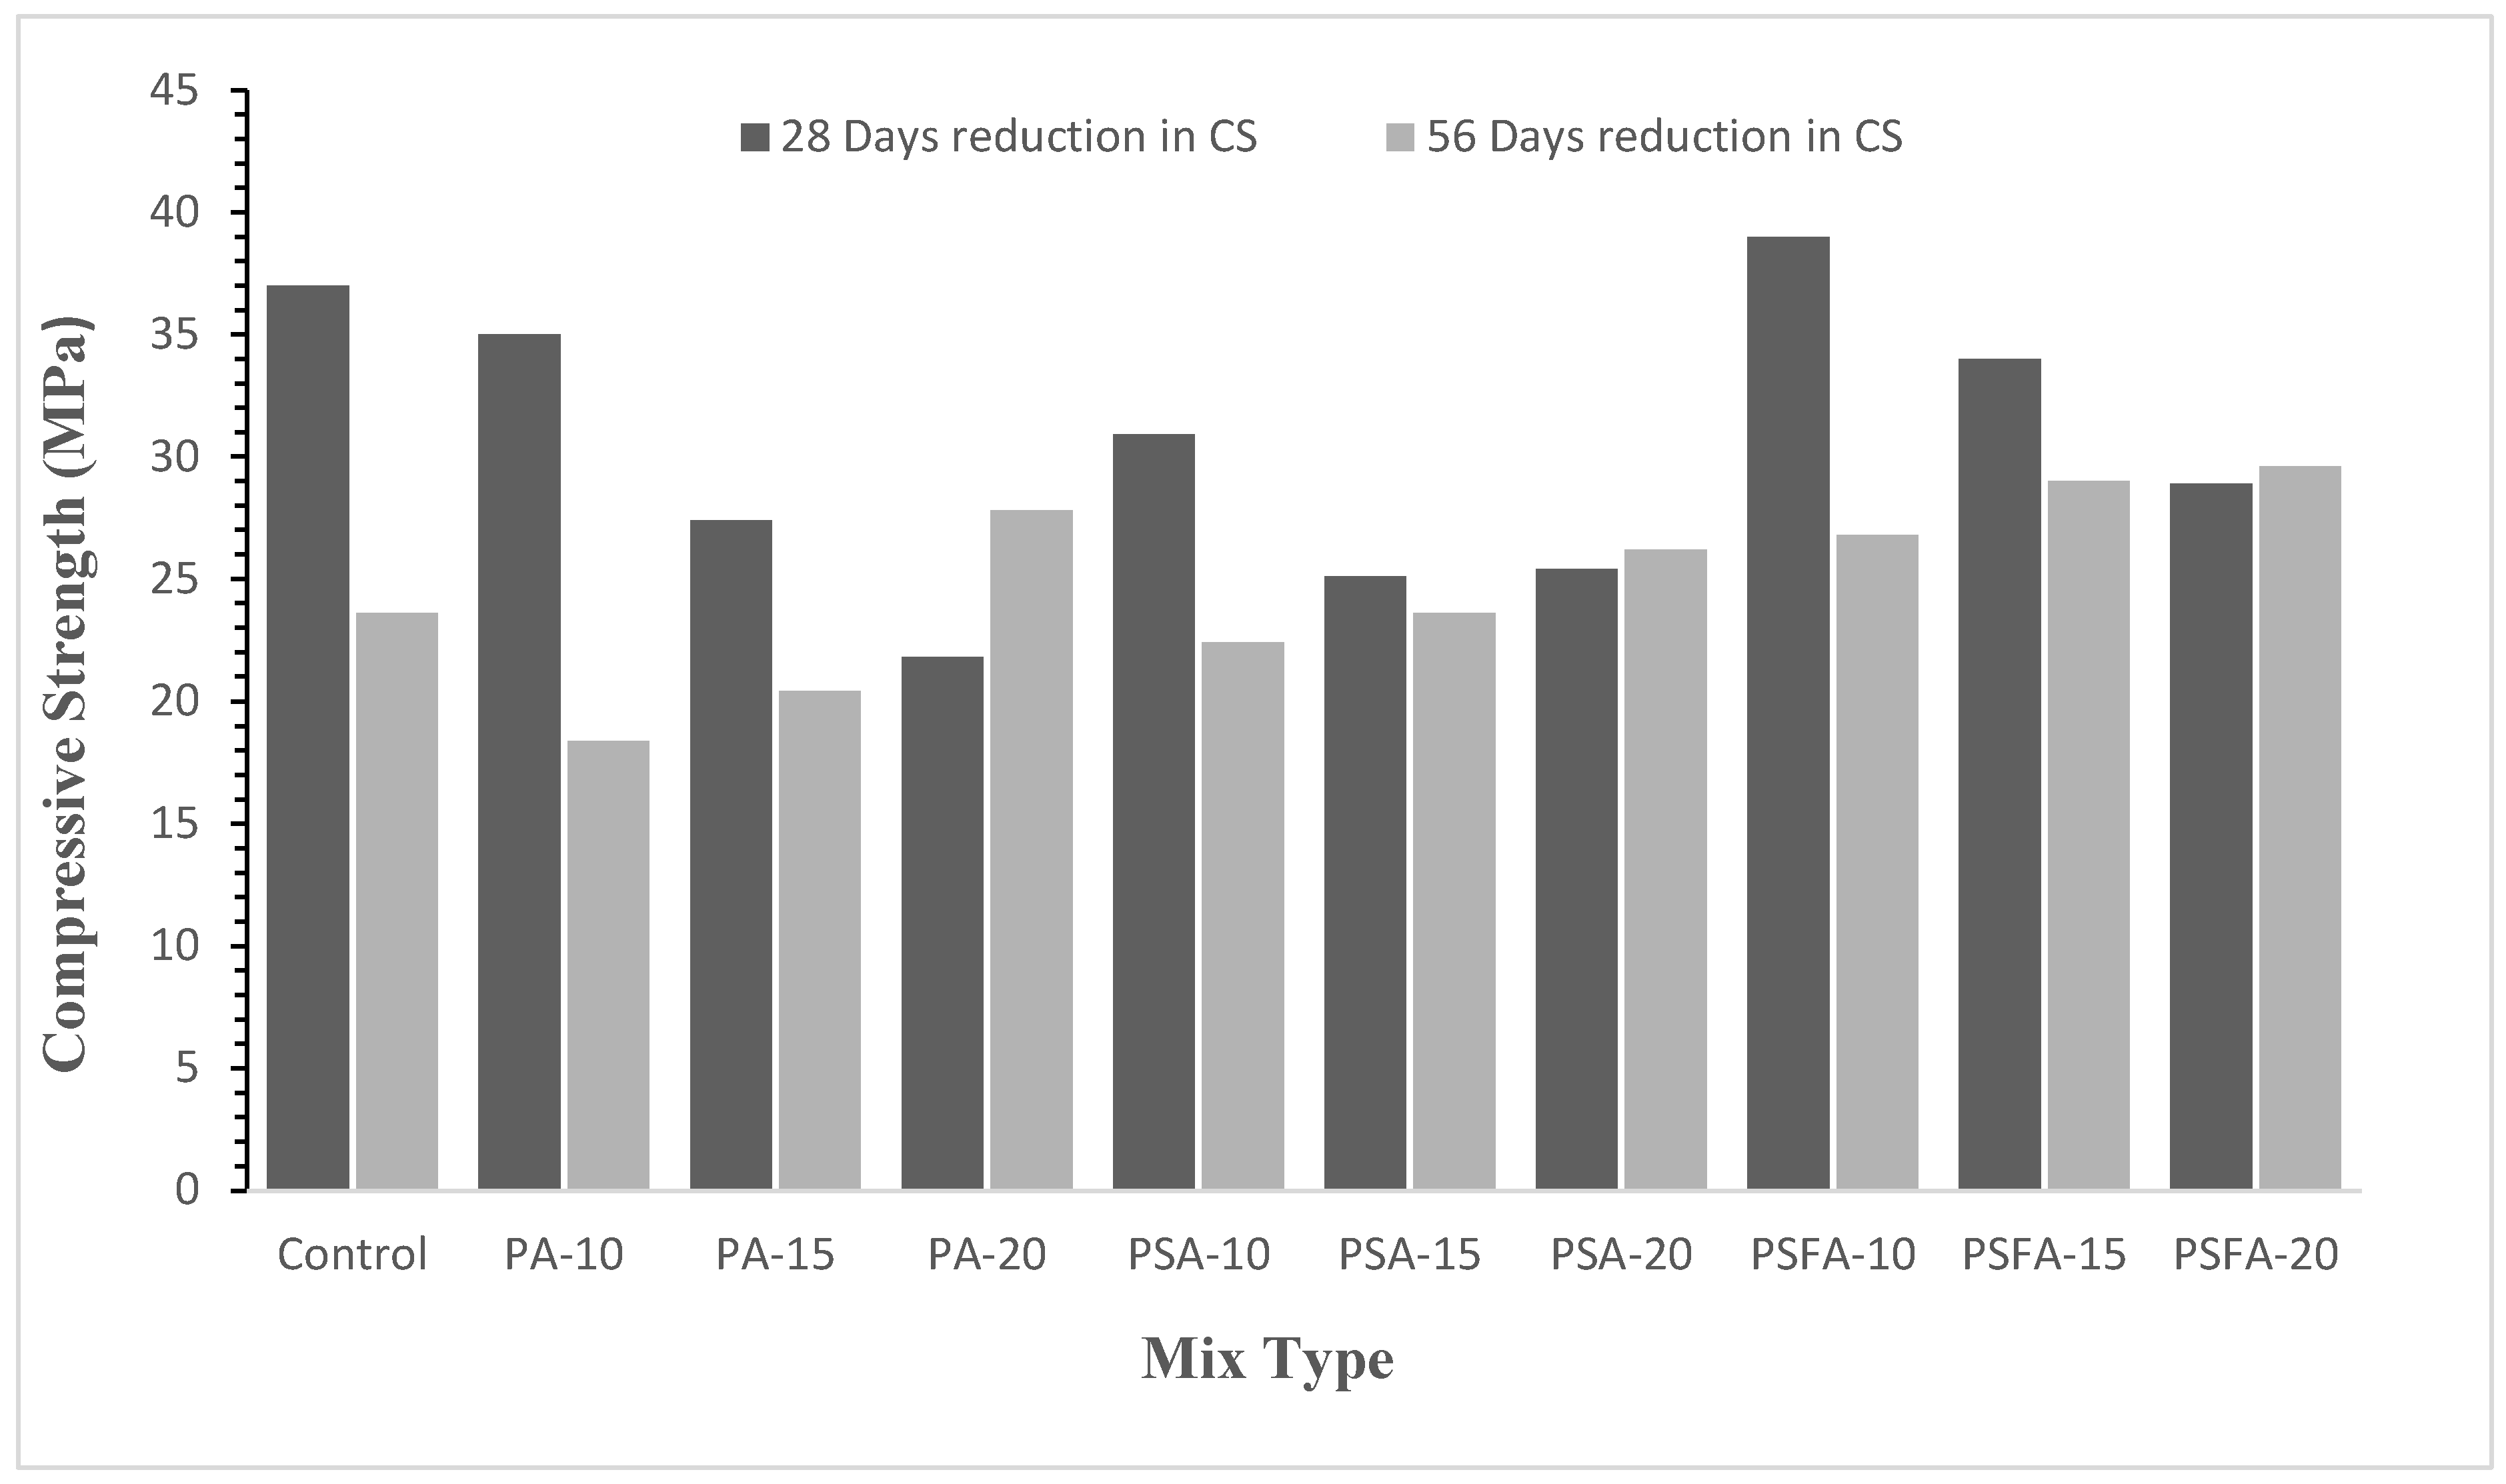
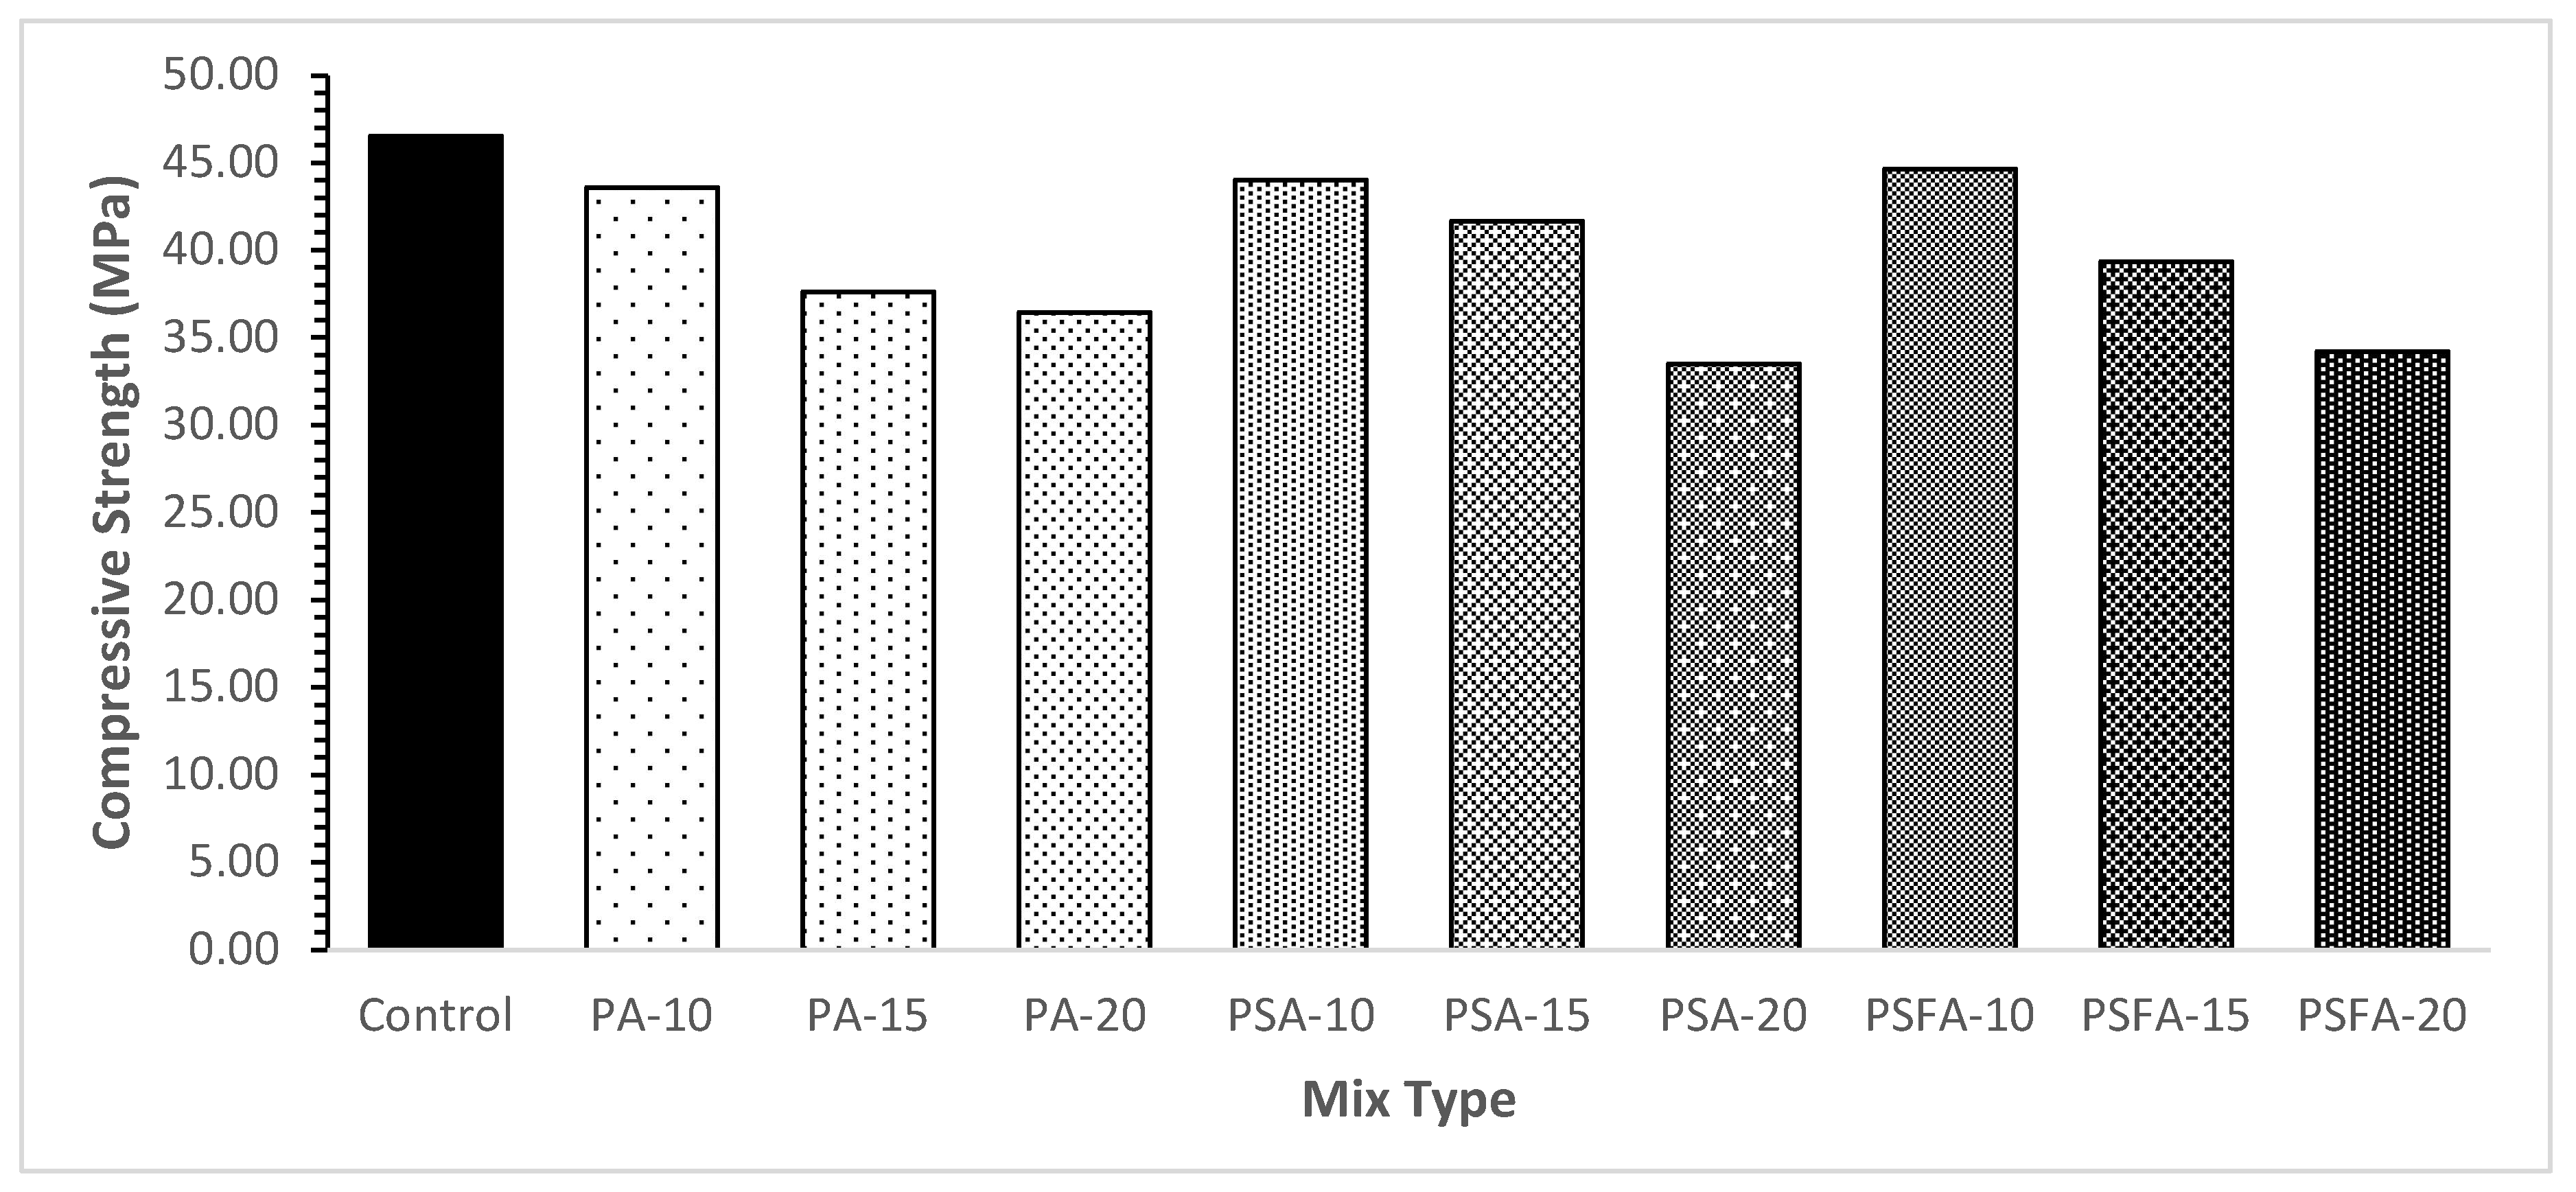
5.3.1. Compressive Strength

ASTM C39/C39M [21] was used to assess compressive strength (CS). A total of 30 concrete cylinders measuring 150×300 mm was cast and cured for a period of 28 days. Sand capping was used to cover the tops of the cylinders so that a uniform amount of pressure could be applied to them by a machine's loading platen. Figure 6 depicts the compressive strength variations of concrete mixes as a function of different percentages of three types of recycled plastic aggregates used as a partial replacement for NCA. The CS of the control sample is 46.51Mpa, while the CS of concrete with 10%, 15%, and 20% PCA were 43.60 MPa, 37.64 MPa, and 36.46 MPa, respectively. The strength was reduced by 21.7% at the point of maximal substitution of untreated PA. The CS of concrete with 10%, 15%, and 20% PA substitution treated with sand was 44.04 MPa, 41.68 MPa, and 33.04 MPa, respectively. At optimum replacement of treated PA with sand, the strength was reduced by 27.95 percent. The strength of concrete with 10%, 15%, and 20% PA substitution treated with SF is 44.66 MPa, 39.34 MPa, and 37.87 MPa, respectively. Optimum substitution of treated PA with silica fume reduced its strength by 18.58 percent. The decrease in compressive strength was caused by the poor bond between recycled PA and cement paste as well as by the hydrophobic nature of PA particles. This has been observed in previous studies. Islam et al. [29] discovered that plastics are hydrophobic and that recycled plastics have almost no water absorption, resulting in excess water around the plastic aggregates. Because of this excess water, a film will form around the plastic aggregates, which will result in a weaker bond between the cement paste and the recycled plastics. Reviewing the results of previous studies, Lee et al. [30] came to the conclusion that the primary factor contributing to a reduction in strength properties is a lack of strong bonding between plastic aggregates and cement paste. Past literature reported that Sand treated plastic coarse aggregate improves the bonding between cement paste and recycled PA. According to Heru et al. [27] sand-treated plastic coarse aggregate has higher compressive strength than untreated plastic coarse aggregate. It also improves the bond between cement paste and causes fewer cracks to show up on the surface of concrete cylinder specimens.

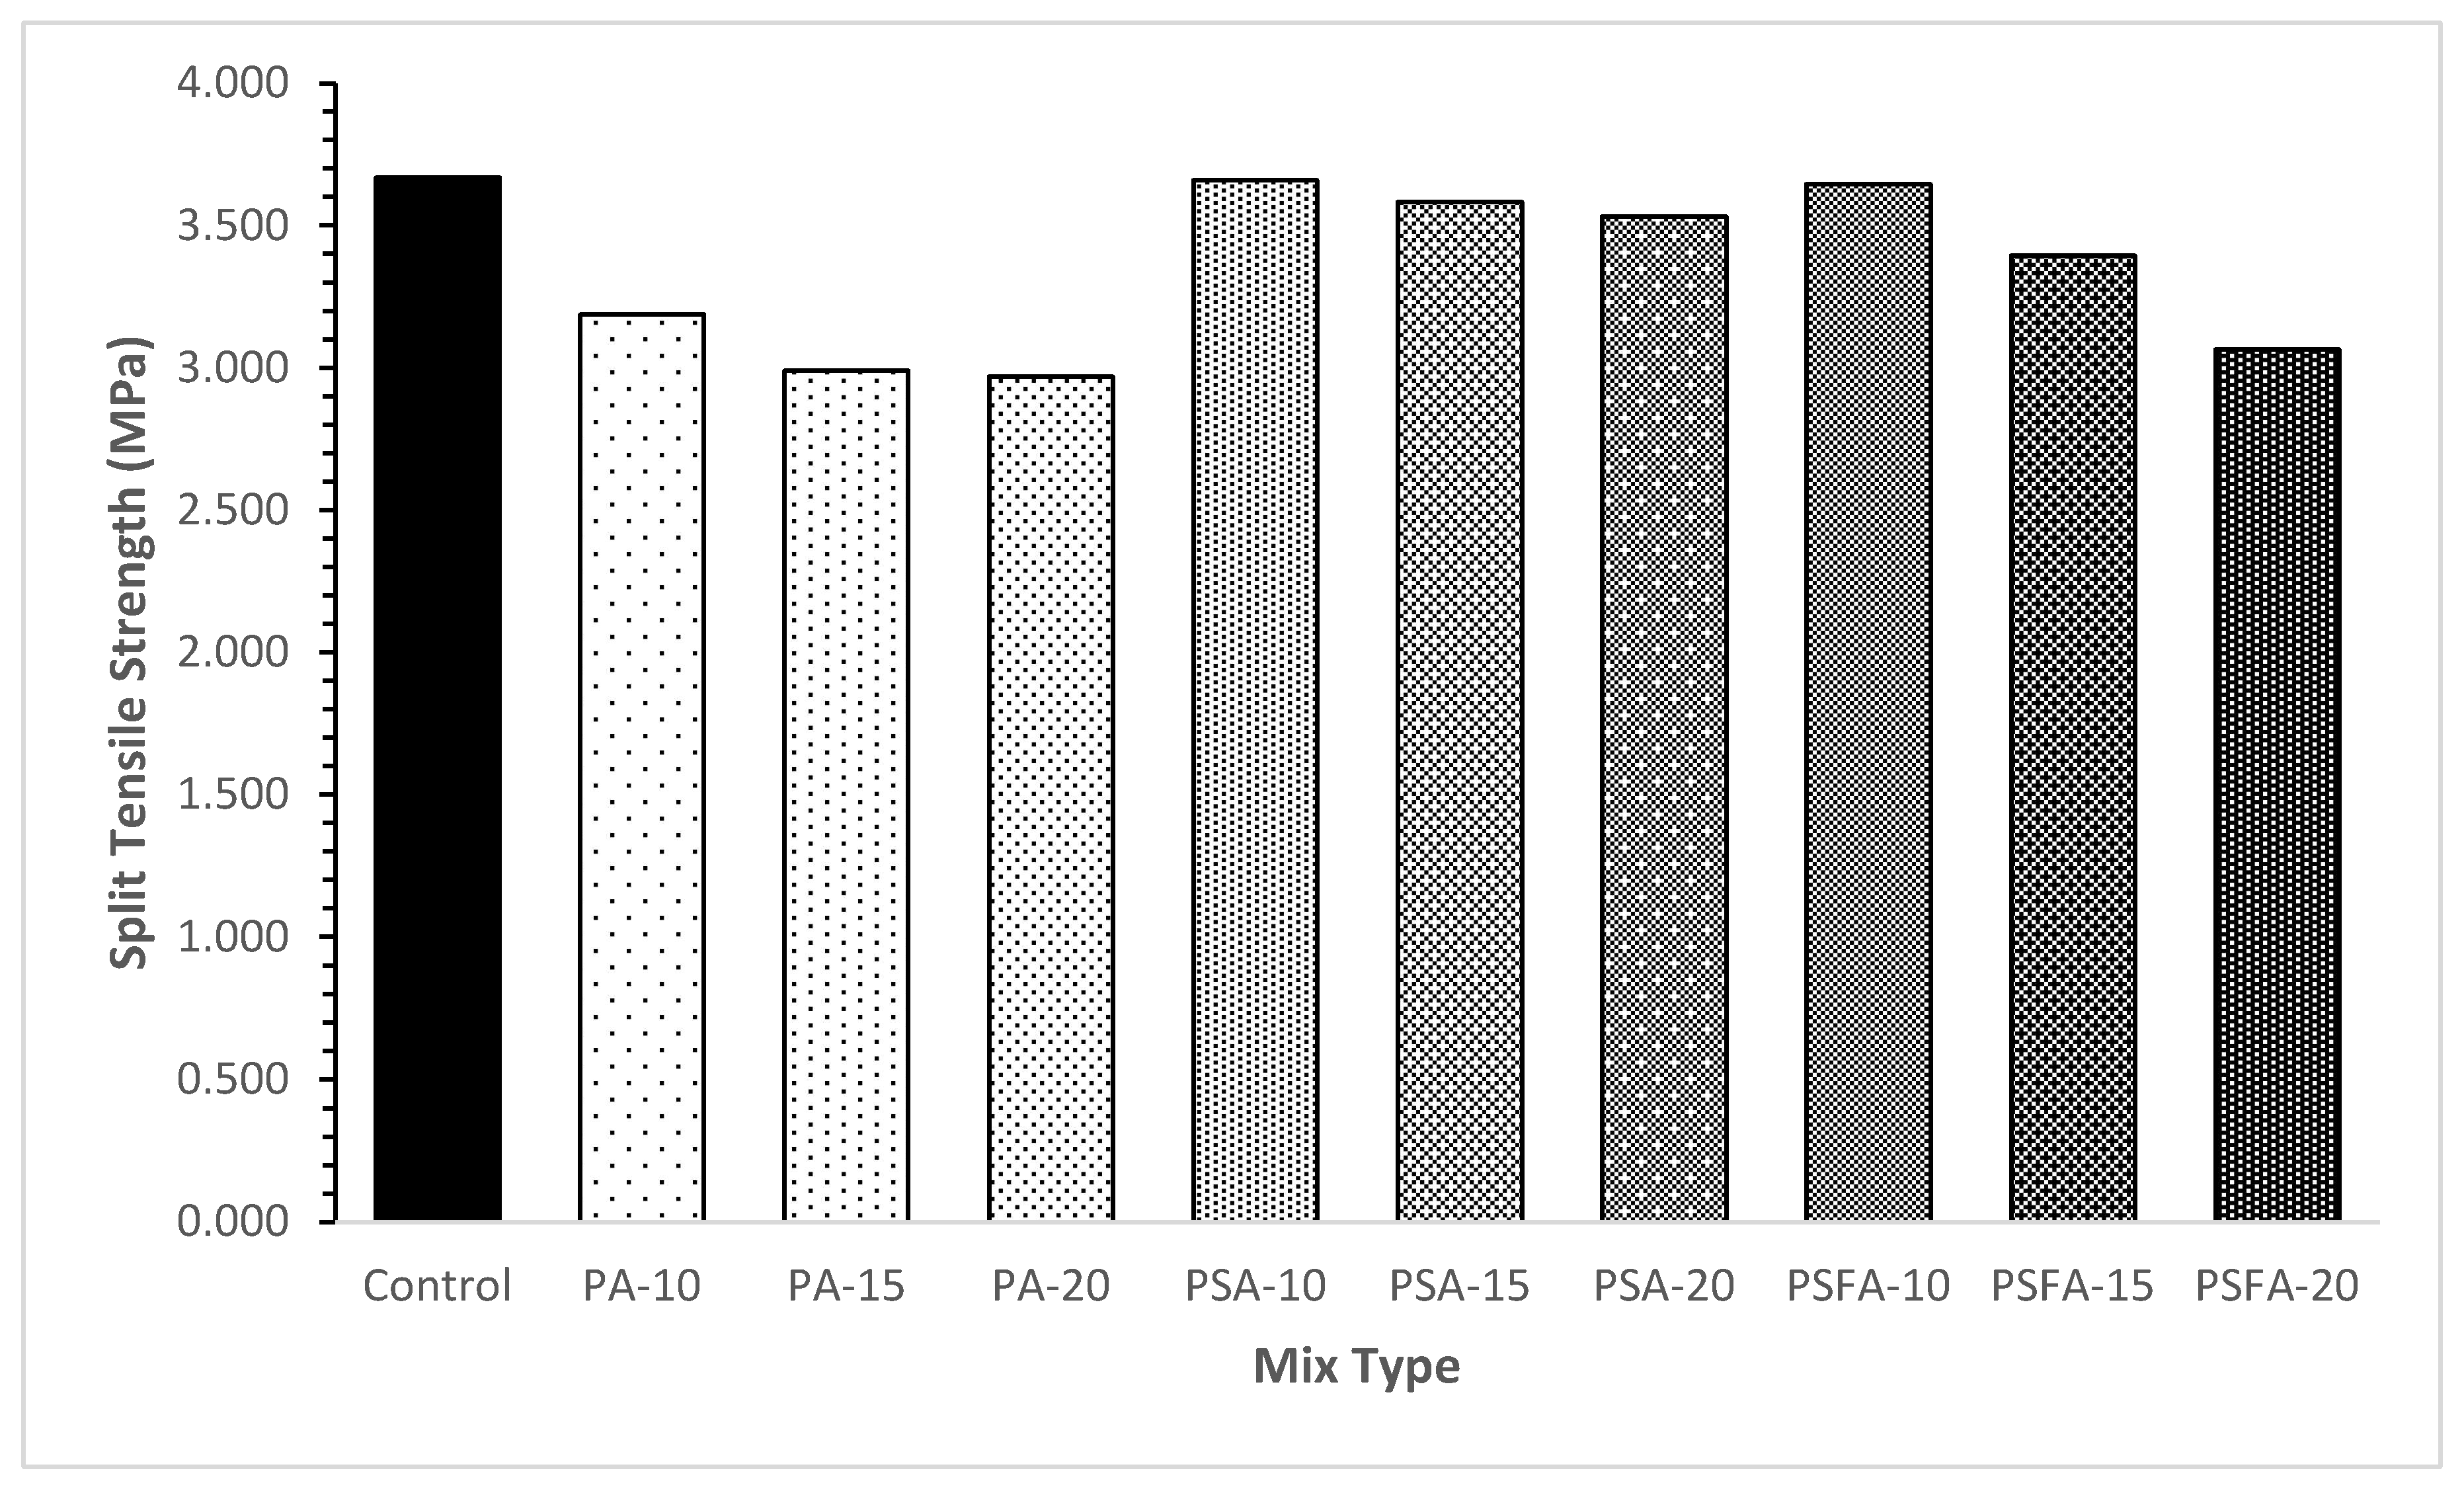
5.3.2. Split Tensile Strength

The split tensile strength is calculated using ASTM C 496/C496M [22]. A total of thirty 300 mm ×150 mm concrete cylinders were cast, and then water cured for 28 days. Figure 7 illustrates how the split tensile strength of concrete mixes varies when varying proportions of three kinds of recycled PA partly replace NCA. The split tensile strength of the control mixture is 3.699 MPa, but the strengths of concrete containing 10%, 15%, and 20% PCA were 3.188 N / m m 2 , 2.990 N / m m 2 , and 2.971 N / m m 2 ,, respectively. Drop in strength at maximum replacement ratio of untreated PA was 19.0%. The concrete's split tensile strength was 3.659 N / m m 2 , 3.584 N / m m 2 , and 3.532 N / m m 2 when PA treated with sand is replaced by 10%, 15%, and 20%, respectively. Optimum substitution of treated PA with sand reduced strength by 3.7%. Strength of concrete containing 10%, 15%, and 20% substitution of PA treated with silica fume were 3.645 N / m m 2 , 3.395 N / m m 2 , and 3.065 N / m m 2 . Reduction in strength at maximum replacement of treated PA with SF is 16.5%. Past literature reported that Sand treated plastic coarse aggregate improves the bond between cement paste and recycled PA Lee et al. [30] Concrete mixes with sand-treated PA had greater split tensile strength than concrete mixes with untreated PA reported by Abbas et al. [7]

5.4. Durability Properties

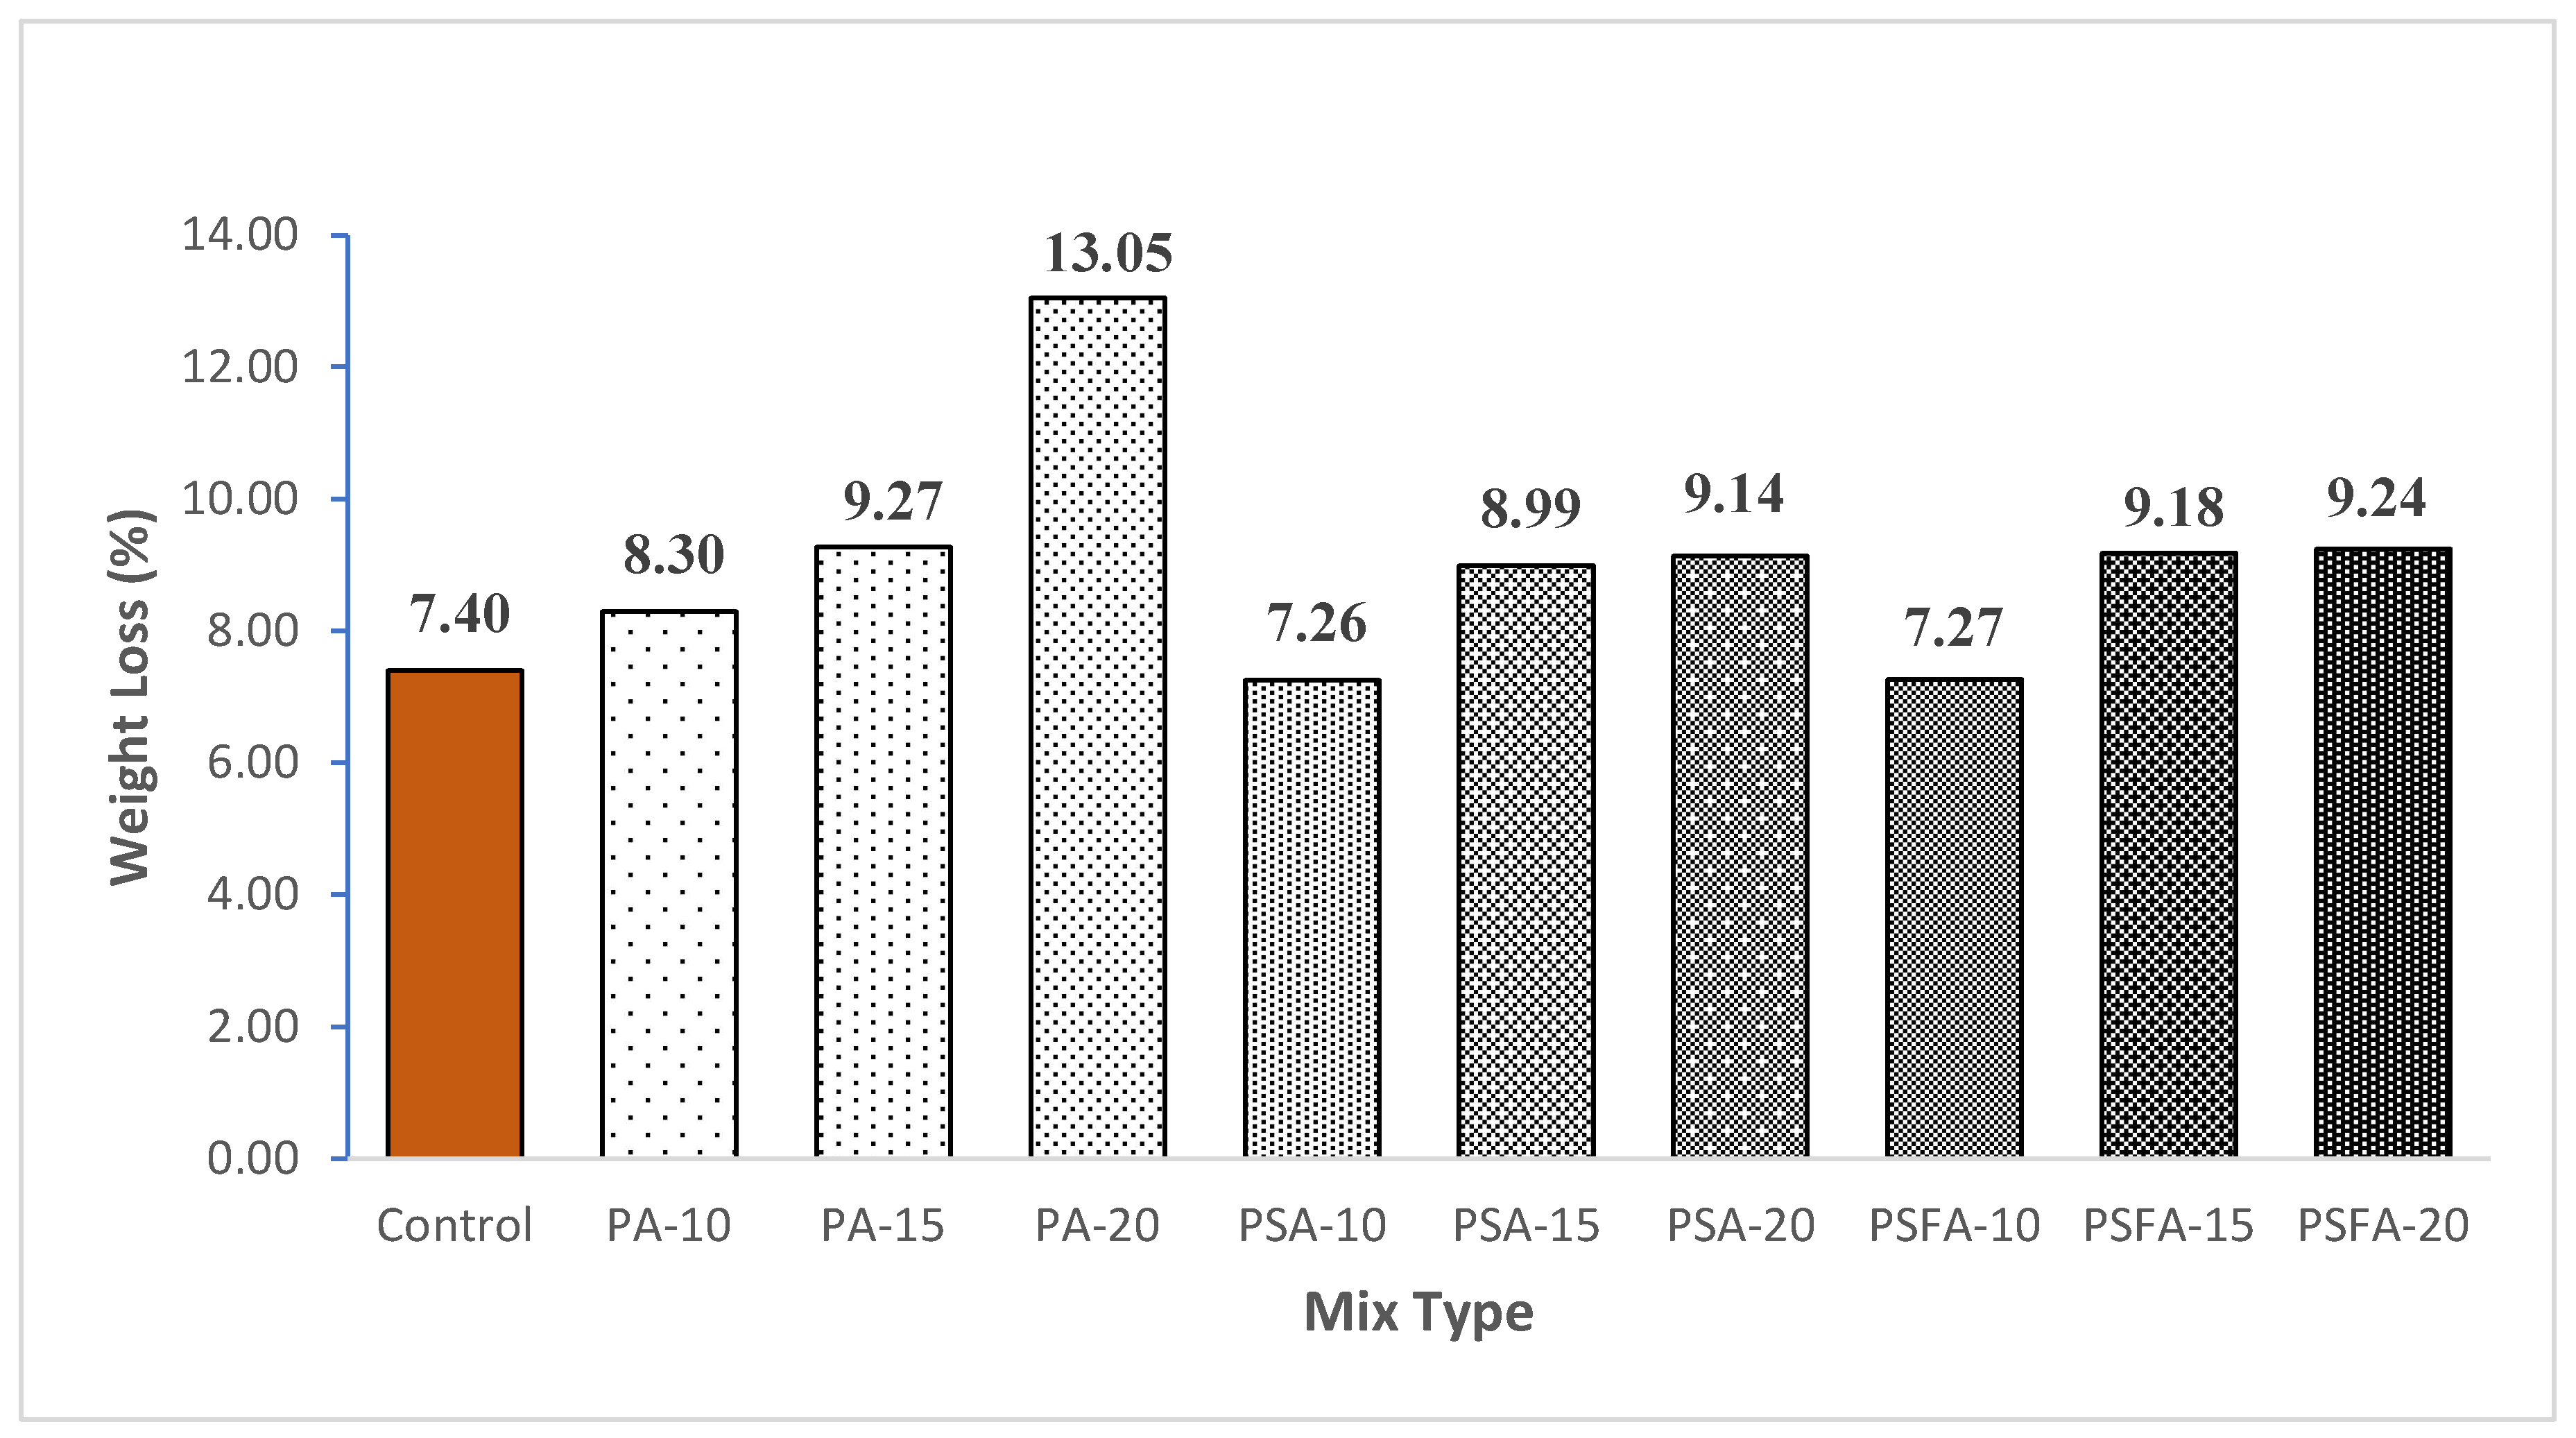
5.4.1. Abrasion Resistance

According to ASTM C131/C131M [25] abrasion resistance (AR) was examined. A total of 10 concrete cylinders measuring 300×150 mm is cast and cured for 28 days. Figure 8 illustrates the range of percentage weight loss of abrasion resistance tests for various concrete mixtures. With reference to control mix, the abrasion resistance increases with increasing content of PA. Increase in weight loss at maximum replacement ratio of untreated PA was 176% with reference to control mix. Sand treated PA with a replacement ratio of 10% decreases the weight loss up to 1.89% but the weight loss increases with replacement ratio of 15% and 20% of PA treated with sand. Similar trend was found with PA treated with silica fume. According to Grdic et al.[31] the AR of concrete is dependent on the mechanical properties of concrete, namely its compressive and tensile strengths. This indicates that concrete mixtures with greater compressive and tensile strengths also possess greater AR. Inzimam et al. also observed the same mixes with greater compressive and tensile strengths lose less weight Haq et al.[32]. A similar trend was found in current study.

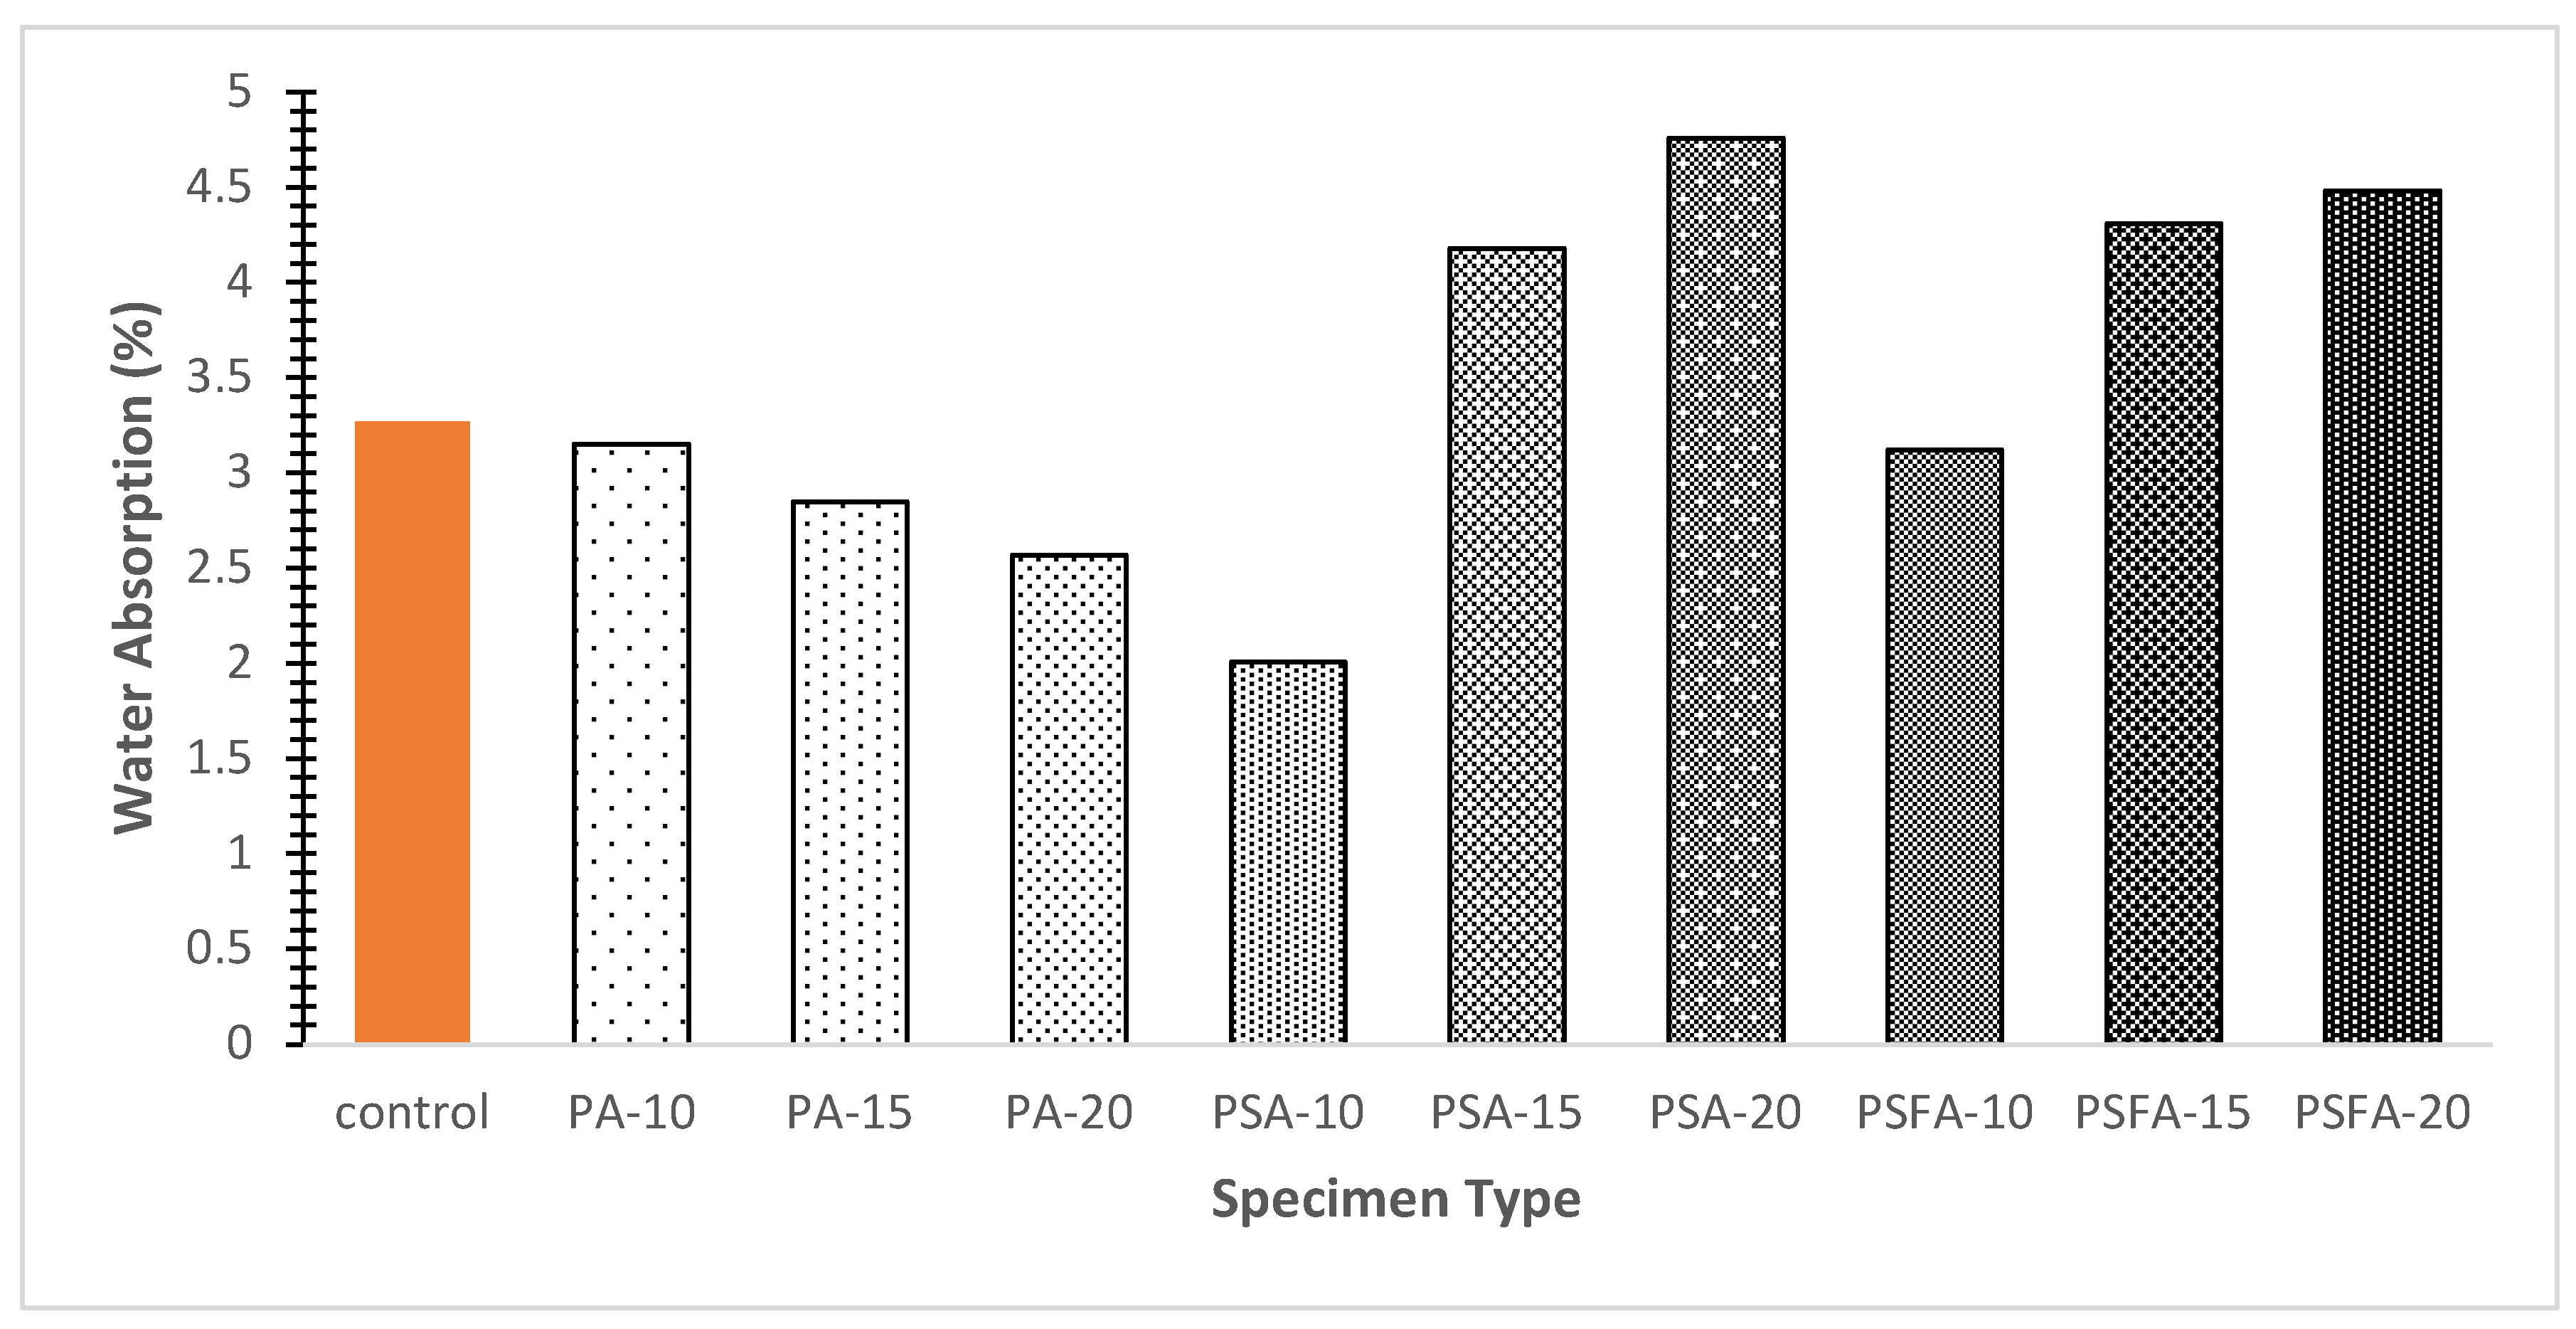
5.4.2. Water Absorption
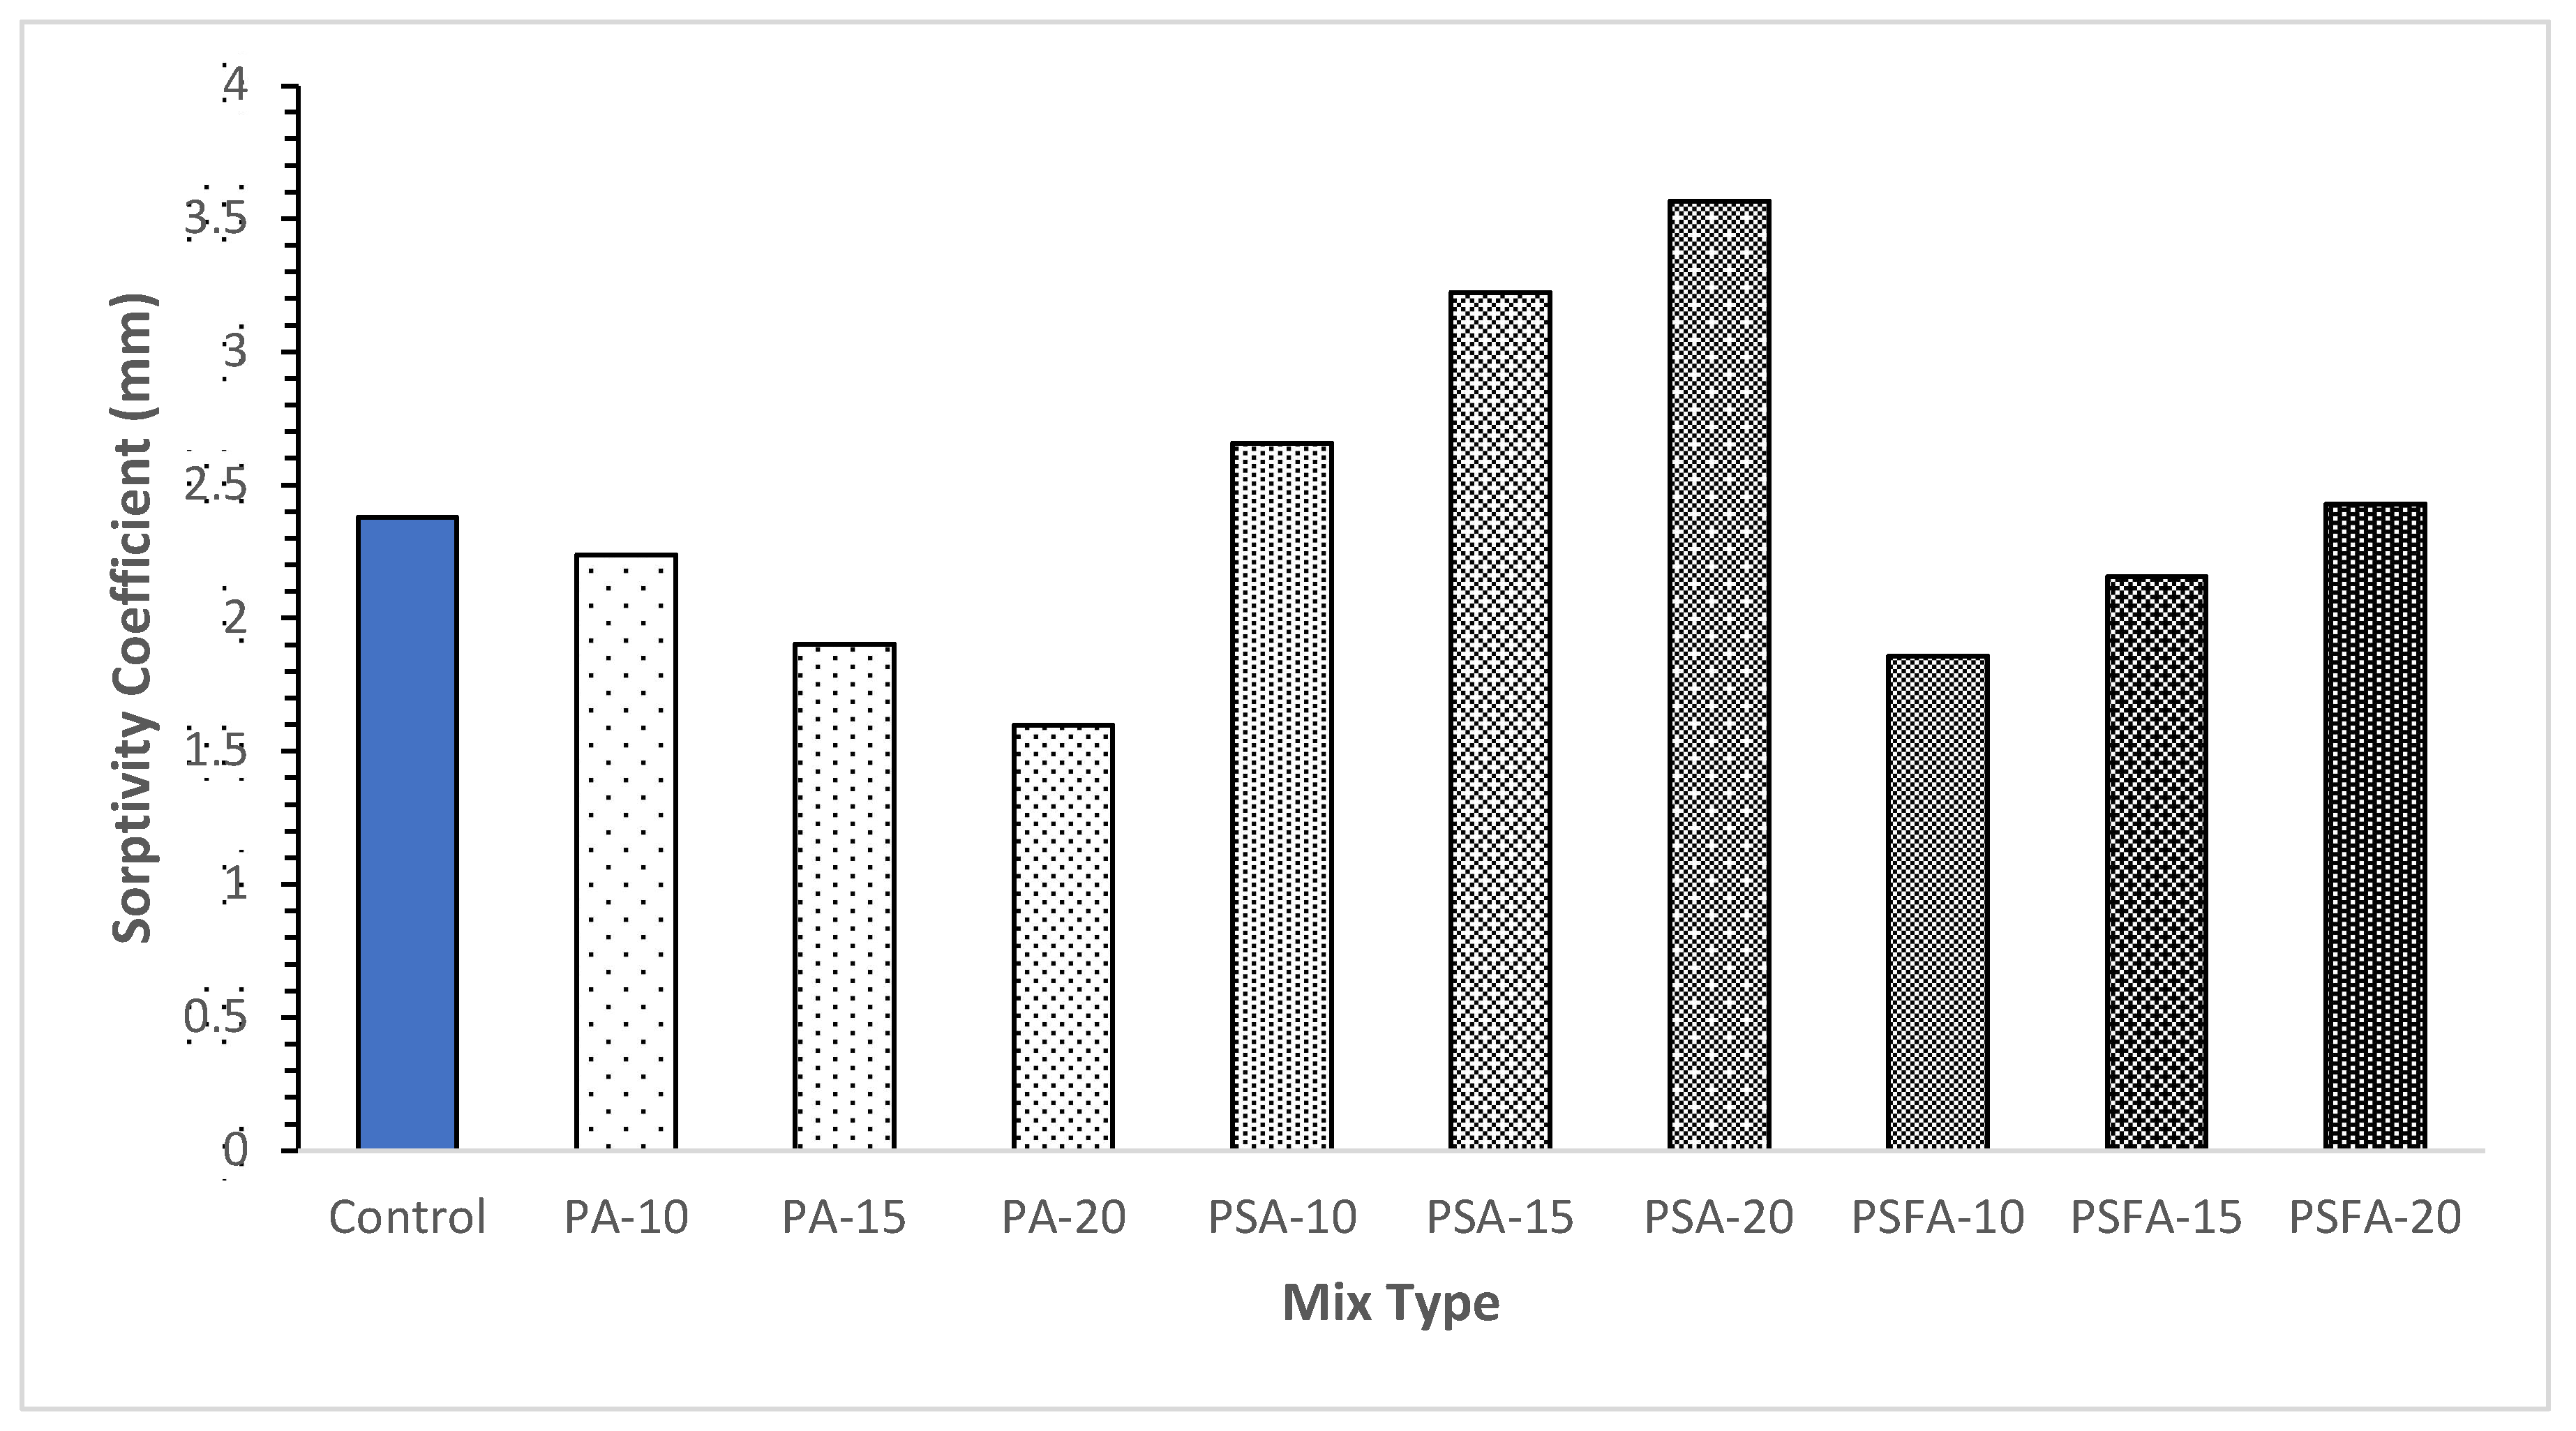
ASTM C-642 [33] was used to test water absorption (WA) test. Figure 9 shows the test results for ten concrete cubes measuring 150 mm x 150 mm that were cast and cured for 28 days. According to the findings, WA is decreased when untreated PA is added to the concrete mix. WA is reduced by 3.7%, 12.8% and 21.7% at replacement ratio of untreated PA of 10%, 15% and 20%. It is because plastics are hydrophobic and recycled plastics have almost no water absorption, resulting in excess water around the plastic aggregates. WA of treated PA with sand increases the water absorption. WA is increased by 29.2% at maximum replacement ratio of treated PA with sand. Increased water absorption of PA treated with sand is due to the transformation of PA from hydrophobic to hydrophilic caused by the deposition of sand on its surface Abbas et al. [7]. Water absorption of PSFA also increases by 27.0% at maximum replacement ratio.

5.4.3. Sorptivity

The Sorptivity value indicates the rate at which water is absorbed by hydraulic cement concrete and evaluates whether the specimen mass increases as a result of the ability to absorb water. The scope of this test covers the humidity value of the cylinder because the specimen is placed under induced moisture content relatively called capillary pore settings. Sorptivity was measured in accordance with ASTM-C1585-13 [24]. A total of 20 concrete cylinders measuring 50 mm×100 mm was cast and cured for 28 days. The SC values that were calculated for each mixture are displayed in Figure 10, where it is possible to see that the Sorptivity coefficient results follow the same pattern as the water absorption test.

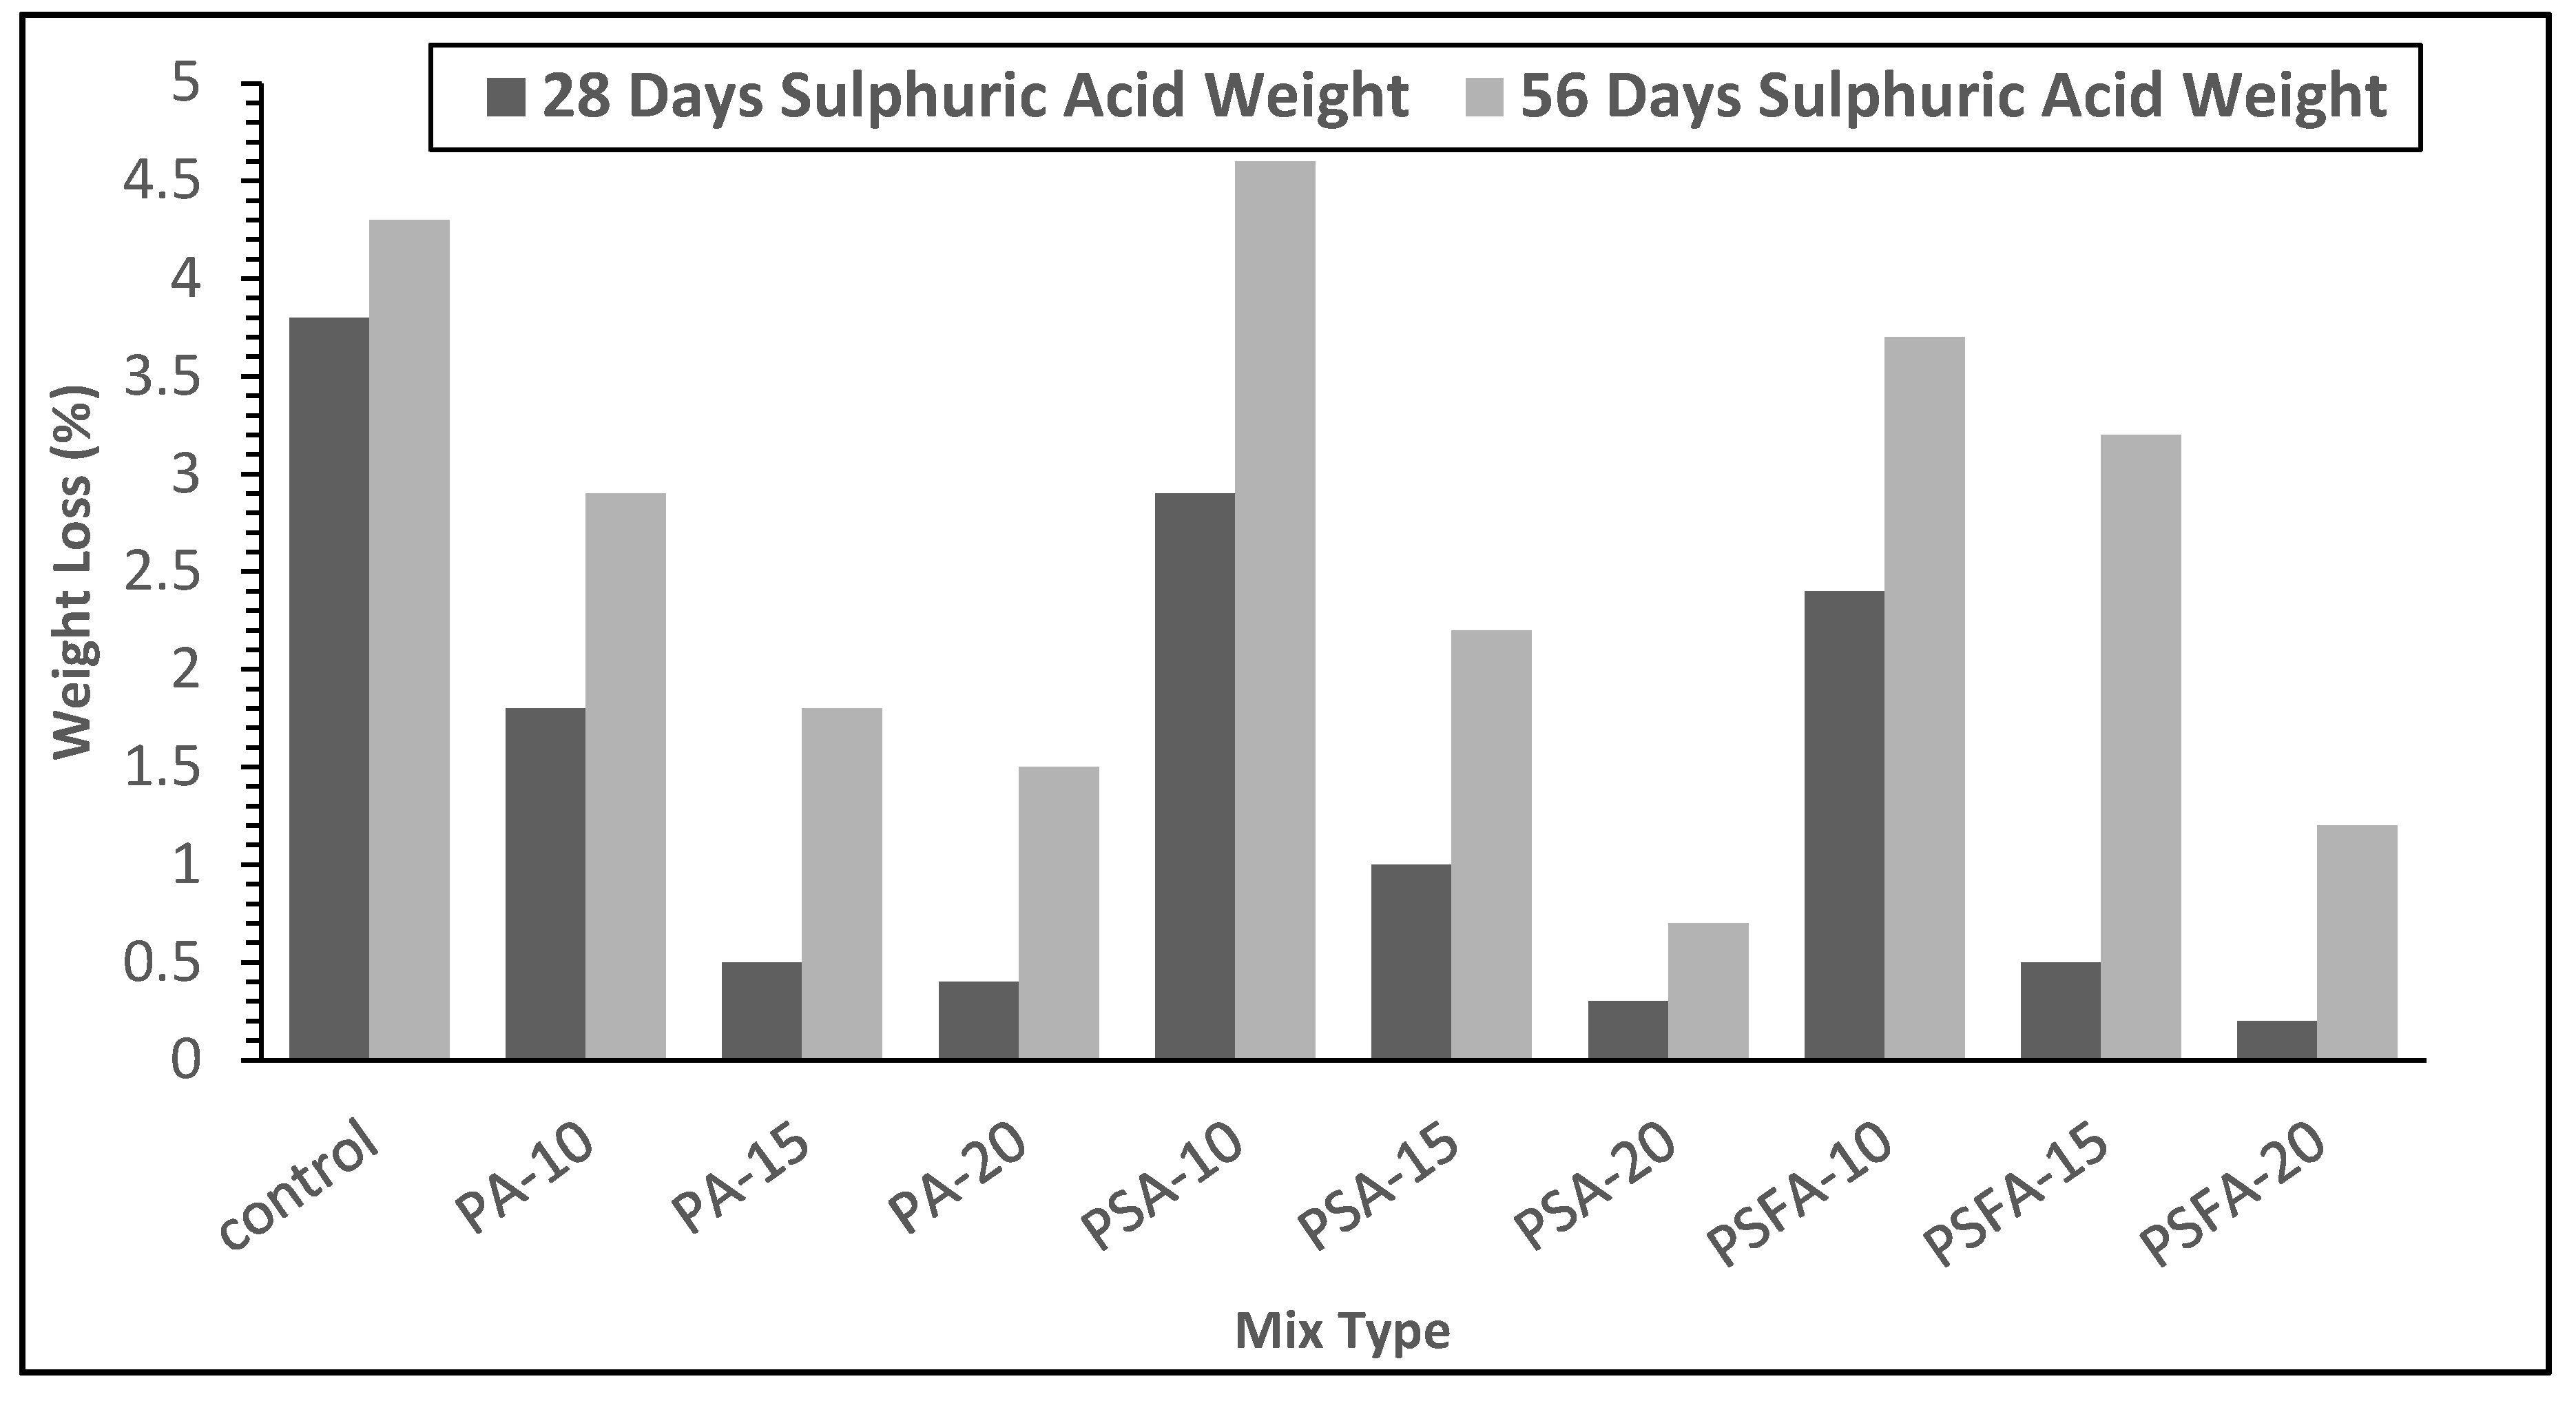
5.4.4. Sulphuric Acid Attack Resistance

As shown in Figure 9, a total of 20 concrete cubes measuring 100 mm ×100 mm was cast and cured for 28 and 56 days. 10 samples are left for 28 days in H 2 S O 4 solution. After 28 days samples are taken out from H 2 S O 4 solution, cleaned with brush and left samples in room temperature for 24 hours for compressive strength test. Another 10 samples are left for 56 days in H 2 S O 4 solution. Weight loss due to H 2 S O 4 was measured in 28 and 56 days are shown in figure 11 and CS tests results of 28 days and 56 days are shown in fig 12.
Preparation of solution
Fill a 2000 mL volumetric flask with 4% concentrated H 2 S O 4 with a specific gravity of 1.84. Dilute with water to the desired strength, thoroughly mix, then immerse the concrete sample in a H 2 S O 4 solution.
Table 3.5.4 shows the value of weight loss for both 28 and 56 days. When compared to the control mix, the addition of PA, PSA, and PSFA lowered weight loss owing to the pozzolanic response. Because of availability of free C a ( O H ) 2 in OPC, the control mix lost more weight, when H 2 S O 4 combines with C a ( O H ) 2 , it creates C a C O 3 powder and gypsum, ultimately leading to the development of ettringite, which has an innovative property that causes concrete to expand and disintegrate. PA is made of ABS which is amorphous polymer. ABS is made up of three monomers: acrylonitrile, butadiene, and styrene combine to form ABS. A synthetic monomer called acrylonitrile is made from propylene ( C 3 H 6 ) and ammonia ( N H 3 ) . This element helps ABS to maintain its thermal stability and chemical resistance. In terms of material loss, the findings reveal that PA and PSFA exhibits greater resistance to acid attack degradation. PSA shows least resistance against acid because acid aggressively react with sand which is deposited on PCA surface. As the sulphate ions entered further into the concrete, the rate of degradation increased, resulting in more weight loss Haq et al[32].
Figure 10 depicts the compressive strength of specimens subjected to H 2 S O 4 solution for 28 and 56 days. Table 4.5.4(a) shows the value of compressive strength. Results showed that compressive strength decreases over time.
Figure 12. Results of strength loss after acid attack.
Preprints 146982 g012

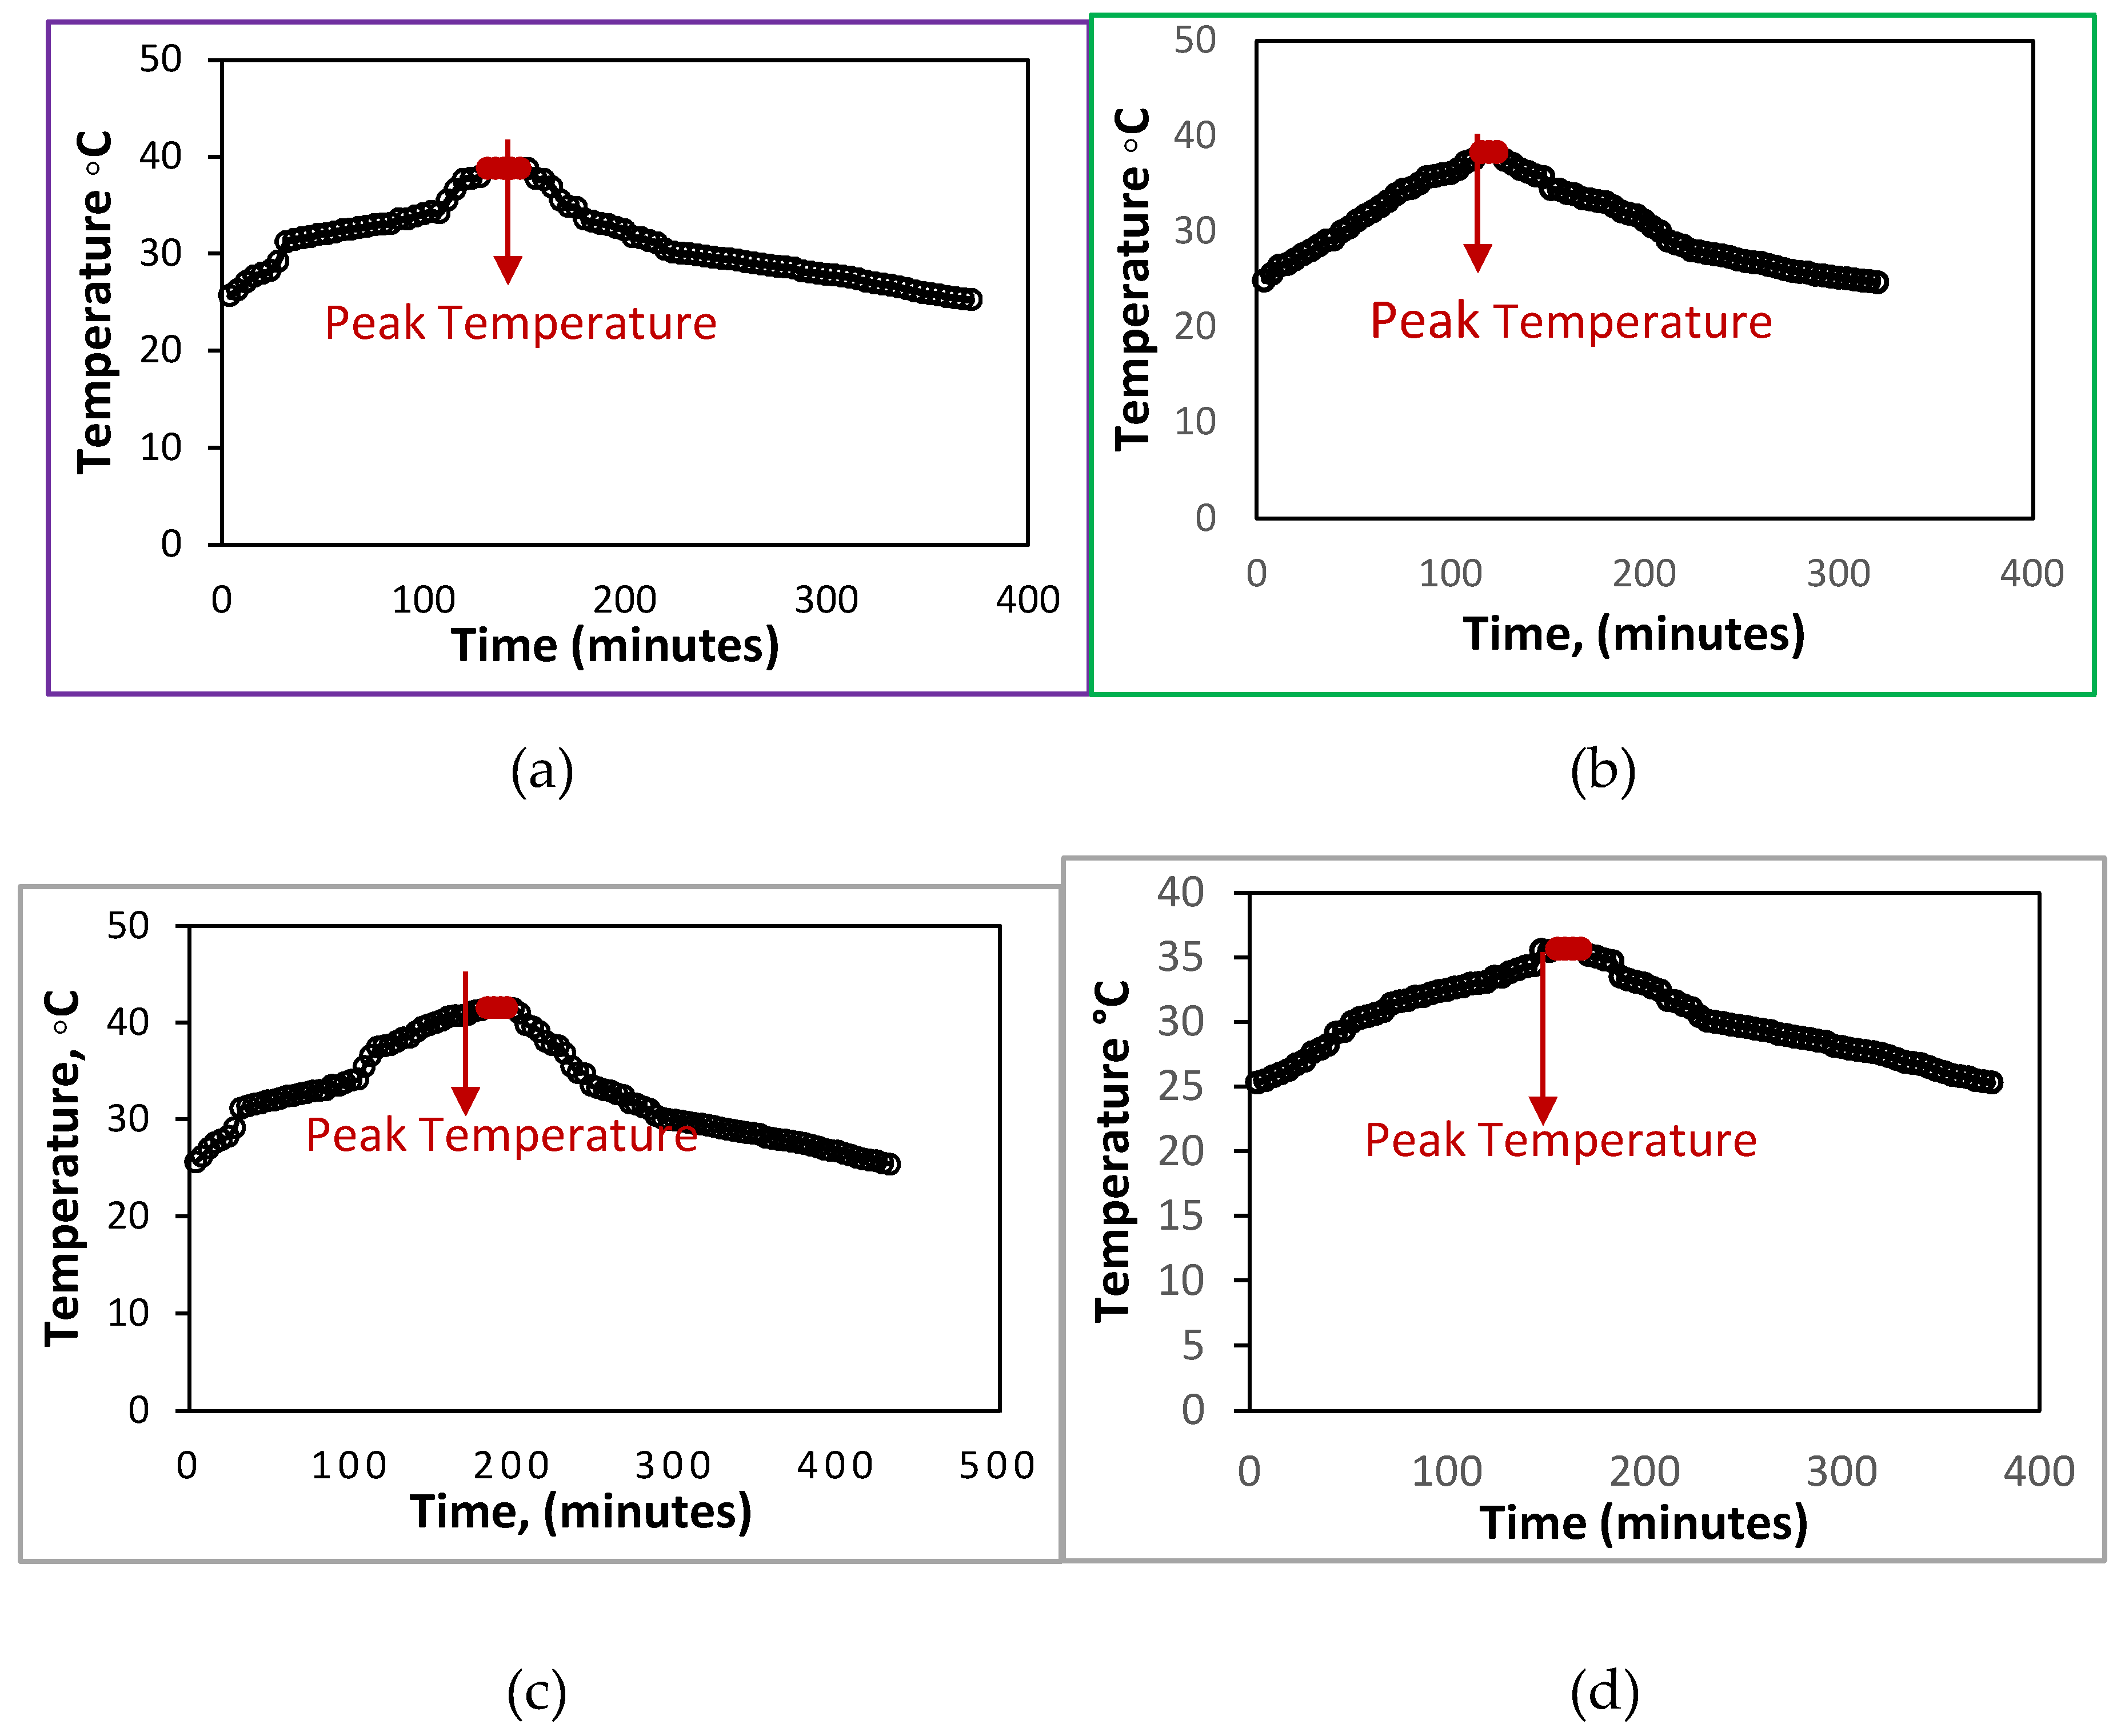
5.4.5. Thermal Performance

A total of ten concrete slabs with dimensions of 200 mm x 200 mm each were cast and permitted to cure for a period of 28 days. The self-designed experimental apparatus is comprised of a wooden box that has been cut in half and a concrete slab that has been put in between the two halves. The dimension of the top compartment is 300 mm x 300 mm x 600 mm, while the dimension of the bottom compartment is 300 mm x 300 mm x 300 mm. At a distance of 450 millimeters from the top of the slab, a heating coil with a capacity of 500 watts is installed in the upper compartment to serve as a source of heat. A layer of aluminum foil has been applied to the inside of the top compartment's walls in order to assist maintain a temperature gradient that is constant throughout the space. Temperature sensors have been positioned at the upper and lower surface of the concrete slab. The top chamber of the experiment was heated to 130 degrees Celsius using a heating coil. The experiment started at the room temperature of 19.37 degrees Celsius. After reaching that temperature, the heating coil was turned off, and the temperature of the upper compartment was allowed to decrease until it reached the level at which it had begun the experiment, which was 19.37 degrees Celsius. Figure 13(a) shows the indoor thermal performance test cycle for the control sample. Figure 13(b) shows the results of PA at 20% replacement, there is fall in temperature of 0.68°C as compared to control mix. Results of PSA are shown in Figure 13(c) graph shows that an increase in temperature as replacement ratio increases. At maximum replacement of PSA-20% temperature will rise of 4°C. Figure 13(d) displays the results of PA treated with SF, finding shows that temperature decreases with increasing percentage of PA. At maximum replacement of treated SF, temperature will fall to 3 °C with reference to control sample.

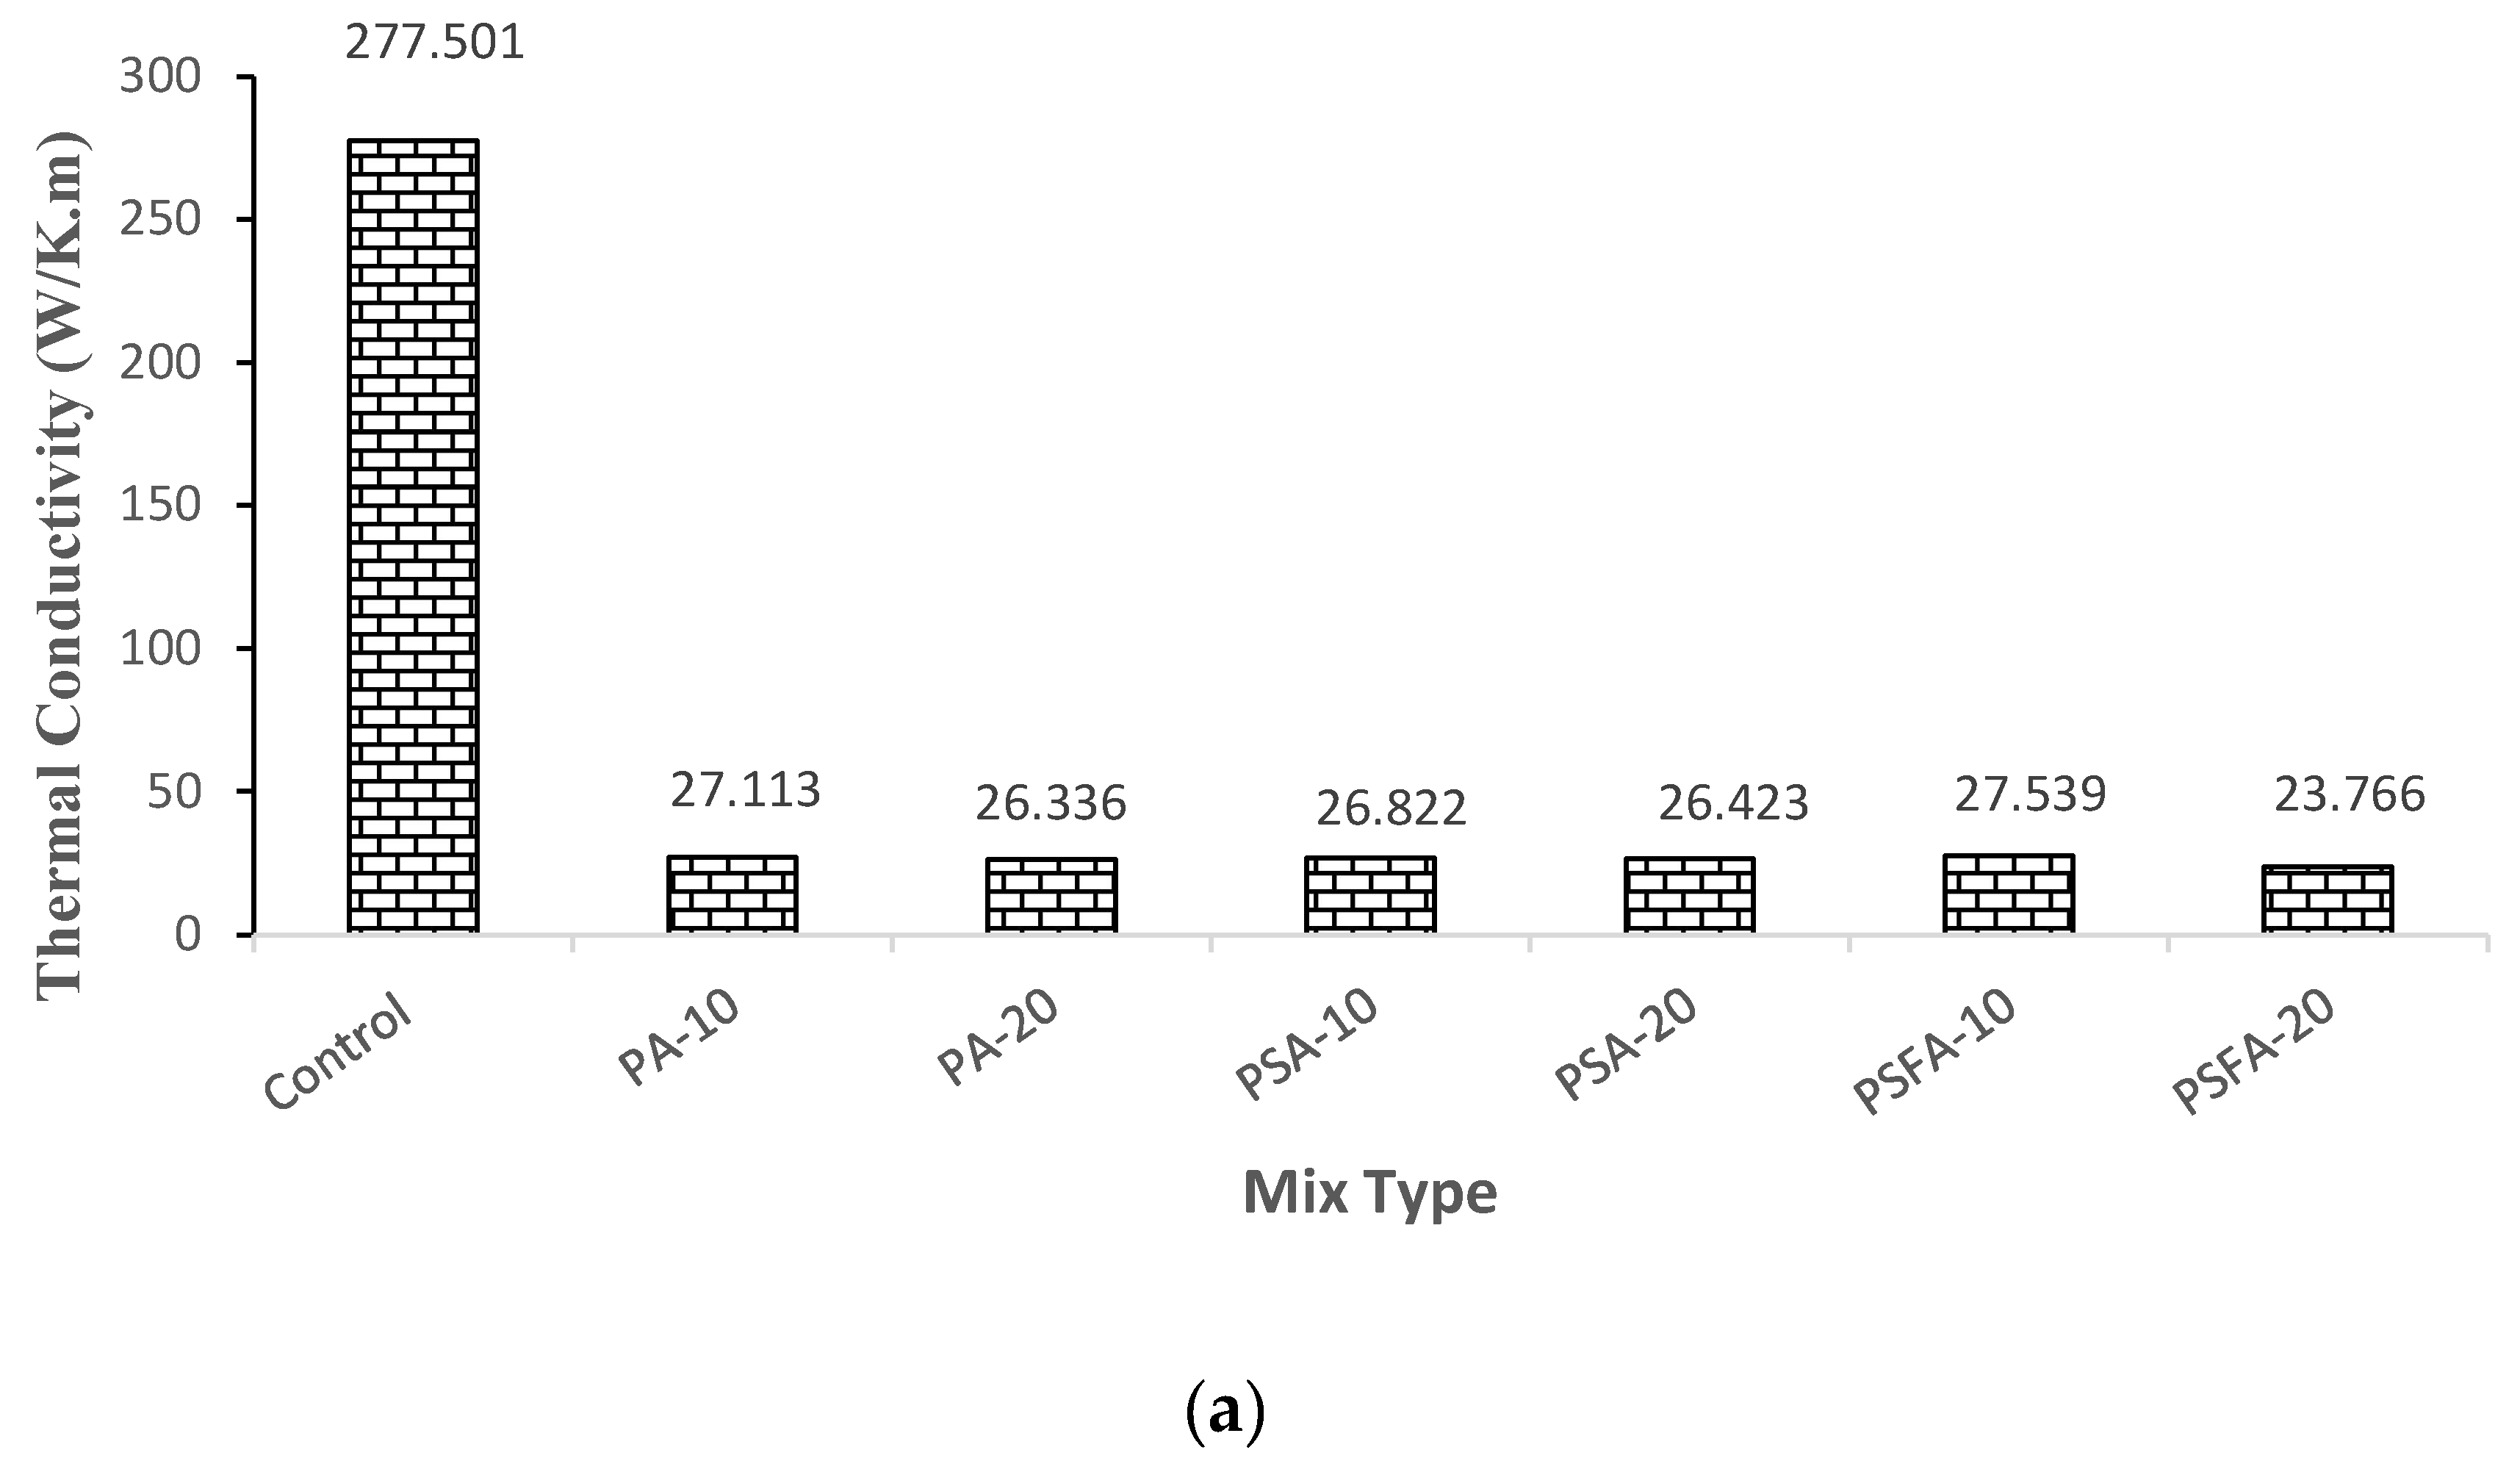
5.4.6. Thermal Conductivity

The thermal conductivity (TC) of a material is its ability to transfer heat from one place to another when there is a temperature gradient over a certain thickness. The lower the TC, the greater the material's ability to withstand heat transfer.
The cast sample consists of prisms with dimensions of 50 mm ×50 mm×50 mm. All samples were made using a varied plastic aggregate replacement ratio and the same w/c ratio. The samples are cured in a water tank at room temperature for 28 days. Figure 14 shows the experimental setup.
The result of conventional concrete and plastic concrete on the thermal conductivity and thermal resistivity are shown in Figure 15a,b. According to the experimental findings, there is a dramatic drop in thermal conductivity and a steady rise in thermal resistivity. The thermal resistivity increases with increasing percentage of PA. Because there is little variation in density, PA and PA treated with sand have approximately the same thermal resistance. The thermal resistivity of treated PA with SF has increases due to decrease in density. Thermal conductivity is directly proportional to density but inversely proportional to thermal resistivity. According to reports, the density reduces as the thermal conductivity increases [34].

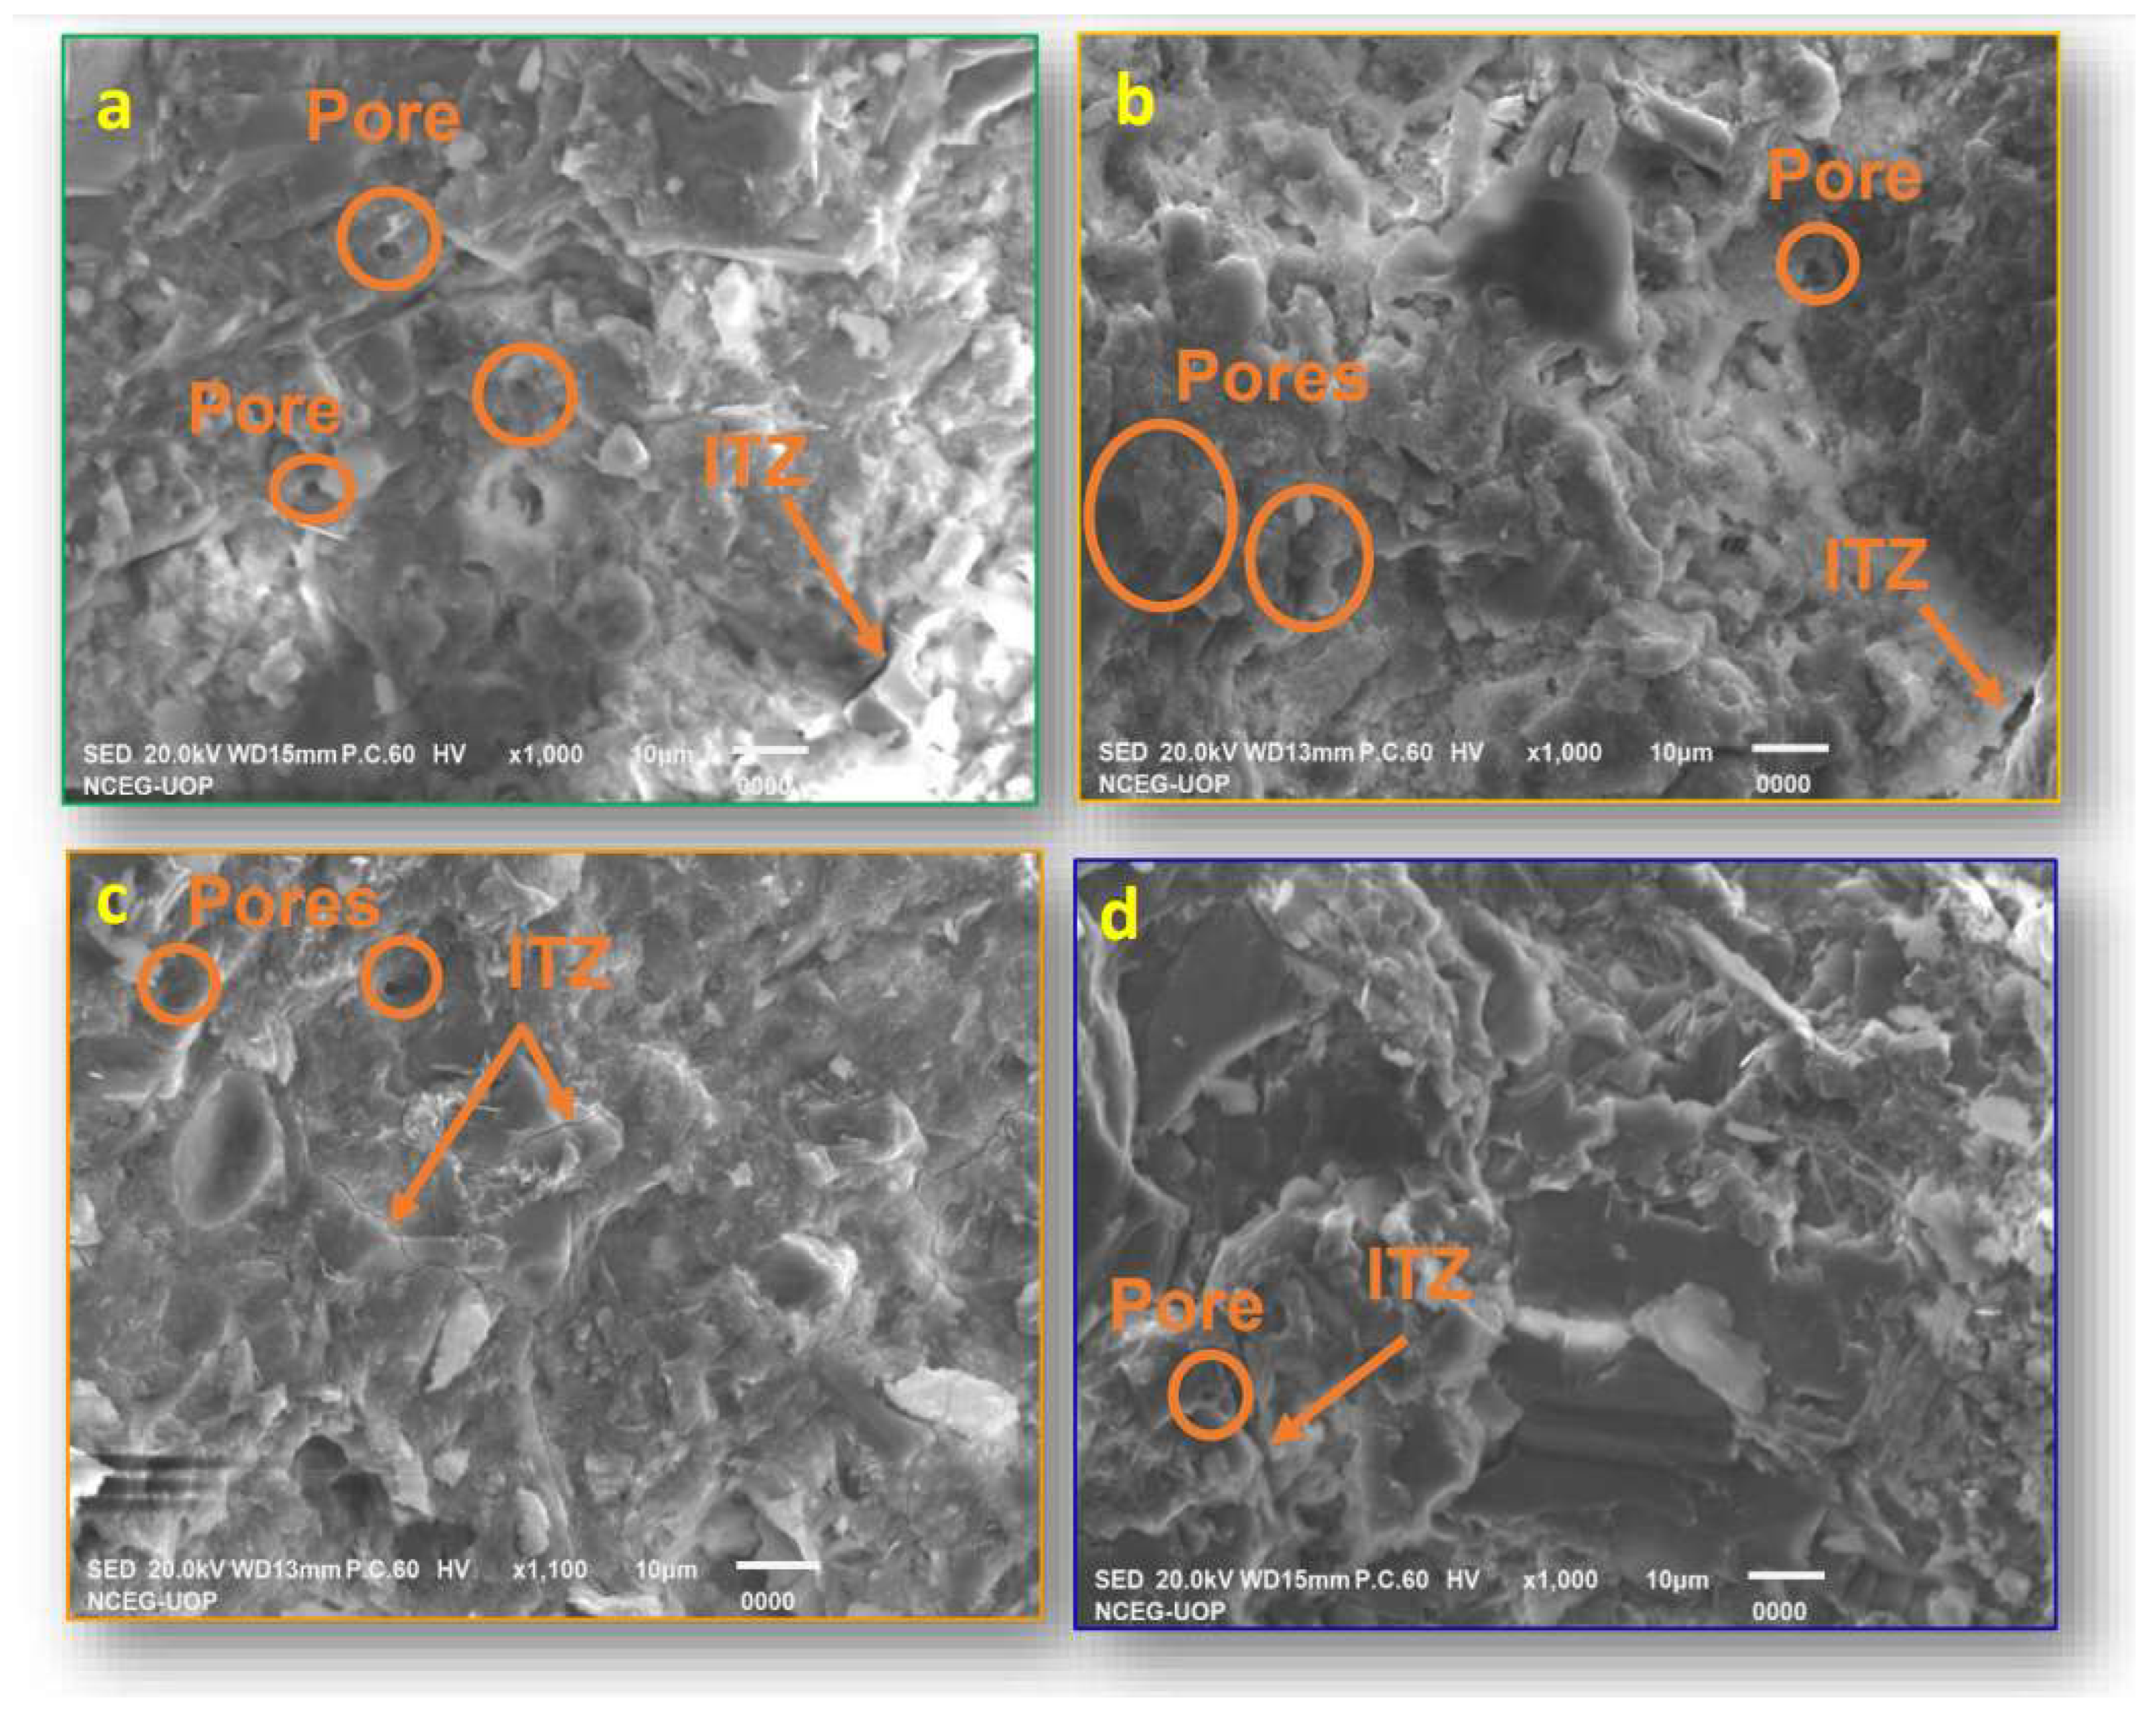
5.4.7. Scanning Electron Microscopy

The effects of untreated PA, PA treated with sand, and PA treated with SF are investigated by morphological visualization via scanning electron microscopy (SEM). The specimens of the 10 mm x 10 mm were sliced and examined using a JSM-5910 scanning electron microscope (JEOL, Japan firm). Figure 16 shows the SEM images of concrete samples of different mixes.
Figure 16(a) shows the SEM images of conventional aggregate, normal aggregate has good bonding with paste matrix due to availability of pores on aggregate surface as visualized, but it is not the case for PA. That’s why bonding of normal aggregate is better than any of other PA. Figure 16 (b) shows the SEM images of untreated plastic aggregate, the interaction of PA with paste matrix is not significant. A large interfacial transition zone (ITZ) and smooth surface of PA appears in SEM image that supports the results of compressive strength as compressive strength is inversely related with ITZ size. The SEM images of the ITZ confirmed the presence of less adhesion and loose gaps between the untreated plastic aggregate and the paste matrix. Figure 16(c) shows the SEM images of treated plastic aggregate with sand, the concrete matrix is dense with minimum pores. The surface of treated PA with sand is rough due to the deposition of sand on surface of aggregate, which improves bonding of aggregate with matrix. SEM images illustrate an improvement in adhesion \in treated plastic aggregate with sand Figure 16(c) compared to untreated plastic aggregate fig.16(b). Figure 16(d) shows the SEM images of treated plastic aggregate with silica fume (SF), denser concrete matrix is observed with the refined pores. Rounded morphology and micro size of SF facilitated to have good packing density of concrete mix. SEM images illustrate an improved adhesion in treated plastic aggregate with silica fume Figure 16 (d) compared to treated plastic aggregate with sand Figure 16(c). This densely populated concrete microstructure improved its mechanical performance which is already reflected in the results of mechanical testing.

5.5. Conclusion & Recommendation

In this study, we attempted to mix E-waste into concrete to determine its impact on the workability, mechanical properties, and durability of concrete. In addition, recycled PCA were treated with sand and silica fume to increase bonding between matrix and plastic PA. PCA was employed to replace conventional coarse aggregate by 10%, 15%, and 20% each using sand-treated, silica fume-treated, and untreated PCA as replacement. The following conclusions may be derived from the results of this research:
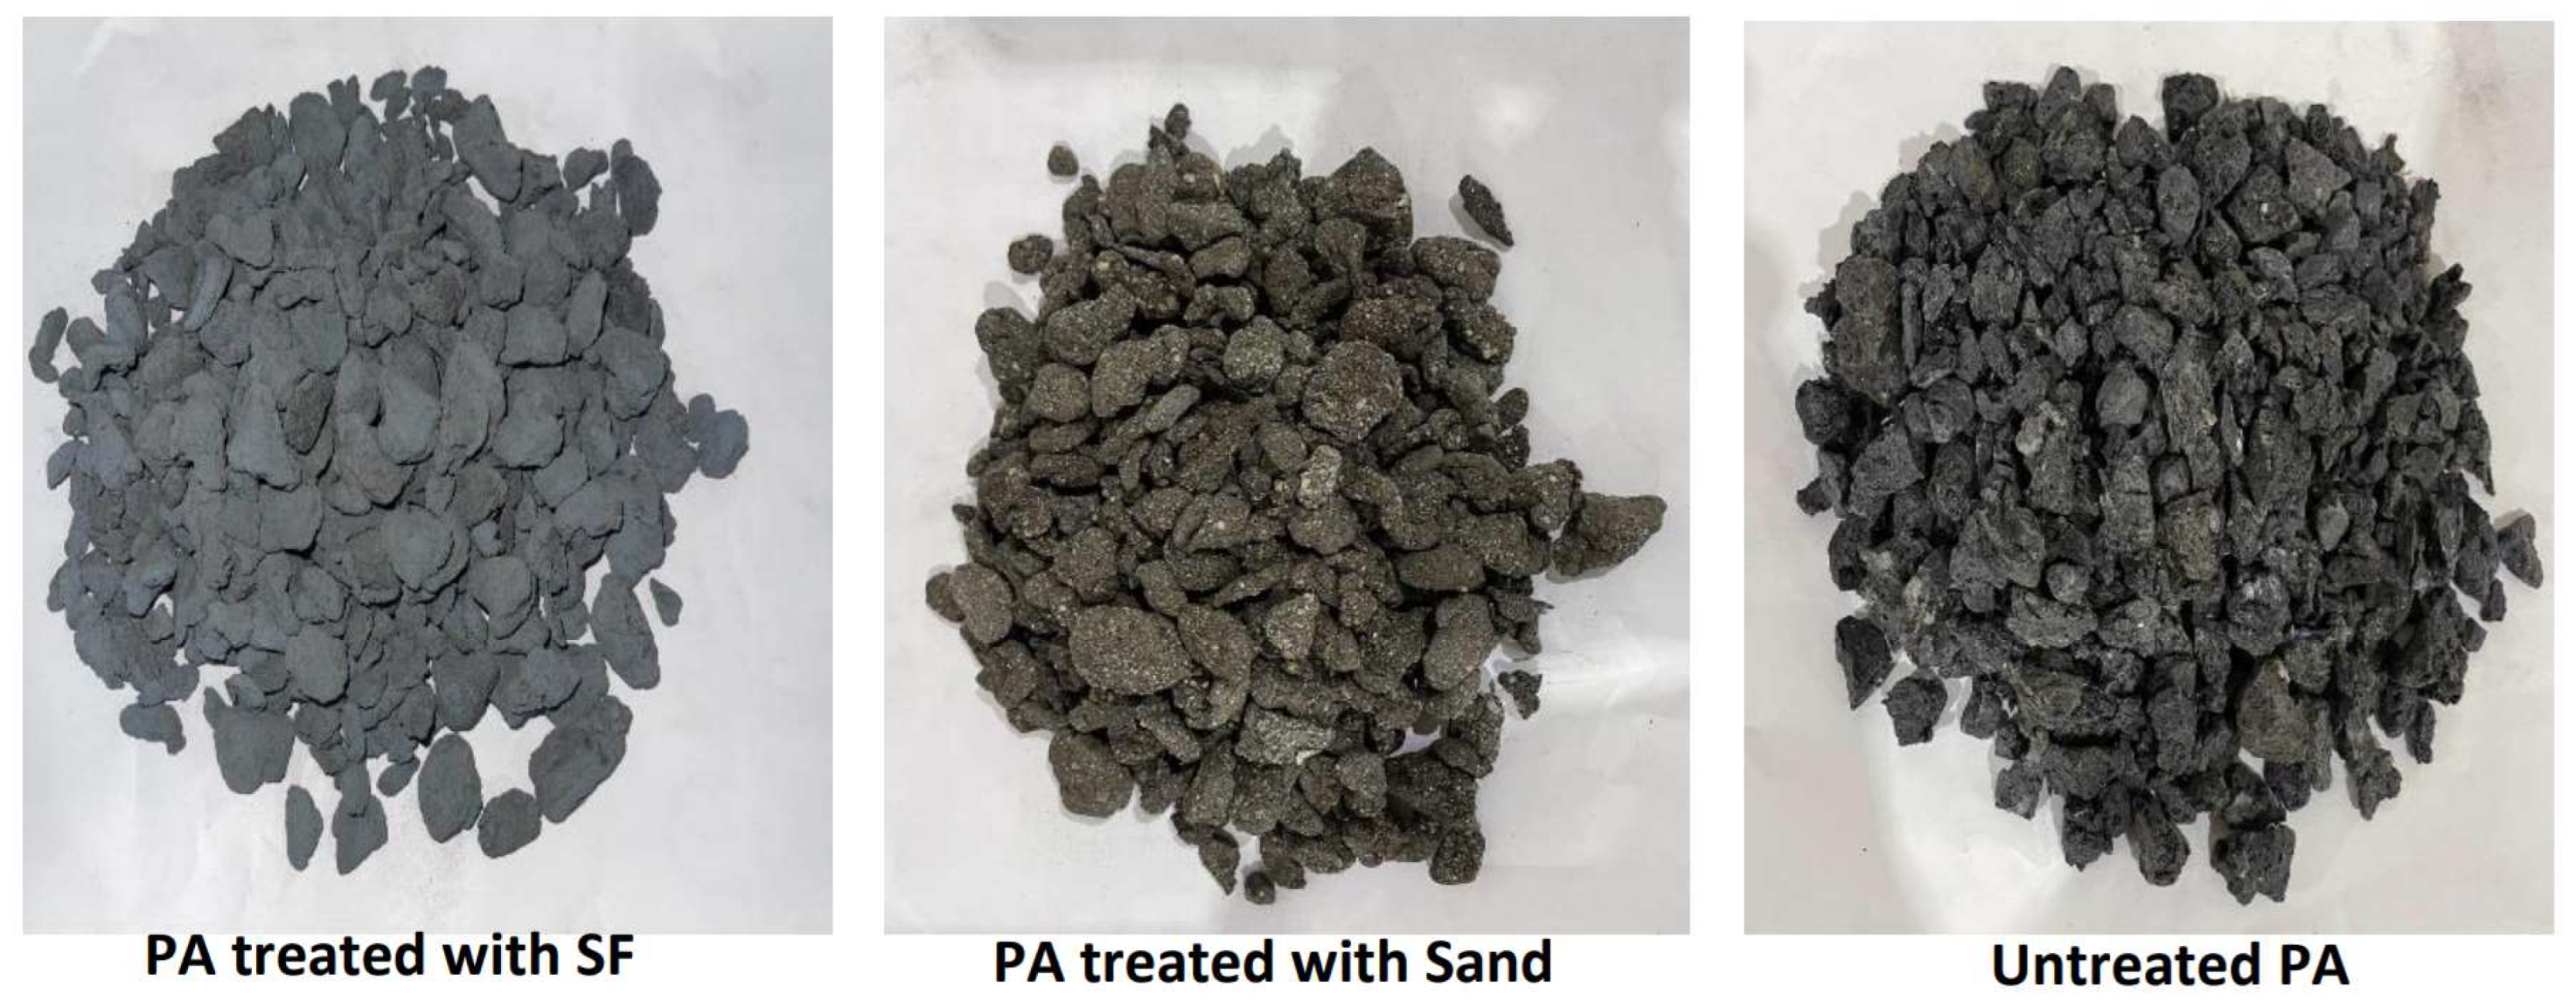
  • The workability of concrete containing untreated E-waste recycled plastics was better than concrete containing sand-treated and silica fume treated E-waste recycled plastics. The greater workability of PA is due to zero water absorption as compared to treated PA and treated silica-fume PA. The reduced workability of treated PA and treated silica fume aggregate was related to the change from hydrophobic to hydrophilic character of recycled PA, as well as enhanced adhesion between cement paste and plastic aggregates.
  • The addition of PA to concrete reduced the fresh and dry densities of concrete mixes by up to 5.4% and 7.5%, respectively.
  • The compressive strength of concrete using sand-treated and silica fume treated recycled plastic aggregates was greater than that of concrete with untreated E-waste. The greater compressive strength values of concrete including sand-treated, and silica fume-treated recycled plastics E-waste were caused by a change in recycled plastic behavior from hydrophobic to hydrophilic and enhanced bonding between treated plastics and cement paste. The compressive strength values of treated PA concrete were found to be higher than those of untreated PA.
  • The split tensile strength of concrete containing sand-treated and silica treated recycled plastics E-waste was greater than that of concrete containing untreated recycled plastics. E-waste. The increased split tensile strength values of concrete, comprising sand-treated and silica fume-treated recycled plastics E-waste, were the consequence of a change from hydrophobic to hydrophilic behavior of recycled plastics and enhanced bonding between sand-treated plastics and cement paste. Indoor thermal performance experiments have shown that concrete containing plastic aggregate provides greater thermal insulation by decreasing heat conductivity by about 90 percent and enhancing thermal resistance.
  • Treated PA with sand and SF has more water absorption by 29.2% and 27.2% at maximum replacement ratio. The reason for the increase in water absorption was sand and SF on the surface of aggregate.
  • The durability of concrete containing sand-treated and SF-treated E-waste was enhanced due to transition of PA from non-water absorbing surface to the water fill surface leaded to adhered CSH gel around the surface for more packed ITZ.
The study revealed that it was a sustainable concrete mix with equivalent fresh, mechanical, and increased durability properties. Future efforts should be directed at effectively optimizing the replacement percentage in order to fully use this sustainable solution in the building sector with a reduces demand of conventional aggregates resulting in reduces load on the natural resources.

References

  1. P. Watson, “Blueprint for greening affordable housing,” Hous Stud, 2021, . [CrossRef]
  2. McGraw Hill Construction, Green Building Retrofit and Renovation. 2009.
  3. N. Iman, “Digital Sustainability: Paving the Way Toward a Green Economy?,” Sustainability and climate change, vol. 16, no. 4, pp. 268–277, Aug. 2023, . [CrossRef]
  4. V. Forti, C. P. Baldé, R. Kuehr, and G. Bel, “The Global E-waste Monitor 2020: Quantities, flows and the circular economy potential,” 2020.
  5. F. Ahmad, A. Jamal, K. M. Mazher, W. Umer, and M. Iqbal, “Performance evaluation of plastic concrete modified with e-waste plastic as a partial replacement of coarse aggregate,” Materials, vol. 15, no. 1, Jan. 2022, . [CrossRef]
  6. K. Ali, M. I. Qureshi, S. Saleem, and S. U. Khan, “Effect of waste electronic plastic and silica fume on mechanical properties and thermal performance of concrete,” Constr Build Mater, vol. 285, p. 122952, 2021, . [CrossRef]
  7. S. N. Abbas, M. I. Qureshi, M. M. Abid, M. A. U. R. Tariq, and A. W. M. Ng, “An Investigation of Mechanical Properties of Concrete by Applying Sand Coating on Recycled High-Density Polyethylene (HDPE) and Electronic-Wastes (E-Wastes) Used as a Partial Replacement of Natural Coarse Aggregates,” Sustainability, vol. 14, no. 7, p. 4087, 2022.
  8. B. T. A. Manjunath, “Partial replacement of E-plastic waste as coarse-aggregate in concrete,” Procedia Environ Sci, vol. 35, pp. 731–739, 2016.
  9. R. Saxena, S. Siddique, T. Gupta, R. K. Sharma, and S. Chaudhary, “Impact resistance and energy absorption capacity of concrete containing plastic waste,” Constr Build Mater, vol. 176, pp. 415–421, 2018.
  10. Prof. C. S. Bari, “Coal Bottom Ash as A Partial Replacement with Fine Aggregate in Concrete,” INTERANTIONAL JOURNAL OF SCIENTIFIC RESEARCH IN ENGINEERING AND MANAGEMENT, vol. 07, no. 07, 2023, . [CrossRef]
  11. A. Shiuly, T. Hazra, D. Sau, and D. Maji, “Performance and optimisation study of waste plastic aggregate based sustainable concrete – A machine learning approach,” Cleaner Waste Systems, vol. 2, 2022, . [CrossRef]
  12. A. B. Nyakuma and T. J. P. Ivase, “Emerging trends in sustainable treatment and valorisation technologies for plastic wastes in Nigeria: A concise review,” Environ Prog Sustain Energy, vol. 40, no. 5, 2021, . [CrossRef]
  13. K. Senthil Kumar and K. Baskar, “Recycling of E-plastic waste as a construction material in developing countries,” J Mater Cycles Waste Manag, vol. 17, no. 4, pp. 718–724, 2015.
  14. ASTM C150/C150M, “Astm C 150,” ASTM C 150/ C150M-15 Standard specification for portland cement, vol. i, pp. 1–9, 2019, . [CrossRef]
  15. ASTM. C33, “ASTM c33-c33m-08 Standard Specification for concrete agg.”.
  16. D. S. Premathilake, A. B. Botelho Junior, J. A. S. Tenório, D. C. R. Espinosa, and M. Vaccari, “Designing of a Decentralized Pretreatment Line for EOL-LIBs Based on Recent Literature of LIB Recycling for Black Mass,” Metals, vol. 13, no. 2. MDPI, Feb. 01, 2023. [CrossRef]
  17. Skrzypczak, A. Leśniak, P. Ochab, M. Górka, W. Kokoszka, and A. Sikora, “Interlaboratory comparative tests in ready-mixed concrete quality assessment,” Materials, vol. 14, no. 13, 2021, . [CrossRef]
  18. ASTM C143/C143M, “Standard Test Method for Slump of Hydraulic-Cement Concrete,” Astm C143, no. 1, pp. 1–4, 2015, . [CrossRef]
  19. Astm:C138/C138M-13, “Standard Test Method for Density (Unit Weight), Yield, and Air Content (Gravimetric),” ASTM International, vol. i, pp. 23–26, 2013, . [CrossRef]
  20. “EN12390–7, Testing Hardened Concrete - Part 7: Density of Hardened Concrete, European Committee for Standardization (2019).”.
  21. 2014 39M, ASTM C 39/C, “ASTM C 39/C 39M – 01. Standard Test Method for Compressive Strength of Cylindrical Concrete Specimens,” pp. 3–9, 2014. [CrossRef]
  22. ASTM C496/C496M − 17, “Standard Test Method for Splitting Tensile Strength of Cylindrical Concrete Specimens ASTM C-496,” ASTM International, no. March 1996, pp. 1–5, 2011.
  23. ASTM, “Standard Method of Test for obtaining and testing drilled cores and sawed beams of concrete,” Standard Specifications for Transportation Materials and Methods of Sampling and Testing, vol. 23, no. 11, pp. 2841–2852, 2018, . [CrossRef]
  24. ASTM C1585-13, “Standard Test Method for Measurement of Rate of Absorption of Water by Hydraulic Cement Concretes,” ASTM International, vol. 41, no. 147, pp. 1–6, 2013.
  25. ASTM C131/C131M-14, “C131/C131M-14 Standard Test Method for Resistance to Degradation of Small-Size Coarse Aggregate by Abrasion and Impact in the Los Angeles Machine,” Annual Book of American Society for Testing materials ASTM Standards,West Conshohocken, USA, vol. 04, no. Note 2, pp. 5–8, 2014, . [CrossRef]
  26. F. Ahmad, A. Jamal, K. M. Mazher, W. Umer, and M. Iqbal, “Performance evaluation of plastic concrete modified with e-waste plastic as a partial replacement of coarse aggregate,” Materials, vol. 15, no. 1, p. 175, 2021.
  27. H. Purnomo, G. Pamudji, and M. Satim, “Influence of uncoated and coated plastic waste coarse aggregates to concrete compressive strength,” in MATEC Web of Conferences, EDP Sciences, 2017, p. 1016.
  28. Alagusankareswari, S. S. Kumar, K. B. Vignesh, and K. A. H. Niyas, “An experimental study on e-waste concrete,” Indian J Sci Technol, vol. 9, no. 2, 2016.
  29. M. J. Islam, M. S. Meherier, and A. K. M. R. Islam, “Effects of waste PET as coarse aggregate on the fresh and harden properties of concrete,” Constr Build Mater, vol. 125, pp. 946–951, 2016.
  30. Z. H. Lee, S. C. Paul, S. Y. Kong, S. Susilawati, and X. Yang, “Modification of waste aggregate PET for improving the concrete properties,” Advances in Civil Engineering, vol. 2019, 2019.
  31. Z. J. Grdic, G. A. T. Curcic, N. S. Ristic, and I. M. Despotovic, “Abrasion resistance of concrete micro-reinforced with polypropylene fibers,” Constr Build Mater, vol. 27, no. 1, pp. 305–312, 2012.
  32. Ul Haq, A. Elahi, A. Nawaz, S. Aamir Qadeer Shah, and K. Ali, “Mechanical and durability performance of concrete mixtures incorporating bentonite, silica fume, and polypropylene fibers,” Constr Build Mater, vol. 345, no. February, p. 128223, 2022, . [CrossRef]
  33. ASTM C 642-97, “Standard Test Method for Density, Absorption, and Voids in Hardened Concrete, ASTM International, United States,” Annual Book of ASTM Standards, no. March, pp. 1–3, 1997.
  34. T. T. Nguyen, V. Picandet, P. Carre, T. Lecompte, S. Amziane, and C. Baley, “Effect of compaction on mechanical and thermal properties of hemp concrete,” European Journal of Environmental and Civil Engineering, vol. 14, no. 5, pp. 545–560, 2010.
Figure 1. Granulometric analysis of natural coarse aggregates and plastic coarse aggregates.
Preprints 146982 g001
Figure 2. Shapes of treated and untreated plastic aggregates.
Preprints 146982 g002
Figure 3. Schematic diagram of manufacturing process of PCA.
Preprints 146982 g003
Figure 4. Results of slump test for plastic aggregate (PA), PA treated with sand (PSA) and PA treated with silica fume (PSFA).
Preprints 146982 g004
Figure 5. Results of the fresh and dry densities of concrete.
Preprints 146982 g005
Figure 6. Results of compressive strength of concrete after 28 days.
Preprints 146982 g006
Figure 7. Results of split tensile strength of concrete after 28 days.
Preprints 146982 g007
Figure 8. Results of abrasion resistance of concrete after 28 days.
Preprints 146982 g008
Figure 9. Results of water absorption of concrete after 28 days.
Preprints 146982 g009
Figure 10. Results of concrete Sorptivity.
Preprints 146982 g010
Figure 11. Results of weight loss after acid attack.
Preprints 146982 g011
Figure 13. Results of (a) Control (b) PA-20 (c) PSA-20 (d) PSFA-20.
Preprints 146982 g013
Figure 14. Experimental setup for thermal conductivity testing.
Preprints 146982 g014
Figure 15. (a) Results of thermal conductivity of concrete; (b) Results of thermal resistivity of concrete.
Preprints 146982 g015aPreprints 146982 g015b
Figure 16. SEM images of (a) Control (b) PA (c) PSA (d) PSFA.
Preprints 146982 g016
Table 1. Chemical and Physical Properties of OPC.
Chemical Properties Content (%) Physical Properties Results
S i O 2 22 Specific Gravity 3.05
A l 2 O 3 5.5 Specific Surface ( m 2 / k g ) 322
F e 2 O 3 3.5 Consistency (%) 29
C a O 63.47 Initial Setting Time (min) 102
M g O 1.7 Final Setting Time (min) 235
S O 3 1.82
N a 2 O 0.2
K 2 O 1
L O I 0.64
Table 2. General Properties of different materials.
Properties Cement NCA PCA PSA PSFA Plasticizer
Nominal Size (mm) 50 19 19 19 19
Water Absorption (%) 0.33 - - -
Specific Gravity 3.05 2.4 0.99 0.99 0.99 1.15
Moisture Content (%) 0.07
Bulk   Density   ( k g / m 3 ) 1440 1522 563 617 535
Morphology Brown Liquid
Abrasion Value (%) 24
Impact Value (%) 13 2 12 8%
Table 3. Testing Details.
Test Type Standard Specimen Shape Specimen size (mm) No. of Samples
Slump ASTM-C143/C143M [18] Cone 300×150 4
Fresh Density ASTM-C138/C138M [19] Cube 150×150 4
Dry Density BS EN 12390-7 [20] Cube 150×150 4
Compressive Strength ASTM-C39/C39M [21] Cube 150×150 4
Split Tensile Strength ASTM-C496 [22] Cylinder 300×150 4
Water Absorption ASTM C-642 [23] Cube 150×150 4
Sorptivity ASTM-C1585 [24] Cylinder 50×100 4
Abrasion Resistance ASTM-C131/C131 [25] Cylinder 300×150 4
Sulphuric Acid Resistance Cube 100×100 4
Thermal Performance Slab 200×200 4
Thermal Conductivity Prism 50×50 4
Scanning Electron Microscopy Chunks 4
Disclaimer/Publisher’s Note: The statements, opinions and data contained in all publications are solely those of the individual author(s) and contributor(s) and not of MDPI and/or the editor(s). MDPI and/or the editor(s) disclaim responsibility for any injury to people or property resulting from any ideas, methods, instructions or products referred to in the content.
Copyright: This open access article is published under a Creative Commons CC BY 4.0 license, which permit the free download, distribution, and reuse, provided that the author and preprint are cited in any reuse.
Prerpints.org logo

Preprints.org is a free preprint server supported by MDPI in Basel, Switzerland.

Subscribe

Disclaimer

Terms of Use

Privacy Policy

Privacy Settings

© 2026 MDPI (Basel, Switzerland) unless otherwise stated