1. Introduction
During the process of brain development, neuronal differentiation and neurite outgrowth play a pivotal role in establishing functional neuronal connections[
1]. It is noteworthy that several neurodegenerative diseases, such as Alzheimer’s and Parkinson’s, exhibit symptoms including neuron loss and neurite atrophy[
2]. Neural stem/progenitor cells (NSPCs), which possess the ability to self-renew and differentiate into multiple cell types, have the potential to differentiate into neurons and glial cells[
3]. Consequently, inducing the differentiation of NSPCs into neurons for replenishing neuron in brain tissue affected by neurodegeneration, regarded as an effective approach in treating neurodegenerative diseases[
4,
5,
6]. To date, numerous natural products and their derivatives have shown the ability to stimulate neuronal differentiation and neurite outgrowth, thus being utilized in neural regeneration research[
7].
Galanthamine, an alkaloid derived from the Amaryllidaceae family of plants, exhibits remarkable biological effects, particularly in the field of neuropharmacology[
8]. Notably, its inhibitory action on the enzyme acetylcholinesterase (AChE) has garnered considerable research attention in the context of neurodegenerative diseases[
9,
10]. AChE plays a crucial role in degrading the neurotransmitter acetylcholine, which is fundamental for cognitive functions[
11]. By inhibiting AChE, galanthamine enhances the availability of acetylcholine in the synaptic cleft, thereby potentiating neurotransmission[
12]. This augmentation has been associated with improvements in cognitive function. Because of its AChE-inhibiting properties, galanthamine has been extensively studied for its therapeutic potential in neurological disorders. Specifically, it has demonstrated promising outcomes in the treatment of Alzheimer’s disease, where its ability to augment cholinergic neurotransmission leads to enhancements in cognitive abilities and daily functioning[
13,
14]. Beyond Alzheimer’s, galanthamine has also been explored for its therapeutic potential in other neurological conditions, such as vascular dementia and myasthenia gravis, exhibiting improvements in cognitive function and neuromuscular transmission, respectively[
15,
16,
17]. Some studies have also proven that galanthamine exhibits pharmacological effects that promote adult hippocampal neurogenesis in mice[
18,
19]. Moreover, it is probable that galantamine exerts its influence on hippocampal neurogenesis through the upregulation of IGF2 expression[
19].
The present study examined the effects of galanthamine on neuronal differentiation of NSPCs. We demonstrate that treatment with galanthamine induces the differentiation of NSPCs, especially promotes the morphological maturation of newborn neurons. Additionally, we suggest that IGF2 is involved in the effects of galanthamine on promoting neuronal differentiation in NSPCs. Our research has improved the understanding of galantamine’s neuroactivity.
2. Results
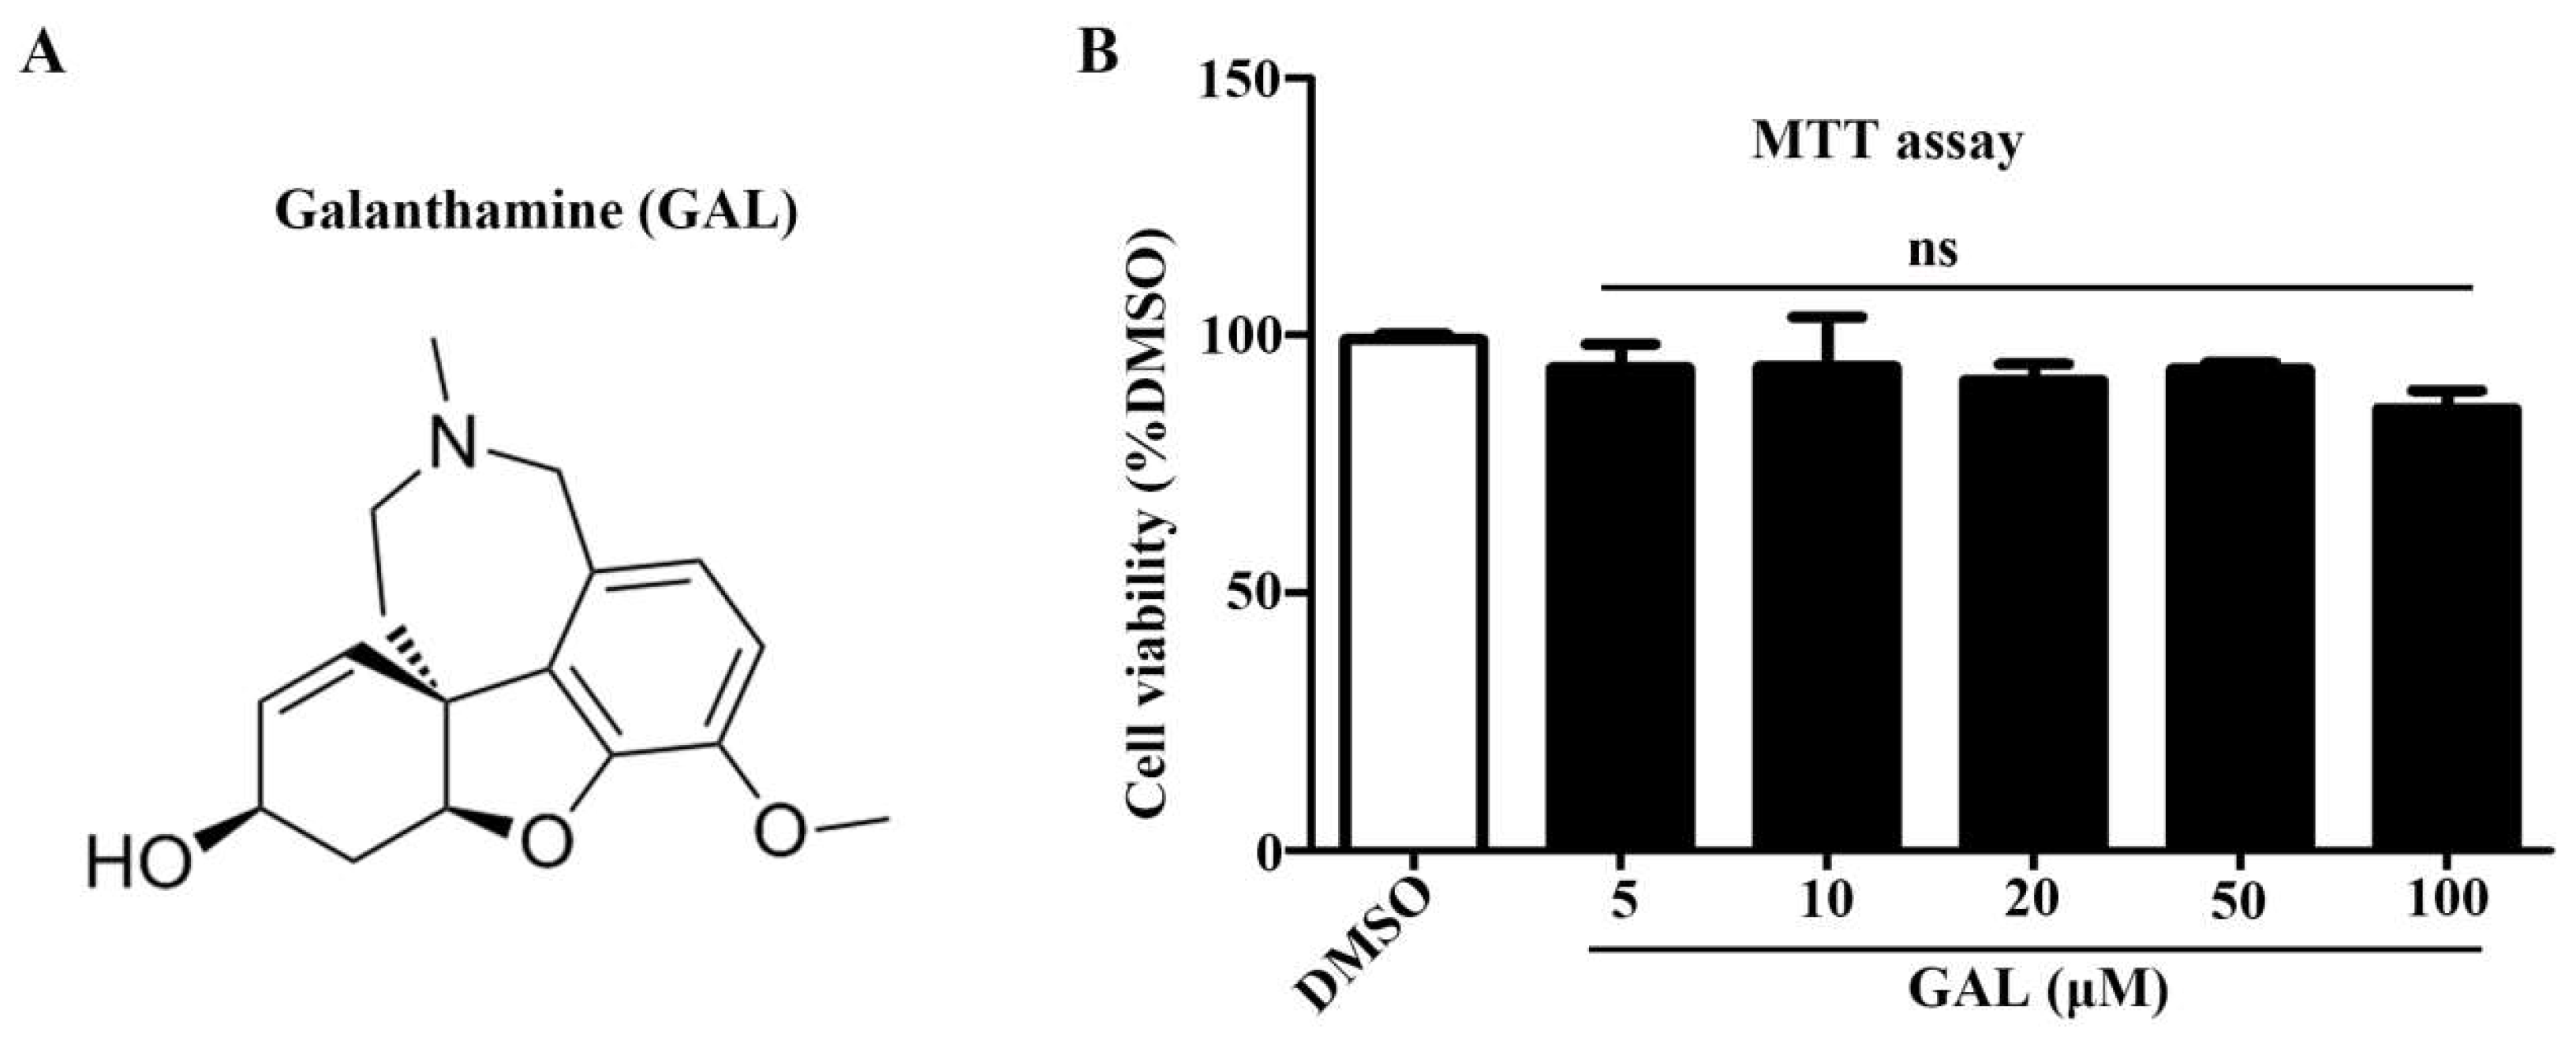
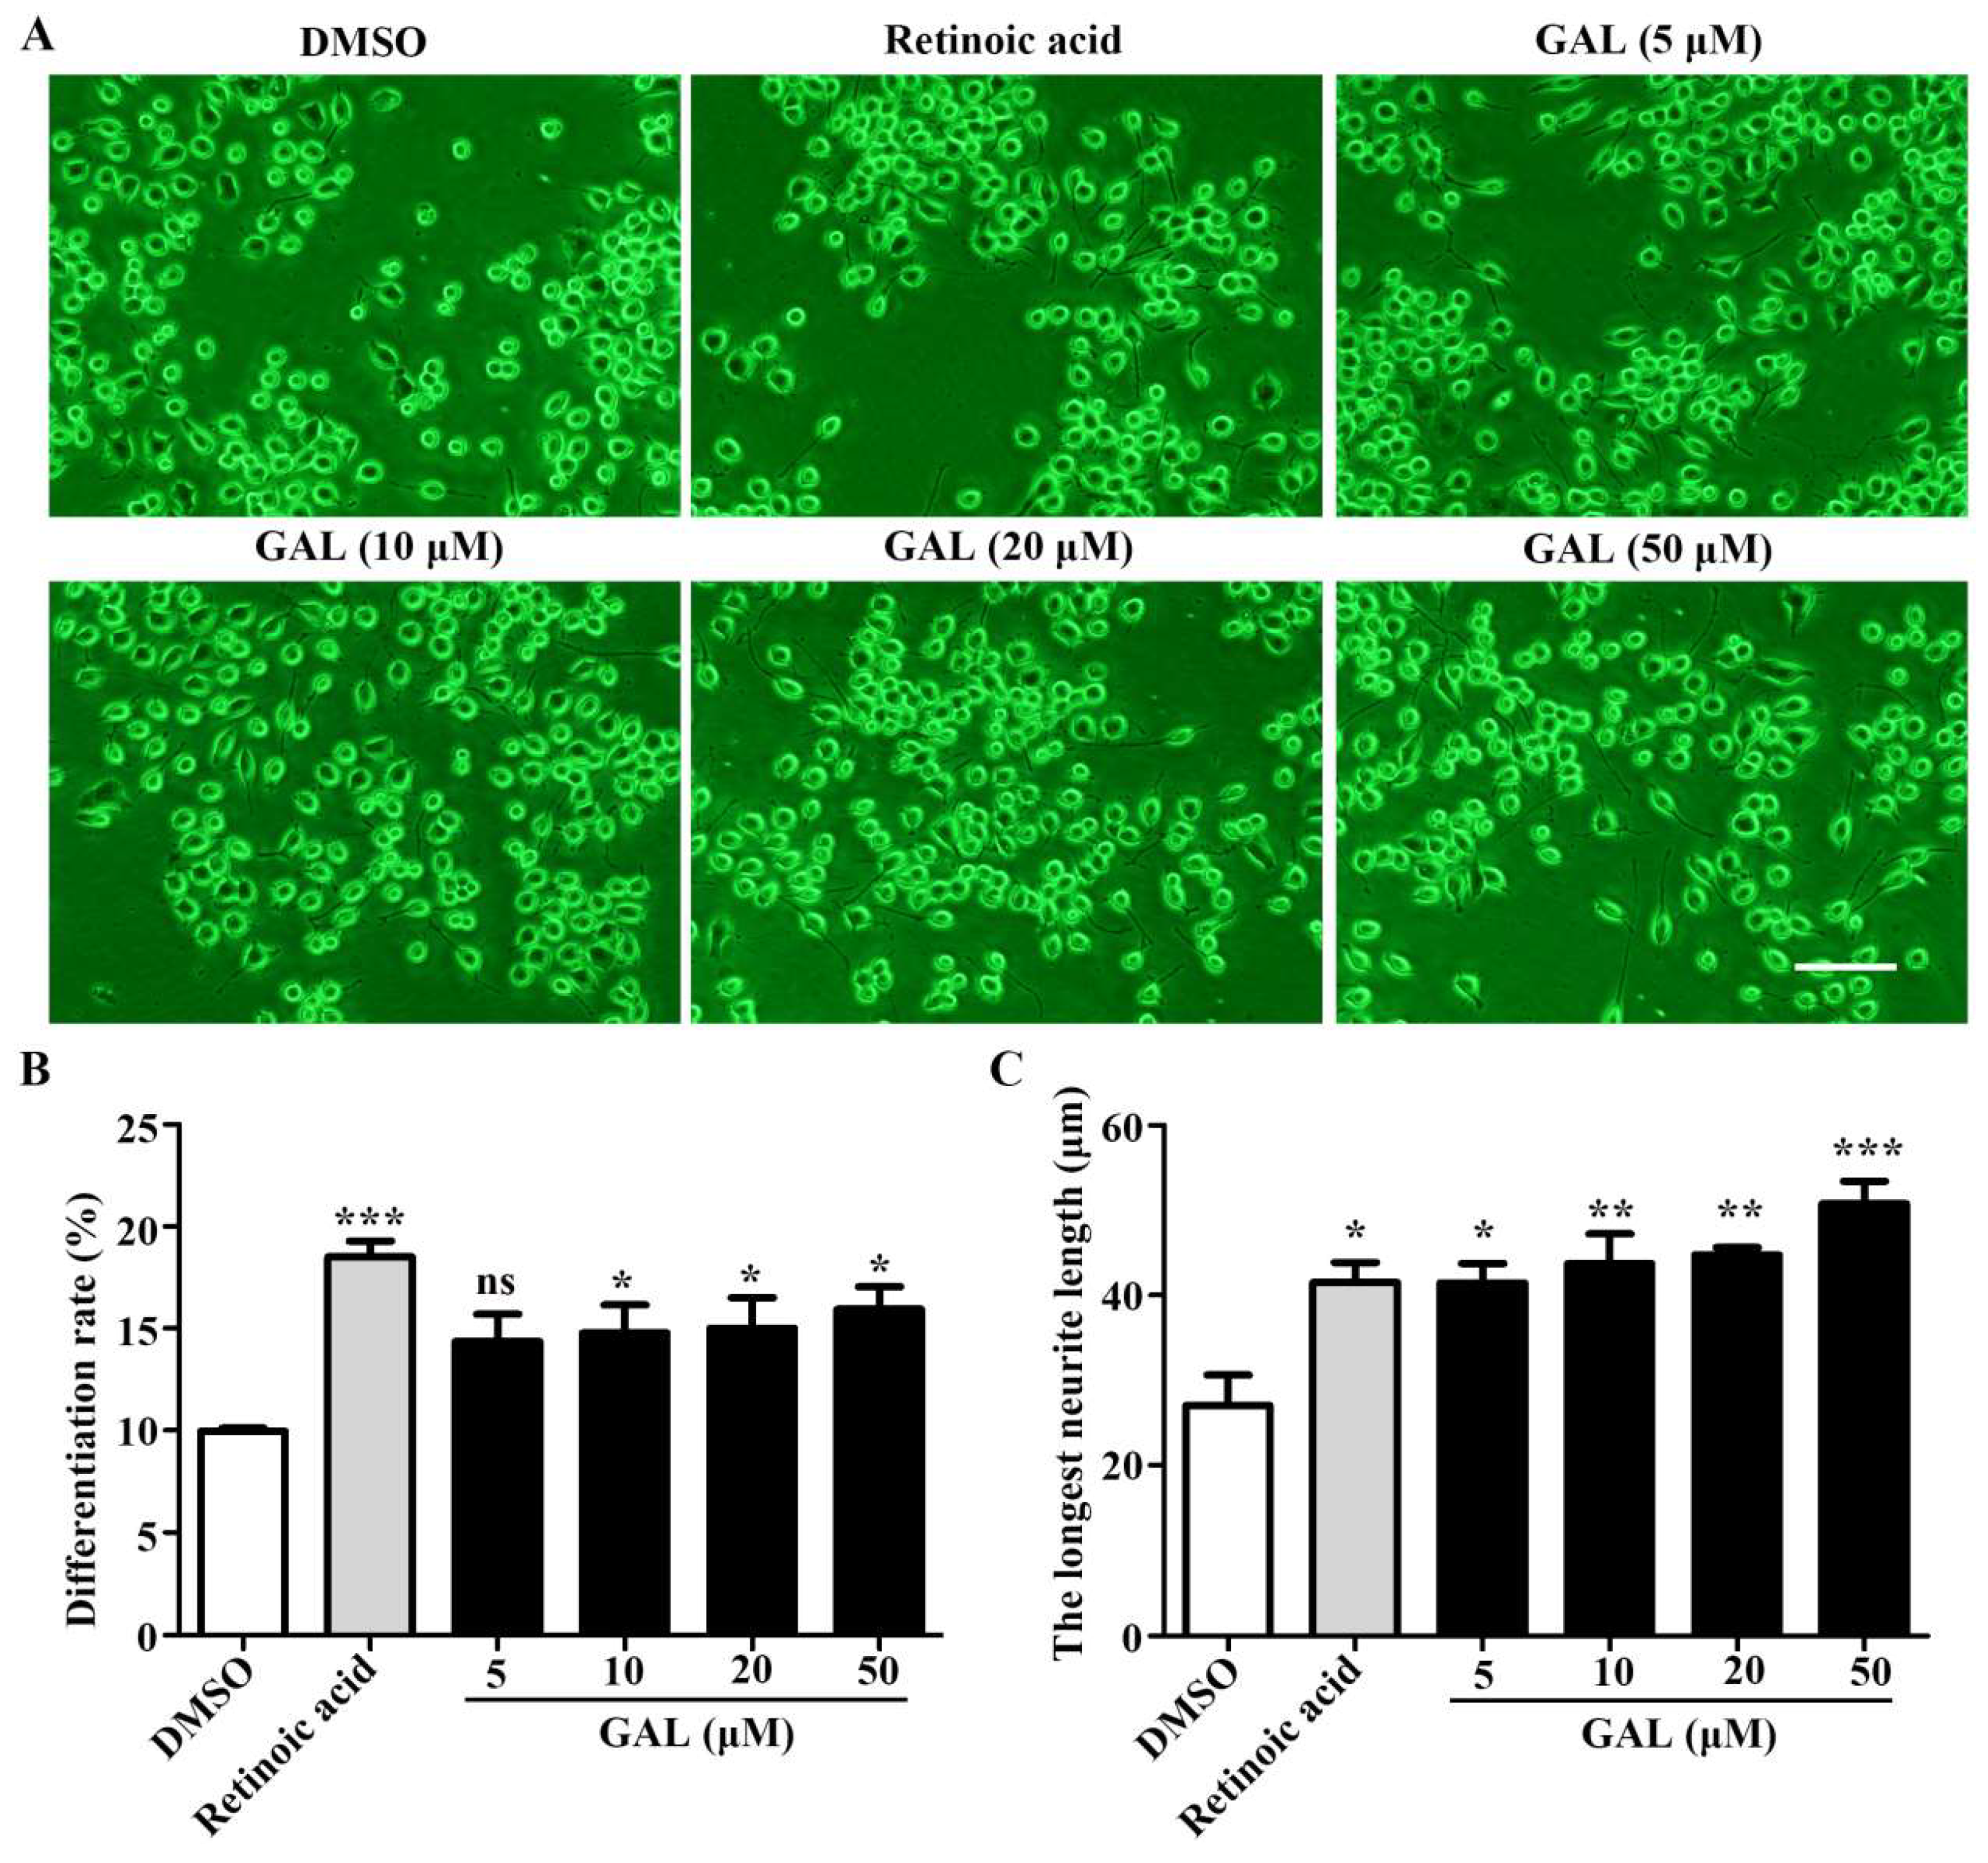
2.1. Galanthamine Induces the Differentiation and Promotes Neurite Outgrowth of Neuro-2a Cells
Herein, we studied the effects of galanthamine on neuronal differentiation using Neuro-2a cells as an in vitro model. The MTT assay showed that the viability of Neuro-2a cells was not significantly effected after incubation with galanthamine at 5-100 μM for 48 h (
Figure 1A, B). Then, we investigated whether galanthamine affects the neuronal differentiation of Neuro-2a cells. The All-trans retinoic acid (RA), renowned as a potent neuritogenic agent for Neuro-2a cells, served as the positive control in the experiment. After a 48h treatment with galanthamine, the morphological changes of cells were captured with phase contrast microscope (
Figure 2A). The differentiation rate (
Figure 2B) and the longest length of neurite of each cell (
Figure 2C) have been analyzed. Notably, galanthamine does-dependently induced cell differentiation and promoted neurite outgrowth. Interestingly, the same dose of galanthamine promotes the growth of neurites more significantly than cell differentiation compared to RA.
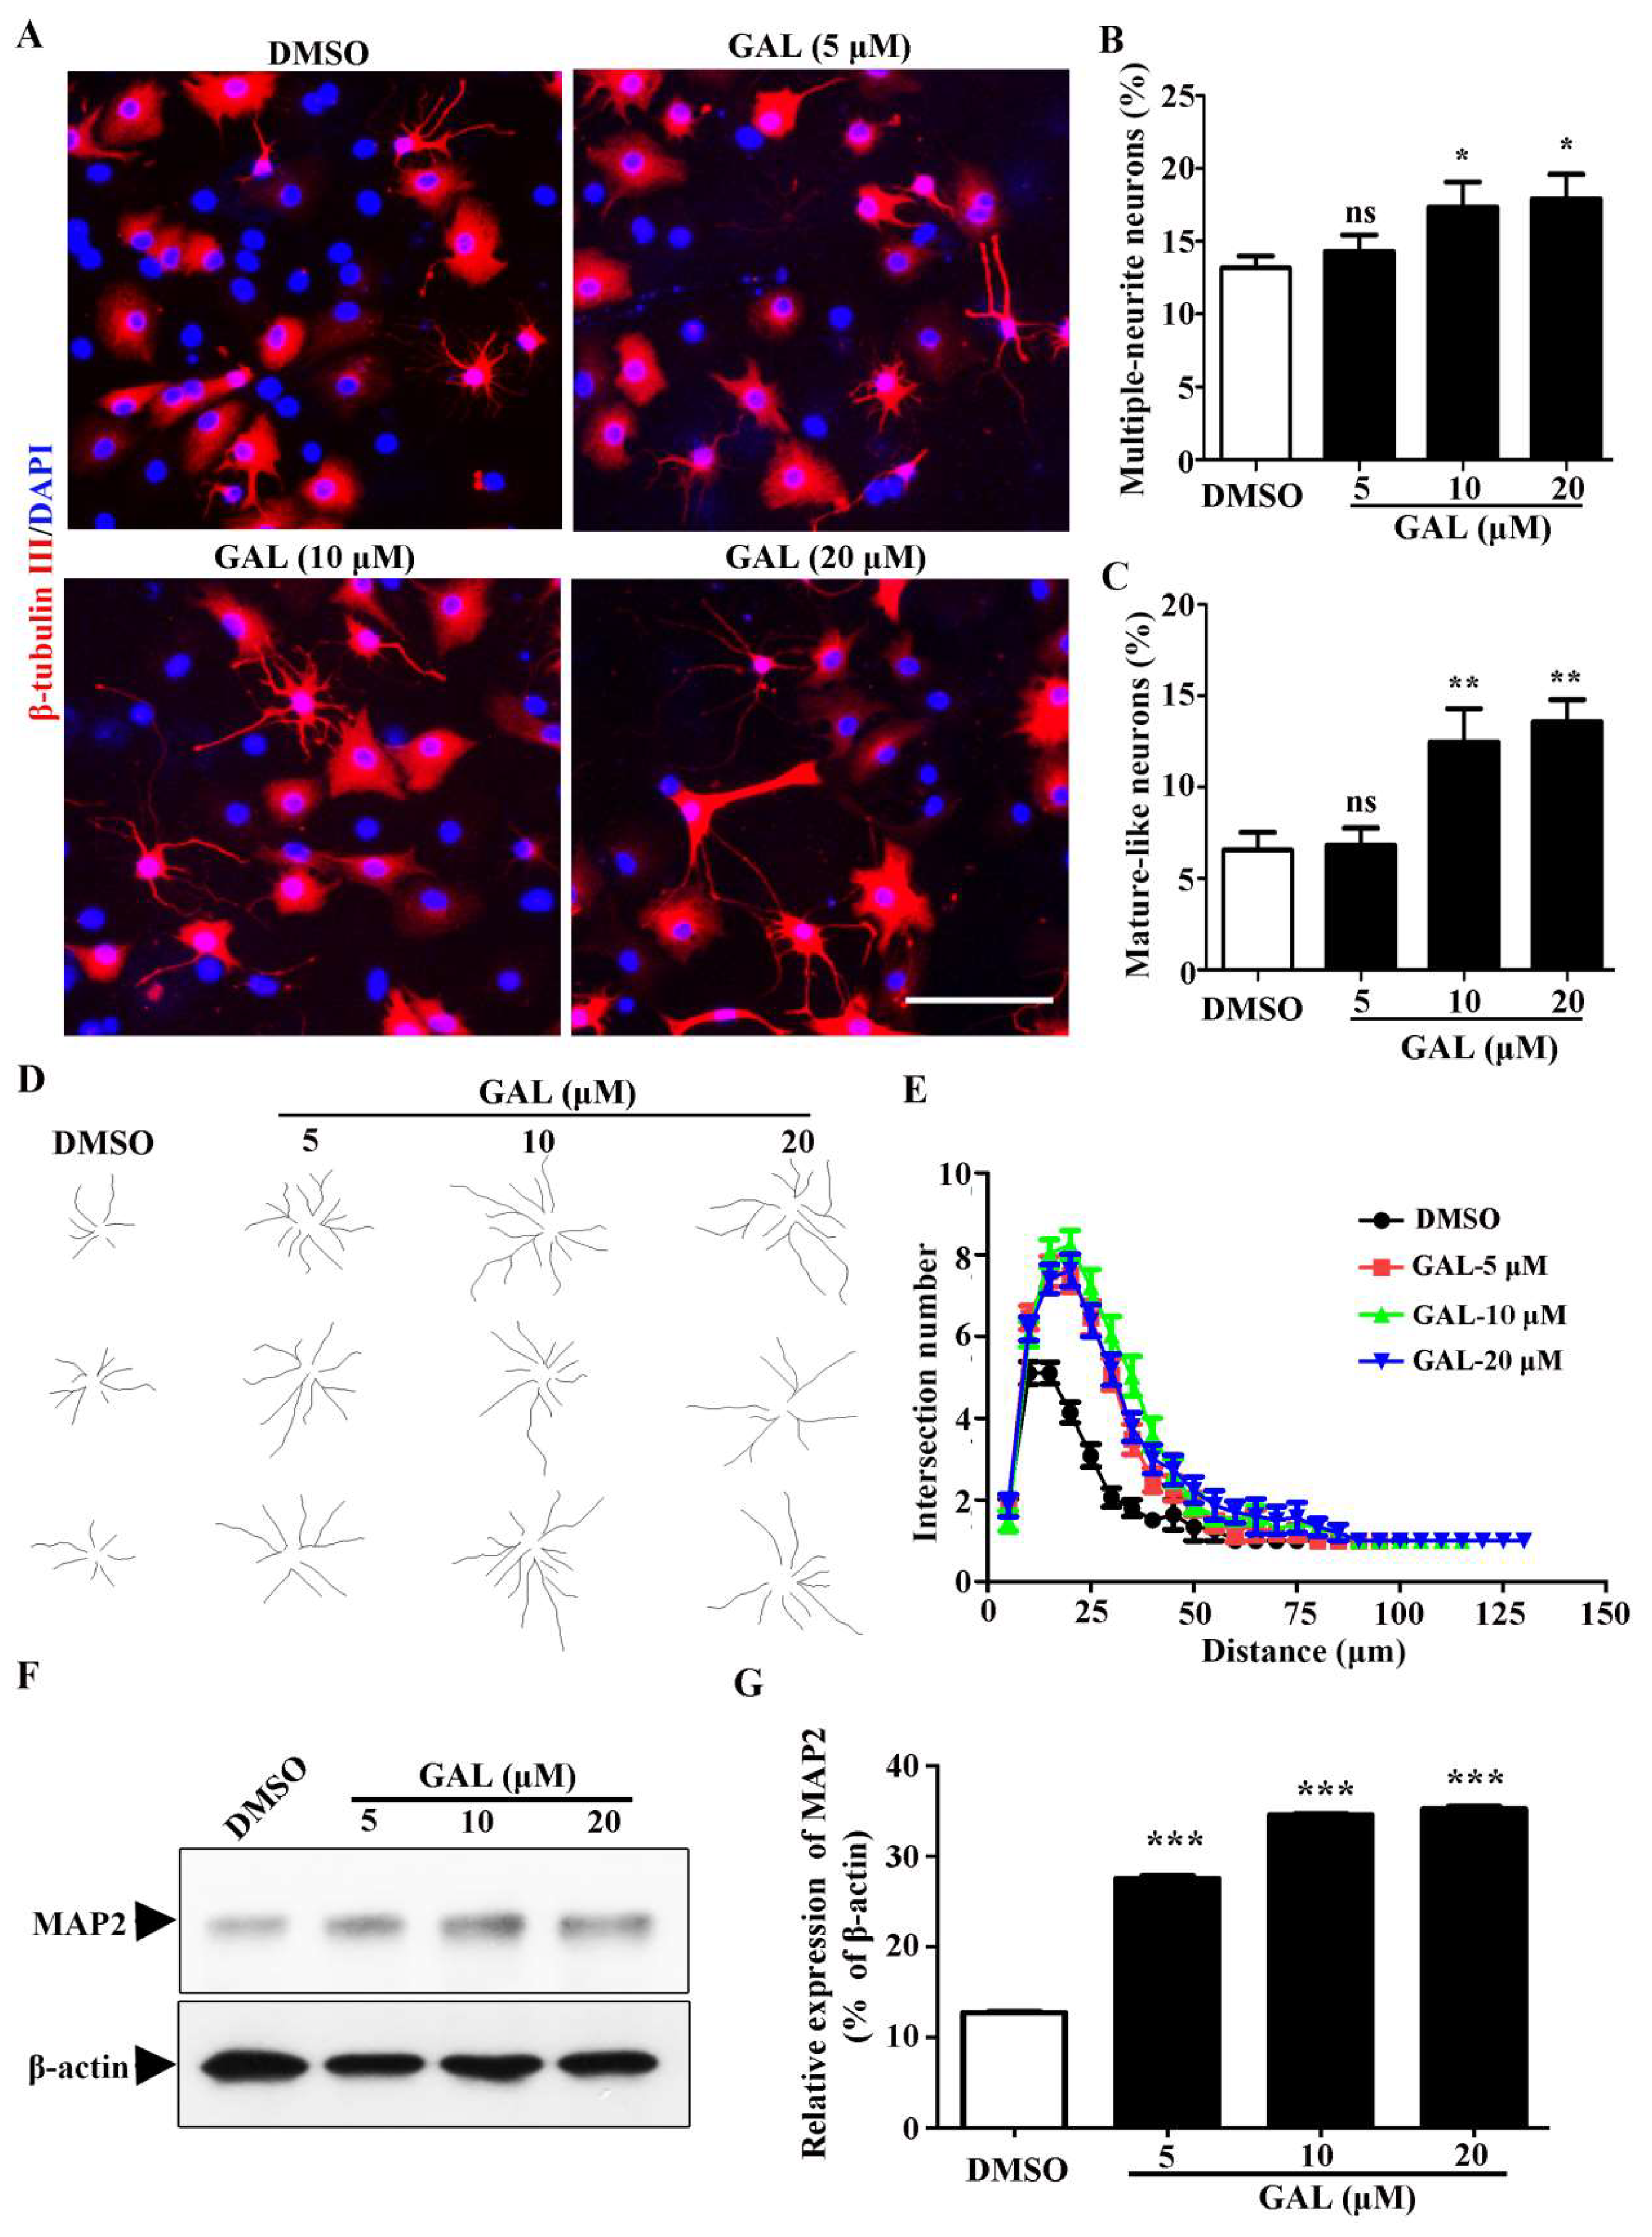
2.2. Galanthamine Promotes the Differentiation of NSPCs
To ascertain whether galanthamine has the ability to promote neuronal differentiation, we investigated its effects on primary cortical NSPCs. After 5 days of treatment with galanthamine, it was observed that galanthamine was capable of enhacing NSPCs differentiation, indicated by higher percentages of cells positive for the neuronal marker β-tubulin III and astracyte marker GFAP (
Figure 3A). The percentage of neurons was significantly increased from 40.96 ± 1.91 % (DMSO) to 68.26 ± 1.61 % (galanthamine, 5 μM), 69.99 ± 1.27 % (galanthamine, 10 μM) and 71.39 ± 1.72 % (galanthamine, 20 μM), respectively (
Figure 3B). The percentage of astracytes was increased from 6.70 ± 0.54 % (DMSO) to 7.90 ± 1.53 % (galanthamine, 5 μM), 11.08 ± 1.52 % (galanthamine, 10 μM) and 20.09 ± 1.62 % (galanthamine, 20 μM), respectively (
Figure 3C). Additionally, the expression levels of β-tubulin III and GFAP protein were measured using western blot analysis. Consisitently, an increase in protein levels for both β-tubulin III and GFAP was observed (
Figure 3D,E). These data furthersupport that galanthamine promotes the differentiation of NSPCs.
2.3. Galanthamine Stimulates the Maturation Process of Newborn Neurons Derived from NSPCs
During the development of neurons, the cell morphology undergoes significant alterations, exhibiting more extensive neurites and a notable increase in the number of branches for each individual neuron. To gain a comprehensive understanding of the influence of galanthamine during neuronal maturation, a quantitative assessment of the total multiple-neurite neurons were measured for β-tubulin III positive cells (
Figure 4A). Upon treatment with galanthamine, the percentage of multiple neurite neurons (more than two branches) was significantly increased from 13.17 ± 0.83 % (DMSO) to 14.31 ± 1.13 % (galanthamine, 5 μM), 17.33 ± 1.74 % (galanthamine, 10 μM) and 17.90 ± 1.69 % (galanthamine, 20 μM), respectively (
Figure 4B). In
Figure 4A, mature-like neurons exhibited elongated and extensive dendrites. Remarkably, our results demonstrate galanthamine treatment significantly increased the percentage of mature-like neurons from 6.57 ± 0.96 % (DMSO) to 6.82 ± 0.93 % (galanthamine, 5 μM), 12.47 ± 1.82 % (galanthamine, 10 μM) and 13.58 ± 1.21 % (galanthamine, 20 μM), respectively (
Figure 4C). Furthermore, the impact of galanthamine on dentritic complexity was evaluated using
Sholl analysis (
Figure 4D,E). The findings revealed that galanthamine facilitates the formation of more ccoplex neurite structure in newborn neurons. Moreover, an increase in the mature neuron-specific cytoskeletal protein, microtubule-associated protein 2 (MAP2) was observed in these neurons derived from NSPCs (
Figure 4F,G). In conclusion, we deduce that galanthamine treatment not only promotes neurogenesis of NSPCs and but also induces greater morphological maturity in the resulting neurons.
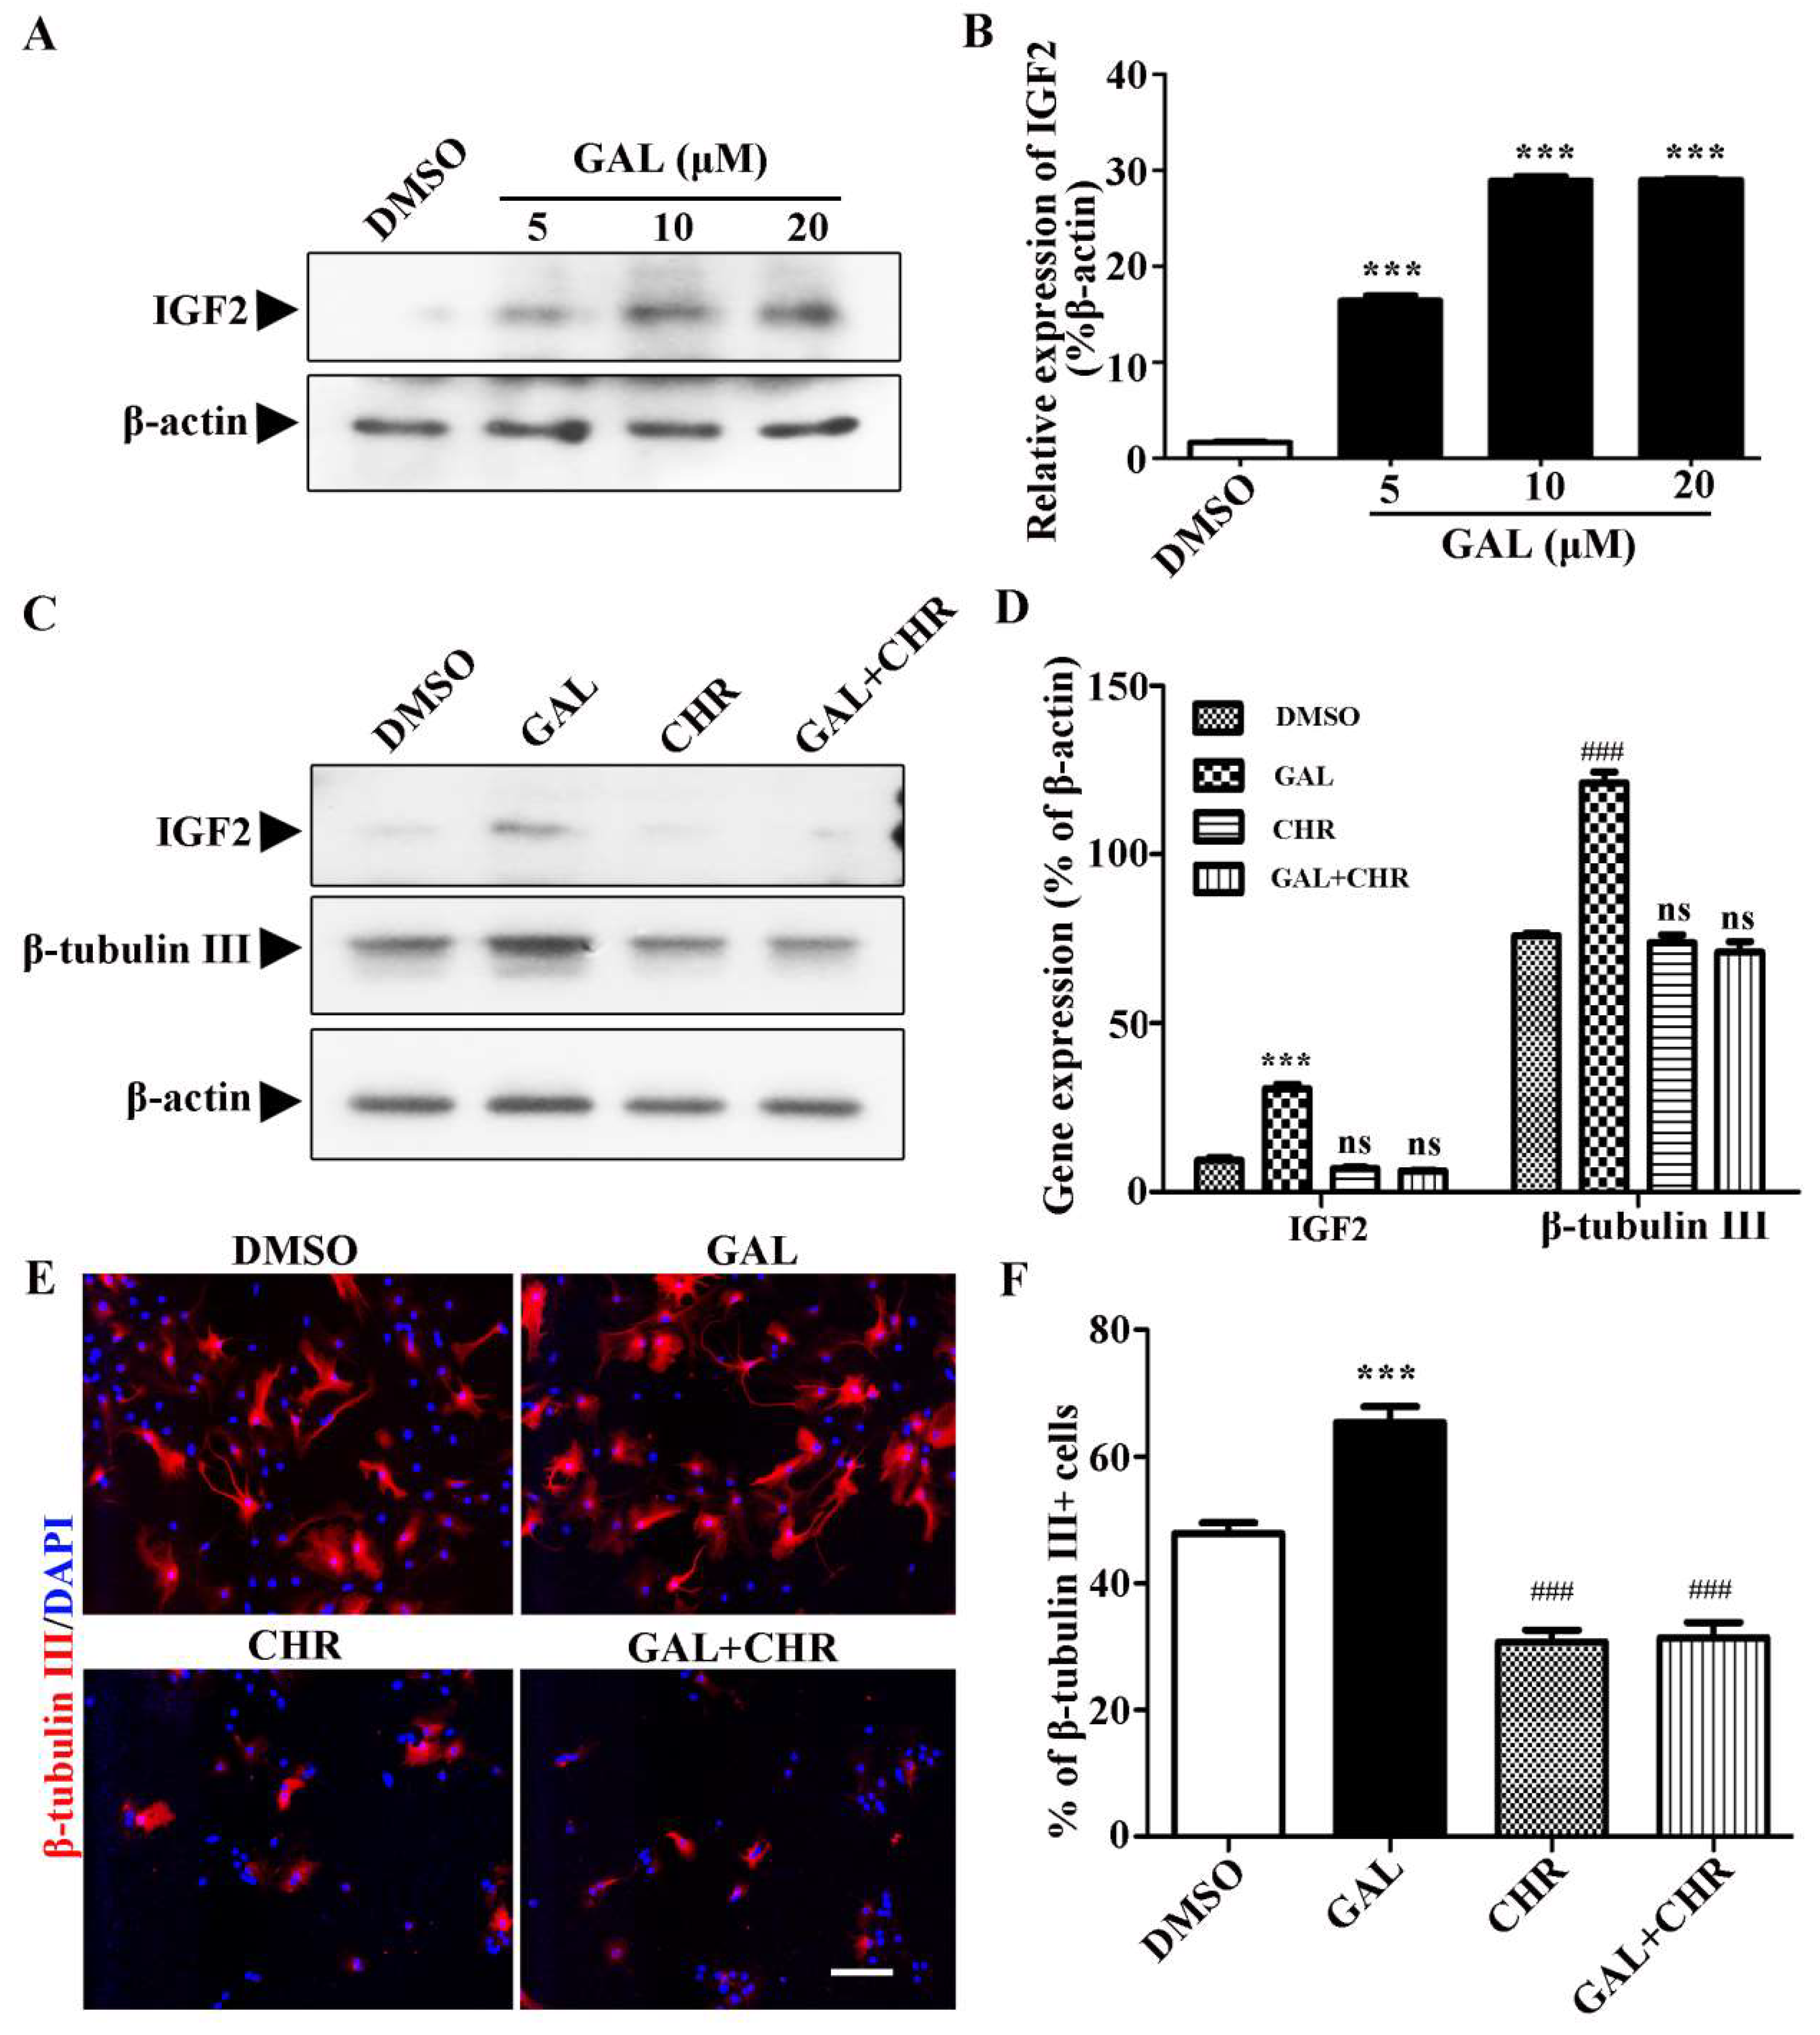
2.4. Galanthamine Promotes Neuronal Differentiation of NSPCs by Up-Regulating IGF2
Further studies are needed to explore the mechanism by which galanthamine influnces the NSPCs differentiation. Previous studies have shown that insulin-like growth factor 2 (IGF2) are involved in adult hippocampal neurogenesis[
19,
20]. In this study, we found that galanthamine can significantly promote the expression of IGF2 during the differentiation process of NSPCs and exhibit a certain concentration dependence (
Figure 5A,B). Thus, it is likely that the effects of galanthamine on NSPCs differentiation are mediated by IGF2. To further confirm this hypothesis, Chromeceptin, an specific inhibitor of IGF2 was used to investigate whether it could reverse the promoting effect of galantamine on the differentiation of NSPCs. Notably, western blotting analyses demonstrate that Chromeceptin exerts a marked inhibitory effect on the up-regulation of IGF2 expression mediated by galantamine. Additionally, Chromeceptin significantly attenuates the expression of β-tubulin III during the process of NSPC differentiation (
Figure 5C,D). Consistent with the western blot analysis,the results of immunofluorescence staining also showed that Chromeceptin could significantly reduce the number of neurons (β-tubulin III positive cells) differentiated from NSPC treated with galanthamine (
Figure 5E,F). The finding indicate that galanthamine enhances neuronal differentiation of NSPCs by up-regulating the IGF2 signaling pathway.
3. Discussion
The precise regulation of neuronal differentiation and neurite outgrowth holds paramount importance in the developmental processes of the nervous system, and is crucial in the development of therapeutic strategies aimed to promote axon regeneration after nerve injury or in neurodegenerative diseases. In this study, we investigated the potential of galanthamine to induce neuronal differentiation and enhance neurite outgrowth in NSPCs. Our findings revealed that galanthamine notably stimulated both neuronal differentiation and neurite outgrowth in NSPCs. Moreover, we observed that neuronal morphology and complexity changed significantly during neuronal maturation. These findings expand our understanding of the mechanism of galanthamine in the treatment of neurodegenerative diseases.
Galanthamine, a natural product isolated from several Amaryllidiceae species, is commonly used against Alzheimer’s disease. Base on current research, the molecular mechanism underlying galantamine’s therapeutic effect in Alzheimer’s disease (AD) is intricate and multifaceted. Galantamine primarily acts as a reversible inhibitor of acetylcholinesterase (AChE), an enzyme responsible for the degradation of acetylcholine (ACh), a neurotransmitter crucial for cognitive functions. By inhibiting AChE, galantamine enhances the synaptic levels of ACh, thereby facilitating cholinergic neurotransmission. This augmentation of cholinergic signaling is believed to be a key mechanism underlying galantamine’s therapeutic benefits in AD. While the mechanism of galanthamine’s therapeutic action remains uncertain and needs to be further elucidated. Current research has also found that galanthamine can stimulate neurogenesis in brain regions including the hippocampus and subventricular zone.
The present study aimed to investigate the effect of galanthamine on NSPCs, particularly focusing on the differentiation and neurite outgrowth of newborn neurons. Initially, using Neuro-2a cells, a neuron-like cell line, we demonstrated that galanthamine significantly increased the cell differentiation rate and promoted neurite outgrowth. Subsequently, we expanded our observations to primary NSPCs. Consistent with our findings in Neuro-2a cells, galanthamine treatment led to a notable enhancement in the differentiation of NSPCs into mature neuronal lineages, as evidenced by increased expression of neuronal markers and the emergence of complex neuronal morphologies. This process was accompanied by a robust extension and branching of neurites, indicative of enhanced neuronal connectivity and functional integration.
Furthermore, previous research has hinted at a potential mechanism underlying galanthamine’s pro-differentiation effects, implicating the involvement of IGF2 signaling. In this study, we observed that galanthamine treatment up-regulated the expression of IGF2, which are known to play pivotal roles in neuronal differentiation, survival, and maturation. This suggests that galanthamine may exert its neurogenic effects, at least partially, through modulating the IGF2 signaling pathway. To further validate this hypothesis, we employed a small molecule inhibitor (Chromeceptin) in loss-of-function assays specifically targeting IGF2. By inhibiting IGF2 signaling, we observed a significant attenuation of the stimulatory effects of galanthamine on the differentiation of NSPCs. These findings not only strengthen the link between galanthamine and IGF2 in neuronal differentiation but also highlight the therapeutic potential of manipulating this pathway for neurological disorders characterized by impaired neurogenesis.
In summary, our findings demonstrate that galanthamine treatment promotes not only neurogenesis but also the development of mature and complex neuronal morphology. These morphological changes are crucial for the establishment of functional neural connections and the integration of newborn neurons into existing neural circuits. Therefore, galanthamine holds promise as a potential therapeutic agent in promoting neural repair and regeneration in various neurological disorders. However, further studies are needed to elucidate the underlying mechanisms of galanthamine’s effects on neuronal morphology and function.
4. Materials and Methods
4.1. Reagents
The reagents utilized in this research are enumerated as follows: Galanthamine and Chromeceptin, both procured from Yuanye Pharmaceutical Company (Yuanye, China); Retinoic acid (RA), poly-D-lysine, Laminin, DMSO, Accutase, and MTT sourced from Sigma (USA); Dulbecco’s modified Eagle’s medium (DMEM/F12), Minimum Eagle’s Medium (MEM), Fetal bovine serum (FBS), Penicillin, and Streptomycin from Hyclone (USA); B27 and N2 Supplement obtained from Gibco (USA); DAPI, Protease and Phosphatase inhibitors cocktail acquired from Beyotime (China); and Basic fibroblast growth factor (bFGF) and Epidermal growth factor (EGF) provided by Peprotech (UK).
The following antibodies were used: β-tubulin III antibody (Sigma, USA); MAP2 antibody and GFAP antibody (Santa cruz, USA); β-actin antibody, IGF2 antibody, HRP-conjugated rabbit and mouse secondary antibodies (Beyotime, China); Alexa Fluor-546 goat anti-mouse IgG (Invitrogen, USA).
4.2. Cell Culture
Neuro-2a cell line (ATCC, USA) were cultured, passaged and differentiated as previously described[
21]. The cells were cultured in MEM culture medium (containing 10 % heat-inactivated FBS and 1% penicillin/streptomycin) and were passaged by trypsinization after reaching 80-90 % confluence. For differentiation, Neuro-2a cells were seeded onto 6-wells plate at a density of 2×10
4 cells per well and incubated in MEM differentiation medium (containing 0.5% heat-inactivated FBS and 1% penicillin/streptomycin) for 2 days.
NSPCs were isolated, cultured and passaged following previously established protocols[
22]. The NSPCs were cultured in growth medium (DMEM/F12 medium supplemented with 2% (v/v) B27, 1% (v/v) N2, 20 ng/mL bFGF, 20 ng/mL EGF and 1% penicillin/streptomycin). After another 5-7 days incubation, the formed neurospheres were passaged as single cells using Accutase. For differentiation, single cells dissociated from neurospheres were seeded on 14 mm coverslips pre-coated with poly-D-lysine (100 ng/mL) and laminin (20 μg/mL) at a density of 2 × 10
4 cells/mL. Cells were induced in DMEM/F12 differentiation medium (containing 10% FBS and 1% penicillin–streptomycin) for 5 days to allow differentiation into multiple cell linages.
4.3. MTT Analysis
Cell viability was assessed through the MTT assay as previously described[
21]. For the assay, a total of 5×10
3 cells were seeded into each well of a 96-well microtiter plates and allowed to grow for 24 h. Sebsequently, the cells were were exposed to varying concentrations of galanthamine (5, 10, 20, 50 and 100 µM). Following a 24-hour incubation period, the media containing galanthamine were meticulously aspirated and 100 µL of MTT solution (0.5 mg/mL in MEM) was dispensed into each well. The plates were then further incubated for 4h. Afterward, 200 µL of DMSO was added to each well to dissovled the formazon crystals. Finally, the absorbance of the resulting solution was measured at 570 nm using microplate reader.
4.4. Western Bloting
The cells were lysed using RIPA buffer (supplemented with protease and phosphatase inhibitors cocktail). Whole cell-lysates obtained from this process were quantitatively analyzed using a BCA protein assay kit (TIANGEN, China). Subsequently, those cell lysates were separated by SDS-PAGE based on their molecular size, and then transferred to PVDF blotting membranes. Specific primary antibodies were used to probe the membranes, followed by incubation with suitable secondary antibodies. Finally, the protein bands were detected through electrochemiluminescence (ECL) technology.
4.5. Immunostaining
For immunostaining, the cultured cells were first fixed in 4% paraformaldehyde (PFA) for 20 minutes, then permeabilized with PBS containing 0.4% Triton X-100. Blocking was performed using PBS containing 5% goat serum and 1% bovine serum albumin (BSA) for 20 minutes. The cells were subsequently incubated overnight at 4°C with primary antibodies, followed by a 1-hour incubation at room temperature with Alexa Fluor-546 goat anti-mouse IgG or Alexa Fluor-488 goat anti-rabbit IgG as secondary antibodies. Nuclei were stained with DAPI. Fluorescence images were captured using an Olympus IX71 microscope (Olympus Corporation, Japan).
4.6. Statistical Analysis
The results are presented as the mean ± standard error of the mean (SEM). Statistical analysis was performed using student’s t test or one way analysis of variance (ANOVA) test to evaluate the differences between the relevant control group and each experimental group. A value of P < 0.05 was considered statistically significant.
Funding
This work was financially supported by the Scientific Research Foundation of Hunan Provincial Education Department ( 24B0716, 22A0549, 22B0764); the Hunan Provincial Natural Science Foundation (2024JJ7366); the National Natural Science Foundation of China (NO.32070367).
References
- Stiles, J.; Jernigan, T. L., The Basics of Brain Development. Neuropsychology Review 2010, 20, (4), 327-348. [CrossRef]
- Markesbery, W. R.; Lovell, M. A., Neuropathologic Alterations in Mild Cognitive Impairment: A Review. Journal of Alzheimer’s Disease 2010, 19, (1), 221-228.
- Temple, S., The development of neural stem cells. Nature 2001, 414, (6859), 112-117. [CrossRef]
- Abraham, R.; Verfaillie, C. M., Neural differentiation and support of neuroregeneration of non-neural adult stem cells. Progress in Brain Research 2012, 201, 17.
- Nie, L.; Yao, D.; Chen, S.; Wang, J.; Pan, C.; Wu, D.; Liu, N.; Tang, Z., Directional induction of neural stem cells, a new therapy for neurodegenerative diseases and ischemic stroke. Cell Death Discovery 2023, 9, (1). [CrossRef]
- Pincus, D. W.; Goodman, R. R.; Fraser, R. A. R.; Maiken, N.; Goldman, S. A., Neural Stem and Progenitor Cells: A Strategy for Gene Therapy and Brain Repair. Neurosurgery 1998, (4), 858-867. [CrossRef]
- More, S. V.; Koppula, S.; Kim, I. S.; Kumar, H.; Kim, B. W.; Choi, D. K., The Role of Bioactive Compounds on the Promotion of Neurite Outgrowth. Molecules 2012, 17, (6). [CrossRef]
- Harvey, A. L., The pharmacology of galanthamine and its analogues. Pharmacology & Therapeutics 1995, 68, (1), 113. [CrossRef]
- Bickel, U.; Thomsen, T.; Weber, W.; Fischer, J. P.; Bachus, R.; Nitz, M.; Kewitz, H., Pharmacokinetics of galanthamine in humans and corresponding cholinesterase inhibition. Clinical Pharmacology & Therapeutics 1991, 50, (4), 420-8. [CrossRef]
- Kong, Y. R.; Tay, K. C.; Su, Y. X.; Wong, C. K.; Khaw, K. Y., Potential of Naturally Derived Alkaloids as Multi-Targeted Therapeutic Agents for Neurodegenerative Diseases. Molecules 2021, 26, (3), 728. [CrossRef]
- Wilkins, H.; Newhouse, P., Acetylcholinesterase and Cognitive Enhancement. 2010.
- Afonso; Caricati-Neto; and; Luiz; Carlos; Abech; D’angelo; and; Haydee; Reuter, Enhancement of purinergic neurotransmission by galantamine and other acetylcholinesterase inhibitors in the rat vas deferens - ScienceDirect. European Journal of Pharmacology 2004, 503, (1-3), 191-201.
- Marco, L.; Carreiras, M. D. C., Galanthamine, a Natural Product for the Treatment of Alzheimer’s Disease. Recent Patents on CNS Drug Discovery 2012, 1, (1), 105-111.
- Rainer, M., Galanthamine in Alzheimer’s Disease. CNS Drugs 1997, 7, 89-97. [CrossRef]
- Gool, W. A. V., Use of galantamine to treat vascular dementia. Lancet 2002, 360, (9344), 1512-1513. [CrossRef]
- Pohanka, M., Acetylcholinesterase inhibitors: a patent review (2008 – present). Expert Opinion on Therapeutic Patents 2012. [CrossRef]
- Mona; Mehta; Abdu; Adem; Marwan; Sabbagh, New acetylcholinesterase inhibitors for Alzheimer’s disease. International journal of Alzheimer’s disease 2012.
- Jin, K.; Xie, L.; Mao, X. O.; Greenberg, D. A., Alzheimer’s disease drugs promote neurogenesis. Brain Research 2006, 1085, (1), 183-188. [CrossRef]
- Kita, Y.; Ago, Y.; Takano, E.; Fukada, A.; Takuma…, K., Galantamine increases hippocampal insulin-like growth factor 2 expression via α7 nicotinic acetylcholine receptors in mice. Psychopharmacology 2013, 225, (3), 543-551. [CrossRef]
- Kita, Y.; Ago, Y.; Higashino, K.; Asada, K.; Takano, E.; Takuma, K.; Matsuda, T., Galantamine promotes adult hippocampal neurogenesis via M1 muscarinic and α7 nicotinic receptors in mice. International Journal of Neuropsychopharmacology 2014, 17, (12), 1957-68. [CrossRef]
- Xiang, X.; Jiang, X.; Lin, H.; Yu, M.; Wu, L.; Zhou, R., Acylhydrazone Derivative A5 Promotes Neurogenesis by Up-Regulating Neurogenesis-Related Genes and Inhibiting Cell-Cycle Progression in Neural Stem/Progenitor Cells. Molecules 2024, 29, (14), 3330. [CrossRef]
- Xiang, X.; Jiang, X.; Lu, X., Regulation of neural stem cell self-renewal, proliferation and differentiation by the RhoA guanine nucleotide exchange factor Arhgef 1. Gene 2023, 863, 147306. [CrossRef]
Figure 1.
Influence of galanthamine (GAL) on Neuro-2a cell viability. (A) Molecular structure of GAL. (B) Cell viability was measured by the MTT assay after being cultured with different concentrations of the GAL (5-100 μM) for 24 h. Statistical analyses were performed using One-way ANOVA followed by Dunnett’s test. Data are presented as mean±S.E.M, n =4 per group. ns, no significant vs. DMSO.
Figure 2.
Effect of GAL on the differentiation and neurite outgrowth of Neuro-2a cells. (A) Neuro-2a cells were treated with GAL at concentration (5, 10, 20, 50 μM) for 48h. The differentiation rate (B) and the longest neurite length (C) of each differentiated cell were calculated. Statistical analyses were performed using One-way ANOVA followed by Dunnett’s test. Data are presented as mean±S.E.M, n = 5 per group. ns, no significant differences; *P < 0.05, **P < 0.01, ***P < 0.001 vs. the DMSO.
Figure 3.
GAL promotes the differentiation of NSPCs. (A) NSPCs were differentiated for a duration of 5 days, either in the presence of DMSO or varying concentrations of GAL. Immunostaining techniques were employed to label newborn neurons with β-tubulin III (red), GFAP (red) for astrocytes and DAPI (blue) for nuclei. The scale bar represents 50 μm. Quantification of neurons (B) and astrocytes (C) differentiated from NSPCs (n=5 per group). (D, E) Western blotting confirmed the presence of β-tubulin III and GFAP protein in treated and untreated cells. Statistical analyses were performed using One-way ANOVA followed by Dunnett’s test. Data are presented as mean±S.E.M, n =3 per group. ns, no significant differences; *P < 0.05, ***P < 0.001, ###P < 0.001 vs. the DMSO.
Figure 4.
GAL stimulates the maturation process of newborn neurons derived from NSPCs. (A) Immunostaining techniques were employed to label newborn neurons with β-tubulin III (red) and nuclei with DAPI (blue). The scale bar represents 50 μm. Quantification of multiple-neurite neurons (B) and those resembling mature neurons (C) differentiated from NSPCs (n=5 per group). (D) It was observed that GAL exerted an influence on the morphology of neurons resembling mature ones. (E) The number of dendritic intersections within a radius of 0-200 μm from the cell bodies was determined through Sholl analysis. (F,G) The expression of MAP2 was analyzed by Western blotting. Statistical analyses were performed using One-way ANOVA followed by Dunnett’s test. Data are presented as mean±S.E.M, n =3 per group. ns, no significant differences; *P < 0.05, **P < 0.01, ***P < 0.001 vs. the DMSO.
Figure 5.
GAL promotes NSPCs differentiating into neurons correlate with a significant increased expression of IGF2. (A,B) The expression of IGF2 in differentiated NSPCs induced by different concentrations of GAL was detected by western blotting. (C,D) Inhibition of IGF2 expression in differentiated NSPCs by Chromeceptin (CHR, 5 μM). IGF2 and β-tubulin III expression were detected by western blotting. Statistical analyses were performed using One-way ANOVA followed by Dunnett’s test. Data are presented as mean±S.E.M, n =3 per group. ns, no significant differences; ***P < 0.001, ###P < 0.001 vs. the DMSO. (E) NSPCs were treated with GAL and CHR for 5 days. Neurons were visualized by immunostaining for β-tubulin III (red) and nuclei with DAPI (blue). The scale bar represents 50 μm. (F) The percentage of β-tubulin III positive cells was measured. Statistical analyses were performed using One-way ANOVA followed by Tukey’s test. Data are presented as mean±S.E.M, n =5 per group. ns, no significant differences; ***P < 0.001 vs. the DMSO; ###P < 0.001 vs.the GAL.

|
Disclaimer/Publisher’s Note: The statements, opinions and data contained in all publications are solely those of the individual author(s) and contributor(s) and not of MDPI and/or the editor(s). MDPI and/or the editor(s) disclaim responsibility for any injury to people or property resulting from any ideas, methods, instructions or products referred to in the content. |
© 2025 by the authors. Licensee MDPI, Basel, Switzerland. This article is an open access article distributed under the terms and conditions of the Creative Commons Attribution (CC BY) license (http://creativecommons.org/licenses/by/4.0/).