Submitted:
22 January 2025
Posted:
23 January 2025
You are already at the latest version
Abstract
This study explores the mechanical and corrosion properties of yttria-reinforced 316L stainless steel. Powder precursor materials were prepared using mechanical alloying. Varying yttria (Y₂O₃) content (1, 3, and 5 wt%) was used to assess its impact on the steel’s properties. X-ray diffraction and scanning electron microscopy confirmed the successful dispersion of Y₂O₃ within the matrix, with the formation of chromium carbides during spark plasma sintering (SPS). The mechanical properties, including hardness and compressive yield strength, improved with increasing Y₂O₃ content, with the highest strength observed in the 316L-5Y₂O₃ sample. However, corrosion resistance decreased with higher yttria concentrations. The 3 wt% Y₂O₃ sample exhibited the highest corrosion rate due to localized corrosion in areas enriched with oxide particles and chromium carbides. Electrochemical testing revealed that carbide formation and Cr-depleted regions from SPS processing contributed to the corrosion behavior. These findings suggest that while yttria reinforcement enhances mechanical strength, optimizing Y₂O₃ content and processing methods is crucial to balance both mechanical and corrosion performance in ODS 316L stainless steel.
Keywords:
Mechanical milling
; SPS
; 316L
; Austenitic stainless steel
; Yttria
; ODS steel
; Corrosion
; EPR-SL
1. Introduction
Austenitic stainless steels are extensively utilized across various industries for their excellent ductility, toughness, workability, and ability to maintain mechanical integrity at high temperatures [1]. Additionally, they offer superior corrosion resistance compared to ferritic steels [2]. Their performance under high-temperature and high-pressure conditions makes them suitable for demanding applications like nuclear reactors, where materials must endure severe operational environments [3,4]. Despite these advantages, austenitic stainless steels face limitations, such as relatively low strength and susceptibility to void swelling, especially when compared to ferritic and ferritic-martensitic steels [5,6]. These limitations have driven the development of oxide dispersion-strengthened (ODS) steels to address these challenges.
Incorporating fine yttria (Y₂O₃) particles into ODS steels significantly enhances their mechanical properties by providing pinning points for dislocation motion and grain boundary migration, suppressing grain coarsening [7,8]. This mechanism improves the yield strength, hardness, creep resistance, and radiation tolerance of the material. The high density of oxide particles also acts as sinks for radiation-induced defects, improving swelling resistance [6,9,10]. Such attributes make ODS steels promising candidates for structural applications in fission and fusion reactors, as well as other extreme environments. However, the processing of austenitic ODS steels poses challenges, primarily due to the stickiness of the powders during mechanical alloying, which can reduce milling efficiency and yield [11].
Mechanical alloying (MA) is the most widely adopted method for fabricating ODS steels, often followed by solid-state consolidation processes such as hot extrusion (HE) [12,13] or hot isostatic pressing (HIP) [13,14]. Recent advancements include spark plasma sintering (SPS), which has gained attention for its ability to achieve high densification rates at lower temperatures and shorter processing times. This reduces grain growth and preserves ultrafine oxide dispersion, enabling the formation of bimodal microstructures that provide an optimal balance between strength and ductility [13,15,16]. Nevertheless, the consolidation of ODS powders via SPS remains underexplored, particularly concerning the effects of varying sintering temperatures and oxide concentrations on the material’s microstructure and mechanical properties [17].
This study aims to systematically investigate the effects of Y₂O₃ content (1, 3, and 5 wt%) on the microstructural evolution, mechanical properties, and corrosion resistance of 316L ODS steels fabricated via mechanical alloying and SPS. By exploring the interplay between processing parameters, oxide concentration, and performance, the work seeks to optimize the balance between strength and corrosion resistance in these advanced materials. The findings are expected to contribute to the development of austenitic ODS steels as high-performance structural materials for extreme environments.
2. Materials and Methods
The oxide dispersion strengthened (ODS) steels were prepared via mechanical alloying (MA) of pre-alloyed 316L austenitic steel and yttria powders at 800 rotation per minute for 1 h in high energy ball mills Retsch E-max under argon atmosphere with 0.04 g of stearic acid served as process control agent (PCA). The milling vessels and balls used were made of AISI 420C steel. The properties of initial powders are shown in Table 1. The ball-to-powder mass ratio was 15:1. The composition of mixed powders was designed as 316L-x Y2O3 (x = 1; 3; 5 wt%).
The particle size distribution of the powders after mechanical alloying was analyzed using a Malvern Panalytical Mastersizer 3000 laser diffraction system. The data for the individual fractions (D90, D10 and D50) were obtained with relative standard deviations ranging from 1 to 1.5 %. The width of the size distribution of particles (Span) was calculated based on equation (1).
where:
Span = (D90 − D10) / D50,
D90 = particle size below which 90 % of the powder volume is present,
D10 = particle size below which 10 % of the powder volume is present and
D50 = median particle size (mean of distribution).
The mechanically alloyed powders were consolidated by spark plasma sintering (SPS) method (FCT Systeme HP-D 10) at 1100 °C, 80 MPa for 10 min under vacuum in graphite tools protected by a boron nitride layer.
2.2. Microstructure
The prepared samples were first ground on SiC papers P120 – P400, then polished on diamond suspension dia-complete 9 μm with polishing cloth Beta, followed by polishing on diamond suspension dia-complete 3 μm with polishing cloth Gamma. Final polishing was executed on the Eposile Non-dry suspension with polishing cloth Zeta. In all cases metallographical material from QATM was used. The microstructure was characterized by a scanning electron microscope (Tescan Mira) with an EDS analyzer (oxford Instruments Aztec). Electron-backscatter diffraction (EBSD) maps of all the microstructures were collected on a ZEIS Geminy 2 microscope. The phase composition was measured by X-ray diffraction (X’Pert3 Powder instrument in Bragg-Brentan geometry using a Co anode (λ = 1.78901, U = 40 kV, I = 35 mA).
2.3. Mechanical Properties
The mechanical properties of prepared alloys were characterized by Vickers hardness and compression measurements. The HV1 was measured on a Future-Tech FM-100 at a load of 1 kgf. At least 10 measurements were performed for each sample. Compression tests were performed on cube-shaped specimens with a side length of 2.5 mm at a strain rate equal to 0.001 s-1 (Instron 5882 instrument) at 25 °C and 600 °C. At least two measurements were performed for each material.
2.3. Corrosion Tests
All electrochemical measurements were performed in a conventional three-electrode setup using a Gamry Instruments electrochemical workstation. The volume of electrolyte per area was 250 ml·cm-2.
Austenitic AISI 316L steel produced through conventional methods was used as a reference material. To evaluate the influence of the processing method on corrosion behaviour, a 316L steel sample was also fabricated using powder metallurgy (MA + SPS) under the same conditions employed for the preparation of composites.
Samples were first ground on SiC paper P2500 to achieve reproducible surfaces. The anodic polarization curves were recorded in substitute ocean water according to the ASTM D 1141-98 standard at 25 °C with 1 h stabilization of open circuit potential (Eoc). The potential was measured with respect to the value of ACLE. The scan rate was 1,667 mV/s.
The single-loop electrochemical potentiokinetic reactivation test (SL-EPR) was performed in a solution of 0.5M H2SO4 + 0.01M KSCN at 25 °C according to the ASTM G 108-94 standard. The specimens were polished using a 2 μm diamond paste. The surface of the samples was first potentiostatically passivated by applying the potential of +200 mV/ACLE and holding for 2 min. Subsequently, the sample was reverse polarized from +200 mV/ACLE to a potential of 50 mV below the EOC with a scan rate of 3 mV/s. For each sample, the microstructure was characterized after electrochemical measurements. Next, the charge (Q) was evaluated by integrating it as the area under the curve. Using this value and the appropriate equation (2) based on the standard, the normalized charge (QPa) was determined.
where:
QPa = Q/X,
Q = charge measured on current integration measuring instrument (C), X = As [5.1 · 10-3 · e0.35 · G], As = specimen area (cm2) and G = grain size number (), according to ISO 643:2003 standard.
3. Results
3.1. Powder Precursors
Mechanical alloying with a process control agent was selected as a optimal method for preparing the powder alloy to prevent undesirable sticking of the powder to the milling balls and vessel walls during high-energy milling. Figure 1a presents the XRD spectra of materials processed at 800 RPM for 1 hour with varying Y₂O₃ content (1, 3, and 5 wt%). The dominant peaks correspond to the FCC structure of 316L stainless steel. Peaks attributable to Y₂O₃ are also evident, signifying the presence of oxide particles. These Y₂O₃-specific peaks become increasingly pronounced with higher Y₂O₃ content, particularly in the 3 and 5 wt% samples, indicating a greater fraction of the oxide phase. The analysis thus confirms the coexistence of the FCC austenitic matrix and Y₂O₃ oxide phases. Figure 1b illustrates the particle size distribution of the mechanically alloyed powders. The mechanically alloyed powders of all alloys exhibit polymodal distribution curves, indicating the presence of both fine and coarse particles. A clear trend of powder refinement with increasing Y₂O₃ concentration is observed, further confirmed by the scanning electron microscope images in Figure 2. Table 2 summarizes the characteristic distribution metrics for each alloy, including D50, D90, D10, and the Span according to equation 1.
3.2. Consolidated Materials
The phase composition of consolidated ODS steel samples reinforced with 1, 3, and 5 wt% Y₂O₃ was analyzed using XRD, as shown in Figure 3. The XRD patterns of all samples consolidated by SPS at 1100 °C confirm the retention of the FCC austenitic structure as the dominant phase. Peaks corresponding to Y₂O₃ are clearly visible. These peaks increase in intensity with higher Y₂O₃ content, reflecting the growing oxide fraction. Additionally, the appearance of new peaks suggests the significant formation of chromium carbides during the SPS process. Surprisingly, part of the Y in the microstructure is according to the XRD presented as a pure element. Although the peaks of Y are not clearly evident in the XRD spectra of powders this can be related to the generally low content of metallic Y phase. We believe that Yttrium may be partially formed during the milling process by breakage and dissolution of Y2O3 into the solid solution.
The microstructure of the consolidated samples is presented in Figure 4. No obvious porosity was detected in the materials, indicating a formation of materials of almost theoretical density. Scanning electron microscope images reveal a relatively uniform distribution of Y2O3 particles throughout the matrix. Additionally, regions with locally coarse grains and varying grain sizes are visible. Close-up images in Figure 4 (d-f) highlight the presence of chromium carbides (green arrows) and oxide particles (red arrows), predominantly located at grain boundaries. In samples with higher Y₂O₃ concentrations (3 and 5 wt.%), bands with increased Y2O3 content are observed, indicating localized enrichment in these regions (highlighted in red ellipses).
Figure 5 (a-c) presents EBSD IPF maps of compacted samples with varying concentrations of Y2O3. The materials exhibit a randomly oriented grain structure. Furthermore, all samples display a bimodal grain size distribution, comprising a mix of ultrafine (up to 0.6 µm) and coarse grains (up to 2.8 µm). Grain twinning, a characteristic feature of austenitic steels, is also observed in the microstructures, especially in the larger grains. Phase distribution maps in Figure 5 (d-f) highlight the presence of chromium carbides (highlighted in green) within the microstructure. The amount of carbides estimated by area fraction from EBSD is almost similar for all materials and corresponds to the range of 5 - 6.5 %.
3.3. Mechanical Properties
The mechanical properties were assessed for austenitic steel samples reinforced with 1, 3, and 5 wt% Y₂O₃. A conventionally produced 316L steel specimen was used as the reference standard for Vickers hardness measurements. For compression testing, a 316L steel sample fabricated via powder metallurgy as other composites served as the reference.
A comparison of the mechanical properties reveals variations in hardness (HV1) and compressive yield strength across materials with different reinforcement concentrations. Hardness increases progressively with higher Y₂O₃ content (Figure 6), with the 316L-5Y₂O₃ specimen achieving the highest value of 435 HV1. Relative to the reference 316L steel, hardness showed an increase of 30% for the SPS-processed 316L sample, 101% for 316L-1Y₂O₃, 134% for 316L-3Y₂O₃, and 149% for 316L-5Y₂O₃.
The compressive tests conducted at room temperature (Figure 7a) reveal a significant difference in mechanical properties between materials with 1 wt% and 3 wt% Y₂O₃ reinforcement. All materials exhibit substantial plasticity, with deformations exceeding 40%, where the test was manually stopped. Samples with 5 wt% reinforcement show properties comparable to those with 3 wt%. The highest compressive yield strength of 1035 MPa was recorded for the 316L-5Y₂O₃ sample, while the lowest value (775 MPa) was observed for the 316L-1Y₂O₃ sample. Compared to the SPS-processed reference material 316L, the yield strength increased by 147% and 230% for the 1 wt% and 5 wt% reinforced samples, respectively. The yield strength values are further summarized in Table 3, providing a clear comparative overview of the mechanical performance across all tested materials. At an elevated temperature of 600 °C (Figure 7b), the yield strength of all materials decreased compared to the results observed at room temperature. The stress-strain curves for the specimens with 3 and 5 wt% Y₂O₃ reinforcement exhibited nearly identical patterns, with similar yield strength values and overall stress-strain behaviour. The material with 1 wt% Y₂O₃ demonstrated significantly higher yield strength than the reference 316L (SPS).
3.4. Corrosion Tests
3.4.1. Potenciodynamic Curves
The potentiodynamic polarization curves were measured for 316L stainless steel produced by SPS and cast, and for ODS steel reinforced with 1 and 3 wt% Y₂O₃. As shown in Figure 8, all curves exhibit similar trend indicating that materials underwent passivation. The steep slope of cathodic tafel region further indicate the oxidation process and formation of passive layer. It is worth to underline that the higher resistivity to localized corrosion had the reference sample, which is proved by the ∆E (the difference between Ecorr and Eb) shown in in Table 4. On the contrary the lowest resistivity to localized corrosion is observed for 316L (SPS). ODS steels are characterized by higher Eb, although ∆E is reduced with higher amount of Y2O3 in materials.
3.4.2. EPR-SL
The electrochemical potentiokinetic reactivation curves obtained using the single-loop method (Figure 9) show a clear increase in the reactivation peak current density as the Y₂O₃ content in the materials decreases. From these curves, the reactivation charge Q (C) was calculated for each material and normalized to the surface charge density QPa (C/cm²), as summarized in Table 5. The degree of sensitization was observed to increase with decreasing QPa. Surface micrographs of the materials after exposure (Figure 10) reveal preferential corrosion along grain boundaries and around chromium carbides in the case of SPS-processed 316L steel, corresponding to Cr-depleted regions in the matrix. In materials containing Y₂O₃, corrosion is predominantly localized in areas of elevated Y₂O₃ concentration, which also coincides with regions enriched in carbides.
4. Discussion
4.1. Powder Precursors
The XRD spectra in Figure 1a verify the presence of the FCC structure in all powders, demonstrating the retention of the austenitic phase following mechanical alloying. Notably, the primary FCC peaks remain largely unchanged with the addition of Y₂O₃, suggesting that the oxide particles are well-dispersed and have minimal impact on the bulk matrix structure. The polymodal particle distribution shown in Figure 1b offers a distinct advantage for the preparation of consolidated samples via spark plasma sintering, as fine particles enhance bulk density and reduce porosity by filling the voids between coarse particles, a phenomenon similarly observed for SiC materials in the work of S. Lemonnier et al. [18]. The particle distribution width, expressed as a span in Table 2, indicates that a higher span value corresponds to a broader distribution and improved packing density. Accordingly, samples with 3 and 5 wt% Y₂O₃, which have span values of 2.4 and 2.2, respectively, demonstrate better bulk density compared to the 1 wt% Y₂O₃ sample, which exhibits a narrower particle distribution. Particle size analysis (Figure 1b) demonstrates a distinct trend of powder refinement with increasing Y₂O₃ concentration, a finding further supported by the scanning electron microscope (SEM) images in Figure 2. The powders exhibit irregular and angular particle shapes, resulting from the cold welding and subsequent fracturing of particles during mechanical alloying. As in our case, Wang M. et al. [19] also observed particle downsizing caused by strain accumulation and work hardening during mechanical milling, which ultimately led to particle embrittlement and fracture. With Y₂O₃ content increasing from 1 wt.% to 5 wt.%, the powders display a polymodal size distribution alongside a noticeable reduction in average particle size (Table 2). This refinement can be attributed to the mechanical milling process, where the hard Y₂O₃ oxide particles facilitate the fragmentation of larger particles formed through cold welding, thereby enhancing the homogeneity of yttrium distribution in the powder.
4.2. Consolidated Materials
X-ray diffraction analysis of the consolidated materials (Figure 3) identifies an additional phase alongside the austenitic matrix and yttrium oxides, chromium carbides [20]. The formation of these carbides likely occurs unintentionally during the consolidation process, resulting from carbon introduction in the powder during mechanical alloying due to the use of a process control agent (PCA) and the subsequent diffusion of carbon from graphite dies and punches. Microstructure images in Figure 4 reveal areas with locally coarsened grains, likely resulting from localized thermal effects occurring between powder particles during the consolidation process. These thermal gradients can promote grain growth in specific regions, leading to the observed coarsening [17]. The phenomenon of locally coarsened grains is also evident in the IPF maps from the EBSD analyses presented in Figure 5 (a-c) and was also observed by Ninawe et al. [21]. Additionally, as the Y₂O₃ concentration increases, bands with higher concentrations of oxide particles become evident. This distribution is likely caused by the clustering tendency of Y₂O₃ particles during mechanical alloying. In such areas, the grain size is significantly reduced because the particles pin the grain boundaries and prevent their migration. Bimodal grain size distributions have also been observed in other studies on SPS-consolidated alloys. [13,22,23].
4.3. Mechanical Properties
As mentioned in Section 3.3., the hardness of the materials increases with rising Y₂O₃ content, primarily due to the hardening effect of the oxide particles. While the precipitated carbides also influence hardness, their consistent abundance and distribution across all materials ensure that their impact does not overshadow the effect of the Y₂O₃ particles. Koul et al. also reported an increase in hardness with higher Y₂O₃ oxide content [24]. Additionally, the graph in Figure 6 highlights an improvement in hardness for the SPS-processed sample compared to the commercially produced reference sample. This increase is attributed to the presence of carbides in the microstructure and grain size refinement achieved through the SPS process.
The compressive behaviour of ODS 316L steel at both room temperature and elevated temperatures (600 °C) demonstrates the good material’s plasticity under compression. The yield strength of ODS 316L(SPS) exceeds that of conventional 316L stainless steel both at laboratory and elevated temperatures. This enhanced yield strength is attributed to the grain refinement and bimodal grain size distribution, the strengthening effect of dispersed Y2O3 but also the effect of carbide particles. Despite the presence of carbides, all tested materials exhibit significant compressive strain capacity, with compressive strains exceeding 40%. The compression curves at room temperature, shown in Figure 7a, reveal that even a modest addition of 1 wt% Y₂O₃ results in a notable increase in yield strength which is also affected by carbides. As the Y₂O₃ content rises to 3 and 5 wt%, the yield strength continues to improve [24]. Due to the similar content of carbides in materials such increase has to be related to the Y2O3 content in the microstructure. However, the incremental strengthening effect between the 3 wt% and 5 wt% materials is less pronounced most probably due to the more significant formation of clusters of Y2O3, and therefore, increased material heterogeneity. At the elevated temperature of 600 °C, the compression curves (Figure 7b) show a change in slope in the elastic region compared to the room temperature curves, which is attributed to a decrease in the elastic modulus (E). However, the precise value of E could not be determined due to the absence of a tensometer during the measurements. Yield strengths are lower across all materials at this temperature. Notably, the strengthening effect of 5 wt% Y₂O₃ is reduced at elevated temperatures, with the stress-strain curve for this sample closely resembling that of the 3 wt% Y₂O₃ material. This reduction in strengthening efficiency can be attributed to similar mechanisms observed at laboratory temperature, with the added influence of microstructural heterogeneity further promoting grain growth in specific regions and degradation of residual mechanical properties.
4.4. Corrosion Tests
The findings on the basic corrosion behaviour, as outlined in Section 3.4 and derived from the potentiodynamic curves in Figure 8, reveal that corrosion resistance is significantly influenced by both the processing method and the Y₂O₃ content. 316L steel prepared via SPS exhibits the lowest corrosion resistance, with a breakdown potential of just 116 mV—markedly lower than that of the reference cast material. This diminished performance is attributed to the formation of carbides and Cr-depleted grain boundary regions during the SPS process, which serve as preferential sites for localized corrosion. Pardo et al. [25] as well highlighted that the corrosion resistance of austenitic stainless steels in chloride-containing environments primarily arises from the enrichment of the chromium oxide layer at the metal-environment interface. However, during compaction, the formation of chromium carbides leads to chromium depletion in the adjacent grain boundary regions, adversely affecting corrosion resistance. These results underscore the adverse impact of processing-induced microstructural inhomogeneities on corrosion resistance. For the Y₂O₃-reinforced samples, corrosion resistance decreases as the Y₂O₃ content increases. Although Y₂O₃ particles can act as stabilizers of the passive layer [26], localized corrosion predominantly occurs in regions enriched with these oxide particles. This effect is especially pronounced at interfaces where carbides and Cr-depleted zones coexist [27]. The presence of such features indicates that regions with higher Y₂O₃ concentrations introduce microstructural heterogeneities that facilitate localized corrosion. Interestingly, the sample with 1 wt% Y₂O₃ demonstrates a lower corrosion rate compared to the sample with 3 wt% Y₂O₃. Among all the materials tested, the 3 wt% Y₂O₃ sample exhibits the highest corrosion rate. This elevated rate is likely due to the increased number of oxide phases that serve as active sites for corrosion initiation. These observations suggest that while Y₂O₃ provides mechanical benefits, its content must be carefully optimized to balance mechanical and electrochemical performance.
The EPR-SL method results, illustrated in Figure 10, reveal distinct mechanisms of localized corrosion, aligning with the findings from the potentiodynamic curves. For the 316L sample (Figure 10a), localized corrosion primarily occurs along grain boundaries and around carbides, where chromium depletion leads to increased susceptibility to corrosion attack [28,29]. In contrast, the Y₂O₃-reinforced samples (Figures 10b and 10c) exhibit a different corrosion mechanism. Corrosion in these materials predominantly affects the matrix surrounding carbides and regions with higher oxide content. This mechanism is reflected in the greater degree of desensitization observed for the sample containing 3 wt% Y₂O₃, consistent with the electrochemical results in Table 5. The microstructures of these hardened materials feature regions with both very fine grains and coarse grains. Notably, the very fine grains are concentrated in areas rich in yttrium oxides, which act as sites for localized corrosion. Consequently, these regions are particularly susceptible to grain corrosion and pitting, further contributing to the observed degradation patterns. This underscores the role of microstructural features and oxide dispersion in influencing the corrosion behaviour of these materials.
5. Conclusions
This study demonstrates the potential of Y2O3 dispersion-strengthened (ODS) 316L stainless steel for achieving enhanced mechanical properties, though challenges in corrosion resistance persist. Mechanical alloying effectively produced homogeneous 316L powders reinforced with Y₂O₃, improving particle packing and consolidation. Spark plasma sintering preserved the FCC austenitic structure but also introduced chromium carbides and microstructural heterogeneities with higher Y₂O₃ content, impacting mechanical and corrosion behaviour.
Increasing Y₂O₃ content enhanced hardness and compressive strength while maintaining compressive plasticity, with diminishing returns beyond 3 wt%. Although elevated temperatures caused the reduction of the mechanical performance, the compressive yield strength of composites was significantly higher than for reference 316L. Unfortunately, the corrosion resistance was compromised by localized oxide-rich regions and Cr-depleted zones, particularly at higher Y₂O₃ concentrations.
While Y2O3 reinforcement offers promising mechanical benefits for high-strength applications, further optimization of processing and oxide dispersion is essential to balance mechanical performance and corrosion resistance. Future research should address localized corrosion and explore strategies to enhance material durability.
Author Contributions
Conceptualization, J.K, A.D., J. Č., M.G.; methodology, J.K.; validation, X.X., Y.Y. and Z.Z.; formal analysis, J.P., J.K., D.N, Č.D., V.H., J.F., I.P.; investigation, J.P., D.N., J.F, I.P.; resources, J.K, A.D. M.G.; data curation, J.K., M.G.; writing—original draft preparation, J.P, J.K; writing—review and editing, J.K., J.P., I.P, A.D., J. Č.; visualization, J.P., Č.D.; supervision, J.K., M.G.; project administration, J.K.; funding acquisition, J.K, M.G., A.D. All authors have read and agreed to the published version of the manuscript.
Funding
This research was funded by the Czech Science Foundation (project No. 22-04227L), Grant agency of the UCT Prague (project No. A2_FCHT_2024_013), Slovenian Research and Innovation Agency (project No. N2-0276 and core funding No. P2-0132), National Science Centre in Poland (project No. 2021/43/I/ST8/01018) and Ferroic Multifunctionalities project, supported by the Ministry of Education, Youth, and Sports of the Czech Republic. Project No. CZ.02.01.01/00/22_008/0004591, co-funded by the European Union.
Data Availability Statement
The data presented in this study will be openly available in ZENODO with DOI 10.5281/zenodo.14622099.
Conflicts of Interest
The authors declare no conflicts of interest.
References
- Gelles, D.S. Development of martensitic steels for high neutron damage applications. Journal of Nuclear Materials 1996, 239, 99-106. [CrossRef]
- Kim, D.W. Influence of nitrogen-induced grain refinement on mechanical properties of nitrogen alloyed type 316LN stainless steel. Journal of Nuclear Materials 2012, 420, 473-478. [CrossRef]
- Mathew, M.D.; Laha, K.; Ganesan, V. Improving creep strength of 316L stainless steel by alloying with nitrogen. Materials Science and Engineering: A 2012, 535, 76-83.
- Xu, Y.; Zhou, Z. Processing and structure of a Nitrogen Alloyed Oxide Dispersion Strengthened Austenitic Stainless Steel by mechanical alloying. Journal of Physics: Conference Series 2013, 419, 012052.
- Murty, K.L.; Charit, I. Structural materials for Gen-IV nuclear reactors: Challenges and opportunities. Journal of Nuclear Materials 2008, 383, 189-195. [CrossRef]
- Akasaka, N.; Yamashita, S.; Yoshitake, T.; Ukai, S.; Kimura, A. Microstructural changes of neutron irradiated ODS ferritic and martensitic steels. Journal of Nuclear Materials 2004, 329-333, 1053-1056.
- Zhao, Q.; Yu, L.; Liu, Y.; Huang, Y.; Guo, Q.; Li, H.; Wu, J. Evolution of Al-containing phases in ODS steel by hot pressing and annealing. Powder Technology 2017, 311, 449-455. [CrossRef]
- de Castro, V.; Marquis, E.A.; Lozano-Perez, S.; Pareja, R.; Jenkins, M.L. Stability of nanoscale secondary phases in an oxide dispersion strengthened Fe–12Cr alloy. Acta Materialia 2011, 59, 3927-3936. [CrossRef]
- Xu, W.; Li, L.; Valdez, J.A.; Saber, M.; Zhu, Y.; Koch, C.C.; Scattergood, R.O. Effect of nano-oxide particle size on radiation resistance of iron–chromium alloys. Journal of Nuclear Materials 2016, 469, 72-81. [CrossRef]
- Jayasankar, K.; Pandey, A.; Mishra, B.K.; Das, S. Mixed fuel synthesis of Y2O3 nanopowder and their applications as dispersoid in ODS steel. Advanced Powder Technology 2015, 26, 1306-1313. [CrossRef]
- Balázsi, C.; Gillemot, F.; Horváth, M.; Wéber, F.; Balázsi, K.; Sahin, F.C.; Onüralp, Y.; Horváth, Á. Preparation and structural investigation of nanostructured oxide dispersed strengthened steels. Journal of Materials Science 2011, 46, 4598-4605. [CrossRef]
- Gräning, T.; Rieth, M.; Hoffmann, J.; Seils, S.; Edmondson, P.D.; Möslang, A. Microstructural investigation of an extruded austenitic oxide dispersion strengthened steel containing a carbon-containing process control agent. Journal of Nuclear Materials 2019, 516, 335-346. [CrossRef]
- Hilger, I.; Boulnat, X.; Hoffmann, J.; Testani, C.; Bergner, F.; De Carlan, Y.; Ferraro, F.; Ulbricht, A. Fabrication and characterization of oxide dispersion strengthened (ODS) 14Cr steels consolidated by means of hot isostatic pressing, hot extrusion and spark plasma sintering. Journal of Nuclear Materials 2016, 472, 206-214. [CrossRef]
- Williams, C.A.; Marquis, E.A.; Cerezo, A.; Smith, G.D.W. Nanoscale characterisation of ODS–Eurofer 97 steel: An atom-probe tomography study. Journal of Nuclear Materials 2010, 400, 37-45. [CrossRef]
- Yan, X.; Zhang, X.; Wang, F.; Stockdale, T.; Dzenis, Y.; Nastasi, M.; Cui, B. Fabrication of ODS Austenitic Steels and CoCrFeNi High-Entropy Alloys by Spark Plasma Sintering for Nuclear Energy Applications. JOM 2019, 71, 2856-2867. [CrossRef]
- John, R.; Karati, A.; Joseph, J.; Fabijanic, D.; Murty, B.S. Microstructure and mechanical properties of a high entropy alloy with a eutectic composition (AlCoCrFeNi2.1) synthesized by mechanical alloying and spark plasma sintering. Journal of Alloys and Compounds 2020, 835, 155424.
- Sovizi, S.; Seraji, M. The Densification Behavior of Metals and Alloys During Spark Plasma Sintering: A Mini-Review. Science of Sintering 2019, 51,. [CrossRef]
- Lemonnier, S.; Moitrier, F.; Rossit, J.; Bourré, T.; Roseiro, P.; Guetter, G.; Boehmler, J. Multimodal particle size distribution by mixing nanopowders for full densification of spark plasma sintered SiC ceramics. Open Ceramics 2021, 7, 100164. [CrossRef]
- Wang, M.; Zhou, Z.; Sun, H.; Hu, H.; Li, S. Microstructural observation and tensile properties of ODS-304 austenitic steel. Mater. Sci. Eng. A. 2013, 559, 287-292. [CrossRef]
- Jang, K.-N.; Kim, T.-K.; Kim, K.-T. The effect of cooling rates on carbide precipitate and microstructure of 9CR-1MO oxide dispersion strengthened(ODS) steel. Nuclear Engineering and Technology 2019, 51, 249-256. [CrossRef]
- Ninawe, P.S.; Ganesh, S.; Sai Karthik, P.; Chandrasekhar, S.B.; Vijay, R. Microstructure and mechanical properties of spark plasma sintered austenitic ODS steel. Adv. Powder Technol. 2022, 33, 103584. [CrossRef]
- Mao, X.; Oh, K.H.; Jang, J. Evolution of ultrafine grained microstructure and nano-sized semi-coherent oxide particles in austenitic oxide dispersion strengthened steel. Materials Characterization 2016, 117, 91-98. [CrossRef]
- Wu, Y.Q.; Allahar, K.N.; Burns, J.; Jaques, B.; Charit, I.; Butt, D.P.; Cole, J.I. Fe-Cr-Mo based ODS alloys via spark plasma sintering: A combinational characterization study by TEM and APT. In Crystal Research and Technology, 2014; Vol. 49, pp 645-652. [CrossRef]
- Koul, S.; Shivam, V.; Chattopadhyay, K.; Manna, R.; Biswas, K.; Mukhopadhyay, N.K. Development of Oxide Dispersed Austenitic Stainless Steel through Mechanical Alloying and Spark Plasma Sintering. Journal of Materials Engineering and Performance 2022, 31, 9522-9533. [CrossRef]
- Pardo, A.; Merino, M.C.; Coy, A.E.; Viejo, F.; Arrabal, R.; Matykina, E. Pitting corrosion behaviour of austenitic stainless steels – combining effects of Mn and Mo additions. Corrosion Science 2008, 50, 1796-1806. [CrossRef]
- Molin, S.; Persson, Å.H.; Skafte, T.L.; Smitshuysen, A.L.; Jensen, S.H.; Andersen, K.B.; Xu, H.; Chen, M.; Hendriksen, P.V. Effective yttrium based coating for steel interconnects of solid oxide cells: Corrosion evaluation in steam-hydrogen atmosphere. Journal of Power Sources 2019, 440, 226814. [CrossRef]
- Rashid, M.W.A.; Gakim, M.; Rosli, Z.M.; Azam, M.A. Formation of Cr23C6 during the Sensitization of AISI 304 Stainless Steel and its Effect to Pitting Corrosion. International Journal of Electrochemical Science 2012, 7, 9465-9477. [CrossRef]
- Aydoğdu, G.H.; Aydinol, M.K. Determination of susceptibility to intergranular corrosion and electrochemical reactivation behaviour of AISI 316L type stainless steel. Corrosion Science 2006, 48, 3565-3583. [CrossRef]
- Matula, M.; Hyspecka, L.; Svoboda, M.; Vodarek, V.; Dagbert, C.; Galland, J.; Stonawska, Z.; Tuma, L. Intergranular corrosion of AISI 316L steel. Materials Characterization 2001, 46, 203-210. [CrossRef]
Figure 1.
(a) XRD patterns of MA powders; (b) Particle size distribution of MA powders.
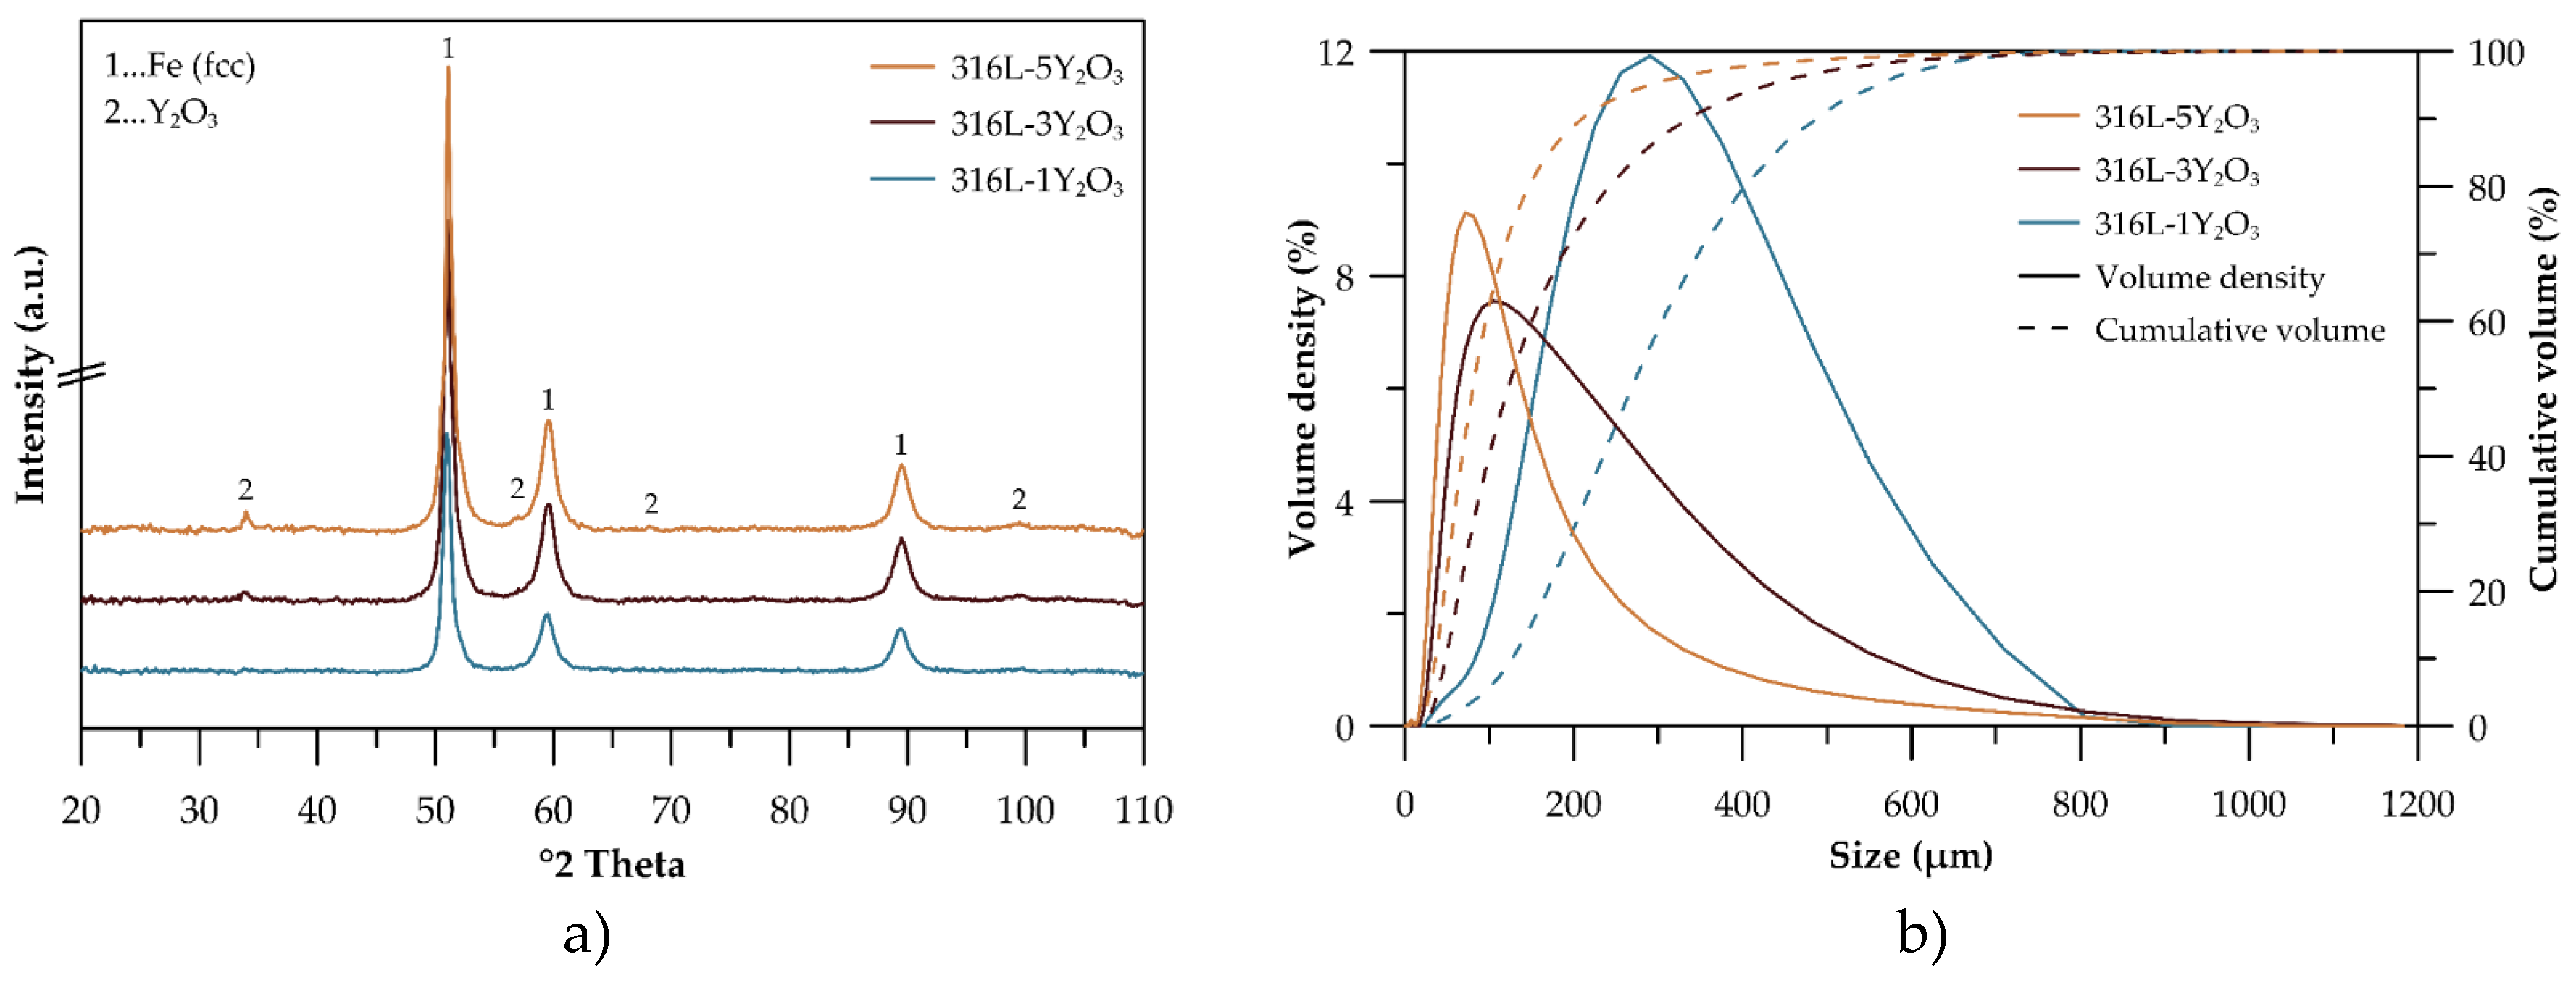
Figure 2.
SEM micrographs of mechanically alloyed powders: (a) 316L-1Y2O3; (b) 316L-3 Y2O3; (c) 316L-5 Y2O3.
Figure 2.
SEM micrographs of mechanically alloyed powders: (a) 316L-1Y2O3; (b) 316L-3 Y2O3; (c) 316L-5 Y2O3.
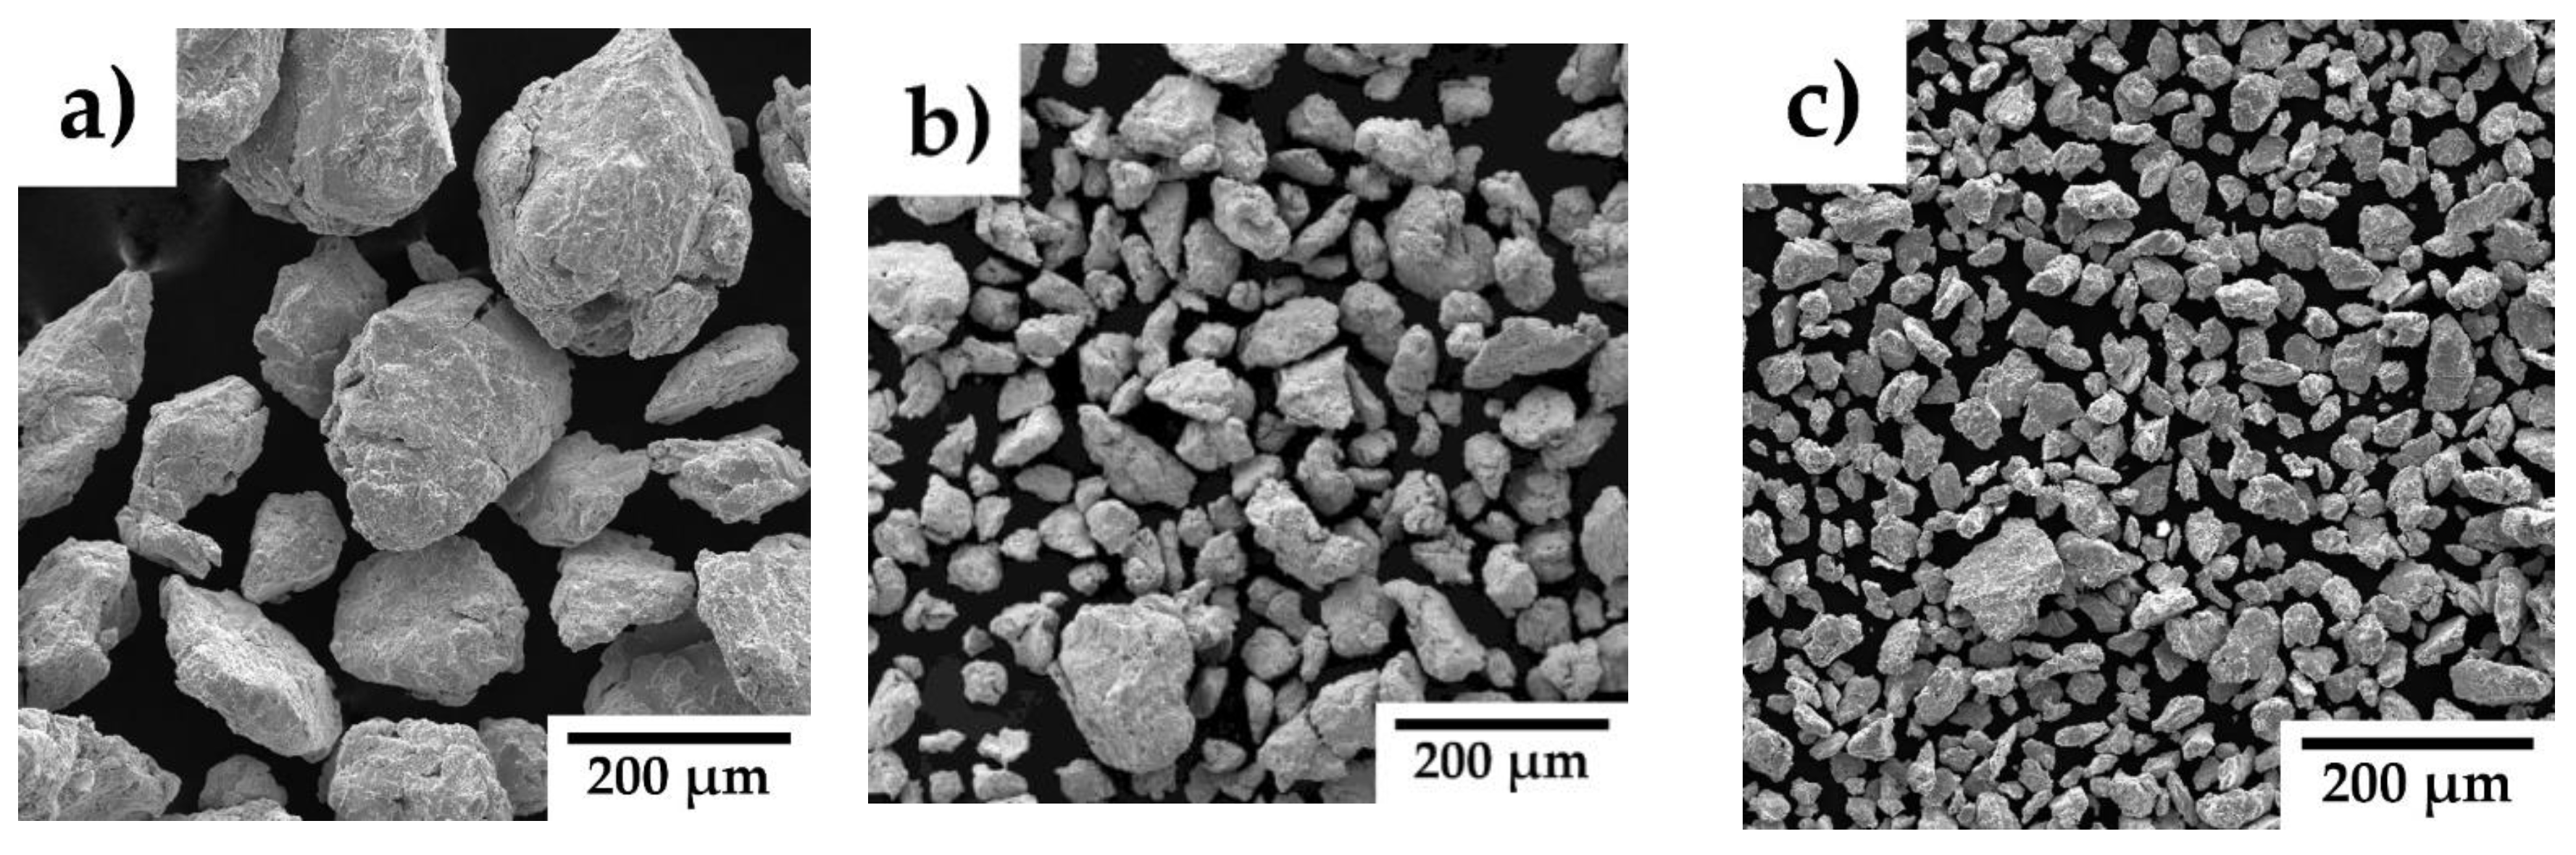
Figure 3.
XRD patterns of consolidated samples.
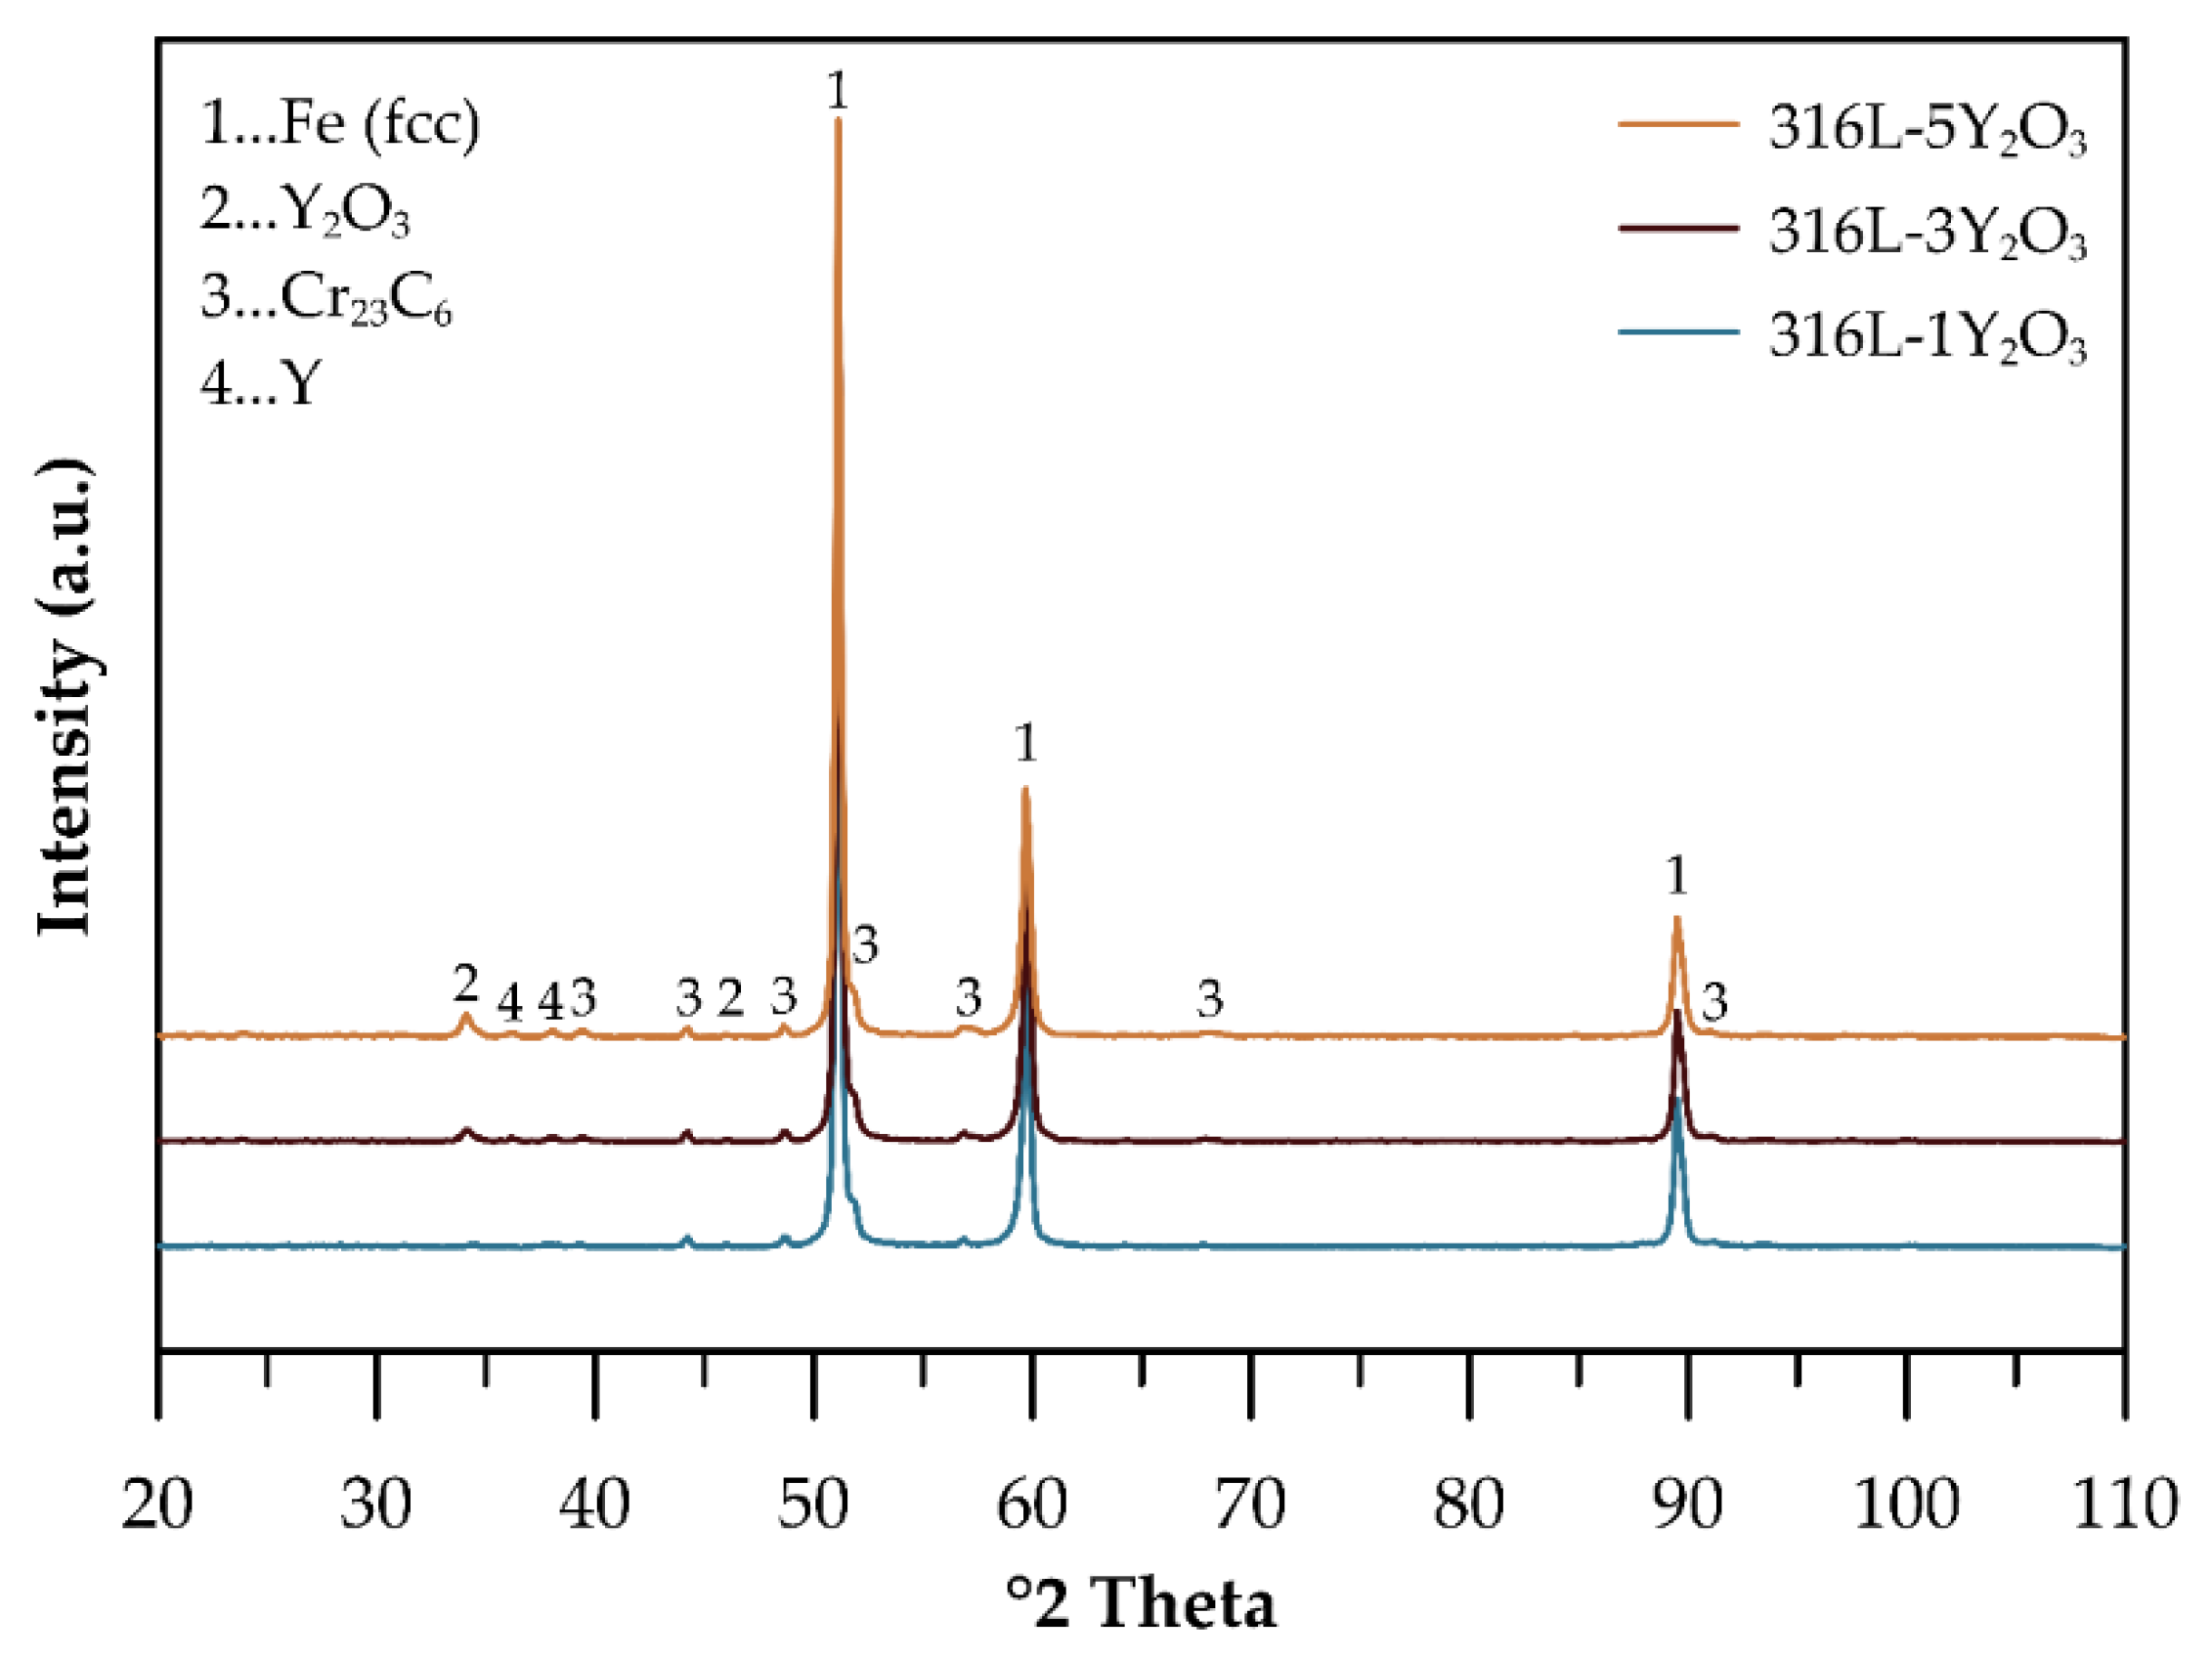
Figure 4.
(a-c) General microstructure of consolidated materials; (d-f) Close-up images of consolidated materials; with yttria content (a; d) 1 wt %; (b; e) 3 wt %; (c; f) 5 wt %.
Figure 4.
(a-c) General microstructure of consolidated materials; (d-f) Close-up images of consolidated materials; with yttria content (a; d) 1 wt %; (b; e) 3 wt %; (c; f) 5 wt %.
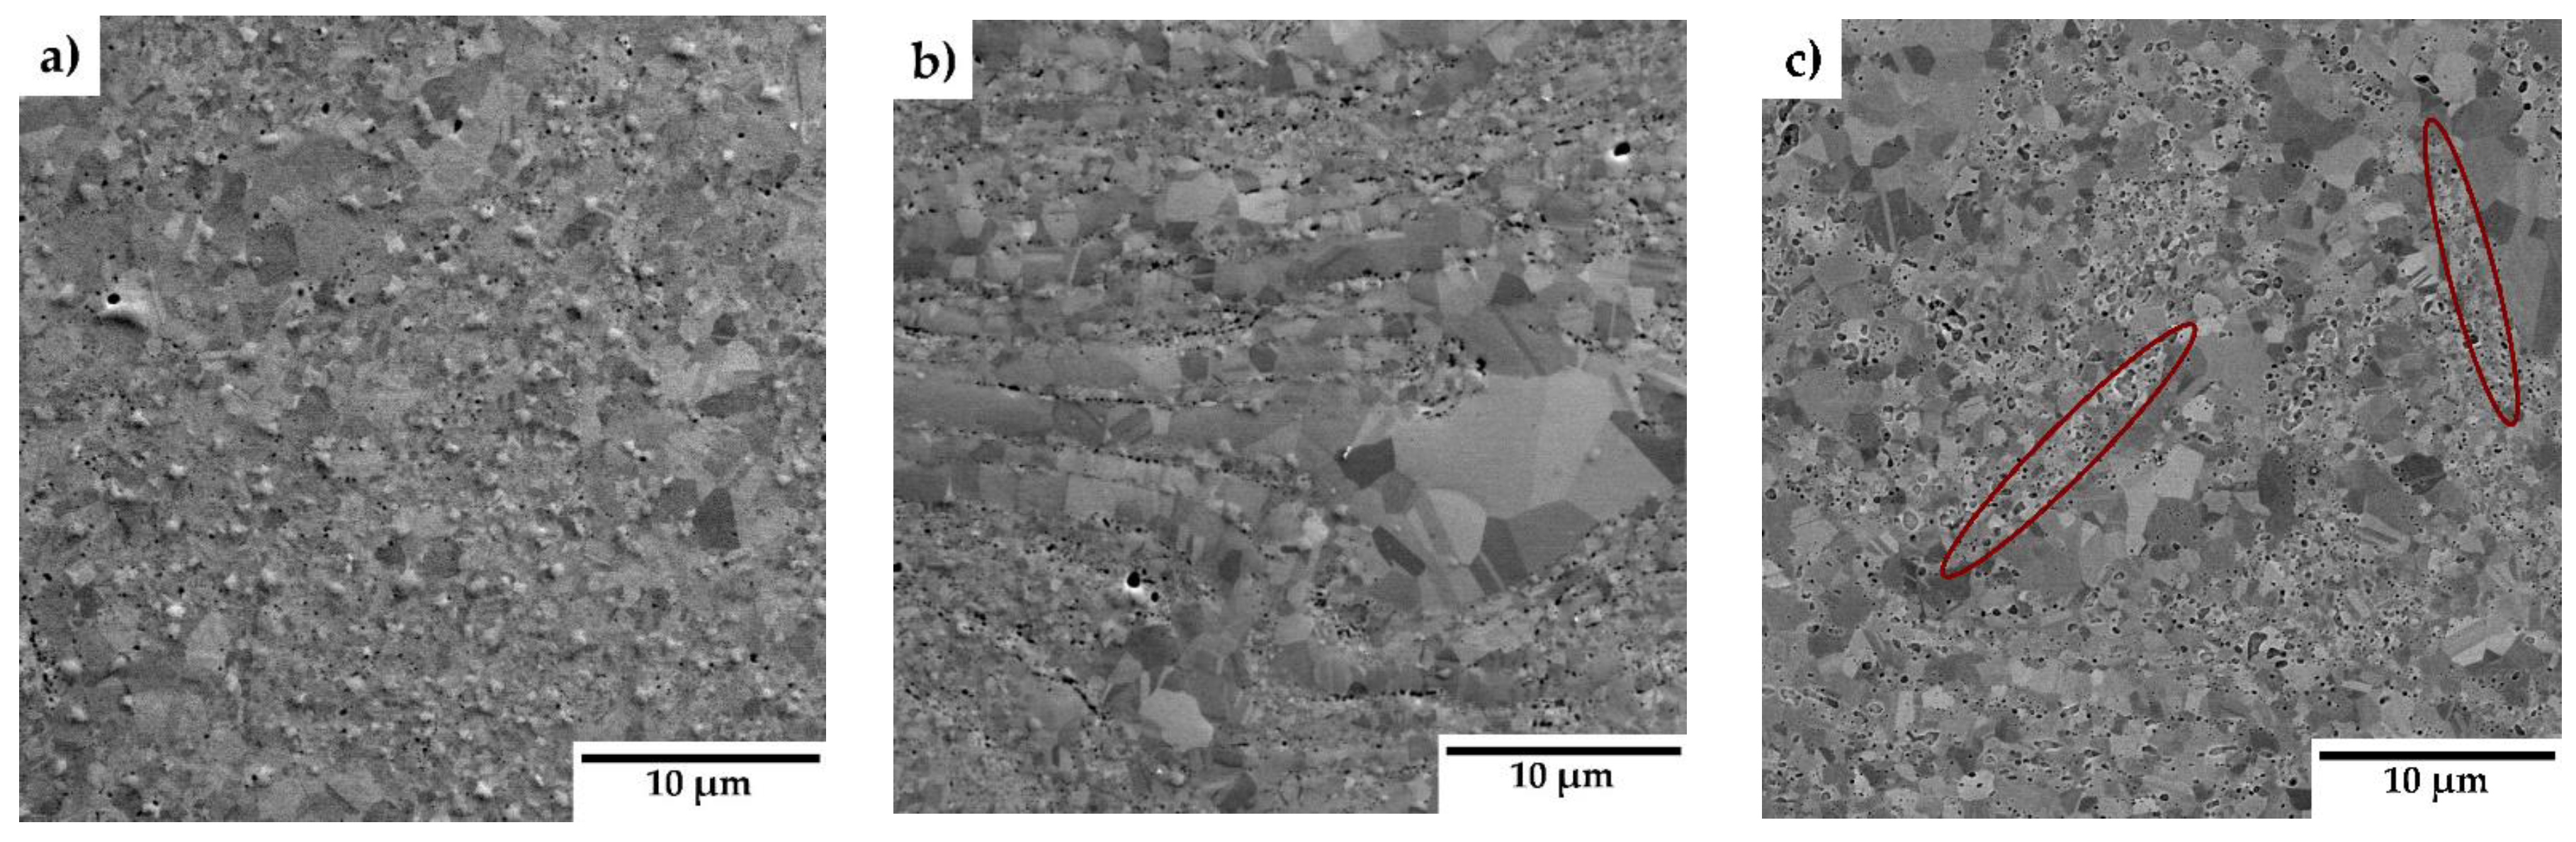
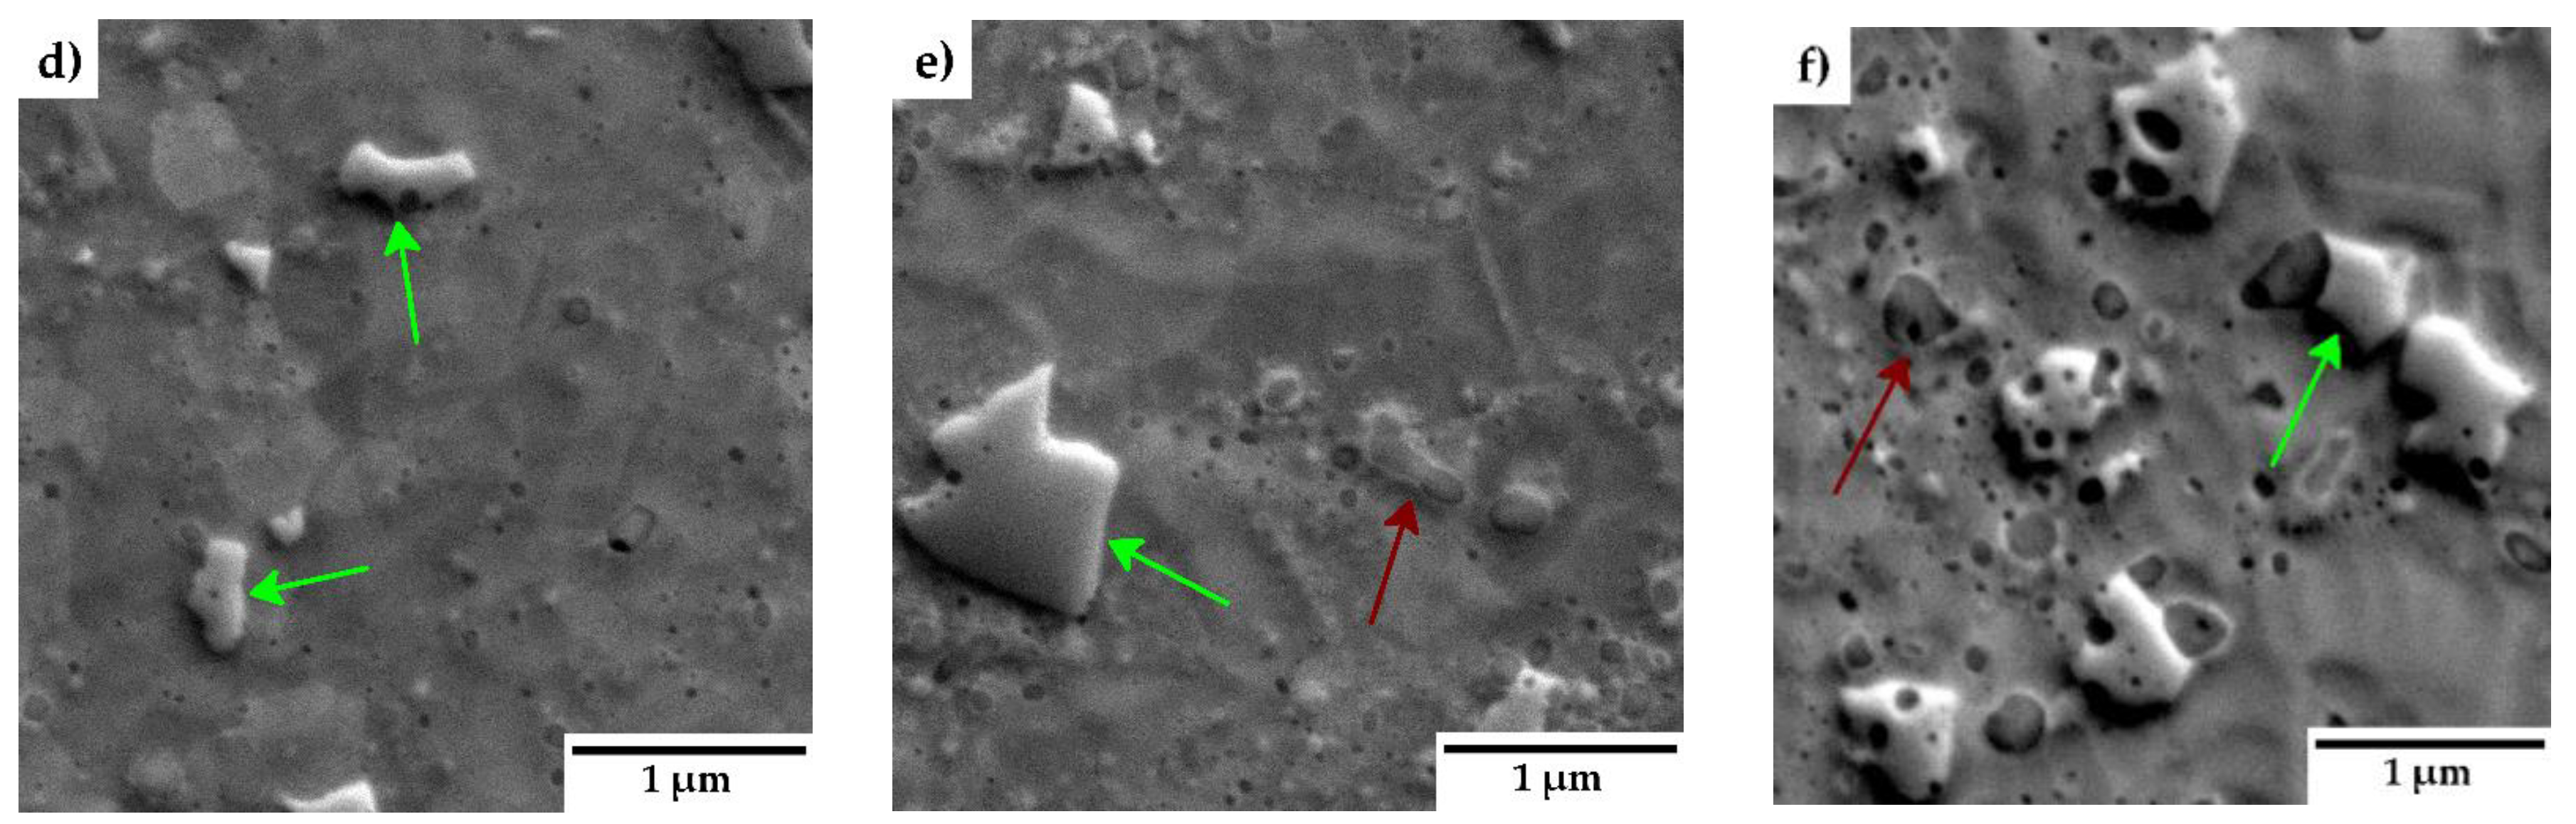
Figure 5.
(a-c) EBSD IPF maps of consolidated materials; (d-f) Phase distribution maps of consolidated materials - carbides are in green, austenite in red; with Y2O3 content (a; d) 1 wt %; (b; e) 3 wt %; (c; f) 5 wt %. IPF maps corresponds to the Z axis which is parallel to the vertical axis of the SPSed sample. Both austenite and carbide phase have similar fcc structure, therefore they are not distinguished in the IPF map.
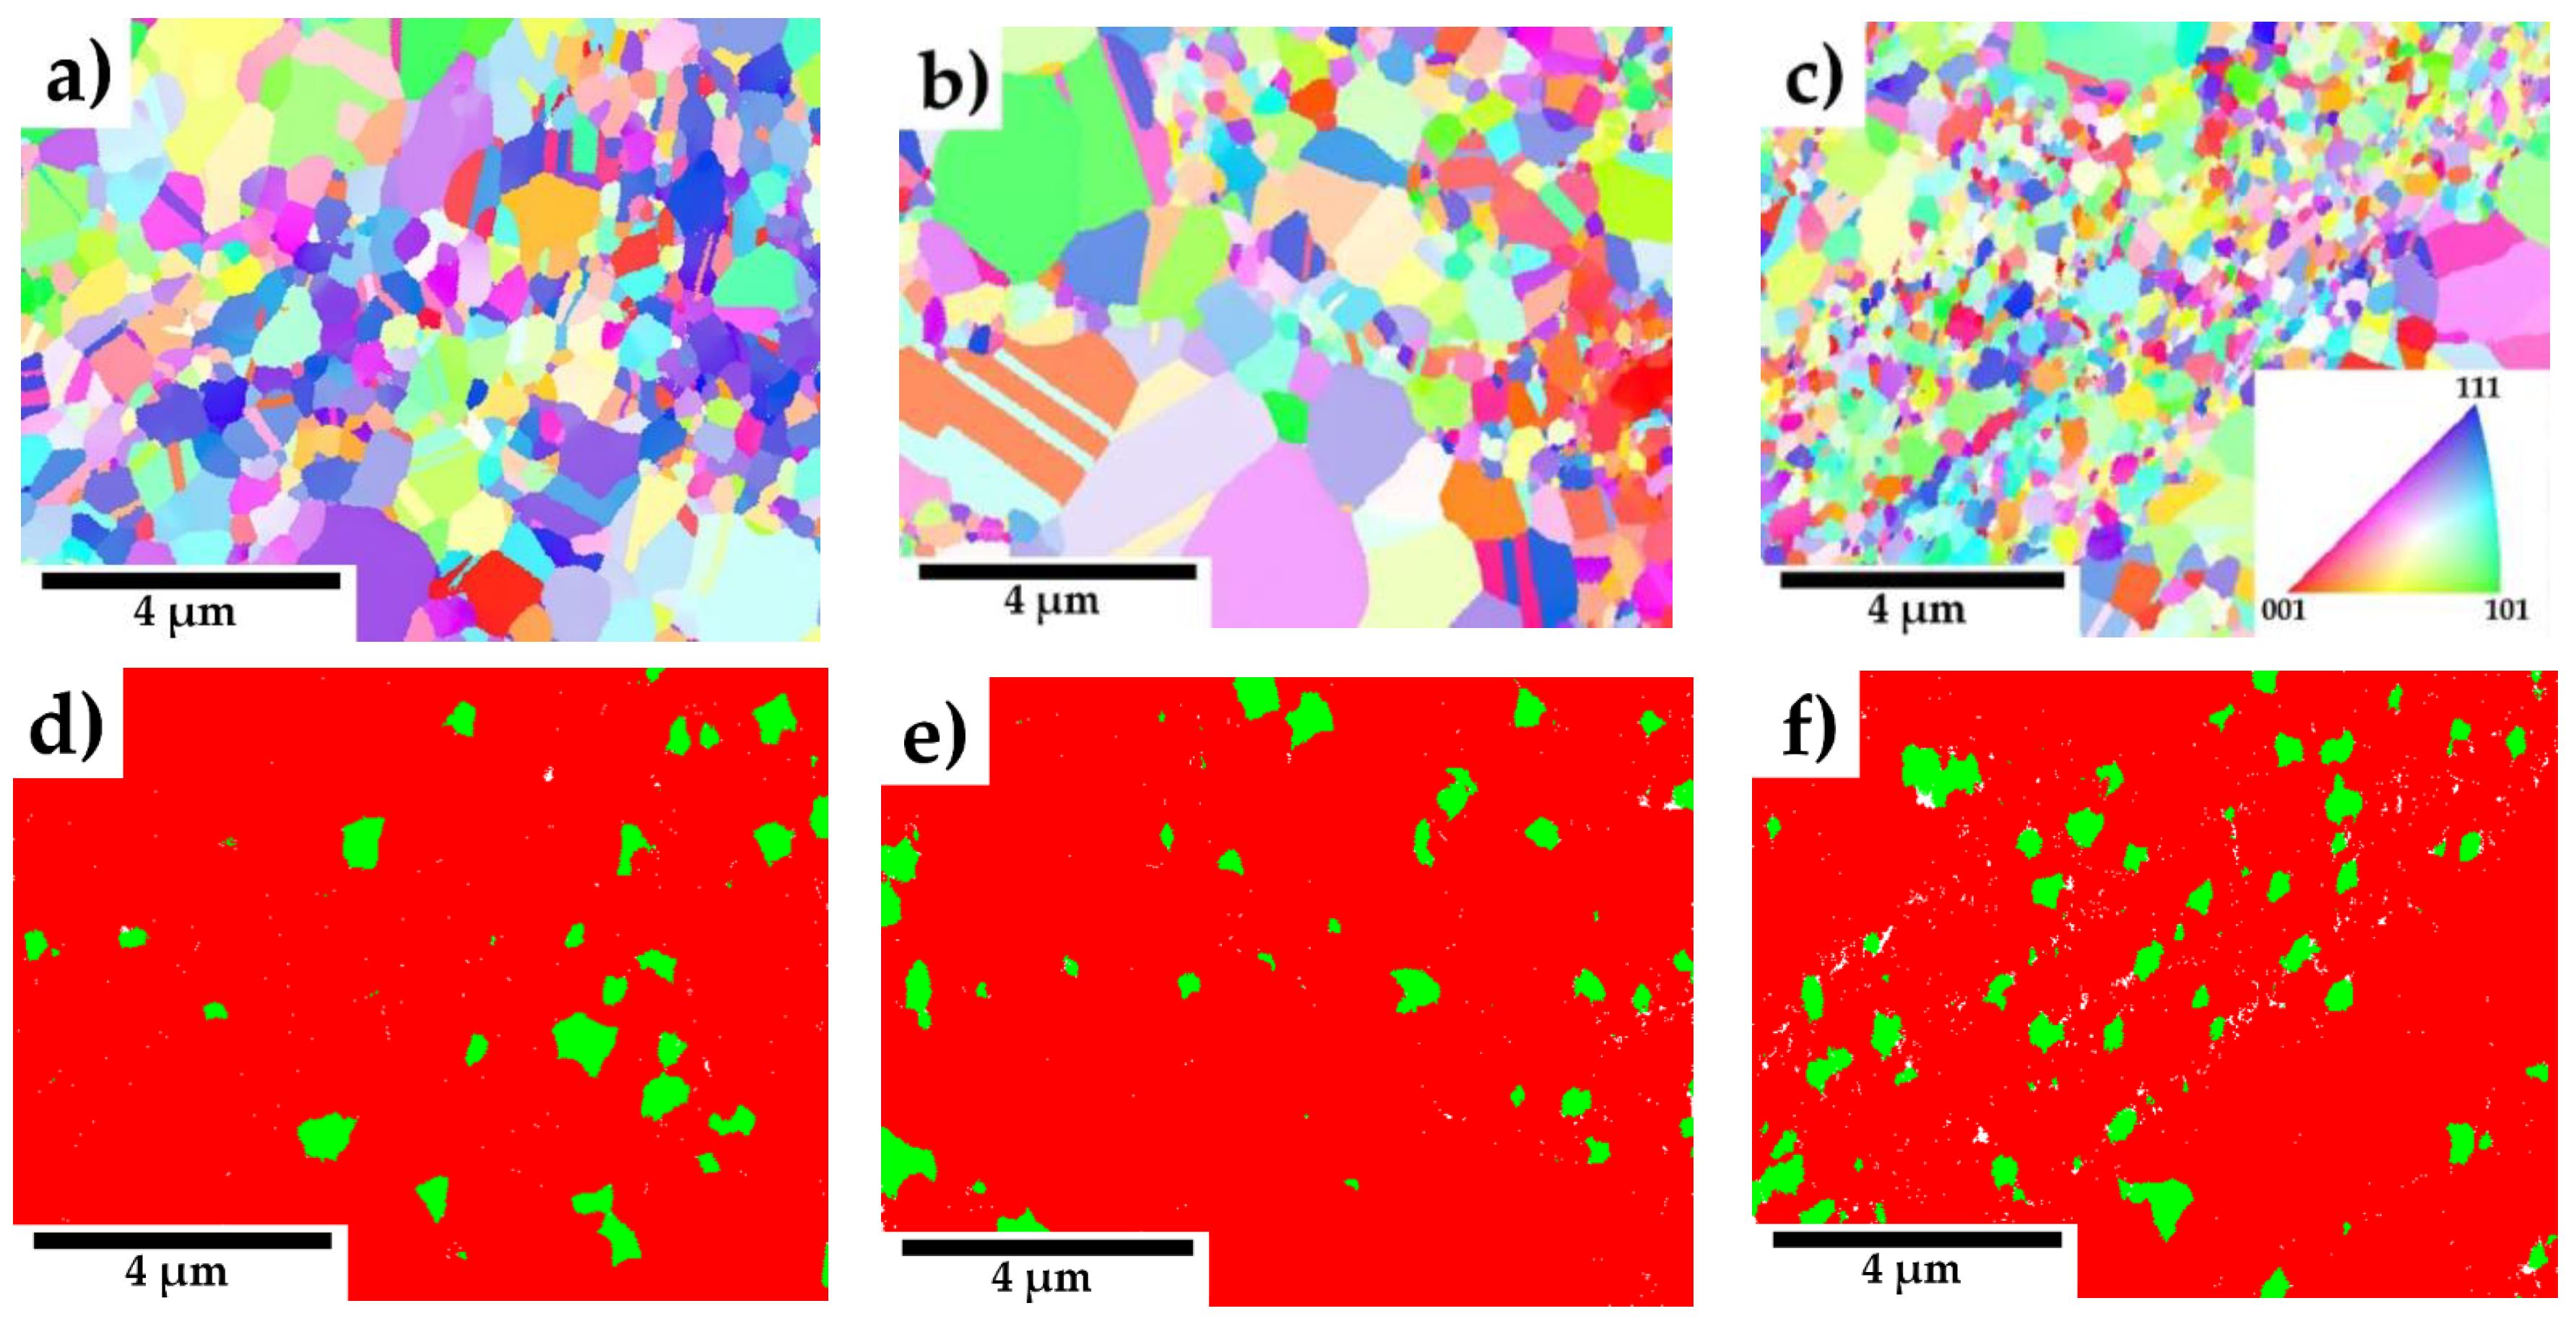
Figure 6.
Hardness chart of consolidated materials.
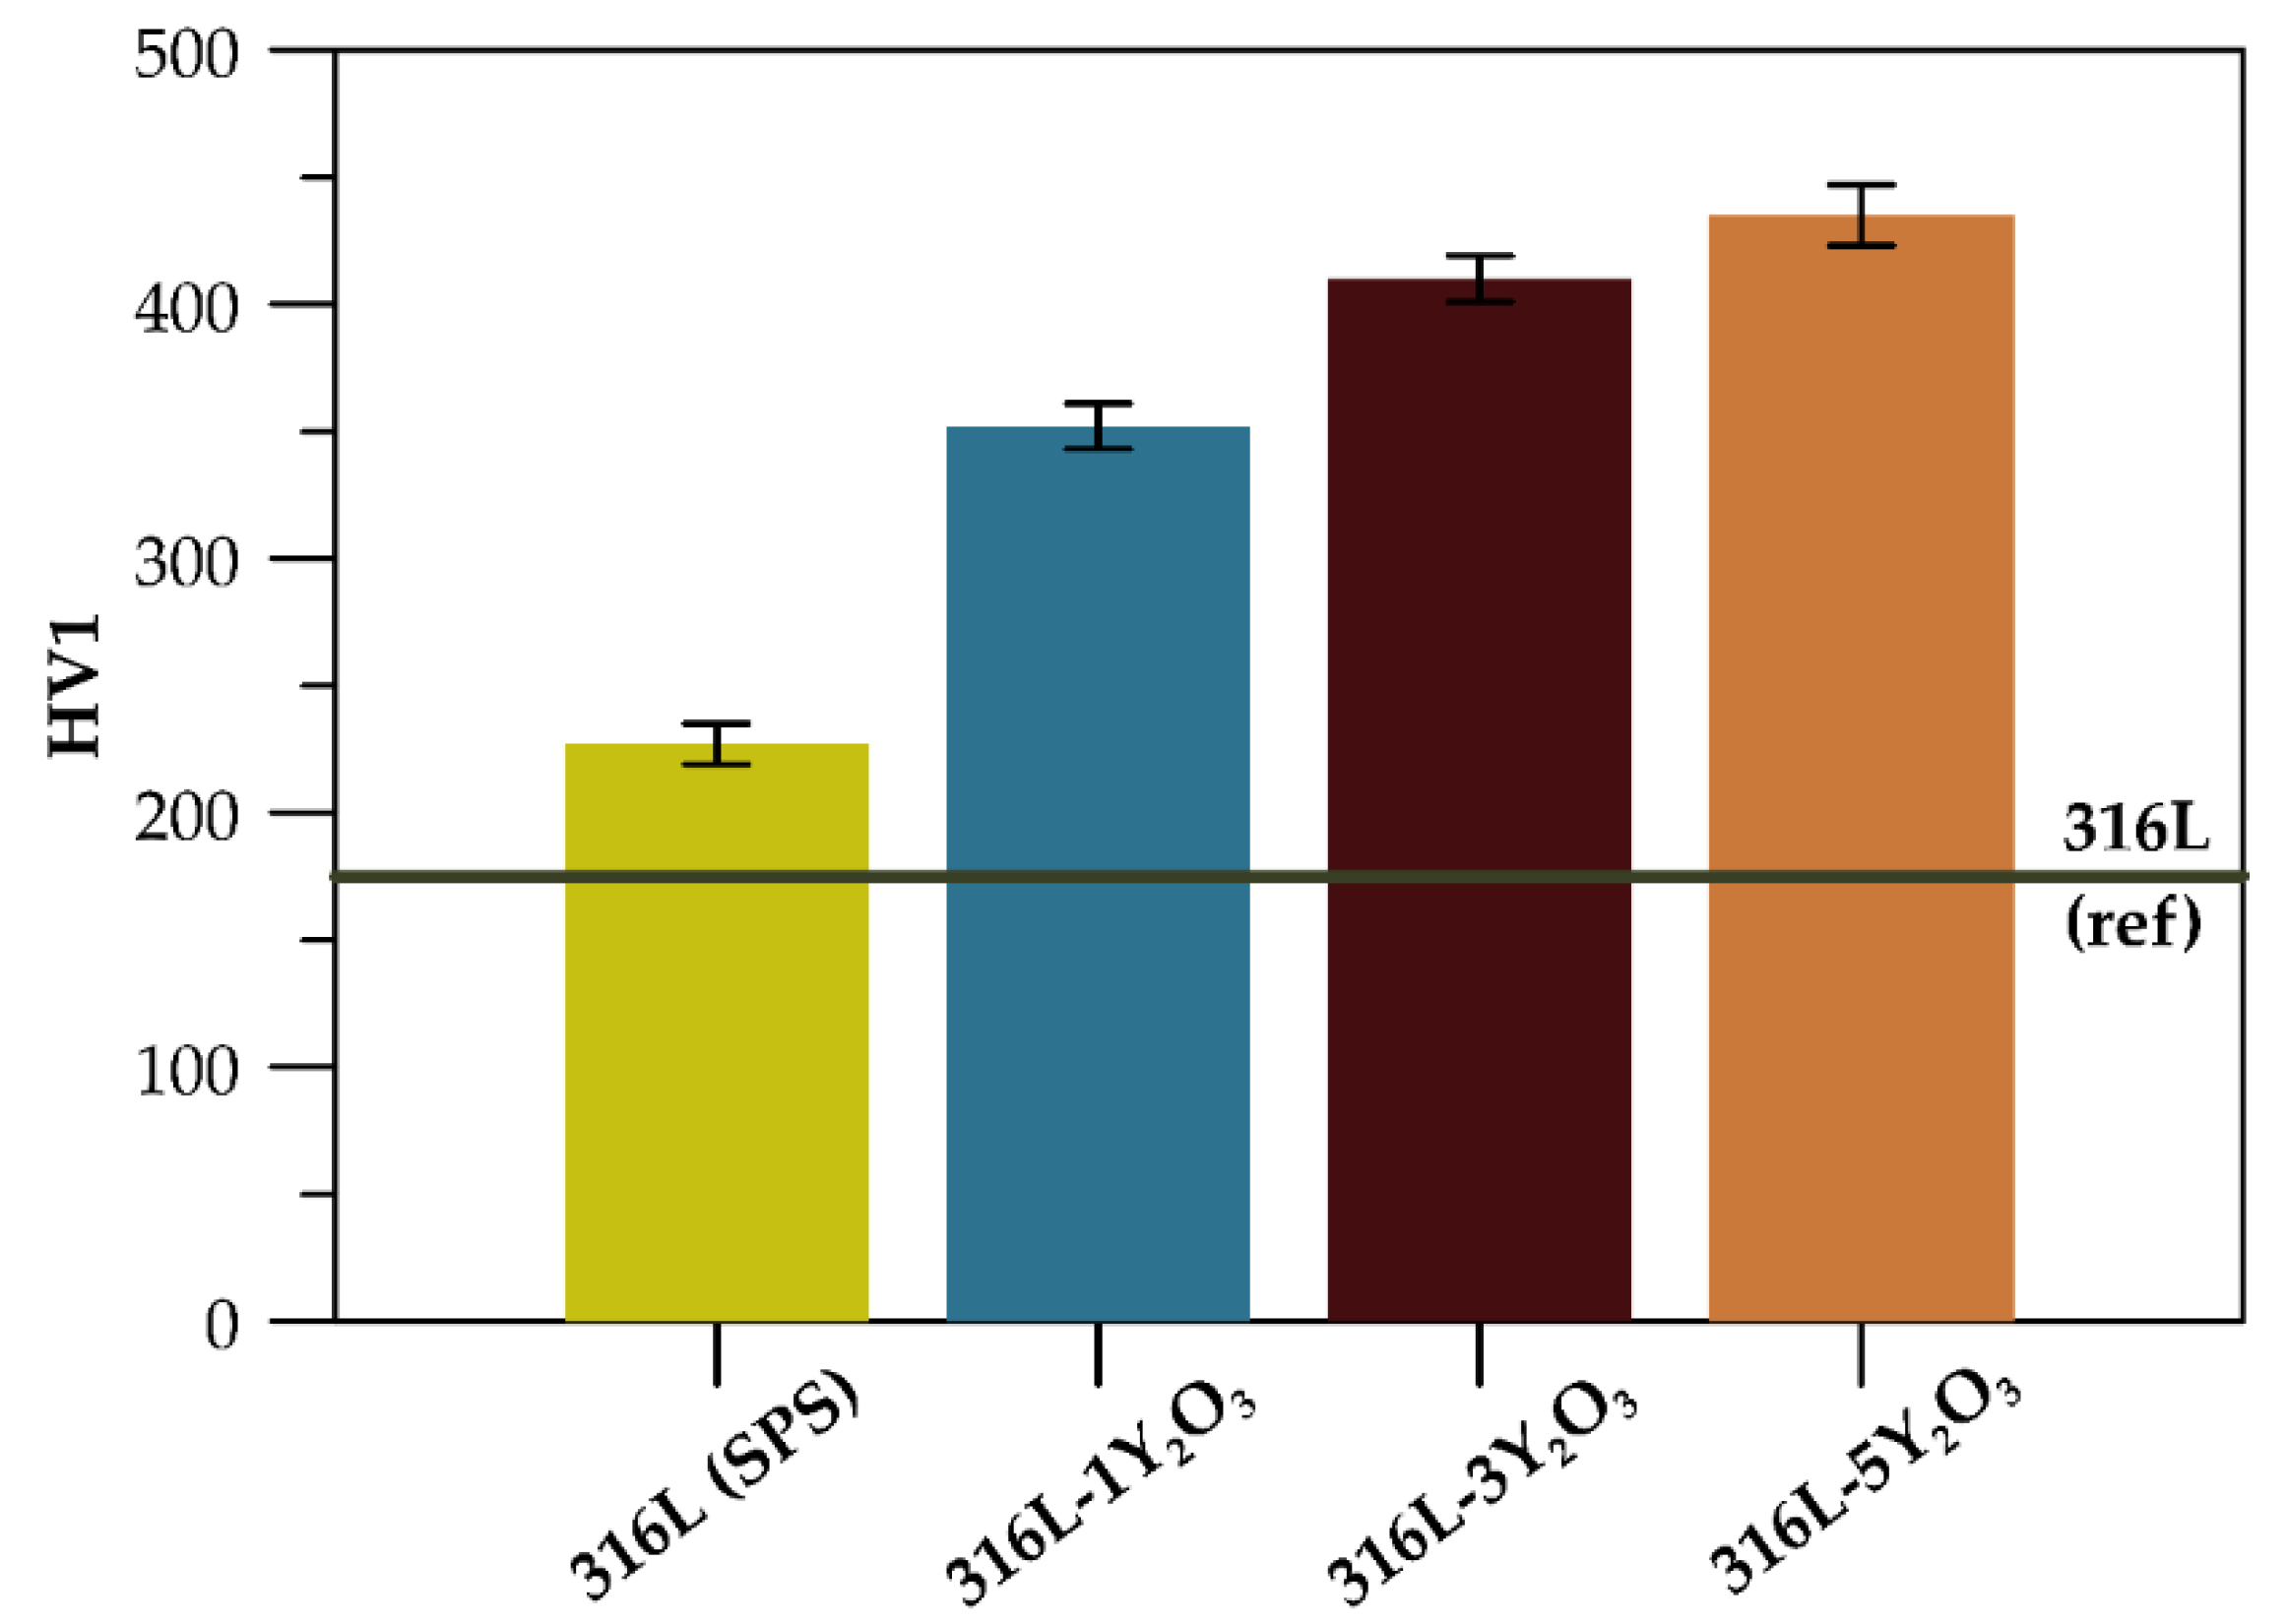
Figure 7.
(a) Stress-strain curves of austenitic ODS steel at 25 °C for varying Y₂O₃ content; (b) Stress-strain curves of austenitic ODS steel at 600 °C for varying Y₂O₃ content.
Figure 7.
(a) Stress-strain curves of austenitic ODS steel at 25 °C for varying Y₂O₃ content; (b) Stress-strain curves of austenitic ODS steel at 600 °C for varying Y₂O₃ content.
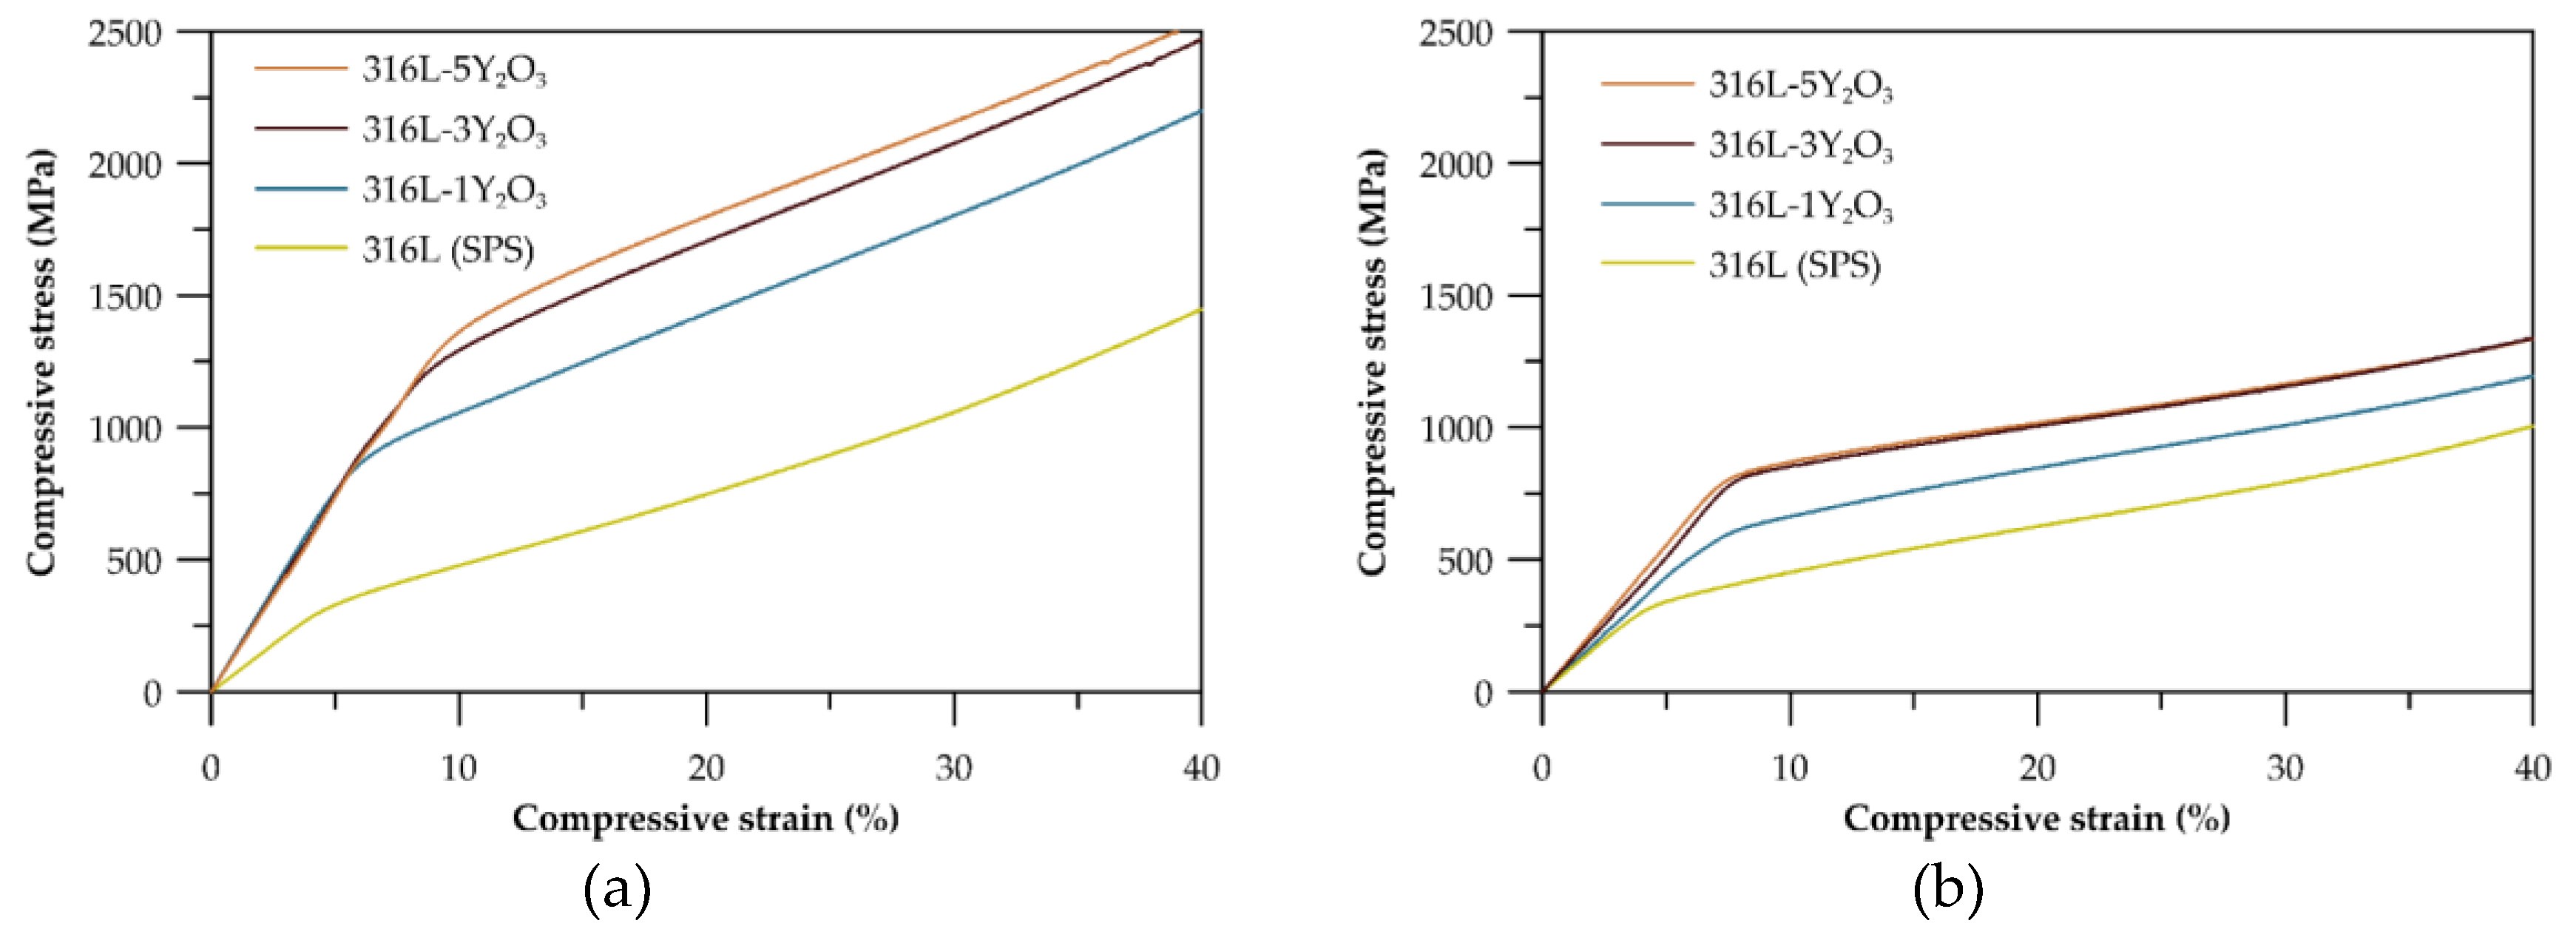
Figure 8.
Potentiodynamic curves.
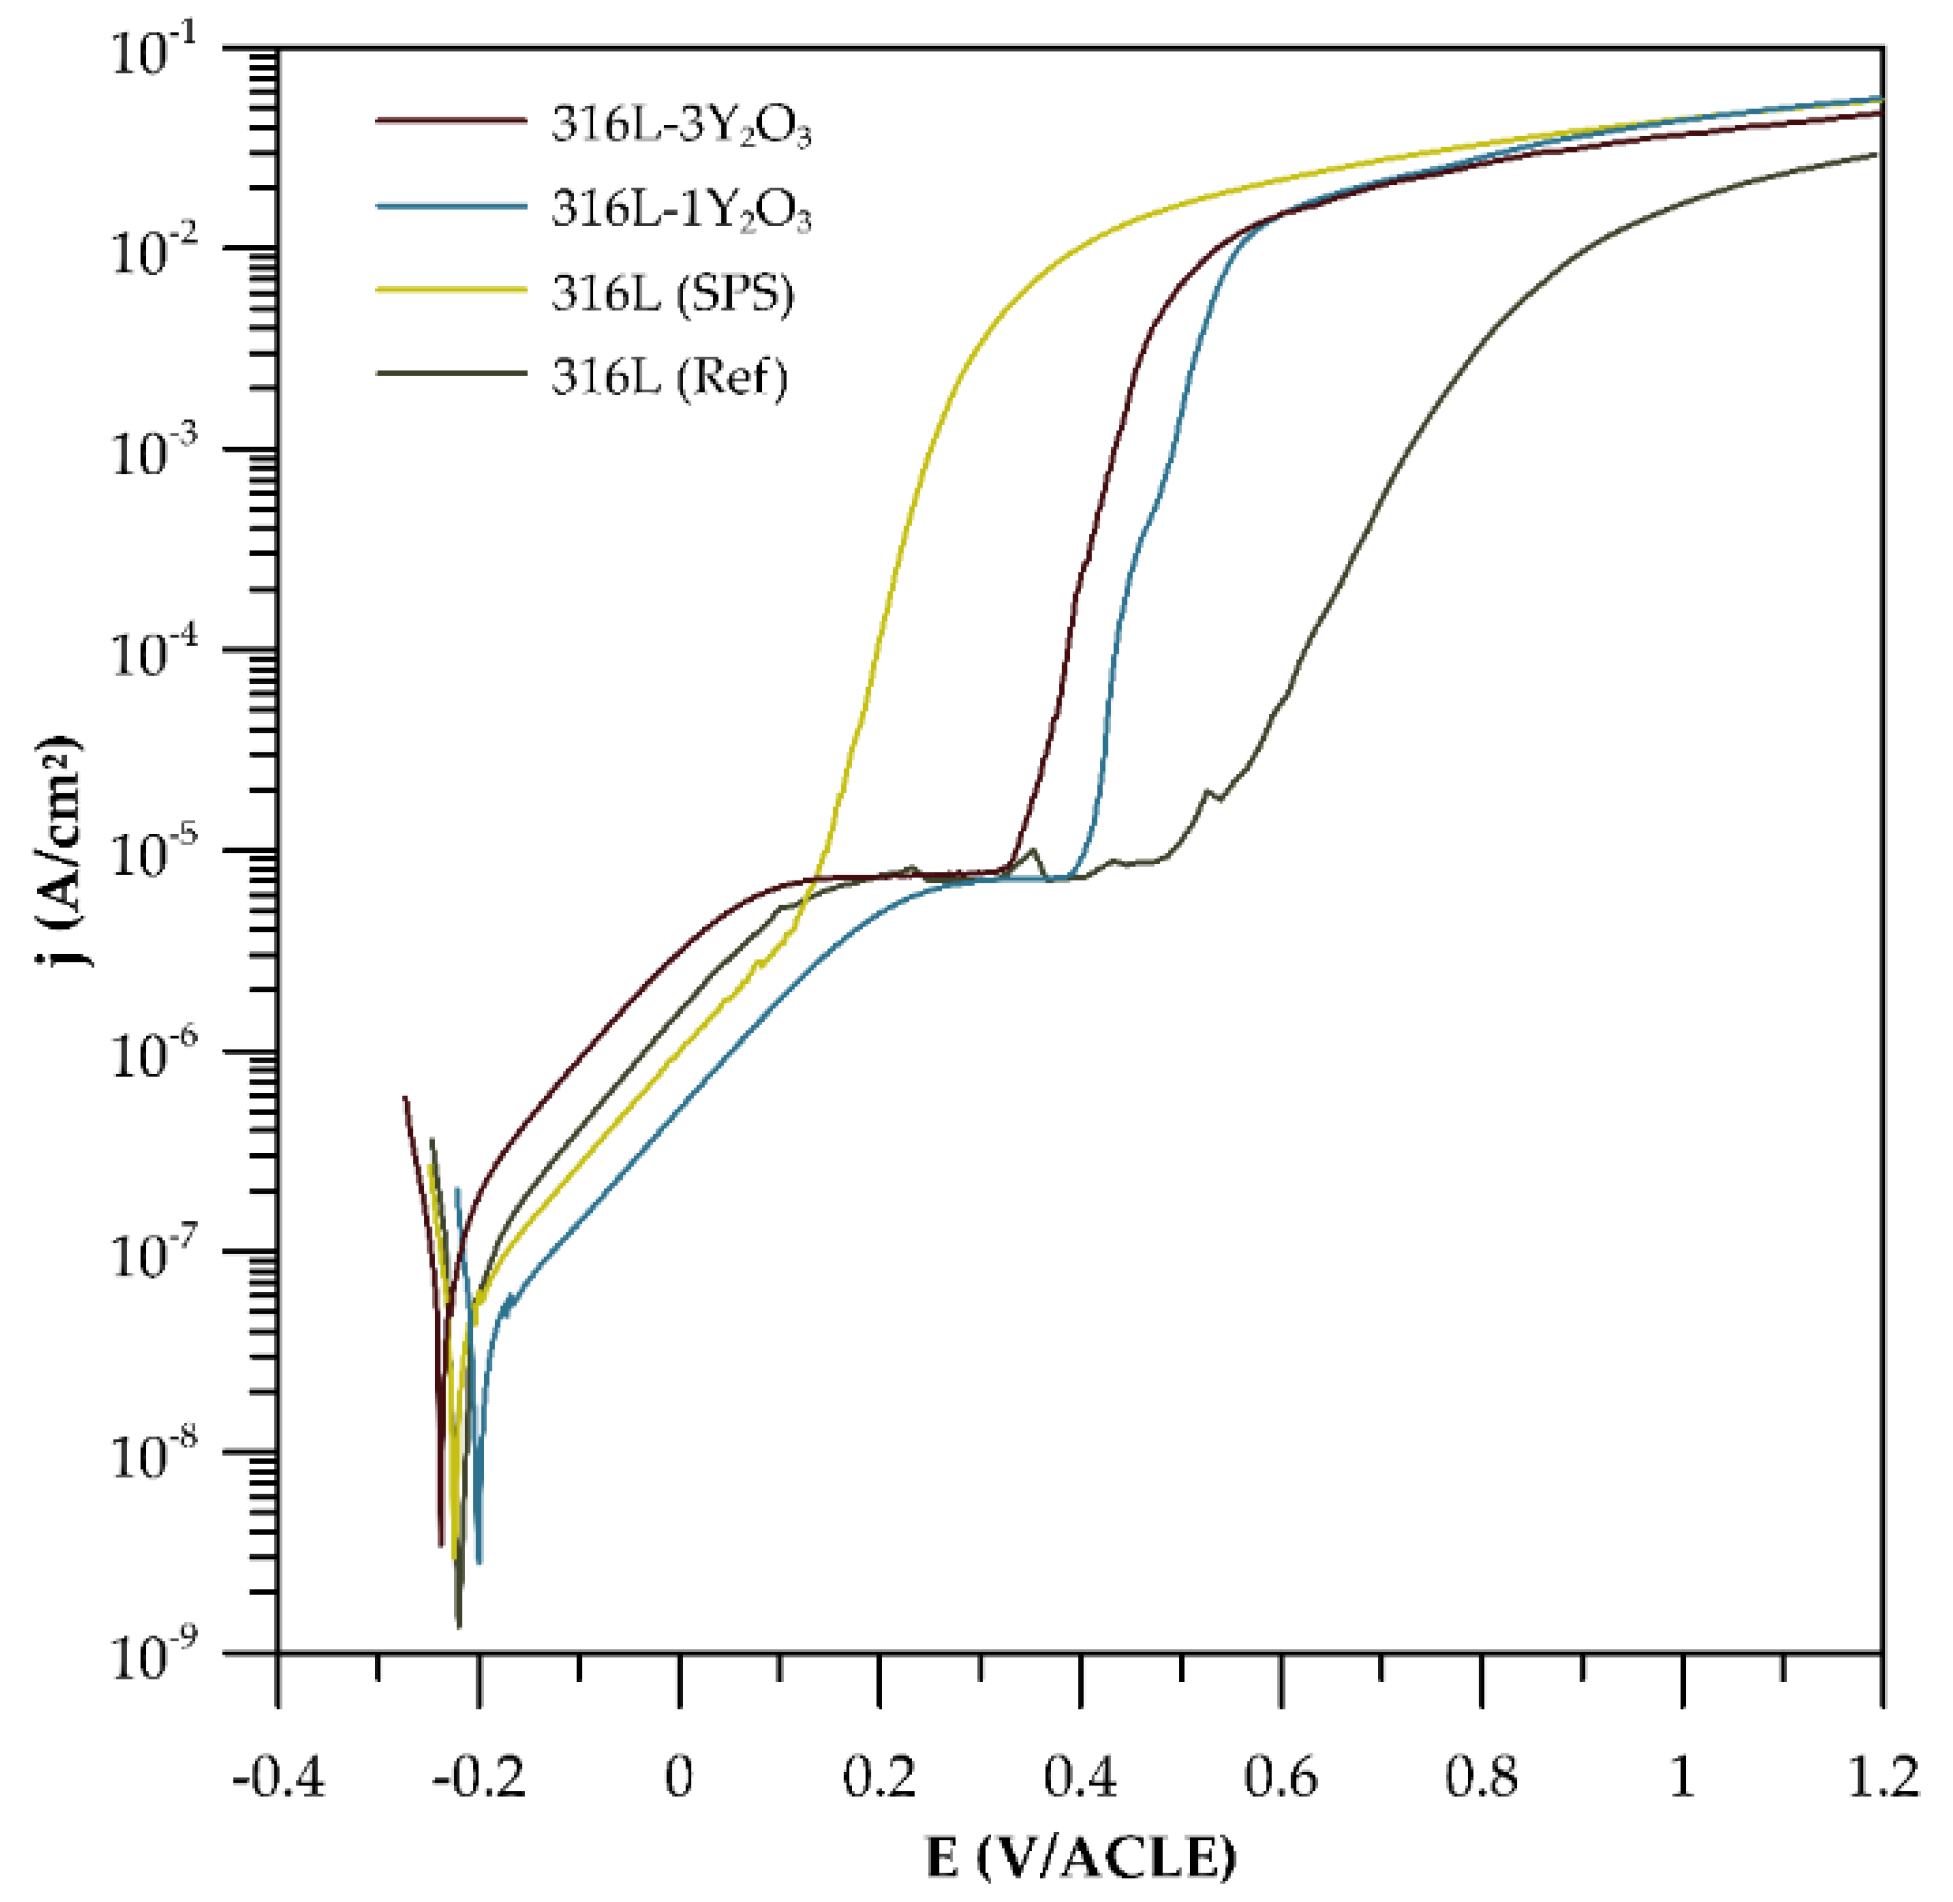
Figure 9.
EPR-SL curves of consolidated materials.
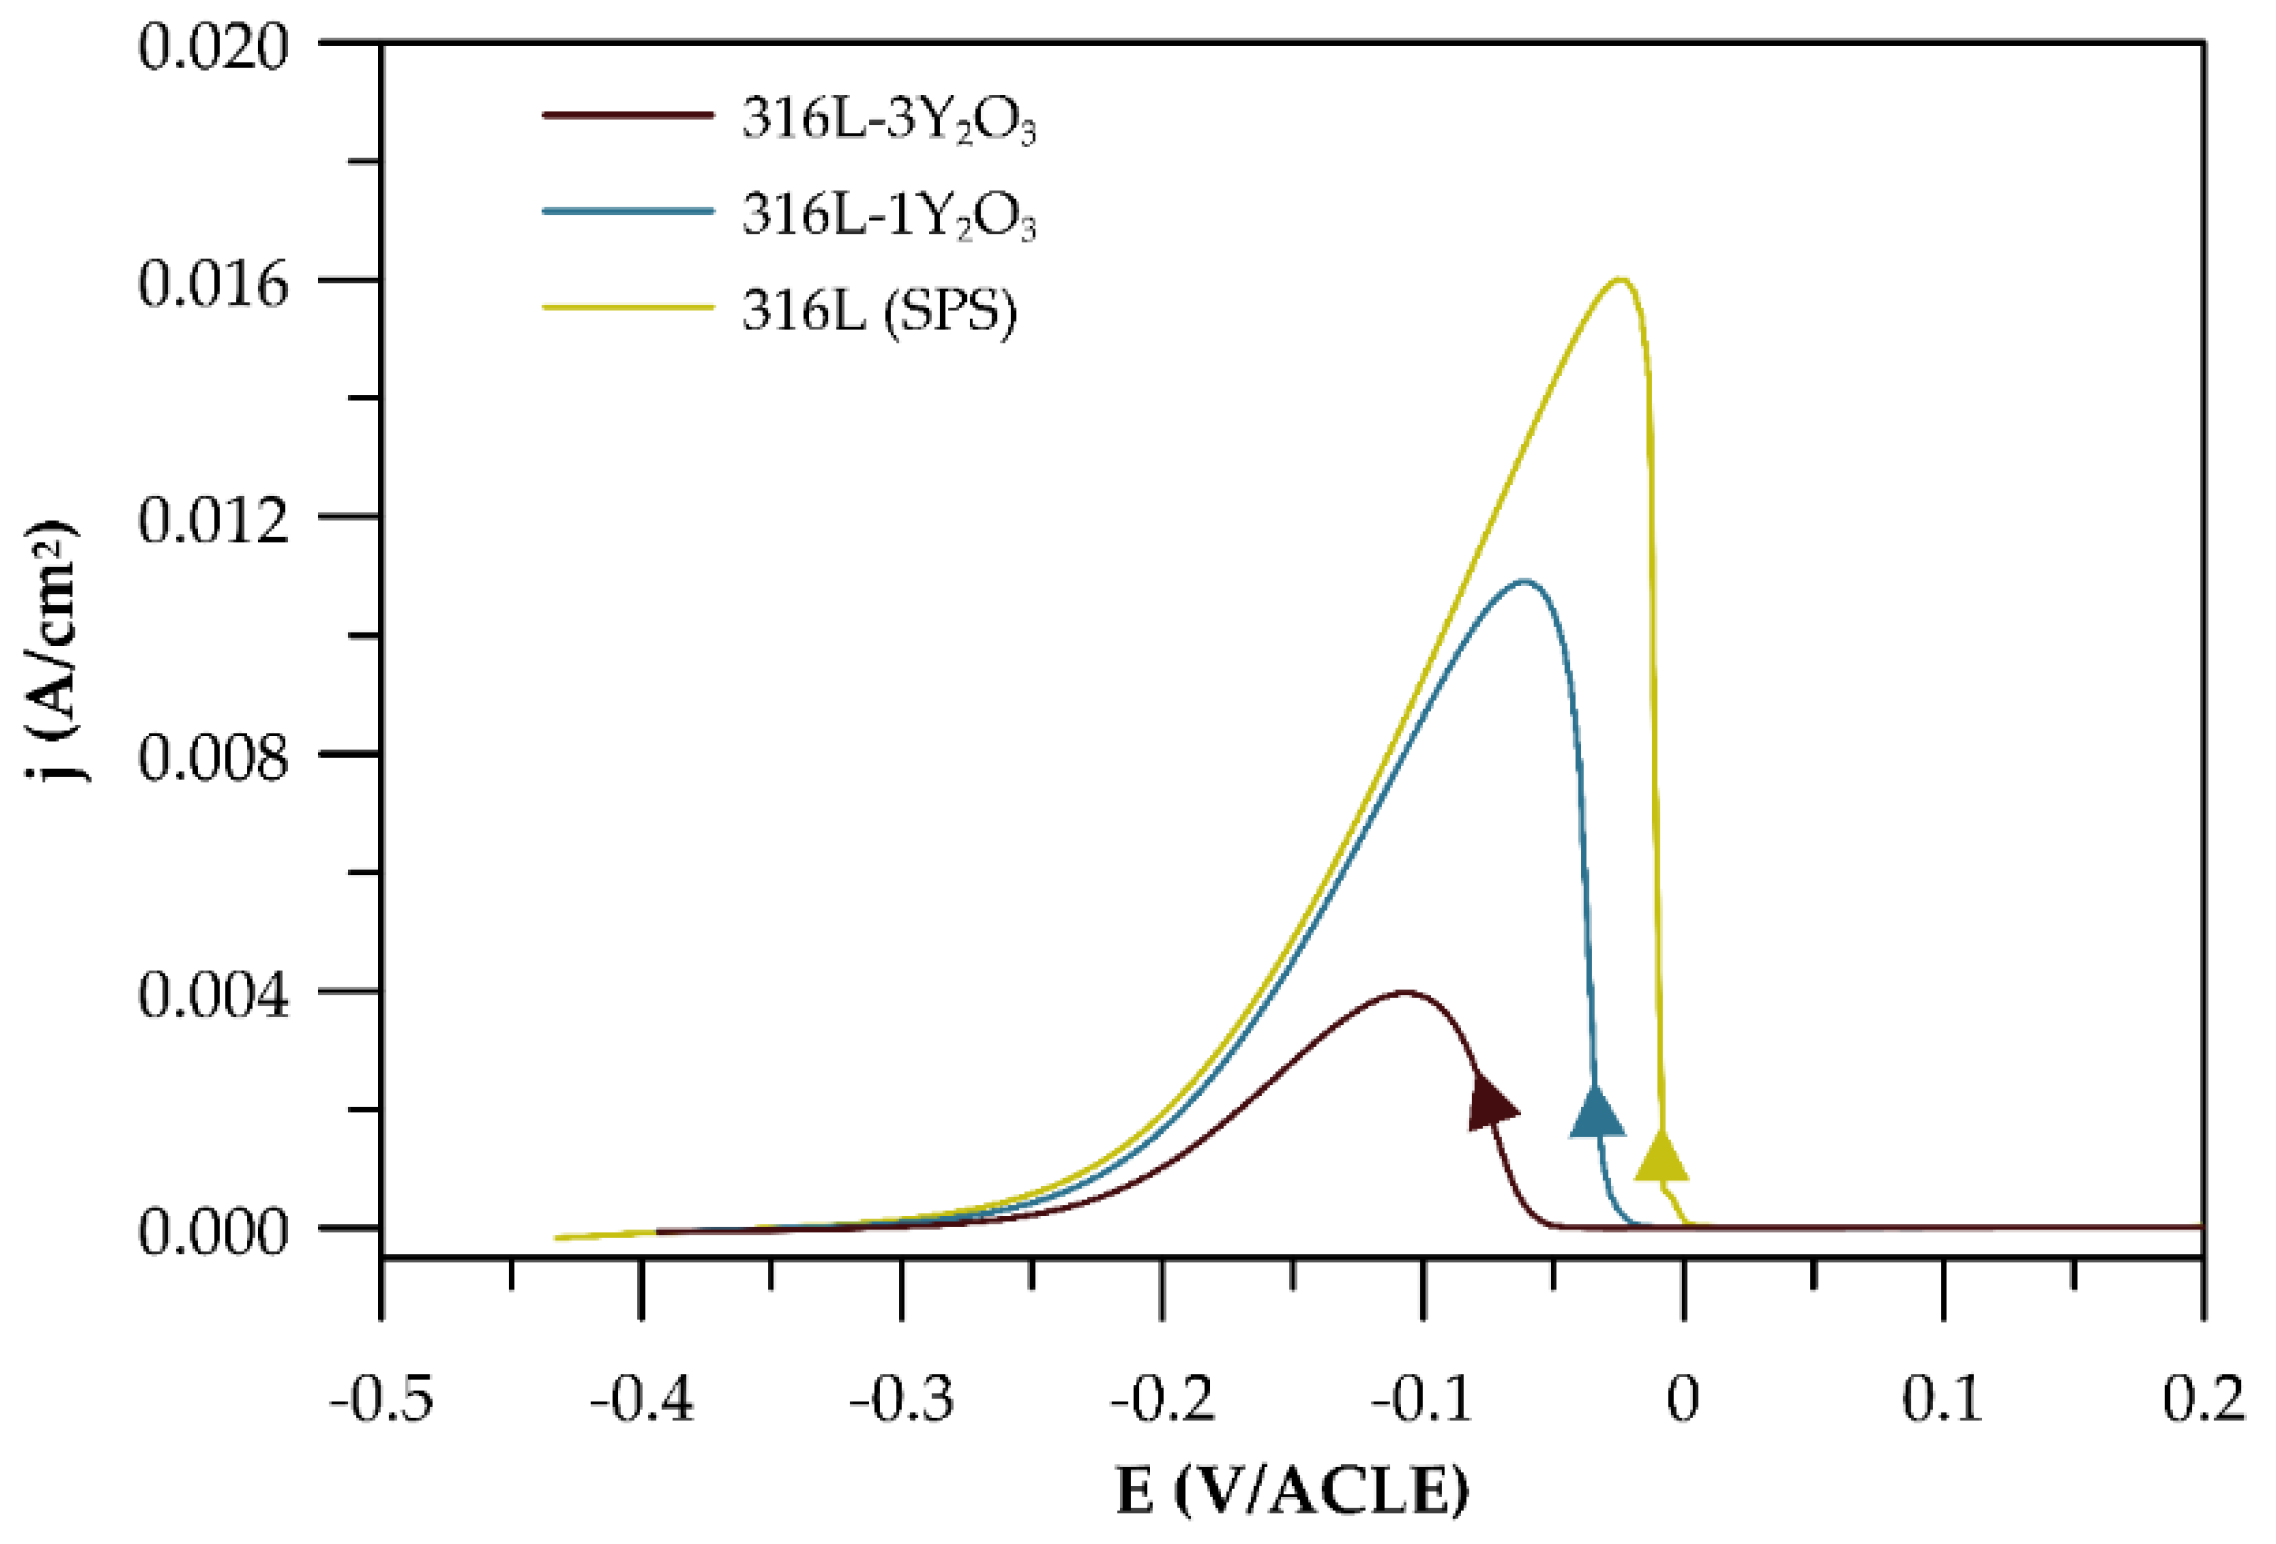
Figure 10.
SEM Surface micrographs of the materials after exposure: (a) 316L(SPS); (b) 316L-1Y2O3; (c) 316L-3Y2O3.
Figure 10.
SEM Surface micrographs of the materials after exposure: (a) 316L(SPS); (b) 316L-1Y2O3; (c) 316L-3Y2O3.
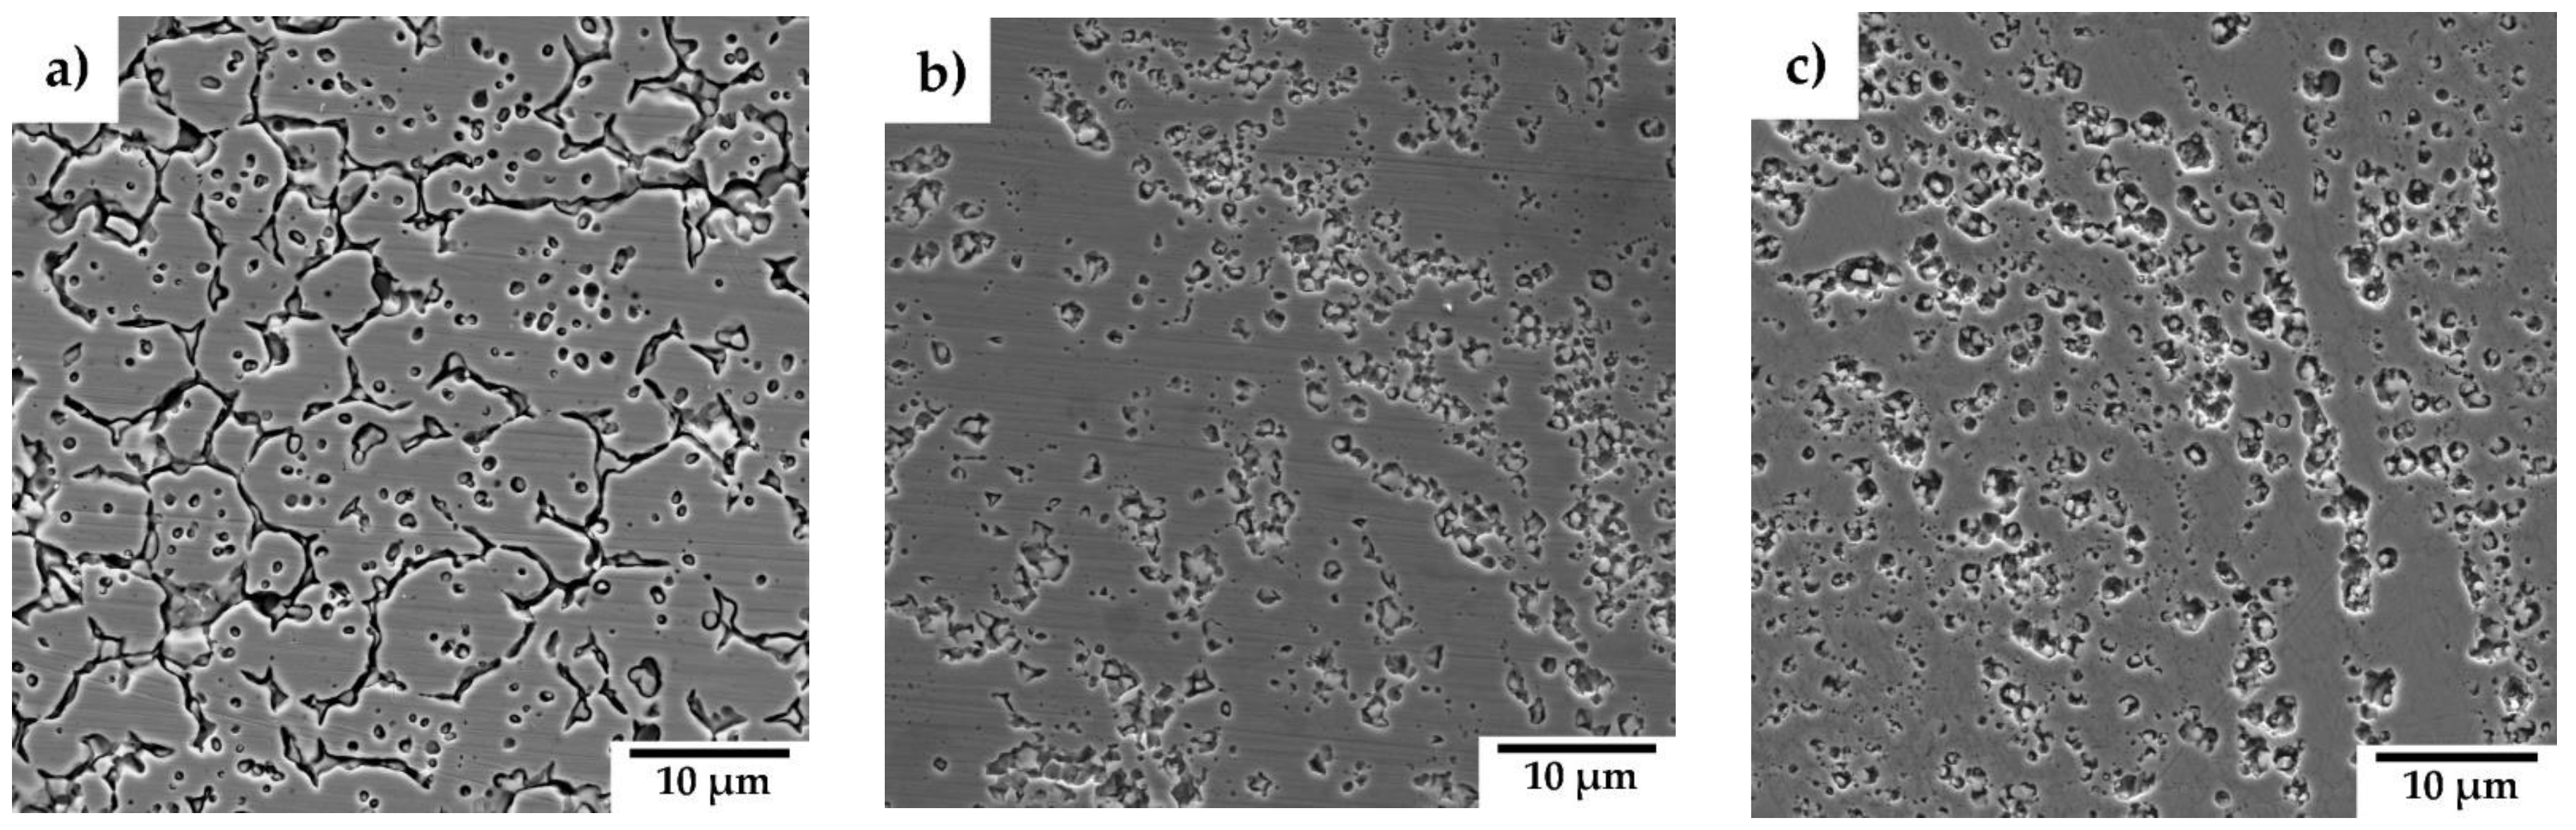

Table 1.
Properties of initial powders.
| Initial powders | Purity (%) | Size (μm) |
|---|---|---|
| Pre-alloyed 316L steel | 99.99 | 30-60 |
| Y2O3 | 99.9 | 1-2 |
Table 2.
Particle size distribution parameters for alloys with different compositions.
| Alloy | D90 (μm) | D10 (μm) | D50 (μm) | Span |
|---|---|---|---|---|
| 316L-1Y2O3 | 486.8 | 126.9 | 267.7 | 1.4 |
| 316L-3Y2O3 | 336.3 | 048.0 | 121.6 | 2.4 |
| 316L-5Y2O3 | 209.7 | 035.6 | 080.3 | 2.2 |
Table 3.
Compressive yield strength (CYS) of ODS steels in compression at room and elevated temperatures (600 °C) and Vickers hardness.
Table 3.
Compressive yield strength (CYS) of ODS steels in compression at room and elevated temperatures (600 °C) and Vickers hardness.
| Material | CYS0.2 (MPa) |
CYS0.2 600 °C (MPa) |
HV1 |
|---|---|---|---|
| 316L (SPS) | 313 ± 9 | 296 ± 7 | 227 ± 8 |
| 316L-1Y2O3 | 775 ± 21 | 550 ± 32 | 352 ± 9 |
| 316L-3Y2O3 | 1022 ± 15 | 803 ± 9 | 410 ± 9 |
| 316L-5 Y2O3 | 1042 ± 7 | 835 ± 6 | 435 ± 12 |
Table 4.
Electrochemical parameters of austenitic ODS steel samples.
| Material | Ecorr (mV/ACLE) |
βc mV/decade |
Eb (mV/ACLE) | ∆E (mV) |
| 316L (ref) | −220 | 166.8 | 472 | 252 |
| 316L (SPS) | −225 | 177.7 | 116 | 109 |
| 316L-1Y2O3 | −200 | 180.5 | 395 | 195 |
| 316L-3Y2O3 | −235 | 178.9 | 328 | 93 |
Table 5.
Results of the SL-EPR test and calculation of QPa.
| Material | Q (C) | X (cm2) | QPa (C/cm2) |
|---|---|---|---|
| 316L (SPS) | 0.068 | 0.029 | 20.7 |
| 316L-1Y2O3 | 0.025 | 0.043 | 09.0 |
| 316L-3Y2O3 | 0.007 | 0.043 | 03.1 |
Disclaimer/Publisher’s Note: The statements, opinions and data contained in all publications are solely those of the individual author(s) and contributor(s) and not of MDPI and/or the editor(s). MDPI and/or the editor(s) disclaim responsibility for any injury to people or property resulting from any ideas, methods, instructions or products referred to in the content. |
© 2025 by the authors. Licensee MDPI, Basel, Switzerland. This article is an open access article distributed under the terms and conditions of the Creative Commons Attribution (CC BY) license (https://creativecommons.org/licenses/by/4.0/).
Copyright: This open access article is published under a Creative Commons CC BY 4.0 license, which permit the free download, distribution, and reuse, provided that the author and preprint are cited in any reuse.


