
Submitted:
21 January 2025
Posted:
22 January 2025
You are already at the latest version
Abstract
Previously, we reported that mating induces an early transcriptional response in the oviductal mucosa of rats. The functional category ‘cell-to-cell signaling and interaction’ was overrepresented in this gene list. Therefore, in the present study, we describe the role of one of these genes, carbohydrate sulfotransferase 10 (Chst10), in the oviductal mucosa. CHST10 participates in the synthesis of the carbohydrate moiety HNK-1, which mediates cell-to-cell interactions. Using 1D western blot and sulfotransferase assays, we showed that mating increased the protein level and activity of CHST10 in the oviductal mucosa at 3 h after stimulation. A 2D western blot assay and mass spectrometry were used to identify the novel HNK-1 glycoproteins ALDH9A1, ALDOA and FHL1 in the oviductal mucosa, and we showed that mating induces the synthesis of their acidic variants. Interestingly, in the utero-tubal junction (UTJ), acrosome-reacted sperm are in close contact with HNK-1-ALDH9A1 regions, and acrosome-intact sperm are in close contact with other regions in which HNK-1 and ALDH9A1 do not colocalize. Furthermore, vaginocervical stimulation applied to unmated rats increases the mRNA level of Chst10 in the oviductal mucosa. In conclusion, mating increases the activity of CHST10 in the oviductal mucosa, which in turn induces the synthesis of acidic variants of ALDH9A1 and FHL1 via HNK-1 glycosylation. In the UTJ, HNK-1-ALDH9A1 can control the quality of the sperm arriving at the fertilization site, since we detected acrosome-reacted sperm in close contact with this glycoprotein, a finding that merits further research to propose the use of HNK-1-ALDH9A1 in the selection of sperm in procedures of assisted reproduction. Finally, the sensorial component of mating could regulate events occurring in the oviductal mucosa early after mating.
Keywords:
Mating
; oviduct
; oviductal mucosa
; CHST10
; HNK-1 glycoproteins
; sperm-oviduct interactions
1. Introduction
Mating induces physiological changes in the female reproductive tract that regulate reproductive function. Mating components independent of sperm, such as sensorial stimulation of the vaginocervical area and seminal plasma, modify the physiology of reproductive organs at various distances from the site of insemination. Recently, we reported that mating induces an early transcriptional response in the oviductal mucosa of rats [1], and we revealed that the signals that partially regulate this transcriptional response include tumor necrosis factor and retinoic acid. The cohort of mating-related genes was involved mainly in cell-to-cell signaling and interactions; thus, in the present study, we described the role of one of these genes, carbohydrate sulfotransferase 10 (Chst10).
Chst10 is upregulated in the oviductal mucosa of rats 3 h after mating [1]. This gene encodes a sulfotransferase that participates in the synthesis of the human natural killer-1 (HNK-1) carbohydrate moiety, which is associated with membrane lipids and proteins and mediates interactions among cells in both the immune system and nervous system [2,3,4]. CHST10 is located in the Golgi apparatus, and in addition to its involvement in the synthesis of HNK-1 glycoproteins, it also participates in the generation of part-time proteoglycans [5]. Therefore, this sulfotransferase could modify the expression patterns of HNK-1 glycoproteins and/or proteoglycans that must be exposed on the epithelial membrane and/or secreted into the oviductal lumen. Indeed, high Golgi apparatus activity and high sulfated glycoprotein secretion have been reported in response to mating in sheep and rabbits, respectively [6,7].
On the other hand, CHST10 is also involved in estrogen metabolism because it actively sulfates glucuronidated estradiol (E2). CHST10 deficiency leads to high levels of E2 in the serum, uterine hypertrophy, and infertility in mice [8]. In our rat model, mating changes not only the mechanism by which E2 accelerates oviductal egg transport but also the sensitivity to E2. Indeed, accelerating oviductal egg transport in mated rats requires a dose of E2 that is 10 times greater than that needed in unmated rats (10 µg/rat and 1 µg/rat, respectively) [9]. Therefore, exploring the specific processes regulated by CHST10 in oviductal physiology early after mating is imperative.
To achieve our objective, we measured the protein levels and activity of CHST10 in the oviductal mucosa, determined the localization of HNK-1 carbohydrate moieties in the oviduct, identified the HNK-1 glycoproteins present in the oviductal mucosa and determined their oviductal localization. Finally, we identified the component of mating that regulates the expression of Chst10 in the oviductal mucosa.
2. Results
2.1. Mating Increases CHST10 Protein Level and Sulfotransferase Activity in the Oviductal Mucosa
Mating increased the mRNA level of Chst10 in the oviductal mucosa [1]; consequently, we measured the CHST10 protein levels by western blotting to determine whether it affects oviductal physiology. As shown in Figure 1, we detected 3 bands in the oviductal mucosa from the unmated and mated rats, which corresponded to the CHST10 isoforms that have been proposed to be expressed in the rat (see Discussion). We found that mating increased the protein levels of CHST10, considering the intensity of the three isoforms detected in the oviductal mucosa. Additionally, CHST10 was detected in the epithelium cytoplasm (Figure 2, fourth column, red arrows) of the ampulla, isthmus, and utero-tubal junction (UTJ); in some folds, the pattern of the detected signal resembled the location of the Golgi apparatus, especially in the UTJ (Figure 2, fourth column, red arrowheads). CHST10 was also expressed in the UTJ muscular layer (Figure 2).
Next, we measured the sulfotransferase activity in the oviductal mucosa. First, we determined the kinetic parameters of human recombinant CHST10 using two specific acceptor substrates (Figure 3A). CHST10 showed a preference for PGA [10], with Km = 41.6 ± 2.4 μM and Vmax = 328 ± 3.8 pmol/min/μg; while for 17b-Estradiol 3-[b-D-glucuronide] a Km = 73.9 ± 5.4 μM and Vmax = 332 ± 7.1 pmol/min/μg. Second, we compared the substrate preference patterns of CHST10 (Figure 3B, left) and the total proteins obtained from the cellular components of oviductal mucosa (Figure 3B, right). The substrate specificity patterns of CHST10 and the total proteins were similar, confirming that the activity measured in the oviductal mucosa corresponds to that of CHST10. Third, we measured sulfotransferase activity in the oviductal mucosa extracts from unmated and mated rats using two specific acceptor substrates, PGA (Figure 3C, left) and E23G (Figure 3C, right) and found that sulfotransferase activity in oviductal mucosa also increased because of mating; therefore, we further evaluated the expression of one of the CHST10 specific products in the oviduct, the HNK-1 carbohydrate moiety.
2.2. Mating Changes the Levels of HNK-1 Glycoproteins in the Oviductal Mucosa
CHST10 participates in the synthesis of the HNK-1 carbohydrate moiety, which is a glycolipid or glycoprotein prosthetic group. Immunofluorescence was used to detect the HNK-1 carbohydrate moiety in the oviduct, which was located on the luminal face of the epithelium. The signal in the ampulla was strong but weaker in the isthmus; thus, the isthmus images are shown at major magnification (Figure 4). HNK-1 was detected into the lumen of isthmus; however, this signal was detected at a different Z-position compared with the image enclosed in the square in middle panel. The signals detected in the muscular and serous layers of isthmus were not specific since these signals were also detected in the isotype control.
Since mating increases the expression and activity of CHST10 in the oviductal mucosa, does mating also change the pattern of HNK-1 glycoprotein expression? Western blot analysis of the total proteins resolved by one-dimensional (1D) electrophoresis was conducted with samples obtained from the cellular and secreted pools of proteins from the oviductal mucosa. This approach revealed that mating decreased the intensity of the 130 kDa band in the cellular pool of glycoproteins (Figure 5A, left and right) while increasing the intensity of the 55 kDa band in the secreted pool of glycoproteins from the oviductal mucosa (Figure 5B, left and right).
Then, western blot analysis of the samples resolved by two-dimensional (2D) electrophoresis was conducted to isolate and identify the HNK-1 glycoproteins (Figure 6); however, samples from the cellular pool were not well resolved (data not shown), which is why we focused on HNK-1 glycoproteins from the secreted pool. 2D analysis of HNK-1 glycoproteins revealed that mating changed the synthesis and/or secretion of a group of secreted HNK-1 glycoproteins in the oviductal mucosa. Our results indicated that mating induced the appearance of 10 spots (black arrowheads), increased the intensities of 2 spots (green arrowheads) and decreased the intensities of 3 spots (red arrowheads). Three spots with similar intensities were selected as references (white arrowheads) for sample comparison (Figure 6, upper and lower panels). Band 2 (55 kDa) previously detected in Figure 5B was resolved as spot 1, spot 2 and spot 3 and was detected only in mated rats (Figure 6, lower panel), supporting the results obtained after 1D electrophoresis.
Silver staining of the nitrocellulose membranes used for the 2D western blots revealed that the protein cores of spots 2, 3, 5 and A appeared only in samples from mated rats (Figure 7, lower panel), indicating that those proteins could be secreted and/or synthesized de novo. The intensities of the protein core of spots 1 and 6 did not differ between samples, the intensity of the protein core of spot B increased in mated rats, and the intensity of the protein core of spot 4 decreased in mated rats. A new sample was subsequently analyzed via 2D electrophoresis, from which spots 2 and 3 were removed from the gel for mass spectrometry identification. We also identified spots 4, 5, and 6 since they were clearly resolved in the Coomassie blue-stained gel. The identified proteins are listed in Table 1. Spots 2 and 3 were identified as aldehyde dehydrogenase 9 family, member A1 (ALDH9A1), suggesting that they are isoelectric variants with different levels of HNK-1 glycosylation. Additionally, spots 5 and 6 were identified as four and a half LIM domains protein 1 (FHL1), whereas spot 4 was identified as fructose bisphosphate aldolase A (ALDOA).
2.3. Mating Induces the Secretion of ALDH9A1 and Increases the Secretion of ALDOA from the Epithelial Cells of Oviductal Mucosa.
After the proteins ALDH9A1 and ALDOA were identified, the above findings were validated by measuring the levels of these proteins in samples obtained from unmated and mated rats via 1D-electrophoresis and western blotting. Both proteins presented a unique band at the expected molecular mass, approximately 55 kDa and 40 kDa for ALDH9A1 and ALDOA, respectively (Figure 8A and 8B). We cannot detect a specific band for FHL1 protein (data not shown). Since we do not know the identity of a secreted protein in these samples whose level was unchanged after mating, we applied Ponceau red stain to the total proteins on the western blot membranes as a charge control to normalize the signal detected by the specific antibodies in the blot. The intensities of the protein bands between 40 and 60 kDa and between 60 and 100 kDa were used to normalize the ALDH9A1 and ALDOA signal intensities, since 40 and 10 μg of total protein per sample were used, respectively. Thus, mating induces the secretion of ALDH9A1 and increases the secretion of ALDOA from the epithelial cells of oviductal mucosa.
Immunofluorescence analysis of oviduct sections was used to localize ALDH9A1 and ALDOA in the oviductal mucosa. ALDH9A1 was detected on the luminal face of the epithelium in the ampulla and was localized in the cytoplasm and cytoplasmic vesicles in the isthmus and UTJ. Double staining of ALDH9A1 and the HNK-1 moiety revealed that their signals were colocalized only in trenches created by the mucosal folds in the isthmic region (Figure 9, first row, asterisk) but not in the cells in the mucosal folds in this region. Signal colocalization was also detected in the mucosa of the UTJ and apparently interacted with acrosome-reacted sperm (Figure 9, second row, white arrow); the ALDH9A1 signal was weaker than that of the HNK-1 moiety, suggesting the presence of other HNK-1 glycoproteins in this region. Acrosome-intact sperm were also detected in the lumen and interacting with the oviductal mucosa (Figure 9, second row, yellow arrowhead), but in this case, the HNK-1 and ALDH9A1 signals did not colocalize. Interestingly, we also detected weak signals from ALDH9A1 and HNK-1 in the principal segment domain (Figure 9, second row, red arrowhead) and the marginal segment domain of the acrosome (Figure 9, second row, green arrowhead), respectively, in the free spermatozoa located in the lumen. Additionally, TUBB, a marker of ciliated epithelia, was detected in the oviductal mucosa. Early after mating, ciliated epithelia are predominantly present in the ampulla, whereas they are scarce in the isthmus, predominantly in the trenches created by the mucosal folds (Figure 9, third row, green arrows), creating a striped pattern of ciliated cell clusters in the isthmus. Abundant ALDOA was detected in the luminal face of the epithelium in both the ampulla and the isthmus (Figure 9, fourth row, red arrowhead); in some folds, the pattern of the signal detected in the isthmus resembled mucin vesicles (Figure 9, fourth row, red arrow). Double staining of ALDOA and the HNK-1 moiety were not performed.
2.4. Vaginocervical Stimulation (VCS) Increases the Expression of Chst10 in the Oviductal Mucosa
To determine the mating-induced signal that regulates the expression of Chst10 in oviductal mucosa, the immunological and sensorial components of mating were independently applied to unmated rats. In this study, 0.1 mL of saline; sperm suspension (10 million spermatozoa); or seminal vesicle fluid (SVF, diluted 1:1 in saline) was injected into the uterus to analyze the immune component of mating, and VCS or sham stimulation was performed to analyze the sensorial component of mating at 2200 h of proestrus in unmated rats. Approximately 3 h after treatment (0130 h), samples were obtained to determine the relative expression of Chst10 via RT‒qPCR, with Actin b (Actb) and Glyceraldehyde-3-phosphate dehydrogenase (Gapdh) used as reference genes. Finally, we found that only VCS increased the expression of Chst10 in the oviductal mucosa of rats (Figure 10).
3. Discussion
Previously, we reported that mating induces an early transcriptional response in the oviductal mucosa of rats, suggesting that the oviduct can organize a physiological response to sustain the events that occur in the oviduct early after mating. Here, we report one of those physiological responses.
Glycoconjugates in the female reproductive tract are critical for controlling sperm maturation, sperm transport and gamete interactions [11,12,13]. Thus, it is interesting that mating increases the transcriptional activity of Chst10, a gene encoding a carbohydrate sulfotransferase that participates in the synthesis of the particular carbohydrate moiety HNK-1. The structure of the HNK-1 moiety in glycoproteins and glycolipids is unique and consists of a sulfated trisaccharide with the sequence SO4-3GlcAb1-3Galb1-4GlcNAc–R [14]. This moiety mediates interactions among cells in the nervous system and immune system [2,3,4], and here, we report that it could mediate cell interactions in the reproductive system.
Our results show that mating increases the activity of CHST10 and induces the synthesis of novel HNK-1 glycoproteins, which were identified as ALDH9A1, ALDOA and FHL-1, in the oviductal mucosa. Three isoforms of CHST10 can be found in this tissue with molecular masses ranging from 40 to 50 kDa. These bands correspond to CHST10 isoforms proposed to be expressed in rats (see the Rat Genome Databank: https://rgd.mcw.edu/rgdweb/report/gene/main.html?id=621216). Indeed, the sequence of the human antigen used to raise the antibody (Figure S1) has 81, 81 and 85% amino acid (aa) residue identity with CHST10 isoforms X1 (374 aas), X2 (356 aas) and X3 (288 aas), respectively (Figure S2a-c) [15,16,17]. The putative location of this sulfotransferase is the Golgi apparatus, and we detected signals suggesting this location, especially in the UTJ; however, we also detected CHST10 in the epithelium cytoplasm in all oviductal regions and in the muscular layer in the UTJ. Since estrogen sulfotransferases, such as Sult1E1, are located in the cytosol [18], we propose that cytosolic CHST10 could participate in estrogen metabolism in the oviductal mucosa. Indeed, in addition to its 3´-PAPS binding domain, CHST10 also contains a 5´-PAPS binding domain, which is characteristic of cytosolic sulfotransferases [18]. Moreover, we measured the specific sulfotransferase activity with glucuronidated estradiol (E23G) in the oviductal mucosa. Therefore, we propose that in the oviductal mucosa, CHST10 participates not only in the synthesis of HNK-1 glycoproteins but also in estrogen metabolism. On the other hand, since we cannot discriminate which isoform exists in a particular subcellular location, we used the sum of the intensities of all the isoforms detected in each sample to compare CHST10 protein levels between unmated and mated rats. Thus, we found that mating increases the protein levels of CHST10 in the oviductal mucosa, which correlates with the measured increase in sulfotransferase activity when two specific acceptor substrates, PGA and E23G, were used. Although we cannot test whether the sulfotransferase activity measured in the oviductal mucosa is exclusive to CHST10 due to a lack of specific inhibitors, we concluded that mating increases the activity of CHST10 in the oviductal mucosa, as supported by the following: i) activity measurements with specific acceptor substrates; ii) a pattern of acceptor substrate preferences that is similar to that of human recombinant CHST10; and iii) the endogenous production of its specific product, the HNK-1 carbohydrate moiety.
Compared with the isthmus and UTJ, the HNK-1 moiety is more abundant in the ampulla and is located predominantly on the luminal face of the oviductal epithelium. There was an unexpected diversity of HNK-1 glycoproteins in the oviductal mucosa, with clear differences in the molecular masses of the cellular pool (higher than 70 kDa) and the secreted pool (lower than 100 kDa) of glycoproteins (Figure 5). These results support the separation of glycoproteins into cellular and secreted pools by simple centrifugation after mechanical isolation of the oviductal mucosa and before lysis of its cellular components. However, in the secreted pool of glycoproteins, we cannot exclude the presence of some serum and/or cytosolic proteins released after the cells are damaged upon oviductal mucosal mechanical isolation. Our 2D analysis increased the power of HNK-1 glycoprotein detection. There were at least 15 HNK-1-positive spots with different intensities between the samples of unmated and mated rats, among which 5 were identified. Spots 2 and 3 were identified as ALDH9A1, as they have the same molecular mass but different isoelectric points. Although both are HNK-1 glycosylated proteins, spot 2 is more acidic than spot 3; therefore, spot 2 is the more densely glycosylated variant. Additionally, the protein cores of spots 2 and 3 were detected in samples from mated rats only (Figure 7, lower panel). Consequently, mating induces the de novo synthesis of HNK-1-ALDH9A1 isoelectric variants in the oviductal mucosa, and the presence of acidic variants could very well be correlated with the increased activity of CHST10. We found similar results for spots 5 and 6, which were identified as FHL1. In this case, mating induces the de novo synthesis of the more acidic variant of FHL1 since spot 5 was detected only in samples from mated rats, whereas spot 6 was detected in both the mated and unmated samples. Therefore, mating induces the synthesis of acidic variants of specific HNK-1 glycoproteins in the oviductal mucosa. This conclusion could also be applied to ALDOA, although we only detected this protein in spot 4; however, we propose that spot A and spot B are acidic variants of ALDOA (Figure 6). We did not identify spots A or B because these spots were not well resolved in the Coomassie blue-stained gels; that is, other spots were too close, as observed in the silver-stained membranes used for western blotting (Figure 7). More importantly, contrary to our expectations, we cannot validate our initial interpretation of spot 4 from 2D analysis; that is, mating decreased its intensity (Figure 6 and Figure 7). Indeed, further western blot analyses revealed that mating increased ALDOA levels (spot 4) in the oviductal mucosa (Figure 8B). This contradiction could be explained by the fact that spots A and B are acidic variants of ALDOA; indeed, spots A, B and 4 have the same molecular mass, and spots A and B are located to the left of spot 4 (toward the acidic region). Furthermore, spot A was induced, and spot B was increased in mated samples (Figure 6 and 7), which correlates well with the increased levels of ALDOA in the oviductal mucosa of mated rats. However, this hypothesis must be elucidated in future work. Overall, we conclude that mating increases the activity of CHST10 in the oviductal mucosa to induce the synthesis of acidic variants of ALDH9A1 and FHL1 via HNK-1 glycosylation.
We propose that mating induces the de novo secretion of ALDH9A1 from oviductal epithelium. Our results revealed that ALDH9A1 was not present in the oviductal mucosa secreted pool from unmated rats (except for one sample), but after mating, this glycoprotein was detected (Figure 8A). Similar results were detected by staining the 2D western blot membrane with silver (Figure 7), as we did not detect an ALDH9A1 protein core (spots 2 and 3) in the unmated rat sample. ALDH9A1 is located predominantly on the luminal face of the epithelium in the ampulla, but it is found in the cytoplasm and cytoplasmic vesicles in the isthmus and UTJ. Interestingly, HNK-1-ALDH9A1 represents a minor fraction of the total ALDH9A1 synthesized in the oviductal mucosa of the isthmus and UTJ since the majority of this protein was shown to not colocalize with the HNK-1 signal via immunofluorescence (Figure 9, first row). Colocalization of the HNK-1 and ALDH9A1 signals was detected in particular regions of the isthmus (Figure 9, first row, asterisk), specifically in the trenches created by the mucosal folds, which could be related to the ciliated cell clusters that are also found in these trenches, creating a striped pattern of ciliated cell clusters in the isthmus (Figure 9, third row, green arrows), as observed in mice [19]. This striped pattern is similar to the pattern of sperm distribution in the isthmus shown in previous elegant studies in mice [20,21,22]. Furthermore, we previously reported that sialic acid moieties, which have a particular distribution similar to that of HNK-1-ALDH9A1 in the isthmus, are involved in sperm‒oviduct interactions in rats; these interactions occur between sialoglycoconjugates in epithelial cells and sialic acid-binding proteins on the sperm surface in vivo [23]. Therefore, we propose that HNK-1-ALDH9A1 could be another sperm binding site in the rat oviductal mucosa and that sialoglycoconjugates and HNK-1-ALDH9A1 could guide the sperm since they bind intermittently to particular regions of the isthmus during its journey to the fertilization site [24,25]. On the other hand, in the UTJ, we detected the specific colocalization of HNK-1 and ALDH9A1, but in this case, their colocalization appeared in a mucosa fold that were in close contact with acrosome-reacted sperm (Figure 9, second row, white arrows and white arrowhead, respectively). We propose that the regions with HNK-1-ALDH9A1 in the UTJ could be involved in the sperm quality control machinery proposed to exist in the oviduct [26] because in those regions, the sperm was induced to undergo the acrosome reaction prematurely, and consequently, its survival was compromised. In support of this proposal, we detected acrosome-intact sperm interacting with the mucosal folds in a region where the HNK-1 and ALDH9A1 signals did not colocalize (Figure 9, second row, yellow arrowhead).
The ALDH9 family encodes enzymes involved in the metabolism of 4-aminobutyraldehyde (ABAL) and amino aldehydes derived from polyamines and choline [27]. ALDH9A1 catalyzes the irreversible NAD(P)-dependent oxidation of aliphatic or aromatic aldehydes, was first purified from the liver and was characterized as an ABAL dehydrogenase that forms γ-aminobutyric acid (GABA) [28], a well-known neurotransmitter; however, GABA is also an inducer of the acrosome reaction in the sperm of many species in vitro [29,30,31,32]. Interestingly, the abundance of GABA in the rat oviduct is 2.5 times greater than that in the whole brain [33]. GABA is synthesized and secreted by the oviductal mucosa [34], and its concentration is greater at diestrus [33]. Here, we report that ALDH9A1 is highly expressed in the oviductal mucosa (Figure 9), which correlates well with GABA abundance; however, its physiological role in the oviduct in vivo remains to be determined. Recently, ALDH9A1 was shown to exhibit wide substrate specificity, but has a clear preference for γ-trimethylaminobutyraldehyde (Km = 6 mM) [35]; other novel identified substrates include 4-guanidinobutyraldehyde (GBAL) and 3-aminopropanal (APAL), with Km values of 21 ± 2 mM and 56 ± 7 mM, respectively [35]. APAL is produced during spermine metabolism by the sequential actions of spermine oxidase and polyamine oxidase [36]. Interestingly, spermine is a ubiquitous polyamine present at millimolar concentrations in the seminal plasma of many species, including humans, rats, and rams [37]. Spermine is rapidly incorporated into sperm during ejaculation and temporarily inhibits premature capacitation and the spontaneous acrosome reaction (sAR); indeed, spermine has been proposed as the major decapacitation factor in seminal fluid [38,39,40]. Therefore, considering that ALDH9A1 participates in spermine metabolism and GABA production and since we detected i) acrosome-reacted sperm in close contact with HNK-1-ALDH9A1 in the UTJ and ii) the distribution of HNK-1-ALDH9A1 in the isthmus, we propose that the HNK -1-ALDH9A1 in close contact with sperm could adjust the content of spermine in the spermatozoa during their journey to the site of fertilization. Therefore, if spermatozoa with a low content of spermine arrives at the UTJ and contacts HNK-1-ALDH9A1 regions, the spermine content will surpass the critical limit, and the spermatozoa will be induced to undergo sAR or AR because of the GABA present in the oviductal mucosa. Thus, HNK-1-ALDH9A1 in the UTJ and isthmus could control the quality of sperm arriving to the fertilization site. This hypothesis merits further research to propose the use of HNK-1-ALDH9A1 in the selection of sperm in procedures of assisted reproduction.
Finally, sensorial stimulation of the vaginocervical area induces the physiological processes necessary for female reproductive success, such as ovulation in rabbits [41] and pseudopregnancy in spontaneous ovulators such as rats [42]. Here, we showed that VCS increases the mRNA level of Chst10 in the oviductal mucosa of rats. Our data suggest that, in the oviductal mucosa, an increase in Chst10 transcripts is correlated with increased CHST10 protein levels and activity; therefore, we propose that all events described in this paper could be regulated by the sensorial component of mating. It is conceivable that signals regulating sperm‒oviduct interactions must arrive at the oviduct earlier than sperm. Thus, the sensorial stimulation associated with mating possibly arrives at the oviduct via the neuronal network that connects the vagina to the oviduct [43], since sperm arrives in the oviduct 15 min after mating [44]. Therefore, our findings merit further research since they suggest that the sensorial component of mating could regulate events occurring in the oviductal mucosa early after mating.
4. Materials and Methods
4.1. Animals
One hundred two Sprague‒Dawley rats, 73 females (240–280 g) and 29 males (400–600 g) were used in this study. The animals were kept under controlled environmental conditions (temperature of 21–24 °C and lights on between 0700 and 2100 h) and were provided rodent chow and water ad libitum. Under these controlled conditions, our animals ovulated at approximately 0630 h of estrus. The estrus cycle was evaluated by performing daily vaginal smears, and all females were used after exhibiting two consecutive 4-day cycles.
4.1.1. Mating and Sample Collection
Females in proestrus were isolated (unmated rats) or caged with fertile males at 2200 h of proestrus (mated rats). Thirty minutes after being caged with the males, the presence of spermatozoa in a vaginal smear or a vaginal plug was verified. The unmated and mated rats were subsequently sacrificed at 0130 h of estrus for oviduct excision and dissection. The oviductal mucosa was obtained under a stereomicroscope using curved microsurgical scissors and fine forceps. Briefly, the mesothelial membrane of the oviducts was removed in saline (0.9% NaCl) to compensate for oviductal folding. Then, the defolded oviducts were dried, placed on a new embryological culture dish with 0.4 mL of saline containing the antiprotease cocktail cOmplete (Roche, cat# 04693132001) at 4 °C, and cut into four pieces. Afterward, each piece was held with fine forceps at one side, and with another set of forceps, the piece was carefully extruded to obtain the mucosa. The mucosa pieces were collected with a micropipette and added to a 0.6 mL conical tube. After centrifugation at 3,000 × g for 10 min, the supernatant was collected in a new conical tube. The pellet contained both epithelial and stromal cells, while supernatant contained the proteins that had been secreted into the oviductal lumen, which we call the secreted pool. However, in this secreted pool of proteins, we cannot exclude the presence of serum and/or cytosolic proteins that were released when the cells were damaged due to mechanical isolation of the oviductal mucosa.
4.1.2. Sperm and Seminal Vesicle Fluid (SVF) Collection
Male rats were sedated and sacrificed by decapitation at 2130 h of female proestrus to obtain their epididymal spermatozoa and SVF. Each cauda epididymis was dissected in saline at 37 °C; then, several regions were cut open in 0.5 mL of saline overlaid with mineral oil at 37 °C to allow the sperm to diffuse into the medium [23]. The concentration of spermatozoa in the suspension was determined using a Neubauer Chamber (Cambridge Instruments). Concomitant with the previous procedure, we used a 1 mL syringe (BD Plastipak, cat# 990214) with a 21G × 1 ½’’ gauge (BD Plastipak, cat# 300340) to obtain the fluid from both seminal vesicles by inserting the gauge into the lumen of each seminal vesicle and aspirating the fluid. We obtained approximately 0.5 mL of fluid, which was diluted 1:1 with saline at 37 °C.
4.1.3. Intrauterine Injection of Sperm or SVF
To identify the mating component that regulates Chst10 expression in the oviductal mucosa, female rats were randomly distributed into 3 groups. Each group received one of the following via intrauterine injection at 2200 h of proestrus: 0.1 mL of saline (n = 5), 0.1 mL of sperm suspension containing 10 million spermatozoa (n = 5) in saline, or 0.1 mL of diluted SVF (n = 5). Surgical intervention was conducted as follows. First, the animals were anesthetized with 75 mg/kg ketamine + 5 mg/kg xylazine via intraperitoneal injection. The uteri were exposed by creating flank incisions, and 0.1 mL of saline, sperm suspension or SVF was injected into the upper third of each uterine horn using a 1 mL syringe. Then, the uteri were returned to the peritoneal cavity, and the muscles and skin were sutured. The procedure lasted 15 min. Finally, the oviductal mucosa was obtained at 0130 h of estrus and stored in TRIzol reagent (Ambion, cat# 15596-018) at -80 °C.
4.1.4. Vaginocervical Stimulation (VCS)
To identify the mating component that regulates Chst10 expression in the oviductal mucosa, female rats were randomly distributed into 2 groups. In the first group, females in proestrus were mechanically stimulated at the vaginocervical area at 2200 h (n = 5). Mechanical stimulation was applied by introducing 1 cm of a glass vibrating rod into the vagina twice for 10 seconds each time with an interval of 5 seconds. The rats in the second group (n = 5) were manipulated following the same procedure as that used for the rats in the stimulation group but did not receive mechanical stimulation (sham control, n = 5). The procedure lasted 10 min. Finally, the oviductal mucosa was obtained at 0130 h of estrus and stored in TRIzol reagent at -80 °C.
4.2. Sulfotransferase Activity
To measure the sulfotransferase activity, we used both unmated and mated female rats. Sulfotransferase activity was measured using a Universal Sulfotransferase Activity Kit (R&D Systems, cat# EA003), and 3’-phosphoadenosine-5’-phosphosulfate (PAPS; R&D Systems, cat# ES019) was used as the donor substrate. Phenolphthalein glucuronic acid (PGA; Sigma‒Aldrich, cat# P0501), 17b-estradiol 3-[b-D-glucuronide] (E23G; Cayman Chemical, cat# 16155) and chondroitin sulfate A (CSA; Sigma‒Aldrich, cat# C9819) were used as positive acceptor substrates, and 17b-estradiol 17-[b-D-glucuronide] (E217G; Cayman Chemical, cat# 16156) and 17b-estradiol (E2; Cayman Chemical, cat# 10006315) were used as negative acceptor substrates. We also evaluated the substrate specificity of human recombinant CHST10 (R&D Systems, cat# 6140-ST) and compared the activity of this enzyme to the sulfotransferase activity detected in the oviductal mucosa protein extracts.
The oviductal mucosa protein extract was obtained as follows. First, 150 µL of Phosphatase 3 buffer (provided in the kit) was added to the oviductal mucosal epithelial and stromal cell pellet. Then, the sample was sonicated at 20 Hz twice for 15 seconds at 4 °C; afterward, the sample was centrifuged at 8,000 × g for 10 min at 4 °C, and the supernatant was stored at -20 °C for further analysis. This assay uses coupling phosphatase 3 (CP3) to remove inorganic phosphate (Pi) from the leaving PAP nucleotide, and the released Pi is detected by malachite green phosphate detection reagents. The amount of Pi released by CP3 is proportional to the amount of PAP generated during the sulfotransferase reaction; therefore, the rate of Pi production reflects the kinetics of the sulfotransferase reaction (Universal Sulfotransferase Activity Kit manual). A standard curve of Pi was generated following the manufacturer´s instructions, and the stability of PAPS to CP3 was evaluated in each experimental procedure. Sulfotransferase activity was evaluated by measuring the absorbance at 620 nm using an Infinite® F50 microplate reader (TECAN Austria GmbH) after 20 min of incubation at 37 °C. The total protein concentration in the oviductal mucosa protein extracts was quantified using the Bradford method (Bio-Rad Protein Assay, cat# 500-0006) with bovine serum albumin (BSA; EMD Millipore, cat# 12659) as a standard.
4.3. Immunofluorescence
To determine the oviductal localization of CHST10, the HNK-1 carbohydrate moiety (CHST10 product), aldehyde dehydrogenase 9 family, member A1 (ALDH9A1), fructose bisphosphate aldolase A (ALDOA), and tubulin β class I (TUBB), we used unmated and mated female rats. For mating, we proceeded as described in 4.1.1 section; however, in this experiment, the organs were immediately processed as described previously [1]. The following antibodies were used for immunofluorescence detection: FITC mouse anti-HNK-1 (human CD57, BD Pharmingen, cat# 555619) diluted 1:5; FITC mouse IgM, k isotype control (BD Pharmingen, cat# 555583) diluted 1:5; rabbit anti-CHST10 polyclonal antibody (Sigma‒Aldrich, cat# HPA012884) diluted 1:60; rabbit anti-ALDH9A1 polyclonal antibody (Invitrogen, cat# PA5-52756) diluted 1:60; rabbit anti-ALDOA polyclonal antibody (Invitrogen, cat# PA5-77857) diluted 1:60; and mouse anti-TUBB monoclonal antibody (DSHB, cat# AB 2315513) diluted 1:100. To detect unconjugated primary antibodies, we used an anti-rabbit IgG Alexa Fluor® 594 secondary antibody (Life Technologies, cat# A21442) diluted 1:200 and an anti-mouse IgG IgM Alexa Fluor® 488 secondary antibody (Life Technologies, cat# A10684) diluted 1:200. For the negative control group, the primary antibody incubation step was omitted. Slides were imaged using a Leica TCS SP8 confocal microscope (Leica Microsystems).
4.4. Western Blotting
4.4.1. Sample Preparation:
The oviductal mucosa epithelial and stromal cell pellet was sonicated at power 20 for 10 seconds once in 200 μL of RIPA buffer (137 mM NaCl, 0.1% SDS, 0.5% sodium deoxycholate, 1% Triton X-100, 2 mM EDTA, 1× protease inhibitor cocktail and 20 mM Tris-HCl, pH 7.5), incubated at 4 °C for 30 min and sonicated again at power 20 for 10 seconds twice; subsequently, the sample was centrifuged at 8,000 × g for 10 min at 4 °C, and the supernatant was transferred to a new conical tube. This protein extract was considered the cellular pool. The total protein in the cellular pool was quantified using a DC protein assay kit II (Bio-Rad, cat# 500-0006) with BSA as a standard. The proteins were subsequently precipitated with cold acetone (5:1), resuspended in loading buffer to a concentration of 5 μg/μL and stored at -20 °C until use.
The secreted pool of proteins from the oviductal mucosa collected in saline was concentrated from 400 to 25 µL for one-dimensional (1D) electrophoresis using Microcon®-10 centrifugal filters (Merck Millipore Ltd., cat# MRCPRT010). Afterward, the total protein was quantified, and loading buffer was added to a final concentration of 5 μg/μL before storage at -20 °C. For two-dimensional (2D) electrophoresis, the samples were concentrated from 400 to 10 μL because NaCl interferes with isoelectric focusing (IEF), mixed with 125 μL of C1 denaturing buffer (8 M urea, 1 M thiourea, 4% CHAPS, 0.66 M DTT, 2 mM tributylphosphine and 0.8% ampholytes pH 3-10) and incubated for 2 h at room temperature with constant agitation. After centrifugation at 8,000 × g for 10 min, the supernatant was transferred to a new conical tube and immediately used for gel IEF.
4.4.2.1. D Electrophoresis and Western Blotting:
To detect changes in the levels of the CHST10, ALDH9A1, ALDOA and HNK-1 glycoproteins in the oviductal mucosa induced by mating, we used unmated and mated female rats. The samples were resolved under reducing and denaturing conditions via SDS‒PAGE (12%) and electroblotted onto nitrocellulose membranes (BIO‒RAD, cat# 162-0115) overnight at 90 mA and 4 °C. After blocking for 1 h with 5% nonfat milk in PBSTr (137 mM NaCl, 2.7 mM KCl, 10.5 mM Na2HPO4, 1.8 mM KH2PO4, 0.2% Triton X-100), the membrane was incubated at 4 °C overnight with a rabbit anti-CHST10 polyclonal antibody diluted 1:1000, a mouse anti-HNK-1 monoclonal antibody (BD Pharmingen, cat# 559048) diluted 1:10000, a rabbit anti-ALDH9A1 polyclonal antibody diluted 1:1000 or a rabbit anti-ALDOA polyclonal antibody diluted 1:3000 in PBSTr + 2% BSA. The membrane was subsequently washed and incubated with an anti-mouse IgG & IgM, HRP-linked secondary antibody (Sigma‒Aldrich, cat# AP130P) diluted 1:5000 or an anti-rabbit IgG, HRP-linked secondary antibody (Cell Signaling, cat# 7074S) diluted 1:2000 for 1 h at room temperature. A rabbit anti-TUBB polyclonal antibody (Abcam, cat# ab15568) diluted 1:5000 was used as a loading control for the cellular pool of proteins from the oviductal mucosa. Ponceau red or silver staining [45] of the western blot membrane was used as a loading control for the secreted pool of proteins from the oviductal mucosa. The HRP conjugates were detected using Western Lightning Plus enhanced chemiluminescence substrate (PerkinElmer, cat# NEL104001EA) and developed via Amersham Hyperfilm ECL (GE Healthcare). The stained membranes and films were subsequently imaged using an OmniMedia Scanner (UMAX Data System, Hsinchu, Taiwan). Densitometry was performed using ImageJ software.
4.4.3.2. D Electrophoresis and Western Blotting:
To identify the HNK-1 glycoproteins that are regulated by mating in the oviductal mucosa, we used unmated and mated females. A 7 cm immobilized pH gradient (IPG) strip (pH 3-10, Bio-Rad, cat# 163-2000) was rehydrated overnight under passive conditions with 125 μL of the secreted pool of proteins from the oviductal mucosa (350 μg in C1 denaturing buffer) for 12 h. Then, IEF was conducted in a linear range to a total of 3800 V-h at 20 °C with a current of 50 μA/IPG strip. Prior to SDS‒PAGE, the gels were incubated with 10 mg/mL DTT in equilibration buffer (6 M urea, 30% glycerol, 2% SDS, 0.05 Tris‒HCl, pH 8.8) for 15 min and then with 45 mg/mL iodoacetamide (IAA) in the same buffer for 15 min. SDS‒PAGE was performed with 12% polyacrylamide gels (80 × 60 × 1.5 mm) and Tris–glycine–SDS buffer at 35 mA, followed by electroblotting onto a nitrocellulose membrane overnight at 90 mA and 4 °C. Western blotting was performed as previously described with the following modifications: the anti-HNK-1 mouse monoclonal antibody was diluted 1:2500, and the secondary antibody was diluted 1:30000. After western blotting, the membranes were stained with silver as described previously. Image analysis and spot matching were performed using Fiji/ImageJ software [46]
4.5. Protein Identification
4.5.1. Destaining and Drying the Gel Pieces:
The secreted pool of proteins from the oviductal mucosa was resolved by 2D electrophoreses and stained with Coomassie blue. The spot pattern was matched with the spot pattern obtained from the silver-stained membranes to identify the target proteins that were glycosylated with HNK-1 because of mating. The selected spots were excised with a scalpel, cut into small pieces and destained with a destaining solution: 50 mM ammonium bicarbonate (AB) + 50% acetonitrile (ACN), overnight with shaking at room temperature (RT). The destained gel pieces were dried by washing twice in 100 mM AB for 10 min, twice with destaining solution for 10 min and finally with pure ACN for 10 min.
4.5.2. Trypsin Digestion:
The dried gel pieces were sent to the biOMICS mass spectrometry facility (Sheffield University, UK). In the biOMICS laboratory, proteins in dry gel pieces were reduced on Cys residues by adding 50 μL of 50 mM Tris(2-carboxyethyl) phosphine and heating for 10 min at 70 °C, supernatant was removed and let cool down on the bench. Then, proteins were alkylated on reduced Cys by adding 100 μL of 50 mM IAA and incubating for 30 min, at RT in the dark. The following procedures were conducted at RT unless specified. The gel pieces were washed twice each step with shaking for 10 min with the following solutions: 200 μL of 100 mM AB; 100 μL of 50% ACN + 50 mM AB; and 100 μL of ACN. The supernatant was removed, and samples were dried for 10 min. Proteins in gel pieces were digested by adding 20 μL of 1 ng/μL of trypsin (New England biolabs) in 100 mM AB and incubation overnight at 37 °C. Digestion was stopped by adding 10 μL of ACN to gel pieces and incubation for 15 min at 37 °C, supernatant, containing digested peptides, was transferred into a new conical tube. The digested peptides were extracted twice again from gel pieces with 25 μL of 0,5% formic acid (FA) and incubation for 15 min with shaking followed by addition of 50 μL of ACN and incubation for 15 min with shaking. Final extraction was conducted by adding 50 μL of ACN to gel pieces and incubation for 15 min with shaking. Supernatants were transferred into the same conical tube, the total volume of extracted peptides (230 μL) was dried in the speed-vac for 3 h. Then, the dry pellet of each sample was resuspended by sonication in a water bath for 2 min at power 9 in 40 μL of 0.5% FA and transferred 20 μL into MS vial for further analysis.
4.5.3. Liquid Chromatography and Mass Spectrometry Analysis:
The trypsin-digested peptides in MS vial were separated and analyzed using an HPLC UltiMate 3000 coupled with Orbitrap Elite™ Hybrid Ion Trap-Orbitrap mass spectrometer (Thermo Fisher Scientific). For HPLC, sample injection volume was 18 μL, flow rate was 0.250 μL/min, solvent A was 0.1% FA, and solvent B was 0.1% FA + 80% ACN. The gradient was as follows: 3% of solvent B for 10 min; then up to 40% solvent B for 40 min; then up to 90% solvent B for 5 min; and keep at 90% solvent B for 5 min. Solvent A was used to complete 100% of total solvent in each step. For MS analysis in the Orbitrap the operation mode was CID with minimal signal: 5000; normalized collision energy: 35; default charge state: 2; charge state: ≥ 2+; ion inject time: 30 milliseconds; scan range: 375-1600 m/z; and top 20 ions.
4.5.4. Criteria for Protein Identification:
MaxQuant (v.1.5.5.1) search was applied for each sample individually using default parameters, and contaminants were not included in the search. The database used was Uniprot_Proteome_RattusNorvegicus_CanoIso_2017-07-24.fasta. Trypsin/P was specified as the cleavage enzyme, allowing up to 2 missing cleavages. The mass tolerance for precursor ions was set as 20 ppm. Carbamidomethyl on cysteine was specified as a fixed modification, while protein N-terminal acetylation, and methionine oxidation, were set as variable modifications. The false discovery rate (FDR) was adjusted to 1% decoy reverted database.
4.6. Relative Gene Expression Levels
RT‒qPCR was used to compare the expression levels of Chst10 in oviductal mucosa samples from the VCS and sham control groups and among the saline, sperm and SVF groups. Actin b (Actb) and Glyceraldehyde-3-phosphate dehydrogenase (Gapdh) were used as reference genes to calculate the relative gene expression levels. Information regarding the total RNA isolation procedure, primers sequences, RT‒qPCR conditions and data analyses were reported previously [1].
4.7. Statistical Analysis
The Mann–Whitney test was used to determine the significance of the differences in the various measured factors between unmated and mated rats. The Kruskal‒Wallis test followed by the uncorrected Dunn test was used to determine the significance of the differences in the RT‒qPCR results among the saline, sperm and SVF groups (Figure 9). The lines in the plots represent the median and interquartile range (IQR) of the corresponding dataset. * P < 0.05; ** P < 0.01 and *** P < 0.001 were considered to indicate significant differences. All of the statistical analyses were conducted using Prism 8 software (GraphPad).
5. Conclusions
In conclusion, mating increases the activity of CHST10 in the oviductal mucosa, which in turn induces the synthesis of acidic variants of ALDH9A1 and FHL1 via HNK-1 glycosylation. In the UTJ, HNK-1-ALDH9A1 can control the quality of the sperm arriving at the fertilization site, since we detected acrosome-reacted sperm in close contact with this glycoprotein, a finding that merits further research to propose the use of HNK-1-ALDH9A1 in the selection of sperm in procedures of assisted reproduction. Finally, the sensorial component of mating could regulate events occurring in the oviductal mucosa early after mating.
Supplementary Materials
The following supporting information can be downloaded at the website of this paper posted on Preprints.org, Figure S1: Sequence of the human antigen used to raise the antibody anti-CHST10; Figure S2a: Sequence identity between antigen sequence for human CHST10 with rat CHST10 isoform X1; Figure S2b: Sequence identity between antigen sequence for human CHST10 with rat CHST10 isoform X2; Figure S2c: Sequence identity between antigen sequence for human CHST10 with rat CHST10 isoform X3.
Author Contributions
Conceptualization, L.M.Z., F.F-G., JC.A.; methodology, L.M.Z.; software, L.M.Z., JC.A., M.Z-C.; formal analysis, L.M.Z., F.F-G., JC.A., M.Z-C., P.M.; investigation, F.F-G., JC.A., M.Z-C.; resources, L.M.Z., B.G-S. and P.M.; writing—original draft preparation, L.M.Z. and F.F-G.; writing—review and editing, B.G-S. and P.M.; visualization, L.M.Z. and M.Z-C.; supervision, L.M.Z.; project administration, L.M.Z. and B.G-S.; funding acquisition, L.M.Z. and B.G-S. All authors have read and agreed to the published version of the manuscript.
Funding
This research was funded by ANID FONDECYT, grant number 11121491, ANID PIA, grant number FB0001 and AFB240001. The L.M.Z., F.F-G., and B.G-S. were funded by ANID PIA.
Institutional Review Board Statement
The study was conducted in accordance with the Declaration of Helsinki and approved by our Institutional Ethics Committee and the Scientific and Bioethics Committees of ANID FONDECYT, grant number 11121491 (protocol N°018/FONDECYT/Biología2/1537; November 12, 2012).
Informed Consent Statement
Not applicable.
Data Availability Statement
The original contributions presented in this study are included in the article/supplementary material. Further inquiries can be directed to the corresponding author.
Acknowledgments
We thank Mr. Hernán Ubillo for excellent animal care. We gratefully thank the Biomedical Department Director, Professor Luis Urrutia Morales, for providing us with comfortable and useful facilities. We also thank Instituto Antofagasta for making the confocal microscope accessible.
Conflicts of Interest
The authors declare no conflicts of interest.
References
- Zuniga, L.M.; Andrade, J.C.; Fabrega-Gueren, F.; Orihuela, P.A.; Velasquez, E.V.; Vidal, E.A.; Gutierrez, R.A.; Morales, P.; Gomez-Silva, B.; Croxatto, H.B. Mating induces early transcriptional response in the rat endosalpinx: the role of TNF and RA. Reproduction 2021, 161, 43–59. [Google Scholar] [CrossRef] [PubMed]
- Kared, H.; Martelli, S.; Ng, T.P.; Pender, S.L.; Larbi, A. CD57 in human natural killer cells and T-lymphocytes. Cancer Immunol Immunother 2016, 65, 441–452. [Google Scholar] [CrossRef] [PubMed]
- Morita, I.; Kizuka, Y.; Kakuda, S.; Oka, S. Expression and function of the HNK-1 carbohydrate. J Biochem 2008, 143, 719–724. [Google Scholar] [CrossRef] [PubMed]
- Schachner, M.; Martini, R. Glycans and the modulation of neural-recognition molecule function. Trends Neurosci 1995, 18, 183–191. [Google Scholar] [CrossRef]
- Hashiguchi, T.; Mizumoto, S.; Nishimura, Y.; Tamura, J.; Yamada, S.; Sugahara, K. Involvement of human natural killer-1 (HNK-1) sulfotransferase in the biosynthesis of the GlcUA(3-O-sulfate)-Gal-Gal-Xyl tetrasaccharide found in alpha-thrombomodulin from human urine. J Biol Chem 2011, 286, 33003–33011. [Google Scholar] [CrossRef]
- Erickson-Lawrence, M.F.; Turner, T.T.; Ross, P.; Thomas, T.S.; Oliphant, G. Sulfated oviductal glycoproteins in the rabbit: quantitation by competitive enzyme-linked immunosorbent assay. Biol Reprod 1989, 40, 1299–1310. [Google Scholar] [CrossRef]
- Murray, M.K. Epithelial lining of the sheep ampulla oviduct undergoes pregnancy-associated morphological changes in secretory status and cell height. Biol Reprod 1995, 53, 653–663. [Google Scholar] [CrossRef]
- Suzuki-Anekoji, M.; Suzuki, A.; Wu, S.W.; Angata, K.; Murai, K.K.; Sugihara, K.; Akama, T.O.; Khoo, K.H.; Nakayama, J.; Fukuda, M.N.; et al. In vivo regulation of steroid hormones by the Chst10 sulfotransferase in mouse. J Biol Chem 2013, 288, 5007–5016. [Google Scholar] [CrossRef]
- Forcelledo, M.L.; Vera, R.; Croxatto, H.B. Ovum transport in pregnant, pseudopregnant, and cyclic rats and its relationship to estradiol and progesterone blood levels. Biol Reprod 1981, 24, 760–765. [Google Scholar] [CrossRef]
- Prather, B.; Ethen, C.M.; Machacek, M.; Wu, Z.L. Golgi-resident PAP-specific 3'-phosphatase-coupled sulfotransferase assays. Anal Biochem 2012, 423, 86–92. [Google Scholar] [CrossRef]
- Diekman, A.B. Glycoconjugates in sperm function and gamete interactions: how much sugar does it take to sweet-talk the egg? Cell Mol Life Sci 2003, 60, 298–308. [Google Scholar] [CrossRef] [PubMed]
- Suarez, S.S. Mammalian sperm interactions with the female reproductive tract. Cell Tissue Res 2016, 363, 185–194. [Google Scholar] [CrossRef] [PubMed]
- Topfer-Petersen, E.; Ekhlasi-Hundrieser, M.; Tsolova, M. Glycobiology of fertilization in the pig. Int J Dev Biol 2008, 52, 717–736. [Google Scholar] [CrossRef] [PubMed]
- Voshol, H.; van Zuylen, C.W.; Orberger, G.; Vliegenthart, J.F.; Schachner, M. Structure of the HNK-1 carbohydrate epitope on bovine peripheral myelin glycoprotein P0. J Biol Chem 1996, 271, 22957–22960. [Google Scholar] [CrossRef] [PubMed]
- Bakker, H.; Friedmann, I.; Oka, S.; Kawasaki, T.; Nifant'ev, N.; Schachner, M.; Mantei, N. Expression cloning of a cDNA encoding a sulfotransferase involved in the biosynthesis of the HNK-1 carbohydrate epitope. J Biol Chem 1997, 272, 29942–29946. [Google Scholar] [CrossRef]
- Nagase, T.; Shimoda, Y.; Sanai, Y.; Nakamura, S.; Harii, K.; Osumi, N. Differential expression of two glucuronyltransferases synthesizing HNK-1 carbohydrate epitope in the sublineages of the rat myogenic progenitors. Mech Dev 2000, 98, 145–149. [Google Scholar] [CrossRef]
- Nakagawa, N.; Manya, H.; Toda, T.; Endo, T.; Oka, S. Human natural killer-1 sulfotransferase (HNK-1ST)-induced sulfate transfer regulates laminin-binding glycans on alpha-dystroglycan. J Biol Chem 2012, 287, 30823–30832. [Google Scholar] [CrossRef]
- Pasqualini, J.R. Estrogen sulfotransferases in breast and endometrial cancers. Ann N Y Acad Sci 2009, 1155, 88–98. [Google Scholar] [CrossRef]
- Harwalkar, K.; Ford, M.J.; Teng, K.; Yamanaka, N.; Yang, B.; Burtscher, I.; Lickert, H.; Yamanaka, Y. Anatomical and cellular heterogeneity in the mouse oviduct-its potential roles in reproduction and preimplantation developmentdagger. Biol Reprod 2021, 104, 1249–1261. [Google Scholar] [CrossRef]
- La Spina, F.A.; Puga Molina, L.C.; Romarowski, A.; Vitale, A.M.; Falzone, T.L.; Krapf, D.; Hirohashi, N.; Buffone, M.G. Mouse sperm begin to undergo acrosomal exocytosis in the upper isthmus of the oviduct. Dev Biol 2016, 411, 172–182. [Google Scholar] [CrossRef]
- Muro, Y.; Hasuwa, H.; Isotani, A.; Miyata, H.; Yamagata, K.; Ikawa, M.; Yanagimachi, R.; Okabe, M. Behavior of Mouse Spermatozoa in the Female Reproductive Tract from Soon after Mating to the Beginning of Fertilization. Biol Reprod 2016, 94, 80. [Google Scholar] [CrossRef] [PubMed]
- Suarez, S.S. Sperm transport and motility in the mouse oviduct: observations in situ. Biol Reprod 1987, 36, 203–210. [Google Scholar] [CrossRef] [PubMed]
- Cortes, P.P.; Orihuela, P.A.; Zuniga, L.M.; Velasquez, L.A.; Croxatto, H.B. Sperm binding to oviductal epithelial cells in the rat: role of sialic acid residues on the epithelial surface and sialic acid-binding sites on the sperm surface. Biol Reprod 2004, 71, 1262–1269. [Google Scholar] [CrossRef] [PubMed]
- Smith, T.T.; Yanagimachi, R. The viability of hamster spermatozoa stored in the isthmus of the oviduct: the importance of sperm-epithelium contact for sperm survival. Biol Reprod 1990, 42, 450–457. [Google Scholar] [CrossRef]
- Suarez, S.S. Regulation of sperm storage and movement in the mammalian oviduct. Int J Dev Biol 2008, 52, 455–462. [Google Scholar] [CrossRef]
- Holt, W.V.; Fazeli, A. The oviduct as a complex mediator of mammalian sperm function and selection. Mol Reprod Dev 2010, 77, 934–943. [Google Scholar] [CrossRef]
- Muzio, G.; Maggiora, M.; Paiuzzi, E.; Oraldi, M.; Canuto, R.A. Aldehyde dehydrogenases and cell proliferation. Free Radic Biol Med 2012, 52, 735–746. [Google Scholar] [CrossRef]
- Kurys, G.; Ambroziak, W.; Pietruszko, R. Human aldehyde dehydrogenase. Purification and characterization of a third isozyme with low Km for gamma-aminobutyraldehyde. J Biol Chem 1989, 264, 4715–4721. [Google Scholar] [CrossRef]
- Jin, J.Y.; Chen, W.Y.; Zhou, C.X.; Chen, Z.H.; Yu-Ying, Y.; Ni, Y.; Chan, H.C.; Shi, Q.X. Activation of GABAA receptor/Cl- channel and capacitation in rat spermatozoa: HCO3- and Cl- are essential. Syst Biol Reprod Med 2009, 55, 97–108. [Google Scholar] [CrossRef]
- Kurata, S.; Hiradate, Y.; Umezu, K.; Hara, K.; Tanemura, K. Capacitation of mouse sperm is modulated by gamma-aminobutyric acid (GABA) concentration. J Reprod Dev 2019, 65, 327–334. [Google Scholar] [CrossRef]
- Puente, M.A.; Tartaglione, C.M.; Ritta, M.N. Bull sperm acrosome reaction induced by gamma-aminobutyric acid (GABA) is mediated by GABAergic receptors type A. Anim Reprod Sci 2011, 127, 31–37. [Google Scholar] [CrossRef] [PubMed]
- Shi, Q.X.; Yuan, Y.Y.; Roldan, E.R. gamma-Aminobutyric acid (GABA) induces the acrosome reaction in human spermatozoa. Mol Hum Reprod 1997, 3, 677–683. [Google Scholar] [CrossRef] [PubMed]
- Martin del Rio, R. Gamma-aminobutyric acid system in rat oviduct. J Biol Chem 1981, 256, 9816–9819. [Google Scholar] [CrossRef] [PubMed]
- Orensanz, L.M.; Fernandez, I.; Martin del Rio, R.; Storm-Mathisen, J. Gamma-aminobutyric acid in the rat oviduct. Adv Biochem Psychopharmacol 1986, 42, 265–274. [Google Scholar]
- Koncitikova, R.; Vigouroux, A.; Kopecna, M.; Sebela, M.; Morera, S.; Kopecny, D. Kinetic and structural analysis of human ALDH9A1. Biosci Rep 2019, 39. [Google Scholar] [CrossRef]
- Fernandez, C.; Sharrard, R.M.; Talbot, M.; Reed, B.D.; Monks, N. Evaluation of the significance of polyamines and their oxidases in the aetiology of human cervical carcinoma. Br J Cancer 1995, 72, 1194–1199. [Google Scholar] [CrossRef]
- Mann, T. Secretory function of the prostate, seminal vesicle and other male accessory organs of reproduction. J Reprod Fertil 1974, 37, 179–188. [Google Scholar] [CrossRef]
- Breitbart, H.; Rubinstein, S.; Lax, Y. Regulatory mechanisms in acrosomal exocytosis. Rev Reprod 1997, 2, 165–174. [Google Scholar] [CrossRef]
- Rubinstein, S.; Breitbart, H. Role of spermine in mammalian sperm capacitation and acrosome reaction. Biochem J 1991, 278 ( Pt 1) Pt 1, 25–28. [Google Scholar] [CrossRef]
- Shabtay, O.; Breitbart, H. CaMKII prevents spontaneous acrosomal exocytosis in sperm through induction of actin polymerization. Dev Biol 2016, 415, 64–74. [Google Scholar] [CrossRef]
- Cervantes, M.P.; Palomino, J.M.; Adams, G.P. In vivo imaging in the rabbit as a model for the study of ovulation-inducing factors. Lab Anim 2015, 49, 1–9. [Google Scholar] [CrossRef] [PubMed]
- Gunnet, J.W.; Freeman, M.E. The mating-induced release of prolactin: a unique neuroendocrine response. Endocr Rev 1983, 4, 44–61. [Google Scholar] [CrossRef] [PubMed]
- Shafik, A.; El Sebai, O.; Shafik, A.A.; Shafik, I. Oviduct contractile response to vaginal distension: identification of vagino-tubal reflex. Arch Gynecol Obstet 2005, 271, 148–151. [Google Scholar] [CrossRef]
- Blandau, R.J.; Money, W.L. Observations on the rate of transport of spermatozoa in the female genital tract of the rat The Anatomical Record 1944, 90, 255-260. [CrossRef]
- Kovarik, A.; Hlubinova, K.; Vrbenska, A.; Prachar, J. An improved colloidal silver staining method of protein blots on nitrocellulose membranes. Folia Biol (Praha) 1987, 33, 253–257. [Google Scholar] [PubMed]
- Schindelin, J.; Arganda-Carreras, I.; Frise, E.; Kaynig, V.; Longair, M.; Pietzsch, T.; Preibisch, S.; Rueden, C.; Saalfeld, S.; Schmid, B.; et al. Fiji: an open-source platform for biological-image analysis. Nat Methods 2012, 9, 676–682. [Google Scholar] [CrossRef]
Figure 1.
Mating increases the CHST10 protein level in the oviductal mucosa. Western blot of samples obtained from the oviductal mucosa of unmated (UM1-4) and mated (M1-4) rats. Biological replicates for each group, n = 4. The bar graph represents the intensities of the three CHST10 isoforms detected by western blot normalized to that of TUBB. IQR: Interquartile range.
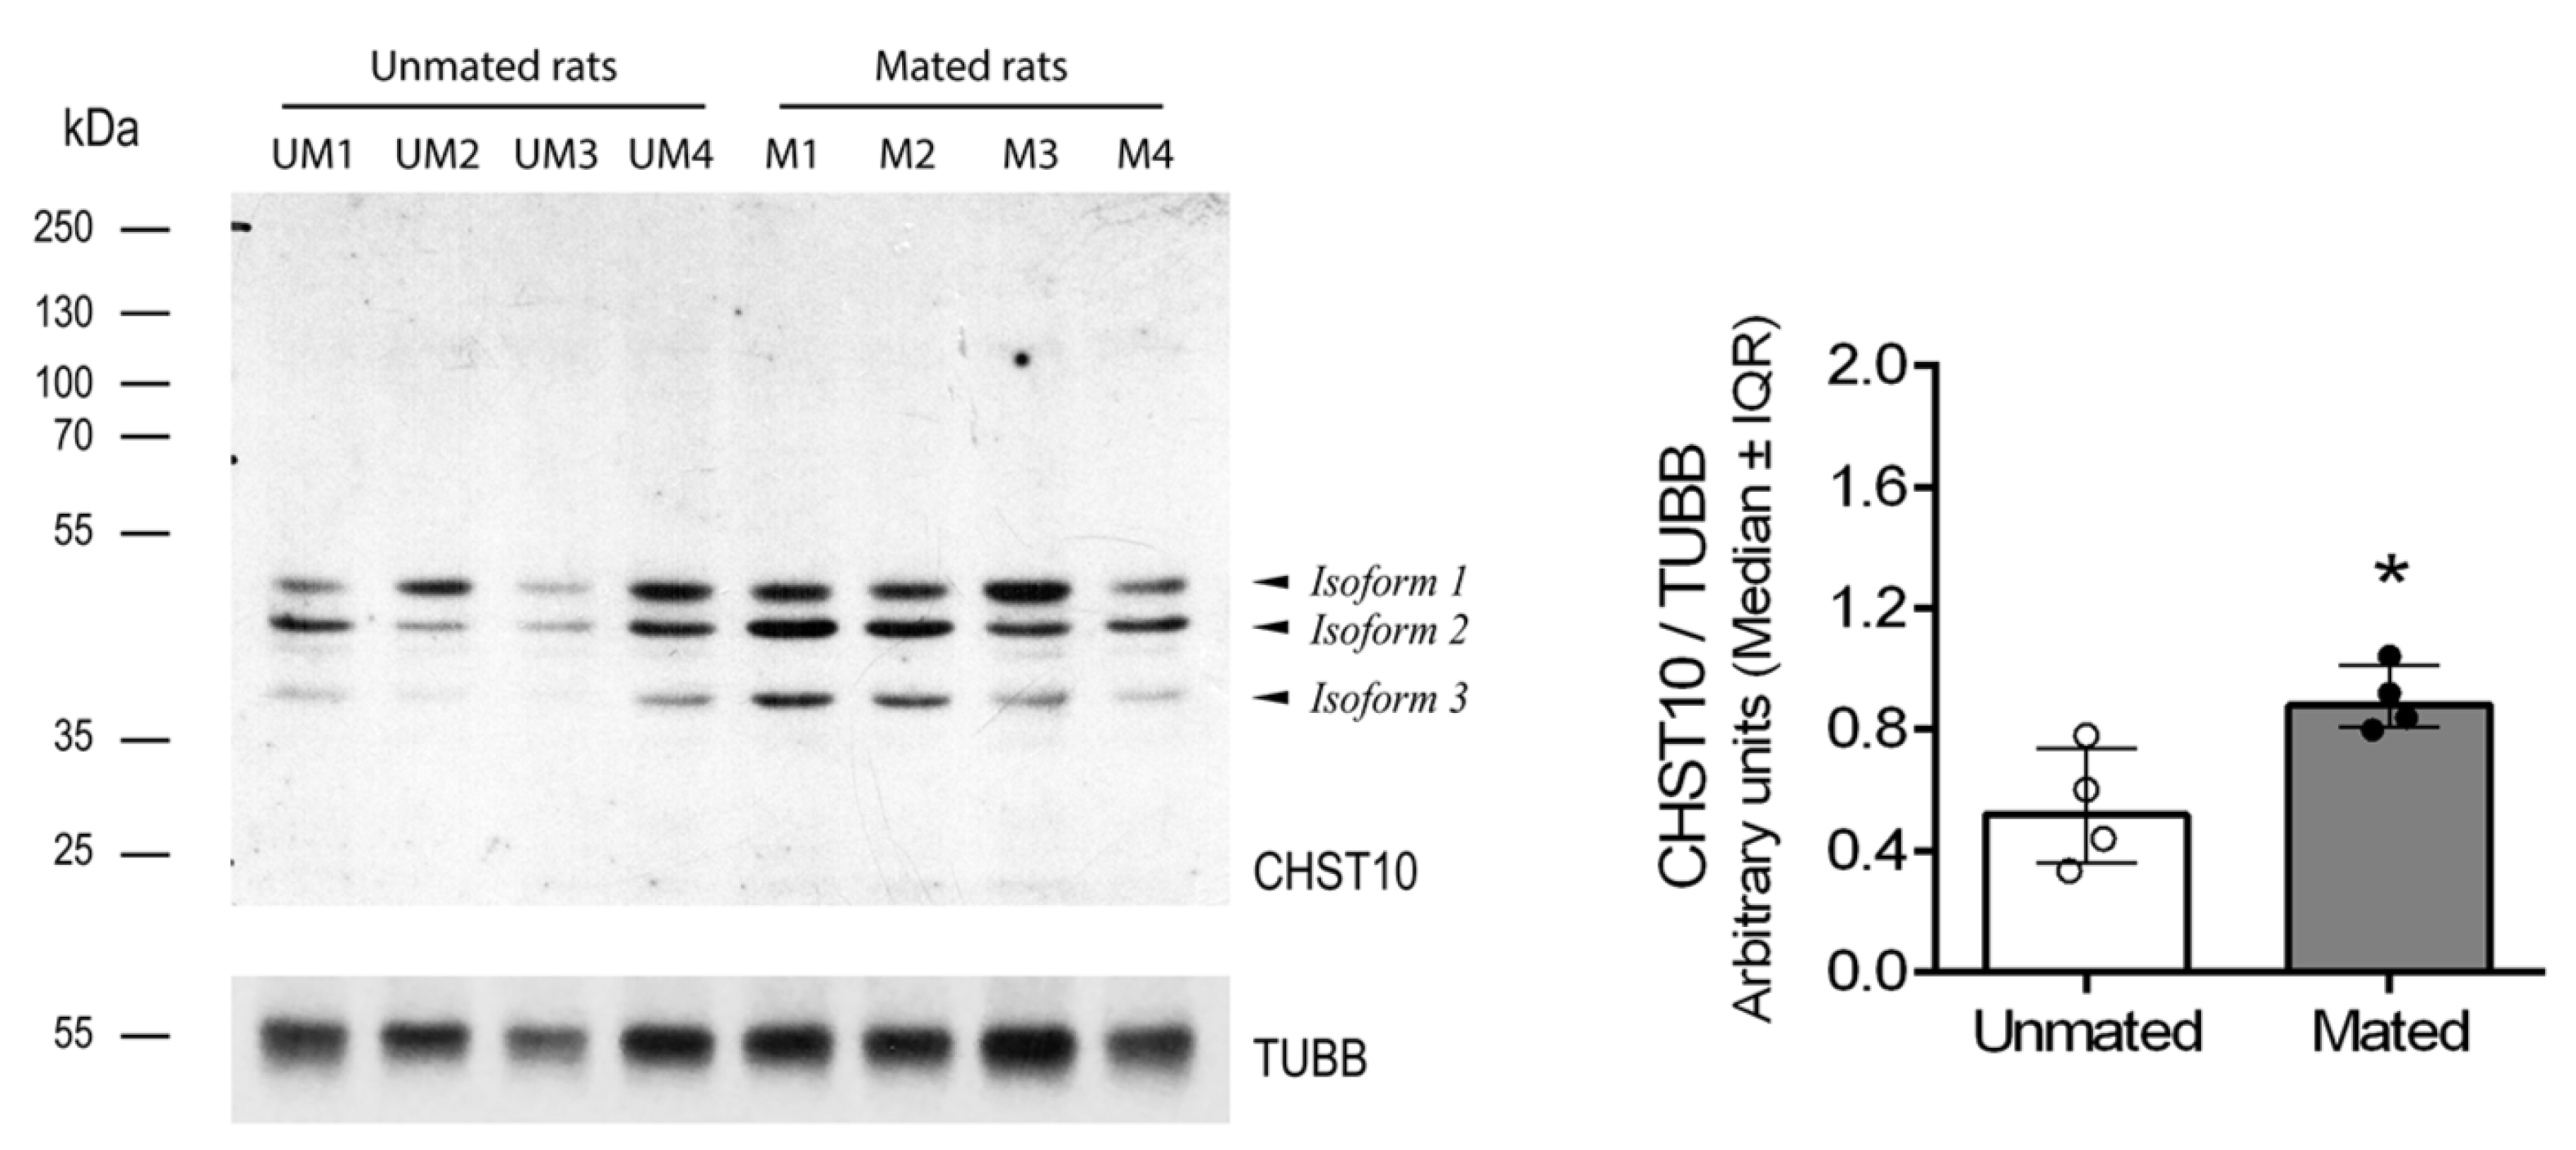
Figure 2.
Expression of CHST10 in the oviduct. CHST10 was detected in oviductal sections obtained from unmated and mated rats via immunofluorescence. The panels show the merged red and blue fluorescence. CHST10: red; and nuclear staining: blue. First row: ampulla; second row: isthmus; and third row: utero-tubal junction (UTJ). The panels in the left column are the negative controls. White arrowheads: immune cells in negative controls; red arrowheads: CHST10 signal resembling the Golgi apparatus location; red arrows: CHST10 in the epithelium cytoplasm. L, Lumen; E, mucosa layer; M, muscular layer. Original magnification, 20× (scale bar, 75 μm). Only the right panels display the image at 63× magnification (scale bar, 25 μm). Images are representative of three independent experiments.
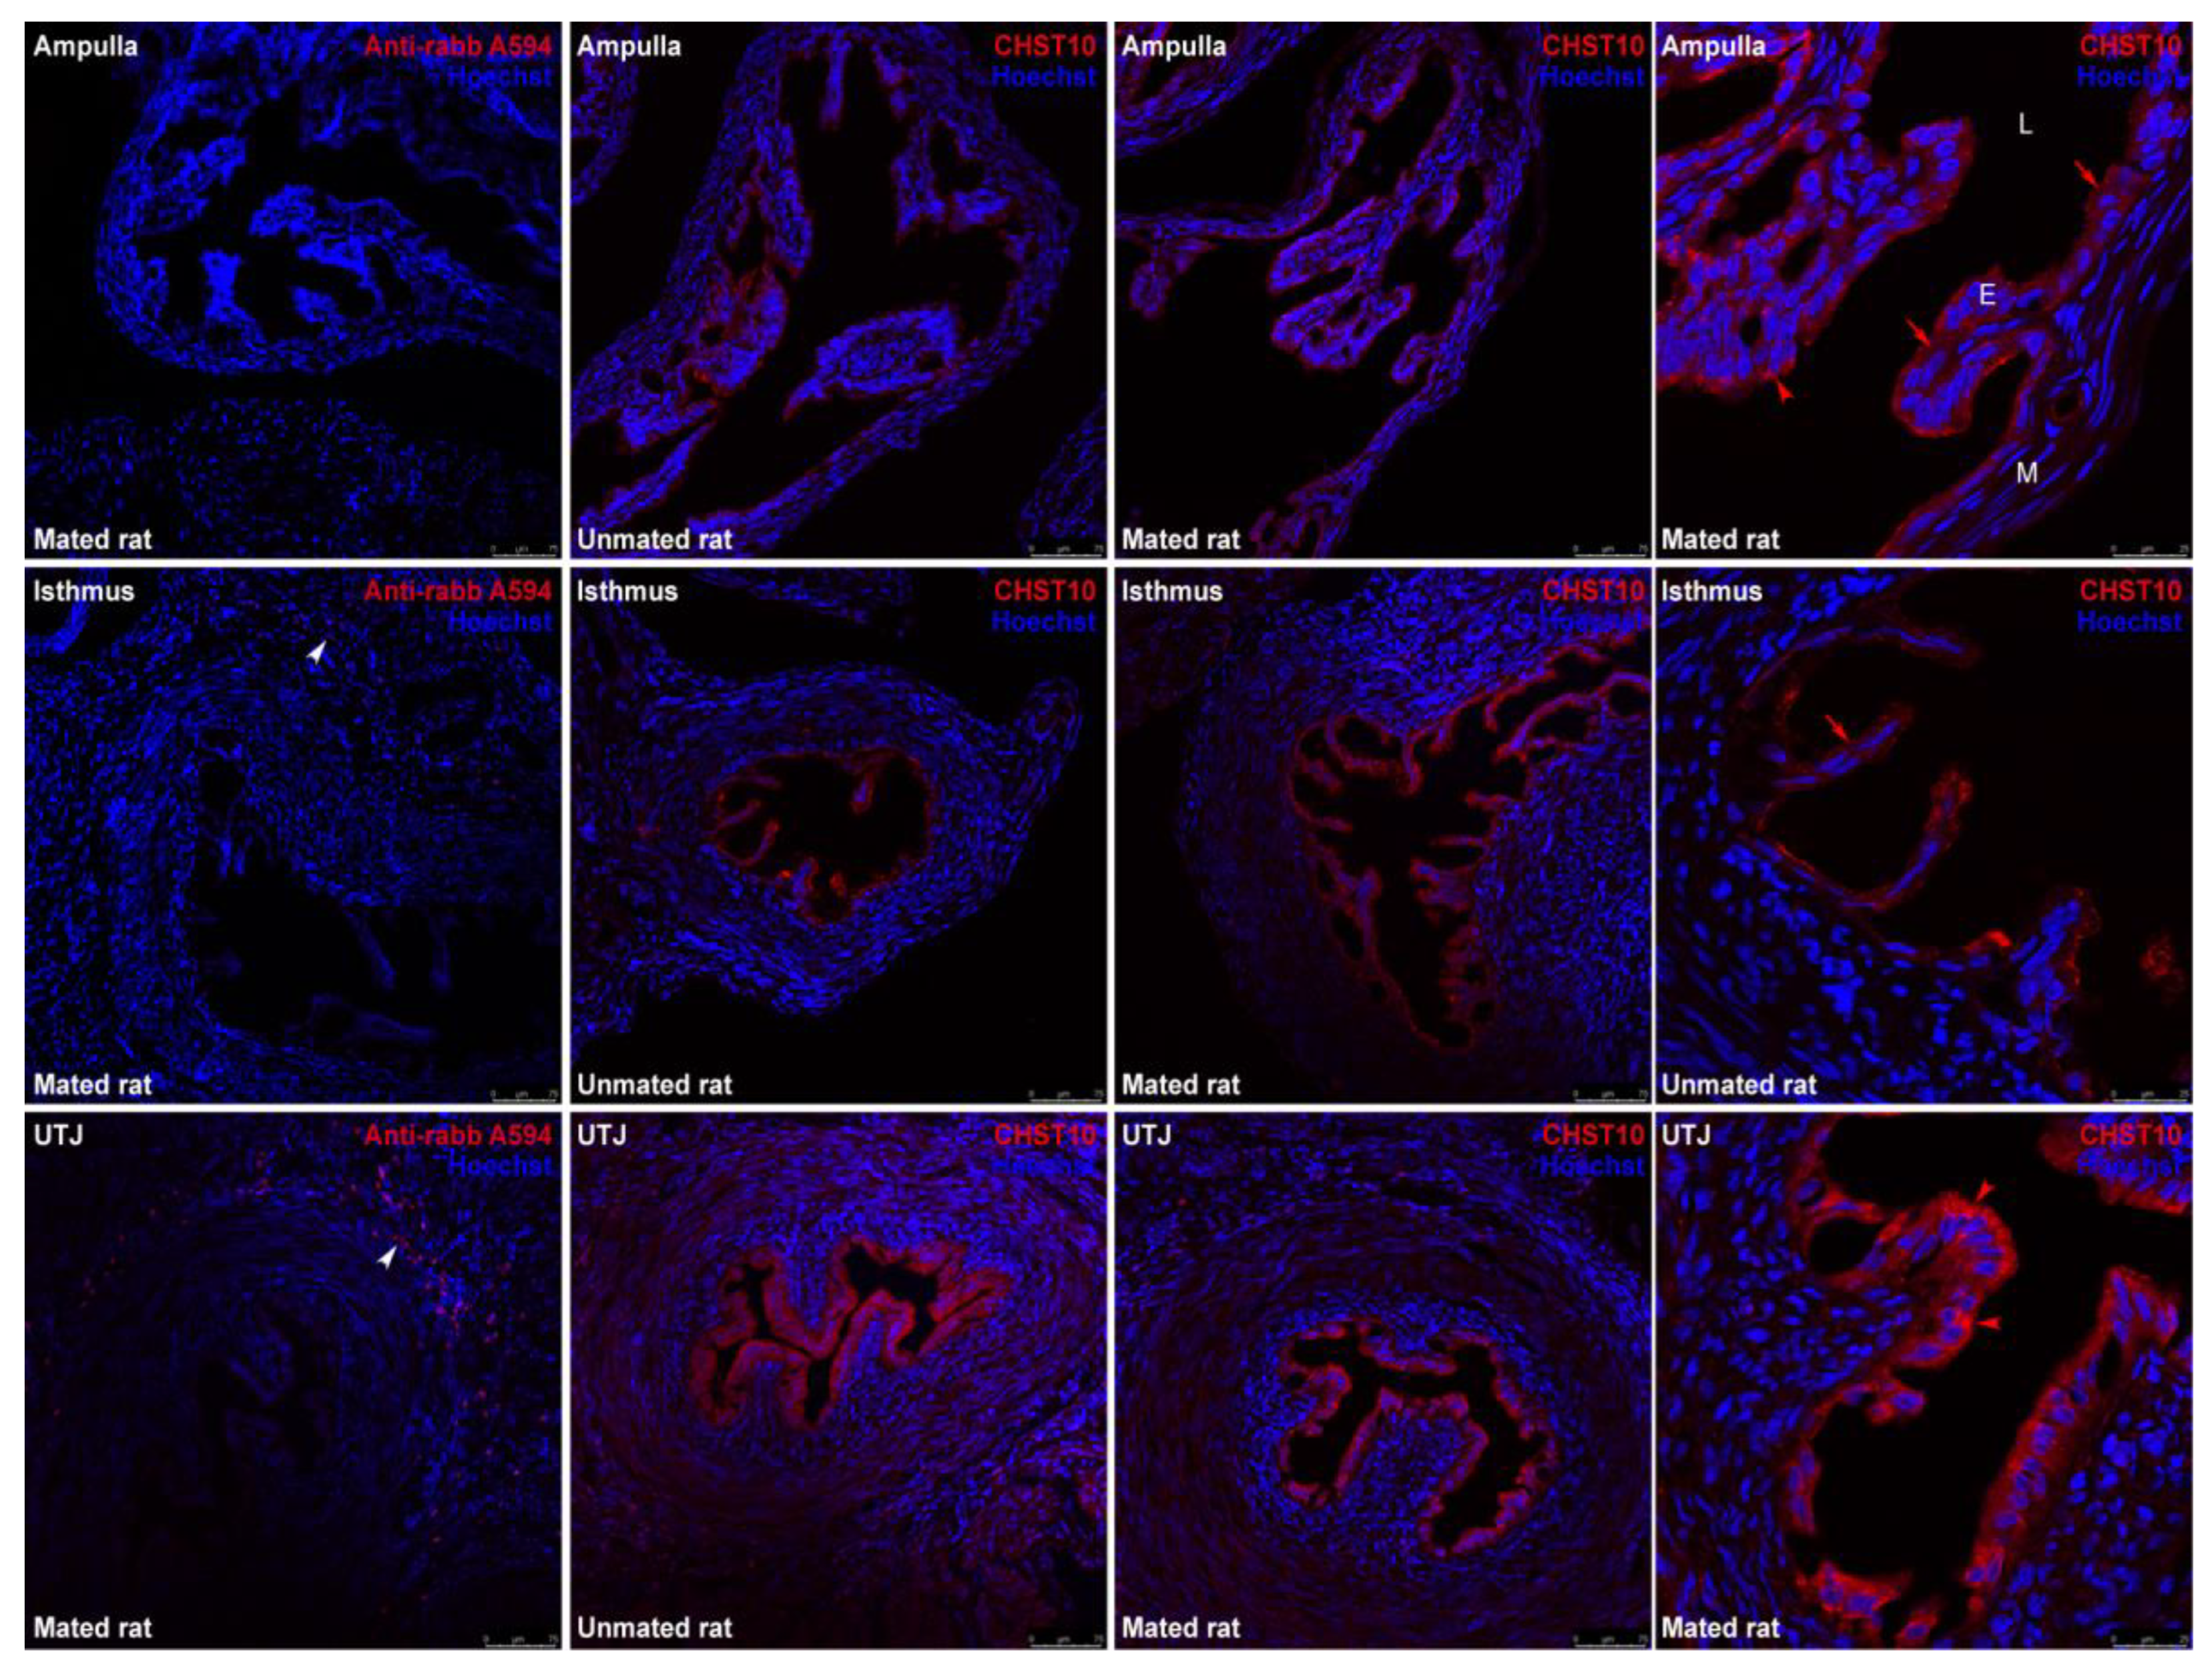
Figure 3.
Mating increases the CHST10 activity in the oviductal mucosa. (A) Michaelis‒Menten kinetics of human recombinant CHST10 to evaluate specific acceptor substrates. PGA: phenolphthalein glucuronic acid; E23G: 17b-estradiol 3-[b-D-glucuronide]. Biological replicates for each group, n = 3. (B) Pattern of acceptor substrate preferences for CHST10 (left) and total protein from the oviductal mucosa of unmated rats (right). CSA: chondroitin sulfate A; E2: 17b-estradiol; E217G: 17b-estradiol 17-[b-D-glucuronide]; DMSO: dimethyl sulfoxide. Biological replicates for each group, n = 3. (C) Plots of sulfotransferase activity measured in the oviductal mucosa of unmated and mated rats using PGA and E23G as acceptor substrates. Biological replicates for each group, n = 8.
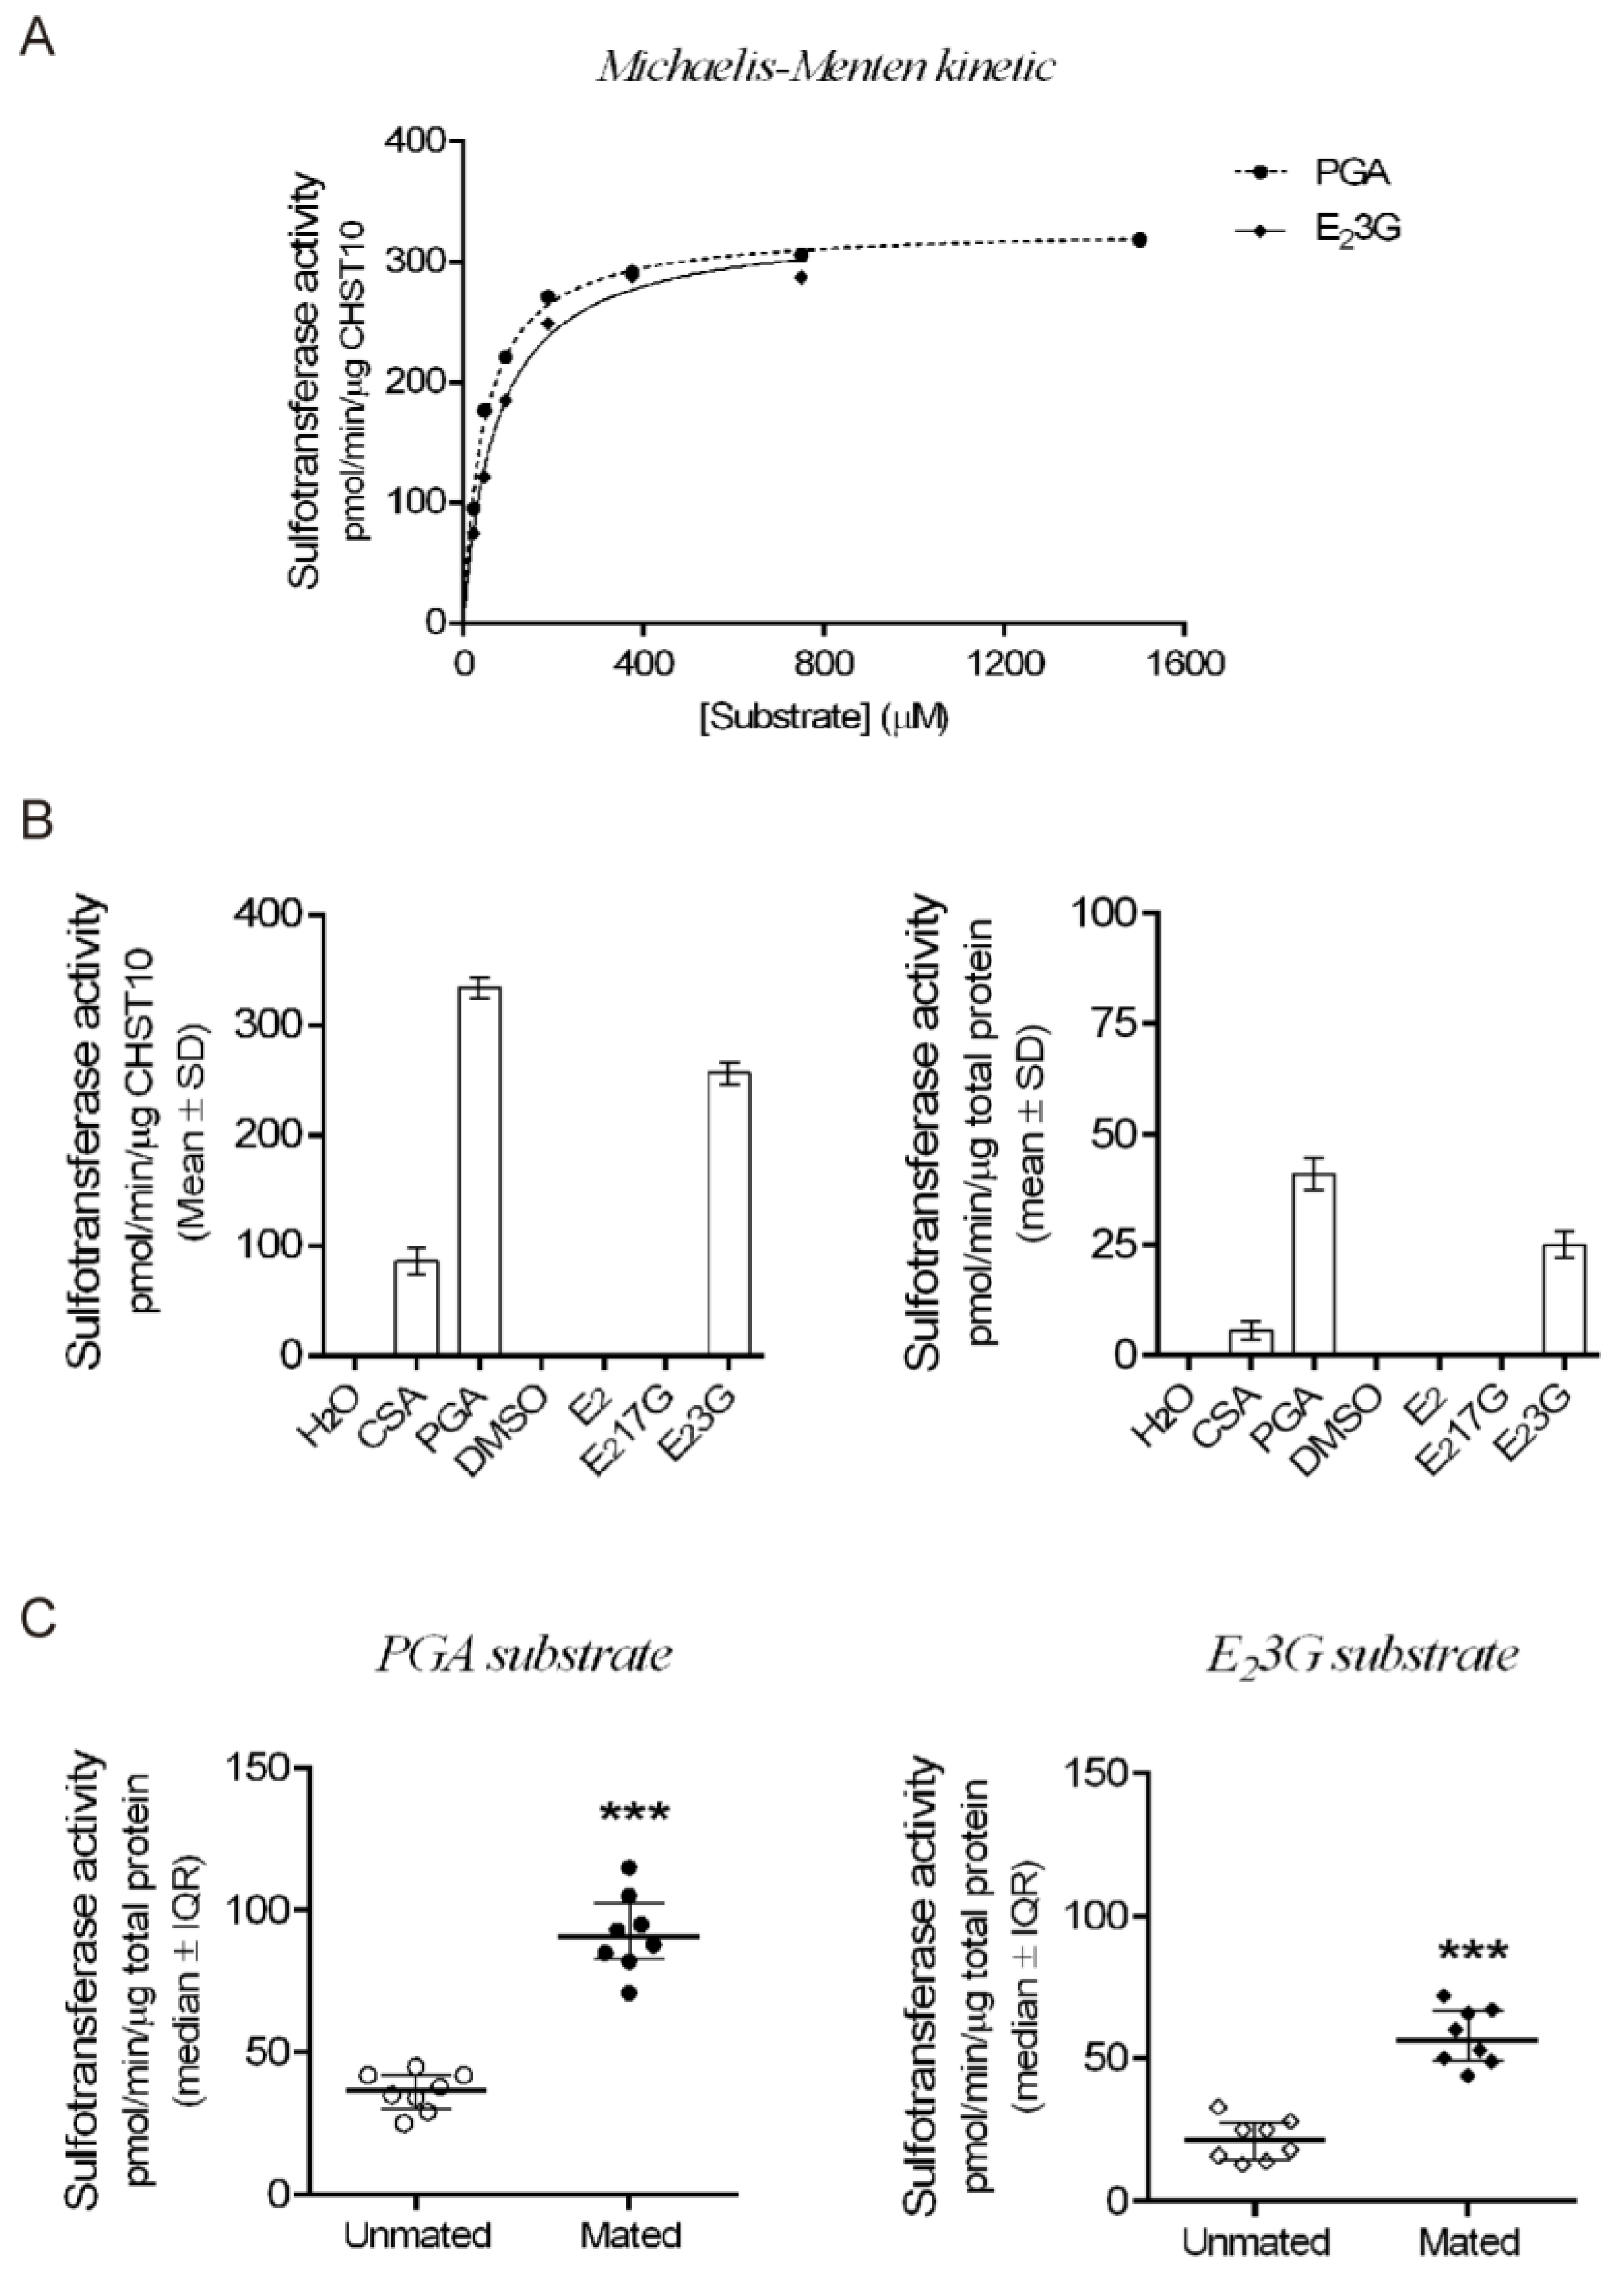
Figure 4.
Expression of HNK-1 moieties in the oviduct. Immunofluorescence images of the HNK-1 moiety in oviductal sections obtained from unmated and mated rats. The panels show merged green and blue fluorescence. HNK-1 moiety: green; and nuclear staining: blue. First row: ampulla; second row: isthmus; original magnifications are 20× and 40×, respectively (scale bar, 75 μm). The square in the middle panels is the location of the magnified image displayed in the right panel, original magnification, 63× (scale bar, 25 μm). Green arrows: apical location of HNK-1 moieties in epithelial cells; green arrowhead: luminal location of HNK-1 moieties; yellow arrowhead: acrosome-intact sperm in the lumen; asterisks: HNK-1 moieties located in the trenches of the mucosal folds. L: Lumen; E: mucosa layer; M: muscular layer.
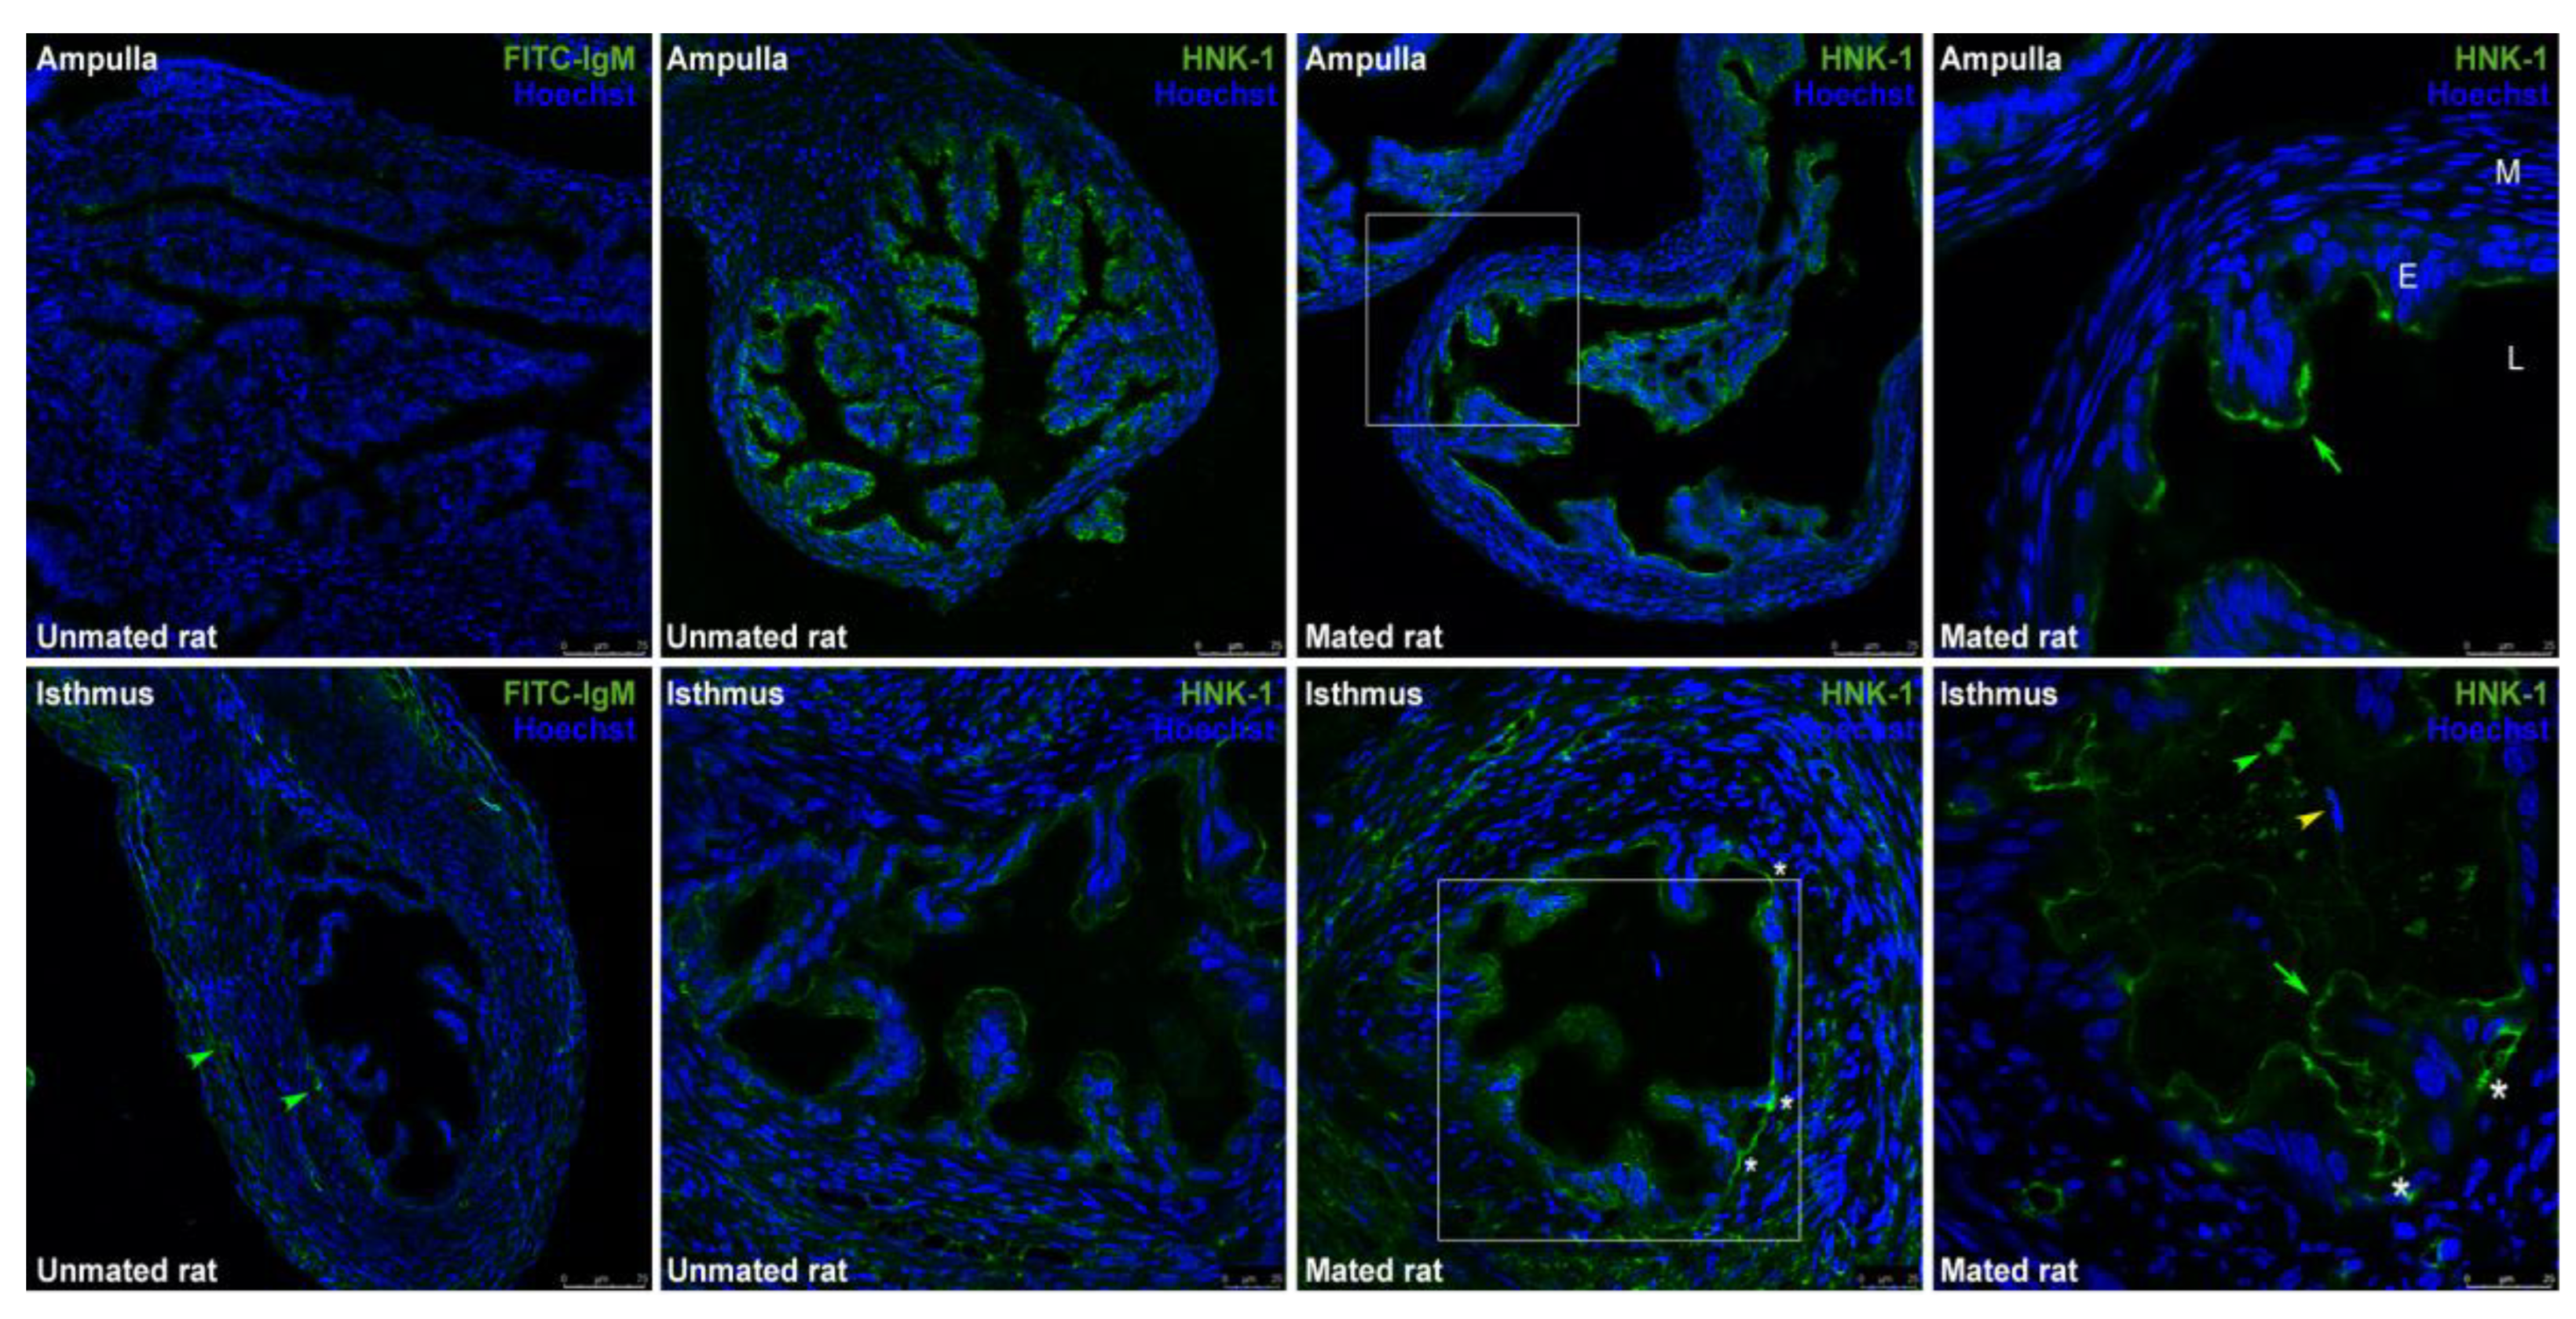
Figure 5.
Mating changes the levels of HNK-1 glycoproteins in the oviductal mucosa. (A) Western blotting via 1D electrophoresis was used to evaluate HNK-1 glycoproteins in the cellular pool of proteins from the oviductal mucosa. Biological replicates for each group, n = 4. The bar graph presents the intensity of band 1 (130 kDa) normalized to that of TUBB. (B) Western blotting via 1D electrophoresis to evaluate HNK-1 glycoproteins in the secreted pool of proteins from the oviductal mucosa. Biological replicates for each group, n = 4. The bar graph shows the intensity of band 2 (55 kDa) normalized to that of the total proteins with molecular weights less than 37 kDa, as detected by silver staining of the nitrocellulose membrane.
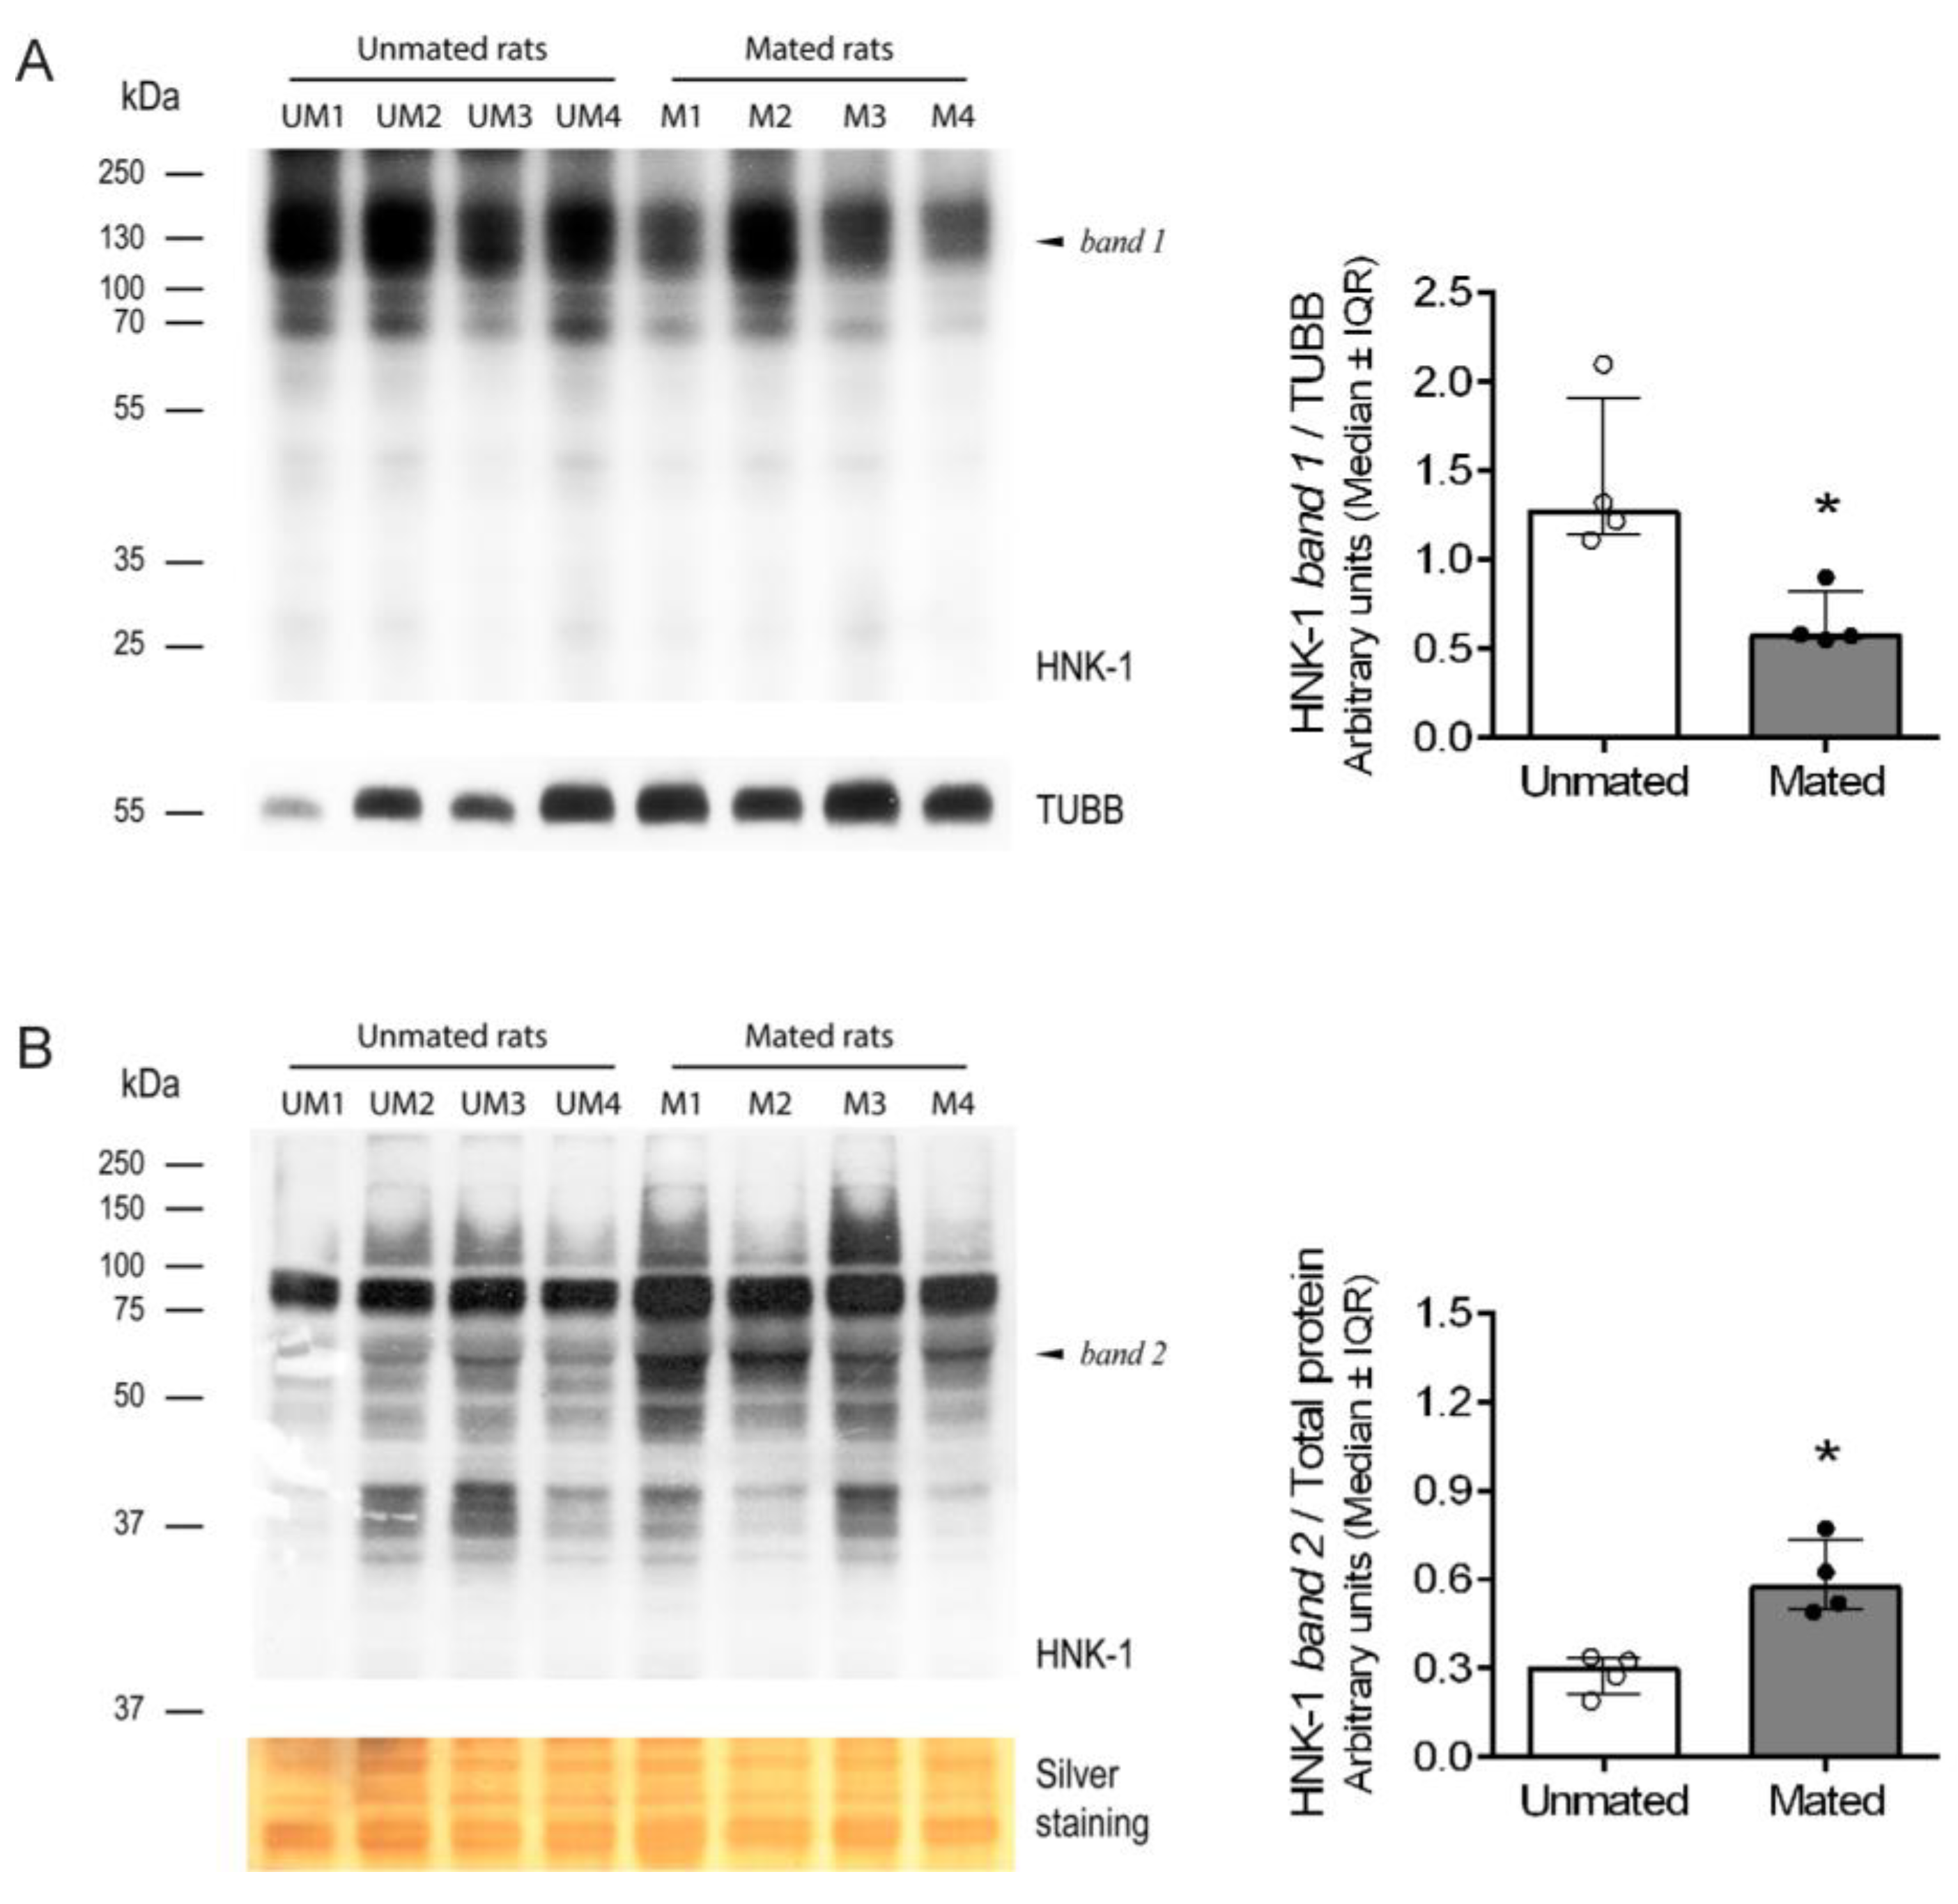
Figure 6.
Mating changes the levels of HNK-1 glycoproteins secreted from the oviductal mucosa. Western blotting via 2D electrophoresis of samples from unmated (upper) and mated (lower) rats. Several HNK-1-positive spots were detected in both samples. Black arrowheads: mating induced spots; green arrowheads: spots with increased intensities because of mating; red arrowheads: spots with decreased intensities because of mating; and white arrowheads: spots with any change in intensities between samples.
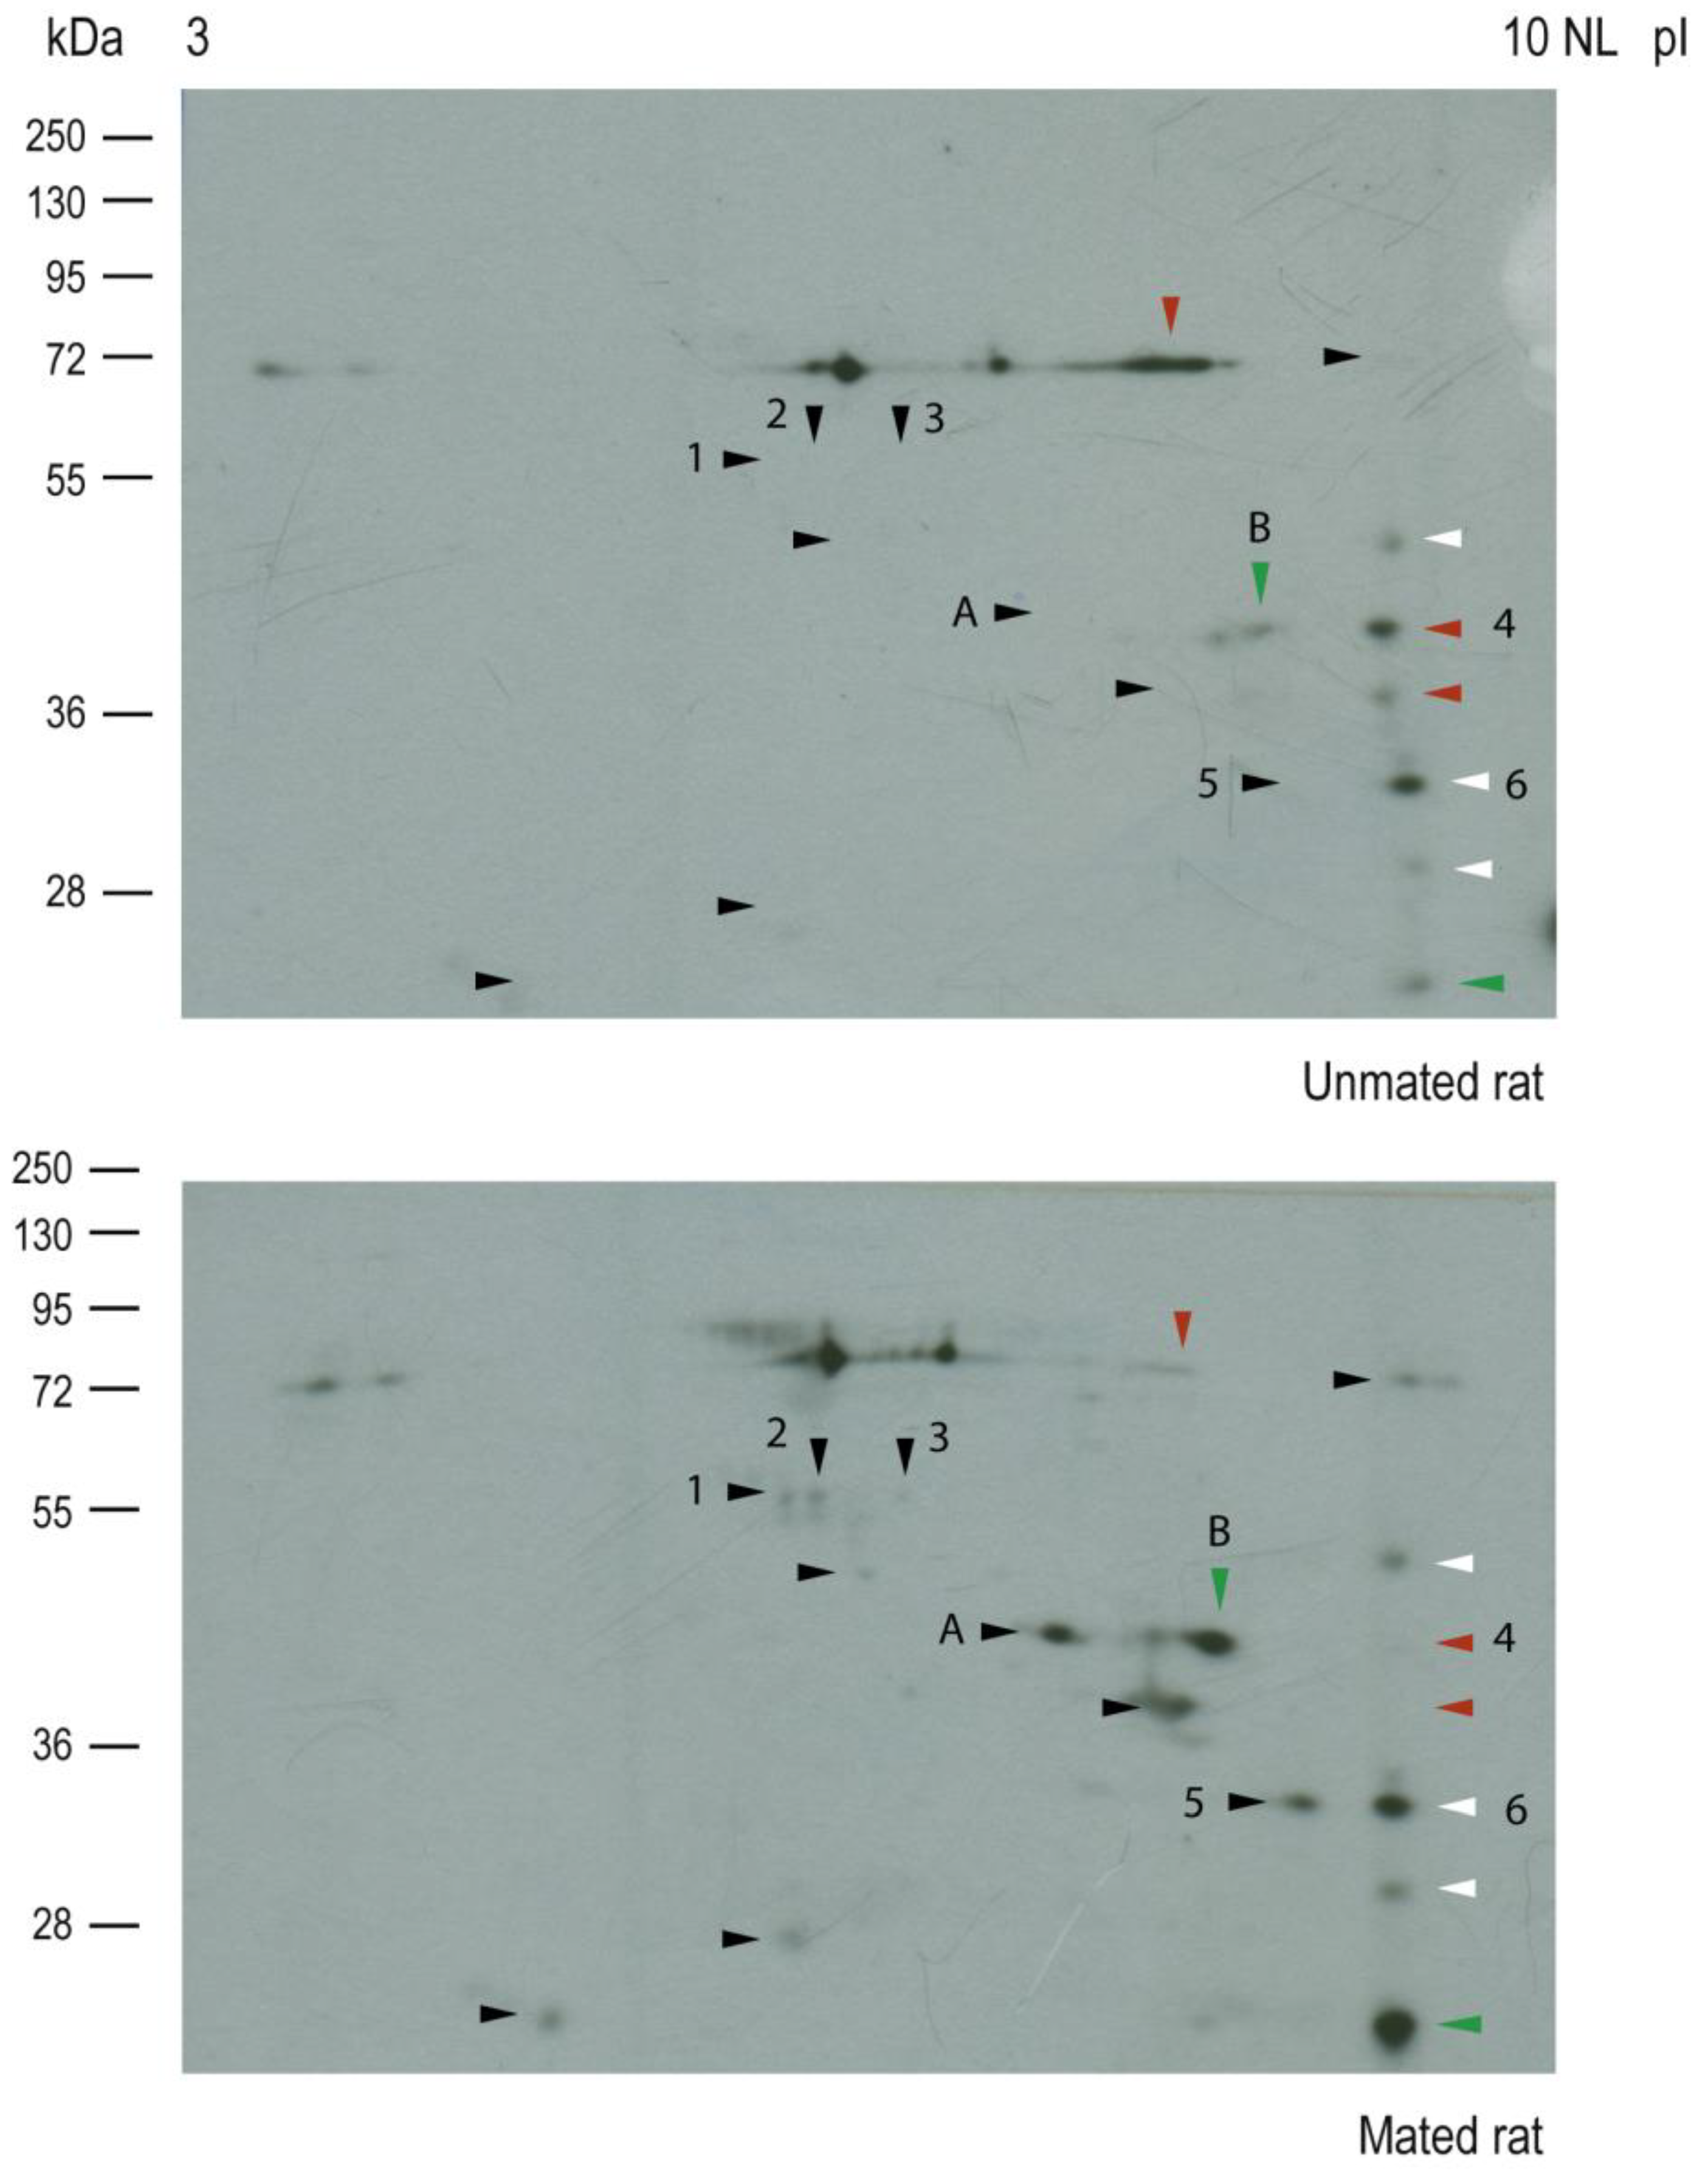
Figure 7.
Mating changes the protein core levels of HNK-1 glycoproteins secreted from the oviductal mucosa. Silver staining was performed on the membranes used for western blotting, as shown in Figure 6. Arrowheads: HNK-1 glycoproteins.
Figure 7.
Mating changes the protein core levels of HNK-1 glycoproteins secreted from the oviductal mucosa. Silver staining was performed on the membranes used for western blotting, as shown in Figure 6. Arrowheads: HNK-1 glycoproteins.
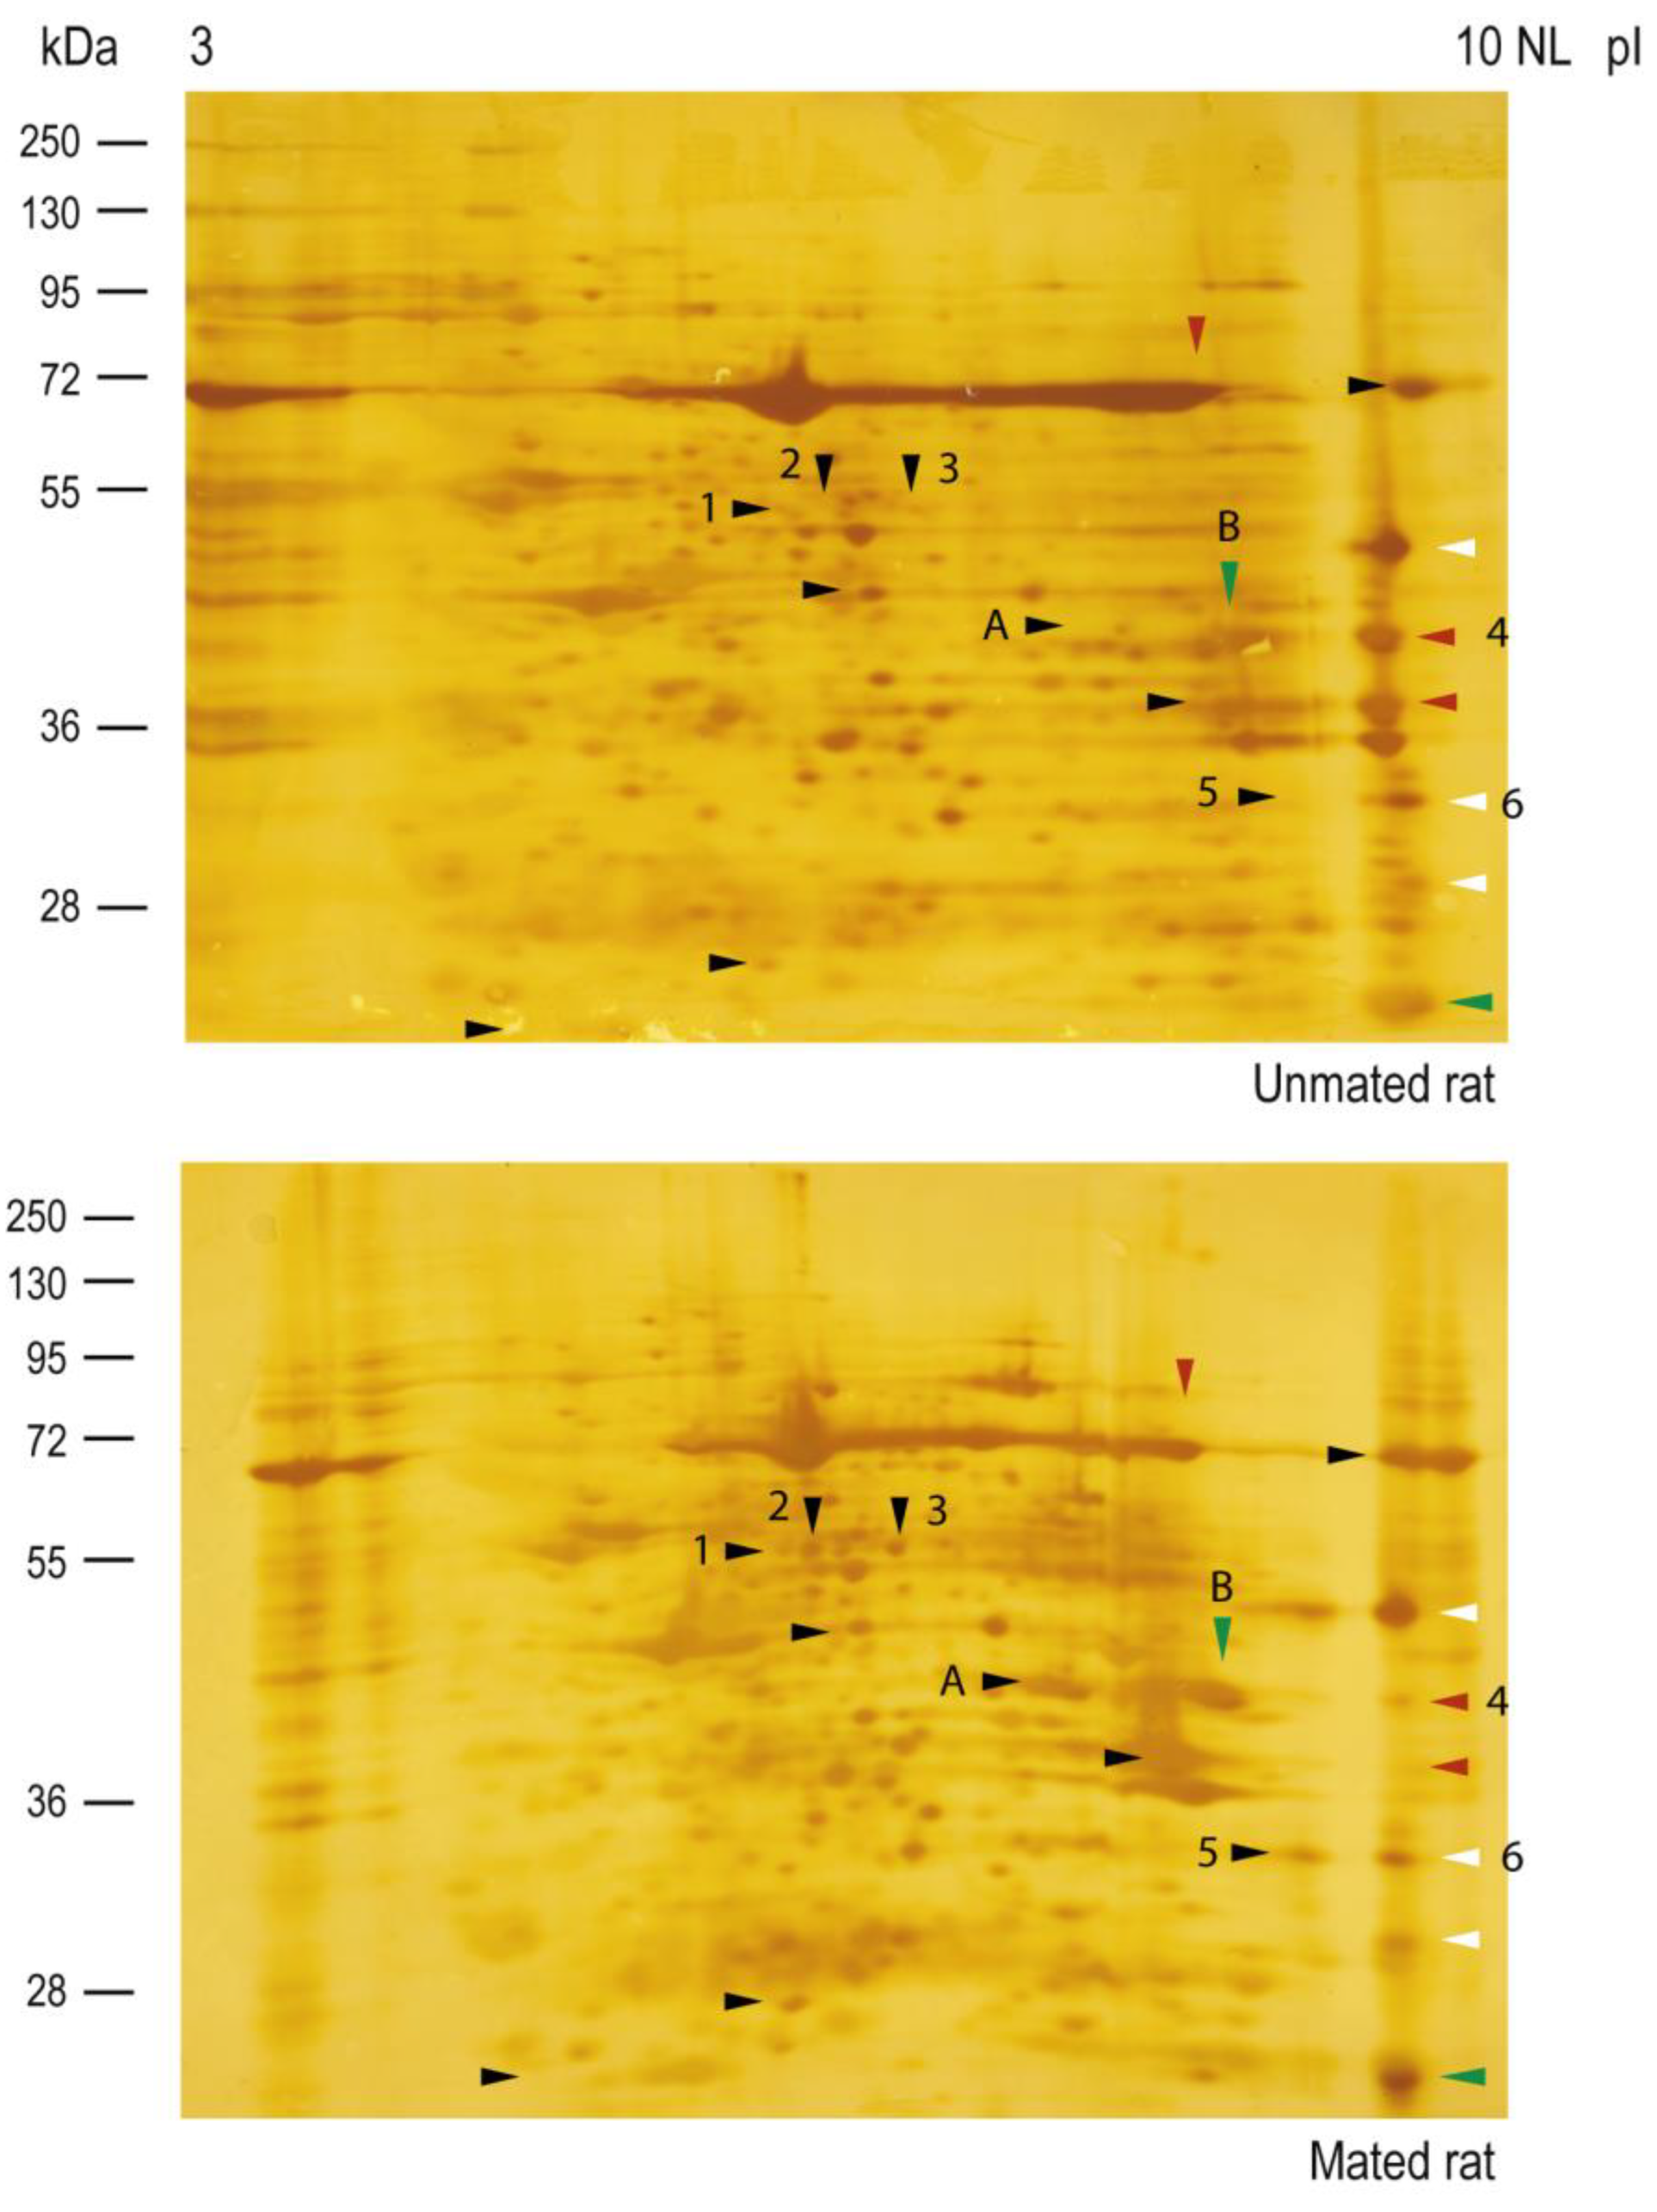
Figure 8.
Mating changes the levels of ALDH9A1 and ALDOA in the secreted pool of proteins from the oviductal mucosa. (A) ALDH9A1 western blot of samples (40 µg each) obtained from the oviductal mucosa of unmated (UM1-4) and mated (M1-4) (upper panel). Biological replicates for each group, n = 4. The bar graph represents the intensity of the unique ALDH9A1 band (arrowhead) normalized to the total protein (TP) intensity between 40 and 60 kDa, as detected by Ponceau red staining of the nitrocellulose membrane (lower panel). (B) ALDOA western blot of samples (10 µg each) obtained from the oviductal mucosa of unmated (UM5-8) and mated (M5-8) rats (upper panel). Biological replicates for each group, n = 4. The bar graph represents the intensity of the unique band (arrowhead) normalized to the TP intensity between 60 and 100 kDa, as detected by Ponceau red staining of the nitrocellulose membrane (lower panel).
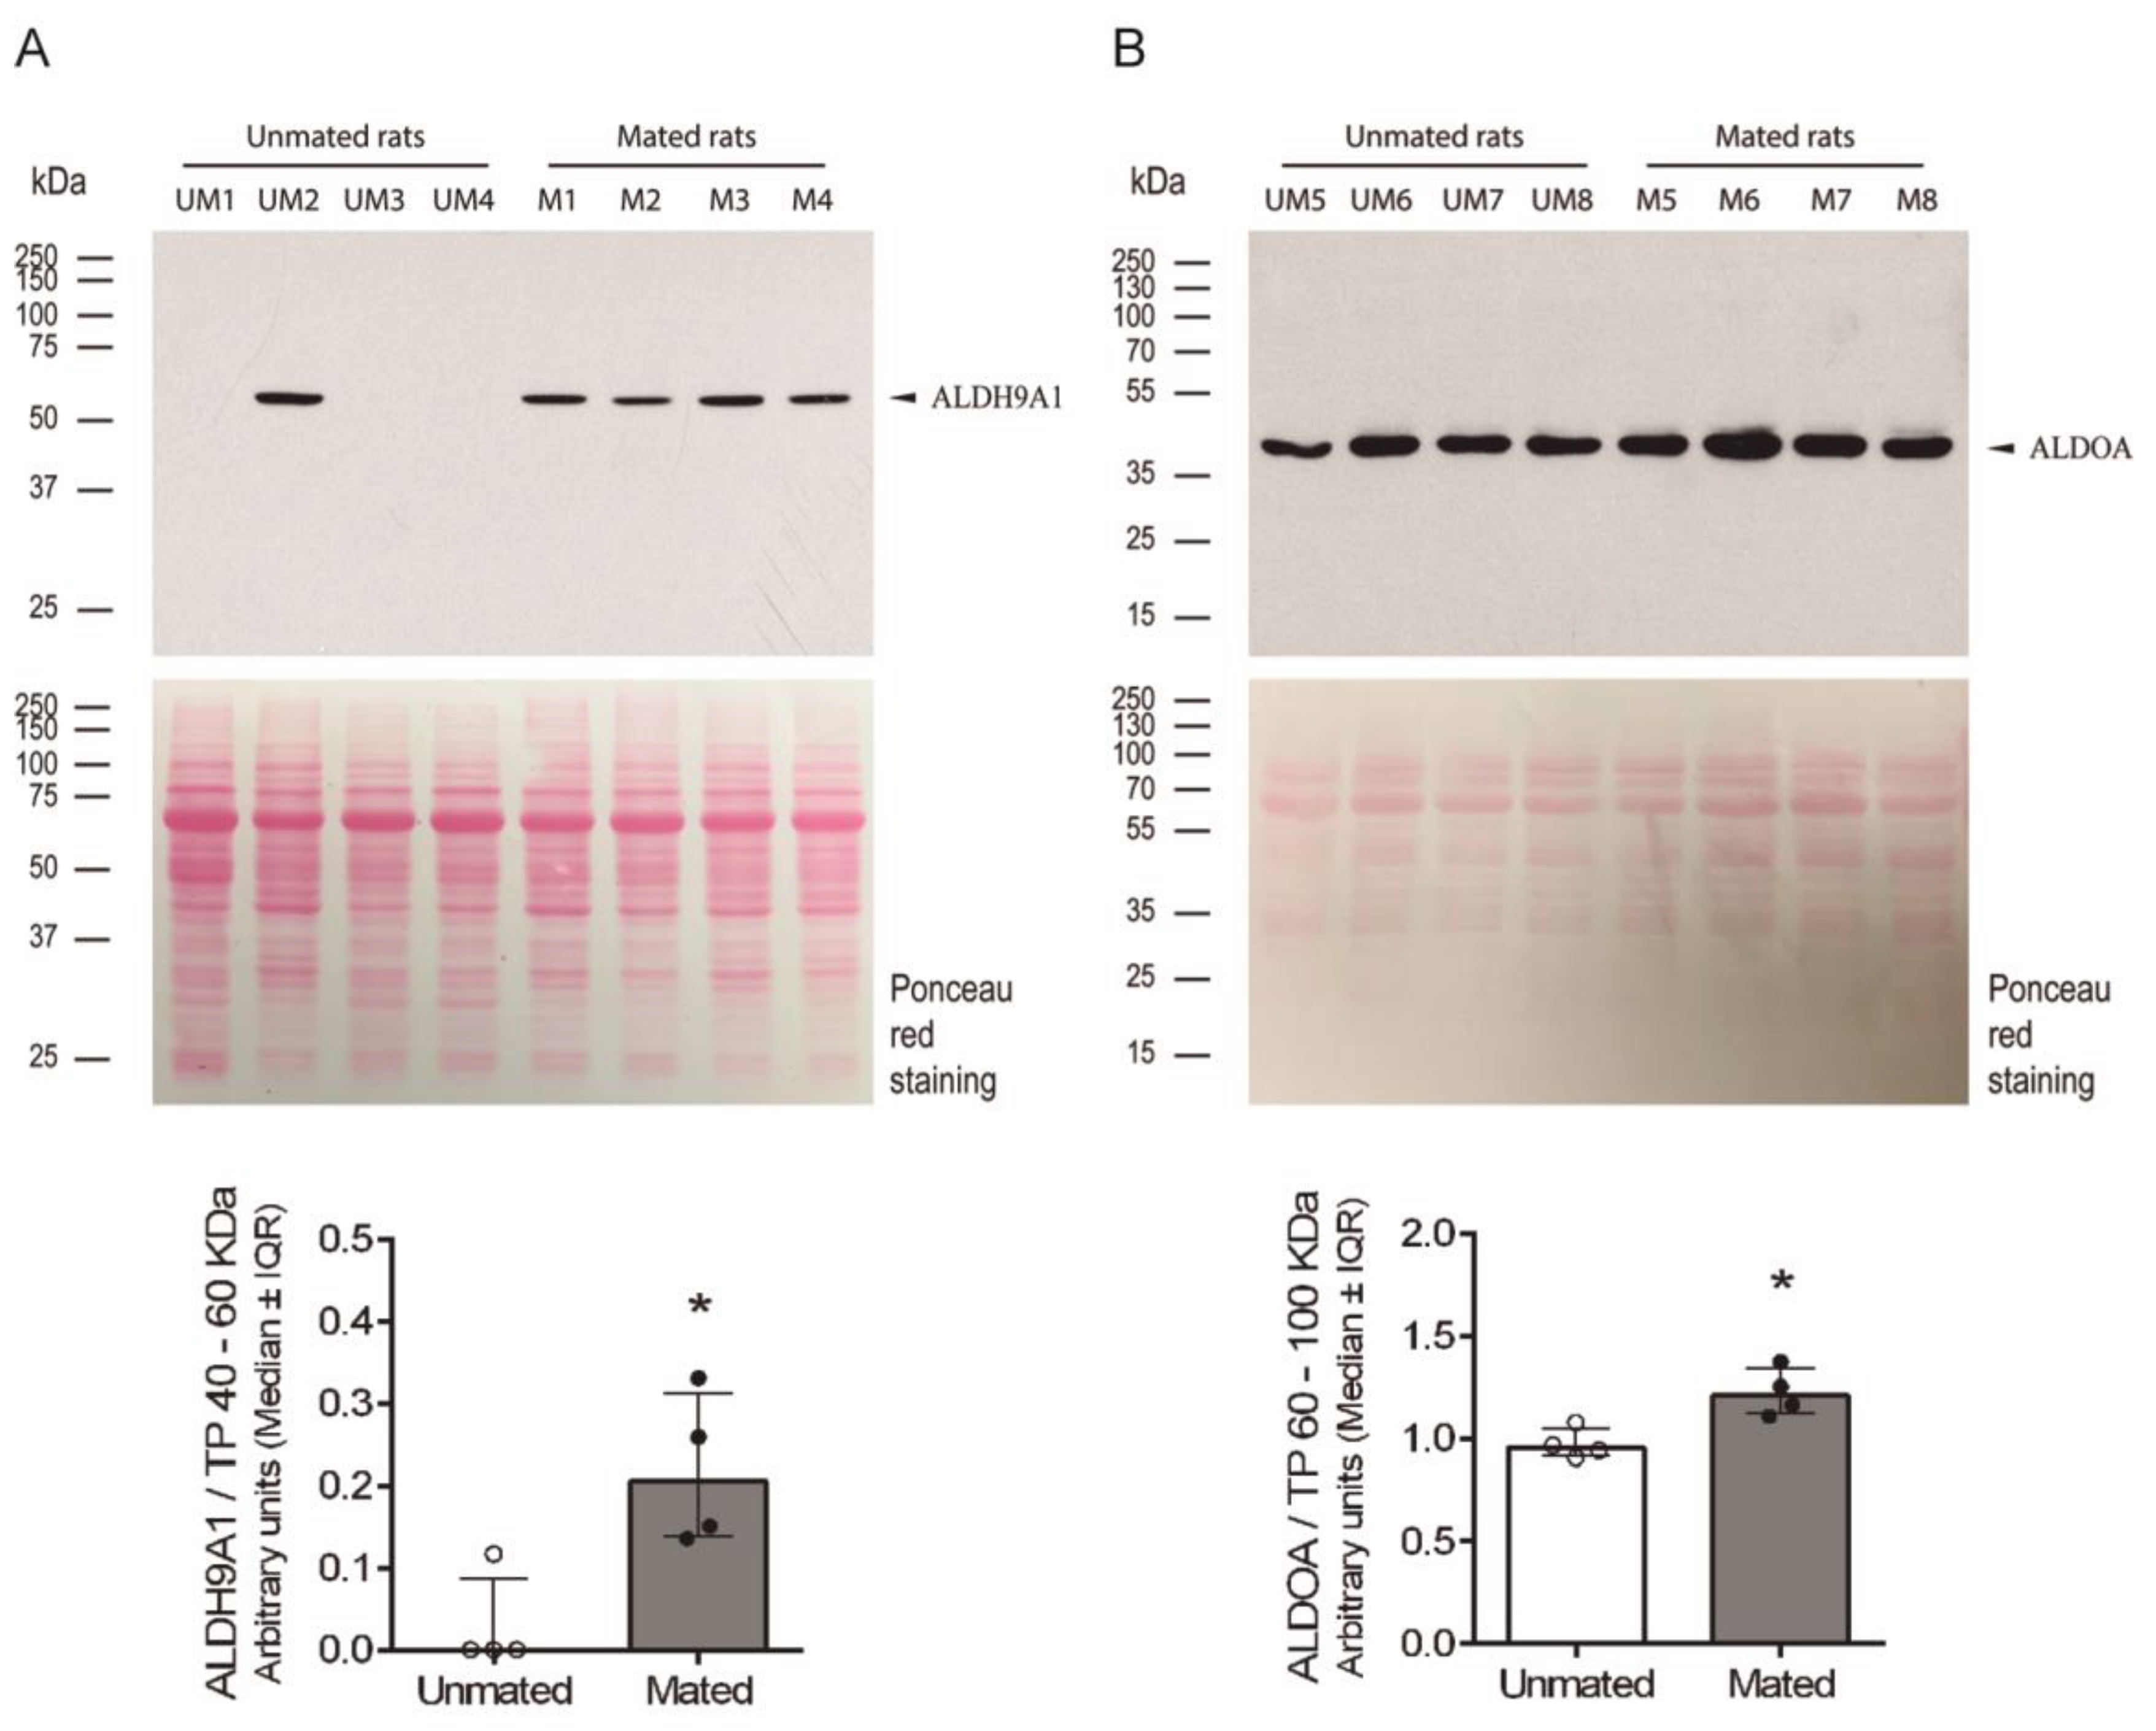
Figure 9.
Expression patterns of the HNK-1 glycoproteins ALDH9A1 and ALDOA in the oviductal mucosa of mated rats. The HNK-1 moiety, ALDH9A1, ALDOA and TUBB were detected via immunofluorescence. In all panels, blue fluorescence corresponds to Hoechst nuclear staining. First row: signals from ALDH9A1 (red) and HNK-1 (green). The square in the UTJ panel is the location of the magnified image displayed in the second row. Asterisk: colocalization of the HNK-1 and ALDH9A1 signals in the isthmus. L, Lumen; E, mucosa layer; M, muscular layer. Second row: signals from ALDH9A1 (red) and HNK-1 (green). White arrows: colocalization of HNK-1 and ALDH9A1 signals; white arrowhead: acrosome-reacted sperm; yellow arrowhead: acrosome-intact sperm; red arrowhead: weak signal of ALDH9A1 on free sperm; green arrowhead: weak signal of the HNK-1 moiety on free sperm. Third row: TUBB location (green). The square in the middle panel is the location of the magnified image displayed in the right panel. Green arrows: ciliated cell clusters in the trenches of the mucosal folds. Fourth row: ALDOA location (red). The square in the middle panel is the location of the magnified image displayed in the right panel. Red arrow: ALDOA localization resembling mucin vesicles; red arrowhead: apical location of ALDOA in epithelial cells. Original magnification, 20× (scale bar, 75 μm). The images in the panels in the right column and in the second row are shown at a magnification of 63× (bar, 25 μm). Images are representative of three independent experiments.
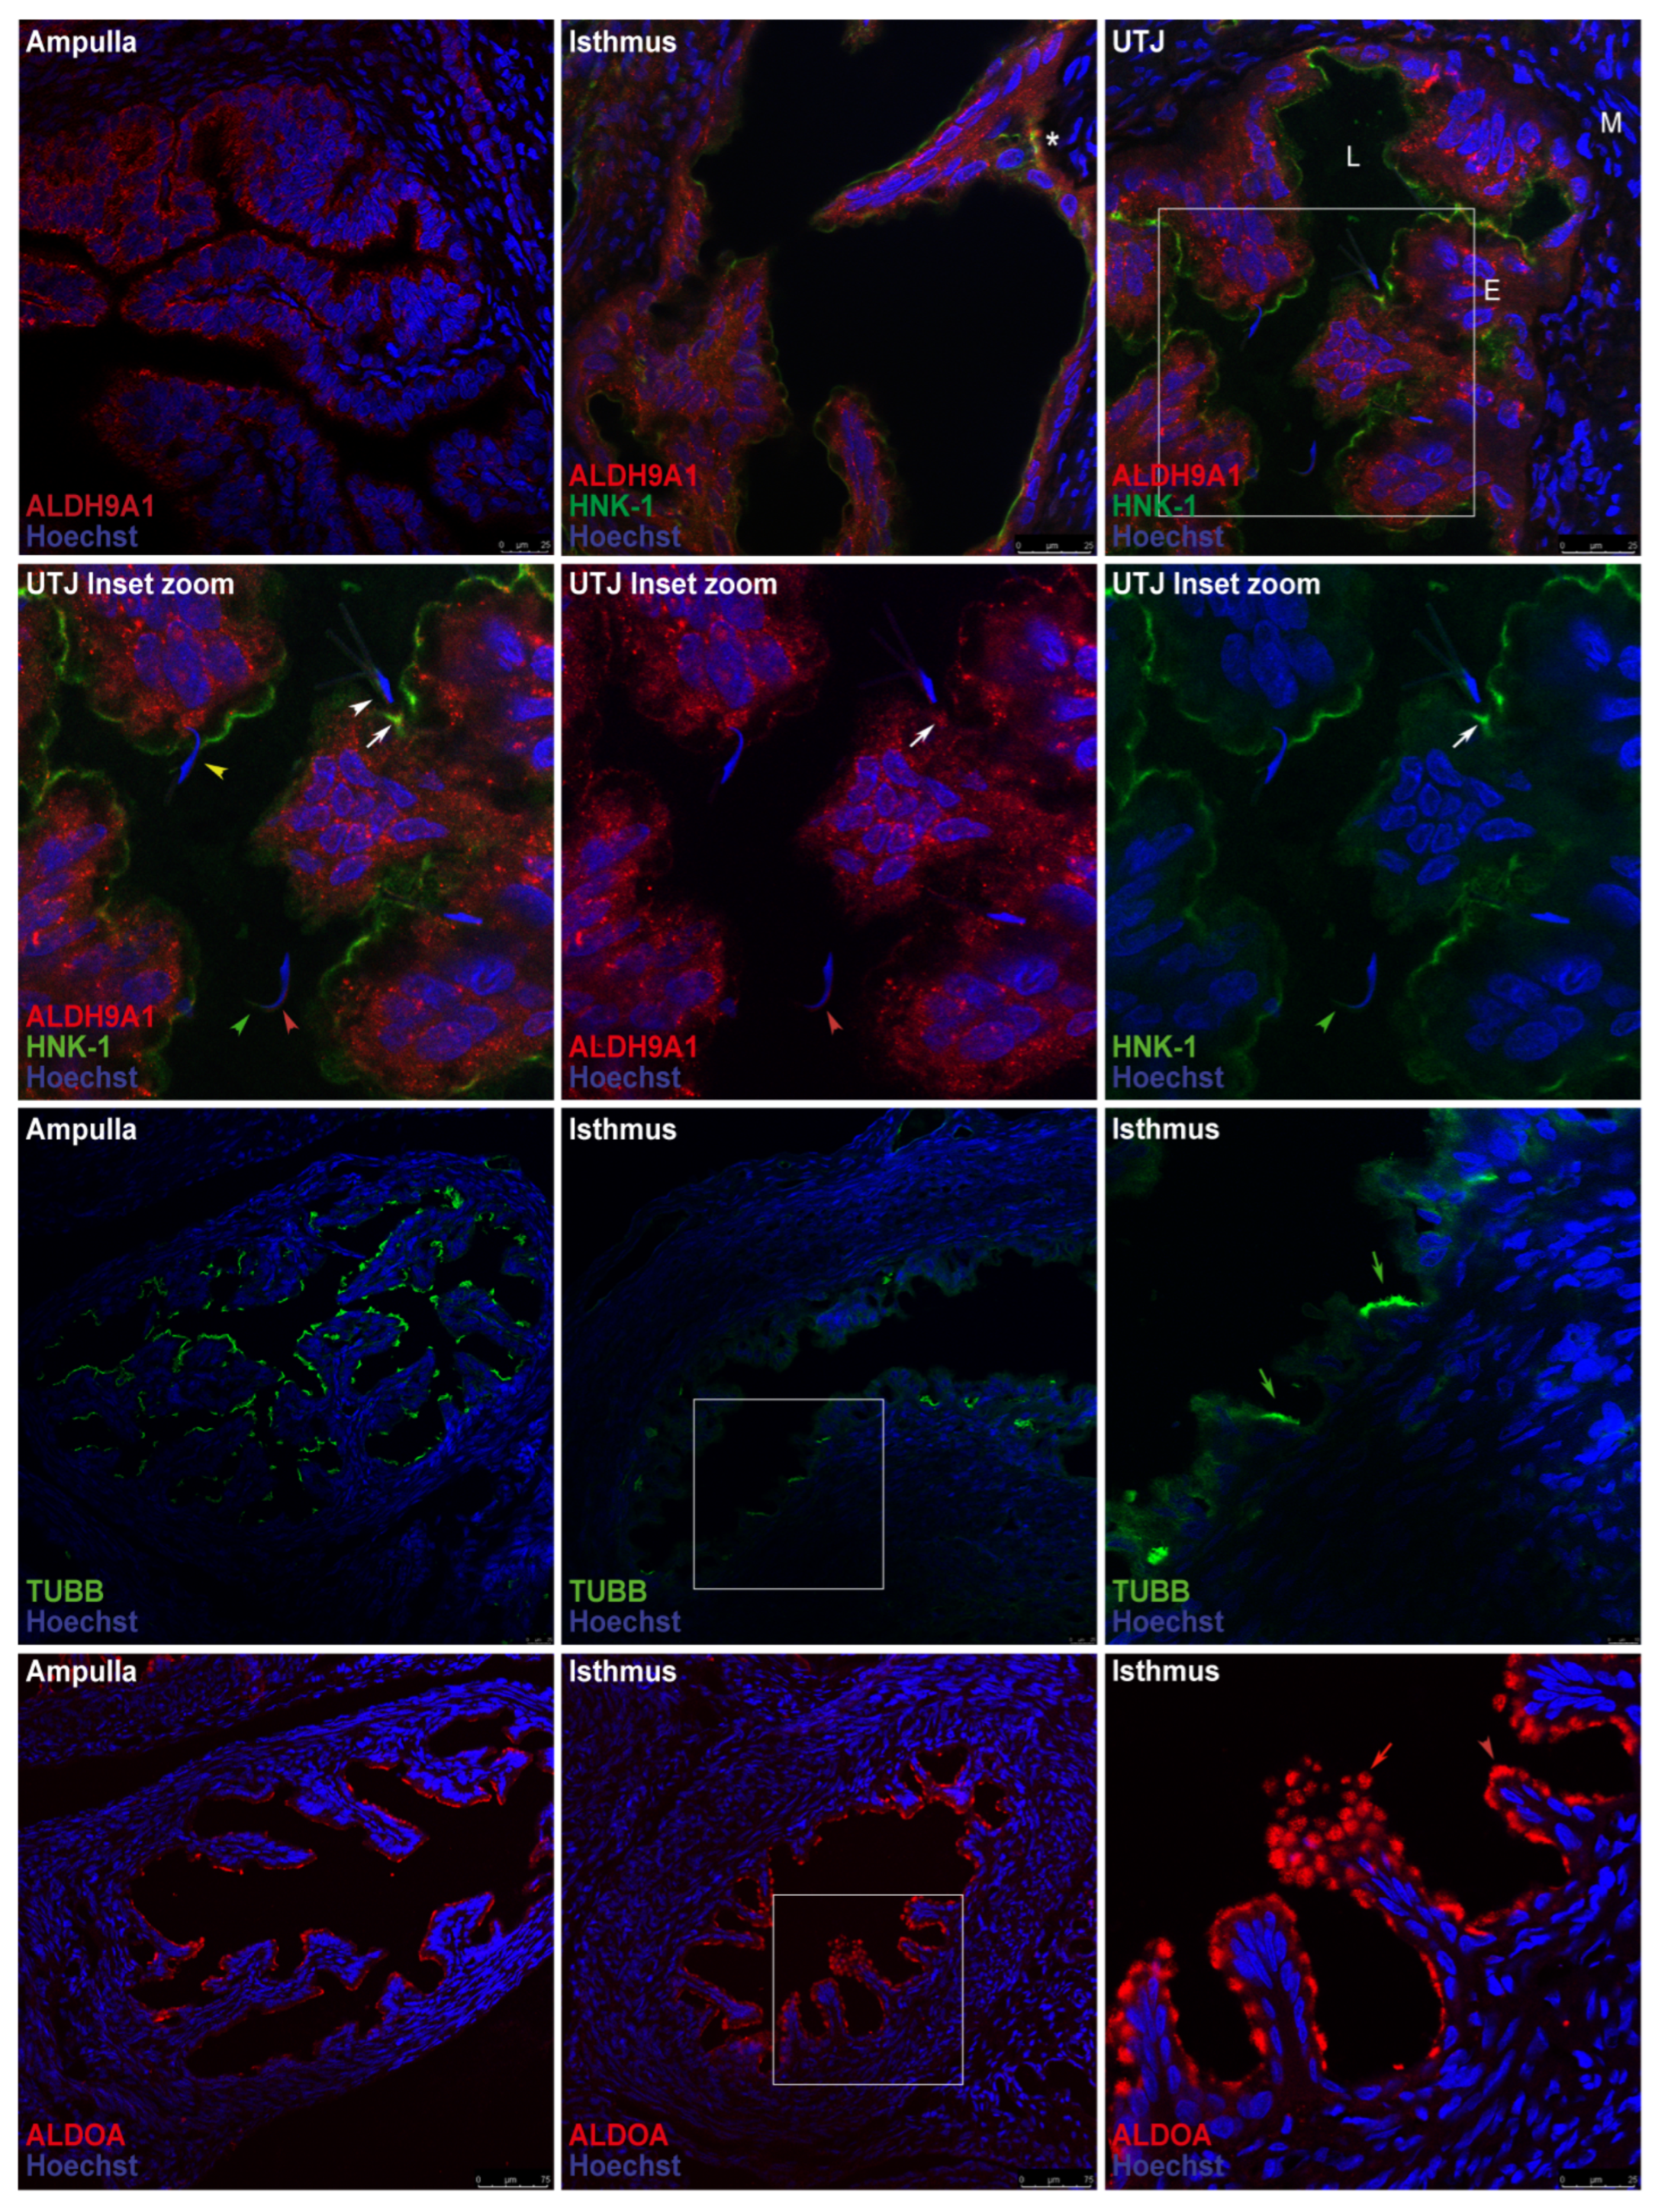
Figure 10.
VCS increases the level of Chst10 in the oviductal mucosa. The graphs show the RT‒qPCR results for Chst10 normalized to the expression of Actb and Gapdh (reference genes). The scatter plots represent the normalized individual data points after 2−ΔCq transformation for each individual sample. (A) Oviductal mucosa obtained 3 h after intrauterine injection of 0.1 mL of saline (0.9% w/v NaCl), a suspension of sperm in saline (10 million cells), or diluted seminal vesicle fluid (SVF, 1:1 dilution) into unmated rats. Biological replicates for each group, n = 5. (B) Oviductal mucosa obtained from unmated rats 3 h after VCS or sham stimulation. Biological replicates for each group, n = 5.
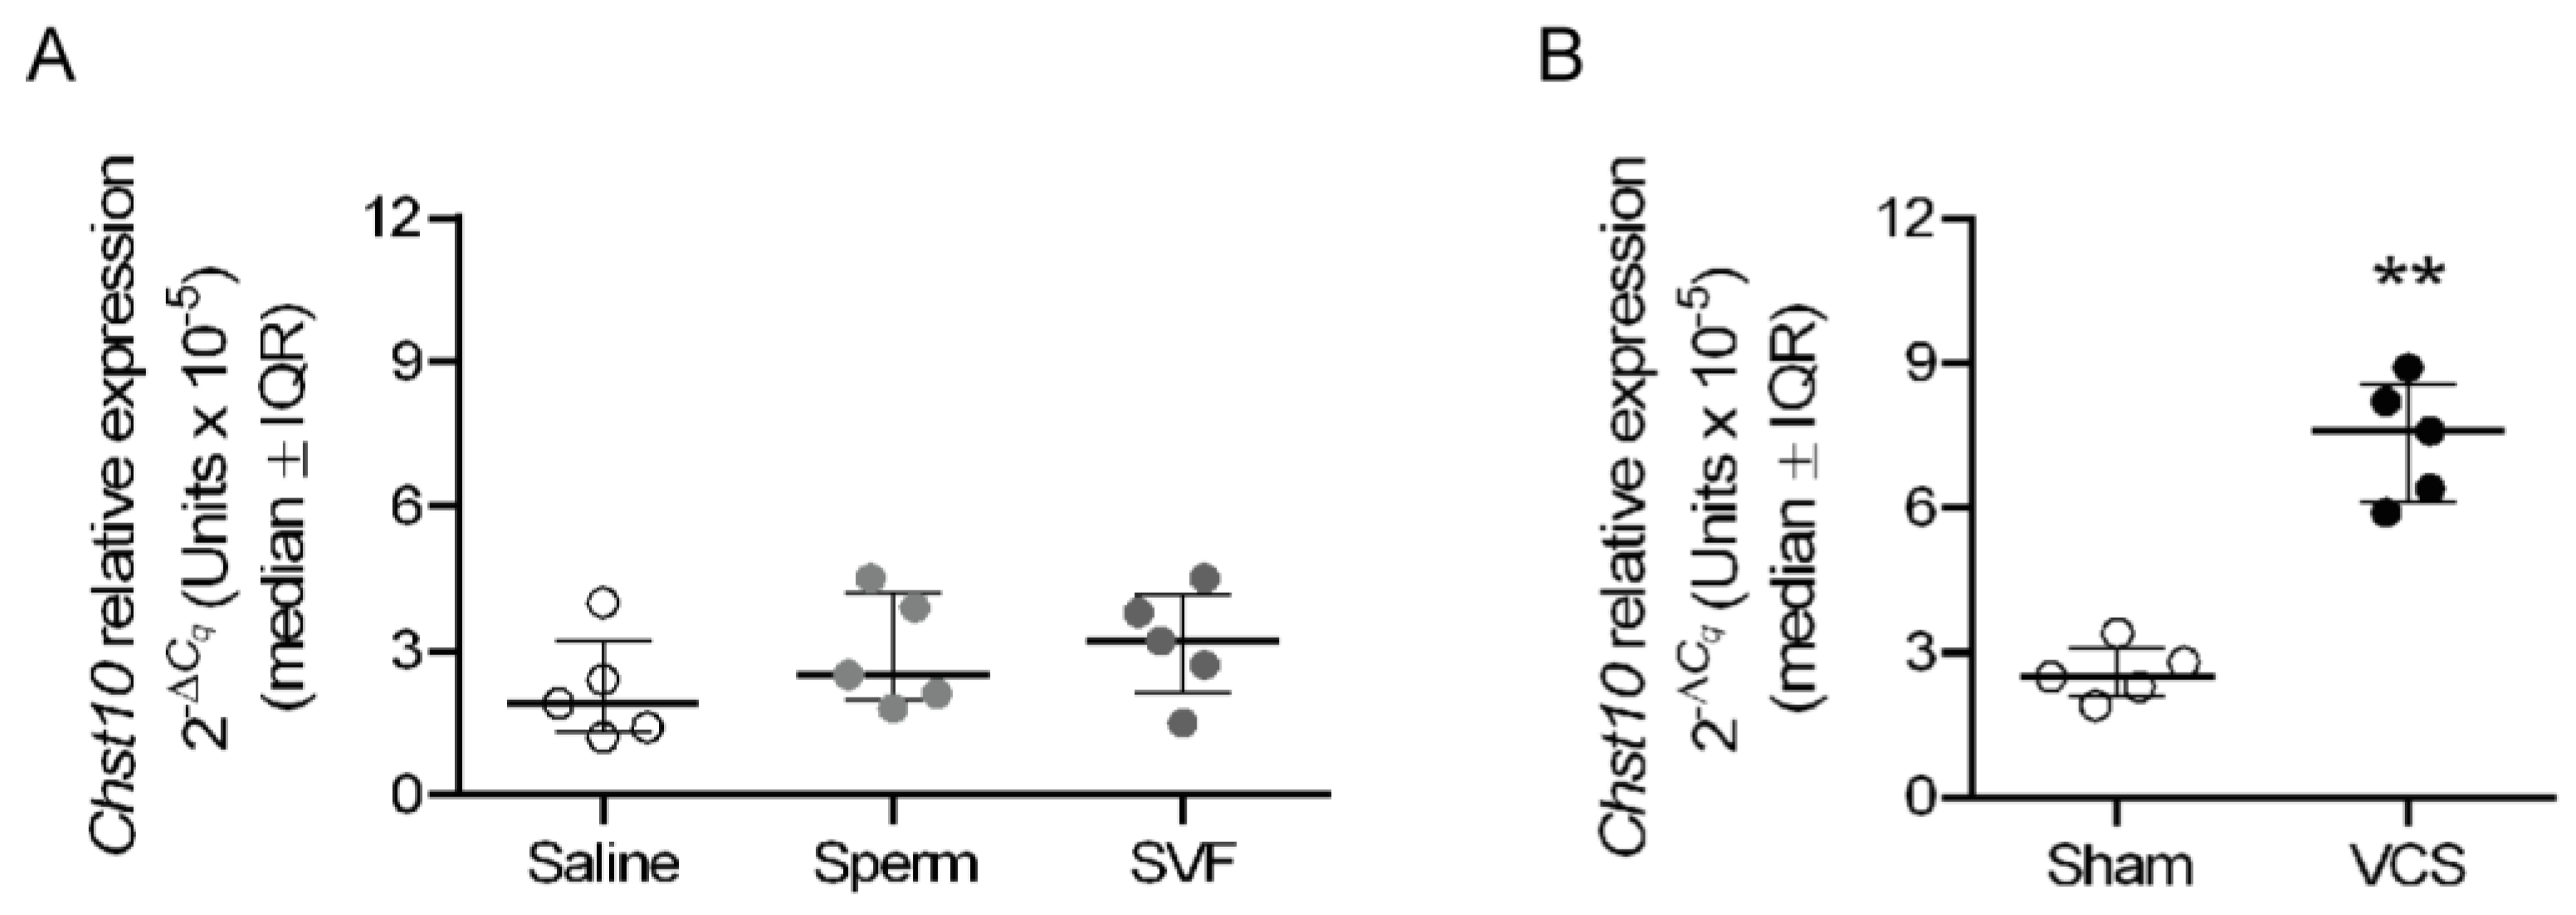

Table 1.
Proteins identified by mass spectrometry.
| Spot number | Protein | Gene | Sequence coverage (%) | Molecular mass (kDa) |
| 2 | Aldehyde dehydrogenase 9 family, member A1 | Aldh9a1 | 37.2 | 54.1 |
| 3 | Aldehyde dehydrogenase 9 family, member A1 | Aldh9a1 | 45.3 | 54.1 |
| 4 | Fructose bisphosphate aldolase A | Aldoa | 42.0 | 39.4 |
| 5 | Four and a half LIM domains protein 1 | Fhl1 | 59.3 | 31.9 |
| 6 | Four and a half LIM domains protein 1 | Fhl1 | 68.2 | 31.9 |
biOMICS Mass Spectrometry Facility (Sheffield University, UK).
Disclaimer/Publisher’s Note: The statements, opinions and data contained in all publications are solely those of the individual author(s) and contributor(s) and not of MDPI and/or the editor(s). MDPI and/or the editor(s) disclaim responsibility for any injury to people or property resulting from any ideas, methods, instructions or products referred to in the content. |
© 2025 by the authors. Licensee MDPI, Basel, Switzerland. This article is an open access article distributed under the terms and conditions of the Creative Commons Attribution (CC BY) license (http://creativecommons.org/licenses/by/4.0/).
Copyright: This open access article is published under a Creative Commons CC BY 4.0 license, which permit the free download, distribution, and reuse, provided that the author and preprint are cited in any reuse.


