Submitted:
21 January 2025
Posted:
22 January 2025
You are already at the latest version
Abstract
In this study the kinetics of stibnite dissolution in (Na2S+NaOH) aqueous media has been investigated. The dependence of controlling mechanism and antimony dissolution rate have been studied with respect to Na2S to NaOH ratio, solution temperature, stibnite powder size and solid to liquid ratio. All results (based on f(X)-t curves) have illustrated that the ash layer diffusion could be the rate controlling mechanism of stibnite dissolution via using shrinking core model. Also, XRF and SEM analysis confirms that the ash layer is nonmetallic and could be possibly Silica. In addition to, dissolution reaction was of order 2 and based on the numerical analysis the apparent activation energy of dissolution was obtained as about 18.13 kJ that is acceptably consistent with the results either in f(x)-t diagrams or tables. The accuracy of Shrinking core model has been evaluated through Bischoff criteria and this method has established that the pseudo steady state solution had good accuracy for developing the model. Besides the effect of main leaching parameters (as mentioned above) on antimony recovery has been determined. Results have shown that the leachant concentration ratio (0.75/0.75) has strongly increased the antimony recovery up to 98 percents among other parameters.
Keywords:
Dissolution kinetic
; Stibnite
; Sodium sulfide
; Shrinking Core
; Sodium Hydroxide
; Reaction order
1. Introduction
Stibnite, antimony sulfide (Sb2S3), is one of the most significant and copious antimony ore taken in to account for extraction of antimony and other strategic metals. Also, it shall be noted that stibnite ore has shown refractory properties for recovery of precious metals and antimony in conventional cyanidation process. Therefore pretreatment and extraction processes could be possibly pyrometallurgical , hydrometallurgical or mixed operations [1]. Pyrometallurgical processes for recovery of antimony include sulfur dioxide and antimony vapor release in the atmosphere and require much more expanses for equipment and process with respect to hydrometallurgical process [1,2,3]. Thus, Hydrometallurgical researches have been extensively done in order to recover the antimony from stibnite [1,4,5,6,7]. Consequently, considering leaching for the first stage of this process, both acidic and basic media, have been exploited for antimony recovery [1,5,6,7,8,9,10].
In the acidic media for leaching of antimony sulfide minerals like Stibnite, mainly hydrochloric acid (HCl) with iron chloride (FeCl3) were commonly used [1,9,11]. After filtration, the antimony can be obtained from electrowinning of the leaching synthesized solution in diaphragm cells. In anode ,also, the solvent is recovered [1]. According to the results, pH and ratio of iron to Stibnite are the most essential parameters. At pH around 0.44 and the ratio of iron to concentrate at about 0.7, the highest level of Stibnite’s disintegration takes place [1].
In alkaline solution, the major leachant is mainly Sodium Sulfur (Na2S), Sodium Hydroxide (NaOH) or mixture of them [6,7,12,13]. Leaching reaction of stibnite in Na2S solution runs thus [12,14]:
NaOH in a mixed Na2S and NaOH leaching solution acts to prevent hydrolysis of Na2S [10,15]. The overall reaction of this phenomenon is descibed the following:
Also, researches have been obviously illustrated that the other significant role of NaOH is to be a leaching agent assisting the leaching process of antimony by the following reaction [6,7,12,13]:
In addition to investigating the parameters affecting the efficiency of recovery, kinetic studies in these processes are of a great importance. There are some significant kinetic models studied in leaching environments, but among these models, shrinking core model has elaborated more logical results where a non-porous particle is assumed to react with a fluid, and products are isolated from the main core of the particle [11,12,13,16,17,18,19,20,21,22,23,24,25].
According to statistical analysis carried out on the factors that control the rate such as the mixer speed or concentration of reactant, it has been shown that diffusion of ions into the solution or liquid phase is the controlling mechanism of reaction rate. Moreover, in most ranges of pH, controlling mechanisms are simultaneously of the type of diffusion into ash layer and chemical reaction [1]. The activation energy also is one of the main parameters that affects the rate of reactions , and it could be possibly regarded as a determining method for kinetic controlling mechanism [16]. Awe et al. have investigated the mechanism of dissolution of tetrahydrate in sulfide alkaline environment and they suggested that the proposed dissolution mechanism of antimony is, in fact, chemical reaction with the obtained activation energy 81 kJ/mol [19].
The objective of this study is to determine the rate controlling step of stibnite dissolution in basic media with the mixture of Na2S+NaOH using shrinking core model and also, studying the effects of main process parameters especially, the concentration of leachants with constant and variable sodium content in leaching solution to investigate the reaction kinetics mechanisms.
2. Materials and Methods
The schematic representation of all experiments and effective parameters is illustrated in Figure 1.
2.1. Materials
At first, crushing of natural stibnite from Dashak Hassan mine was carried out with gyratory, cylindrical and conical crushers and ball mill to make grain size less than 2 mm. Then the particles were classified in the range of 30-120 meshes. After preparation and grading the sample, XRF and XRD (Philips Brand) analysis was performed. The results have been demonstrated in Table 1 and Figure 2 respectively.
As the results in the Table 1 show, the ore has 44.3 percent of antimony metal and the sample is almost considered a crystal and this shows that sampling has been done from epithermal veins from mine. XRD analysis shown in Figure 2 confirmed the XRF results, which was the presence of two phases of silica and Stibnite in ore.
2.2. Methods
Tests have been conducted through two categories of leachant molar ratios describes as follows:
For making equal proportions of both leachants ten grams of powder was poured in beaker containing 500 cc (with equal ratio of the two solvents 0.1/0.1) of solution and leached at temperatures of 25, 40, 60 and 80 °C for 2, 4, 6, 8, 10, 12, 15, 18, 21, 25, 30, 37.30, 45 and 60 minutes using a mechanical mixer with the same (sodium sulfur and sodium hydroxide) ratios of 0.05/0.05, 0.1/0.1, 0.175/0.175, 0.25/0.25, 0.5/0.5 and 0.75/0.75. Using the existing relation equations in the solution making, the volume specified were taken from the reference solution and the solution was brought to a volume of 500 cc. Then, the solution was poured into the beaker of 500 cc and the mixer cycle was adjusted to 1400 rpm. After mixing, 10 cc of the leached solution was taken by pipette and was filtered by funnel and paper with a vacuum pump. Once filtered, the volume of the remaining solution in the flask was raised to 50 ccs. For the rest of the experiments, the ratios of 0.25, 0.5, 2 and 4 of the sodium hydroxide to sodium sulfur were made by taking a fixed amount of sodium (0.3 mol).
Time of Sampling from solution and other parameters were similar to the previous tests. The amount of sodium in these tests was remained constant. To study Suitable solid-liquid ratio, the values of 2, 6, 14 and 18 gr of powder were poured in 500 ml of solution (equal ratios of the two solvent 0.1/ 0.1) and leached at mentioned times. Then, the resulting solution was smoothed by a suction pump, buchner funnel, and filter paper and came to 50 CCs in a balloon.
To obtain the amount of dissolved antimony in the solution, Atomic Absorption Spectrometer (AAS) was used.
Since 14 samples were obtained in each test and the volume of solution inside the reactor was decreased due to taking definite value of sample in each mentioned time, a formula shall be considered for determining the actual rate of dissolution at any time on the basis of solution concentration. This is to minimize the error rate in the kinetic equations, as well as making sure to achieve the actual recovery rate. This relationship was presented in 1998 by Domplos et al. [21,26]:
where Xi is the extraction rate or reacted fraction in ith sample, Vo is Initial volume of leaching solution in milliliter, Vi is the volume of the taken sample in ith stage i in terms of milliliter, Ci is the concentration of antimony in the ith sample based on gr and CM is the percentage of antimony in concentrate.
3. Results and Discussion
In order to prevent ambiguity in reporting and analyzing the results, it is decided to differentiate the leaching results into two sections. The first section has been mainly discussed the effect of leaching parameters on antimony recovery whereas the other section has elaborated antimony leaching kinetics.
3.1. The Effect of Leaching Parameters on Antimony Recovery
3.1.1. Effect of Leachant Concentration
As previously mentioned, two kinds of tests have been conducted for antimony leaching. The basis of these experiments is the sodium content in the solution and is also to highlight the effect of NaOH as a leachant agent. In the first category of experiments, the amount of sodium in the solution has been varied and increased by increasing the Na2S to NaOH ratios. As illustrated in Figure 3. (First category) the antimony recovery has been enhanced by increasing the leachant ratio up to 100 percents. Therefore, the results have strongly indicated that the process is dependent on the leachant concentration and this case is important in kinetic consideration and determination of the reaction order [27].
In the second category, the preparation of solution was originally based on the amount of sodium in 0.1 mol of each leachants, consequently four ratios were examined and the results were demonstrated in Figure 4. in which, it has been found that changing the ratio has slightly developed the antimony recovery against equal ones. In order to elaborate the effect of leachant concentration, 4 different time points have been selected in equal ratios as follows [17]:
- -
- Time for the start of the reaction
- -
- Time for middle of the reaction
- -
- Time near to equilibrium point
As shown in Figure 5, all curves have the same trends, also it can be clearly understood that the highest progress of antimony recovery was in the first 21 minutes of the reactions and this finding has been considered in kinetics investigation of this study. In order to investigate the antimony recovery more precisely, leaching residue of 0.75/0.75 ratio has been analyzed by XRF and EDX and the results have been shown in Table 2 and Figure 6. EDX results in Figure 7 confirms the same results of XRF in Table 2 and according to it, the energy peak of antimony is very low and equal to 1.89 percent.
3.1.2. Effect of Other Parameters
Other parameters such as temperature, solid to liquid ratio and particle size were briefly demonstrated in Figure 7, Figure 8 and Figure 9. As can be seen in Figure 8 The recovery in ratios of 10 g and 14 g were almost identical and in the ratio of 18 grams, the recovery rate is less than 2 mentioned ratios. So, increasing the amount of solid material does not have much impact on the recovery rate of antimony that might be due to the fact that increasing the amount of solid in the solution causes decrease in the capability of solvent to dissolve and consequently the dissolution limit of antimony might be lowered. Also, it should be noted that the by increasing the solid content in solution, the reaction stoichiometry has been replaced to equilibrium stoichiometry and the antimony recovery were less affected by solid to liquid ratio.
3.2. Kinetic Consideration
Among kinetic models for leaching reactions, the shrinking core model is the most useful one due to its simplicity in explaining of leaching process kinetics. Equations of this model are given in Table 3 [23].
Spherical and non-porous forms of particles are the basic assumptions of the shrinkage core model before and after leaching [16,24,27]. Figure 10a,b show SEM images of the mineral particles before and after the leaching process. As can be seen in these figures, the mineralogical structure of the stibnite has no macro pores leading to consider the volume of mineral particles constant. Also, the shape of particle was nearly assumed spherical.
- A.
- Accuracy of the Shrinking Core Model
The accuracy of SCM model is strongly depended on the accuracy of solution deployed for Fick’s second law. In order to obtain SCM from Fick’s second law, the Pseudo steady state solution has been widely applied and many researches have been done to investigate the accuracy of this approximation especially in hydrometallurgy and consequently in solid-liquid reactions [18,27,31,32,33,34,35]. The physical interpretation of pseudo-steady state assumption is that the movement of interface between the unreacted and reacted solids has initially considered to be low with respect to the liquid diffusion through the porous shell. Therefore, the concentration profile across the shell could be calculated from a steady state diffusion equation. Consequently, the required data could be possibly gathered in order to select the suitable criteria for the validity of PSS approximation [35].
Among these criteria the Bischoff method has been selected due to its simplicity via considering the two main physical parameters in his solution. Bischoff stated that the pseudo steady state solution for diffusion control models could be illustrated as follows [32]:
According to Equation (4) [Fick’s second law] for n=1 the related solution leads to the below integral:
By considering the diffusion controlling mechanism the terms h and k would be possibly regarded infinite and the moving boundary position is obtained as follows:
According to this criterion the δ parameter called as perturbation parameter defined:
where the CB,0 is the initial liquid concentration, ρs is the density of stibnite at room temperature, a and b is the solid and liquid stoichiometric coefficient respectively. This ratio is illustrated for all solvent concentration in Figure 12. As illustrated in Figure 11, for small quantity of this parameter (δ<<1) , the former assumption of reaction interface movement could be considered correct and the accuracy of the PSS shrinking core model is determined [32,35].
- B.
- Effect of Leaching Parameters on Reaction Kinetics
3.2.1. Effect of Leachant Concentration
For kinetic considerations, both groups of test samples (different and equal leachant ratios) were investigated based on the mentioned equations in Table 3. The results obtained for different ratios presented in Table 4 has illustrated that in all ratios, equation of ash layer diffusion mechanism is more consistent with the points which is clear from regression coefficients. As specified in Table 4, regression coefficients (R2) of all the equations indicate full compliance of the lines in Figure 9 and besides, it can be concluded that various ratios of the two leachants have no effect on the rate of leaching process. This is due to the low amount of sodium ions exists in the solution.
Similarly, in equal ratios, ash layer diffusion mechanism has been suitably correlated with the experimental data which has been rendered in Table 4. From the table, it has been indicated that the rate of leaching process is strongly dependent on the leachant concentration makes it as a considerable factor in kinetic considerations and determination of the order of reactions [19].
3.2.2. Effect of Temperature
Table 5 shows the effect of temperature on the kinetic mechanism. It appears that with increasing temperature, controlling mechanism is still ash layer diffusion.
Since this mechanism is less sensitive to temperature in comparison with chemical reaction mechanism, the lower required activation energy is predicted for the process. The activation energy is obtained equal to 18.13 kJ calculated from Arrhenius equation (Figure 13).
3.2.3. Effect of Solid to Liquid Ratio
Figure 14 shows the effect of solid to liquid ratio (18 grams/500 ccs of solution) on the shrinking core model. Also, Table 6 shows the results of the other diffusion mechanism of the ash layer in all solid to liquid ratios (the results of chemical reaction and film diffusion were neglected due to interpret the results briefly). Increasing solid to liquid ratio in low ratios up to 10 g per 500 cc has increased the rate of leaching process, but in the last two ratios, this rate has declined rapidly probably due to augmentation of solution viscosity. This event reduces the number of effective collisions of solid particles as well as the power of the fluid flow to dissolve.
3.3. Comparison of the Ash Layer Diffusion Model in SCM to Other Diffusion Models
In addition to the suggested model in the present study [16], two other diffusion models mentioned (D5 and D12) in Dickinson et al. paper [36], were considered and compared with the former one. The first assumption for choosing the mentioned models is the shape of particles which was possibly considered spherical according to Figure 11a,b. Secondly, the ash layer could be considered as resistant layer lead to vary the concentration of leachant attacked to the core [36]. In order to evaluate the comparison of ash layer diffusion model to other models, the parameters including the rate and regression coefficients (R2) in all three models have been obtained shown in Table 8. According to regression coefficients in Table 8, the ash layer diffusion model might be more correlated with respect to the others.
3.4. The Consideration of Silica Formation as an Ash Layer
As previously mentioned, the ash layer could be formed during the leaching process. Therefore, the results obtained from XRF and XRD analysis mentioned in Table 1, Table 2 and Figure 2 indicate that silica phase might be composed during the dissolution process as an ash layer. Figure 15 illustrates the formation of silica glassy shape on the stibnite surface. Moreover, EDX analysis of leach residue proves the fact that liquid reactant has probably attacked the stibnite surface and silica phase has remained as an ash layer on the stibnite surface [37,38].
4. Conclusions
The main purpose of this paper is to highlight the effect of leachant concentration on antimony recovery, and it has been understood that the recovery of the Sb, increases with the increasing of concentration of the two solvents in the equal ratios, rose from 20 percent to about 98 percent. Tests to determine the mechanism were carried out by examining four parameters including temperature, solid to liquid ratio, particle size of stibnite and concentration of the solvent. Increasing solid to liquid ratio increased the recovery rate but at higher ratios did not have much impact on it. Increasing the grain size decreased the recovery rate from 37% to 21% in lower grain size. Temperature also has been an affecting parameter on antimony recovery and increased it from 37 percent to 68 percent in ambient temperature. According to the scanning electronic microscopic analysis, the shape of the particles was remained almost unchanged and based on this hypothesis shrinking core model was used for kinetic analysis of Stibnite leaching. Furthermore, the results of each main leaching parameters have shown that the ash layer diffusion could be possibly regarded as the mechanism of stibnite dissolution. Moreover, the activation energy of the process was estimated as 18.13 kJ/ mole which was probably verified the diffusion model. The SEM and EDX results of the stibnite have been illustrated that silica could be probably considered as an ash layer. Also, the amount of silica remained after leaching, can be the other reason for this assumption. In order to evaluate the accuracy of the model and its solution for Fick’s 2ed law, the Bischoff criterion was selected and the results were in good compatibility to the model.
References
- Mahlangu, T.; Gudyanga, F.; Simbi, D. Reductive leaching of stibnite (Sb 2 S 3) flotation concentrate using metallic iron in a hydrochloric acid medium I: Thermodynamics. Hydrometallurgy 2006, 84, 192–203. [Google Scholar] [CrossRef]
- Li, L. et al. Separation and Recovery of Antimony from High Arsenic-bearing Flue Dusts through Selective Oxidation Using MnO2. ISIJ International 2017, 57, 581–586. [Google Scholar] [CrossRef]
- Qin, W.-q. et al. Mechanism of stibnite volatilization at high temperature. Journal of Central South University 2015, 22, 868–873. [Google Scholar] [CrossRef]
- Adelman, J. Mineral interactions in a gold mining environment: change in oxidation rate of stibnite as affected by the addition of varying amounts of pyrite in an oxygenated flow through system; McGill University, 2010. [Google Scholar]
- Kwong, Y.J.; Pratt, A.; Botton, G. Antimony leaching from stibnite and complex ores. In 7th International Conference on Acid Rock Drainage (ICARD); American Society of Mining and Reclamation (ASMR): St. Louis, MI, USA, 2006. [Google Scholar]
- Sminčáková, E. Leaching of natural stibnite using sodium hydroxide solution. JOM 2009, 61, 32. [Google Scholar] [CrossRef]
- Sminčáková, E.; Komorová, Ľ. Leaching of stibnite in NaOH solutions. Reactions 2008, 1, 10. [Google Scholar]
- Multani, R.S.; Feldmann, T.; Demopoulos, G.P. Antimony in the metallurgical industry: a review of its chemistry and environmental stabilization options. Hydrometallurgy 2016, 164, 141–153. [Google Scholar] [CrossRef]
- Tian, Q. et al. Ozonation leaching of a complex sulfidic antimony ore in hydrochloric acid solution. Hydrometallurgy 2016, 159, 126–131. [Google Scholar] [CrossRef]
- Ubaldini, S. et al. Process flow-sheet for gold and antimony recovery from stibnite. Hydrometallurgy 2000, 57, 187–199. [Google Scholar] [CrossRef]
- Biver, M.; Shotyk, W. , Stibnite (Sb2S3) oxidative dissolution kinetics from pH 1 to 11. Geochimica et Cosmochimica Acta 2012, 79, 127–139. [Google Scholar] [CrossRef]
- Raschman, P.; Sminčáková, E. Kinetics of leaching of stibnite by mixed Na 2 S and NaOH solutions. Hydrometallurgy 2012, 113, 60–66. [Google Scholar] [CrossRef]
- Dodangeh, A. et al. Leaching kinetics of stibnite in sodium hydroxide solution; 2014. [Google Scholar]
- Tian-cong, Z. The metallurgy of antimony/Central South University of Technology; Press Changsha the Peoples Republic, 1988; Volume 731. [Google Scholar]
- Zunkel, A.; Habashi, F. Principles of Extractive Metallurgy, Vol. 1: General Principles. Vol. 2: Hydrometallurgy; JSTOR, 1971. [Google Scholar]
- Levenspiel, O.; Levenspiel, C. Chemical reaction engineering; Wiley: New York, 1972. [Google Scholar]
- Prosser, A.P. Review of uncertainty in the collection and interpretation of leaching data. Hydrometallurgy 1996, 41, 119–153. [Google Scholar] [CrossRef]
- Lindman, N.; Simonsson, D. On the application of the shrinking core model to liquid—solid reactions. Chemical Engineering Science 1979, 34, 31–35. [Google Scholar] [CrossRef]
- Awe, S.A.; Samuelsson, C.; Sandström, Å. Dissolution kinetics of tetrahedrite mineral in alkaline sulphide media. Hydrometallurgy 2010, 103, 167–172. [Google Scholar] [CrossRef]
- Demopoulos, G.; Papangelakis, V. Sulfuric Acid Pressure Leaching of a Limonitic Laterite: Chemistry and Kinetics. Hydrometallurgy 1998, 49, 23–46. [Google Scholar]
- Georgiou, D.; Papangelakis, V. Sulphuric acid pressure leaching of a limonitic laterite: chemistry and kinetics. Hydrometallurgy 1998, 49, 23–46. [Google Scholar] [CrossRef]
- Živković, Ž. et al. Kinetics and mechanism of Sb 2 S 3 oxidation process. Thermochimica Acta 2002, 383, 137–143. [Google Scholar] [CrossRef]
- Younesi, S. , et al. Kinetic mechanisms of cementation of cadmium ions by zinc powder from sulphate solutions. Hydrometallurgy 2006, 84, 155–164. [Google Scholar]
- Havlík, T. Hydrometallurgy: Principles and applications; Elsevier, 2014. [Google Scholar]
- Sminčáková, E.; Komorová, L. Kinetika lúhovania Sb2S3 v roztoku NaOH. Acta Montanistica Slovaca 2007, 12, 328–333. [Google Scholar]
- Anderson, C. Hydrometallurgically treating antimony-bearing industrial wastes. JOM 2001, 53, 18–20. [Google Scholar] [CrossRef]
- Wen, C. Noncatalytic heterogeneous solid-fluid reaction models. Industrial & Engineering Chemistry 1968, 60, 34–54. [Google Scholar]
- Baláž, P.; Achimovičová, M. Selective leaching of antimony and arsenic from mechanically activated tetrahedrite, jamesonite and enargite. International Journal of Mineral Processing 2006, 81, 44–50. [Google Scholar] [CrossRef]
- Baláž, P. et al. Non-oxidative leaching of mechanically activated stibnite. Hydrometallurgy 1992, 31, 201–212. [Google Scholar] [CrossRef]
- Baláž, P. et al. Mechano-chemical treatment of tetrahedrite as a new non-polluting method of metals recovery. In Hydrometallurgy’94; Springer, 1994; pp. 209–218. [Google Scholar]
- Bischoff, K. Accuracy of the pseudo steady state approximation for moving boundary diffusion problems. Chemical Engineering Science 1963, 18, 711–713. [Google Scholar] [CrossRef]
- Bischoff, K. Further comments on the pseudo steady state approximation for moving boundary diffusion problems. Chem. Eng. Sci. 1965, 20, 783–784. [Google Scholar] [CrossRef]
- Stakgold, I.; Bischoff, K.; Gokhale, V. Validity of the pseudo-steady-state approximation. International Journal of Engineering Science 1983, 21, 537–542. [Google Scholar] [CrossRef]
- Lapidus, G. Mathematical modelling of metal leaching in nonporous minerals. Chemical engineering science 1992, 47, 1933–1941. [Google Scholar] [CrossRef]
- Liddell, K.C. Shrinking core models in hydrometallurgy: What students are not being told about the pseudo-steady approximation. Hydrometallurgy 2005, 79, 62–68. [Google Scholar] [CrossRef]
- Dickinson, C.; Heal, G. Solid–liquid diffusion controlled rate equations. Thermochimica Acta 1999, 340, 89–103. [Google Scholar] [CrossRef]
- Falayi, T.; Ntuli, F.; Okonta, F.N. Kinetic and thermodynamic parameters of silica leaching from Camden power station fly ash; 2015. [Google Scholar]
- Koech, L. et al. Leaching kinetics of bottom ash waste as a source of calcium ions. Journal of the Air & Waste Management Association 2015, 65, 126–132. [Google Scholar]
Figure 1.
Schematic representation of leaching experiments and their results in this study.
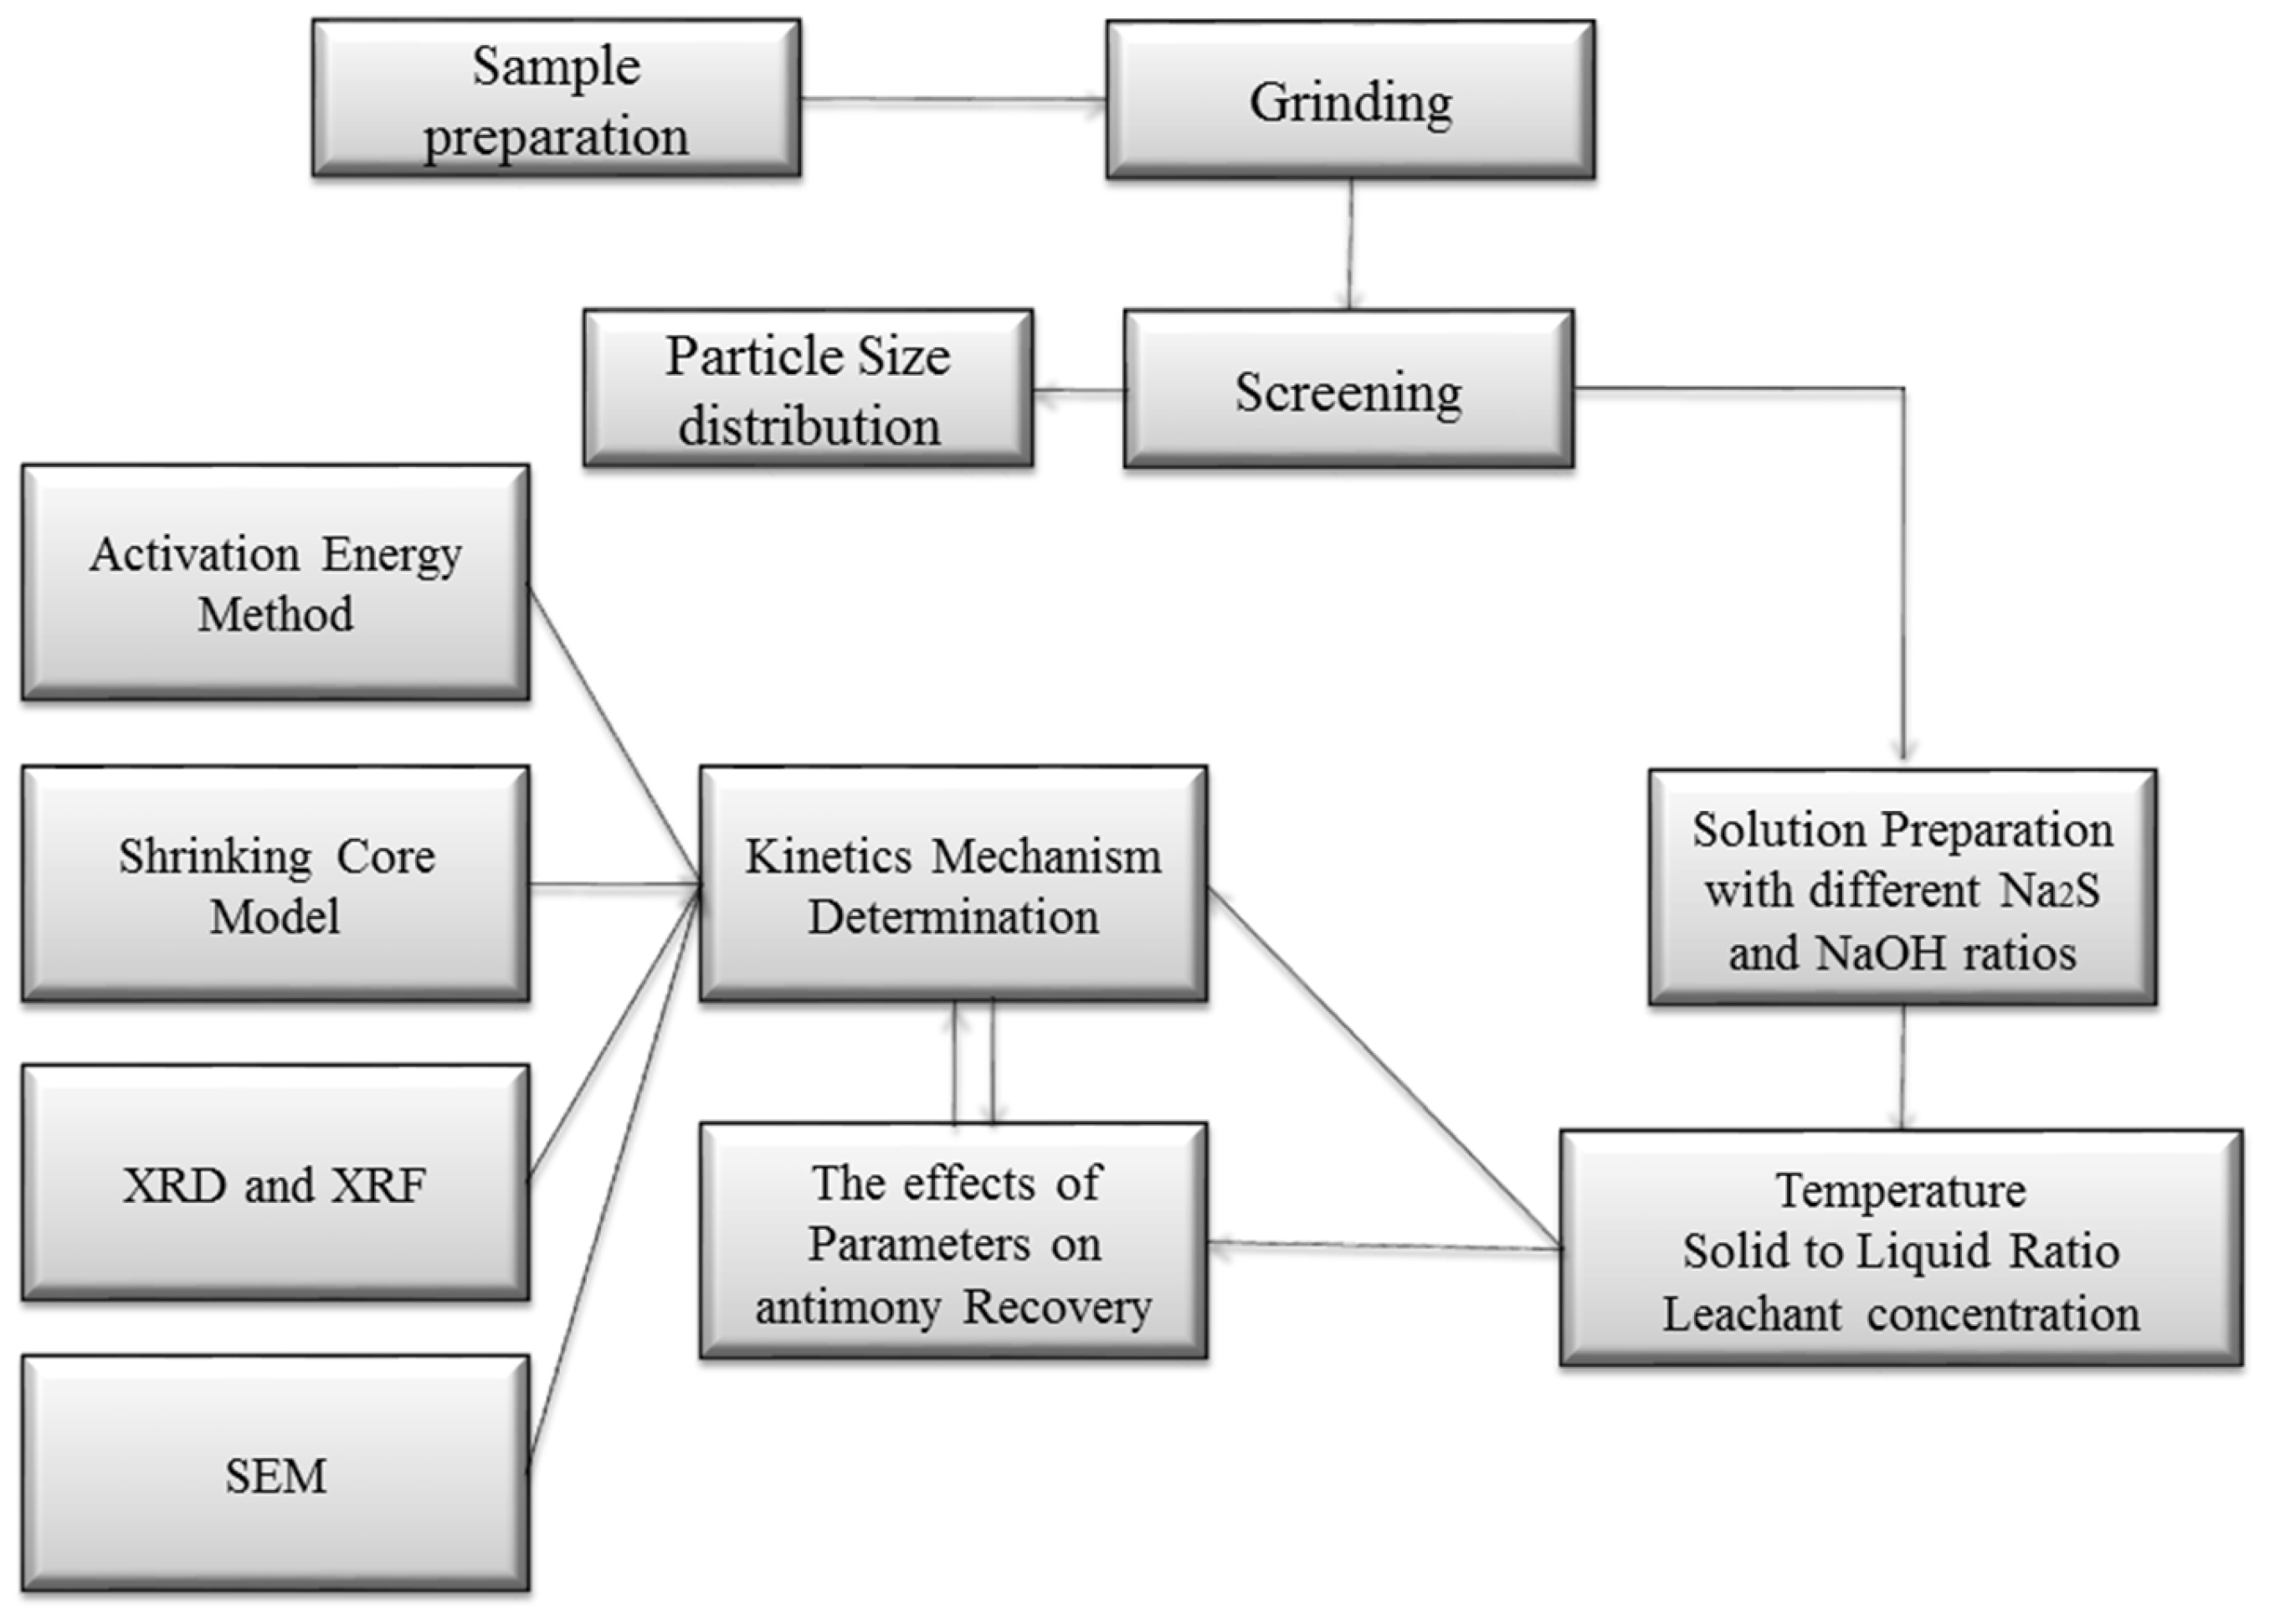
Figure 2.
X ray Diffraction on Stibnite Sample before leaching (-120#).
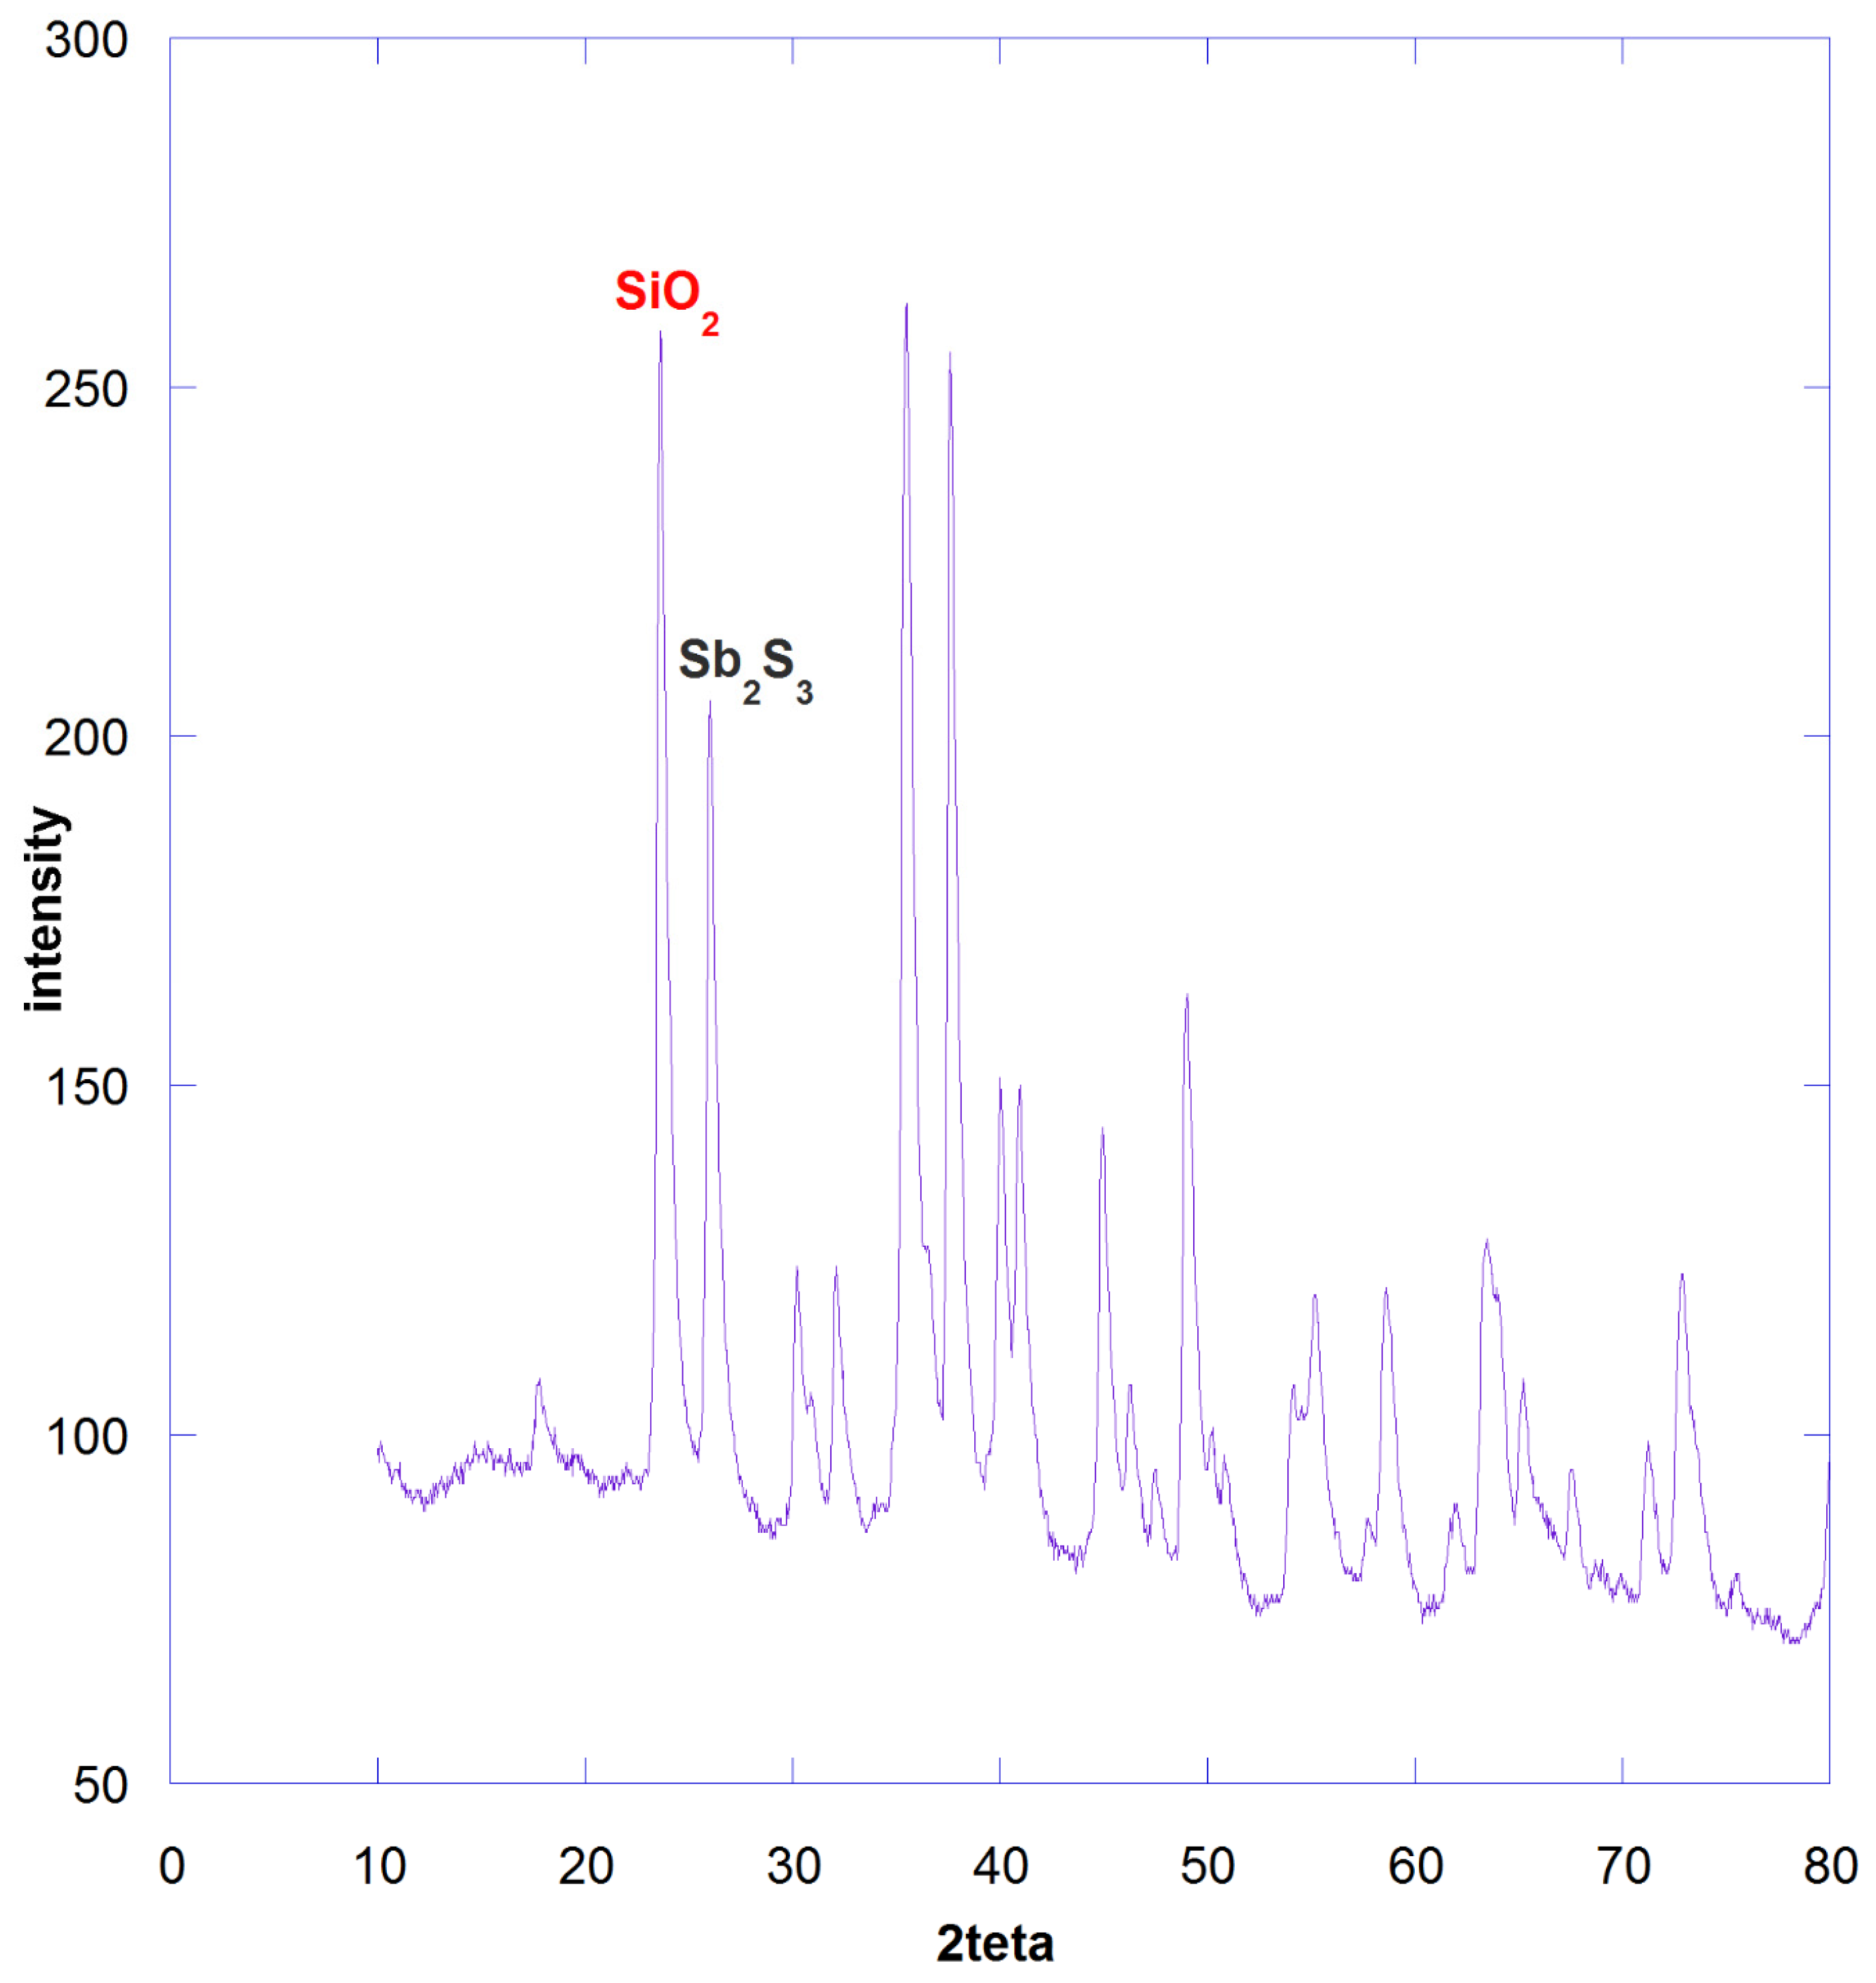
Figure 3.
Effect of leachant concentration (with equal ratio) from 0.05/0.05 to 0.75/0.75 of Na2S/NaOH, T=25 0C , W=1400 rpm.
Figure 3.
Effect of leachant concentration (with equal ratio) from 0.05/0.05 to 0.75/0.75 of Na2S/NaOH, T=25 0C , W=1400 rpm.
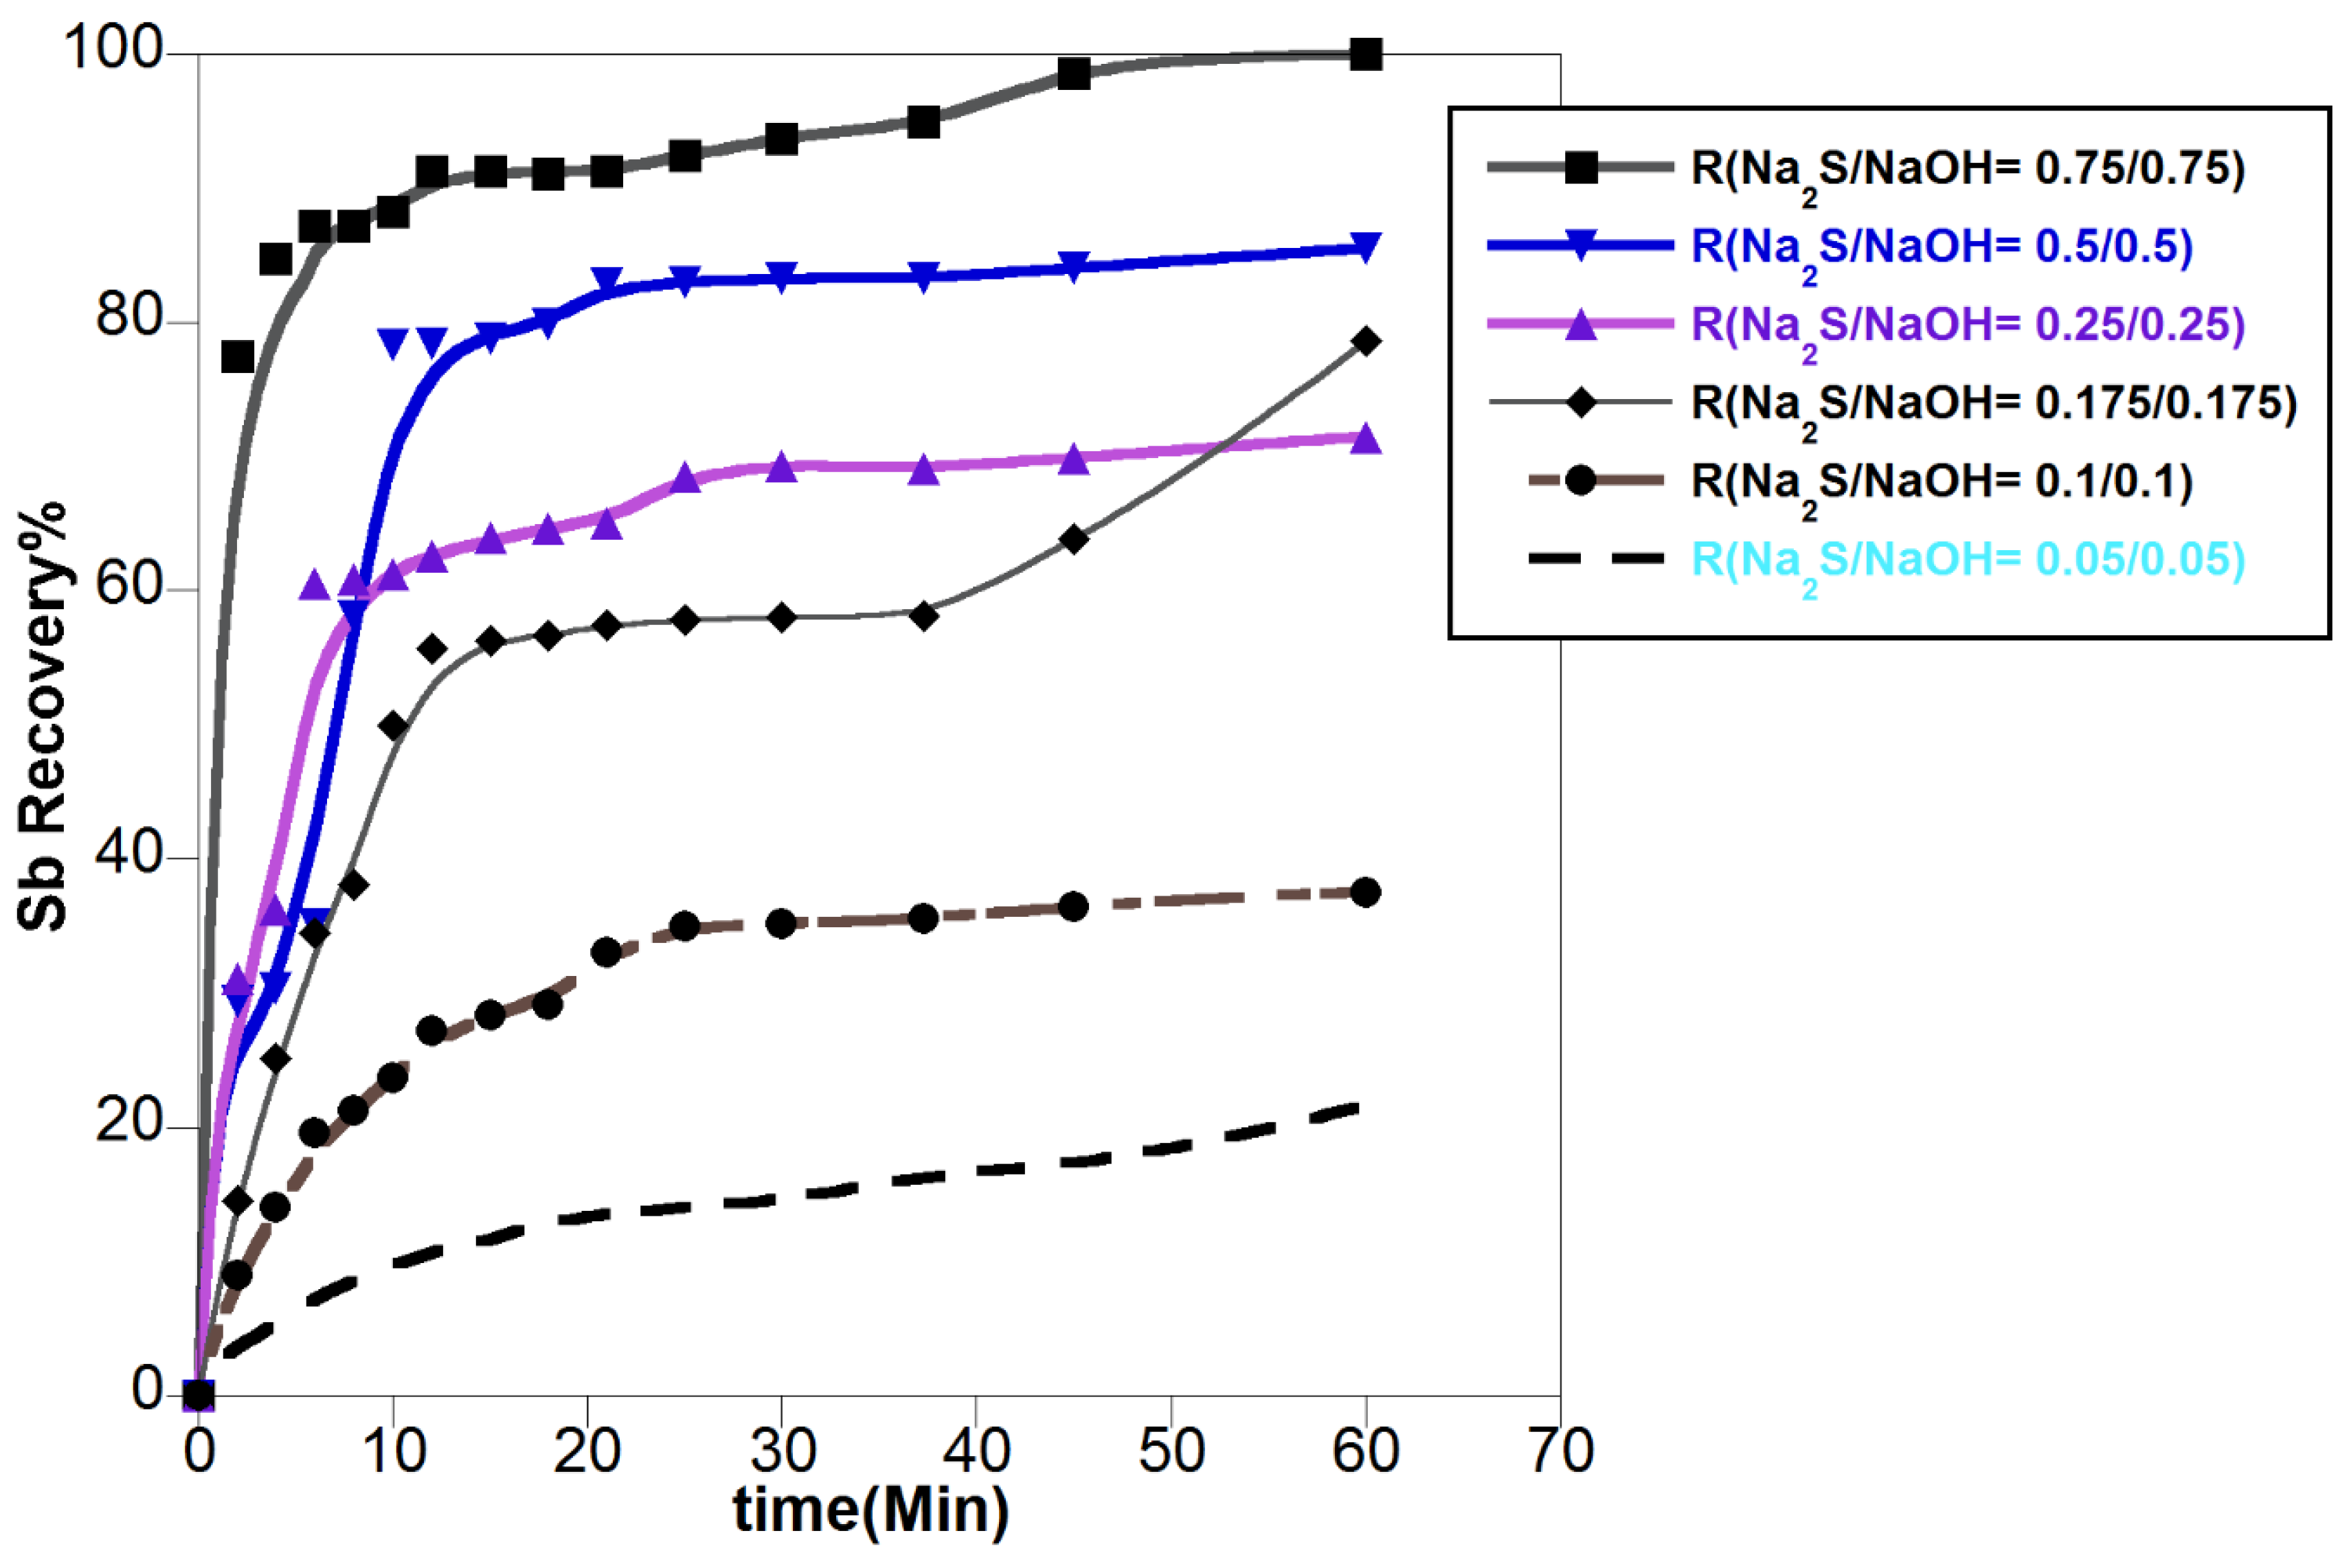
Figure 4.
Effect of leachant concentration (with variable ratio) from 1/2 to 4/1 in comparison with 0.1/0.1 of Na2S/NaOH, T=25 0C , W=1400 rpm.
Figure 4.
Effect of leachant concentration (with variable ratio) from 1/2 to 4/1 in comparison with 0.1/0.1 of Na2S/NaOH, T=25 0C , W=1400 rpm.
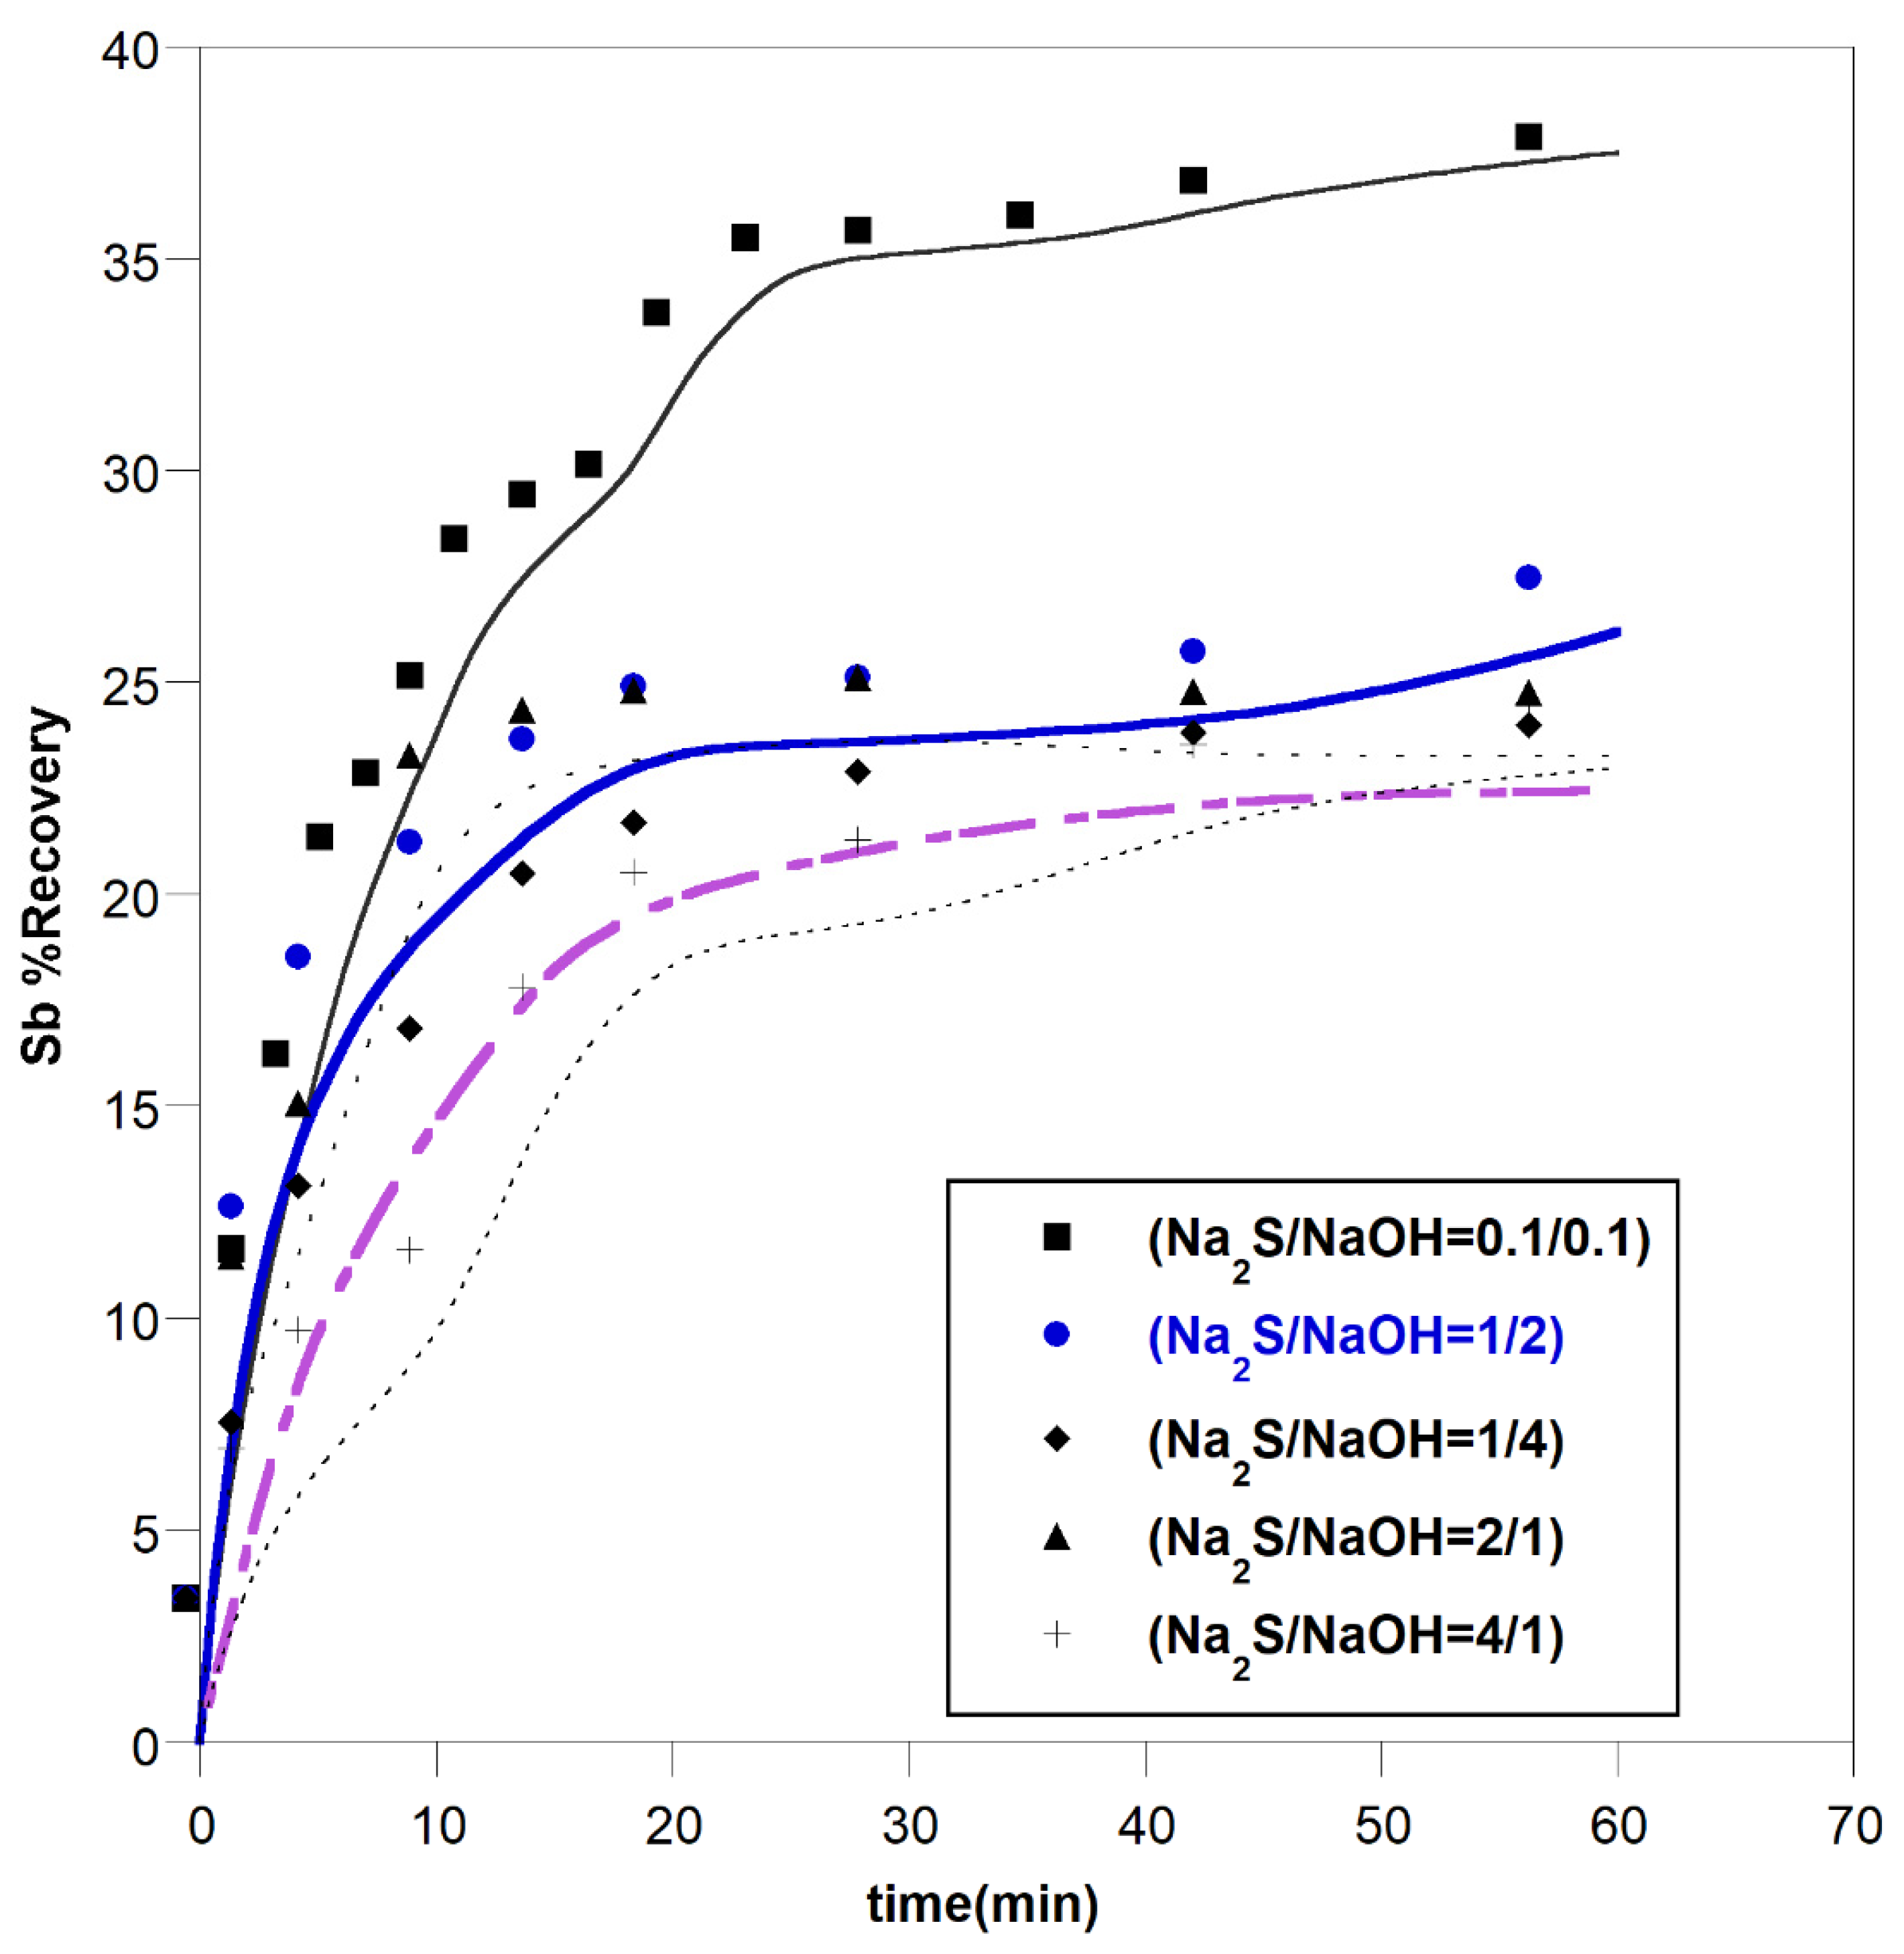
Figure 5.
Effect of time and concentration of solvent on the amount of the solvent recovery with equal ratios from 0.1 to 0.75 of leachant, T=25 0C, W=1400 rpm.
Figure 5.
Effect of time and concentration of solvent on the amount of the solvent recovery with equal ratios from 0.1 to 0.75 of leachant, T=25 0C, W=1400 rpm.
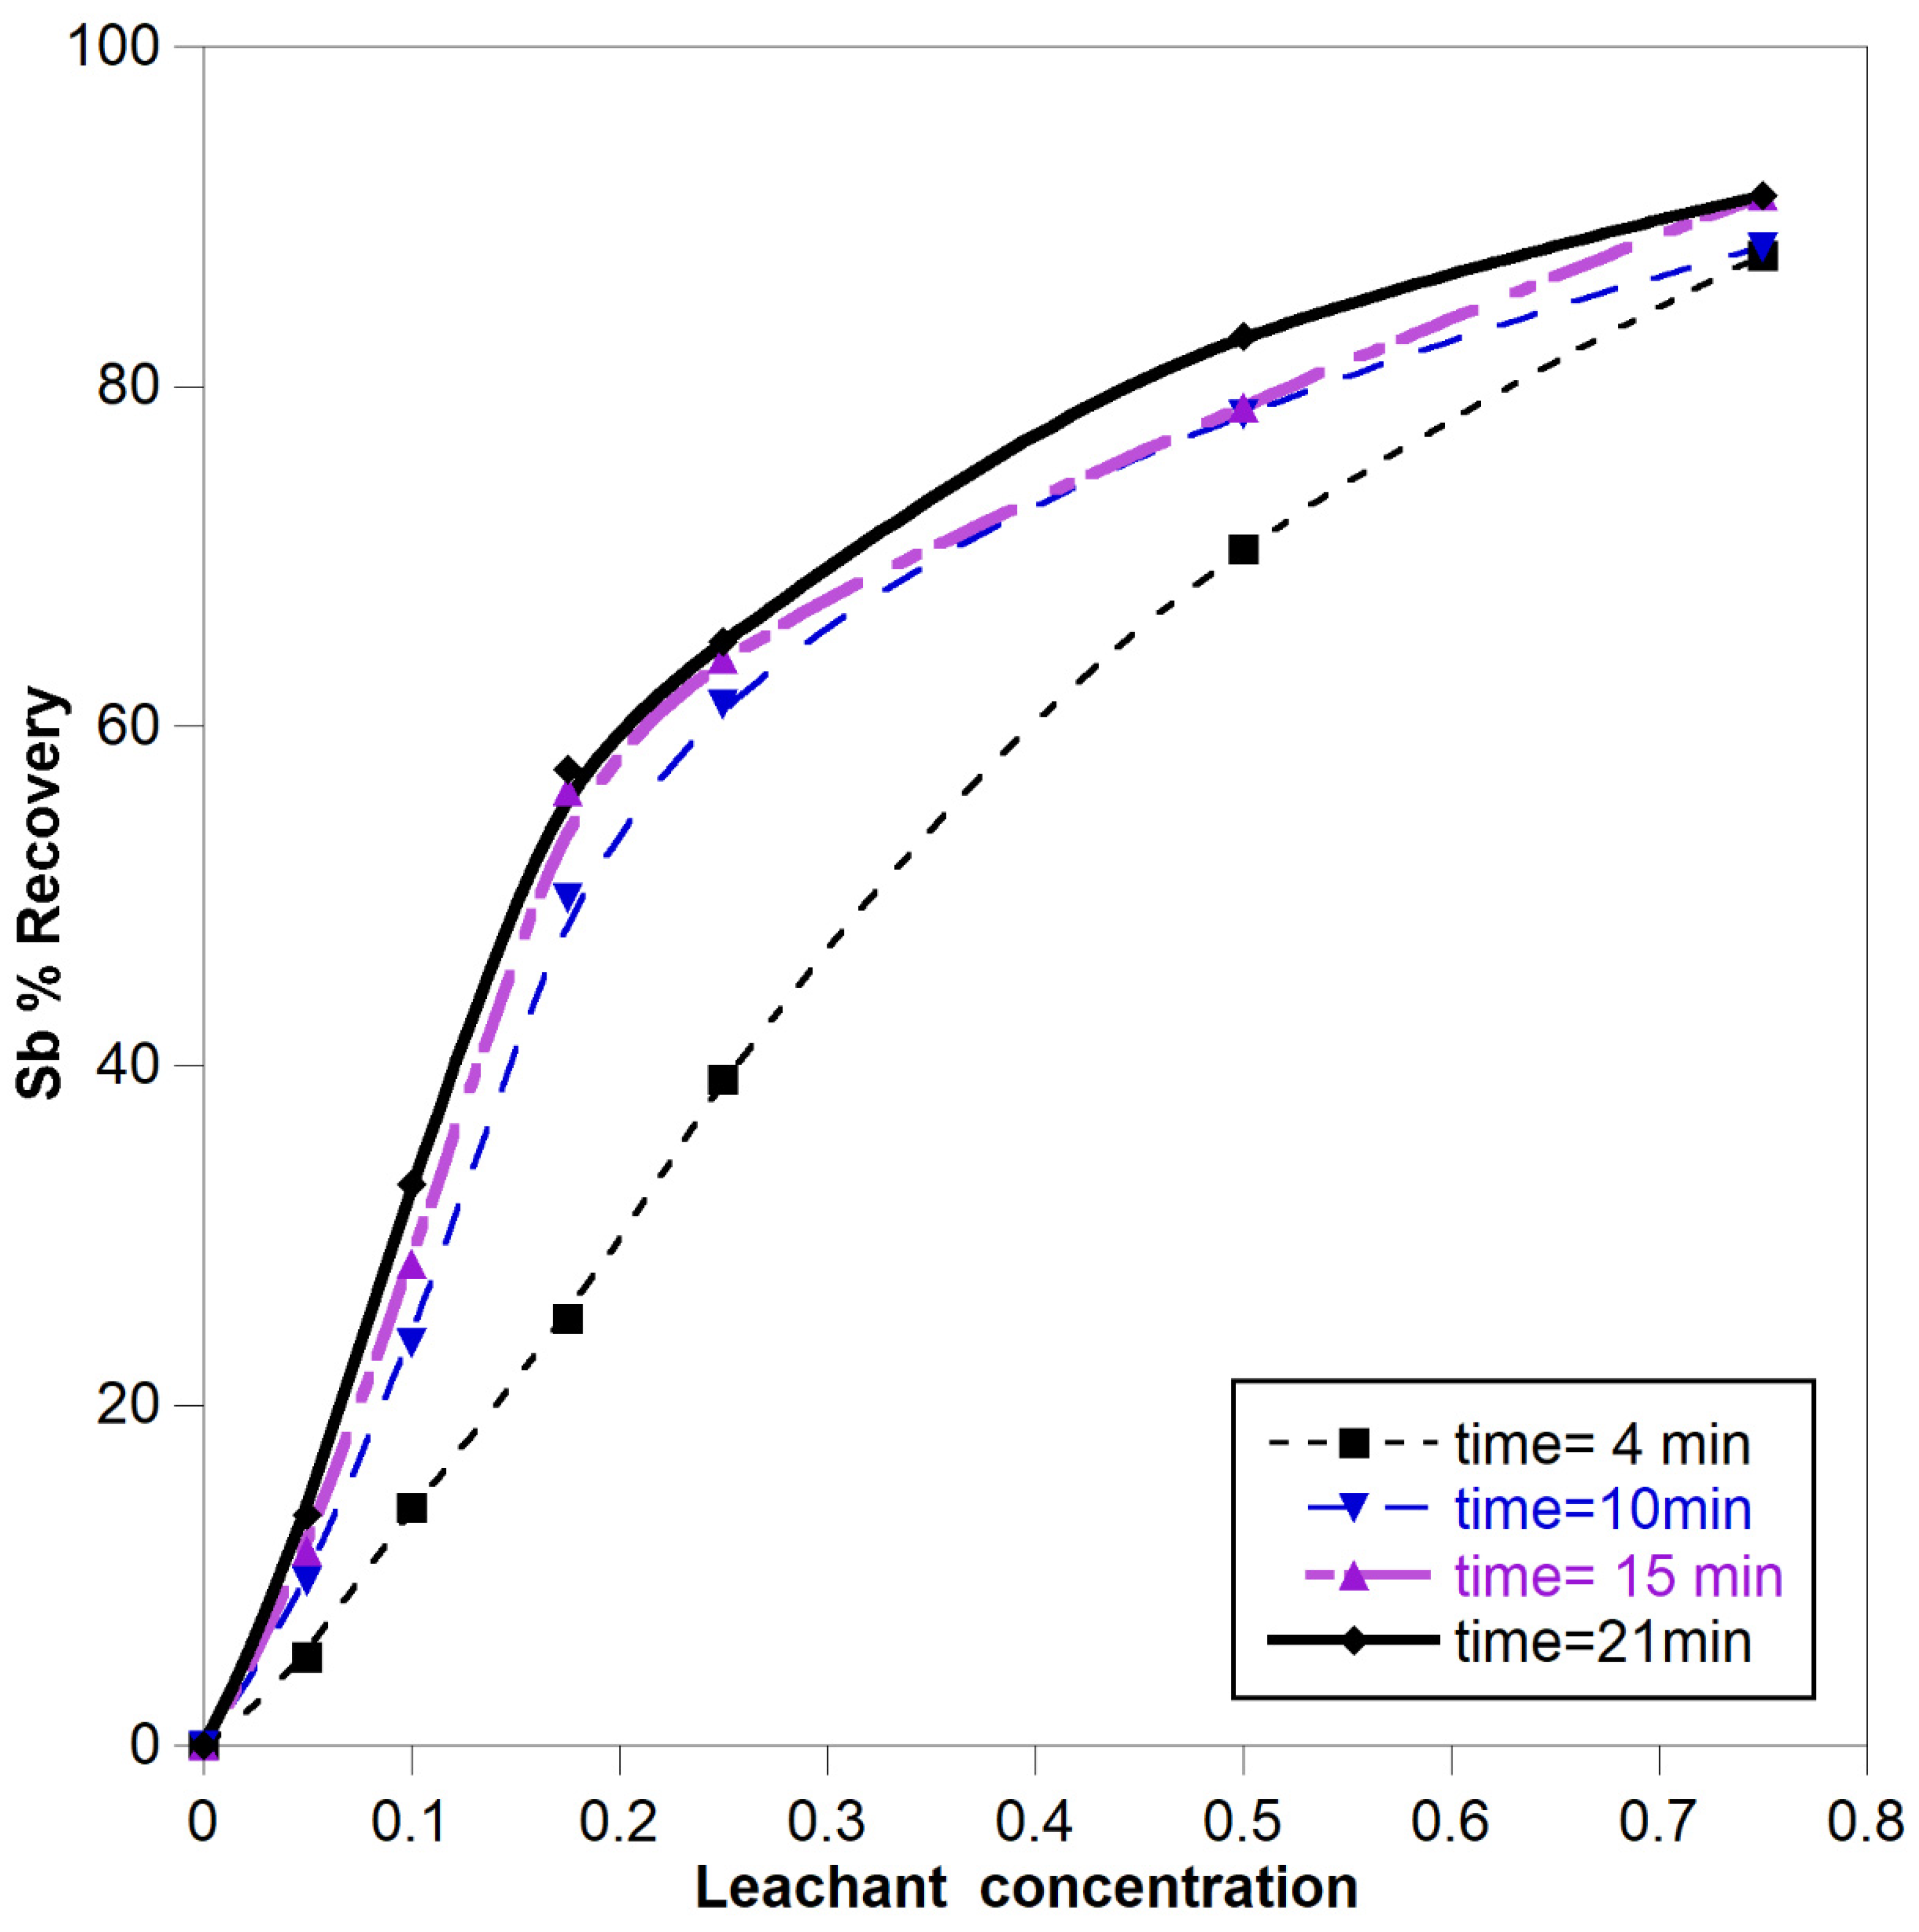
Figure 6.
EDX analysis of the leach residue sample with equal ratio 0.75/0.75 of the two solvents.
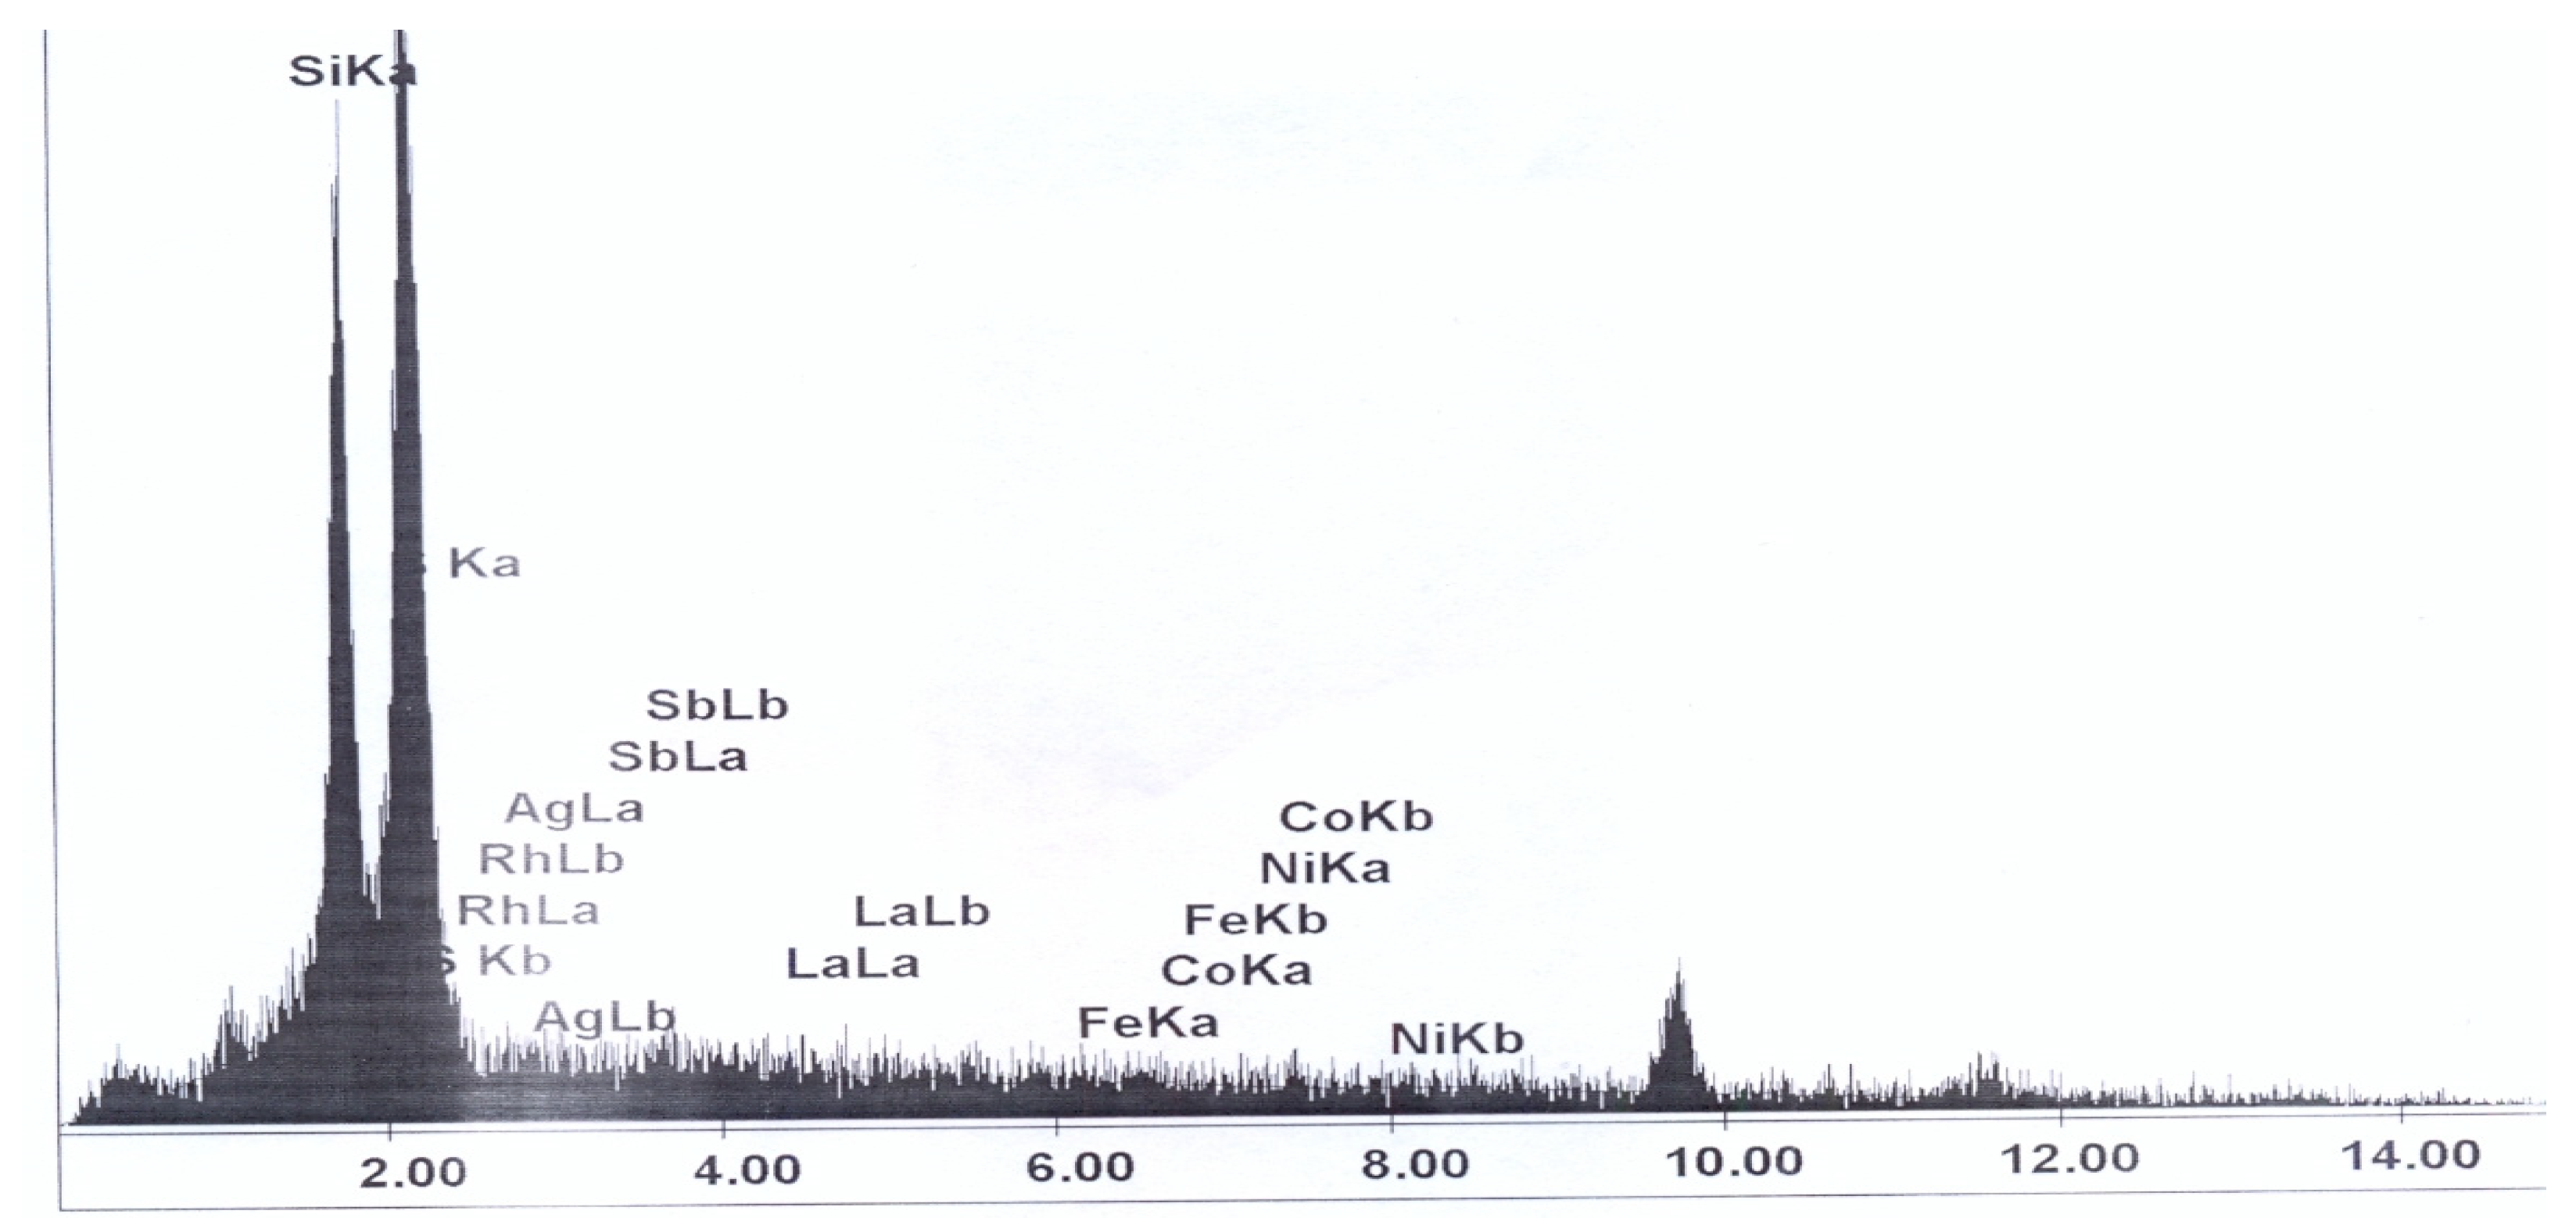
Figure 7.
Effect of temperature on Sb recovery from 298 k to 353 k, (1400 rpm, 0.1/0.1, +45-60#).
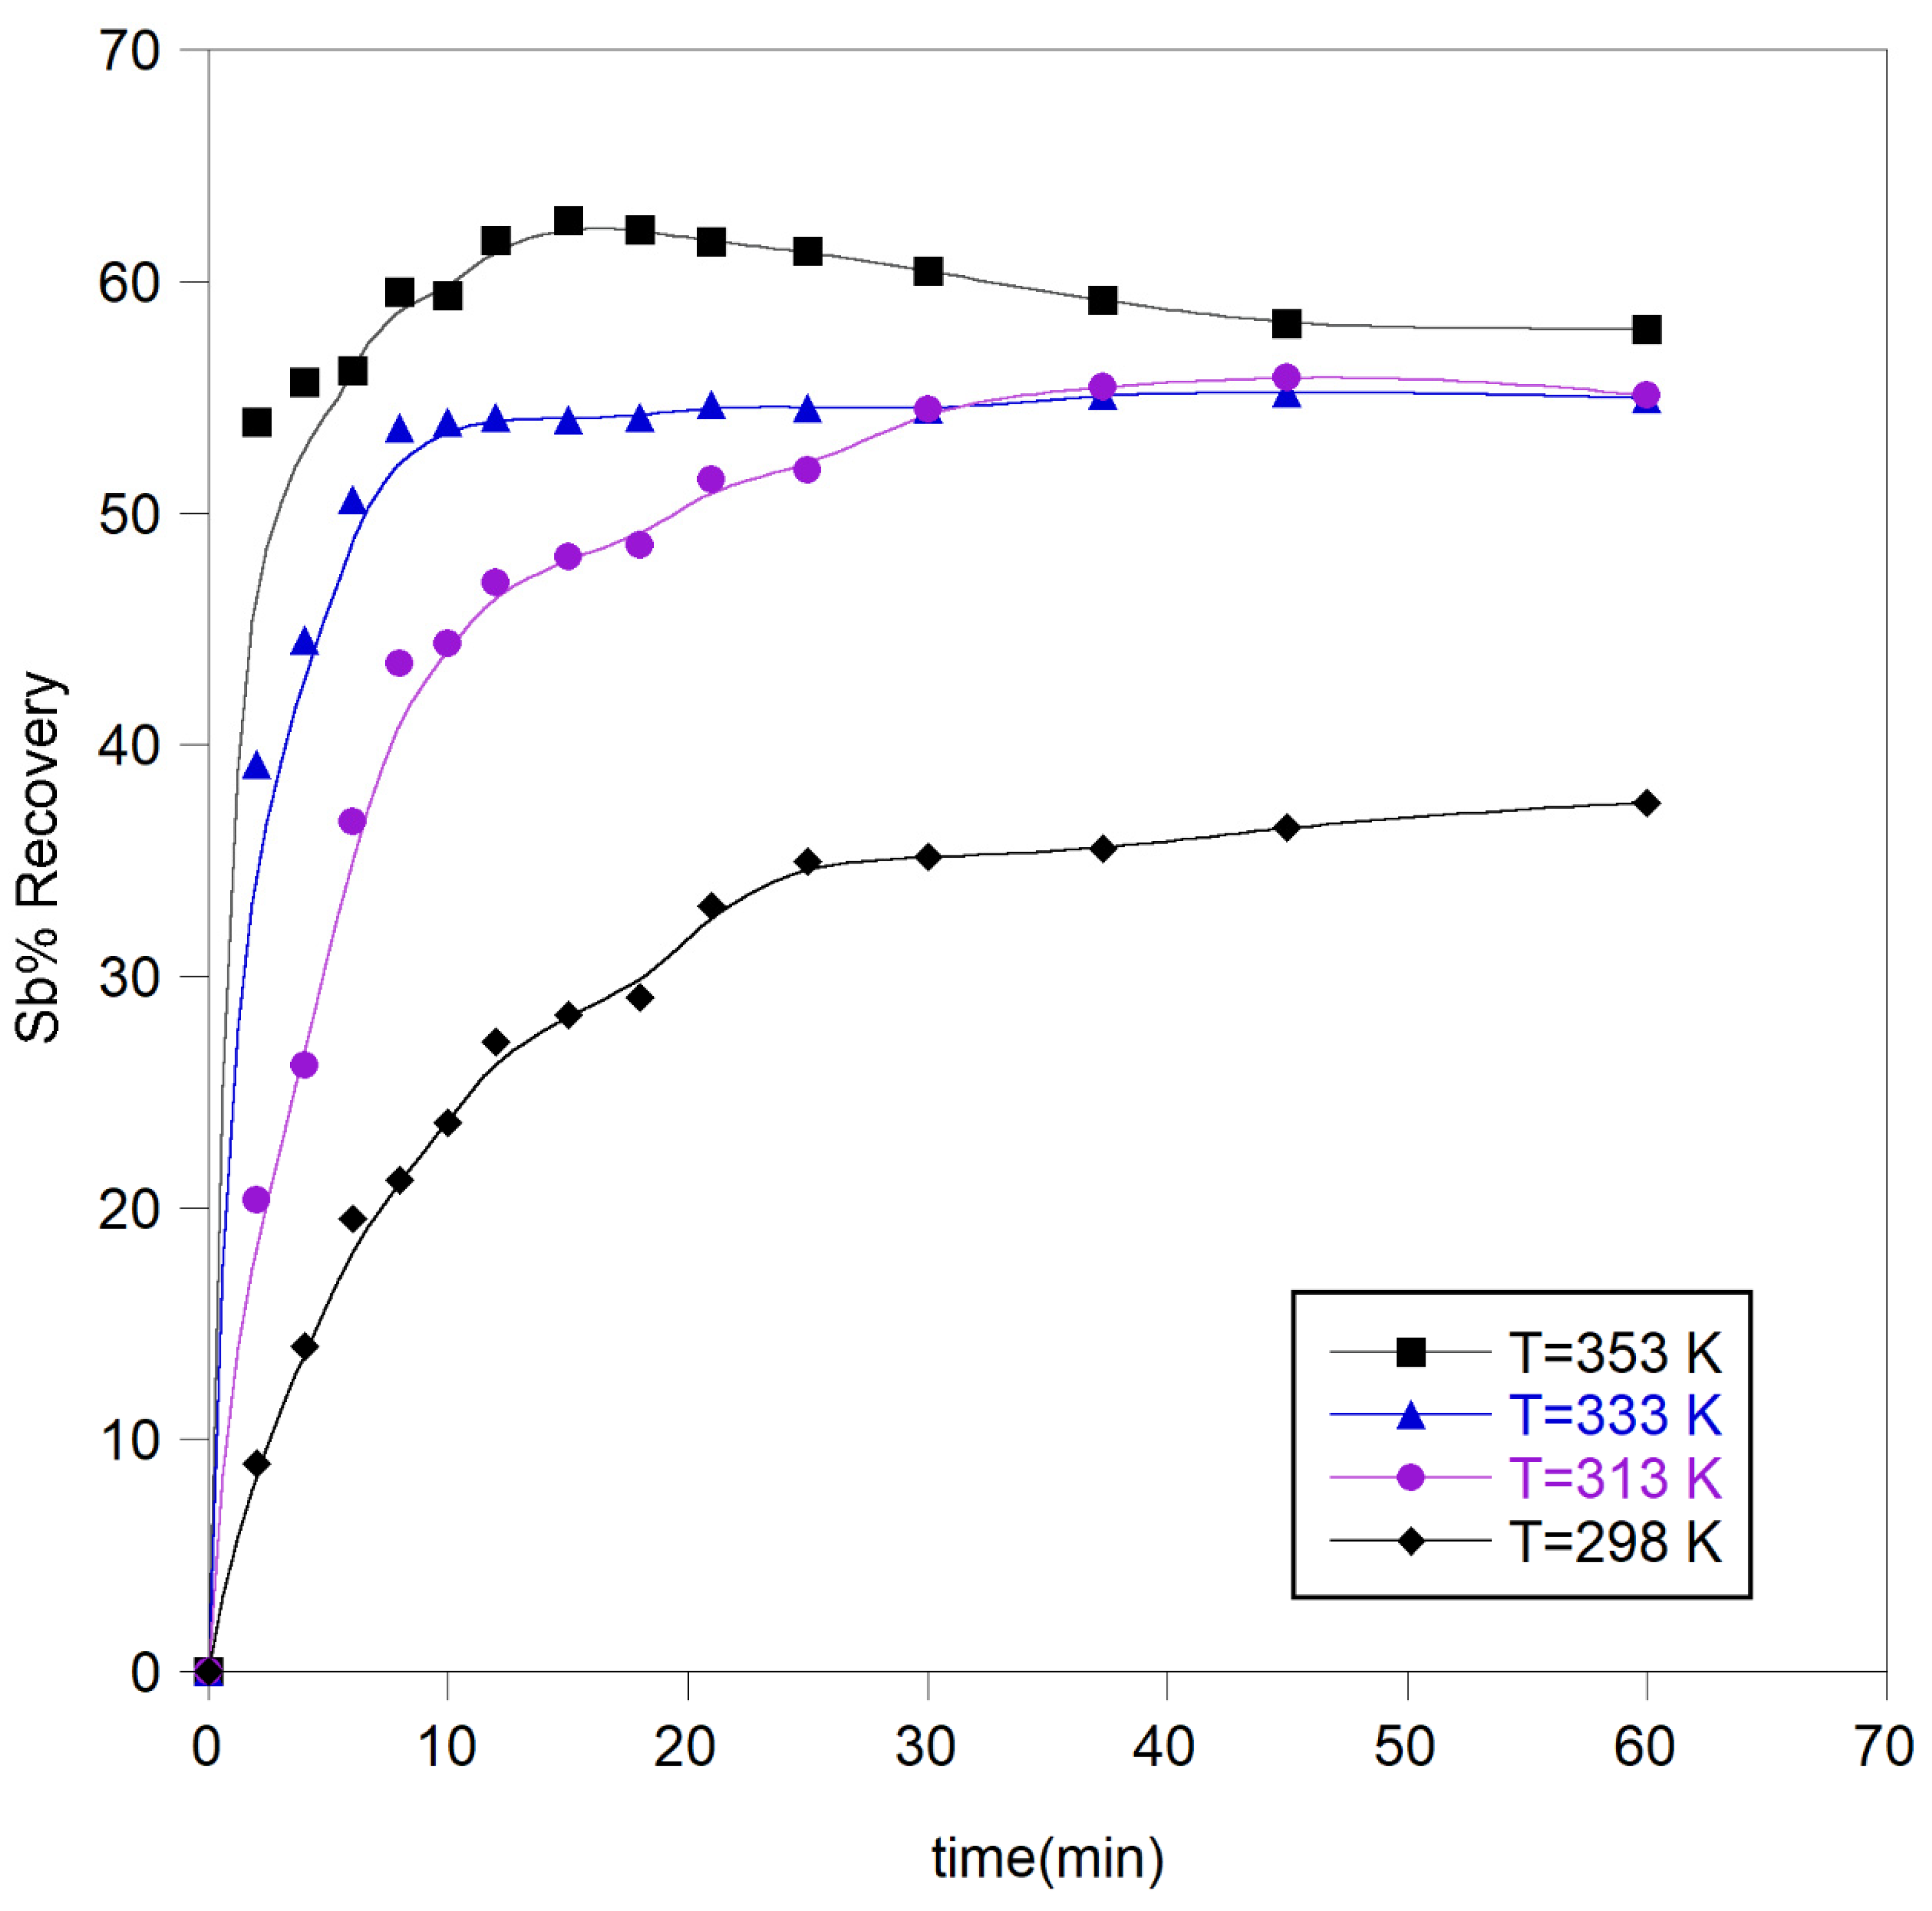
Figure 8.
Effect of solid to liquid ration on Sb recovery from 2 to 18 grams of stibnite in 500 ccs of solution, (1400 rpm, 0.1/0.1, +45-60#, T=25 0C).
Figure 8.
Effect of solid to liquid ration on Sb recovery from 2 to 18 grams of stibnite in 500 ccs of solution, (1400 rpm, 0.1/0.1, +45-60#, T=25 0C).
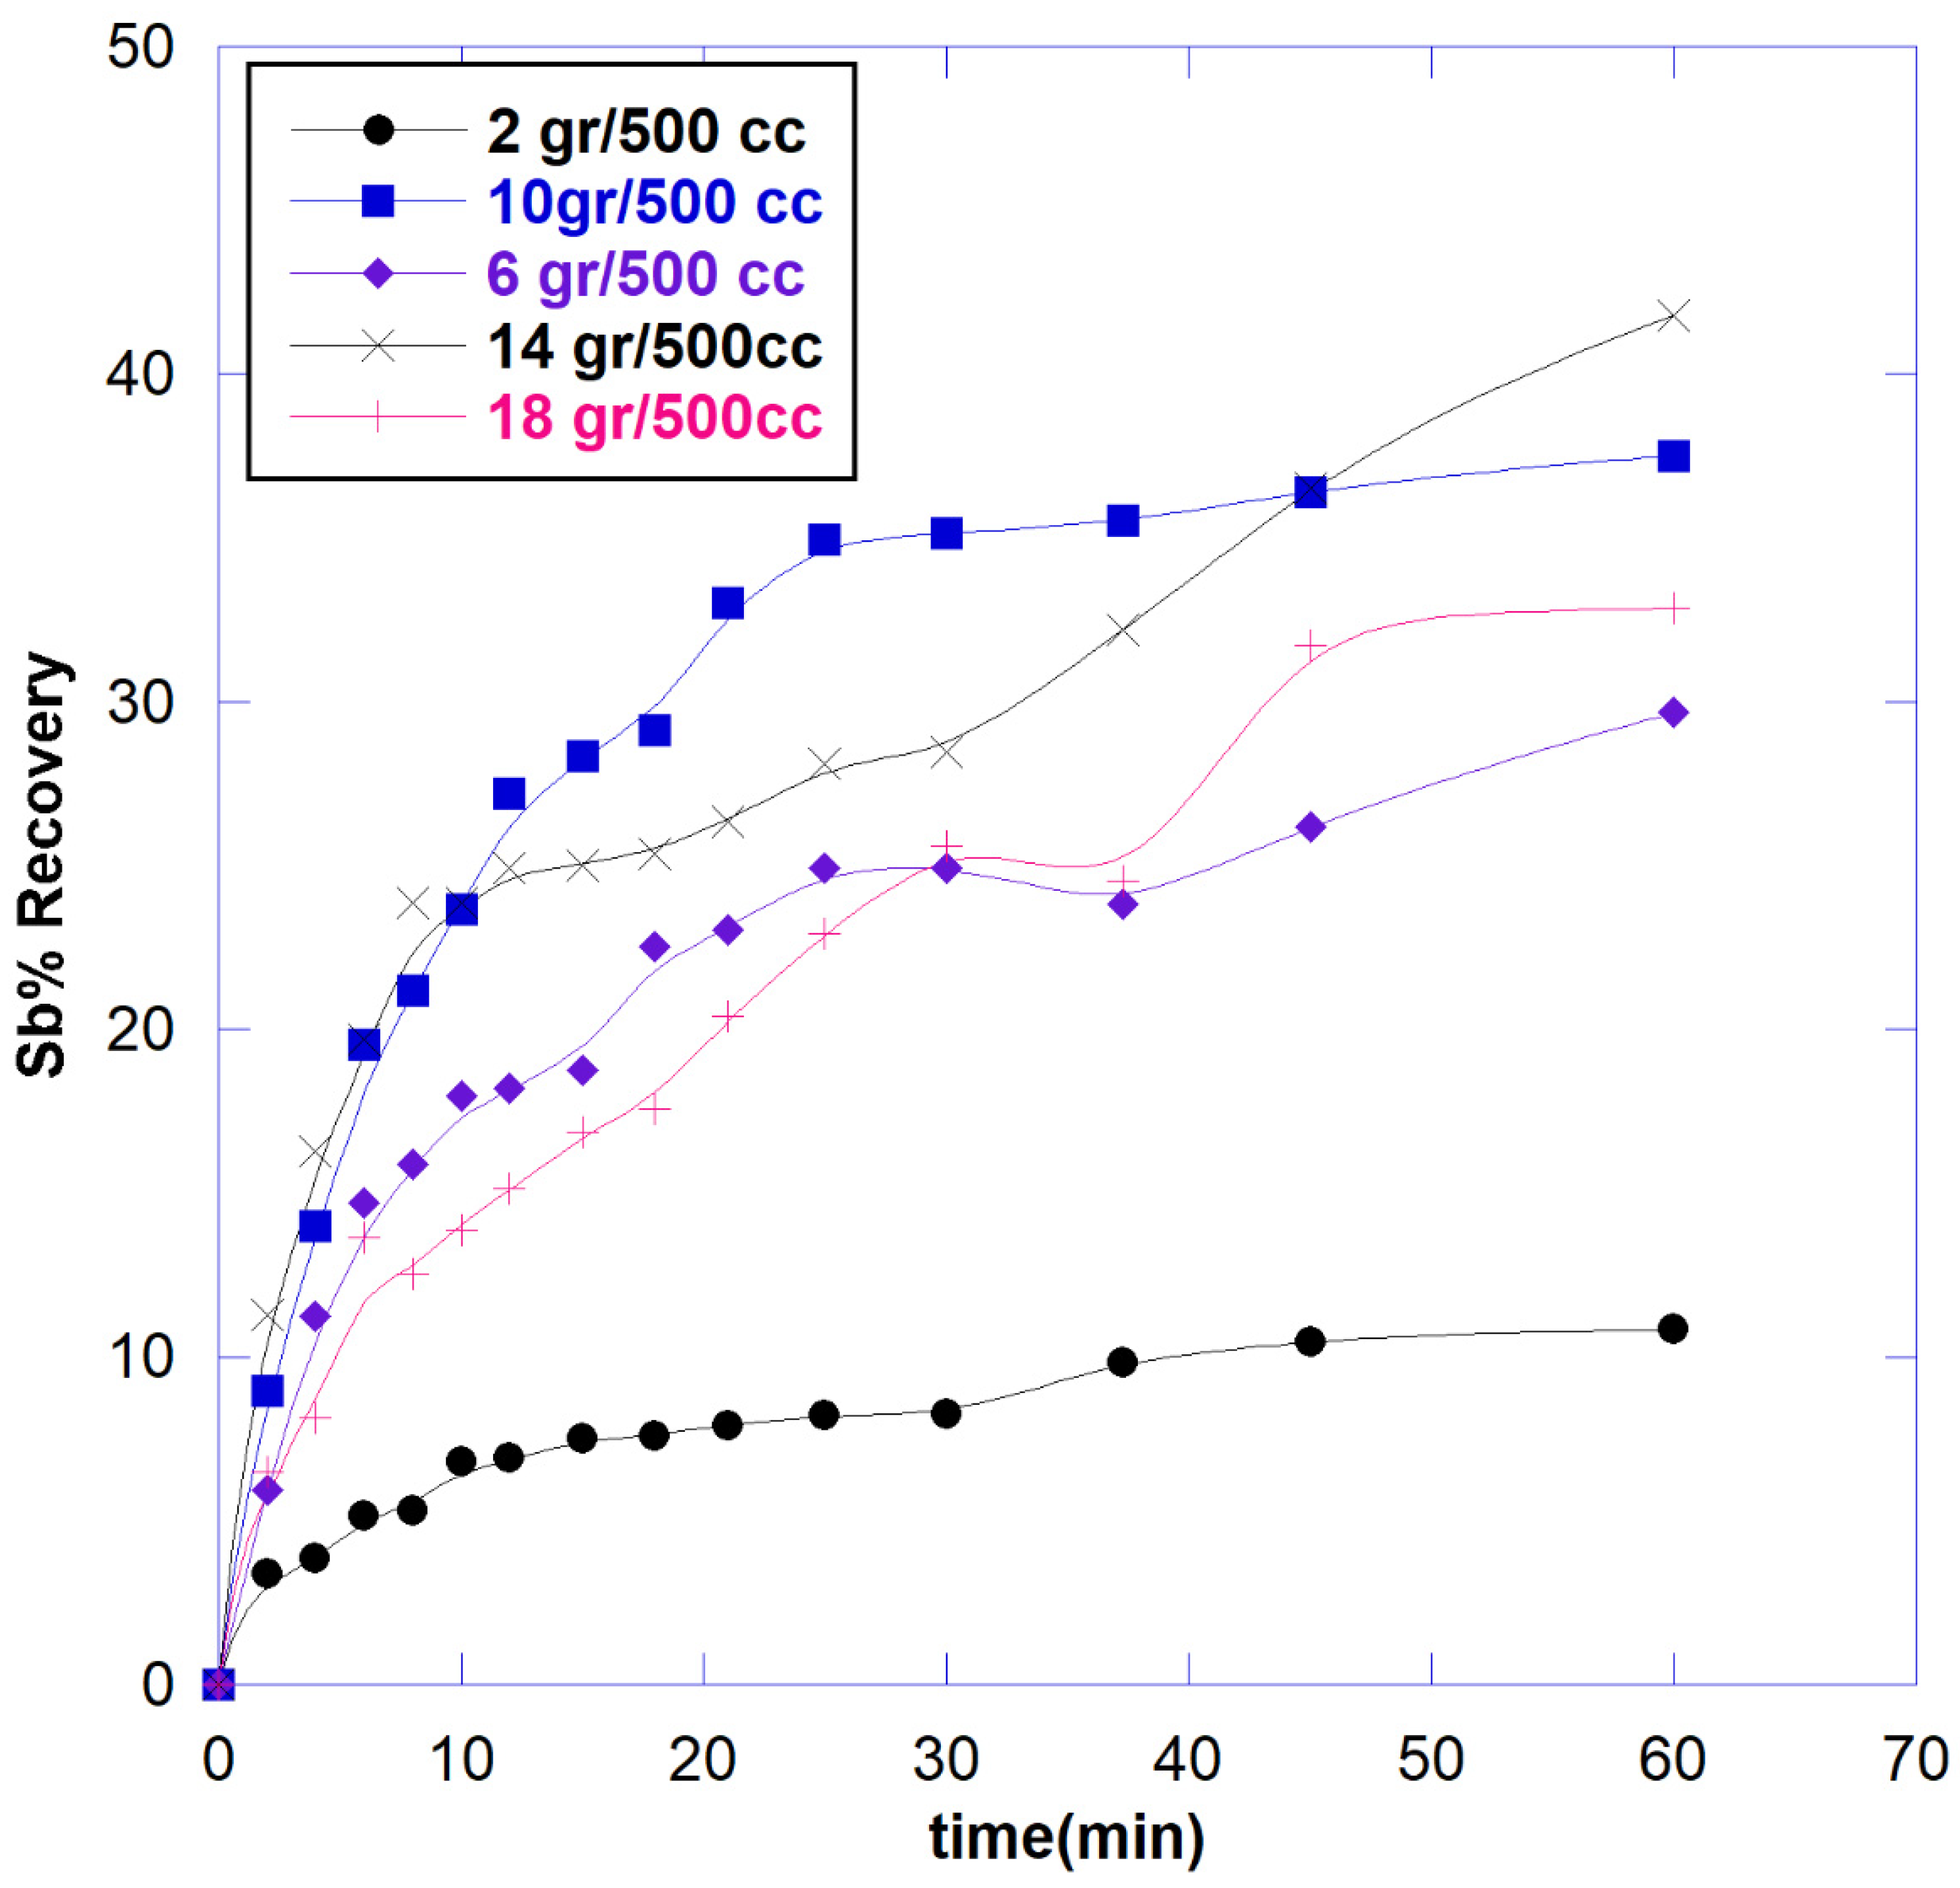
Figure 9.
Effect of particle size distribution on Sb recovery from (+45-60# to +100-120#) of stibnite in, (1400 rpm, 0.1/0.1, +45-60#, T=25 0C).
Figure 9.
Effect of particle size distribution on Sb recovery from (+45-60# to +100-120#) of stibnite in, (1400 rpm, 0.1/0.1, +45-60#, T=25 0C).
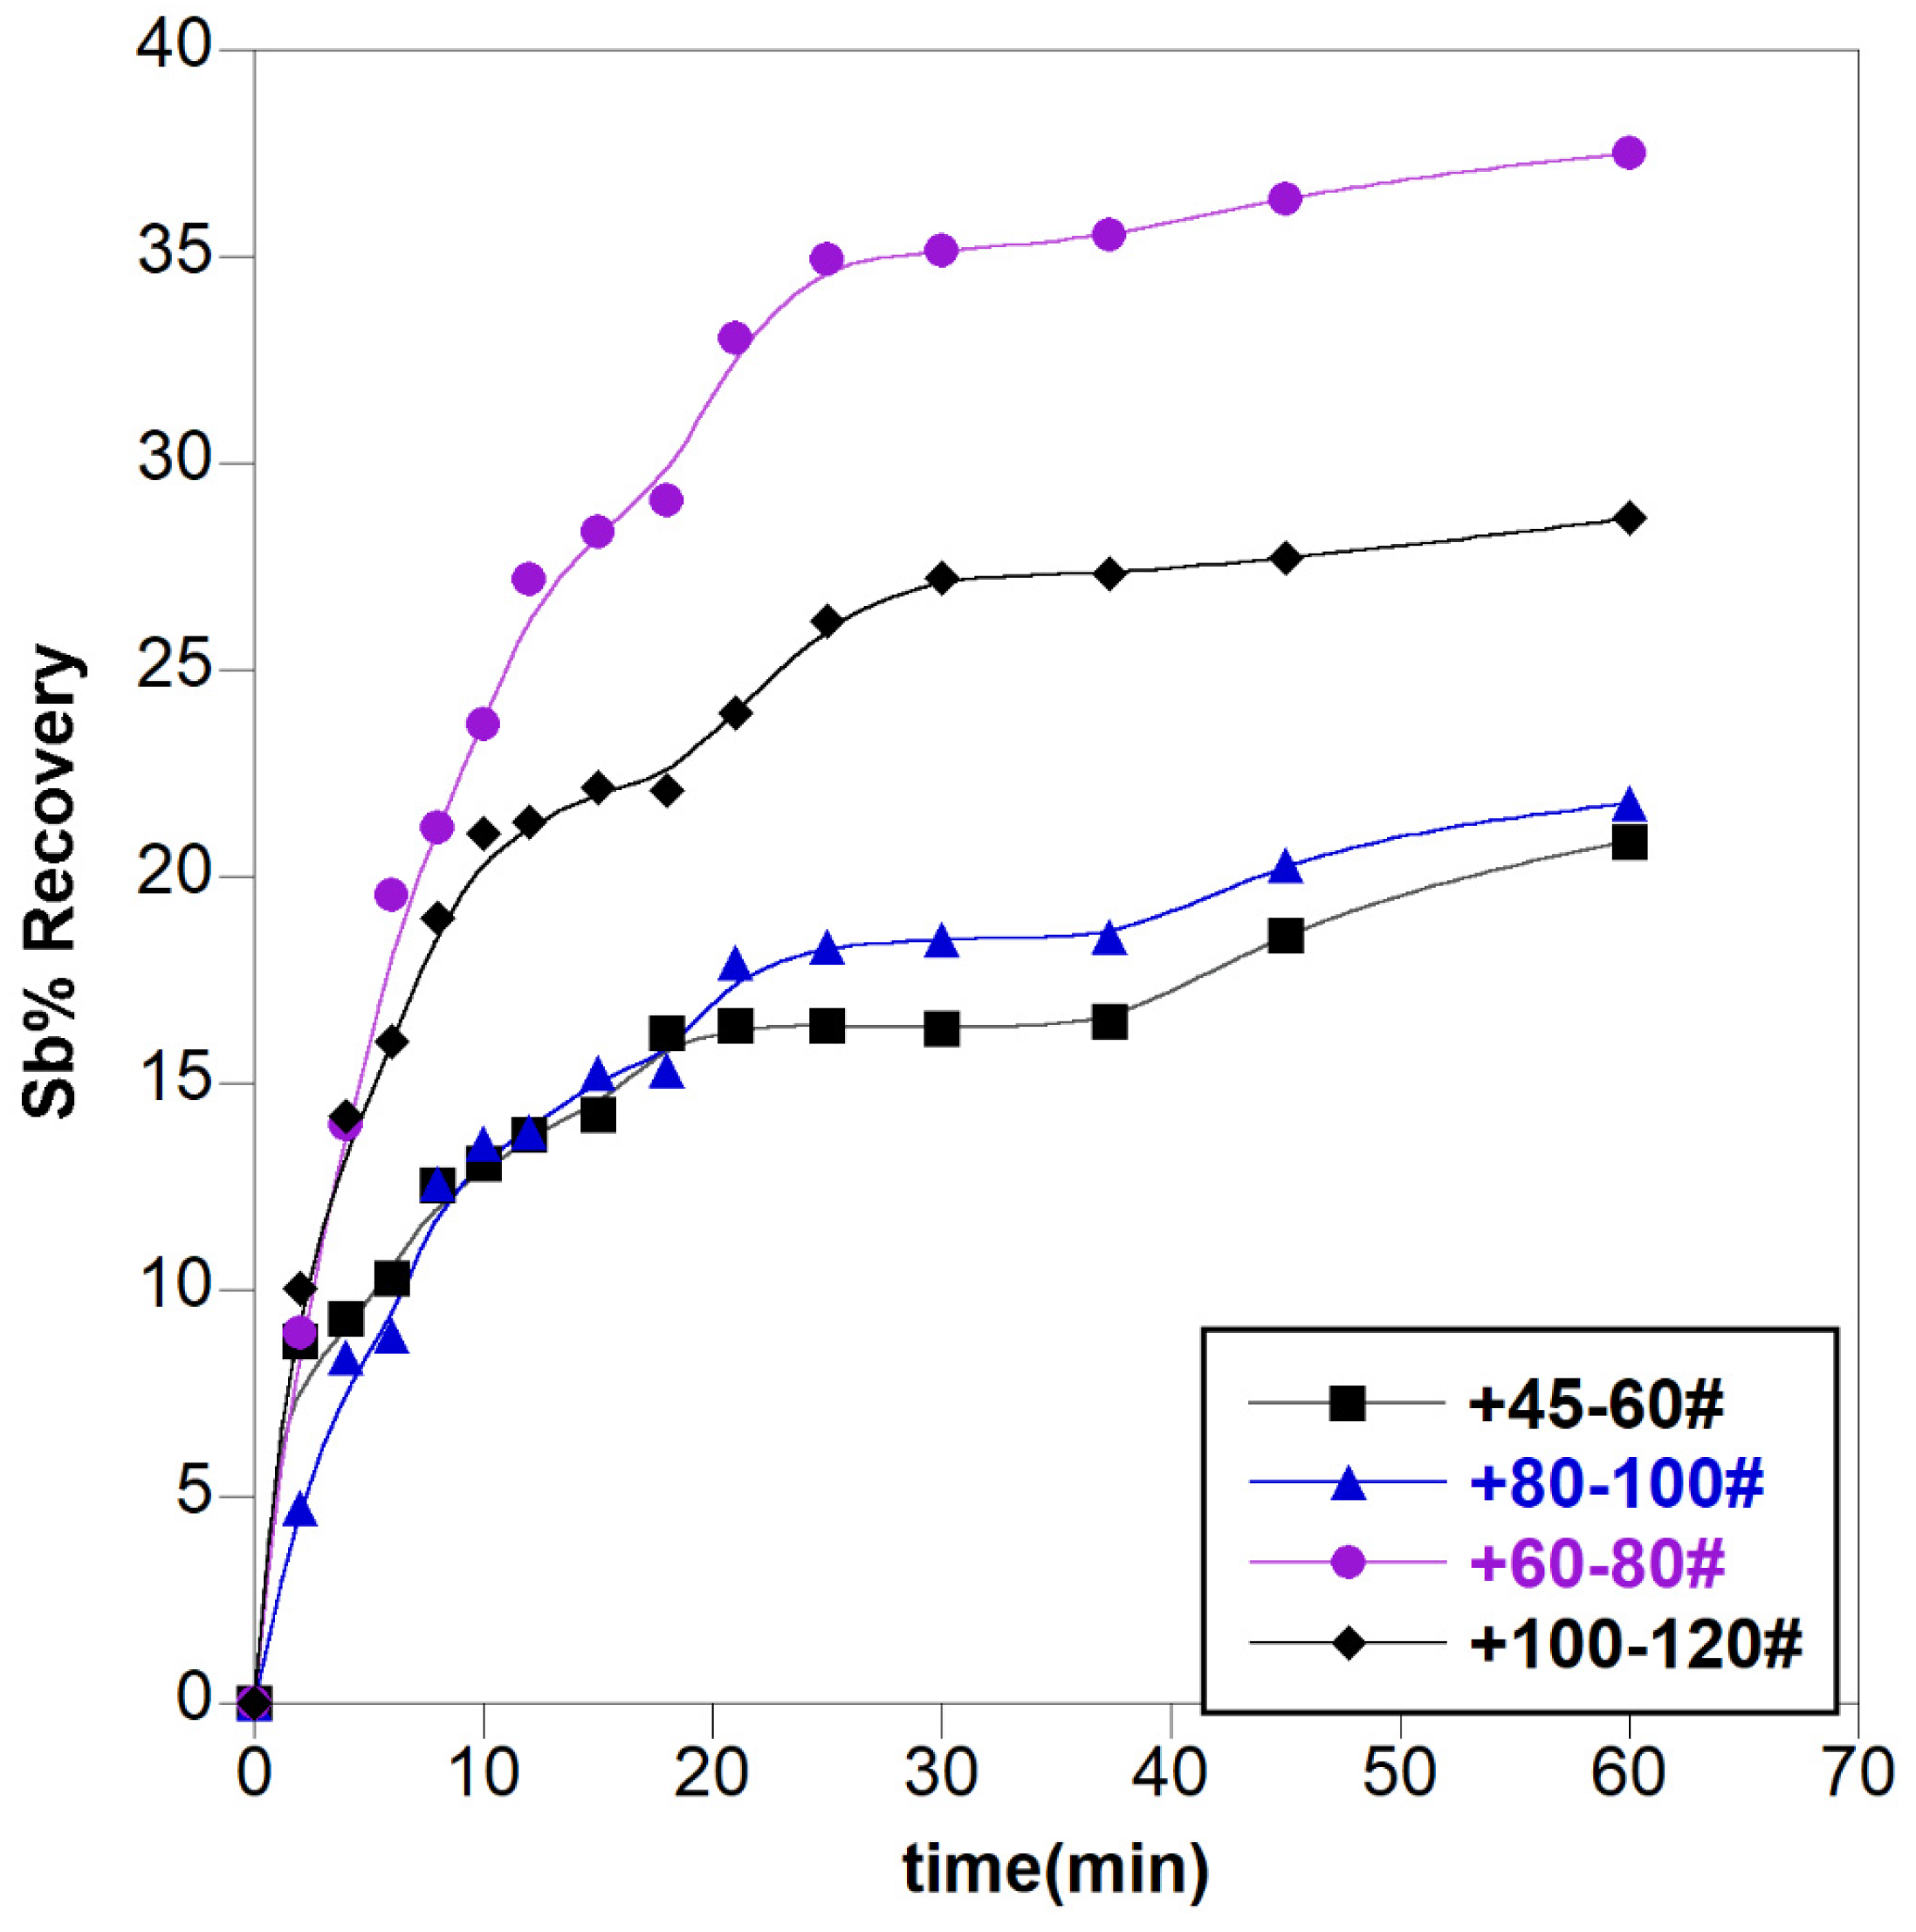
Figure 10.
—The shape and particle distribution of stibnite ore before alkaline leaching using SEM technic for investigating of SCM, a. before leaching, b. after leaching.
Figure 10.
—The shape and particle distribution of stibnite ore before alkaline leaching using SEM technic for investigating of SCM, a. before leaching, b. after leaching.
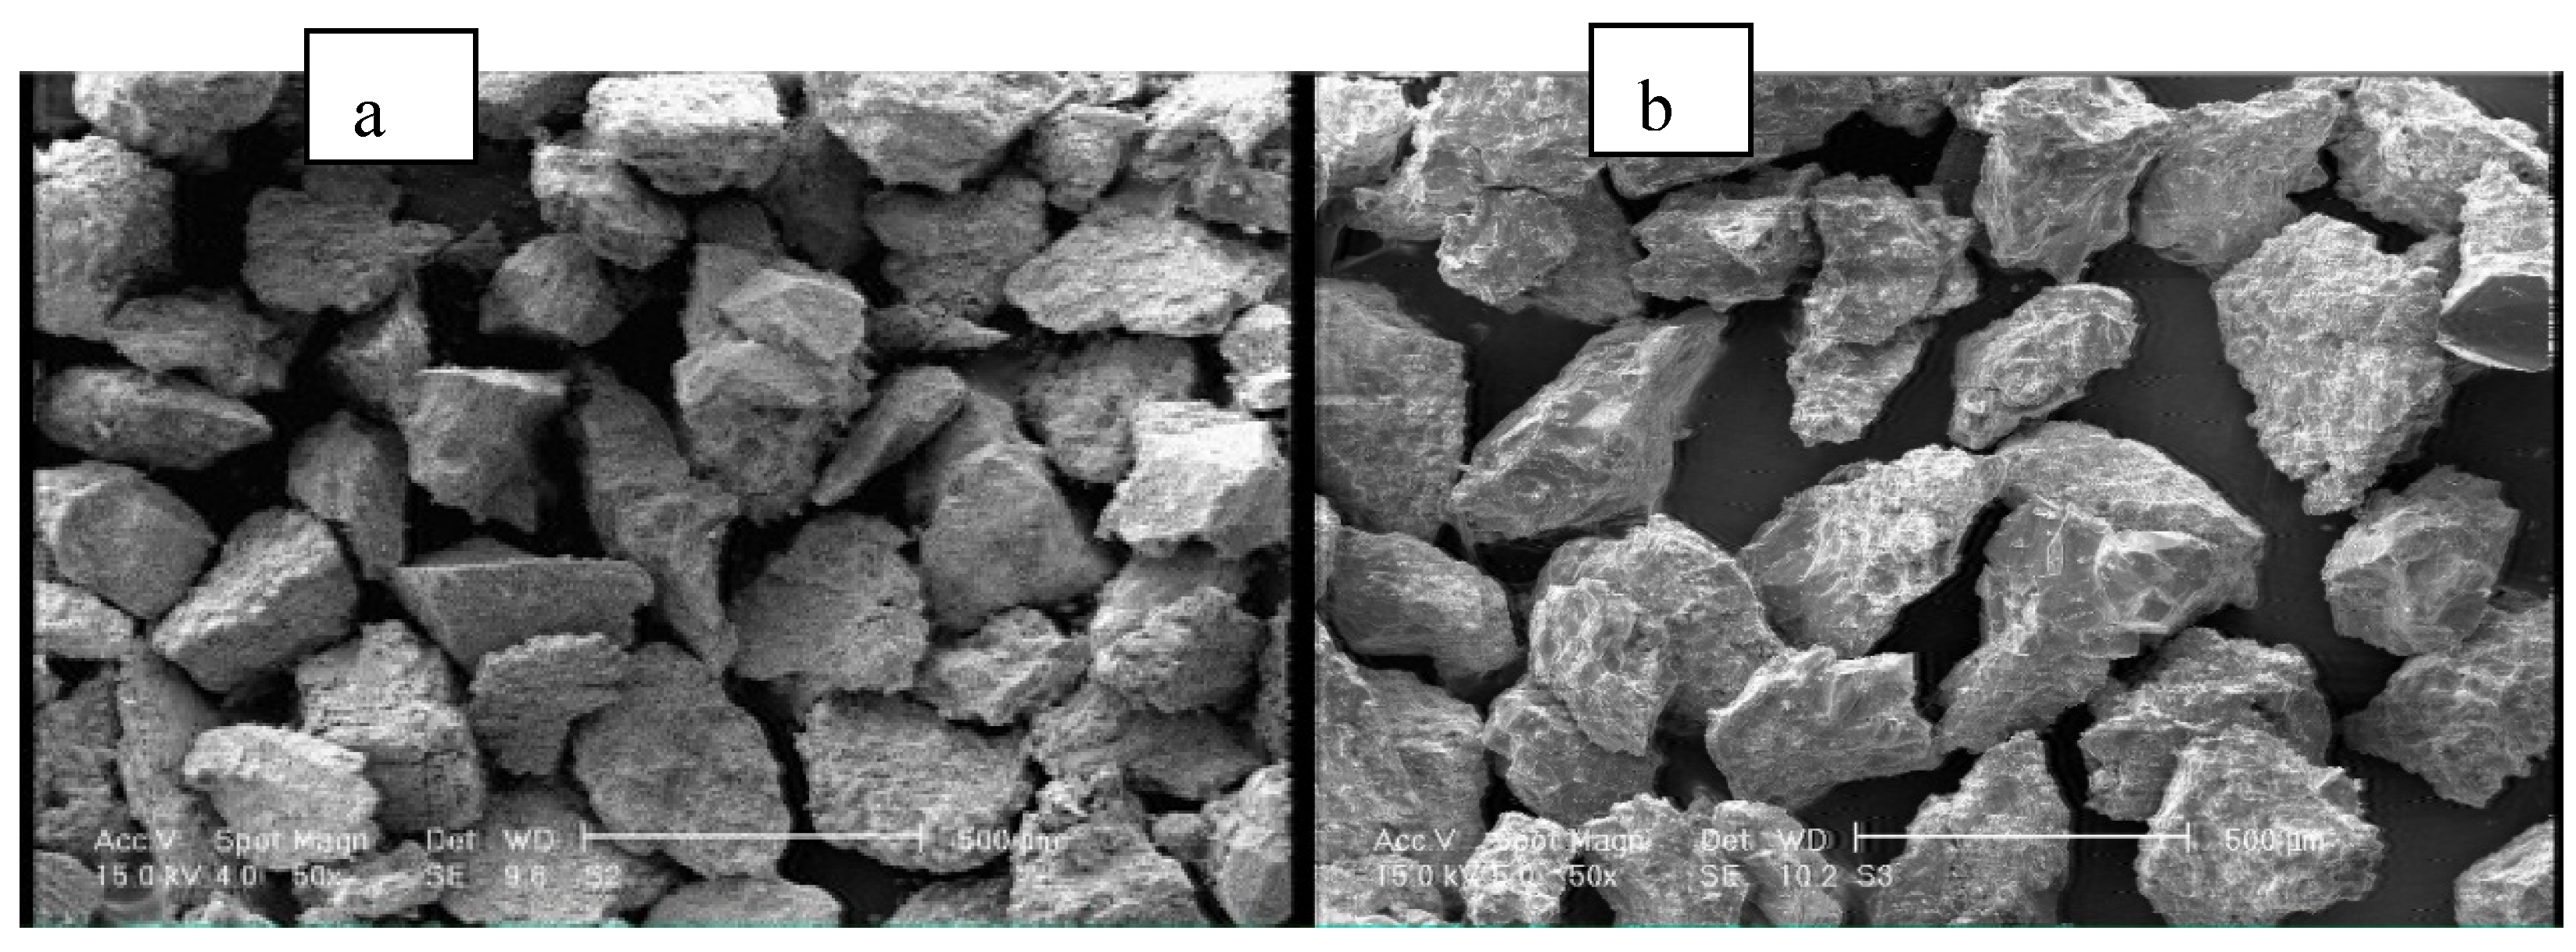
Figure 11.
The perturbation versus different ratios of Na2S to NaOH.
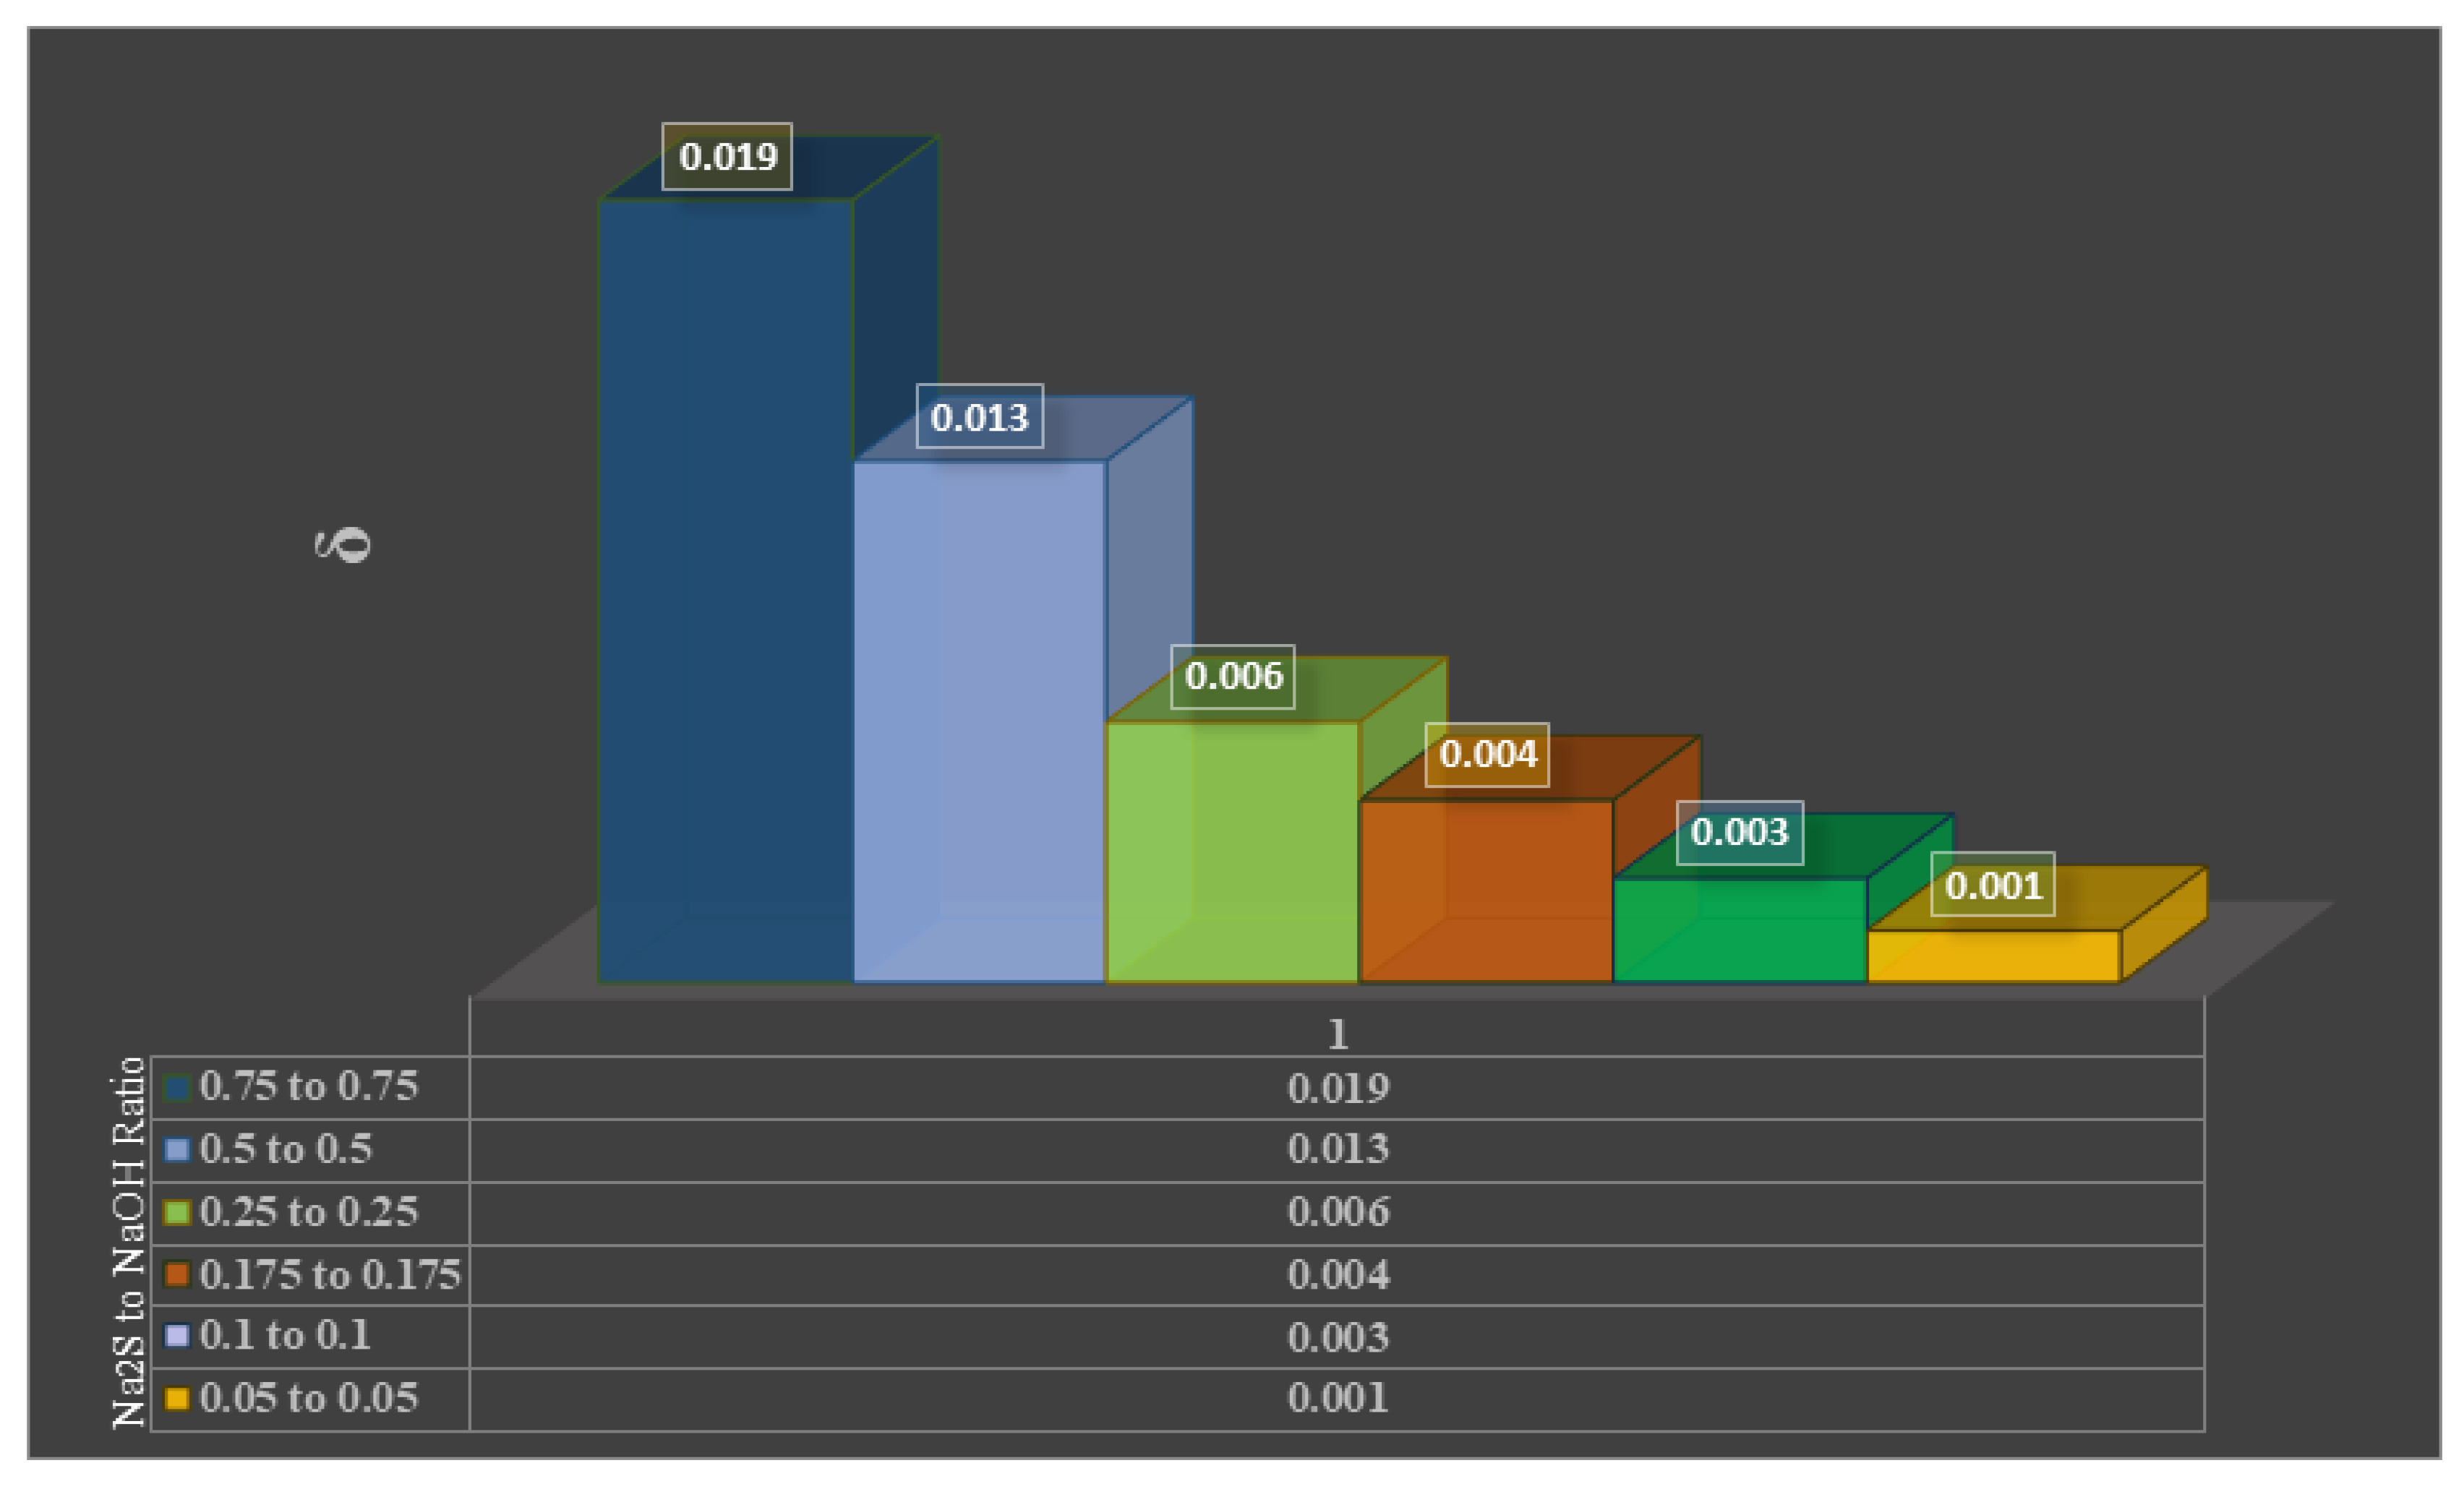
Figure 12.
Determination of the reaction order in logarithmic scale in equal ratios.
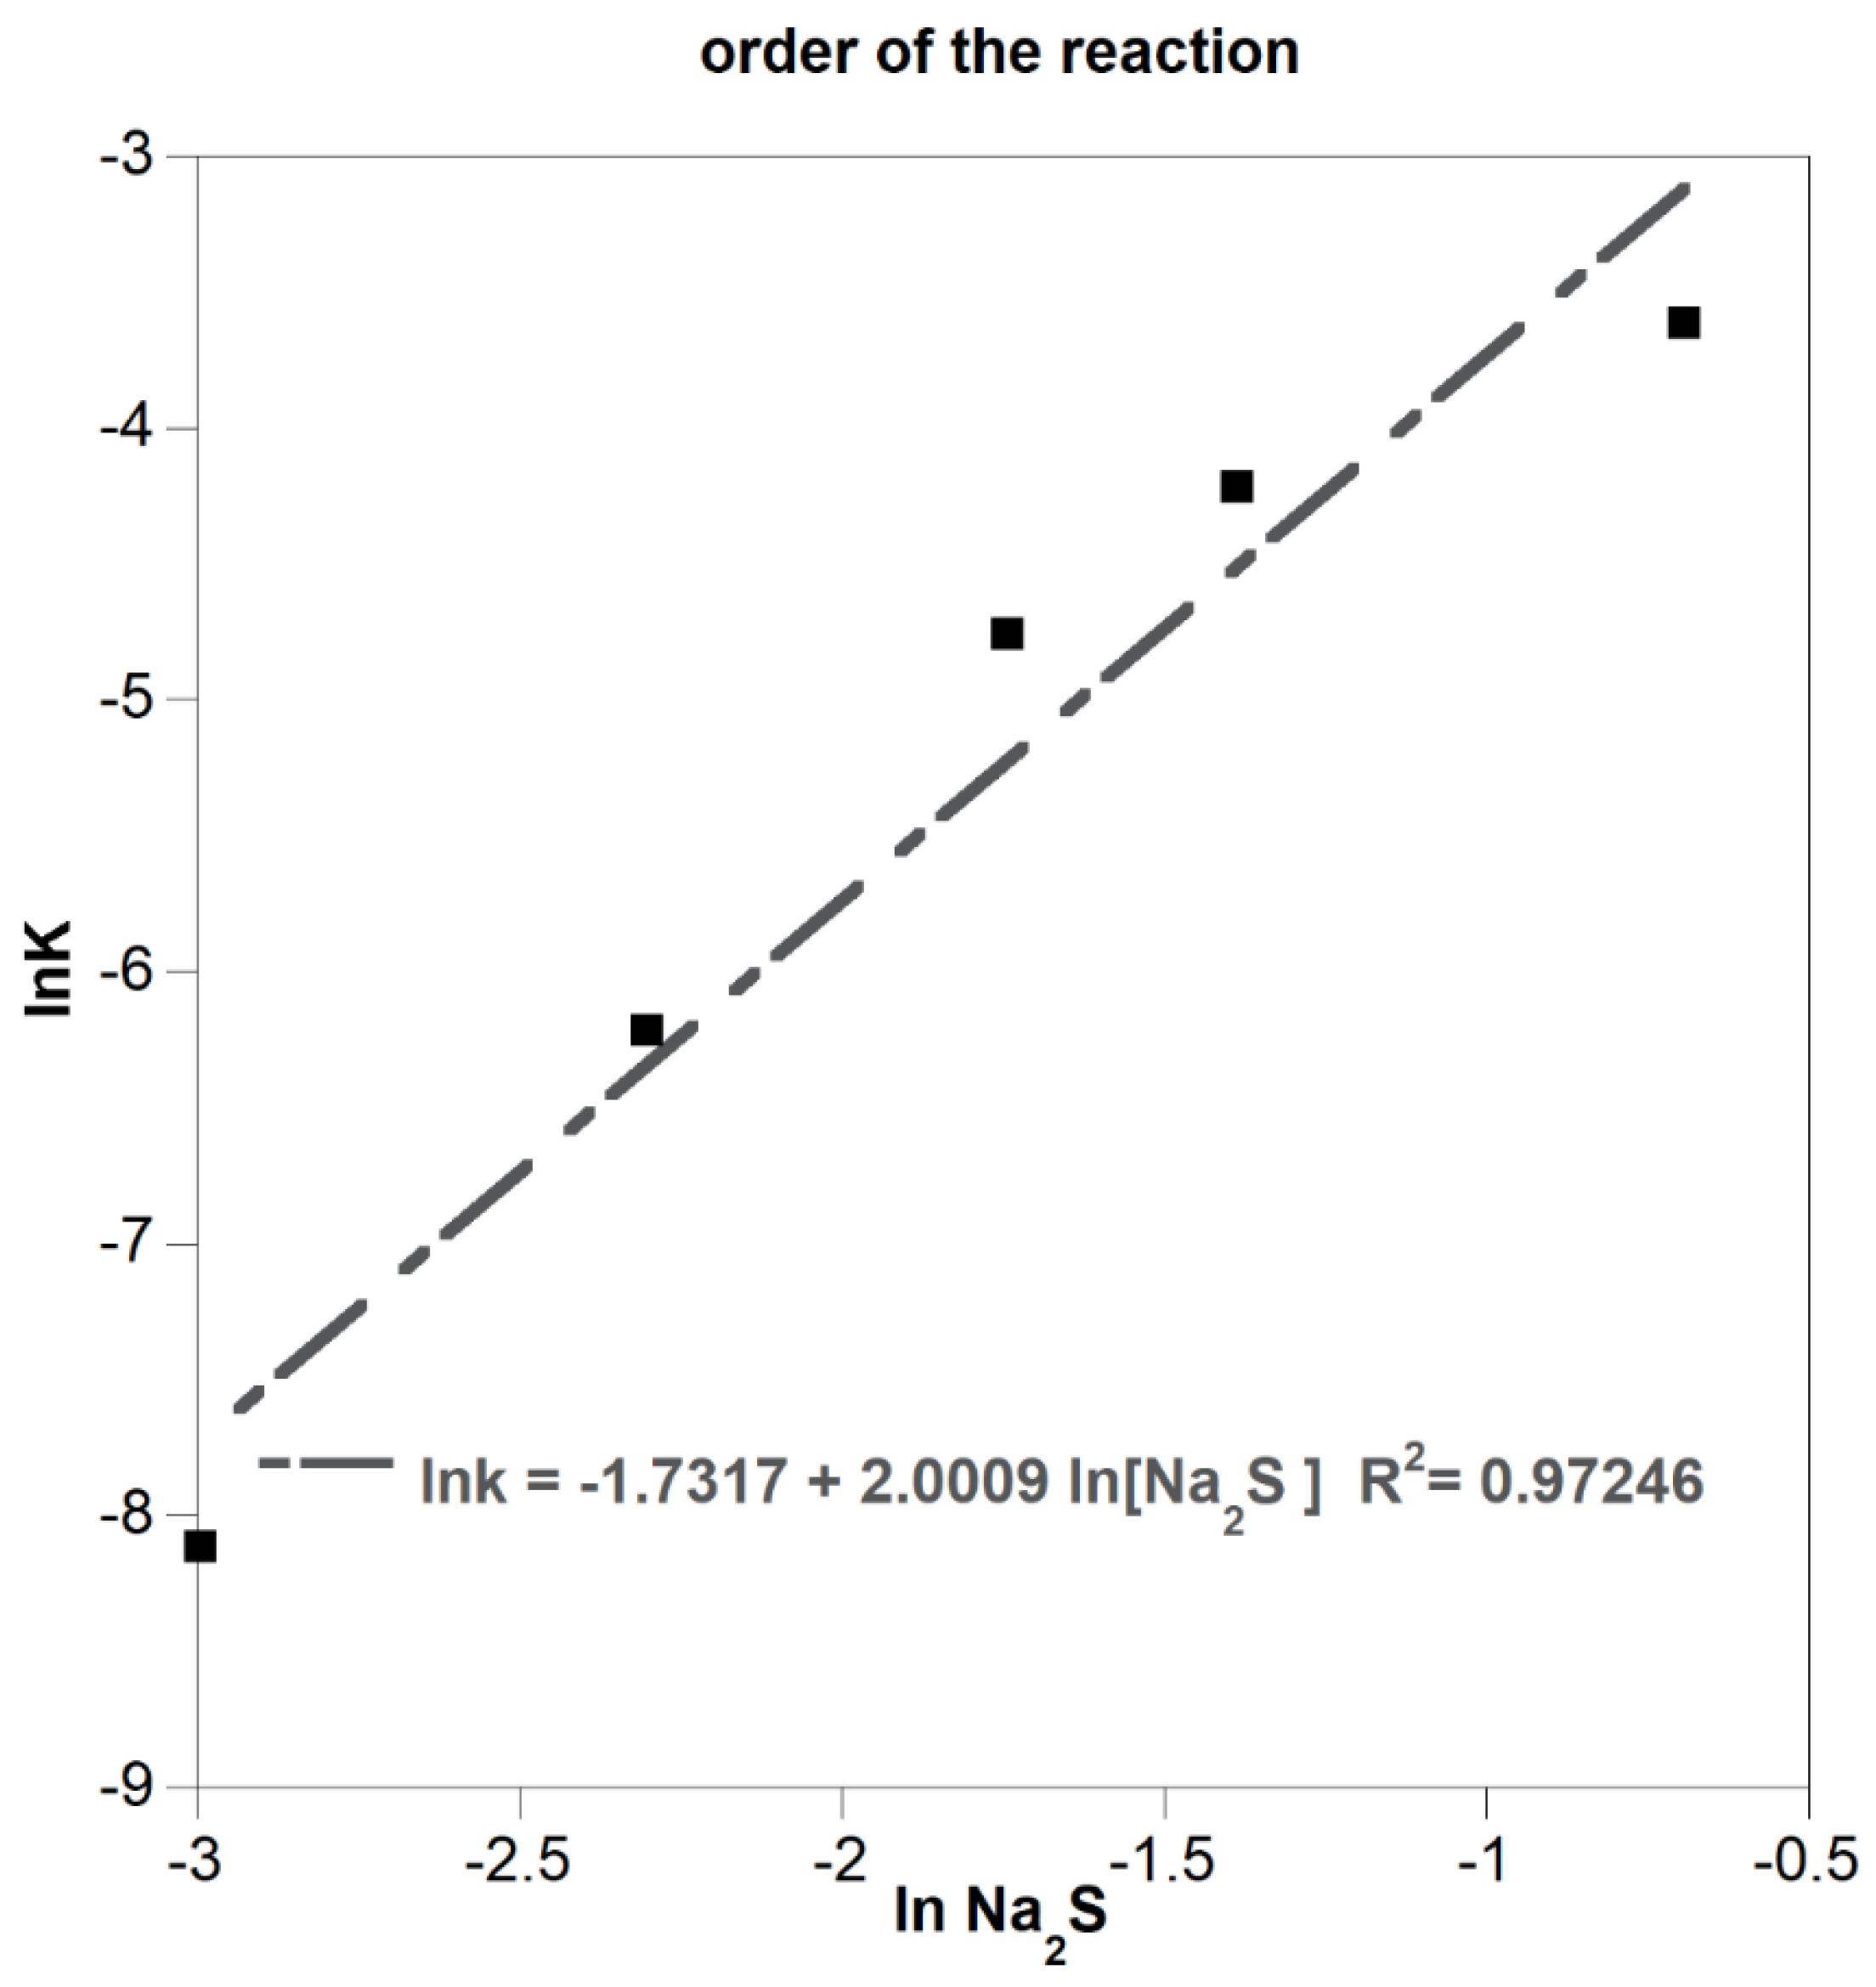
Figure 13.
—Determination of the mechanism using activation energy (1400 rpm, 0.1/0.1, +45-60#).
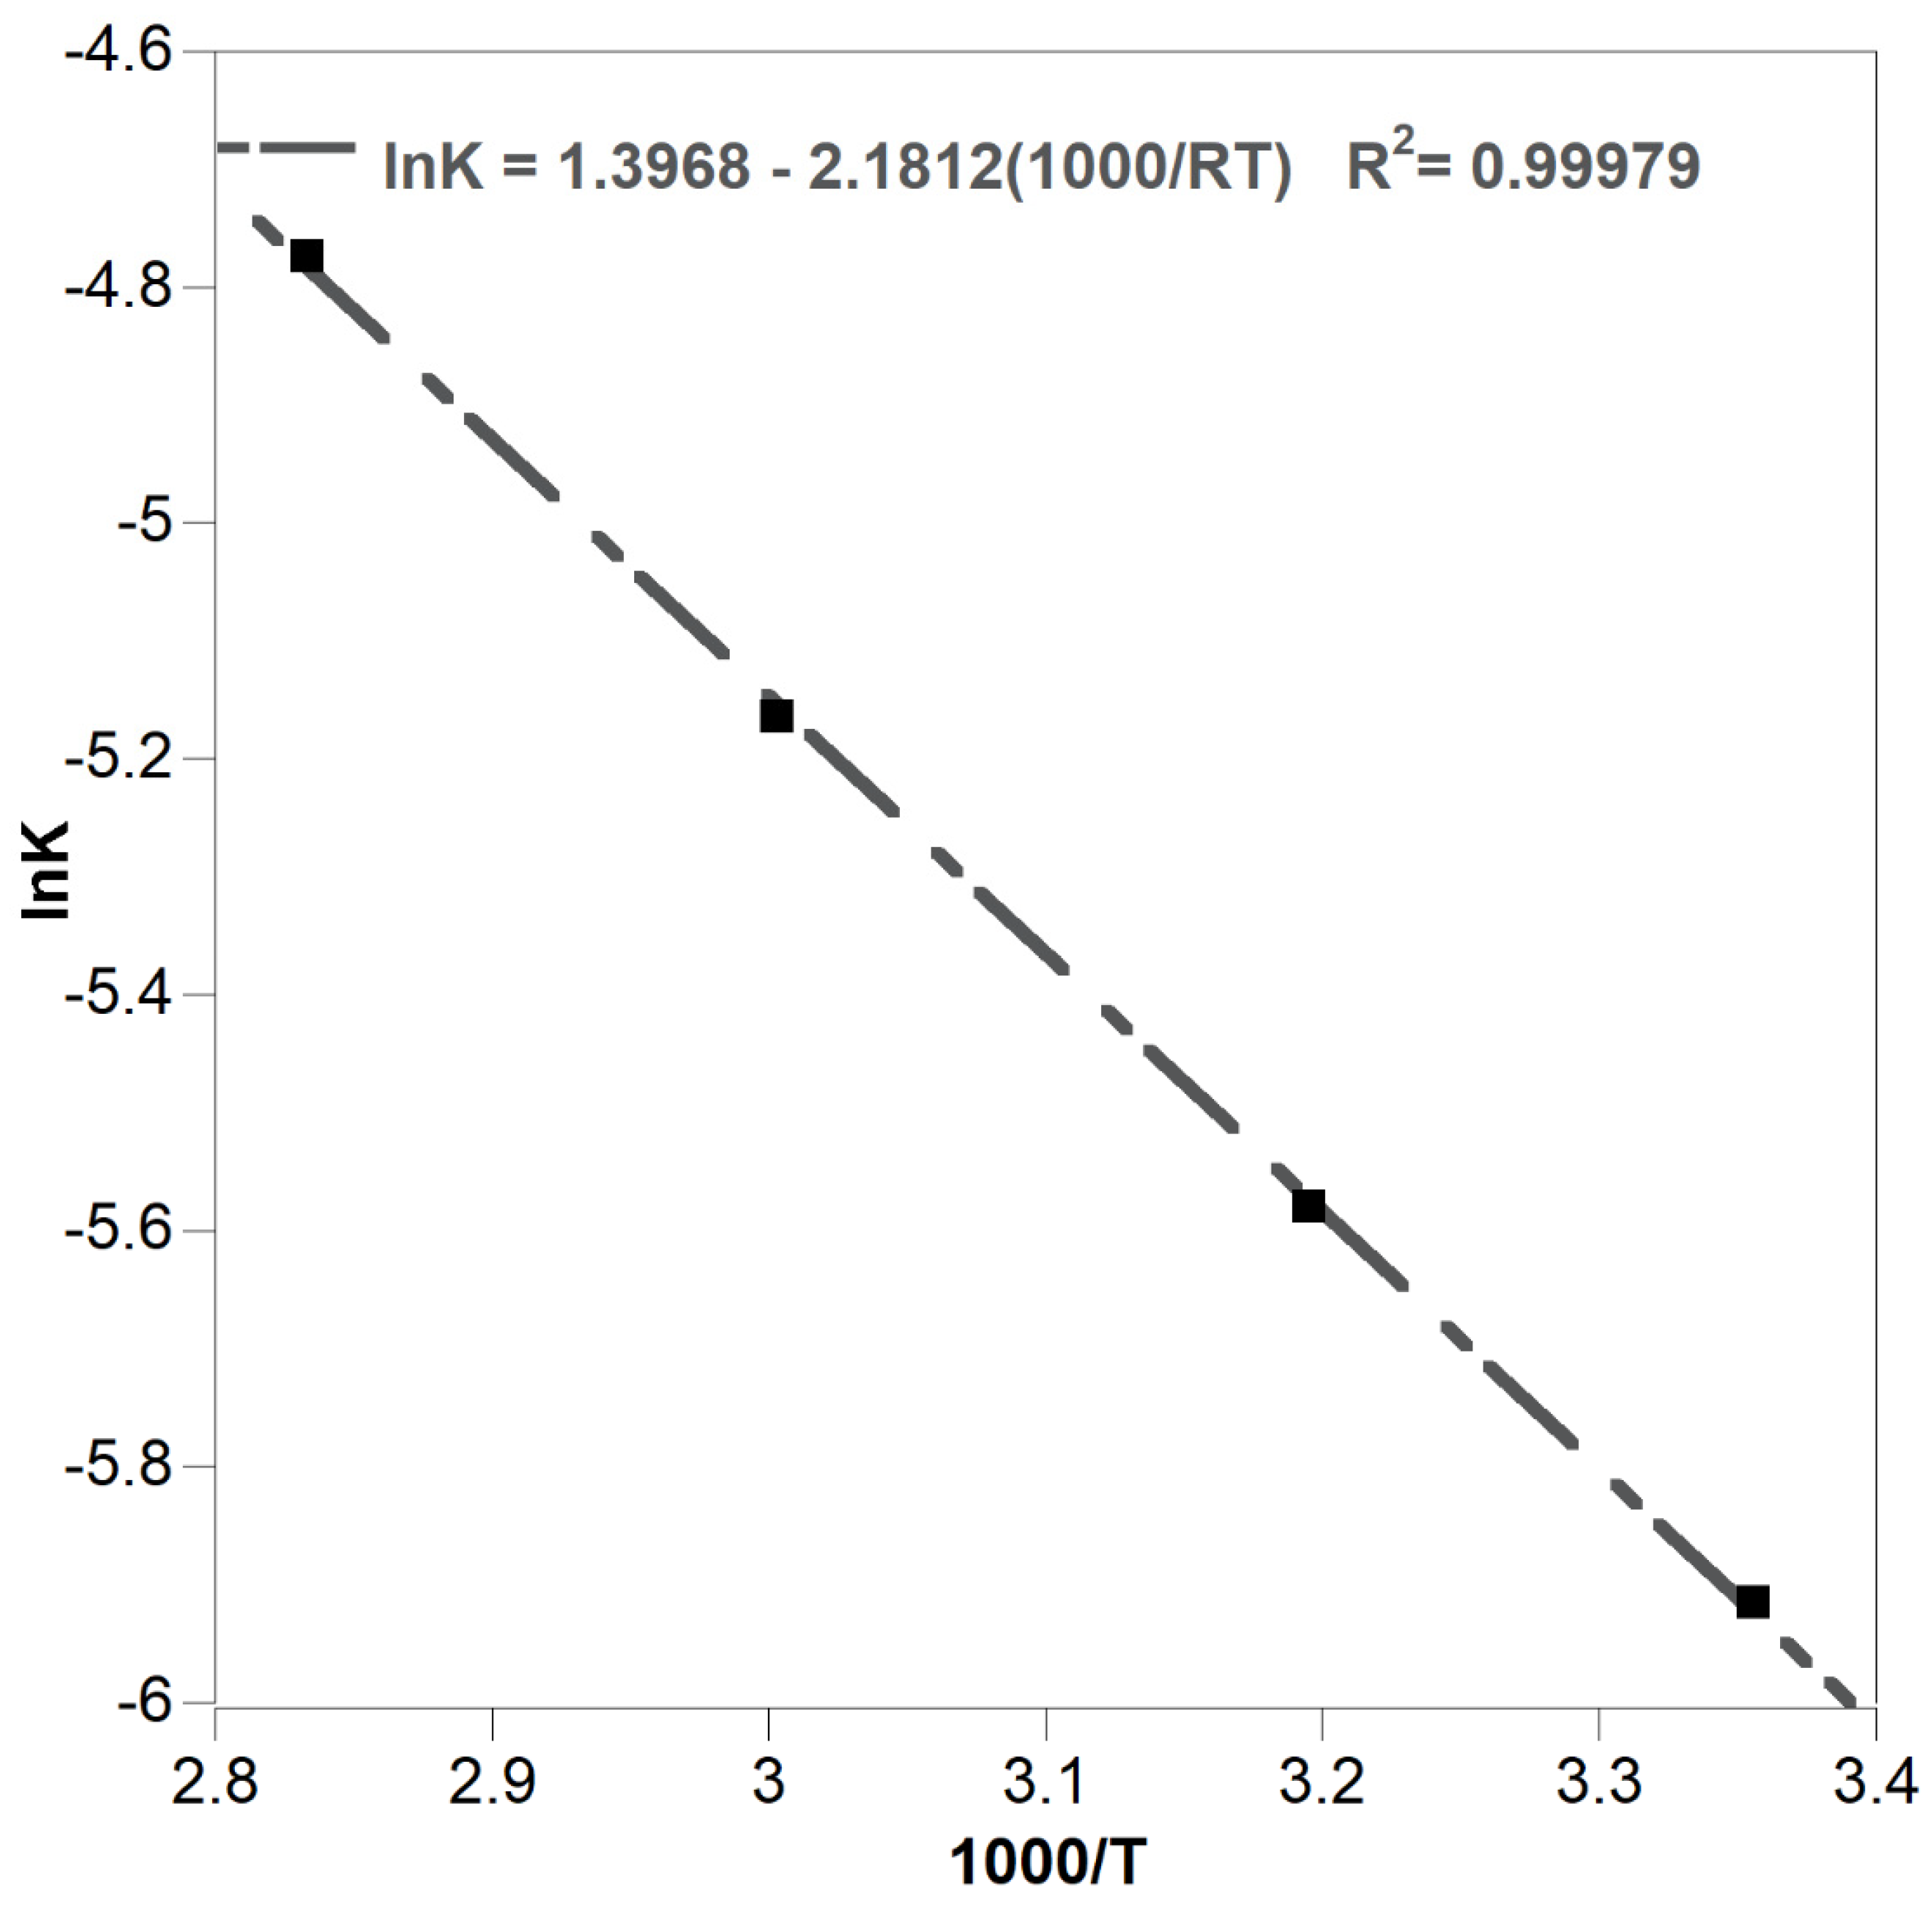
Figure 14.
Determination of the mechanism in the case of different solid to liquid ratio (18 grams in 500 ccs solution), (1400 rpm, 0.1/0.1 Na2S/NaOH, +45-60#, T=25).
Figure 14.
Determination of the mechanism in the case of different solid to liquid ratio (18 grams in 500 ccs solution), (1400 rpm, 0.1/0.1 Na2S/NaOH, +45-60#, T=25).
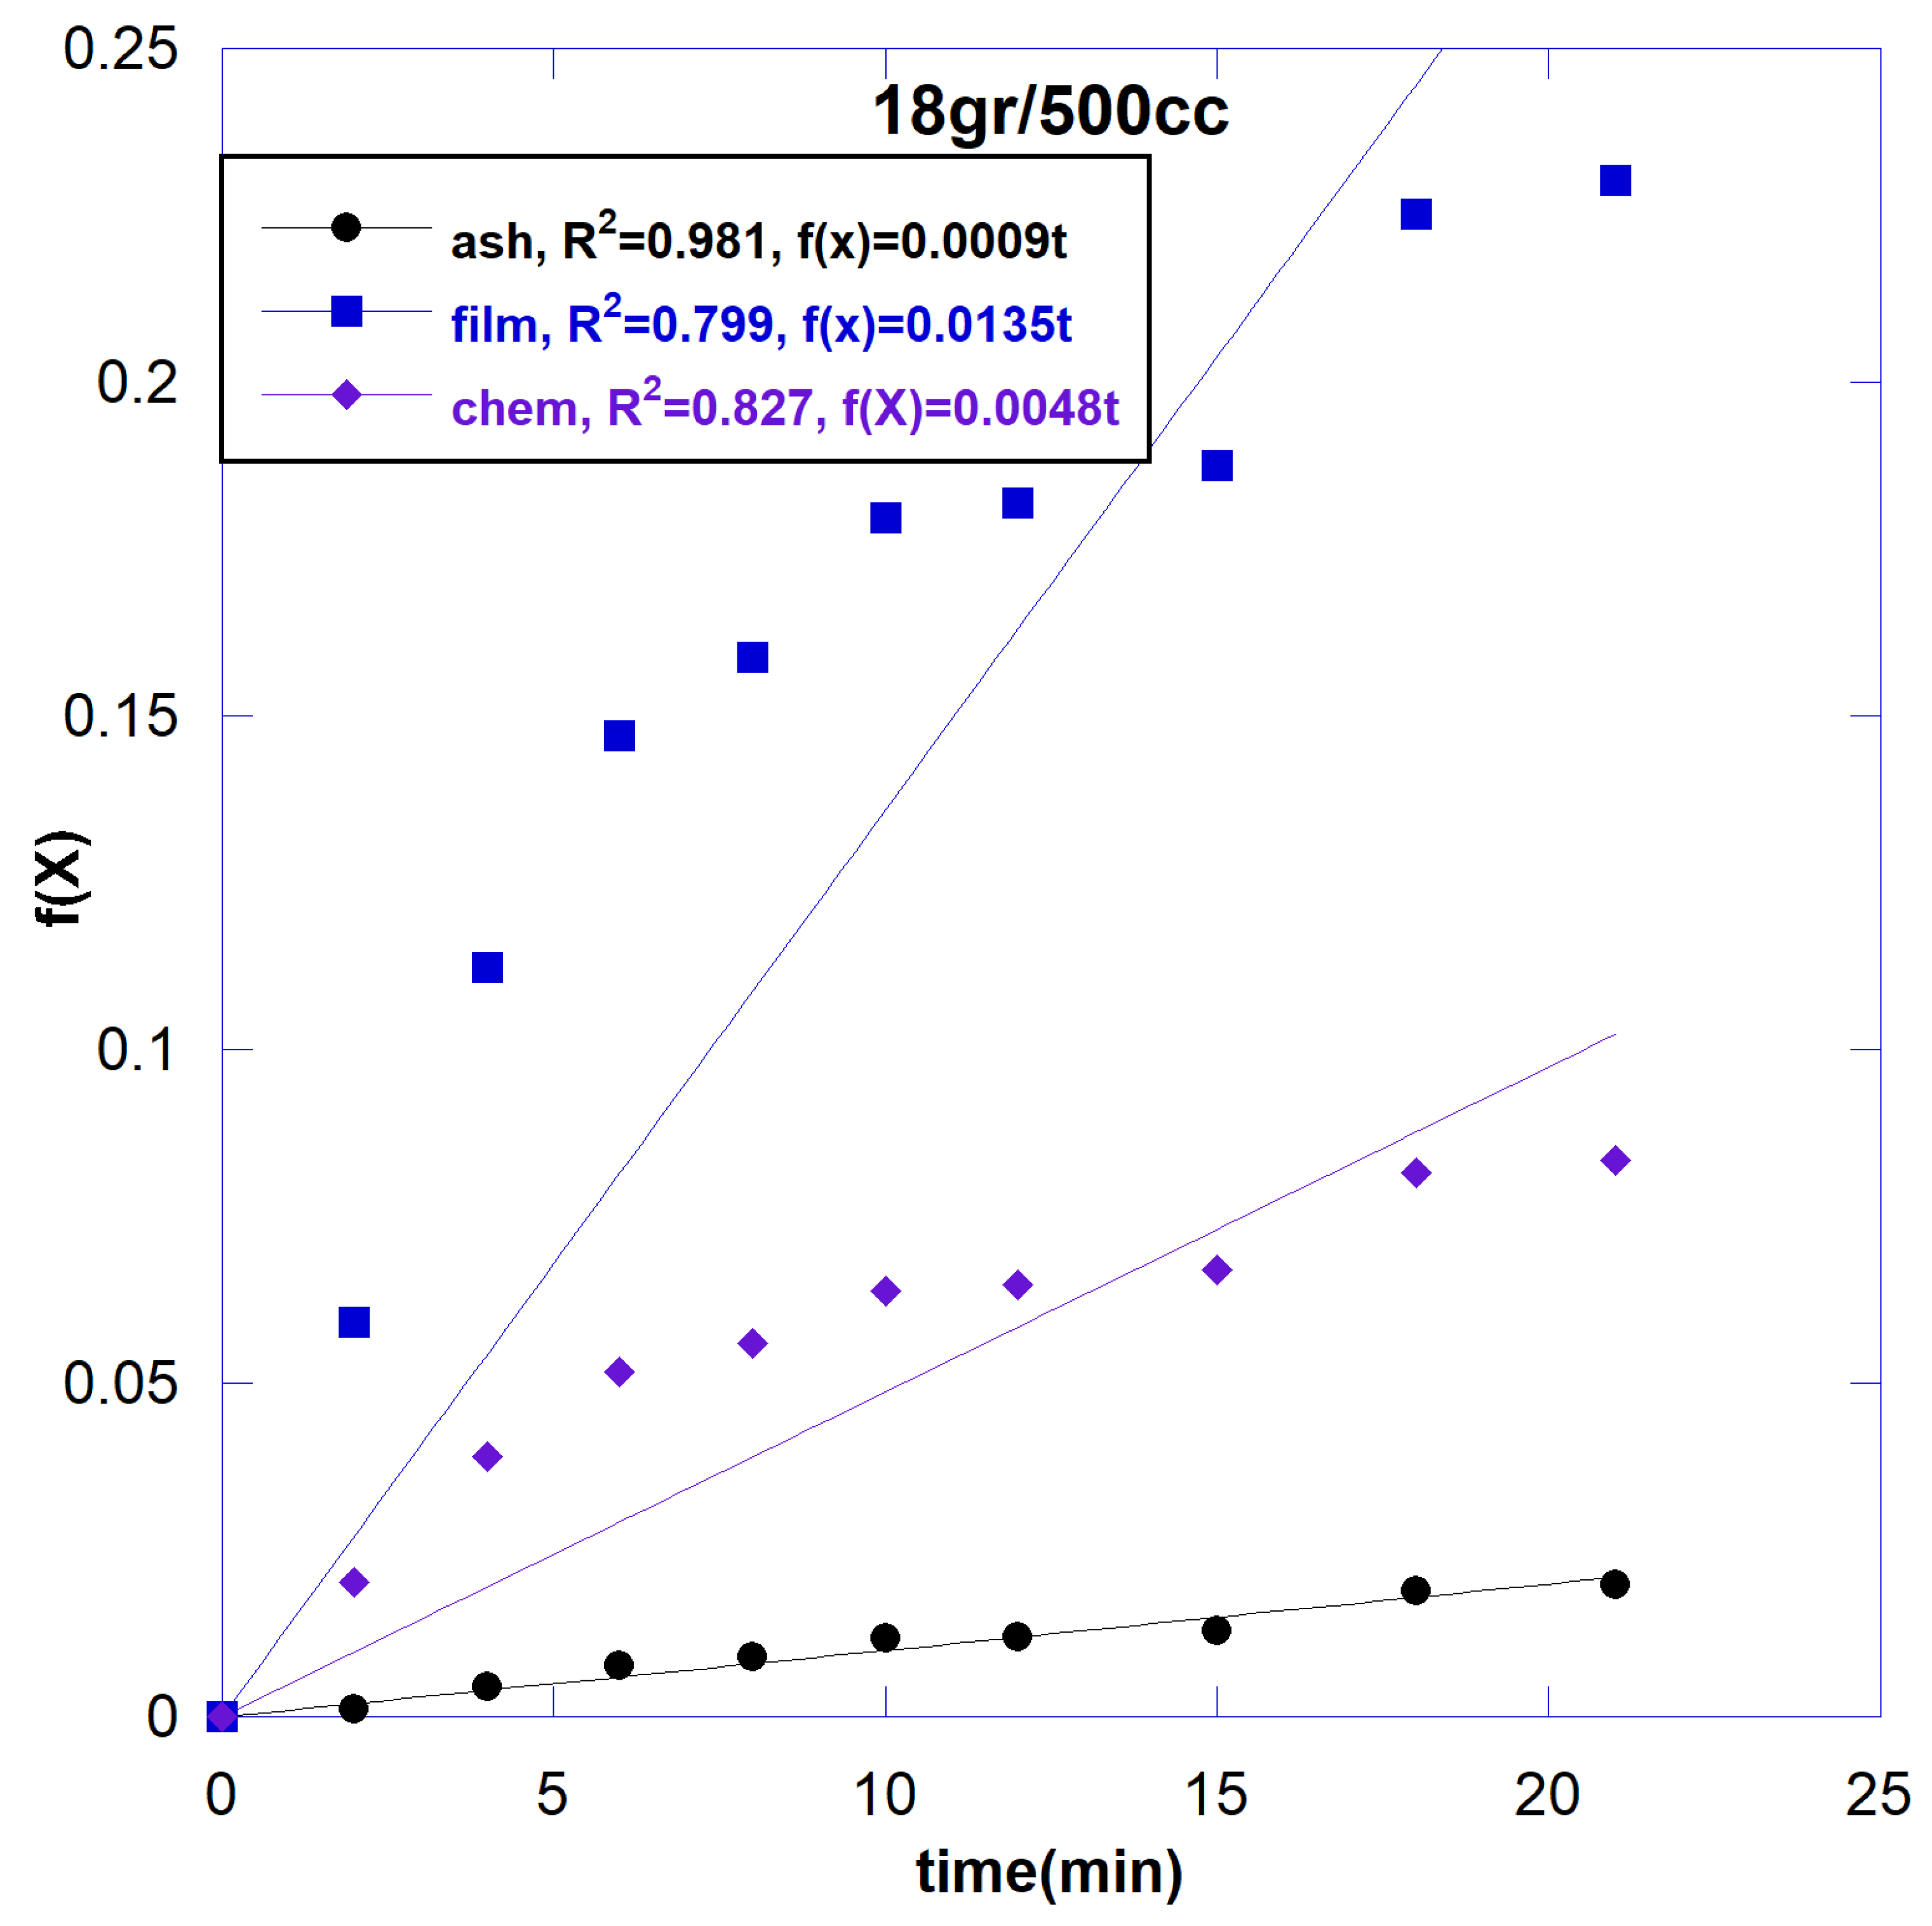
Figure 15.
SEM images of stibnite leaching residue with different magnification: a:200X, b:3200X and c: EDX graph of point indicated in b.
Figure 15.
SEM images of stibnite leaching residue with different magnification: a:200X, b:3200X and c: EDX graph of point indicated in b.
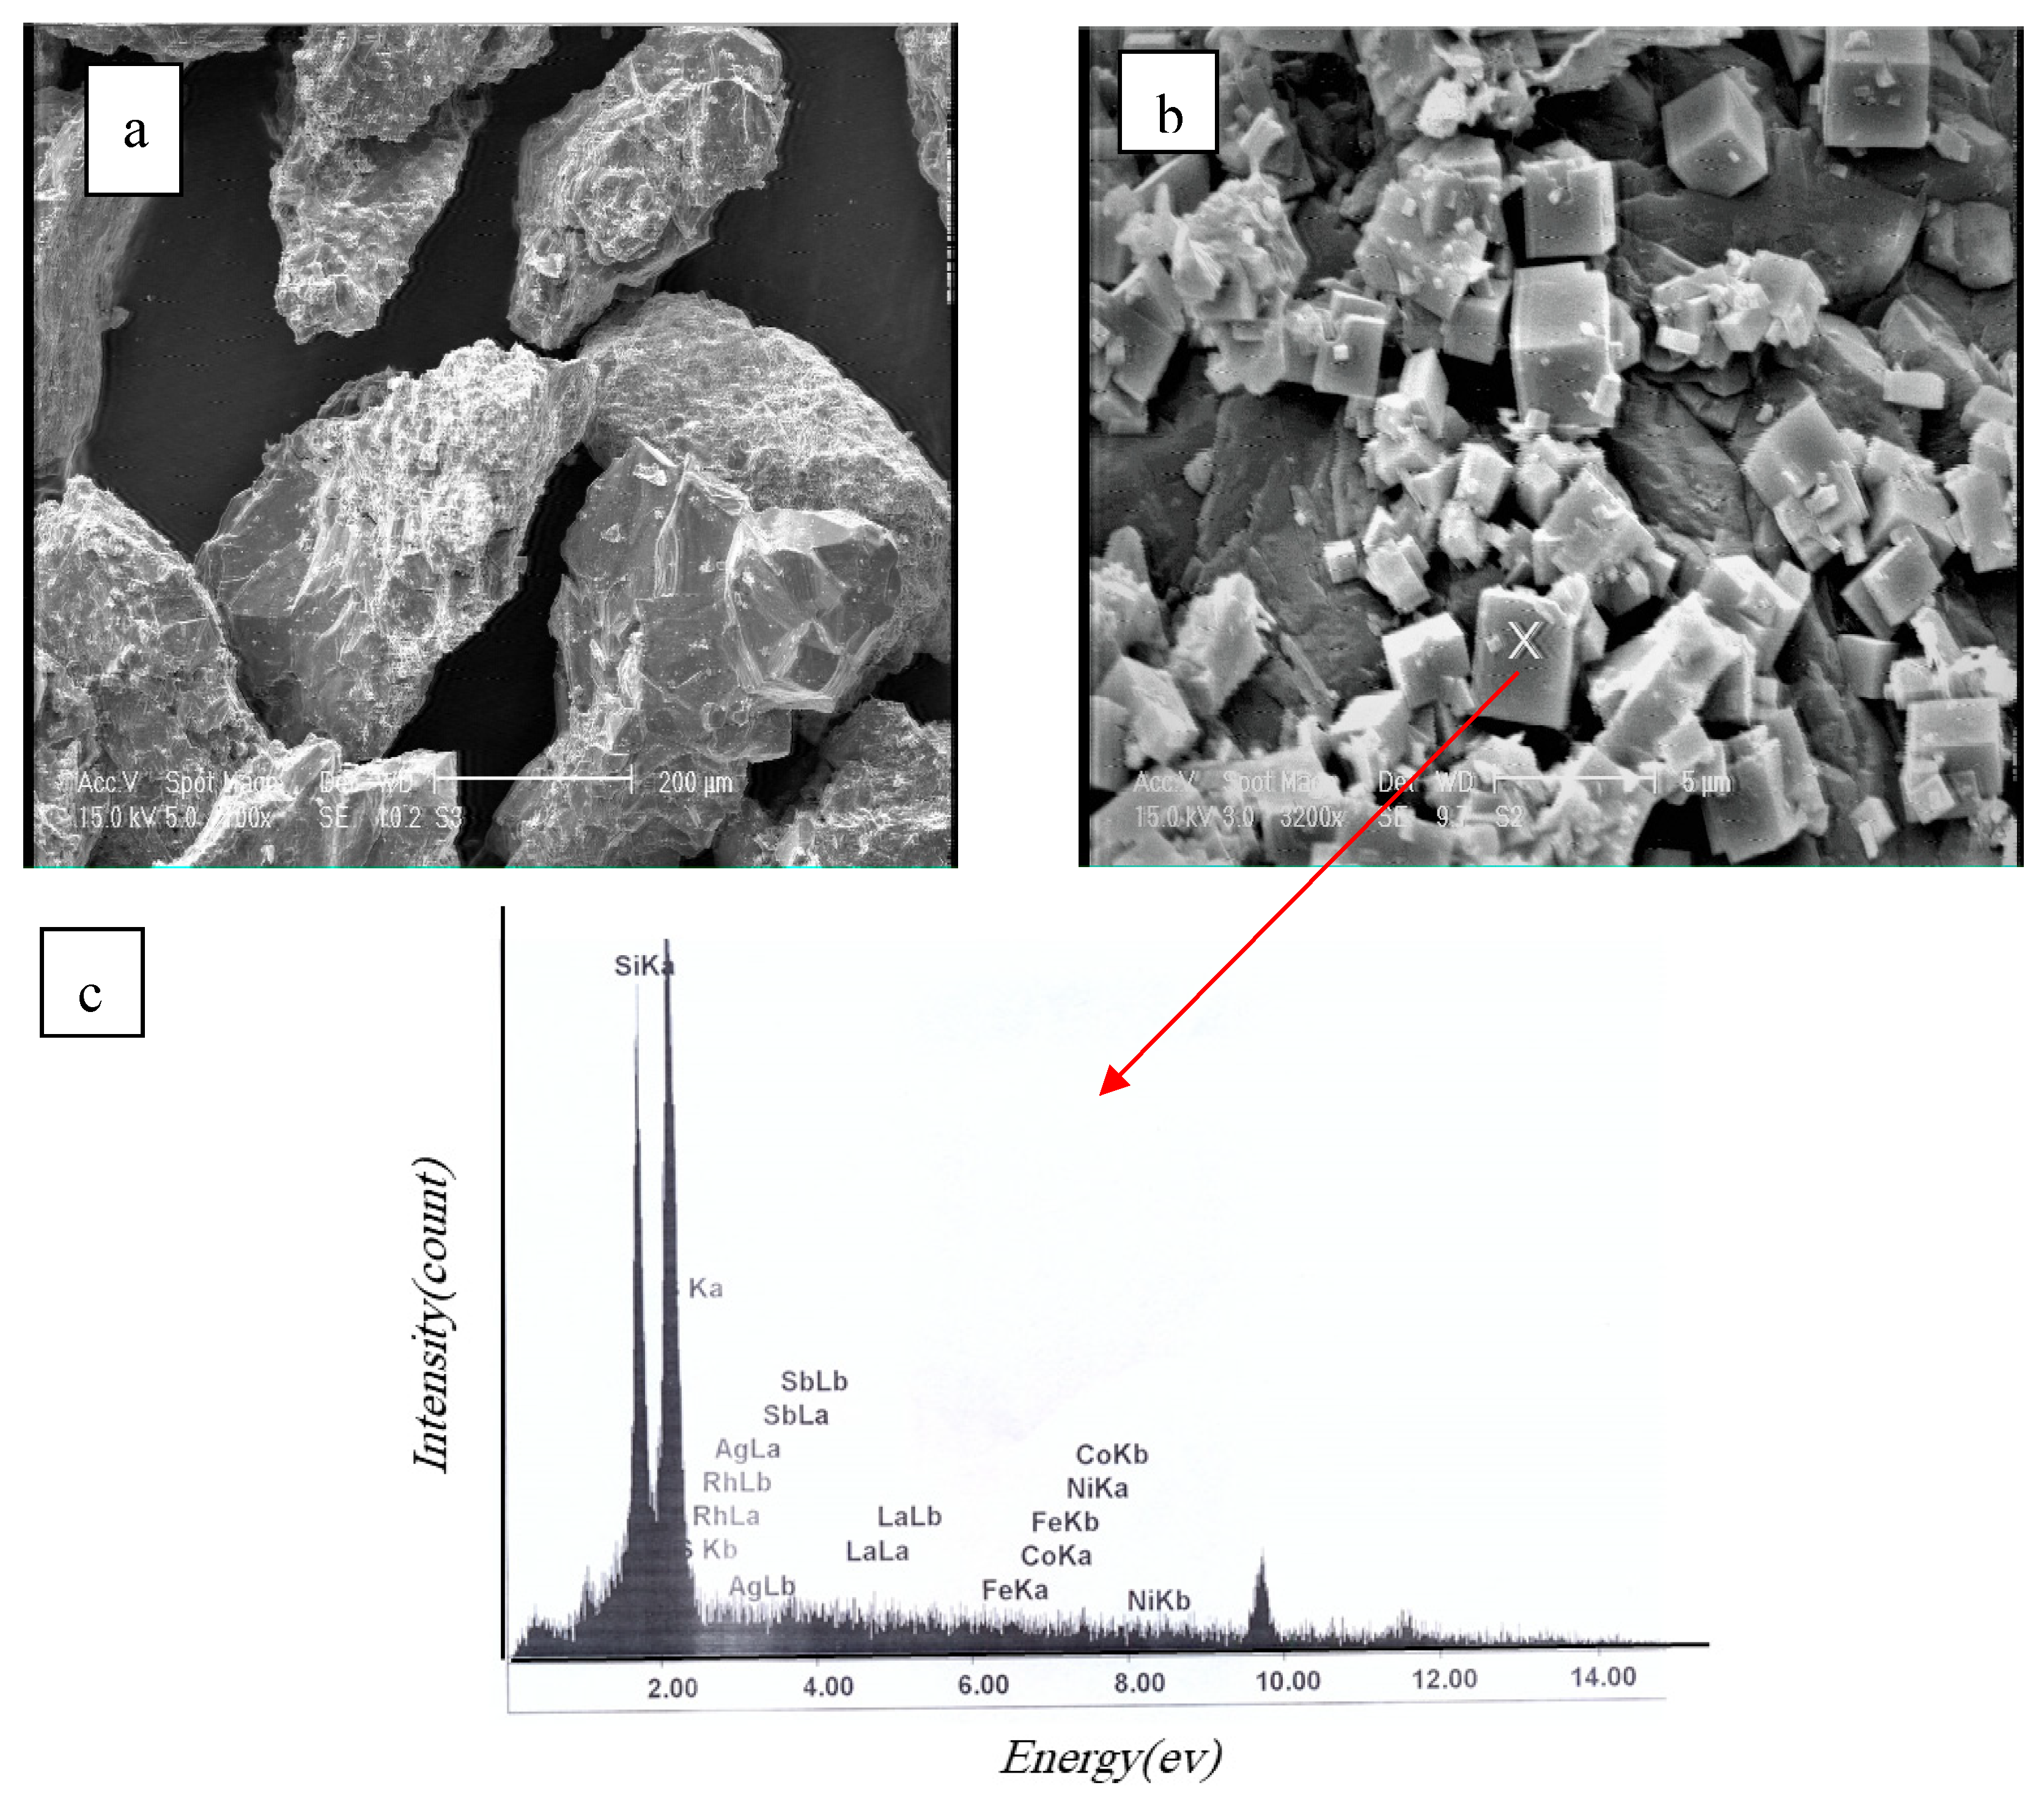

Table 1.
XRF Analysis of Stibnite ore (mesh=120).
| Element of Mixture | Weight Percent |
|---|---|
| Sb | 44.3 |
| SiO2 | 31.2 |
| S | 17.8 |
| Mo | 1.12 |
| Al2O3 | 1.03 |
| TiO2 | 0.14 |
| Fe | 0.30 |
| As | 0.079 |
| Rh | 0.11 |
| Cd | 0.01 |
| In2O3 | 0.09 |
| Pb | 1.05 |
Table 2.
Chemical analysis of the leach residue for the equal ratio of 0.75/0.75 of Na2S/NaOH. (mesh=120).
Table 2.
Chemical analysis of the leach residue for the equal ratio of 0.75/0.75 of Na2S/NaOH. (mesh=120).
| Element of Mixture | Weight Percent |
|---|---|
| Sb | 3.86 |
| SiO2 | 84.5 |
| S | 1.71 |
| Mo | 0.3 |
| Al2O3 | 1.26 |
| TiO2 | 0.22 |
| Fe | 1.79 |
| As | - |
| Rh | 0.01 |
| Cd | 0.018 |
| In2O3 | 0.042 |
| Pb | 1.23 |
Table 3.
shrinking core model.
| Mechanism | f(x) |
|---|---|
|
Controlled by diffusion from ash layer Controlled by chemical reaction Controlled by diffusion from film layer |
1-3(1-x) 2 / 3+2(1-x)=k1t 1-(1-x)1/3=k2t x=k3t |
Table 4.
Results of the different kinetic mechanisms in different and equal ratios of the two leachants (1400 rpm, +45-60#, T=25 0C).
Table 4.
Results of the different kinetic mechanisms in different and equal ratios of the two leachants (1400 rpm, +45-60#, T=25 0C).
| Different Ratios | ||||||
|---|---|---|---|---|---|---|
| Ratio Na2S/NaOH | K1(s-1) | R12 | K2(s-1) | R22 | K3(s-1) | R32 |
| 0.25 | 0.0007 | 0.993 | 0.0052 | 0.746 | 0.0145 | 0.714 |
| 0.5 | 0.0011 | 0.953 | 0.0041 | 0.929 | 0.0117 | 0.918 |
| 2 | 0.0011 | 0.944 | 0.0052 | 0.834 | 0.014 | 0.814 |
| 4 | 0.0005 | 0.961 | 0.002 | 0.924 | 0.008 | 0.915 |
| Equal Ratios | ||||||
| Ratio Na2S/NaOH | K1(s-1) | R12 | K2(s-1) | R22 | K3(s-1) | R32 |
| 0.05/0.05 | 0.003 | 0.993 | 0.0027 | 0.885 | 0.0078 | 0.872 |
| 0.1/0.1 | 0.0021 | 0.992 | 0.0064 | 0.856 | 0.0173 | 0.809 |
| 0.175/0.175 | 0.008 | 0.95 | 0.0157 | 0.884 | 0.0035 | 0.826 |
| 0.25/0.25 | 0.0148 | 0.955 | 0.0234 | 0.647 | 0.043 | 0.85 |
| 0.5/0.5 | 0.023 | 0.968 | 0.0201 | 0.899 | 0.0321 | 0.882 |
| 0.75/0.75 | 0.01 | 0.951 | 0.0075 | 0.869 | 0.0058 | 0.832 |
Table 5.
Results of the different kinetic mechanisms in different temperatures (1400 rpm, +45-60#, 0.1/0.1 Na2S/NaOH).
Table 5.
Results of the different kinetic mechanisms in different temperatures (1400 rpm, +45-60#, 0.1/0.1 Na2S/NaOH).
| Different Ratios | ||||||
|---|---|---|---|---|---|---|
| Temperature(K) | K1(s-1) | R12 | K2(s-1) | R22 | K3(s-1) | R32 |
| 298 | 0.002 | 0.992 | 0.0064 | 0.856 | 0.0173 | 0.809 |
| 313 | 0.0065 | 0.925 | 0.0131 | 0.712 | 0.0324 | 0.6 |
| 333 | 0.0066 | 0.929 | 0.0158 | 0.709 | 0.0377 | 0.826 |
| 353 | 0.003 | 0.9 | 0.0027 | 0.898 | 0.0045 | 0.897 |
Table 6.
Results of the diffusion mechanism of ash layers in all ratios of solid to liquid. (1400 rpm, 0.1/0.1, +45-60#).
Table 6.
Results of the diffusion mechanism of ash layers in all ratios of solid to liquid. (1400 rpm, 0.1/0.1, +45-60#).
| Solid to Liquid Ratio(gr/cc) | Equation | Regression Coefficient (R2) |
|---|---|---|
| 2/500 | F(x)=0.0011t | 0.958 |
| 6/500 | F(x)=0.0006t | 0.978 |
| 10/500 | F(x)=0.0020t | 0.992 |
| 14/500 | F(x)=0.001t | 0.931 |
| 18/500 | F(x)=0.0008t | 0.981 |
Table 7.
Results of the diffusion mechanism of ash layers in all ranges of particle size. (1400 rpm, 0.1/0.1 Na2S/NaOH, T=25 0C).
Table 7.
Results of the diffusion mechanism of ash layers in all ranges of particle size. (1400 rpm, 0.1/0.1 Na2S/NaOH, T=25 0C).
| Particle Size (Micrometer) | Equation | R2 |
|---|---|---|
| 250-350 | F(x)=0.0011t | 0.979 |
| 175-250 | F(x)=0.002t | 0.992 |
| 150-175 | F(x)=0.0005t | 0.949 |
| 105-150 | F(x)=0.0011t | 0.919 |
Table 8.
Comparison of Results of the diffusion mechanism of ash layers to D5 and D12. (1400 rpm, 0.1/0.1 Na2S/NaOH, T=250C).
Table 8.
Comparison of Results of the diffusion mechanism of ash layers to D5 and D12. (1400 rpm, 0.1/0.1 Na2S/NaOH, T=250C).
| Model | equation | Rate Coefficient(s-1) | R2 |
| Ash Layer Diffusion [16] | F(x)= 1-3(1-x) 2 / 3+2(1-x) =k1t | 0.0021 | 0.992 |
| D5 [36] | F(x)=((1-x)-1/3-1)2=k5t | 0.0010 | 0.980 |
| D12 [36] | F(x)=0.2(1-x)-5/3-0.25(1-x)-4/3+0.05=k9t | 0.0006 | 0.973 |
Disclaimer/Publisher’s Note: The statements, opinions and data contained in all publications are solely those of the individual author(s) and contributor(s) and not of MDPI and/or the editor(s). MDPI and/or the editor(s) disclaim responsibility for any injury to people or property resulting from any ideas, methods, instructions or products referred to in the content. |
© 2025 by the authors. Licensee MDPI, Basel, Switzerland. This article is an open access article distributed under the terms and conditions of the Creative Commons Attribution (CC BY) license (http://creativecommons.org/licenses/by/4.0/).
Copyright: This open access article is published under a Creative Commons CC BY 4.0 license, which permit the free download, distribution, and reuse, provided that the author and preprint are cited in any reuse.


