
Submitted:
21 January 2025
Posted:
22 January 2025
You are already at the latest version
Abstract
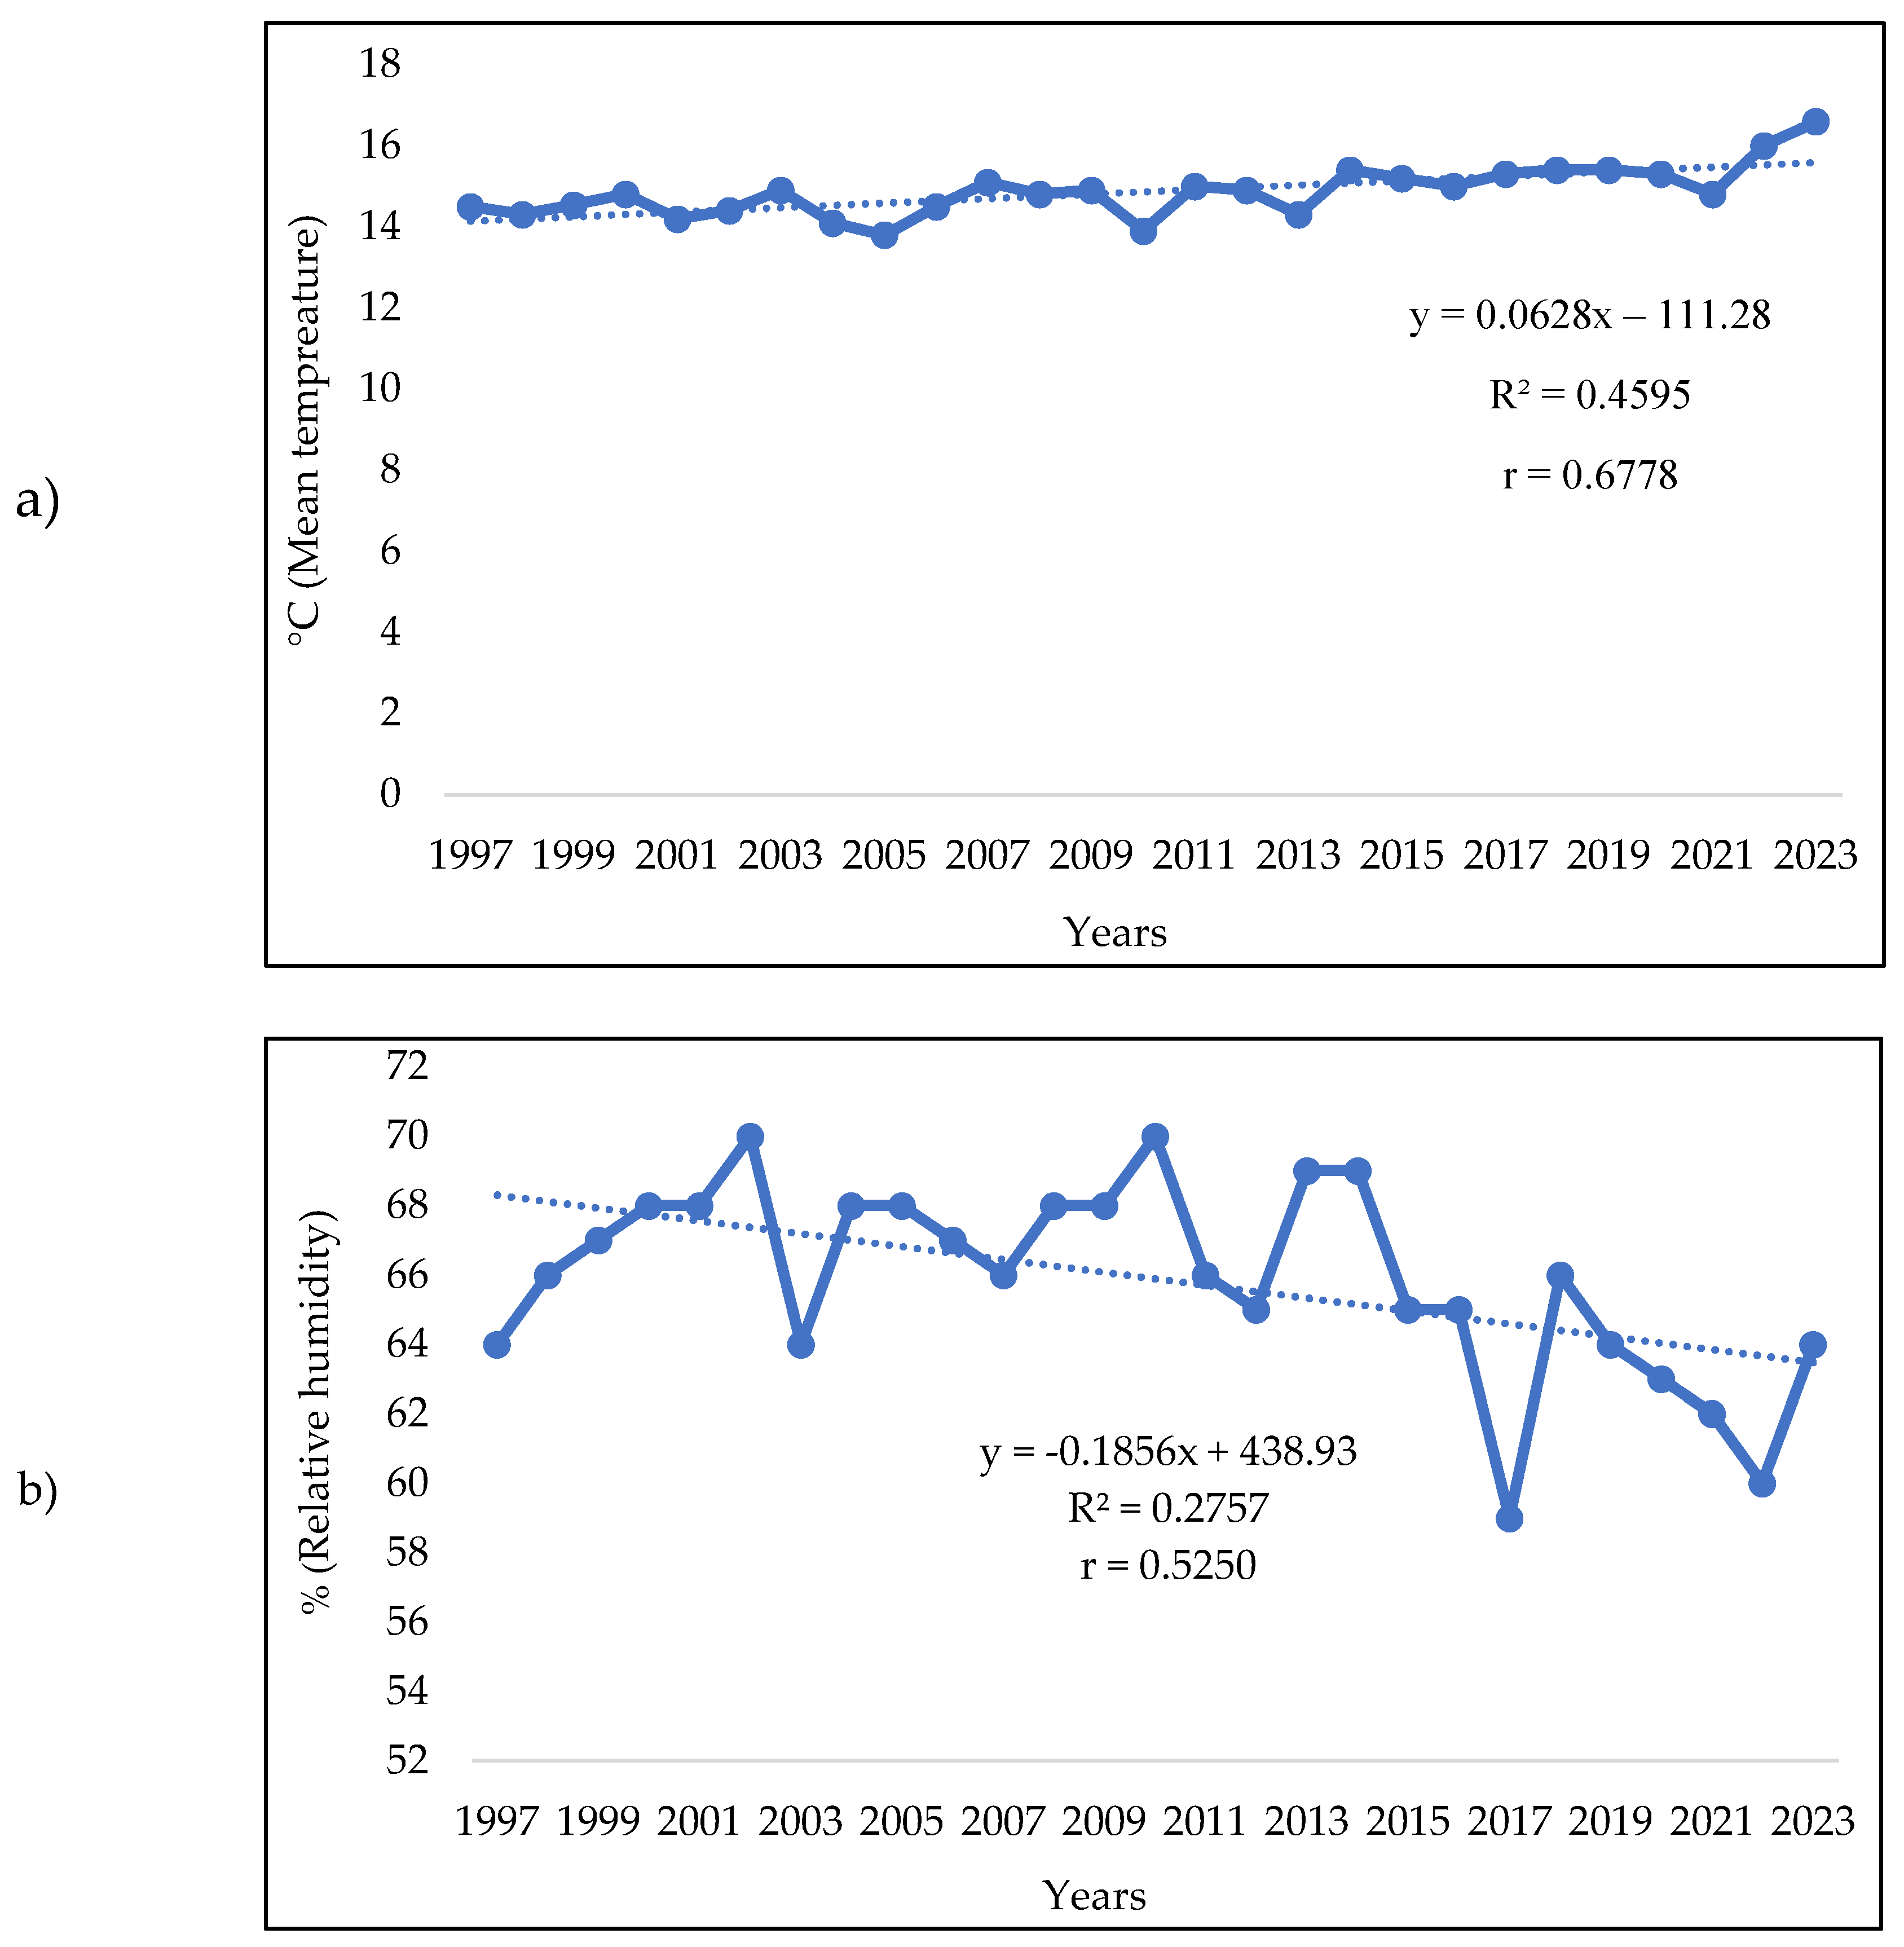
Pollen grains play an important role in the etiopathogenesis of seasonal respiratory allergies, which are increasing in prevalence and severity worldwide. Climate change is one of the possible explanations for the increase of pollen allergies enabling plants to produce more allergenic pollen, in larger quantities and longer periods. Pollen count data can be considered the proxy for aeroallergen exposure and long pollen data sets allow to investigate the trends in seasonal characteristics over time. This study examines temporal variations in seasonality and load of airborne pollen and meteorological data recorded over 27 years in Parma (Italy). The study was performed collecting pollen by a Hirst spore trap considering the following taxa: Betula, Corylus, Cupressaceae-Taxaceae, Platanus, Ambrosia, Poaceae, Total pollen and Alternaria fungal spores. Start and end date, duration, date of peak, peak value, and Seasonal Pollen Integral (SPIn) were examined. Temporal variations in pollen seasons were displayed as the number of days from January 1 (DOY, day of the year). Daily averages temperature, relative humidity and total rainfall were considered. Linear regression analysis was carried out to investigate trends in data over time. The start date turned precocious for Corylus and Poaceae, but late for Betula. The end date was postponed for Poaceae and Total pollen, as well the duration of pollen seasons was longer for Poaceae and Total pollen, the duration became shorter for Betula. The peak date was anticipated for Poaceae, and the peak values were reduced for Poaceae and Total pollen. A weak positive trend was observed for SPIn of Corylus. Regarding Ambrosia, the duration was shorter, and the peak date was postponed. No significant differences were observed for Platanus and Alternaria spores. A significant decrease in the relative humidity and a significant increase of annual average temperature were observed. The results of our study represent a contribution to better understanding the impact on human health of environmentally changing conditions. Moreover, it should be considered that not only the seasonal respiratory allergies may be related to the variation of climate and its impact on pollen load and pollen season, but also it could be related to chronic respiratory disease and cardiovascular diseases. This highlights gaps in current knowledge and the need to quantify the impact of climate change in a One Health perspective to provide useful information to determine exposure of the allergic population to pollen and to plan public health preventive measures.
Keywords:
1. Introduction
2. Materials and Methods
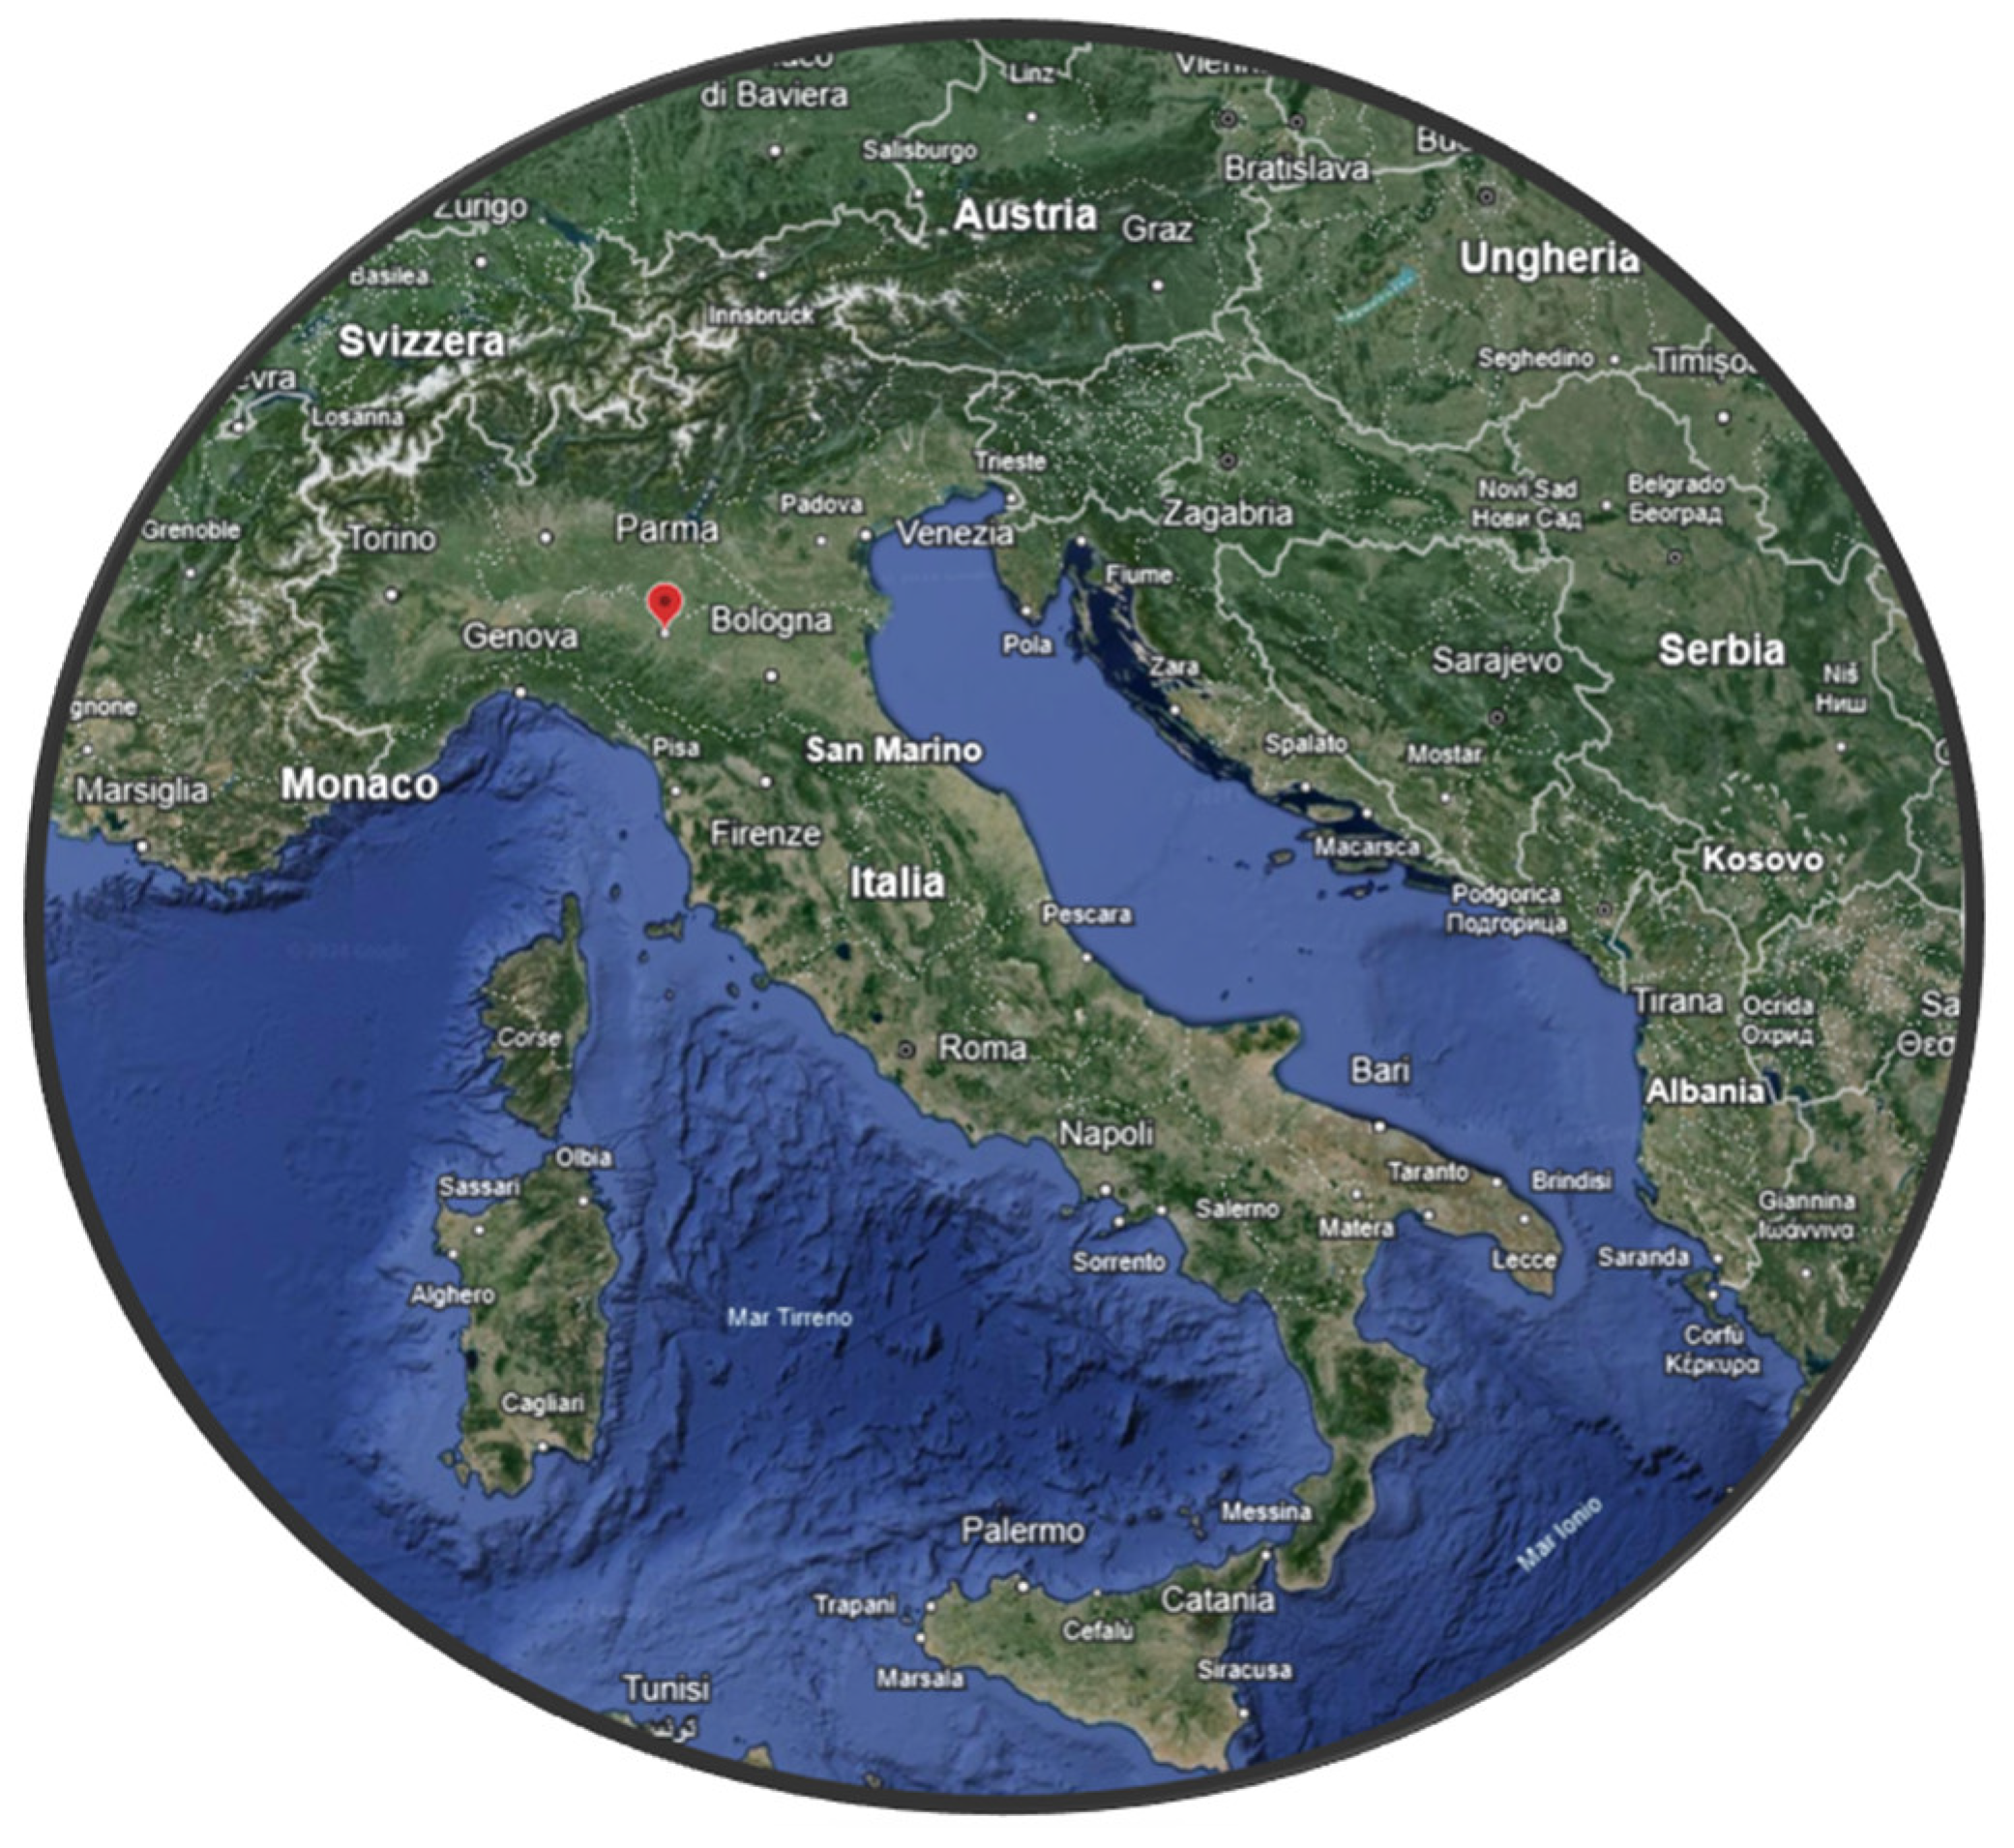
2.1. Location of the Study
2.2. Aerobiological Data
2.3. Meteorological Data
2.4. Statistical Analysis
3. Results
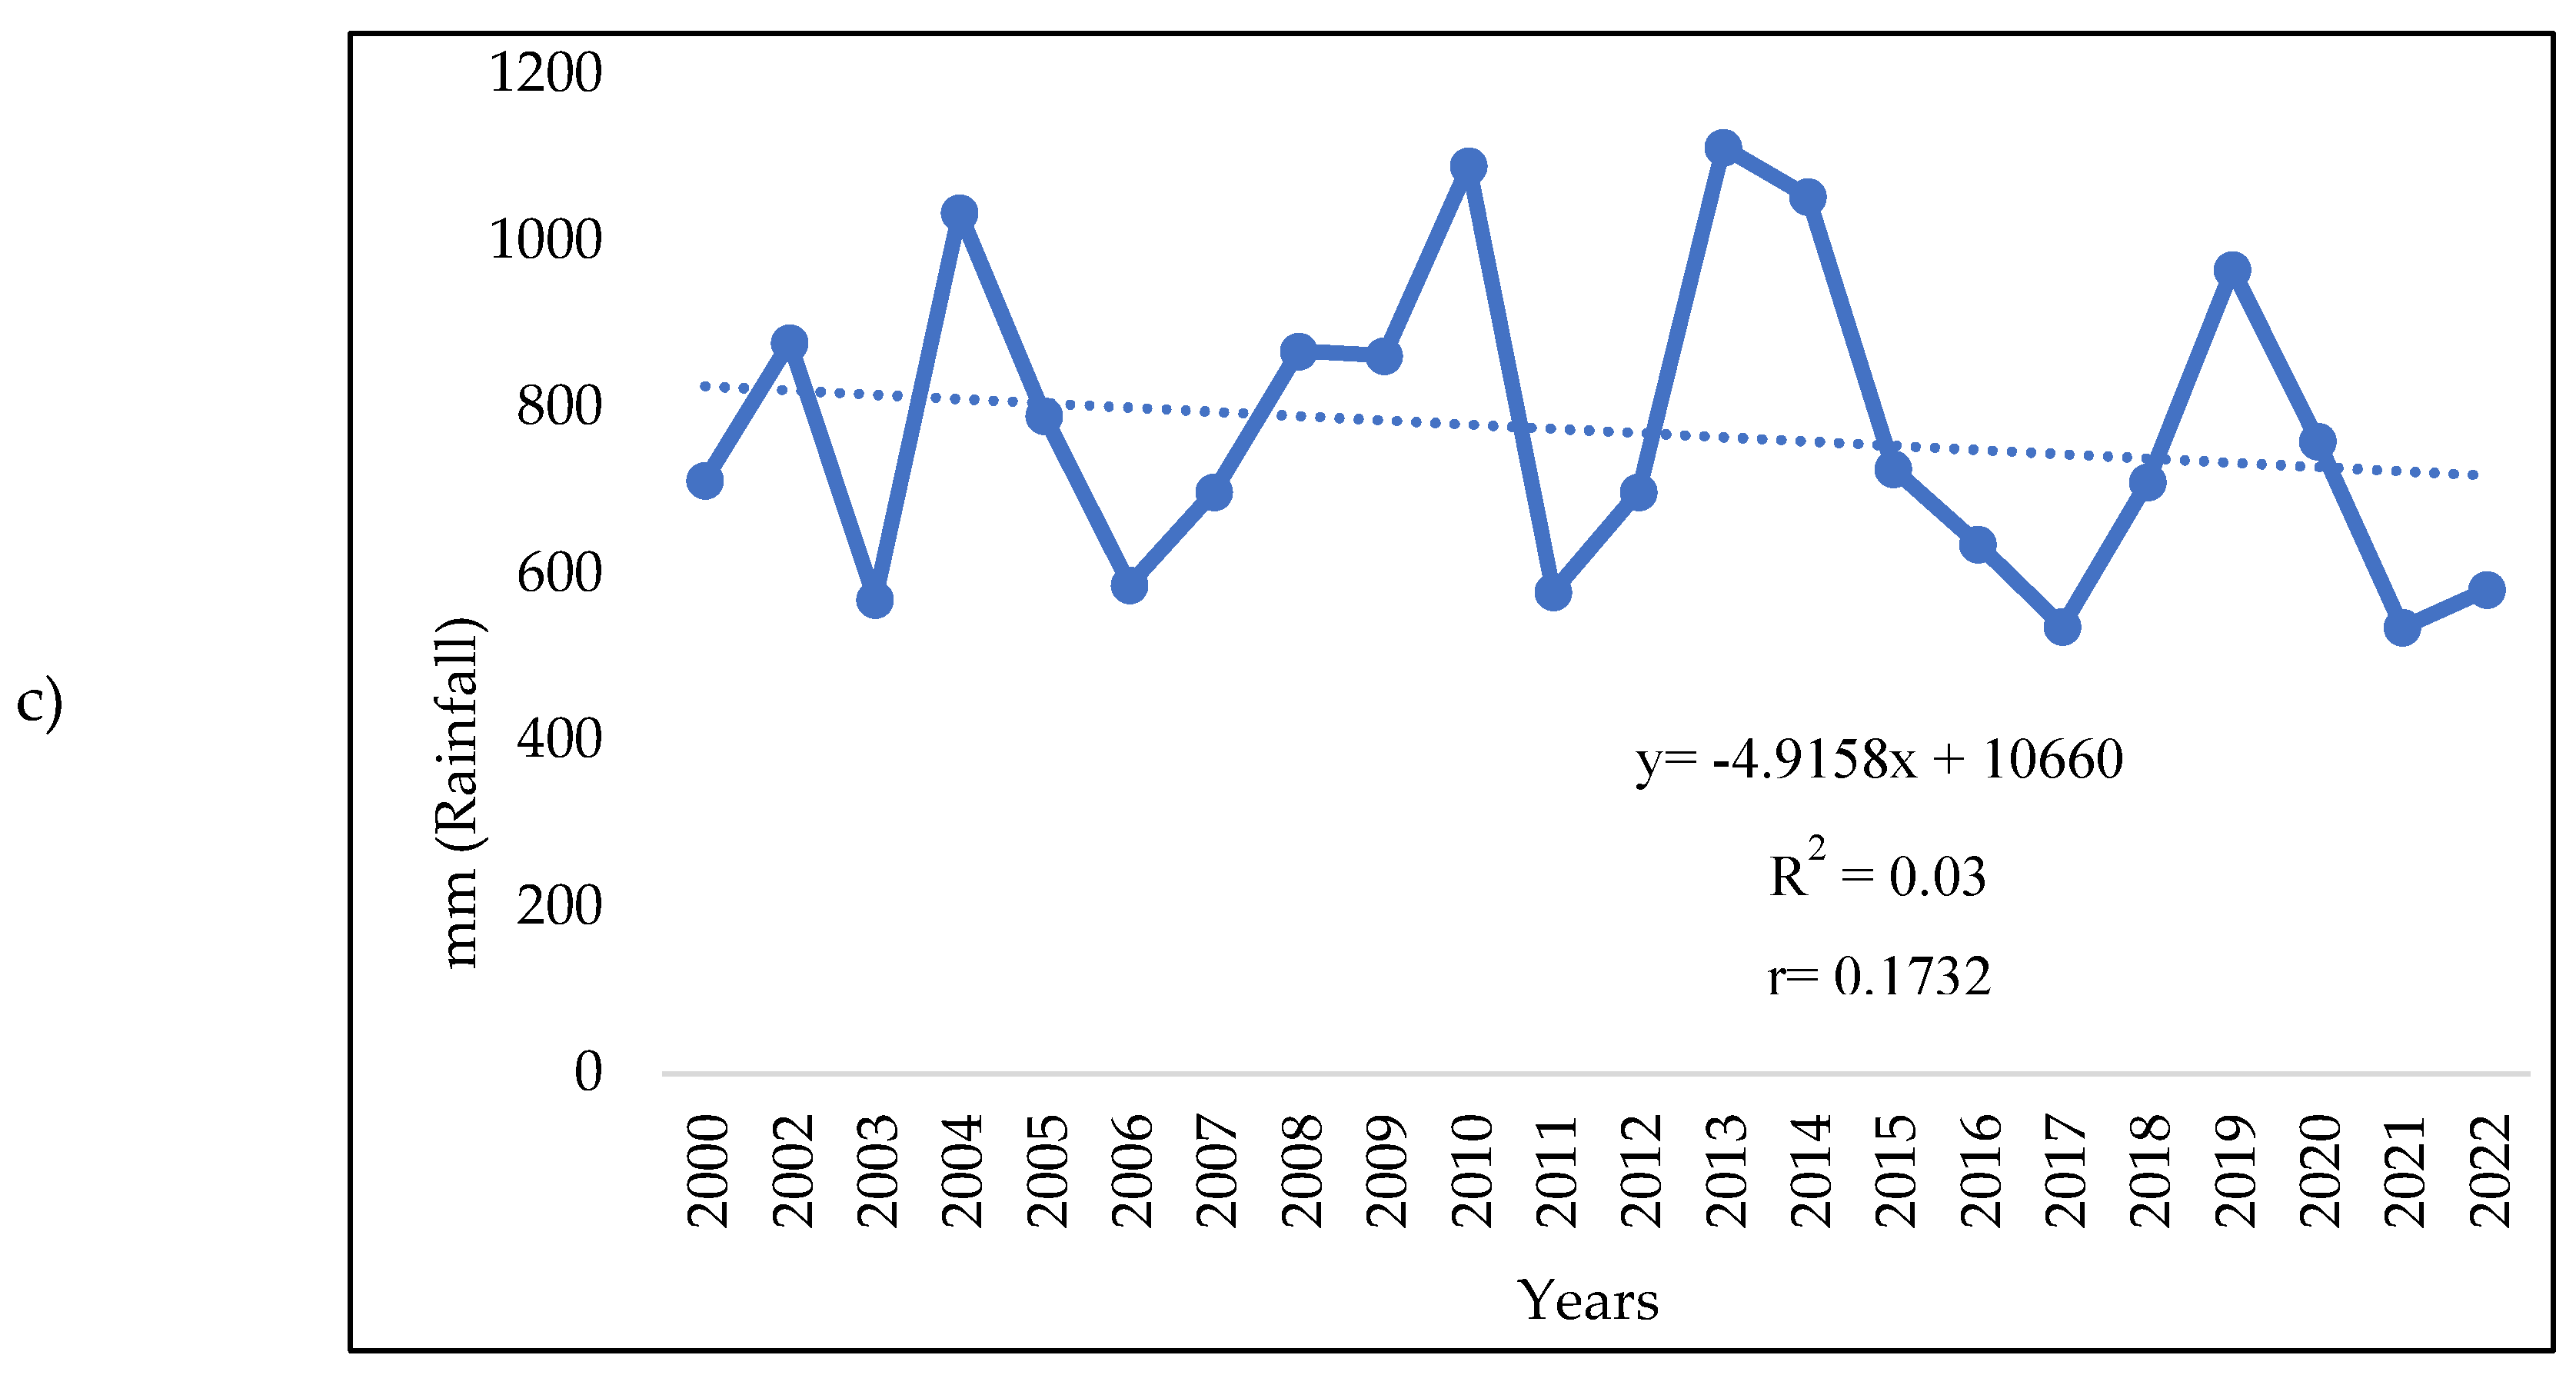
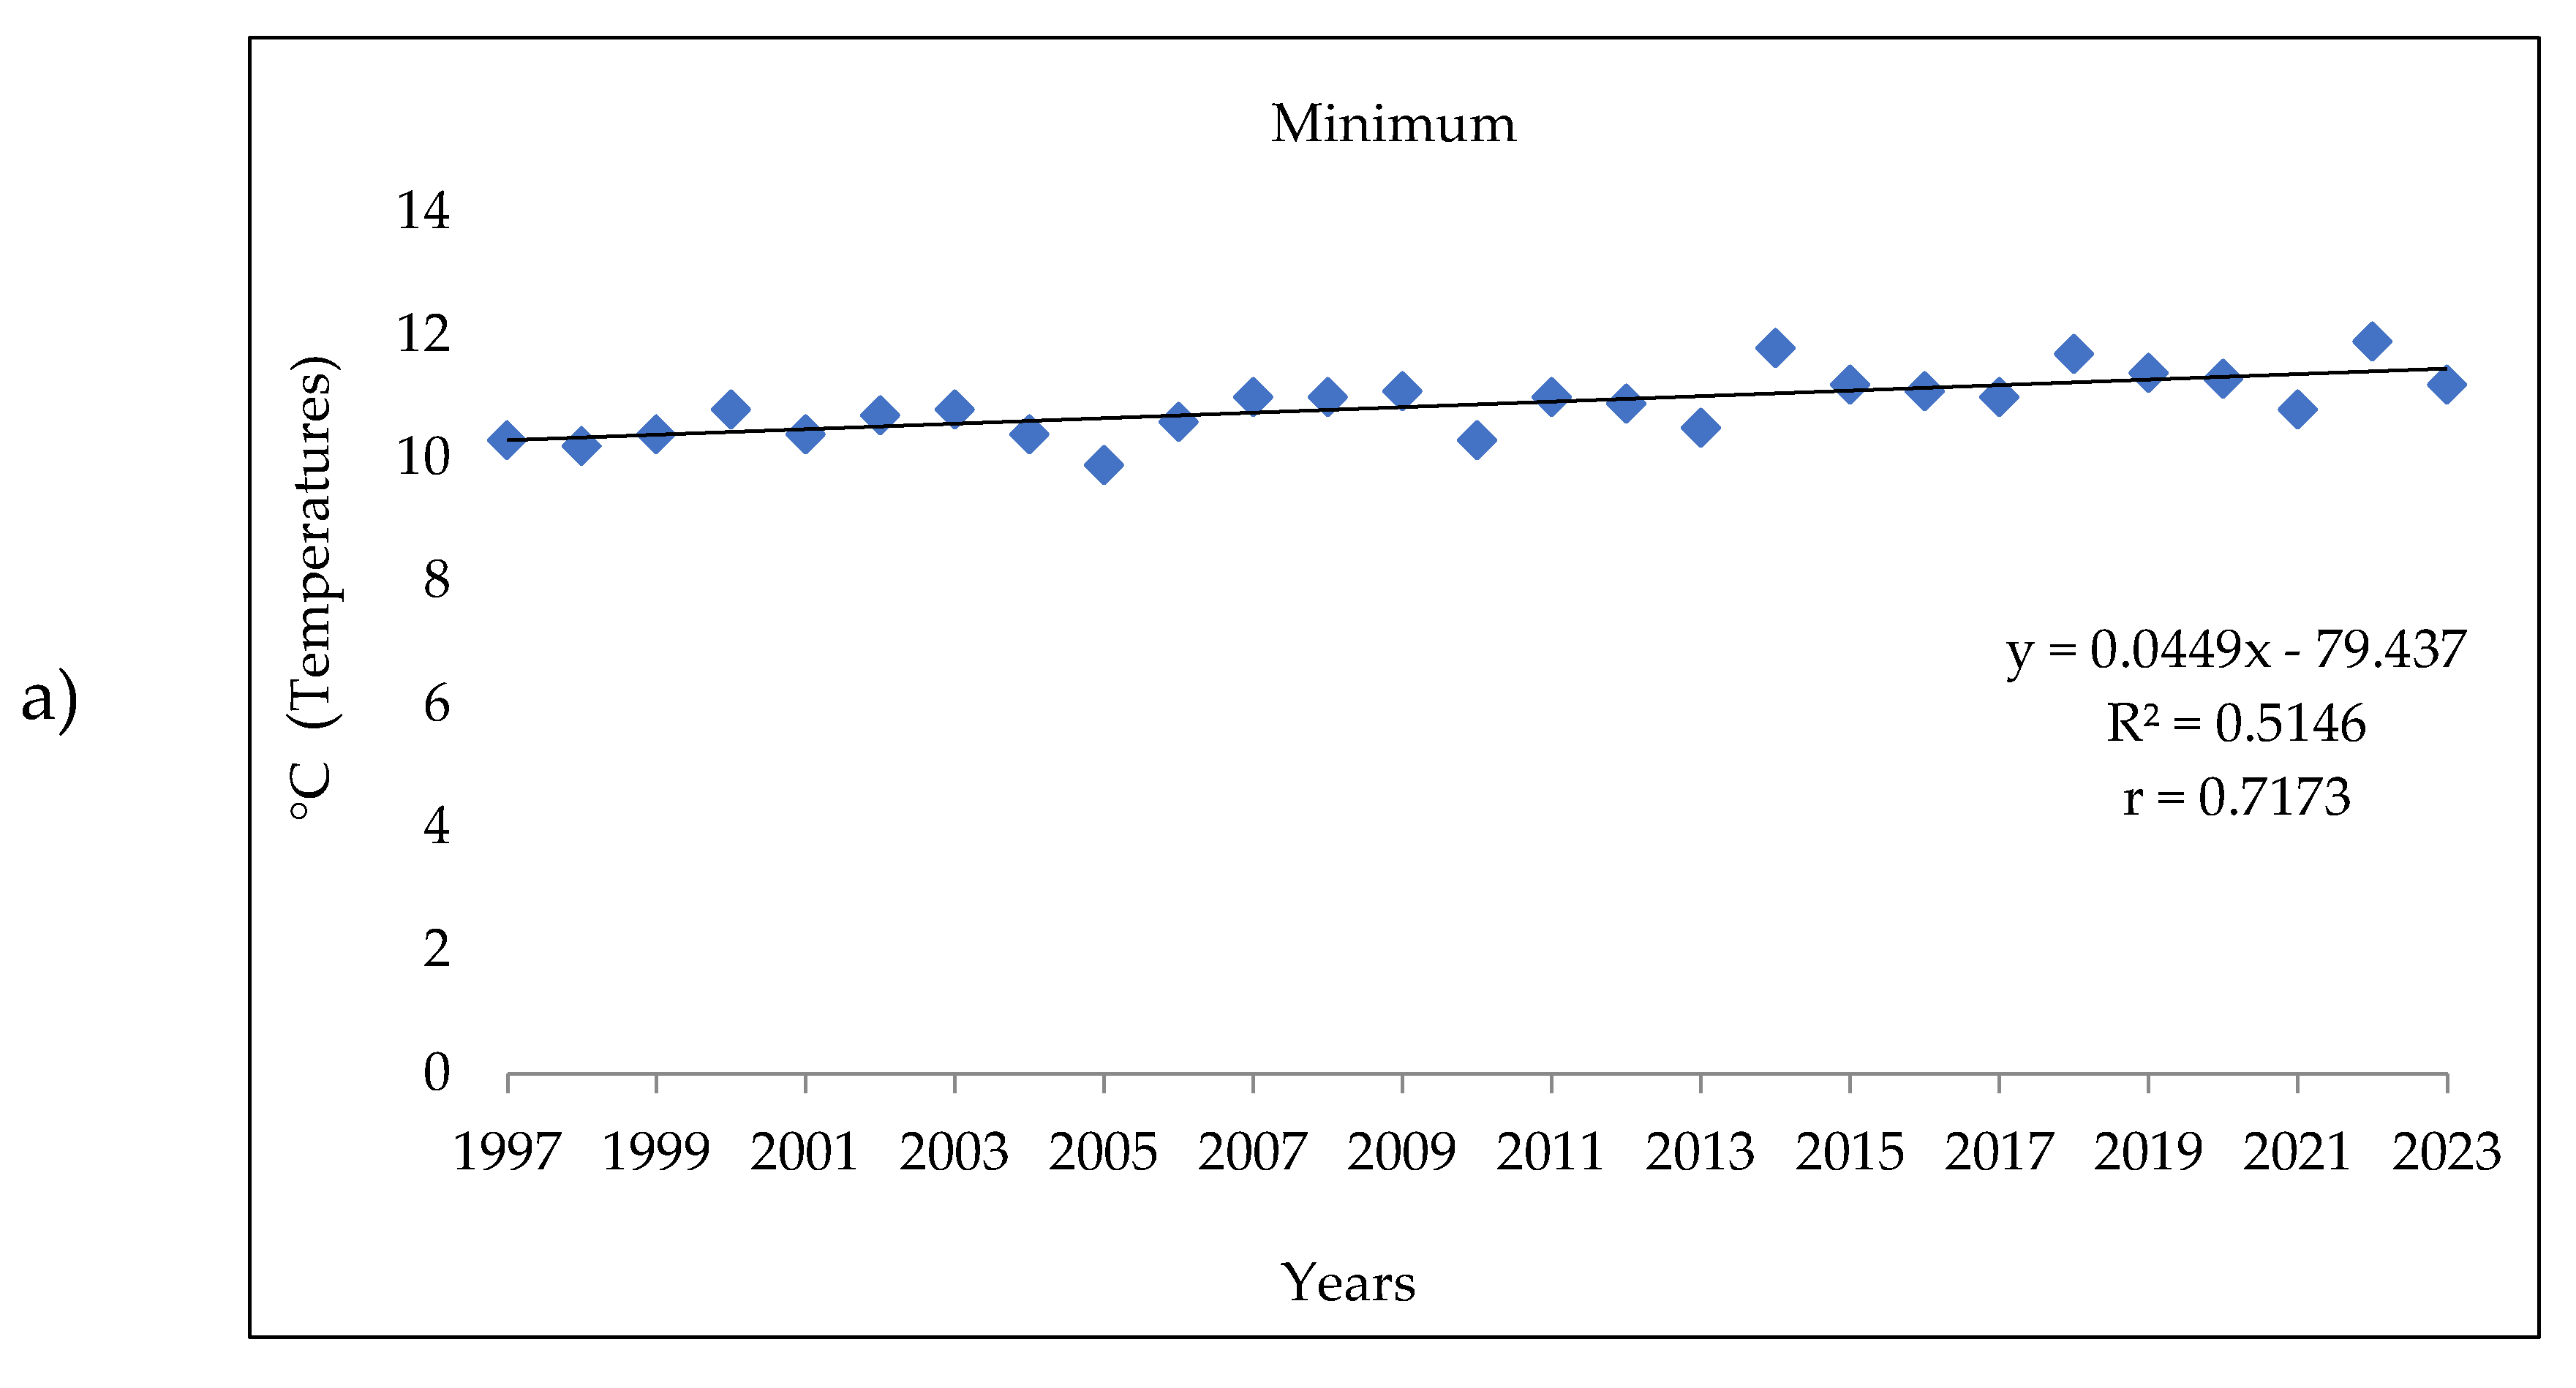
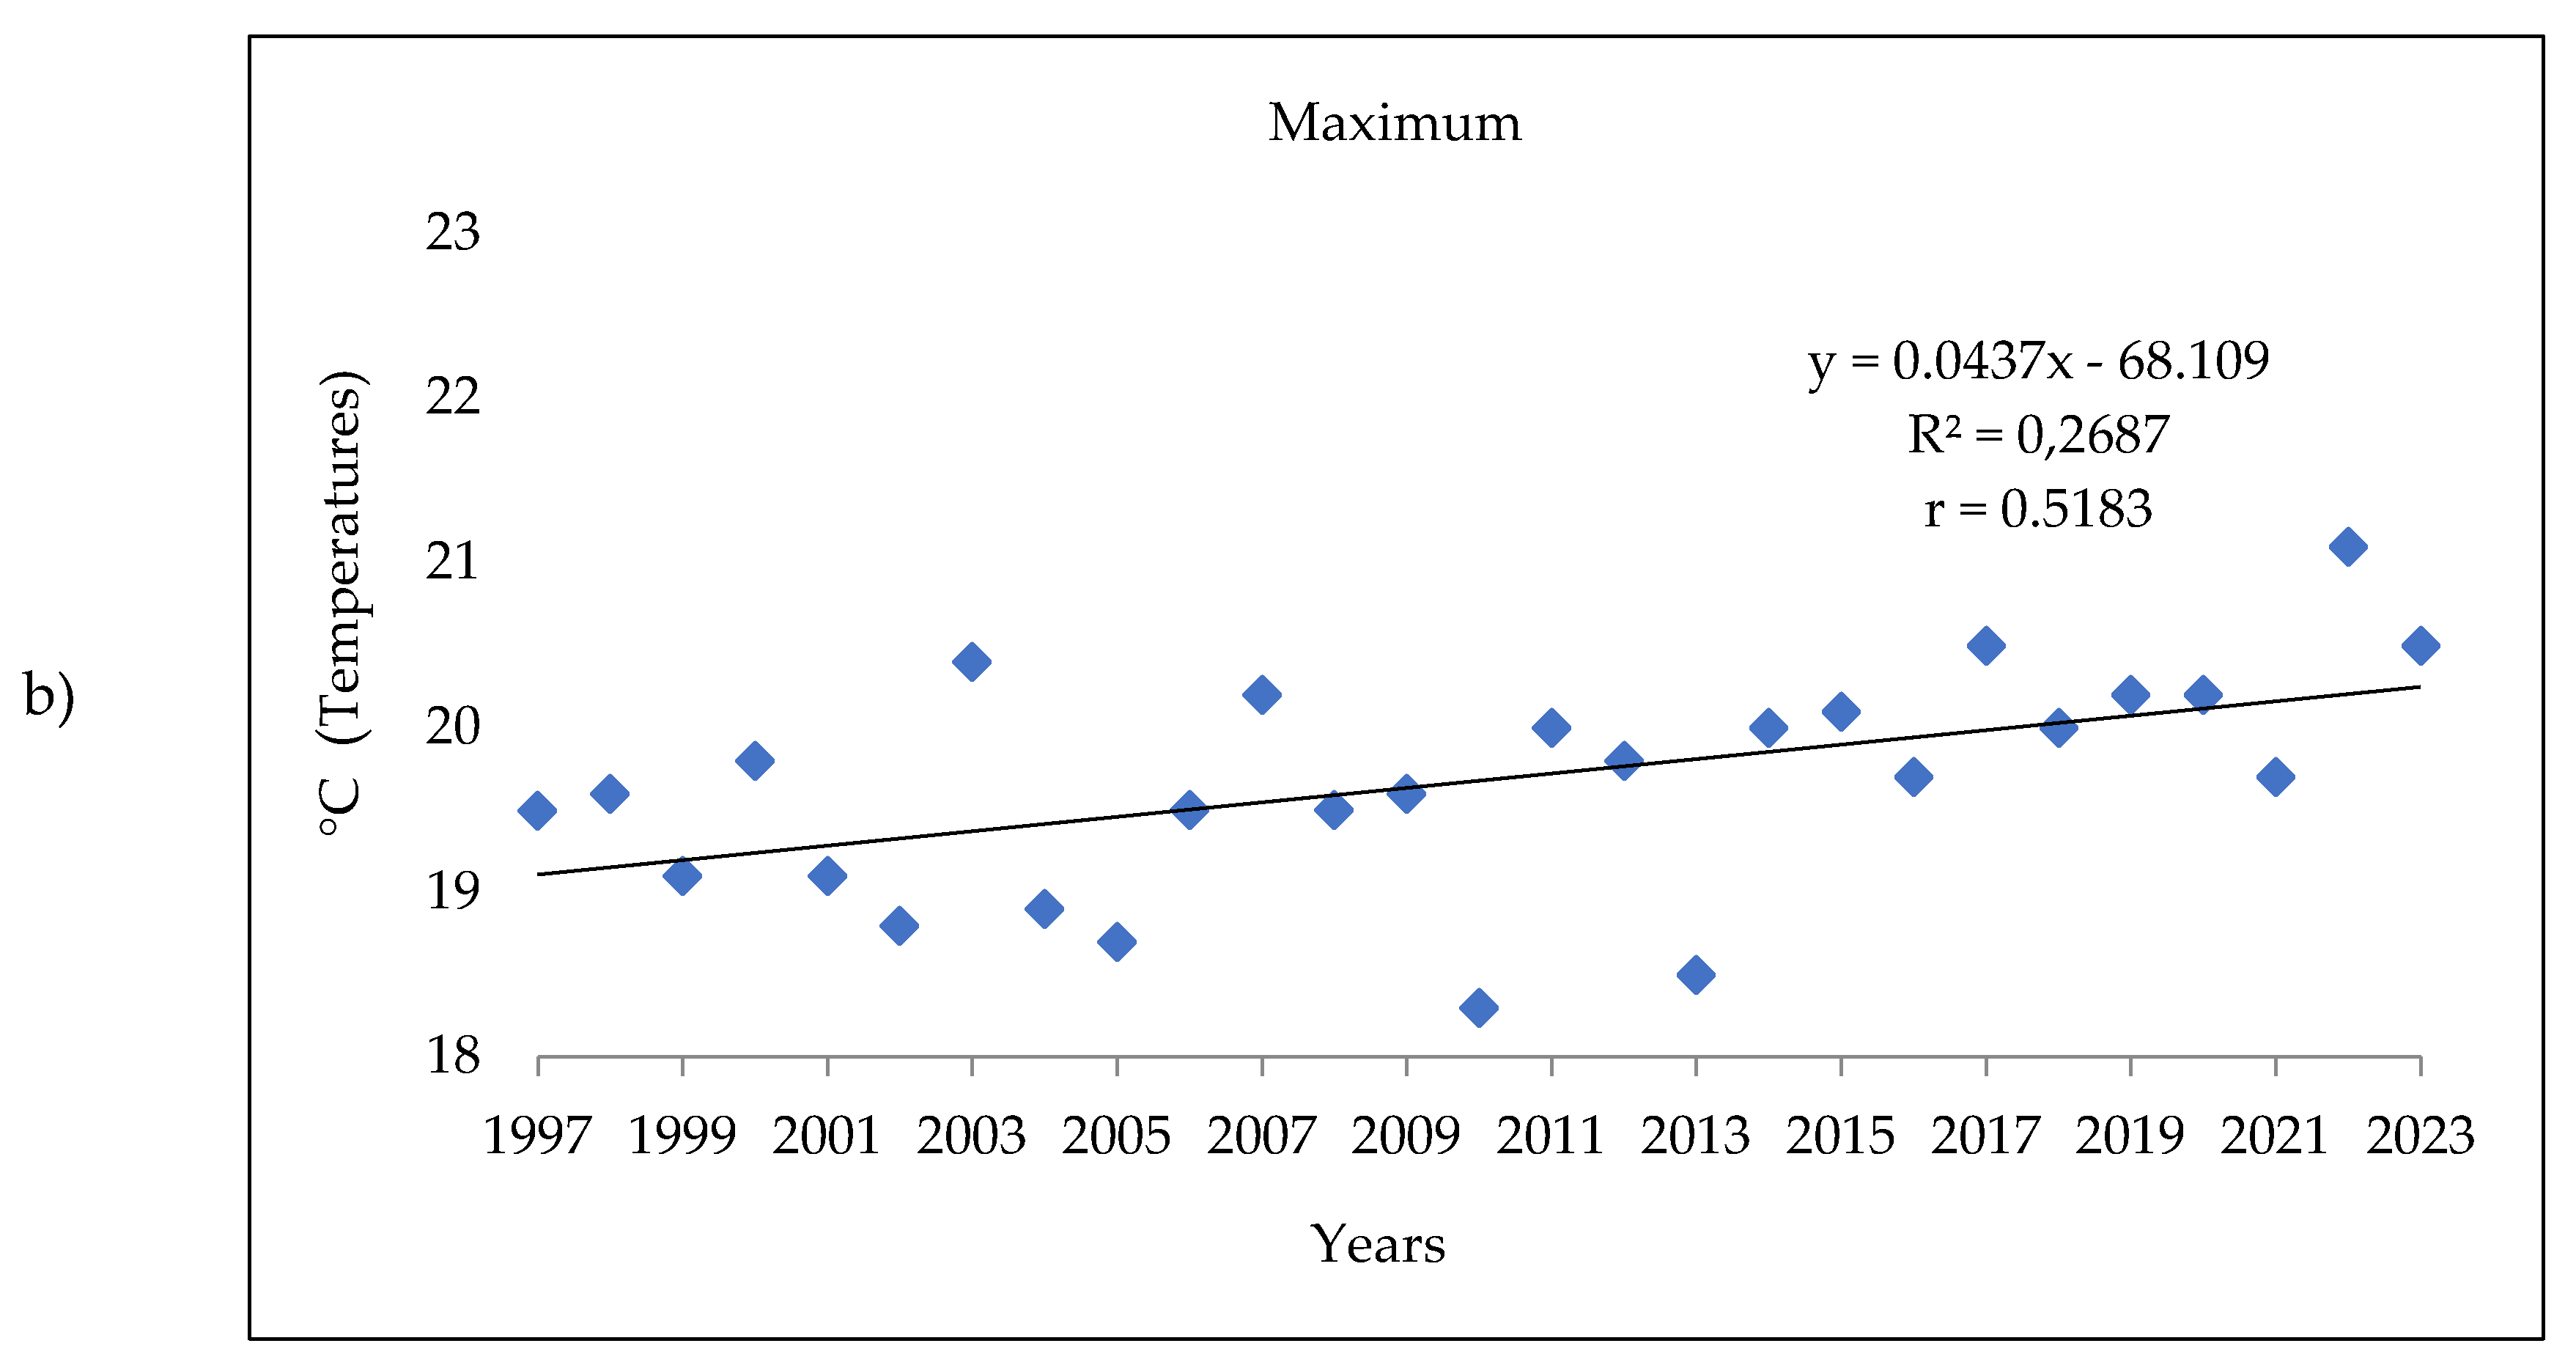
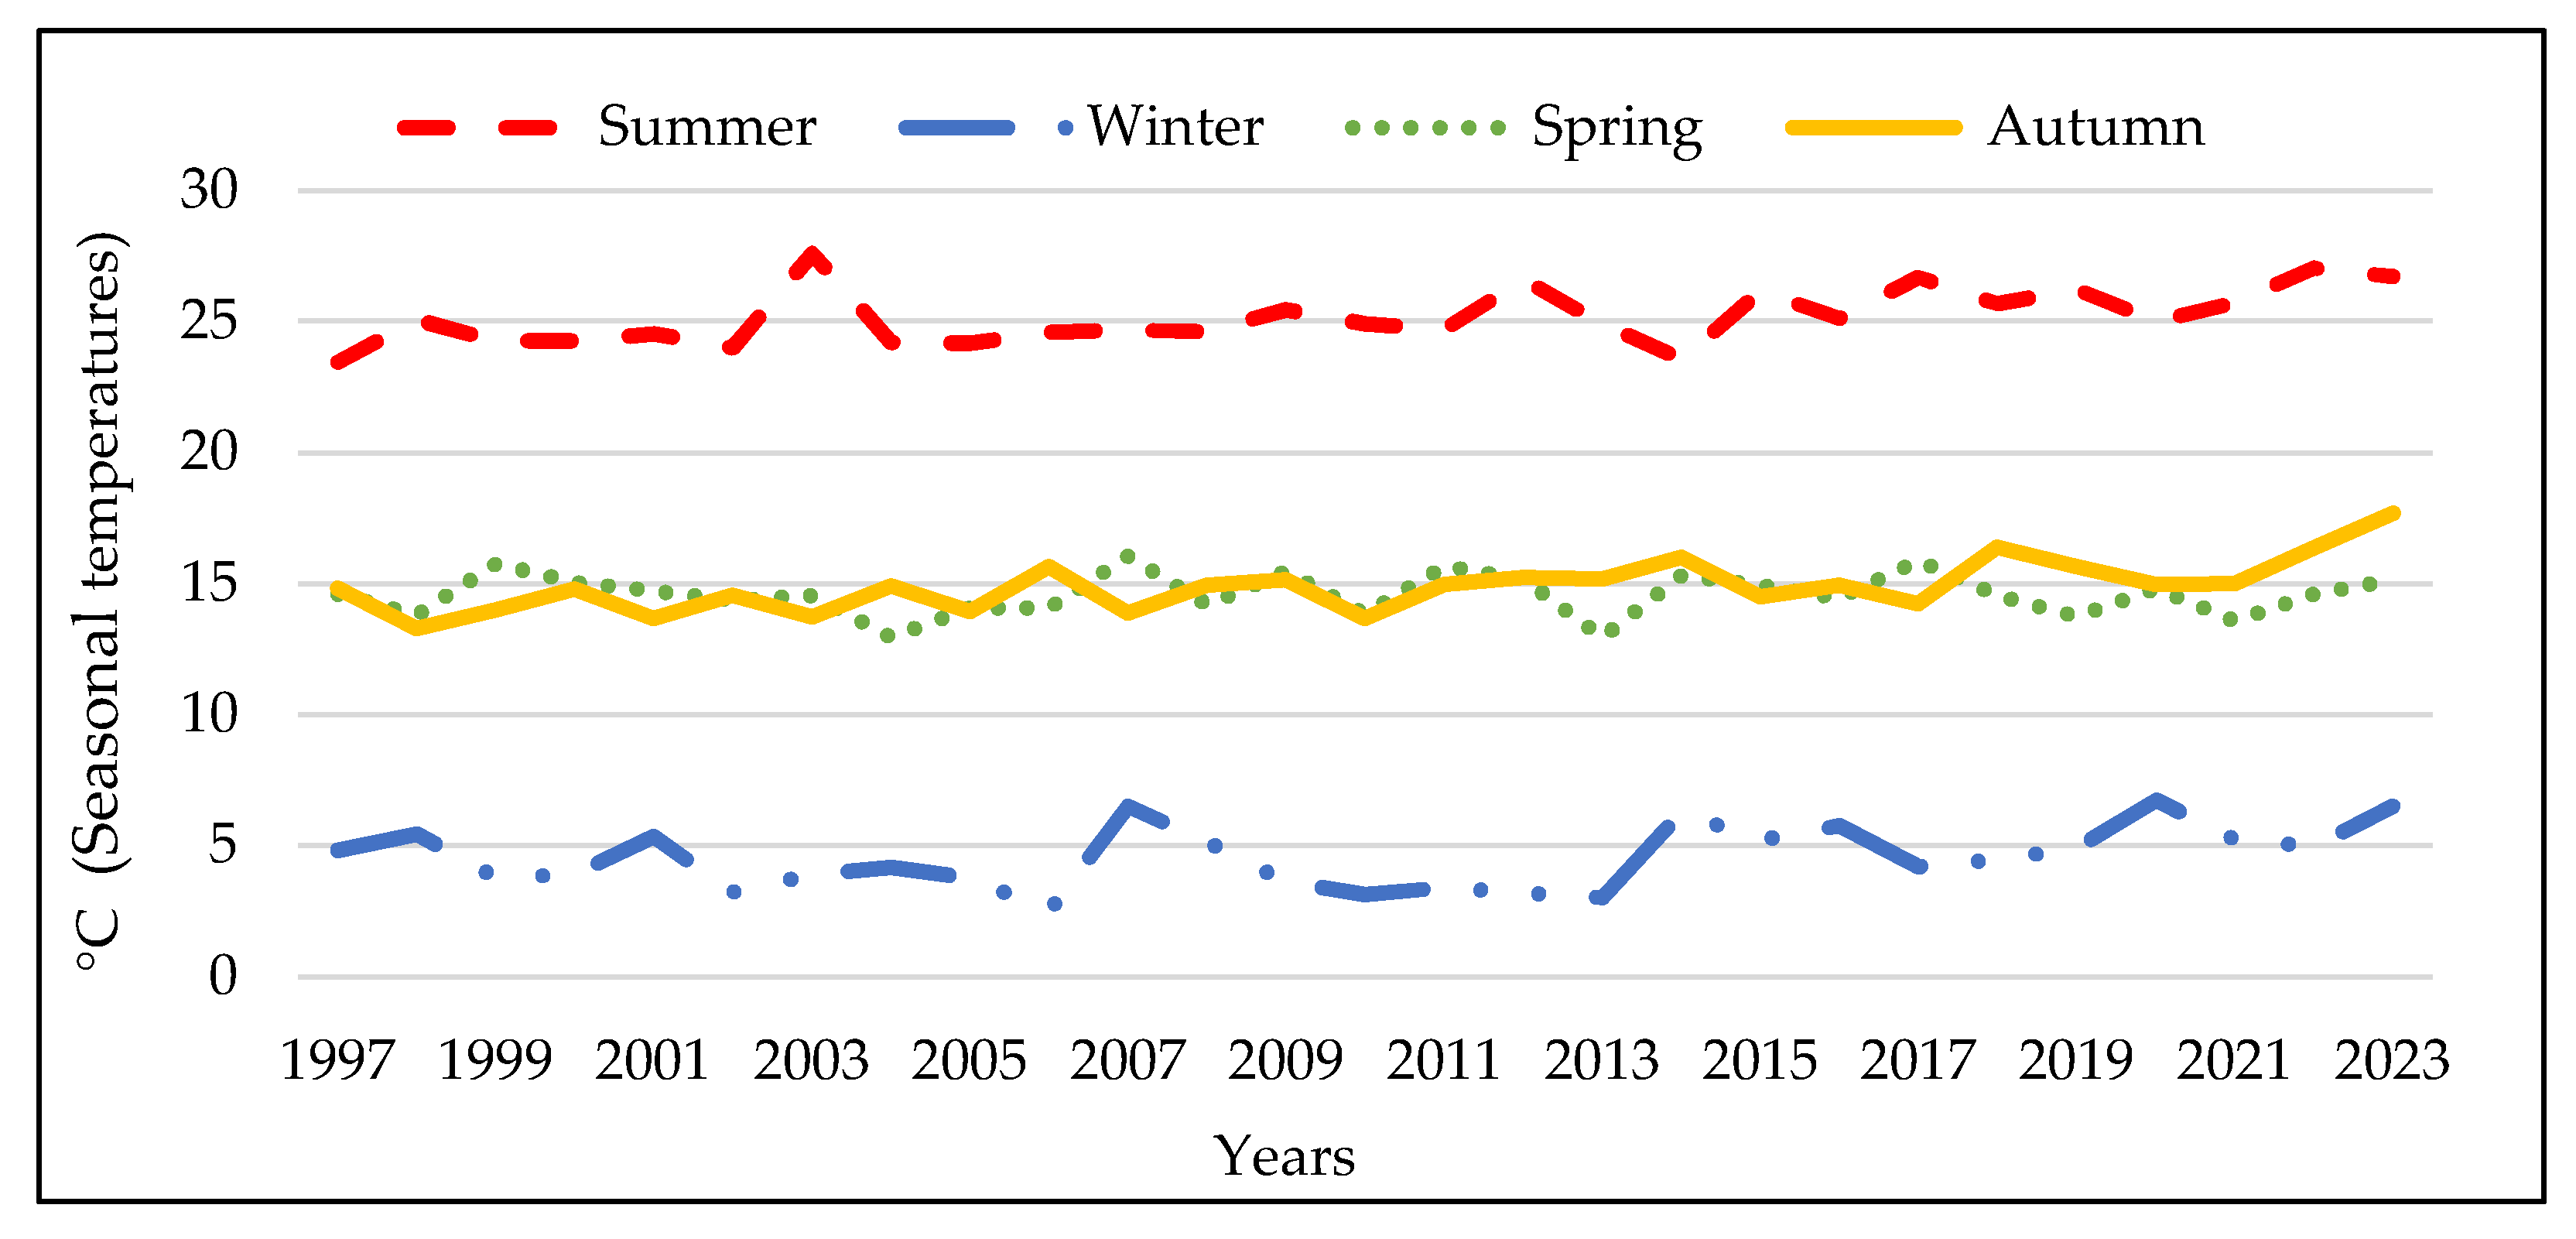
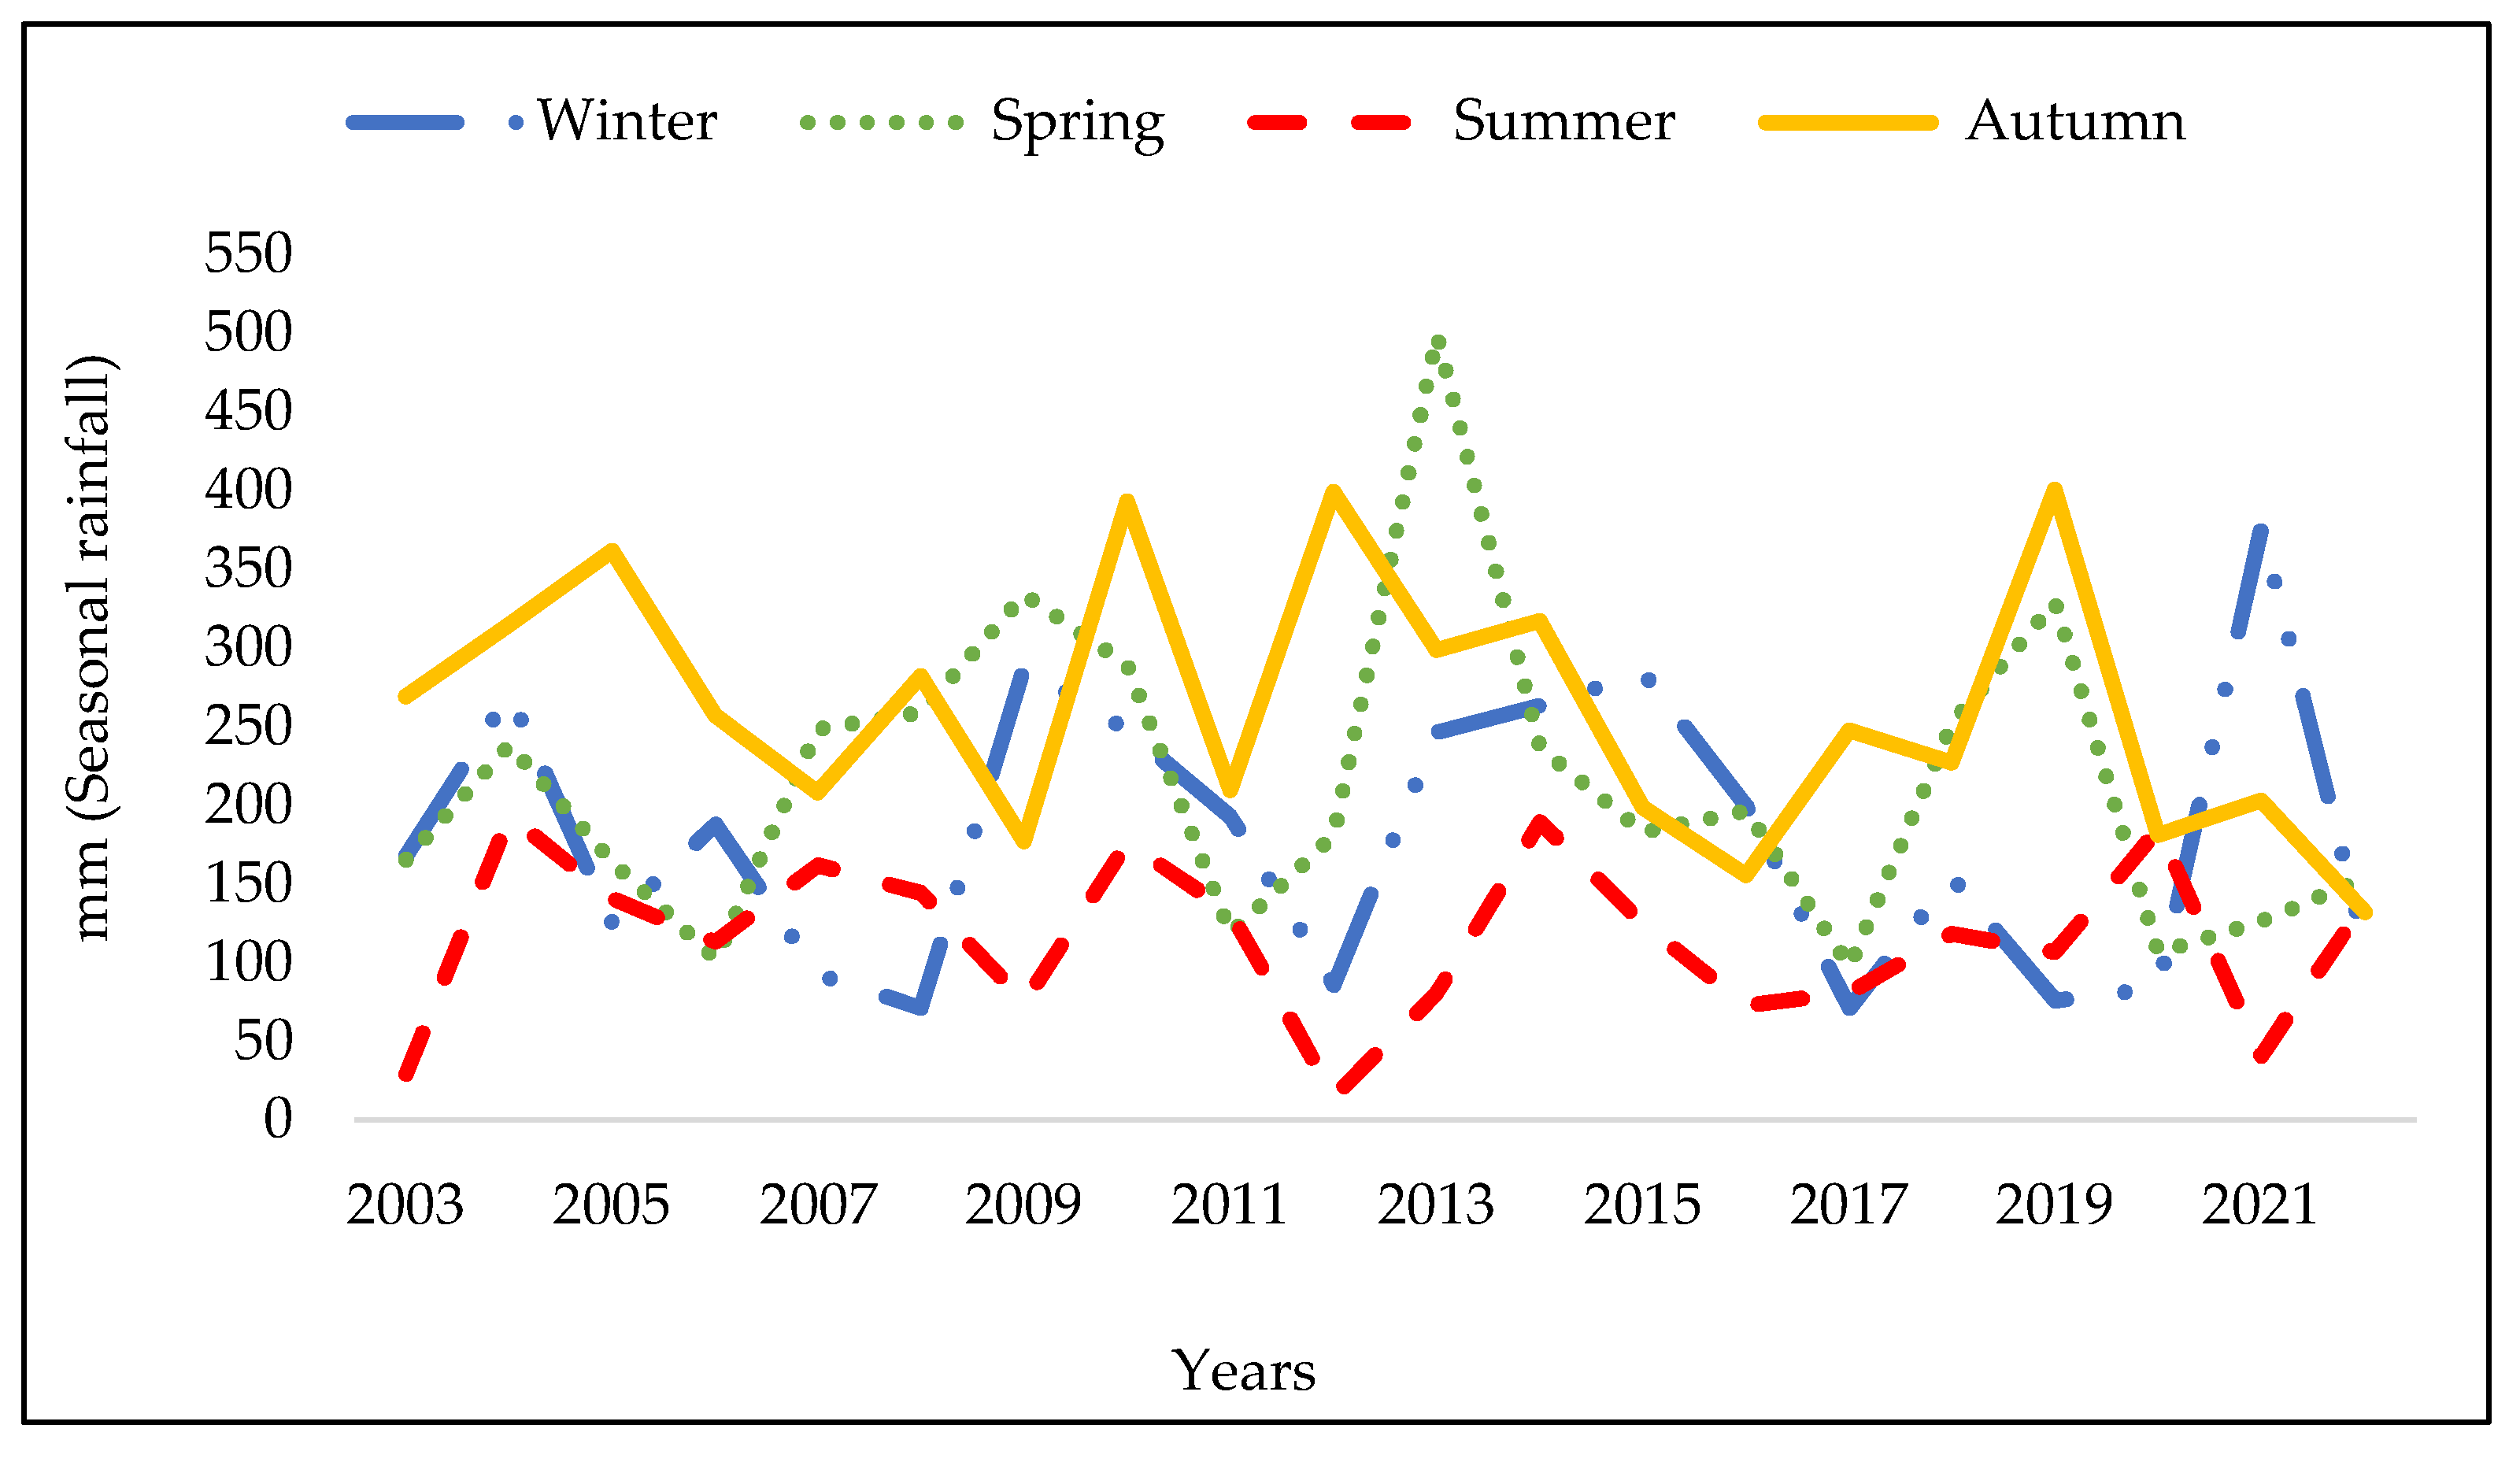
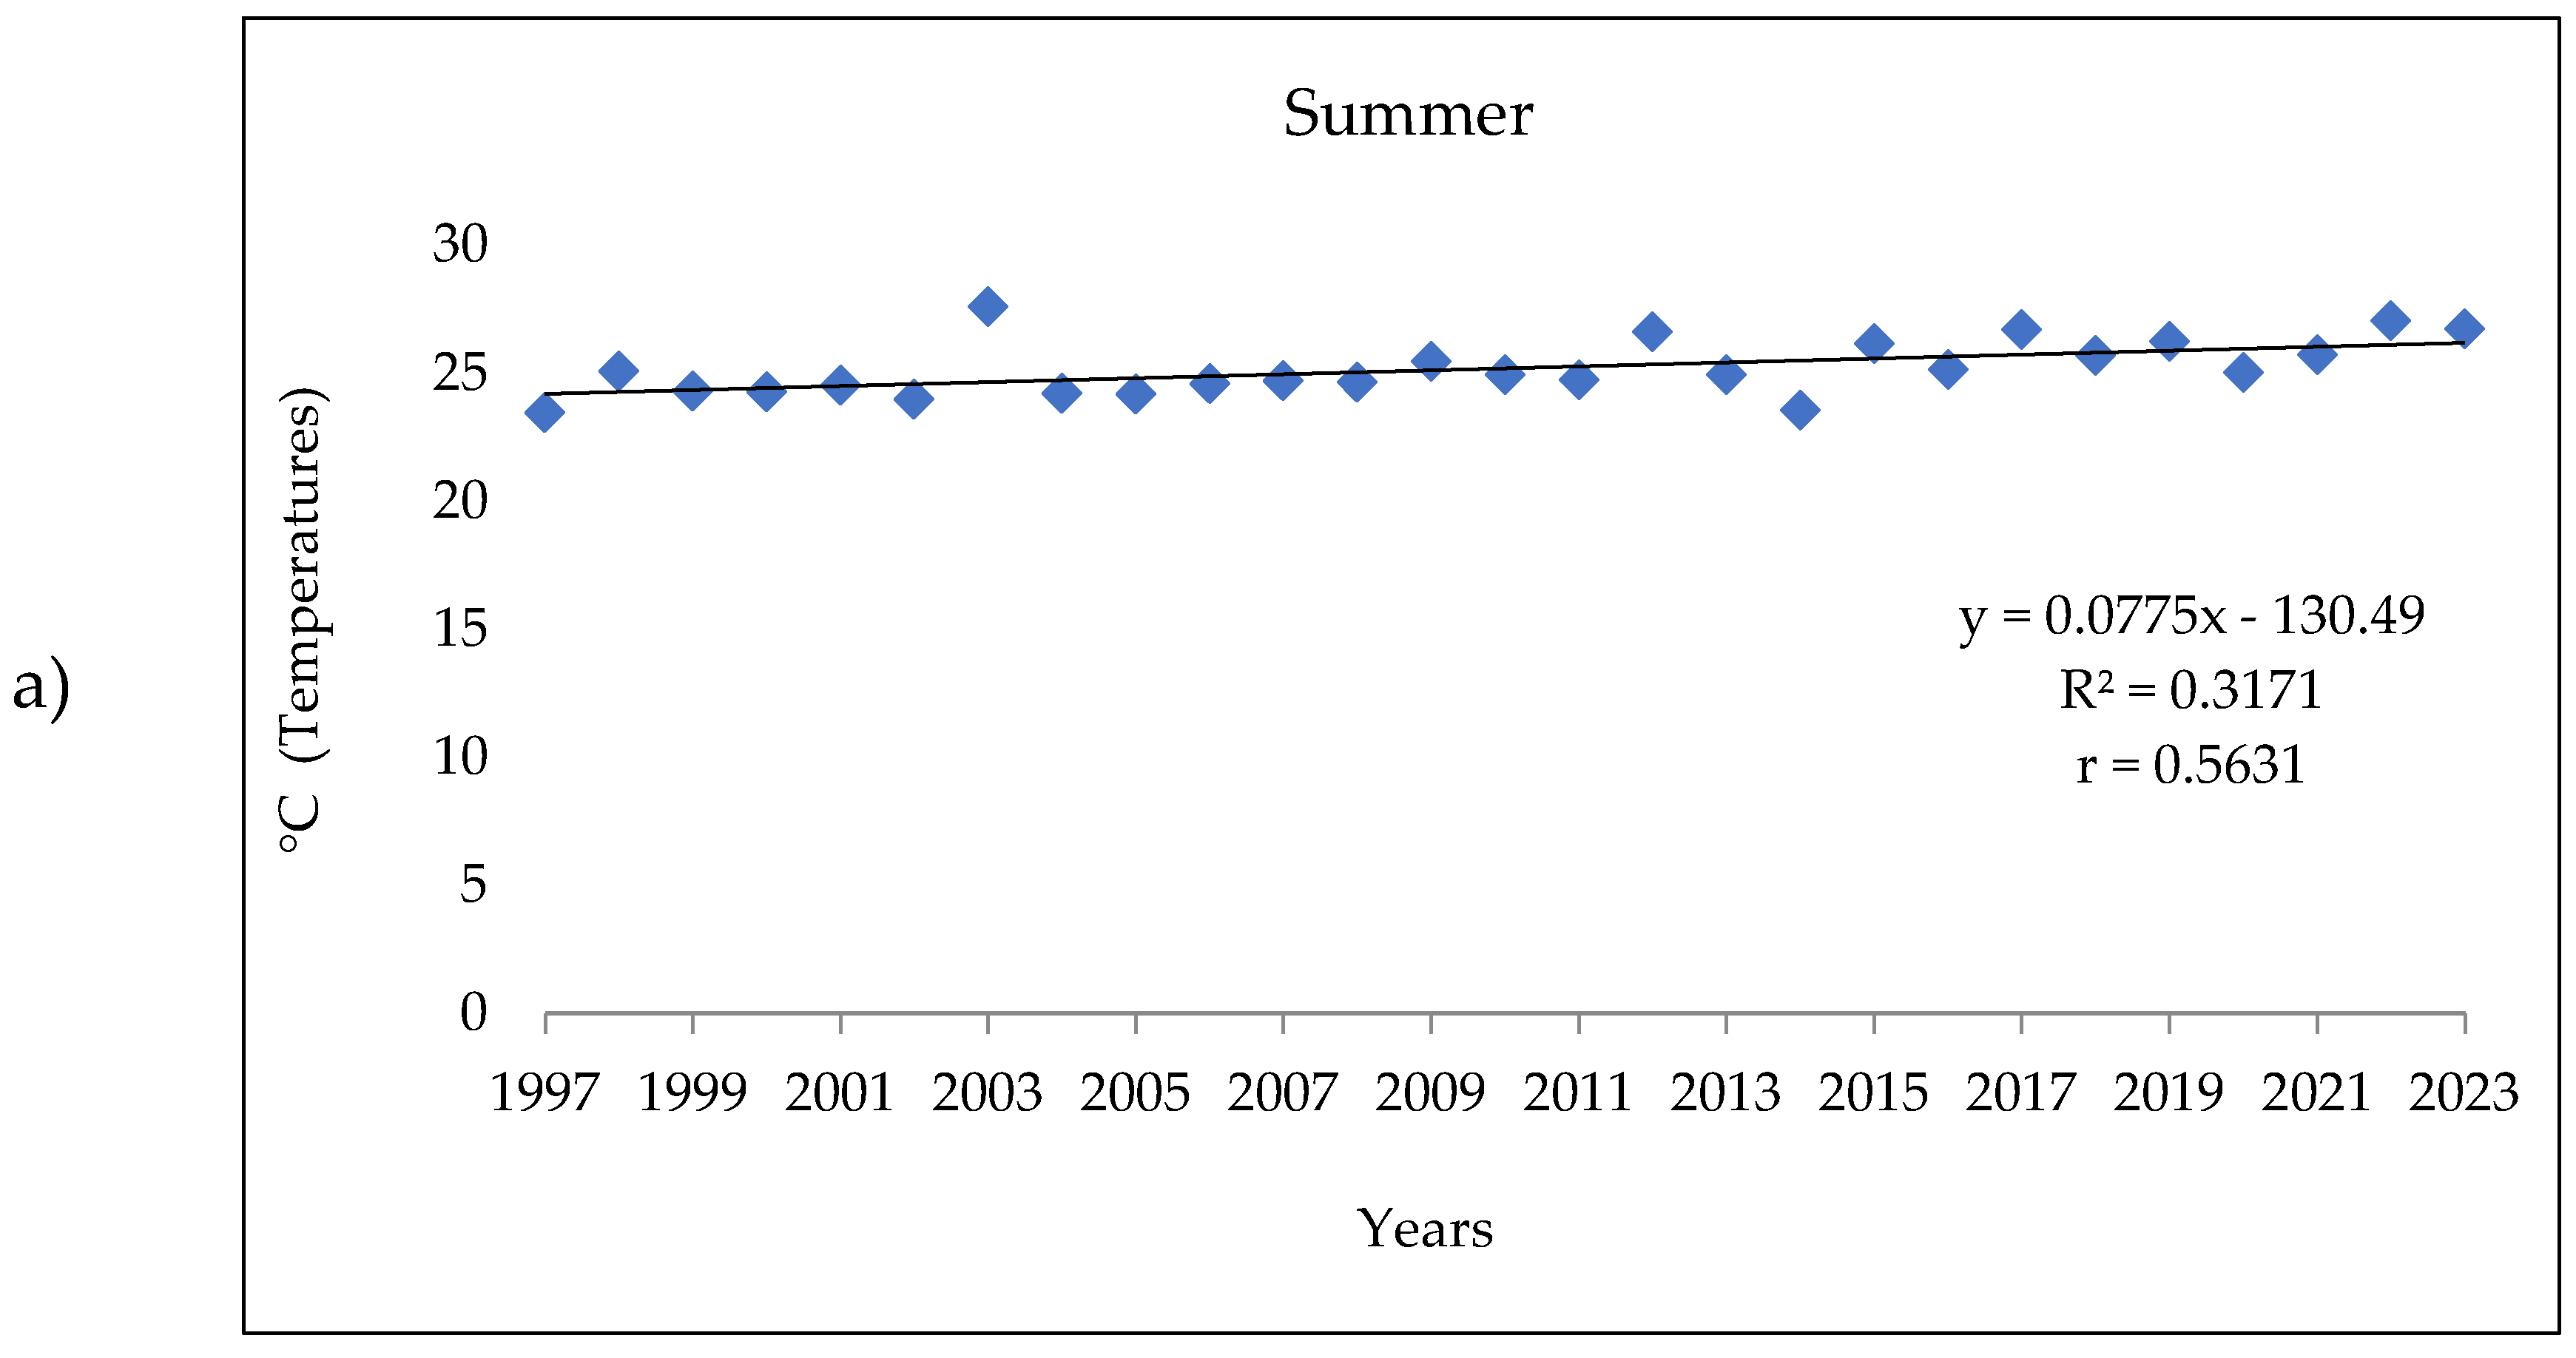
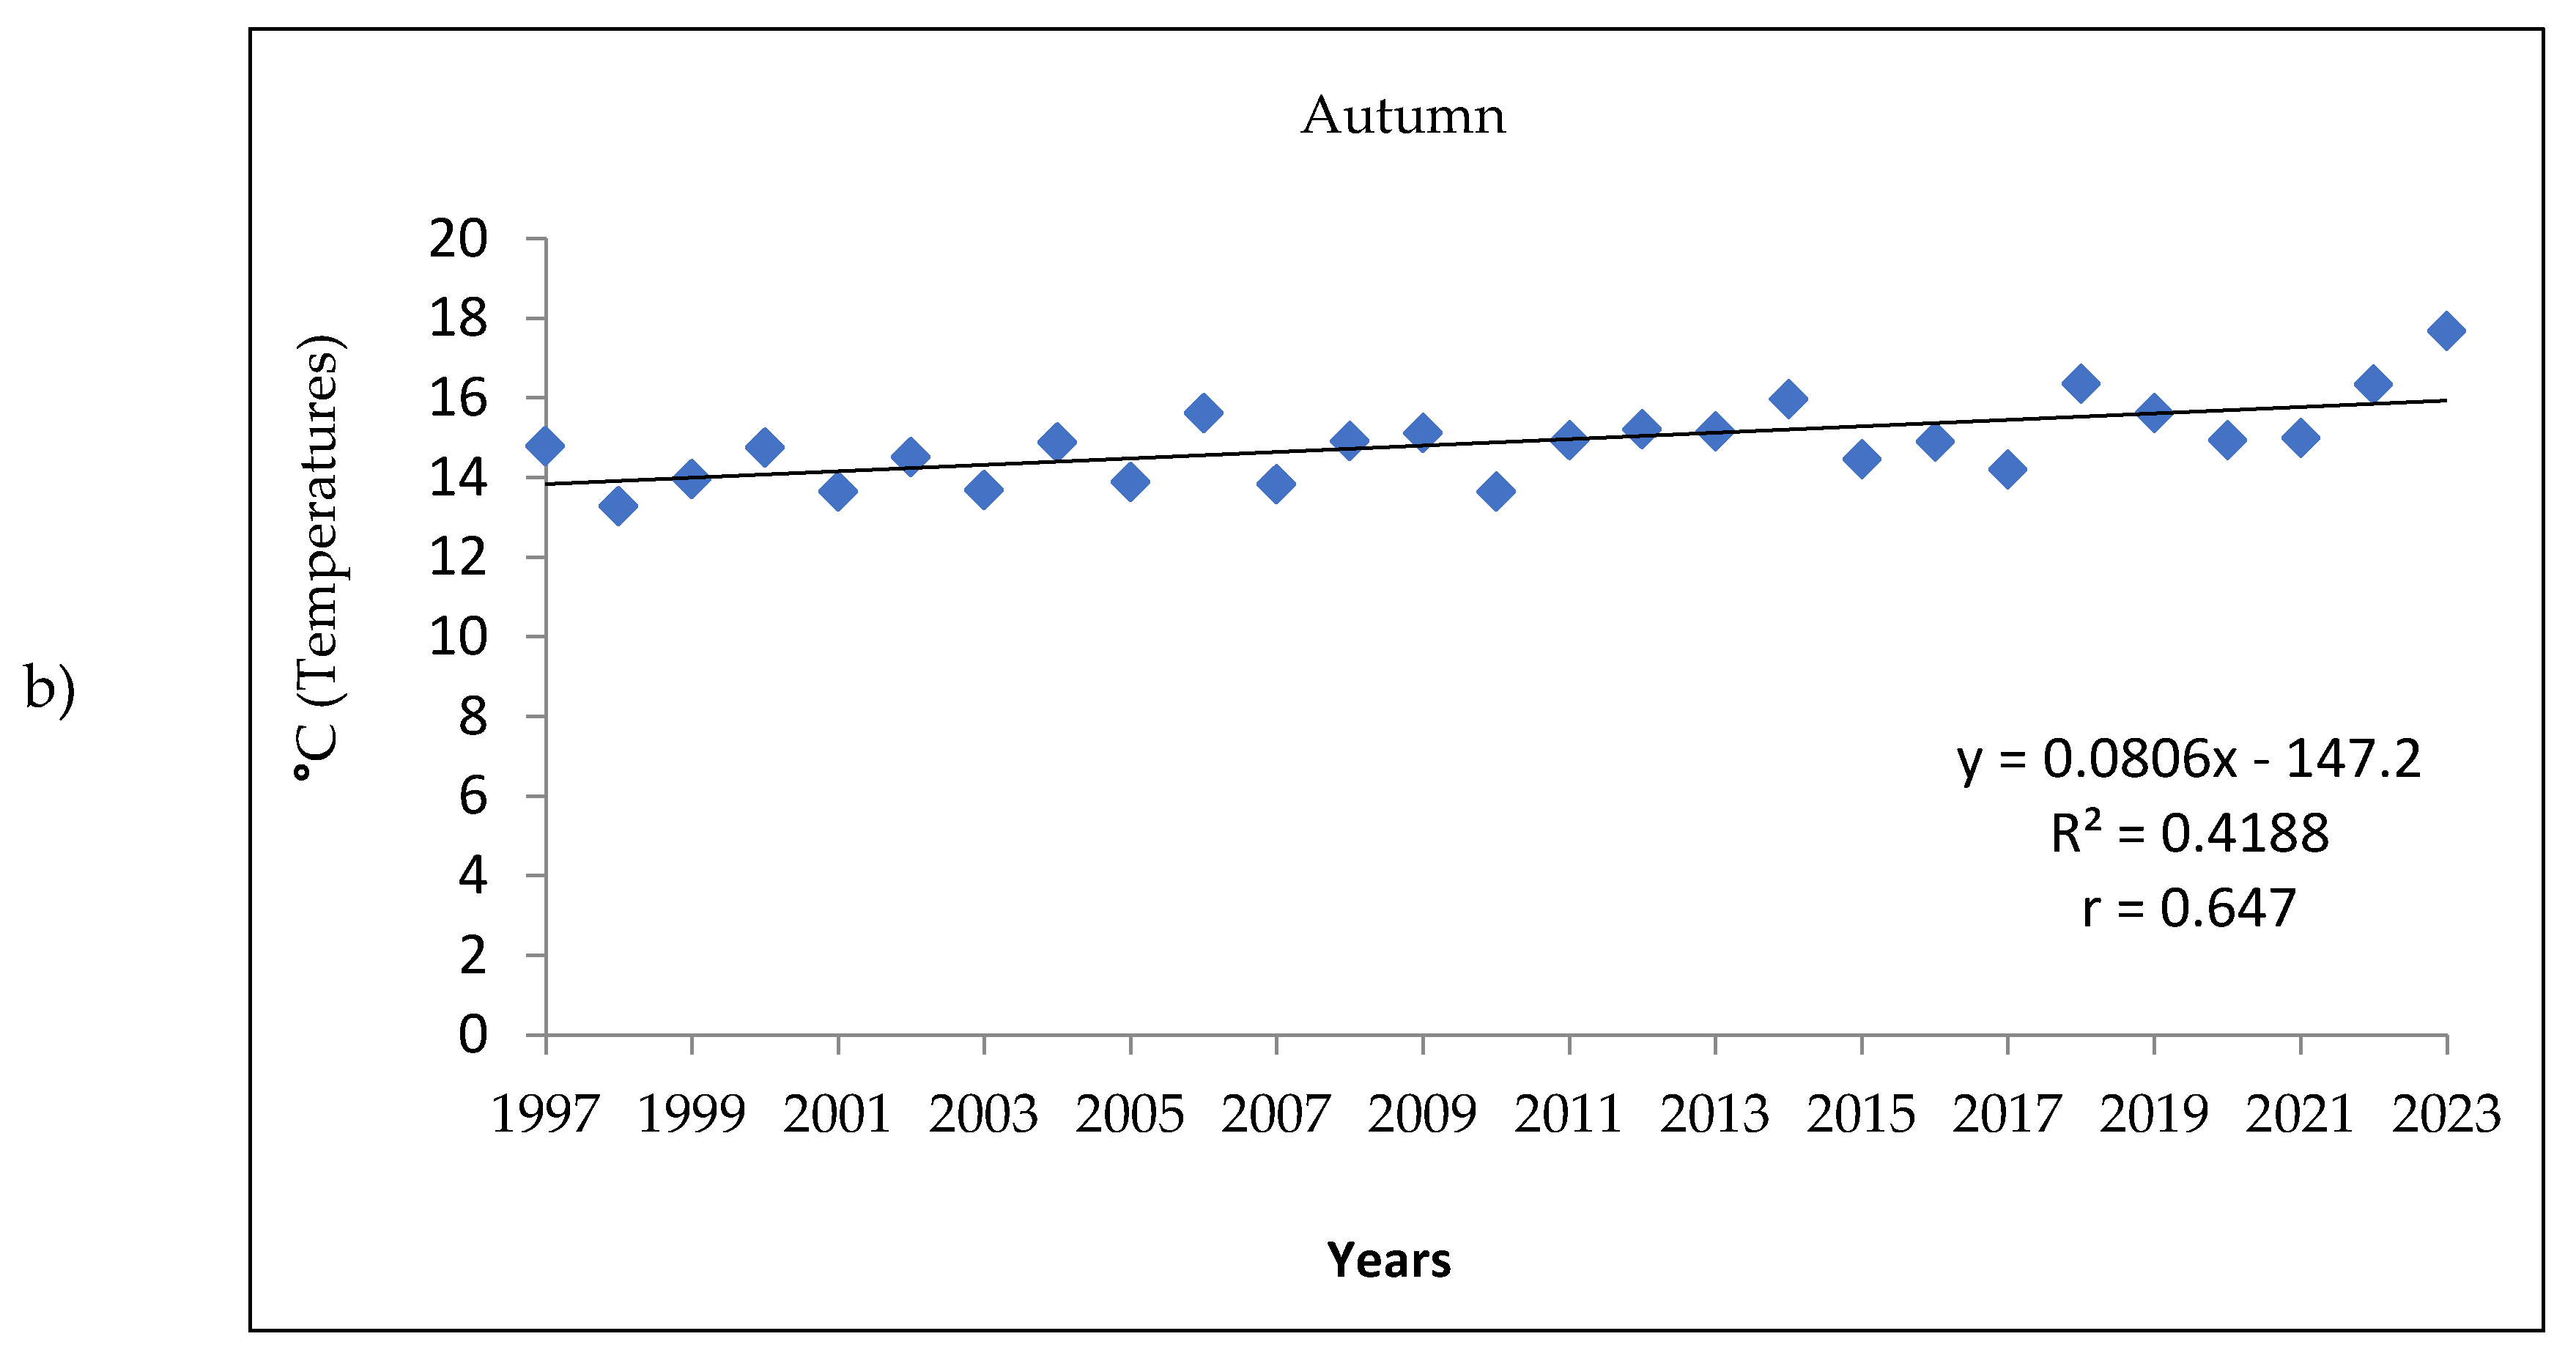
3.1. Analysis of the Meteorologic Parameters over 27 Years
3.2. Characteristics and Trends of Pollen Seasons over 27 Years
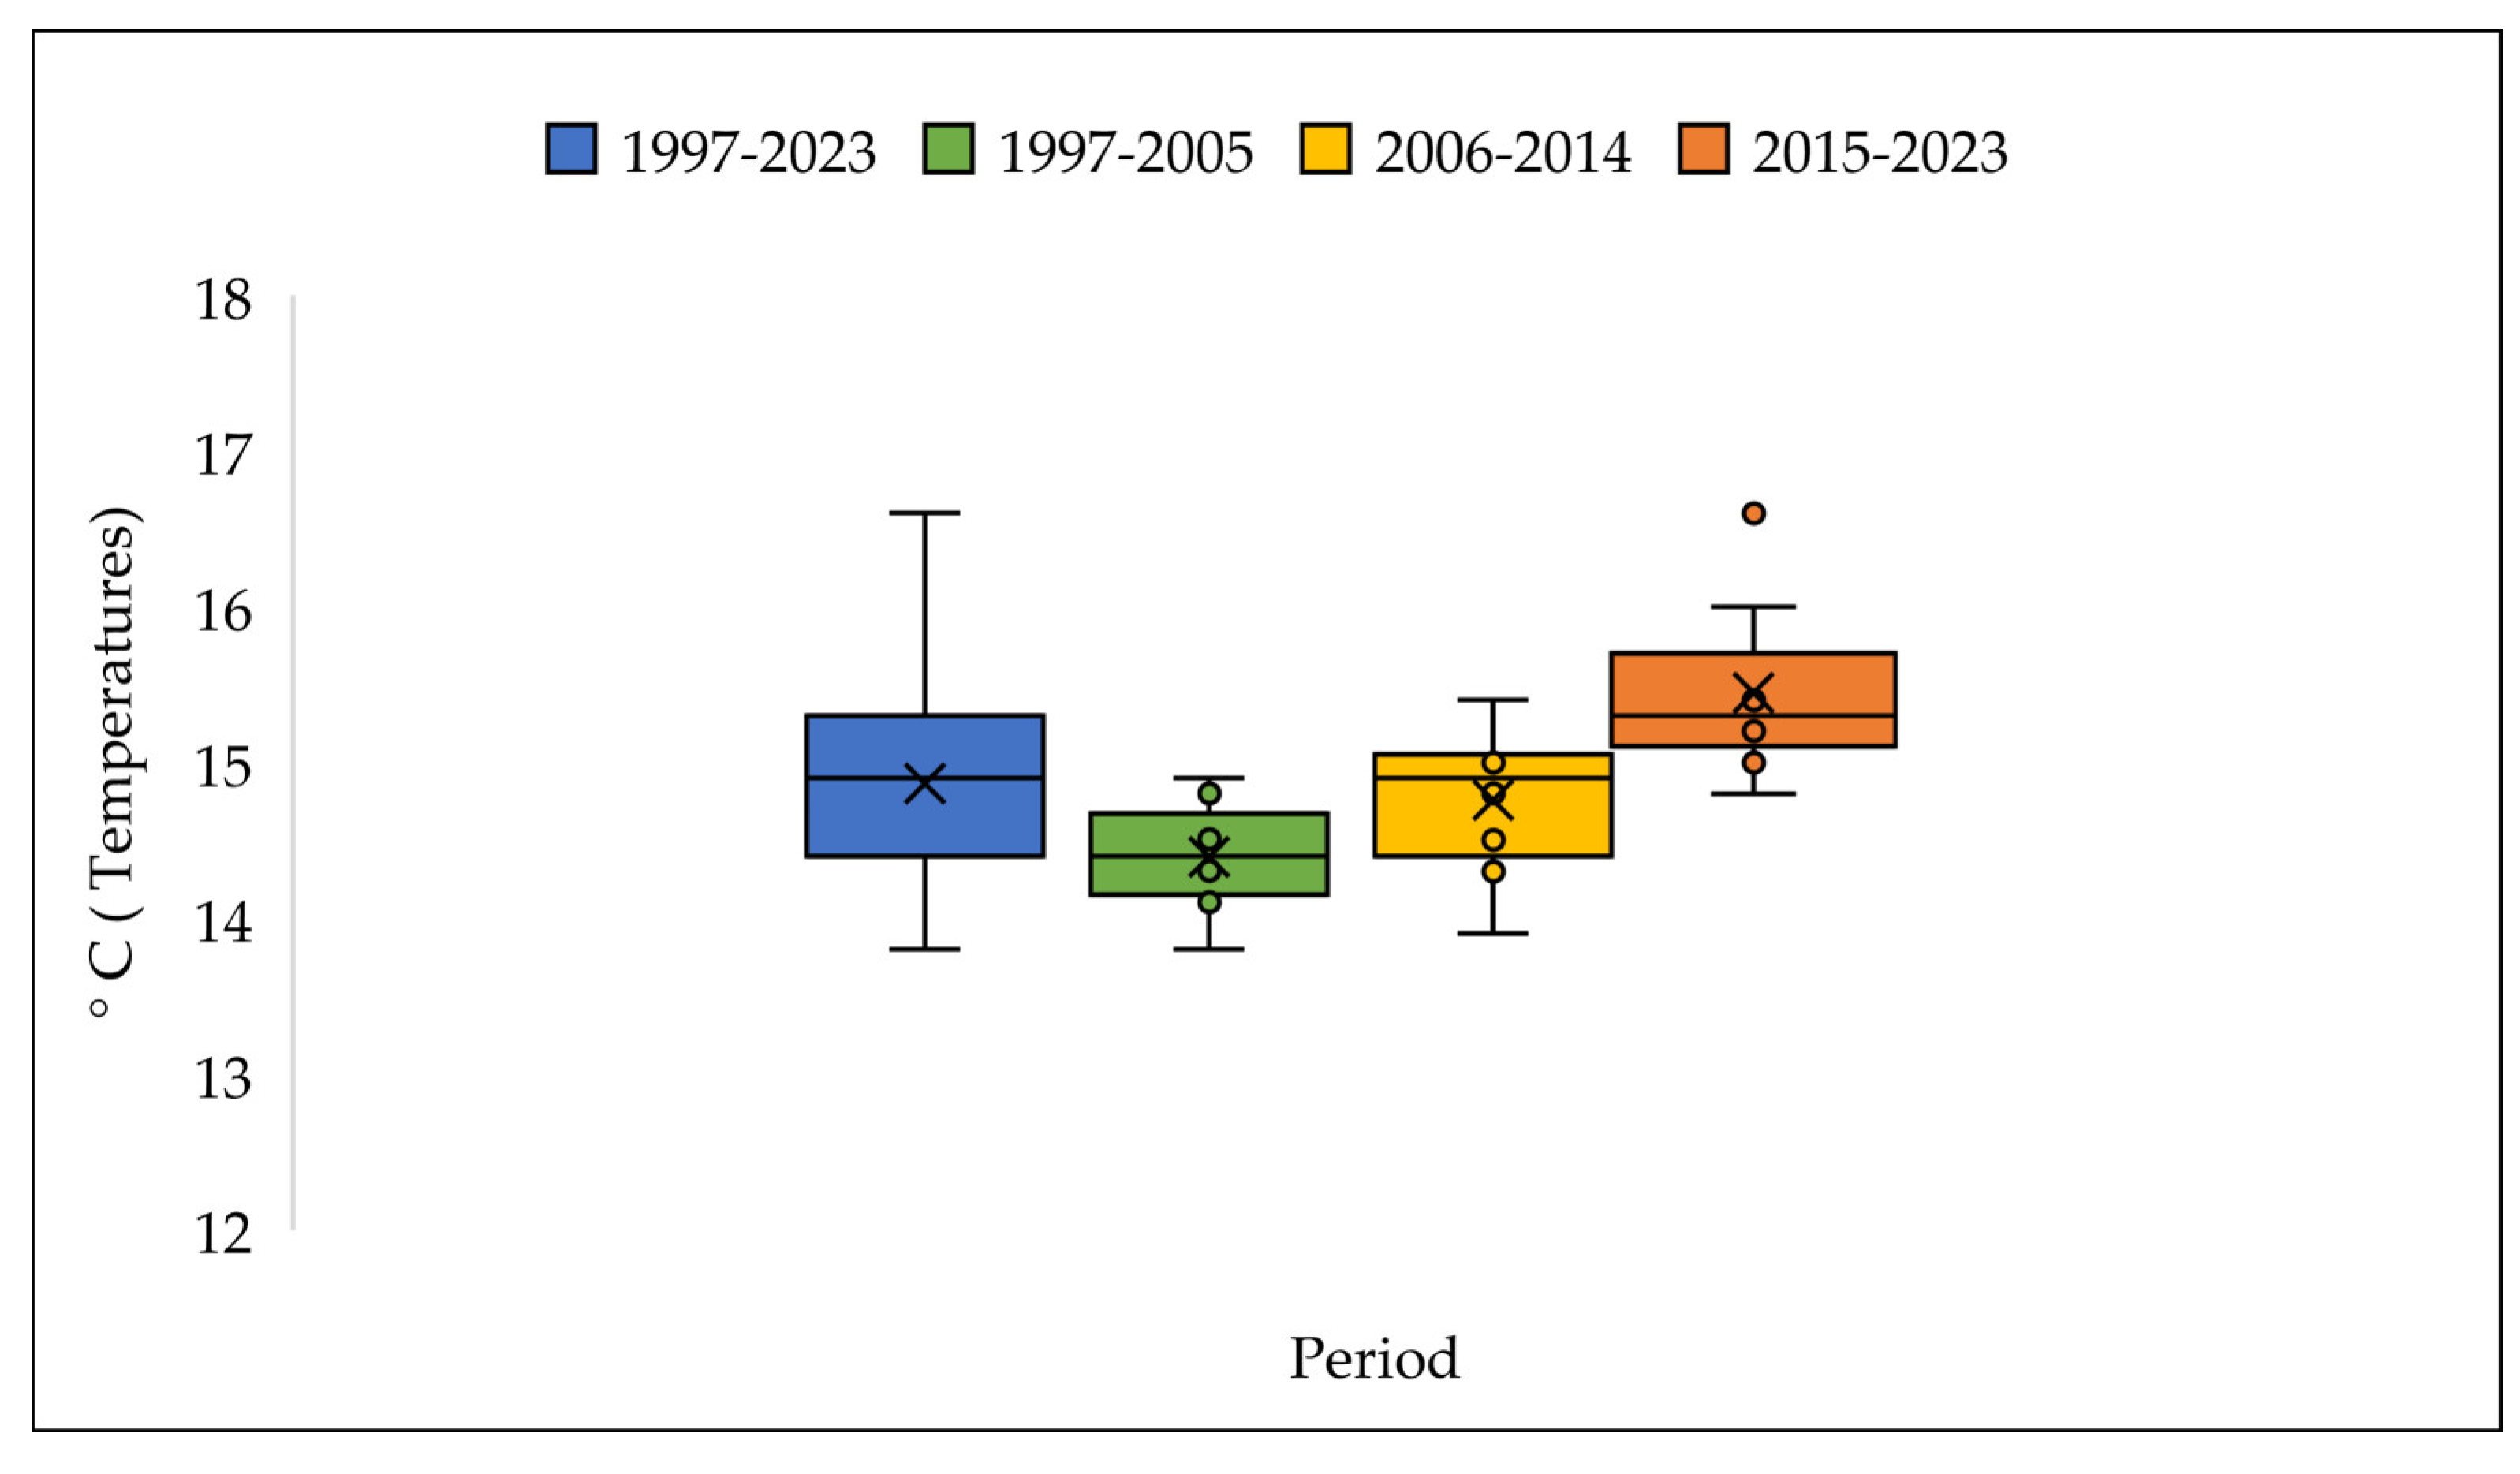
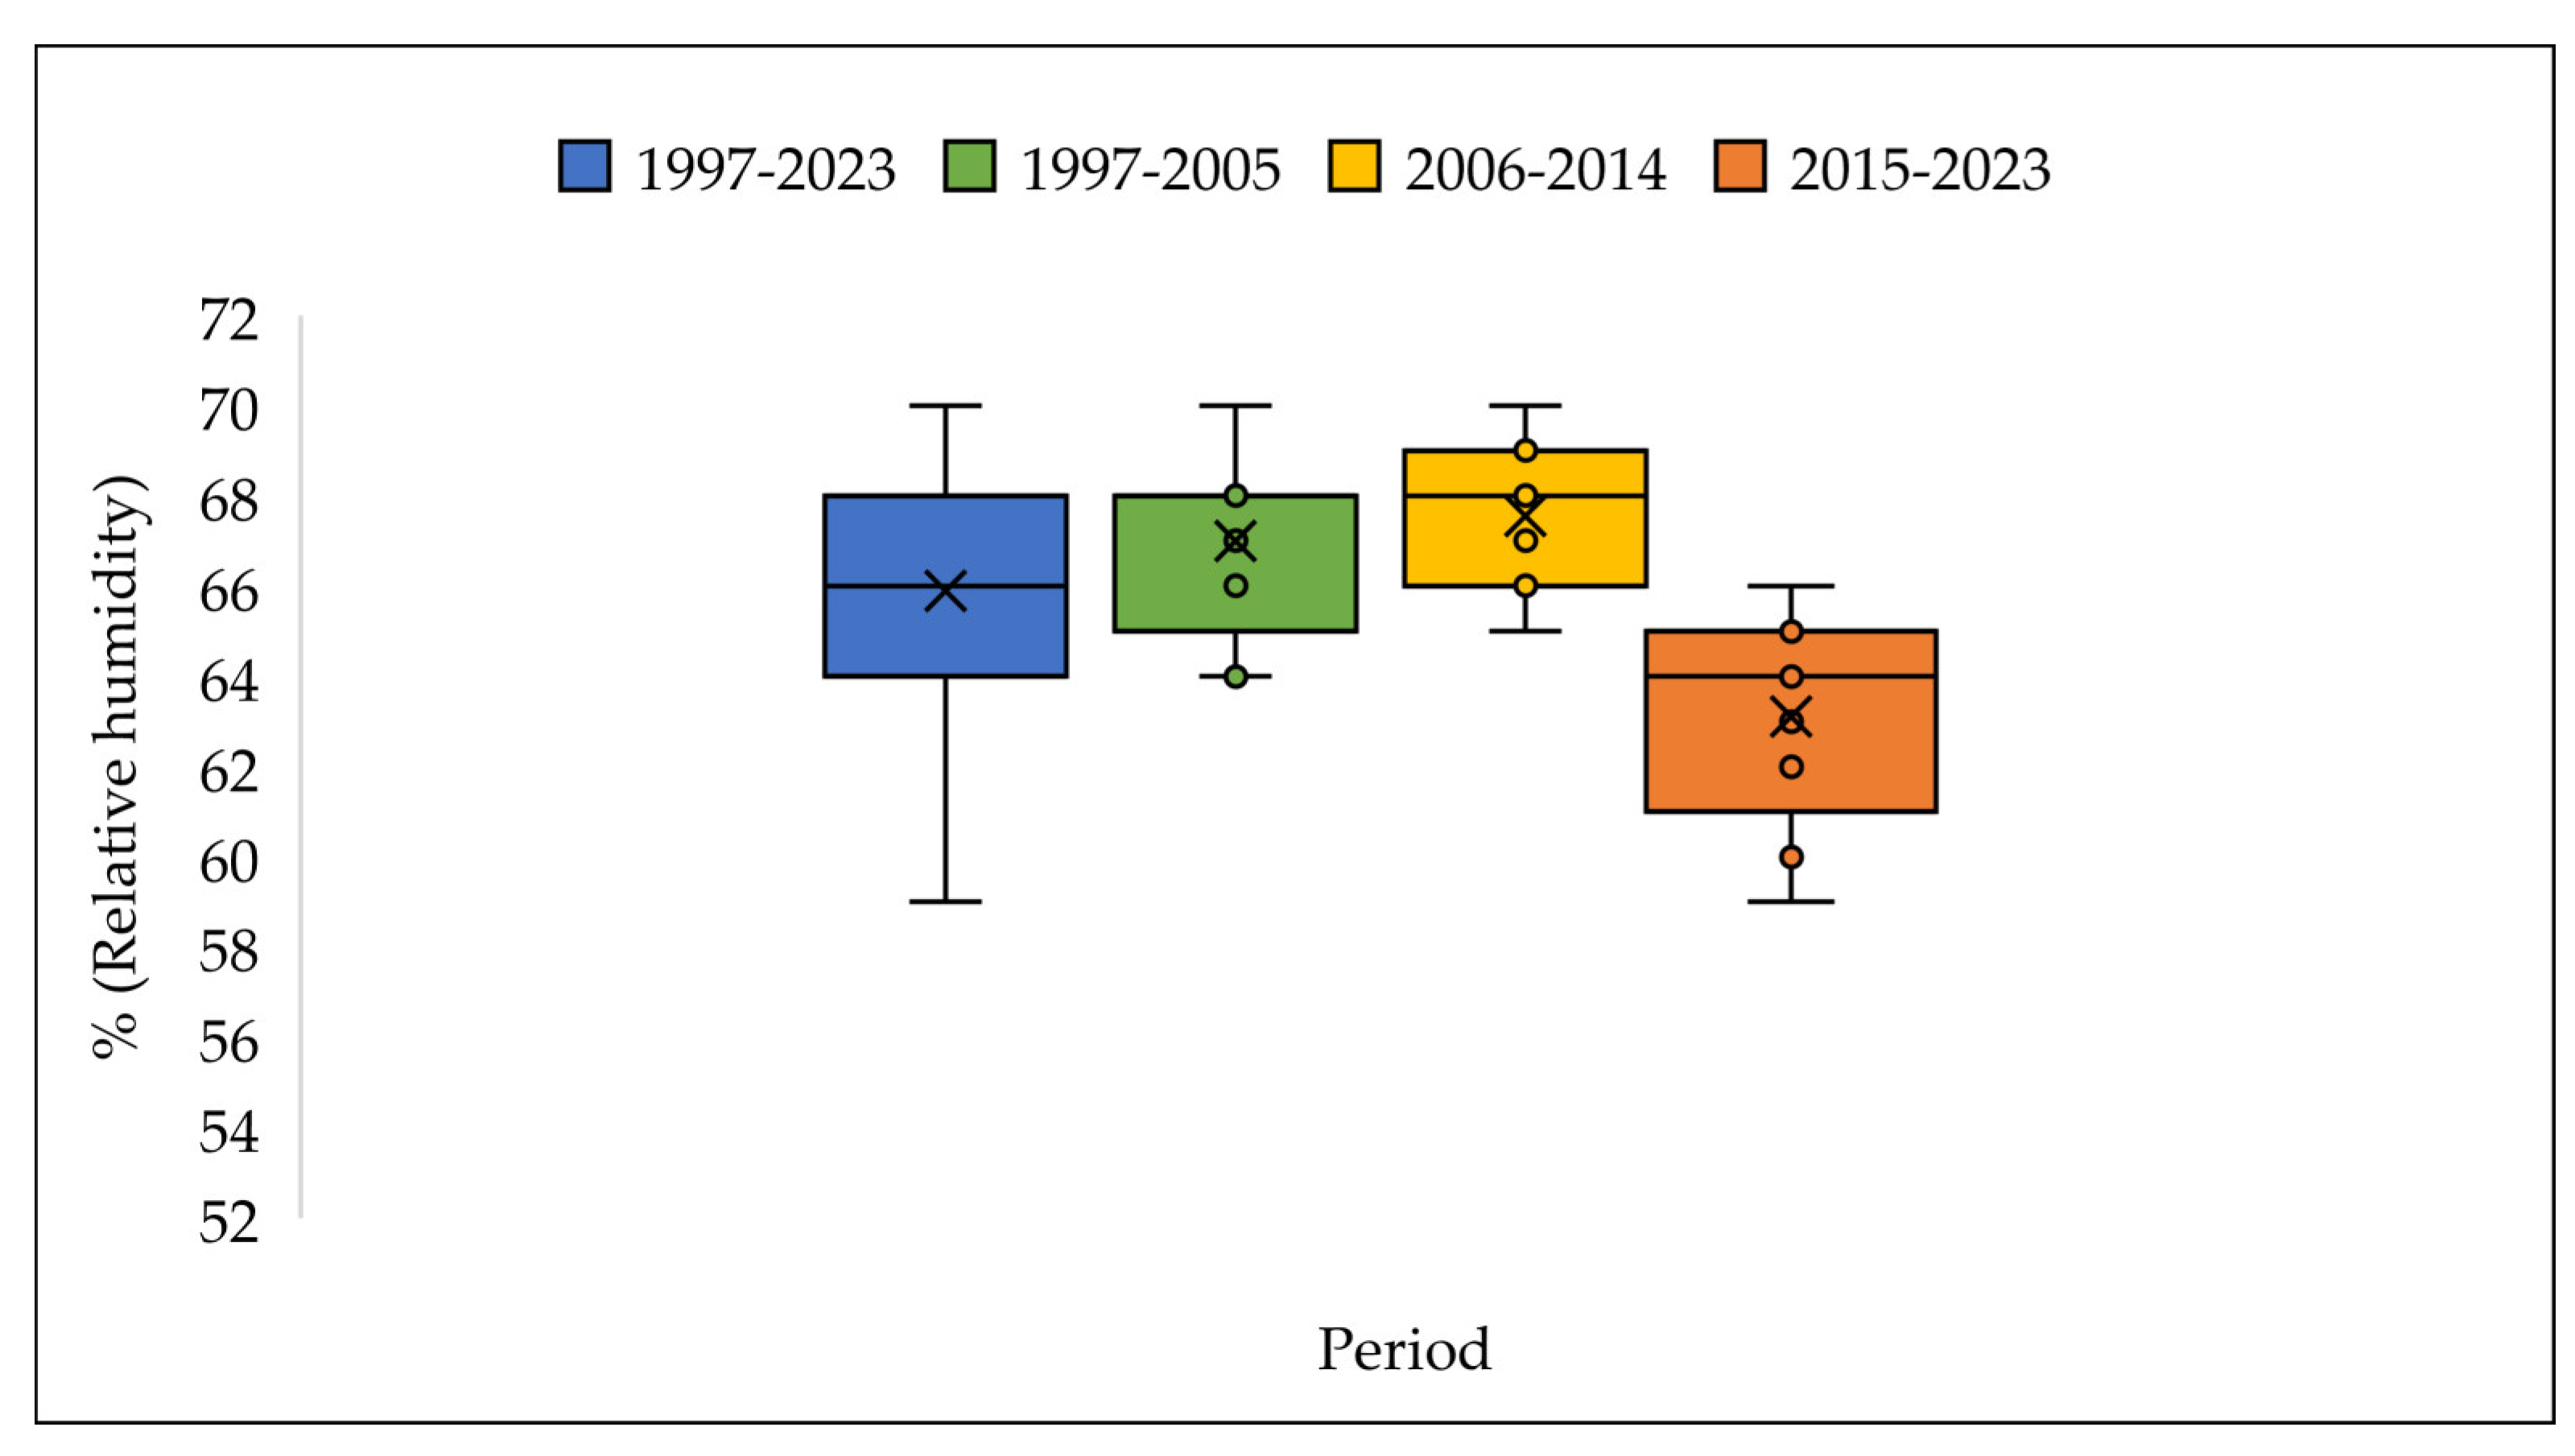
3.3. The Meteorologic Parameters over the Three Periods 1997-2005; 2006-2014 and 2015-2023.
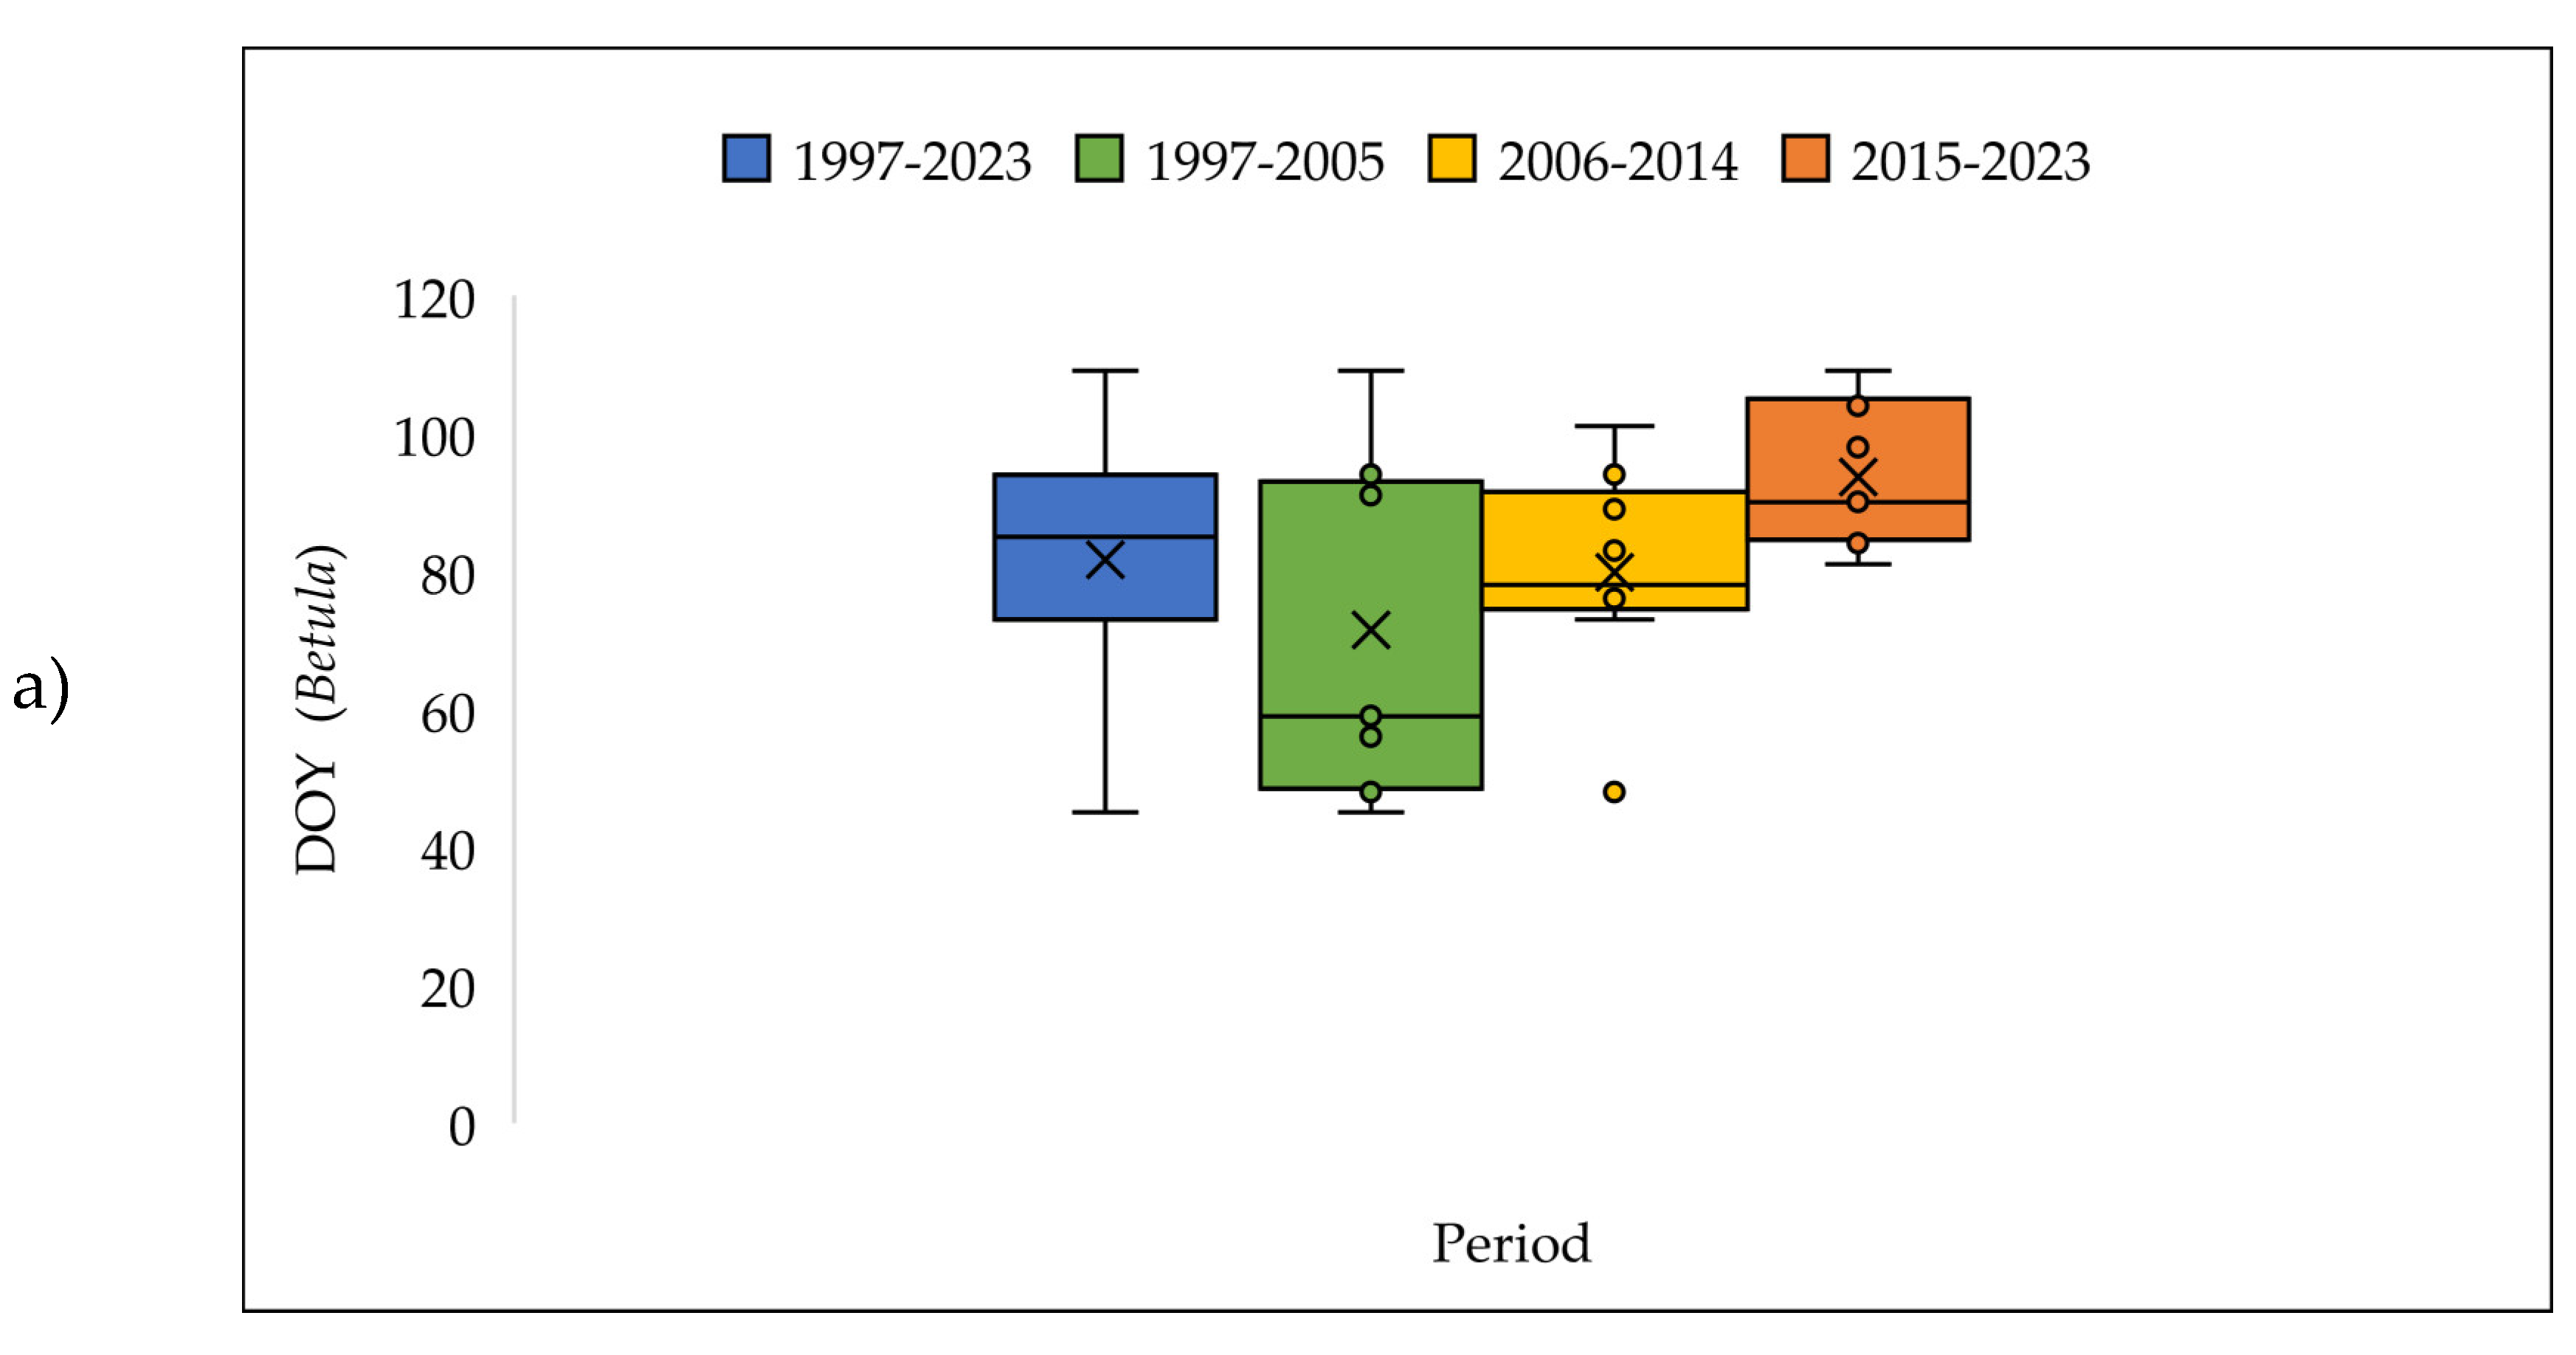
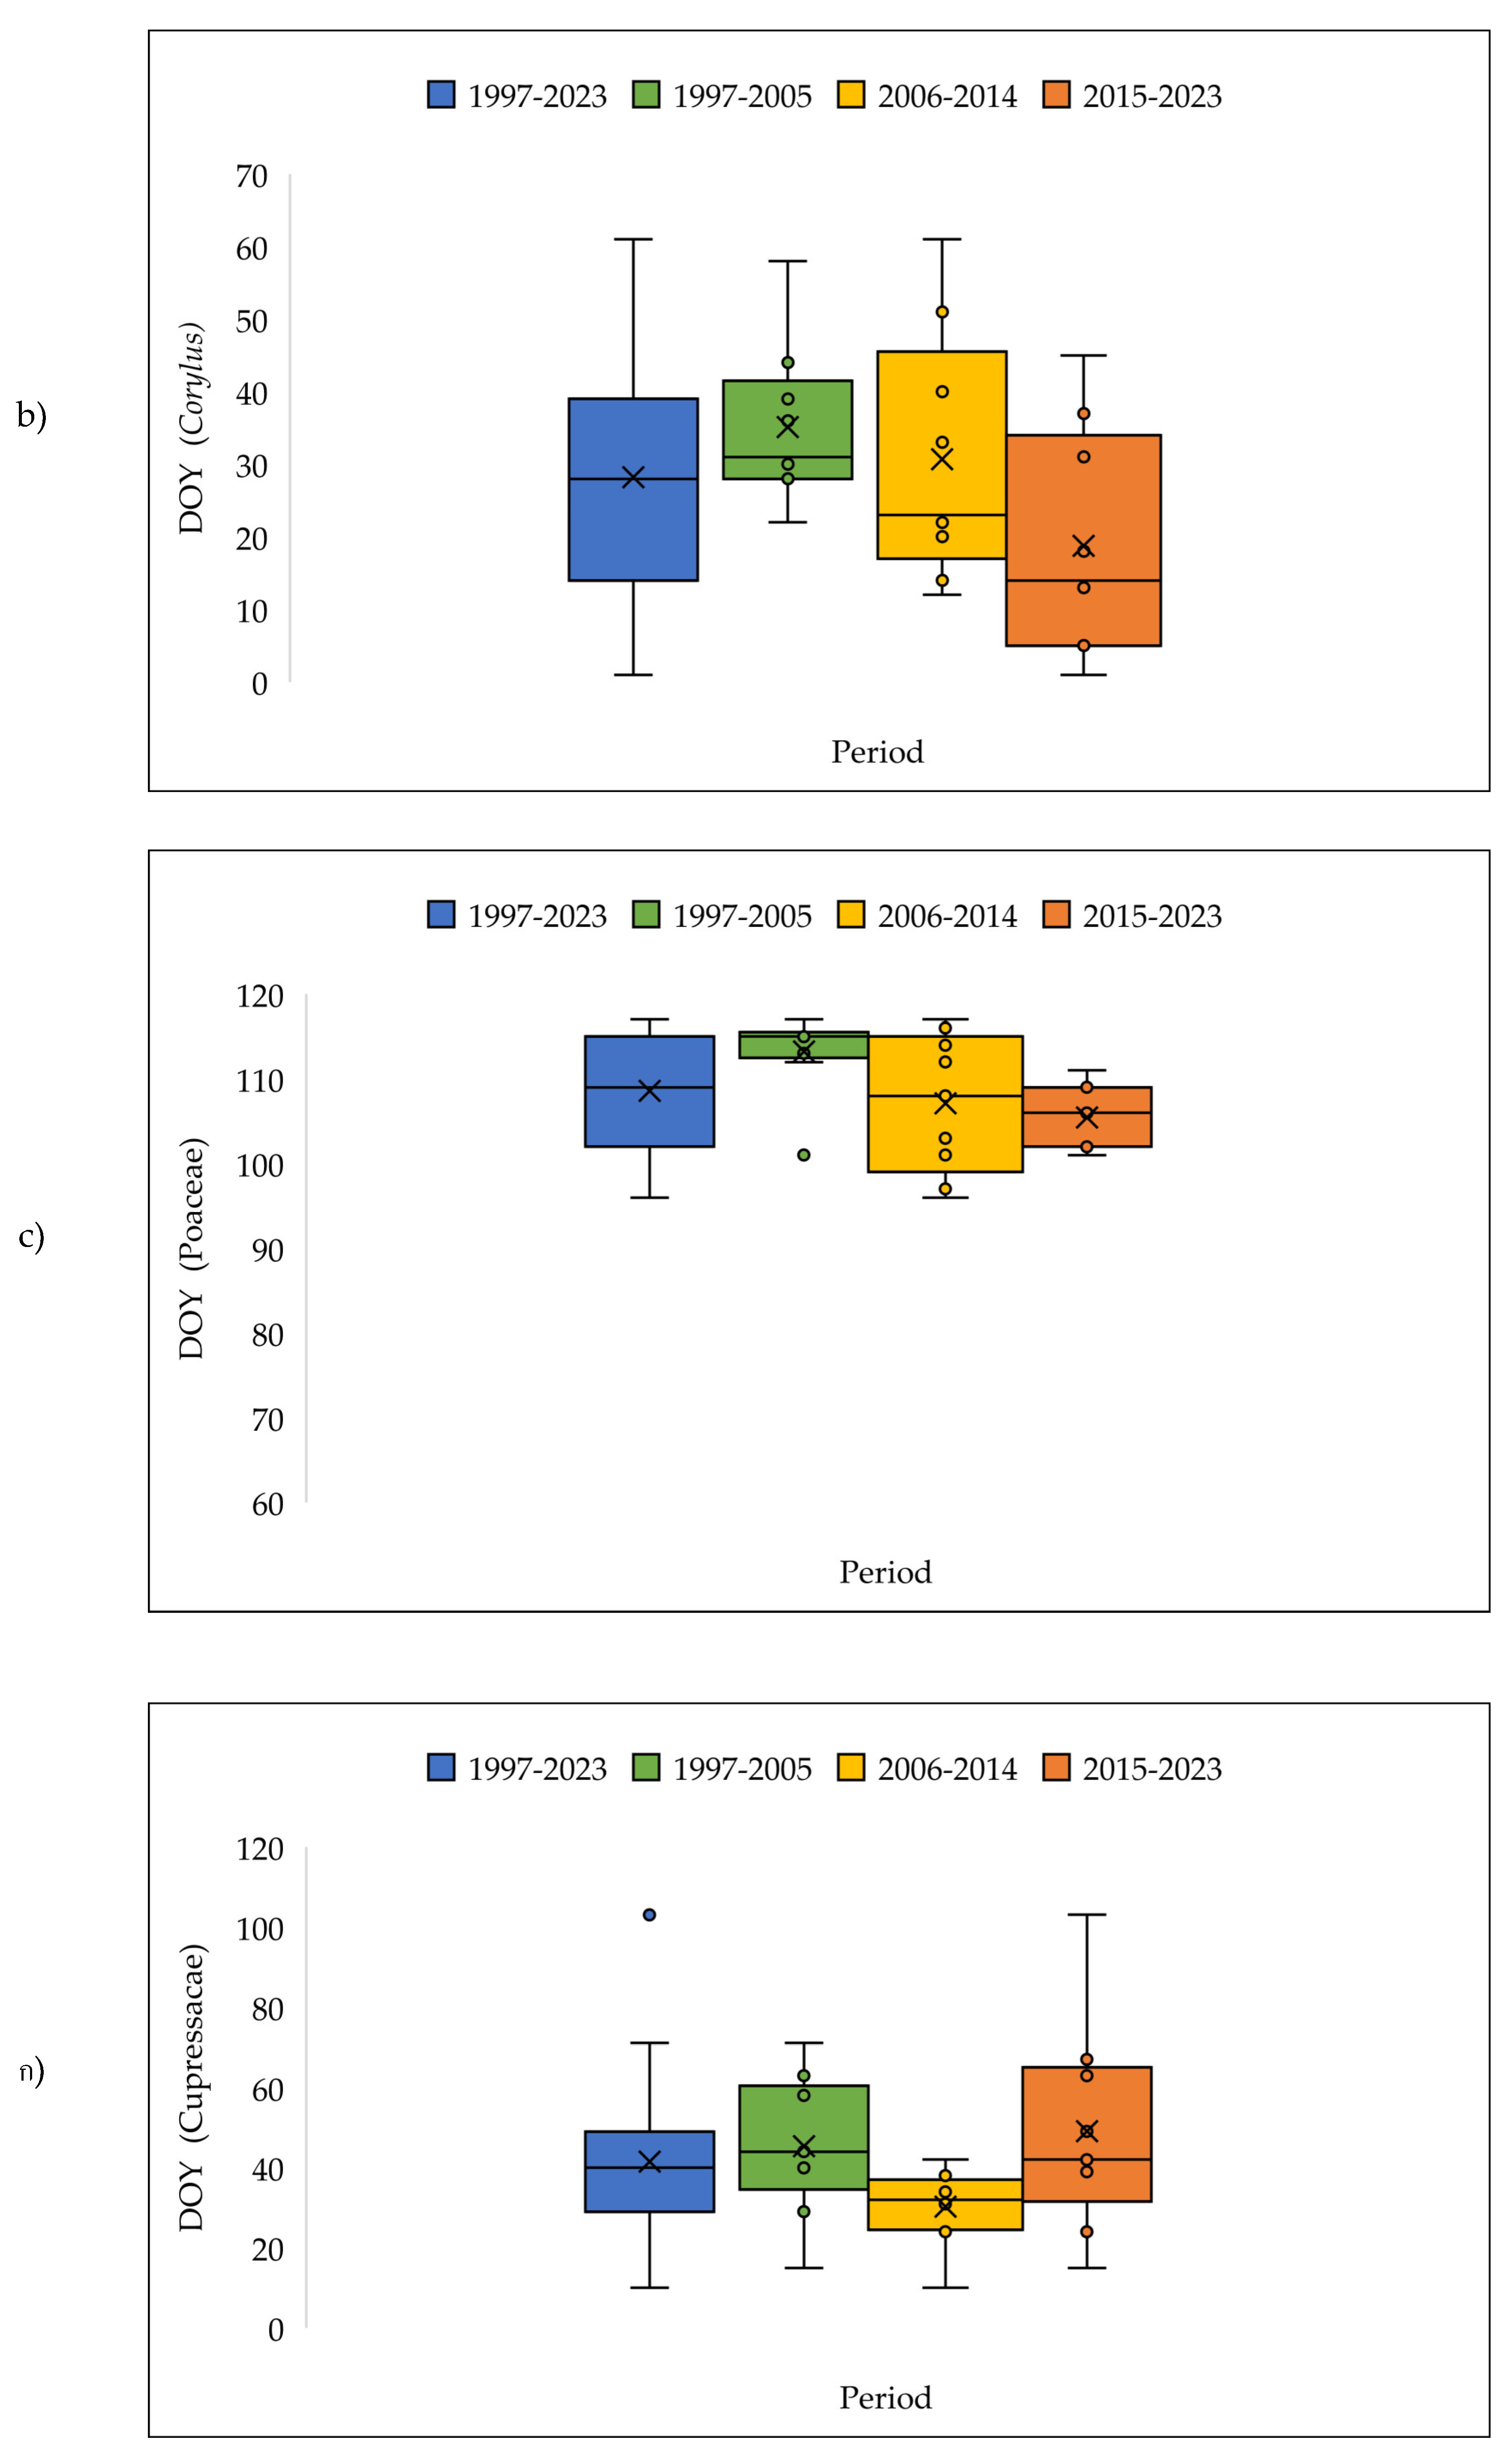
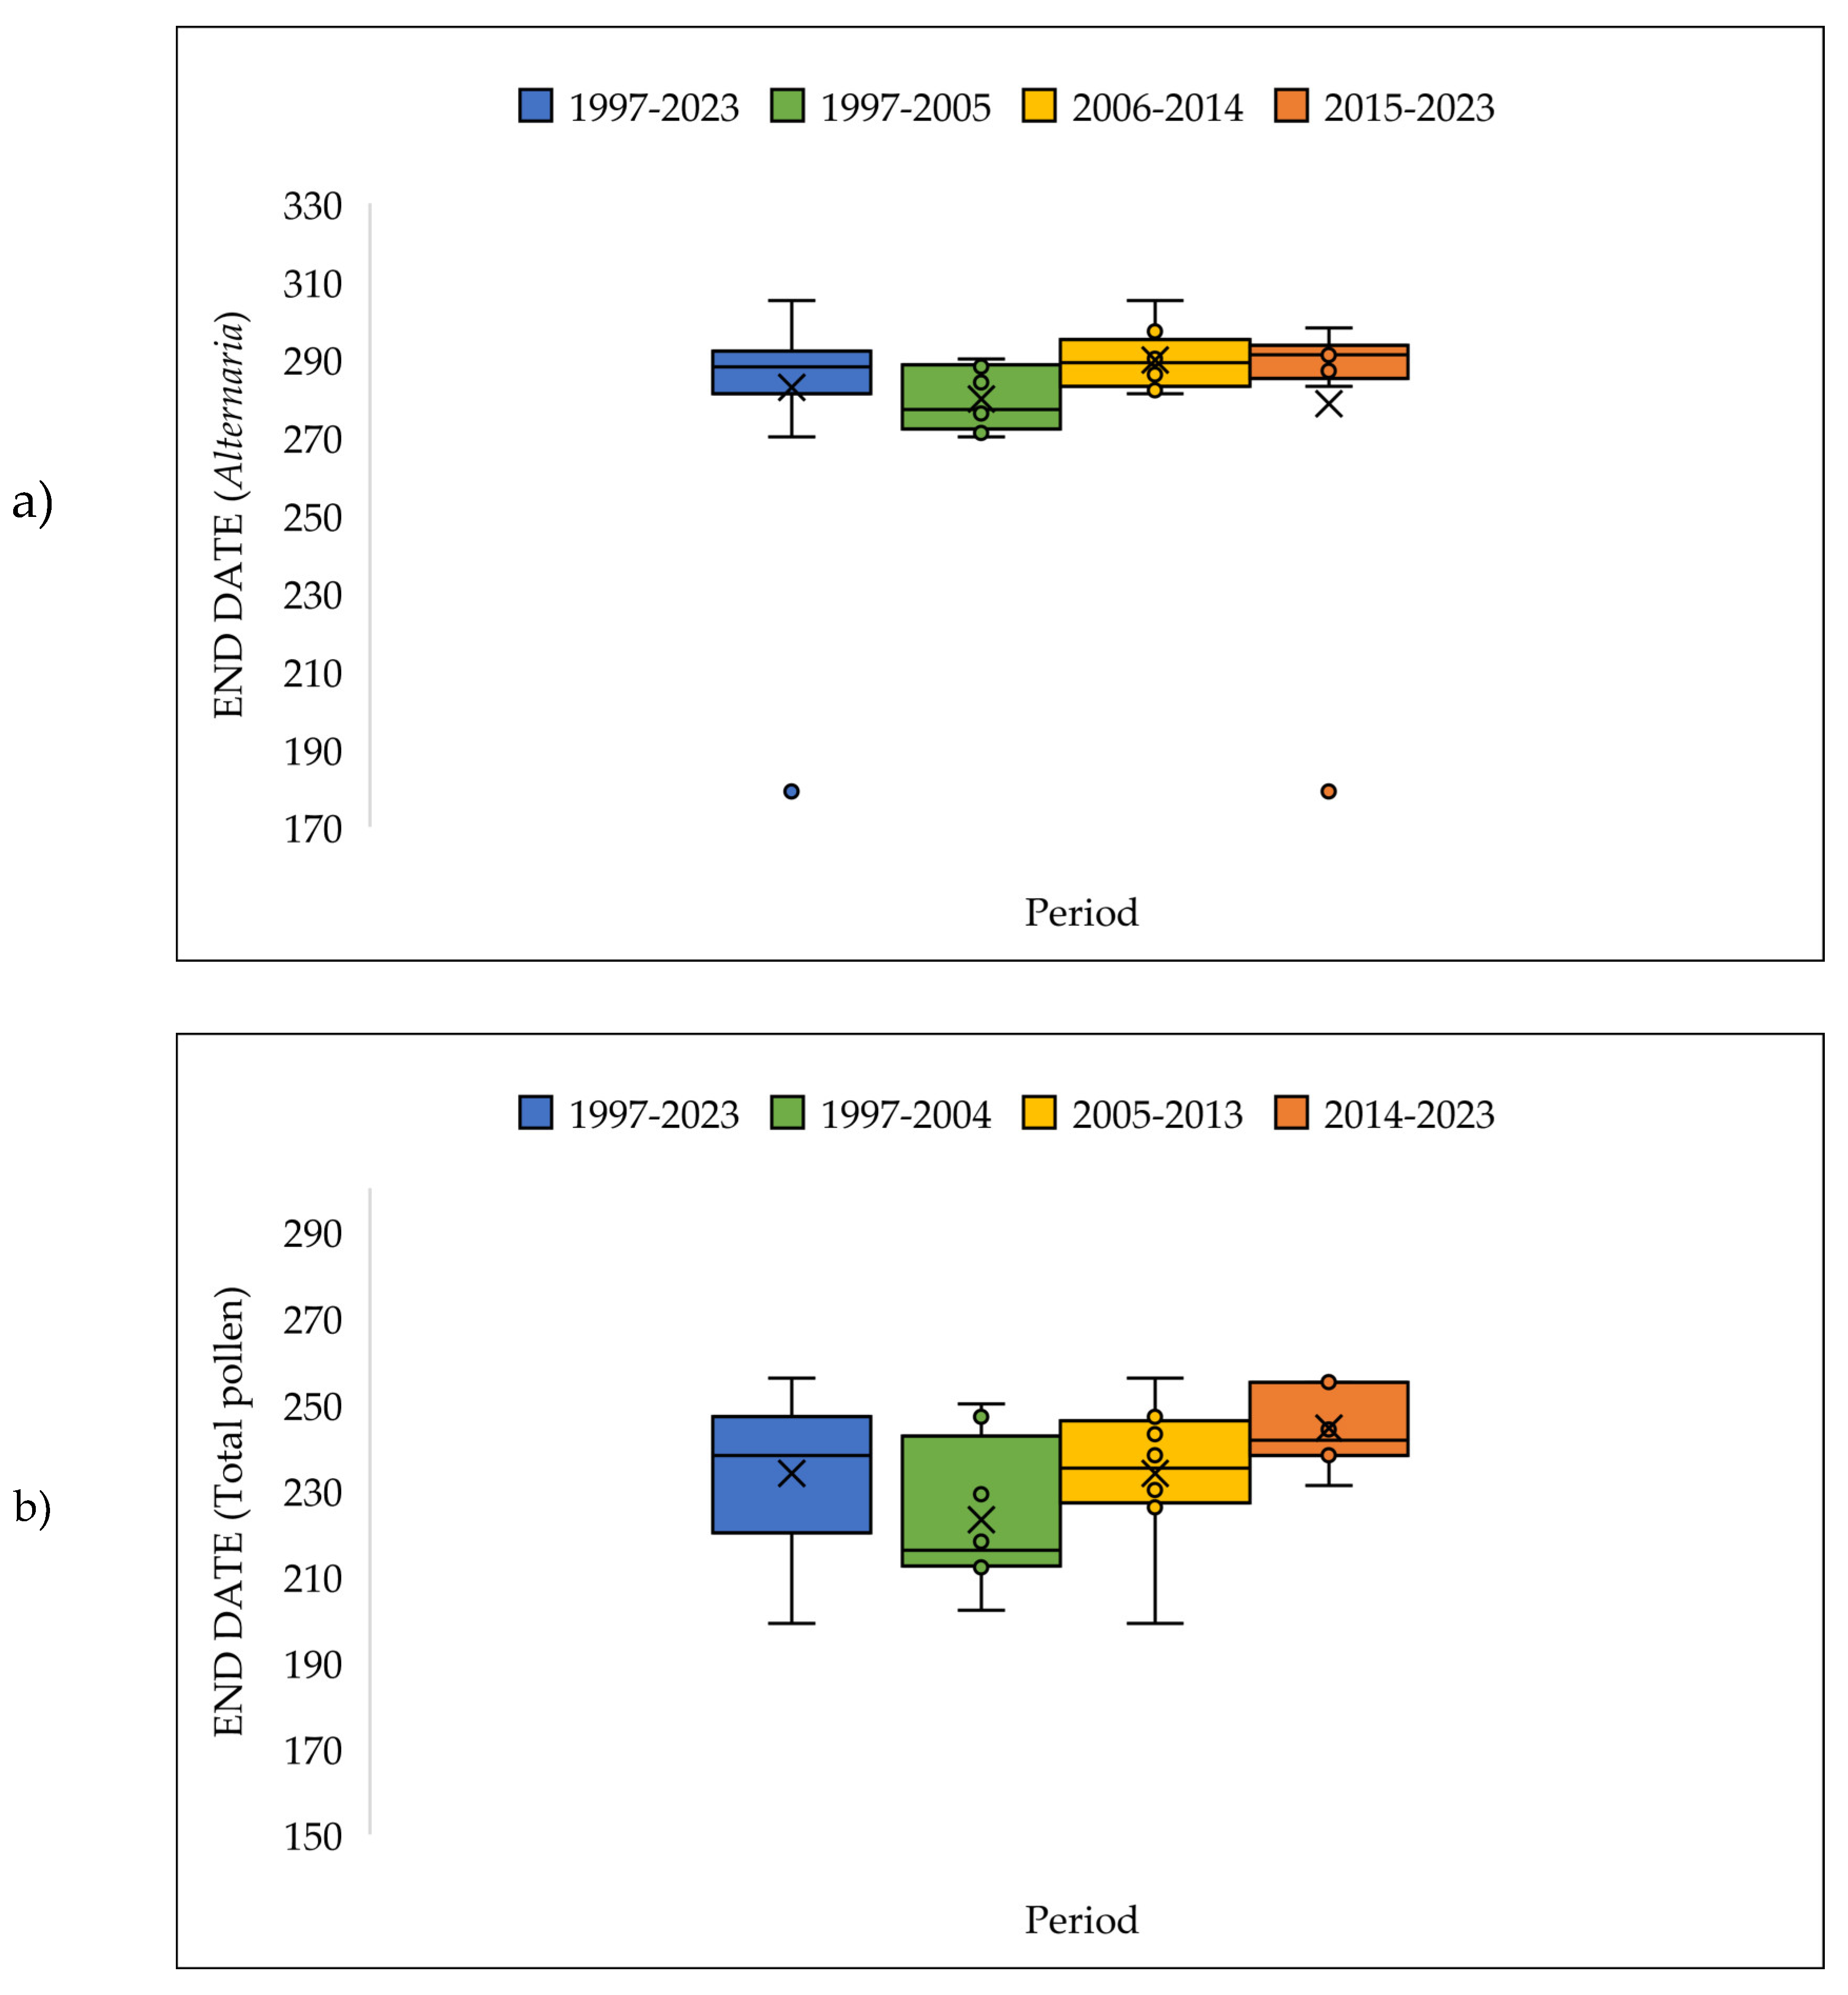
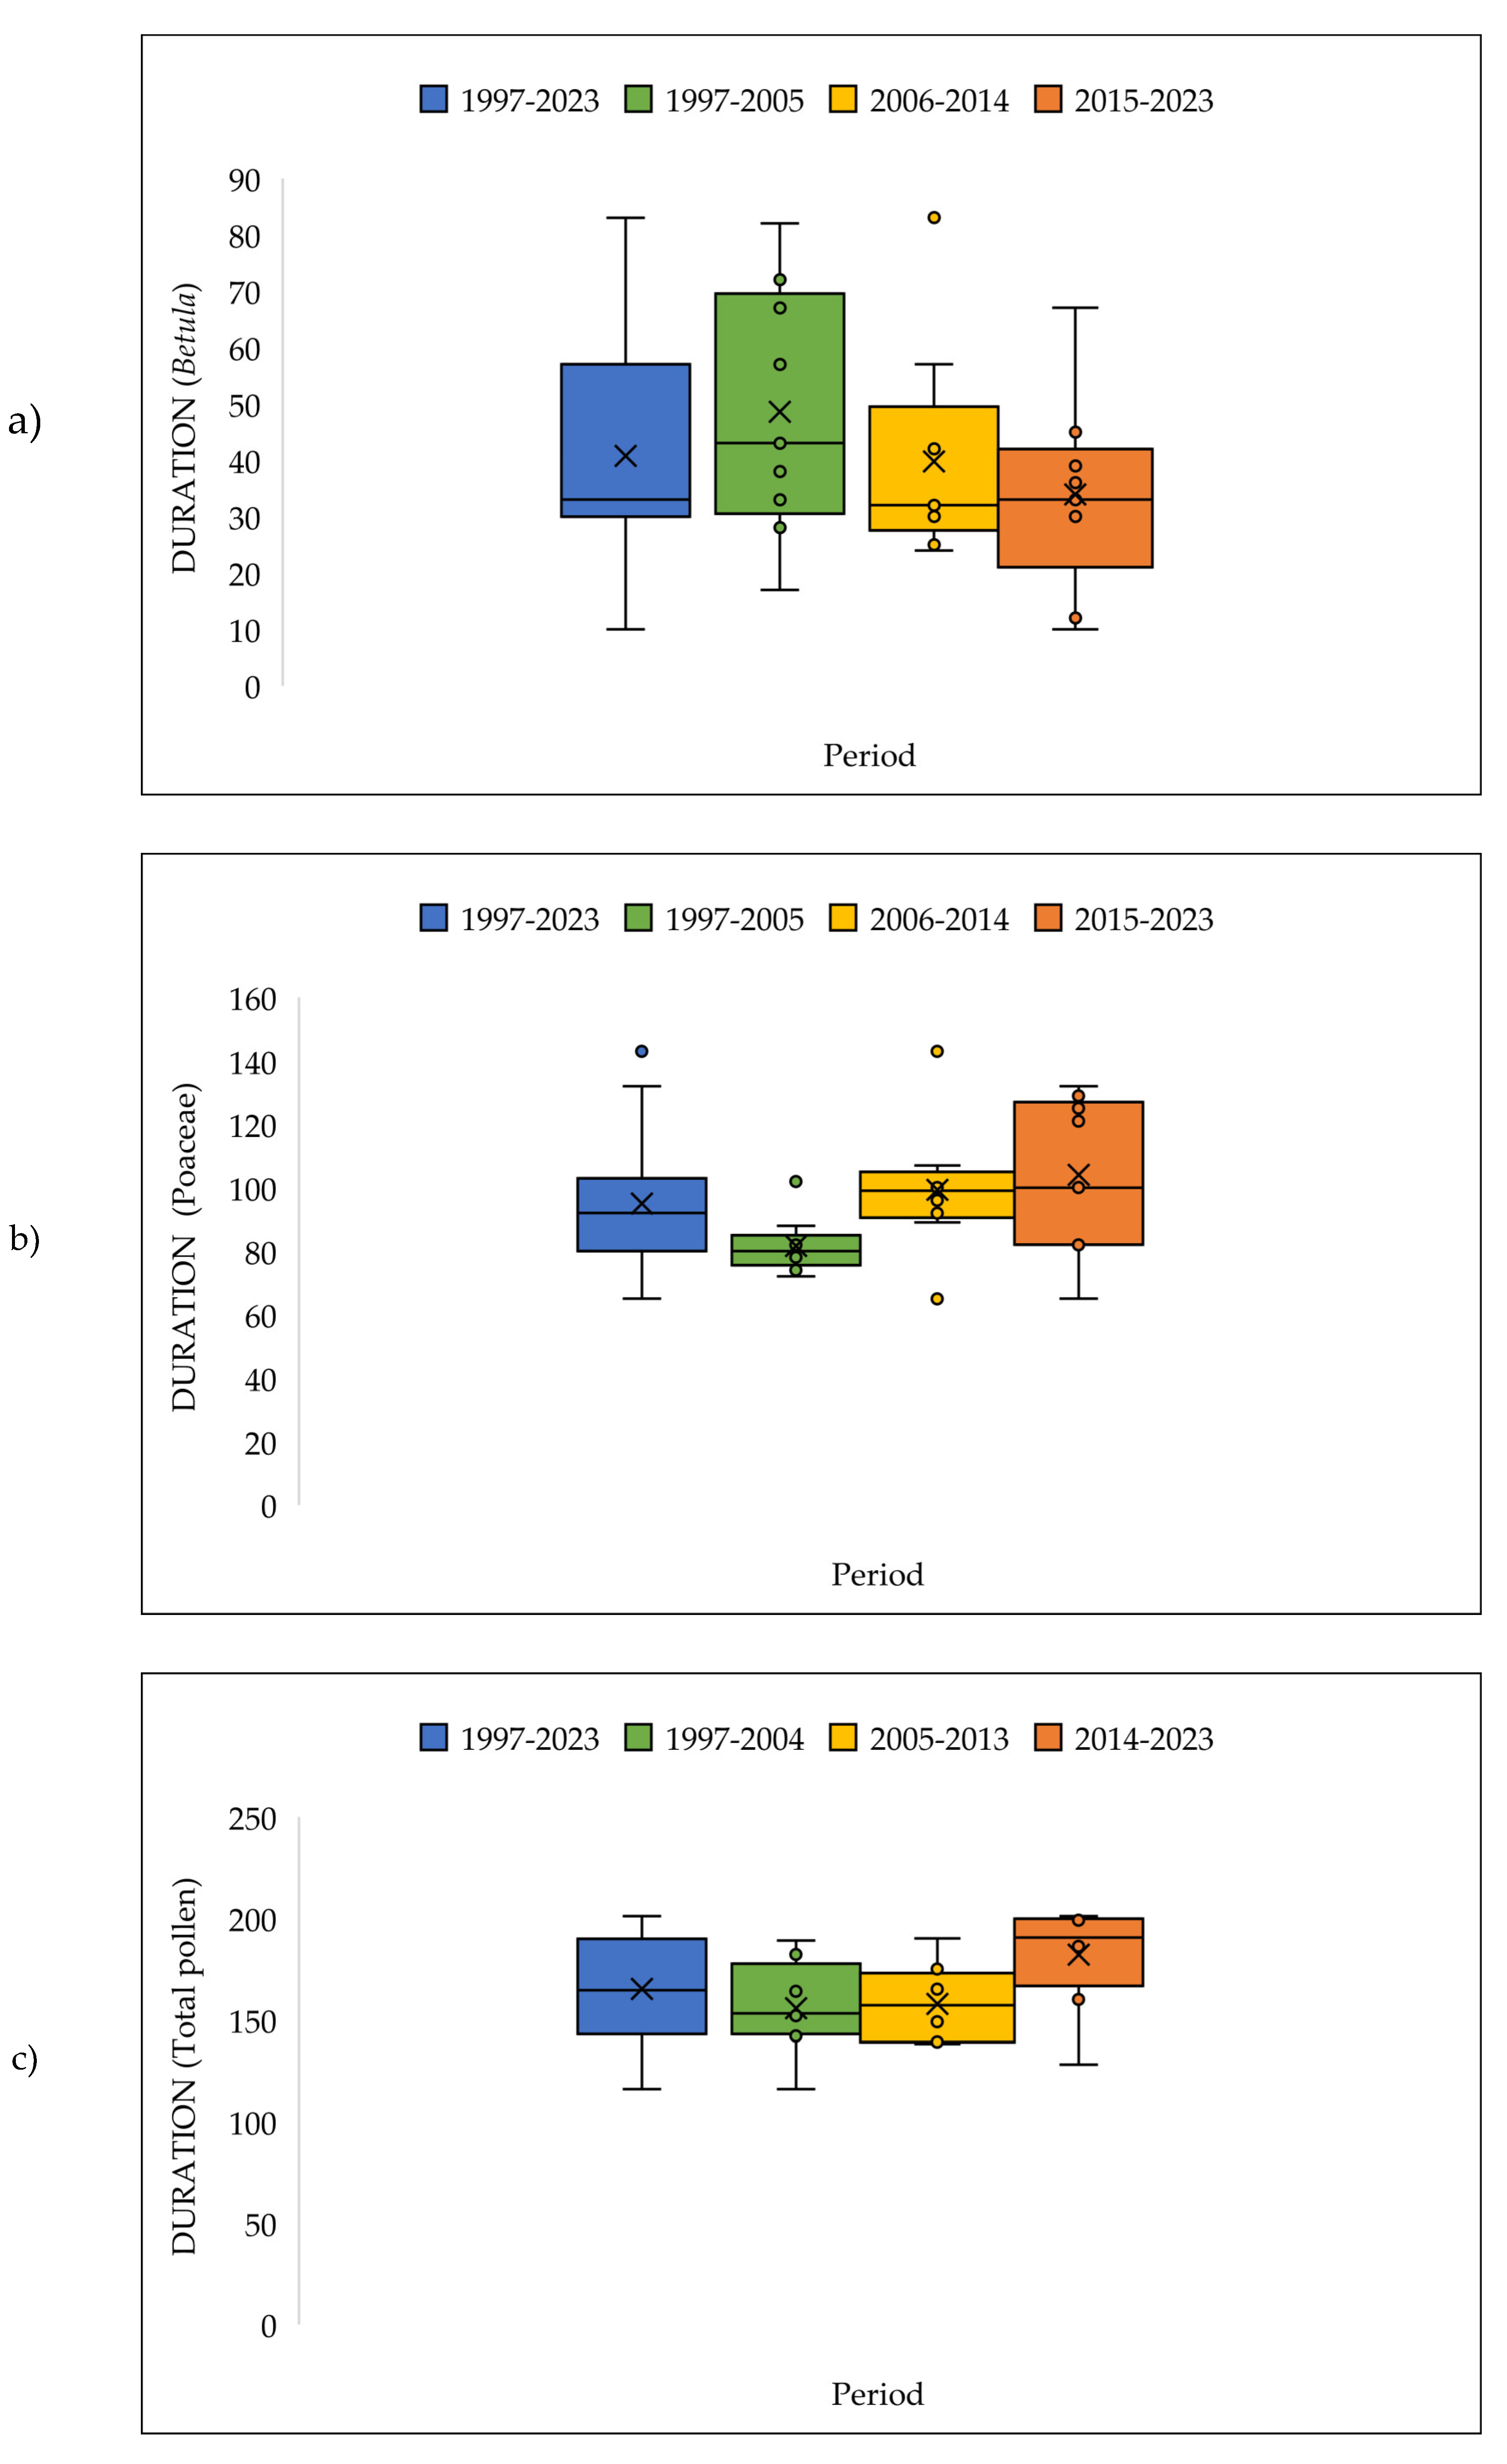
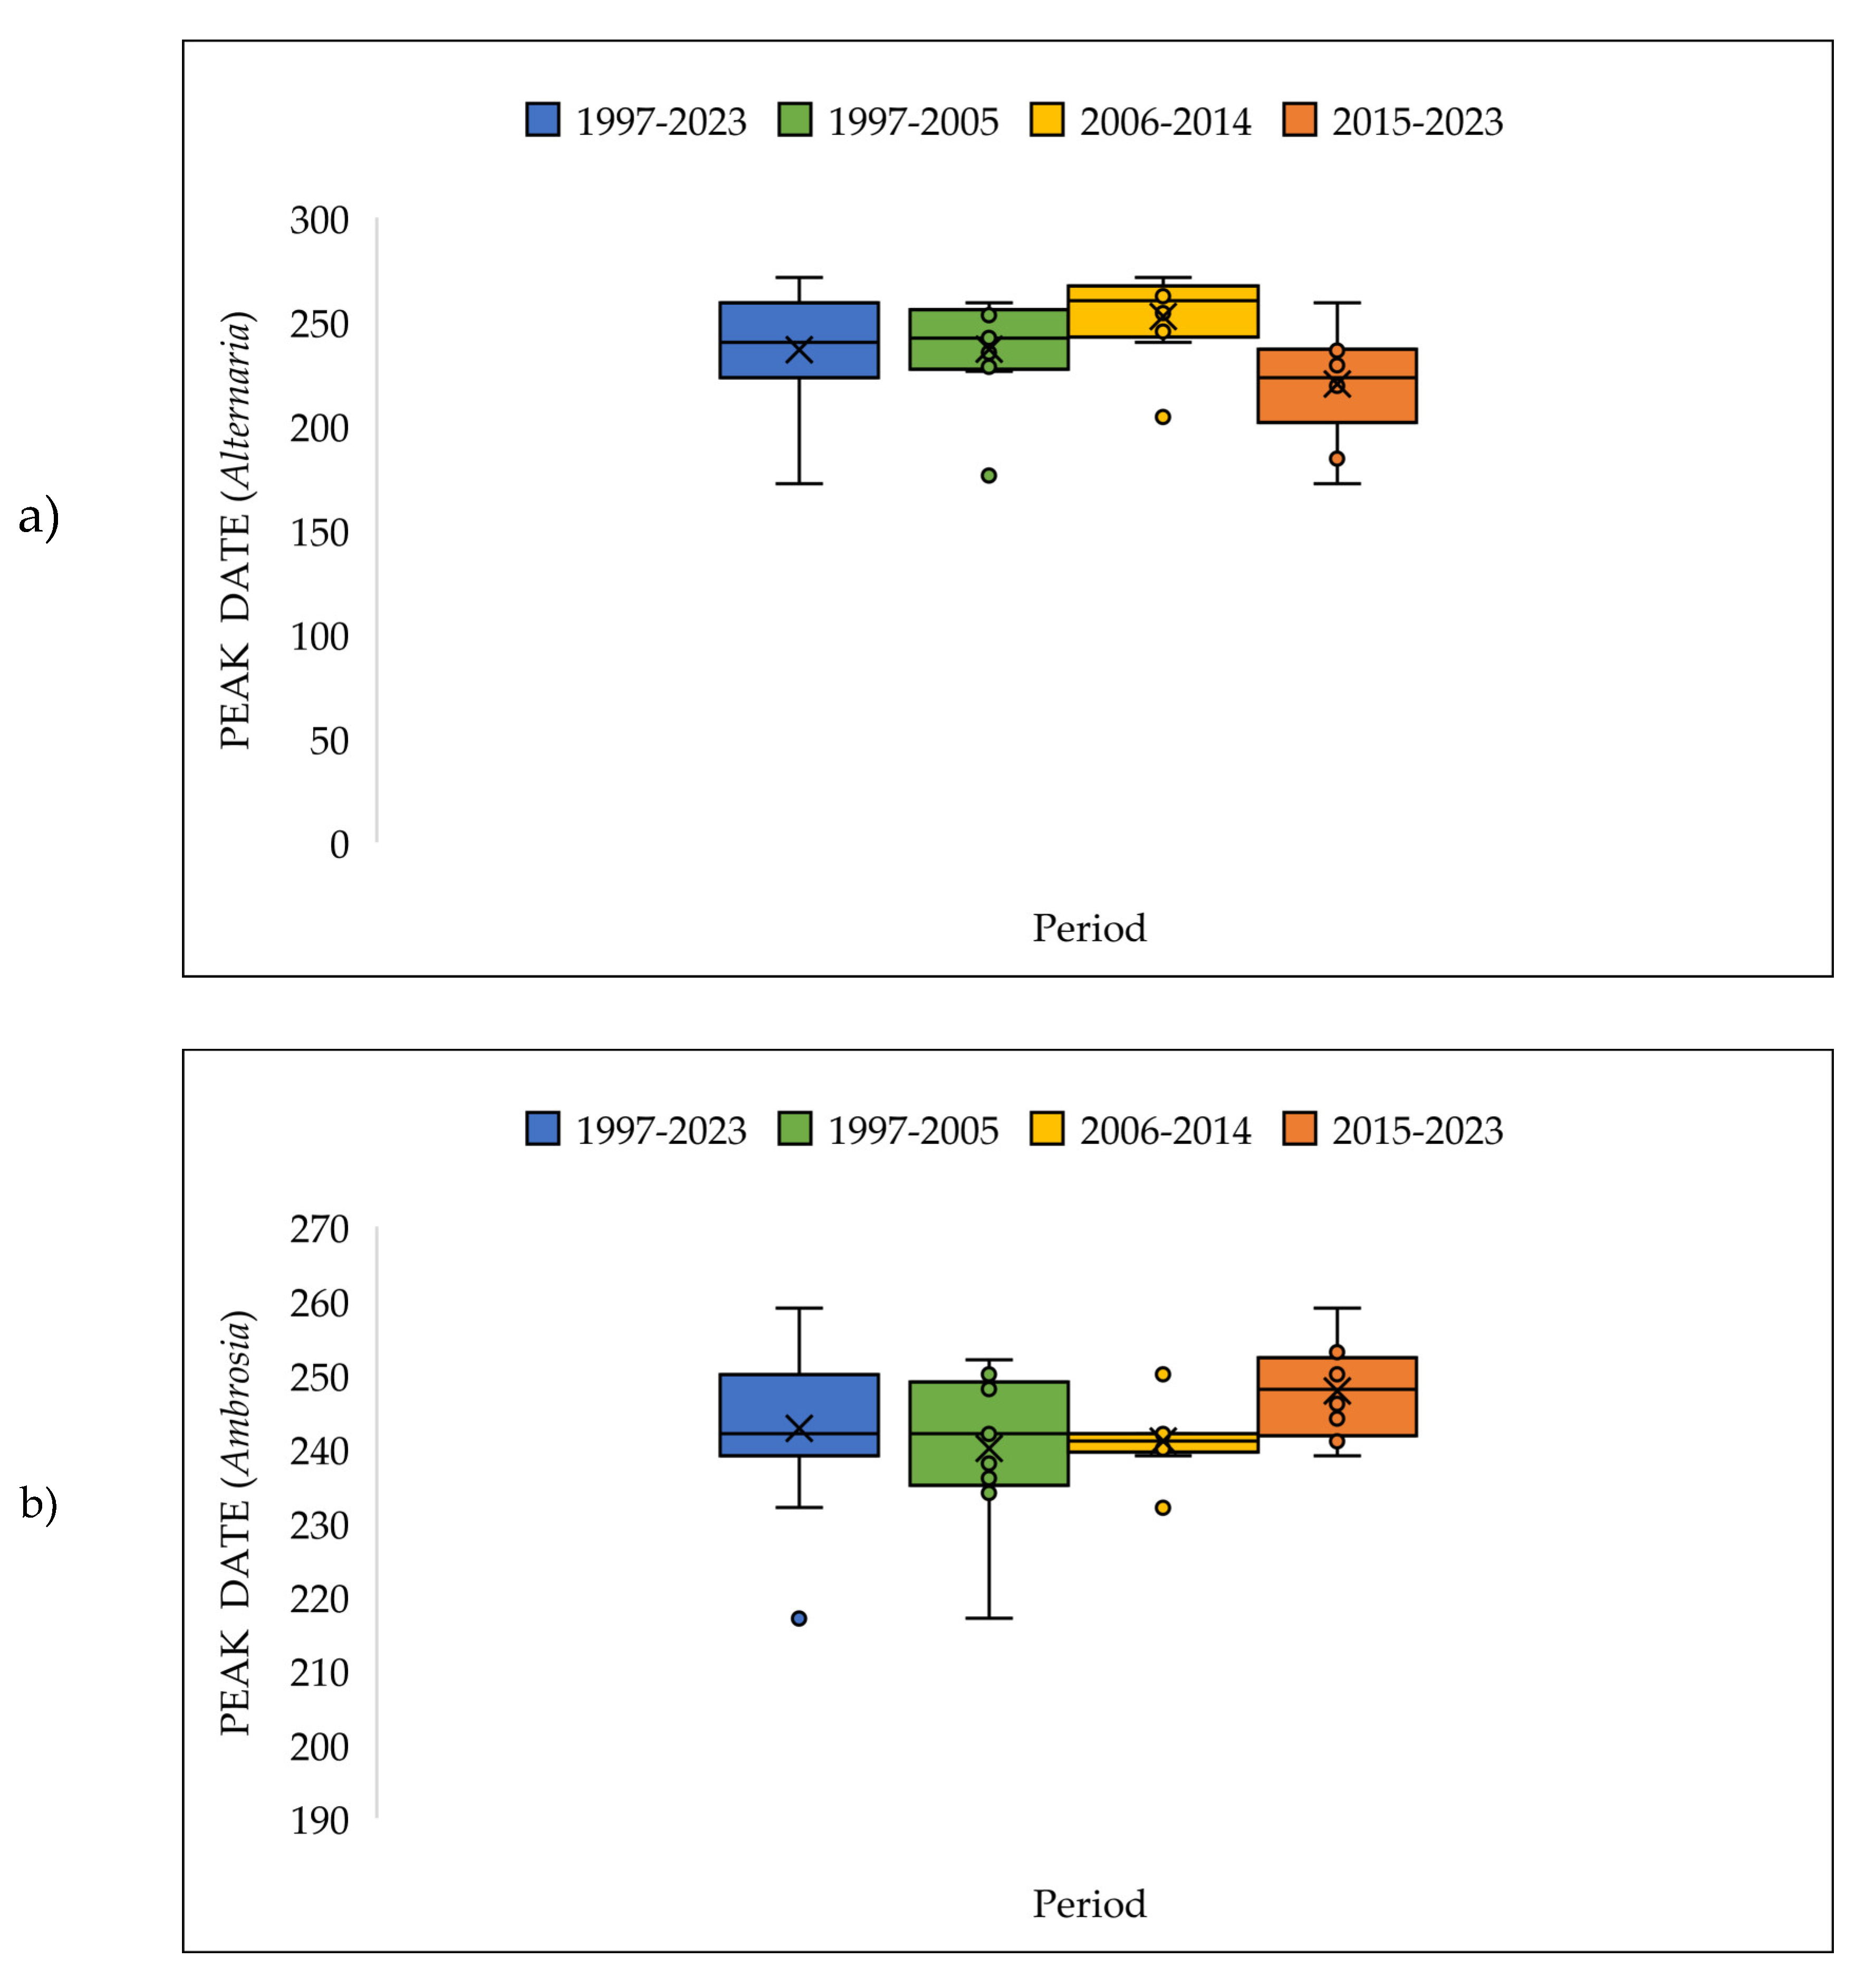
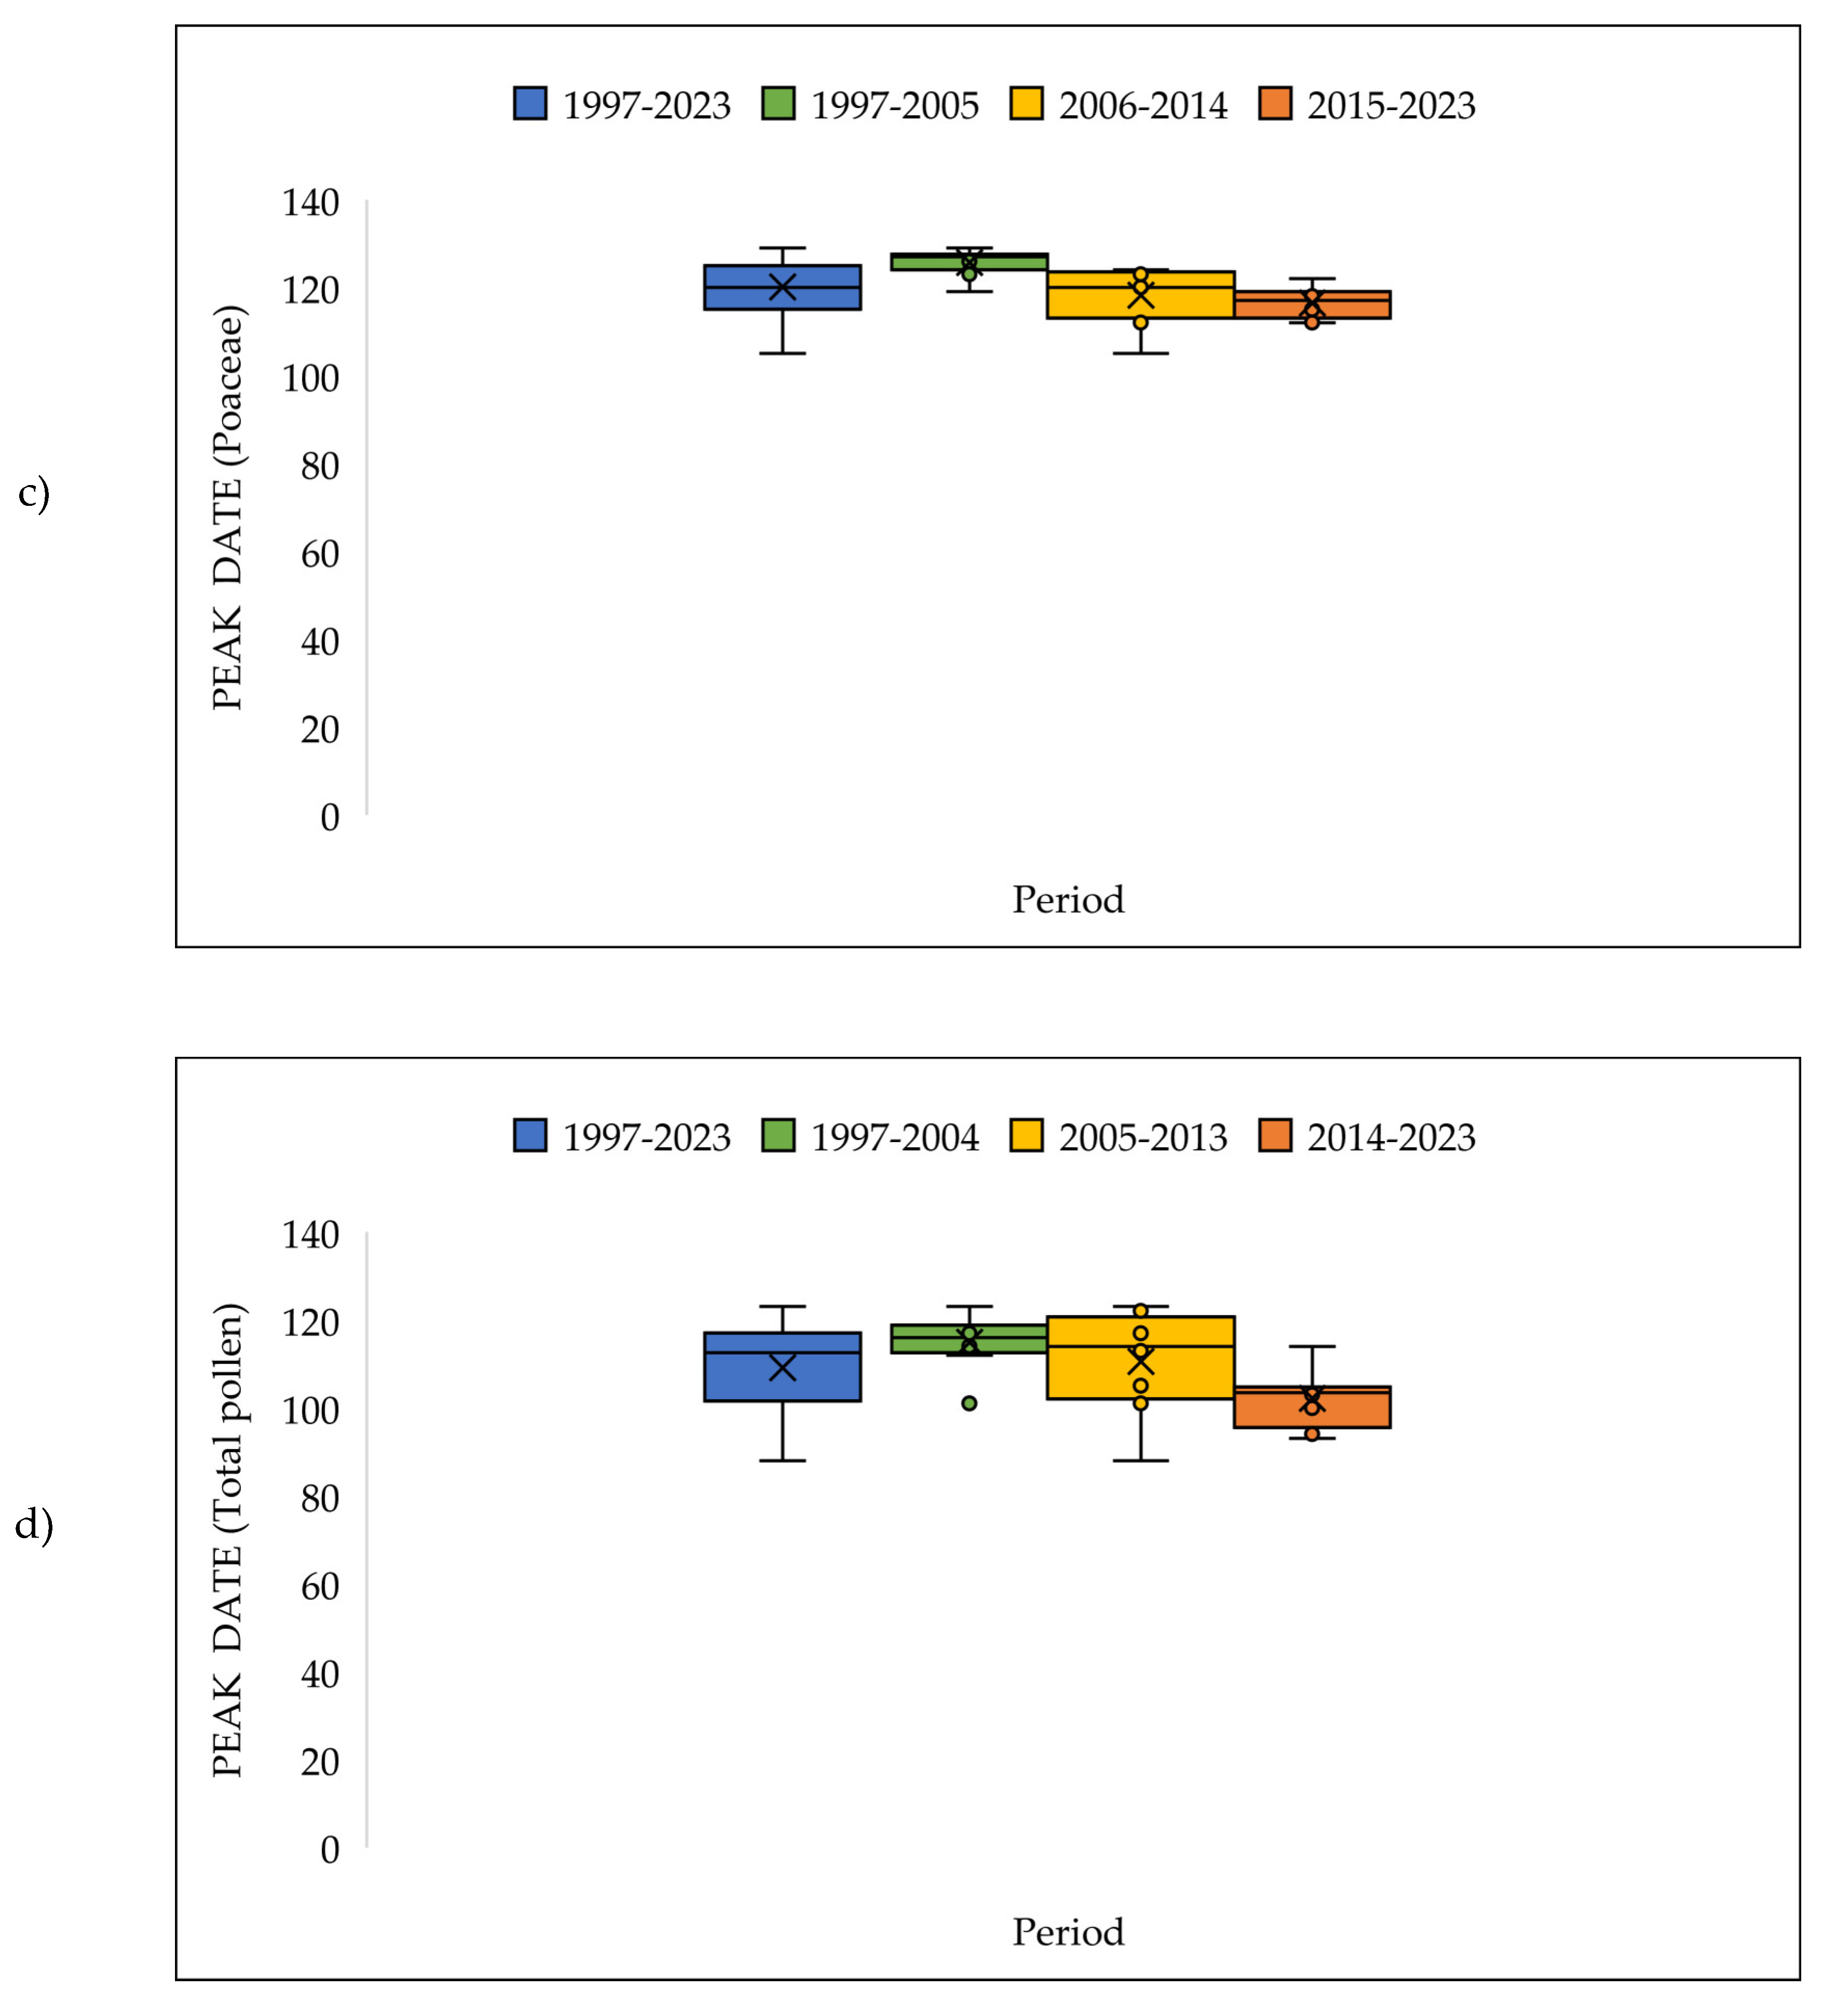
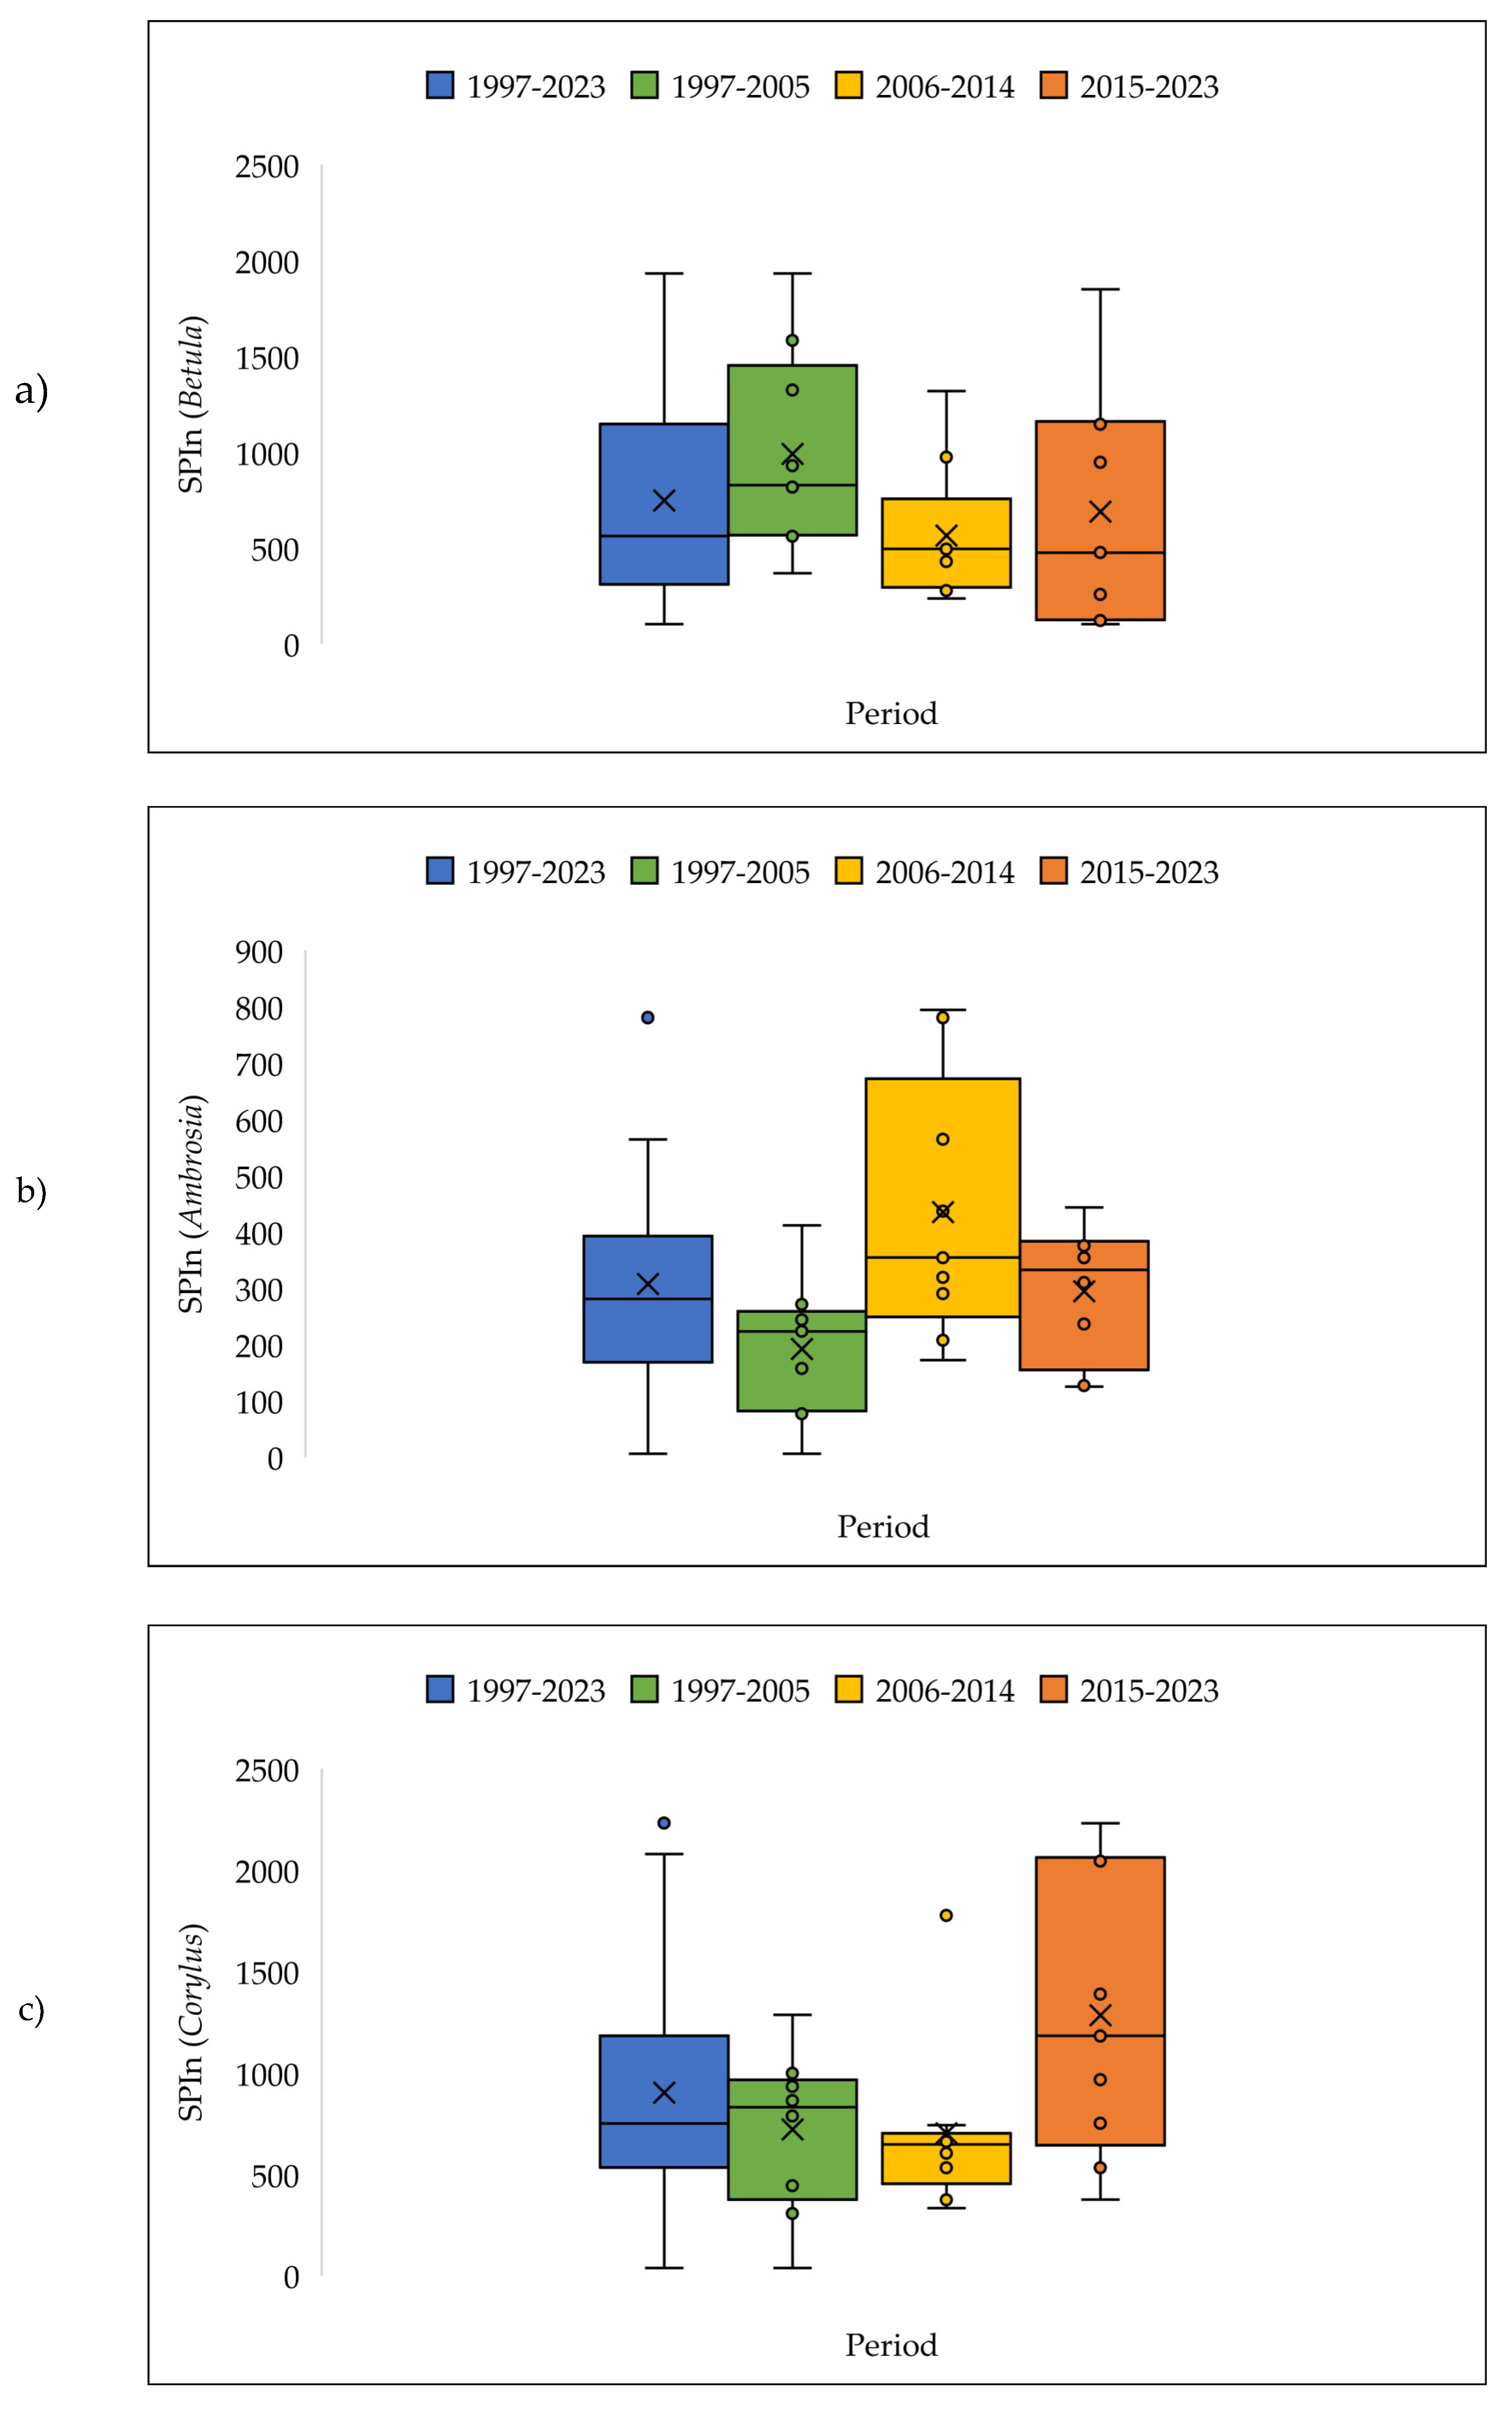
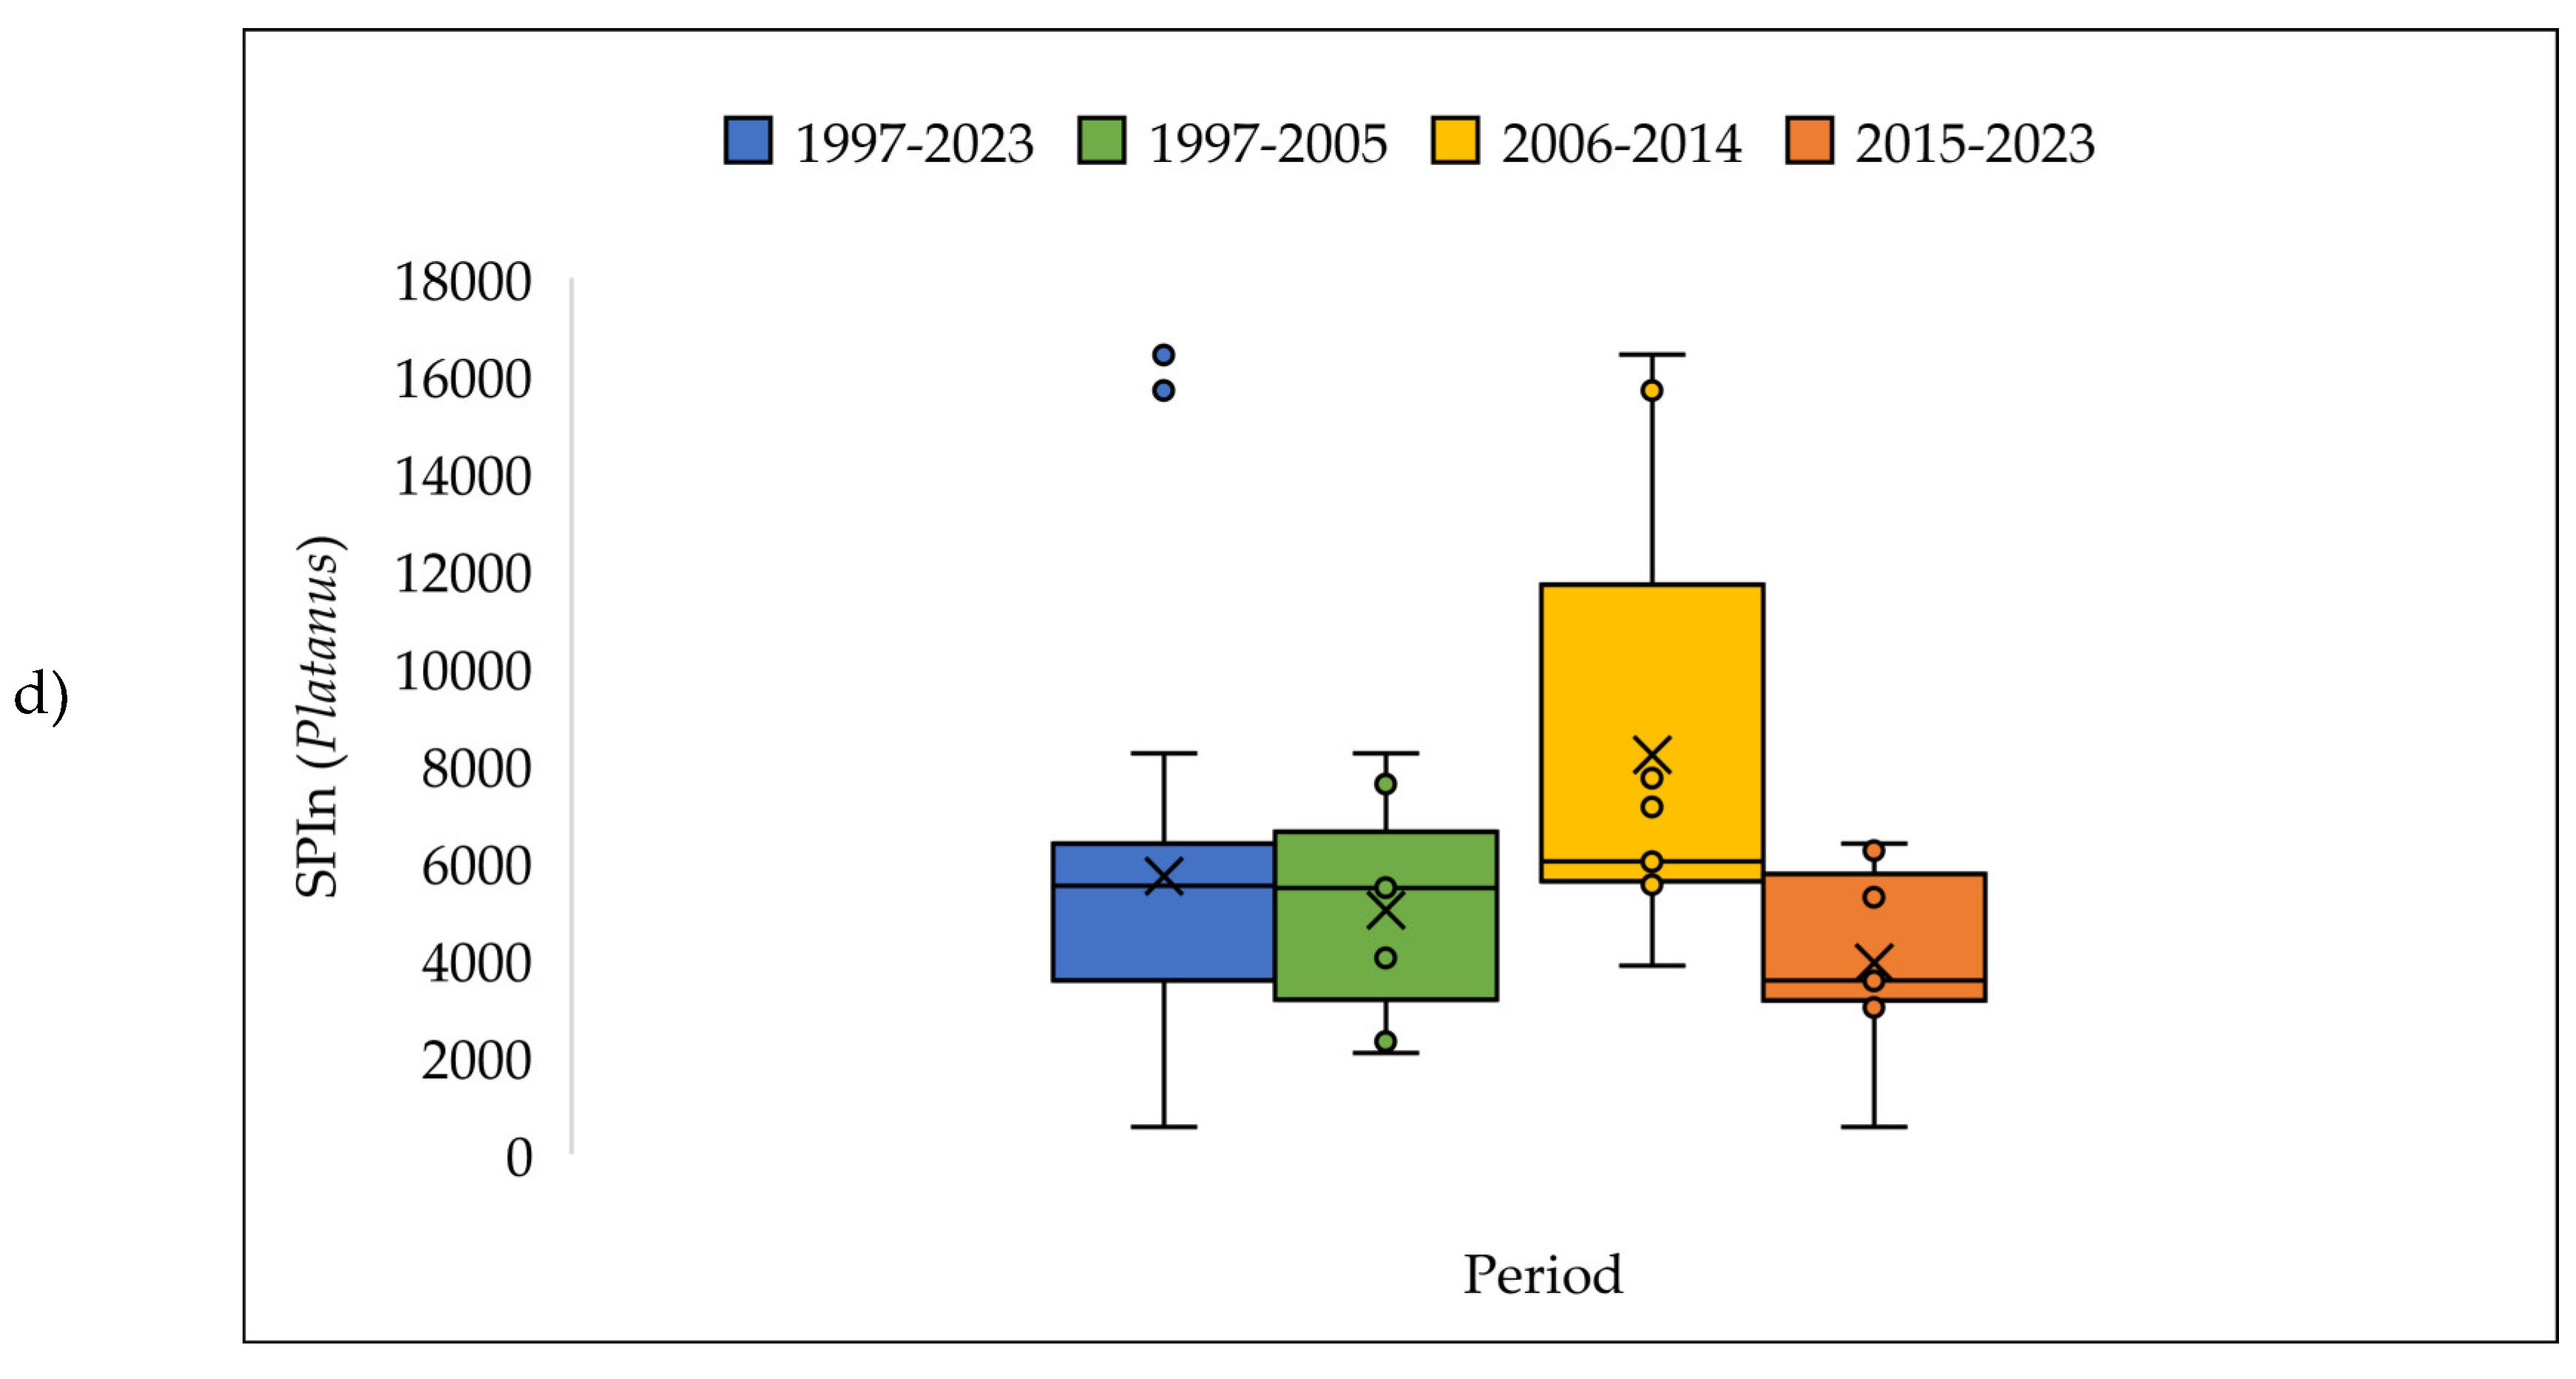
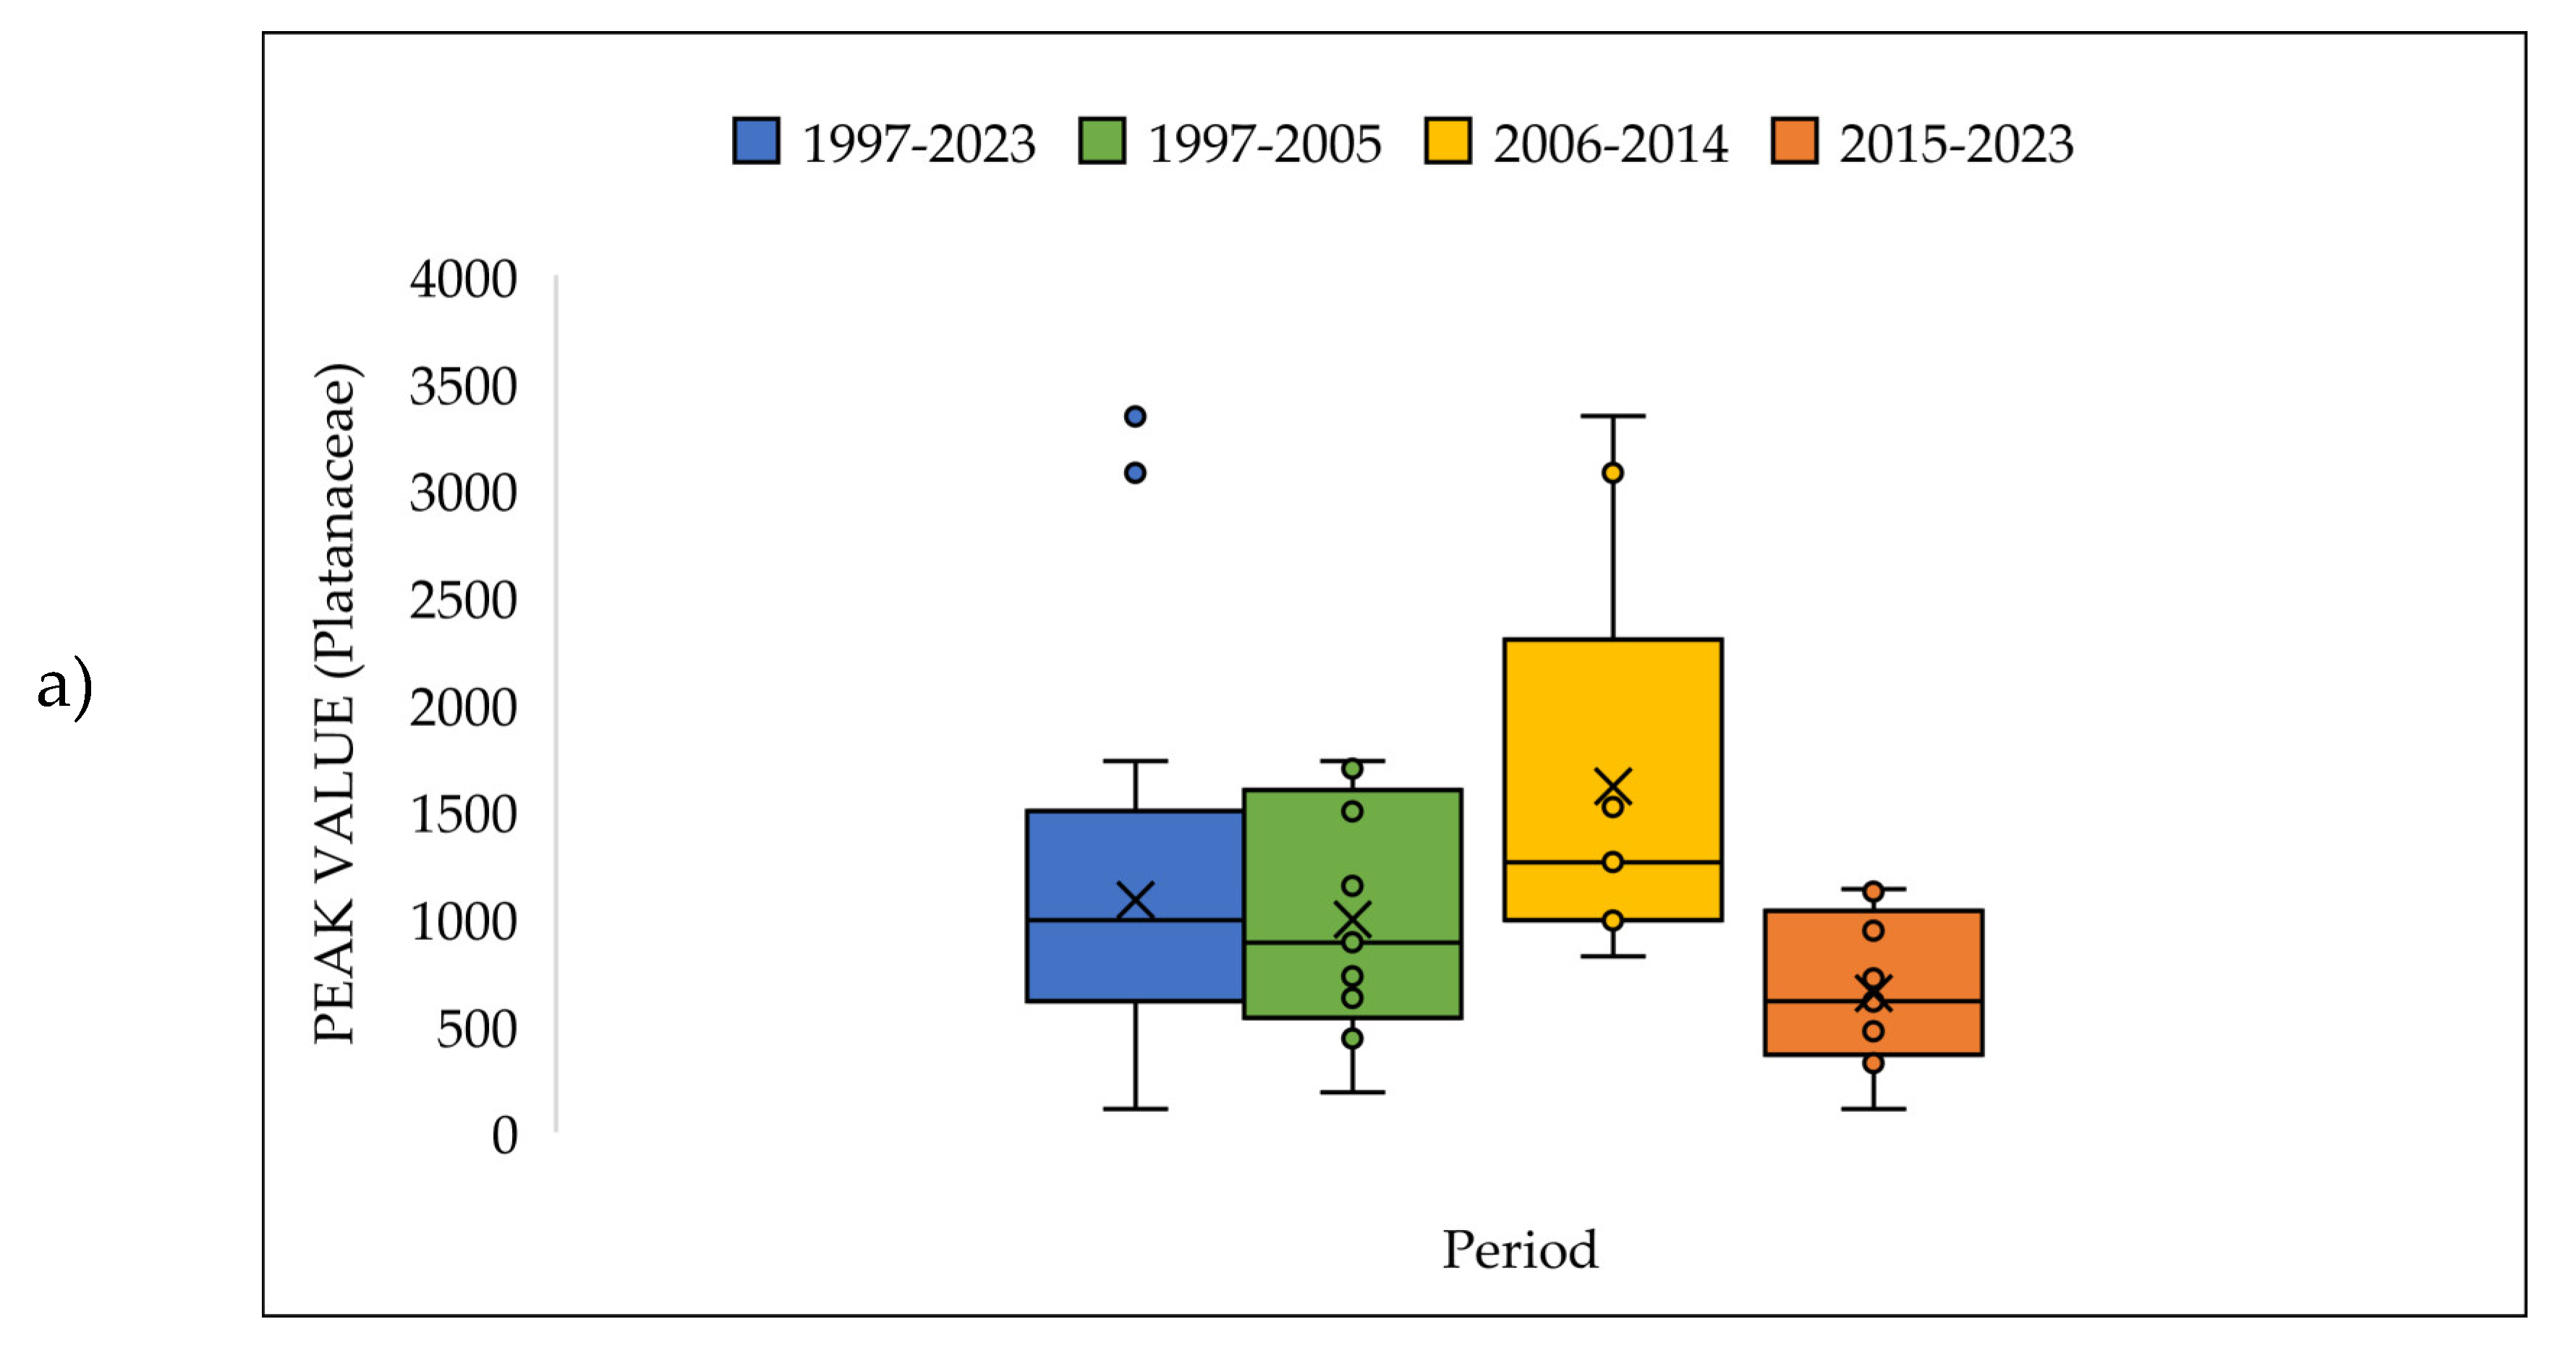
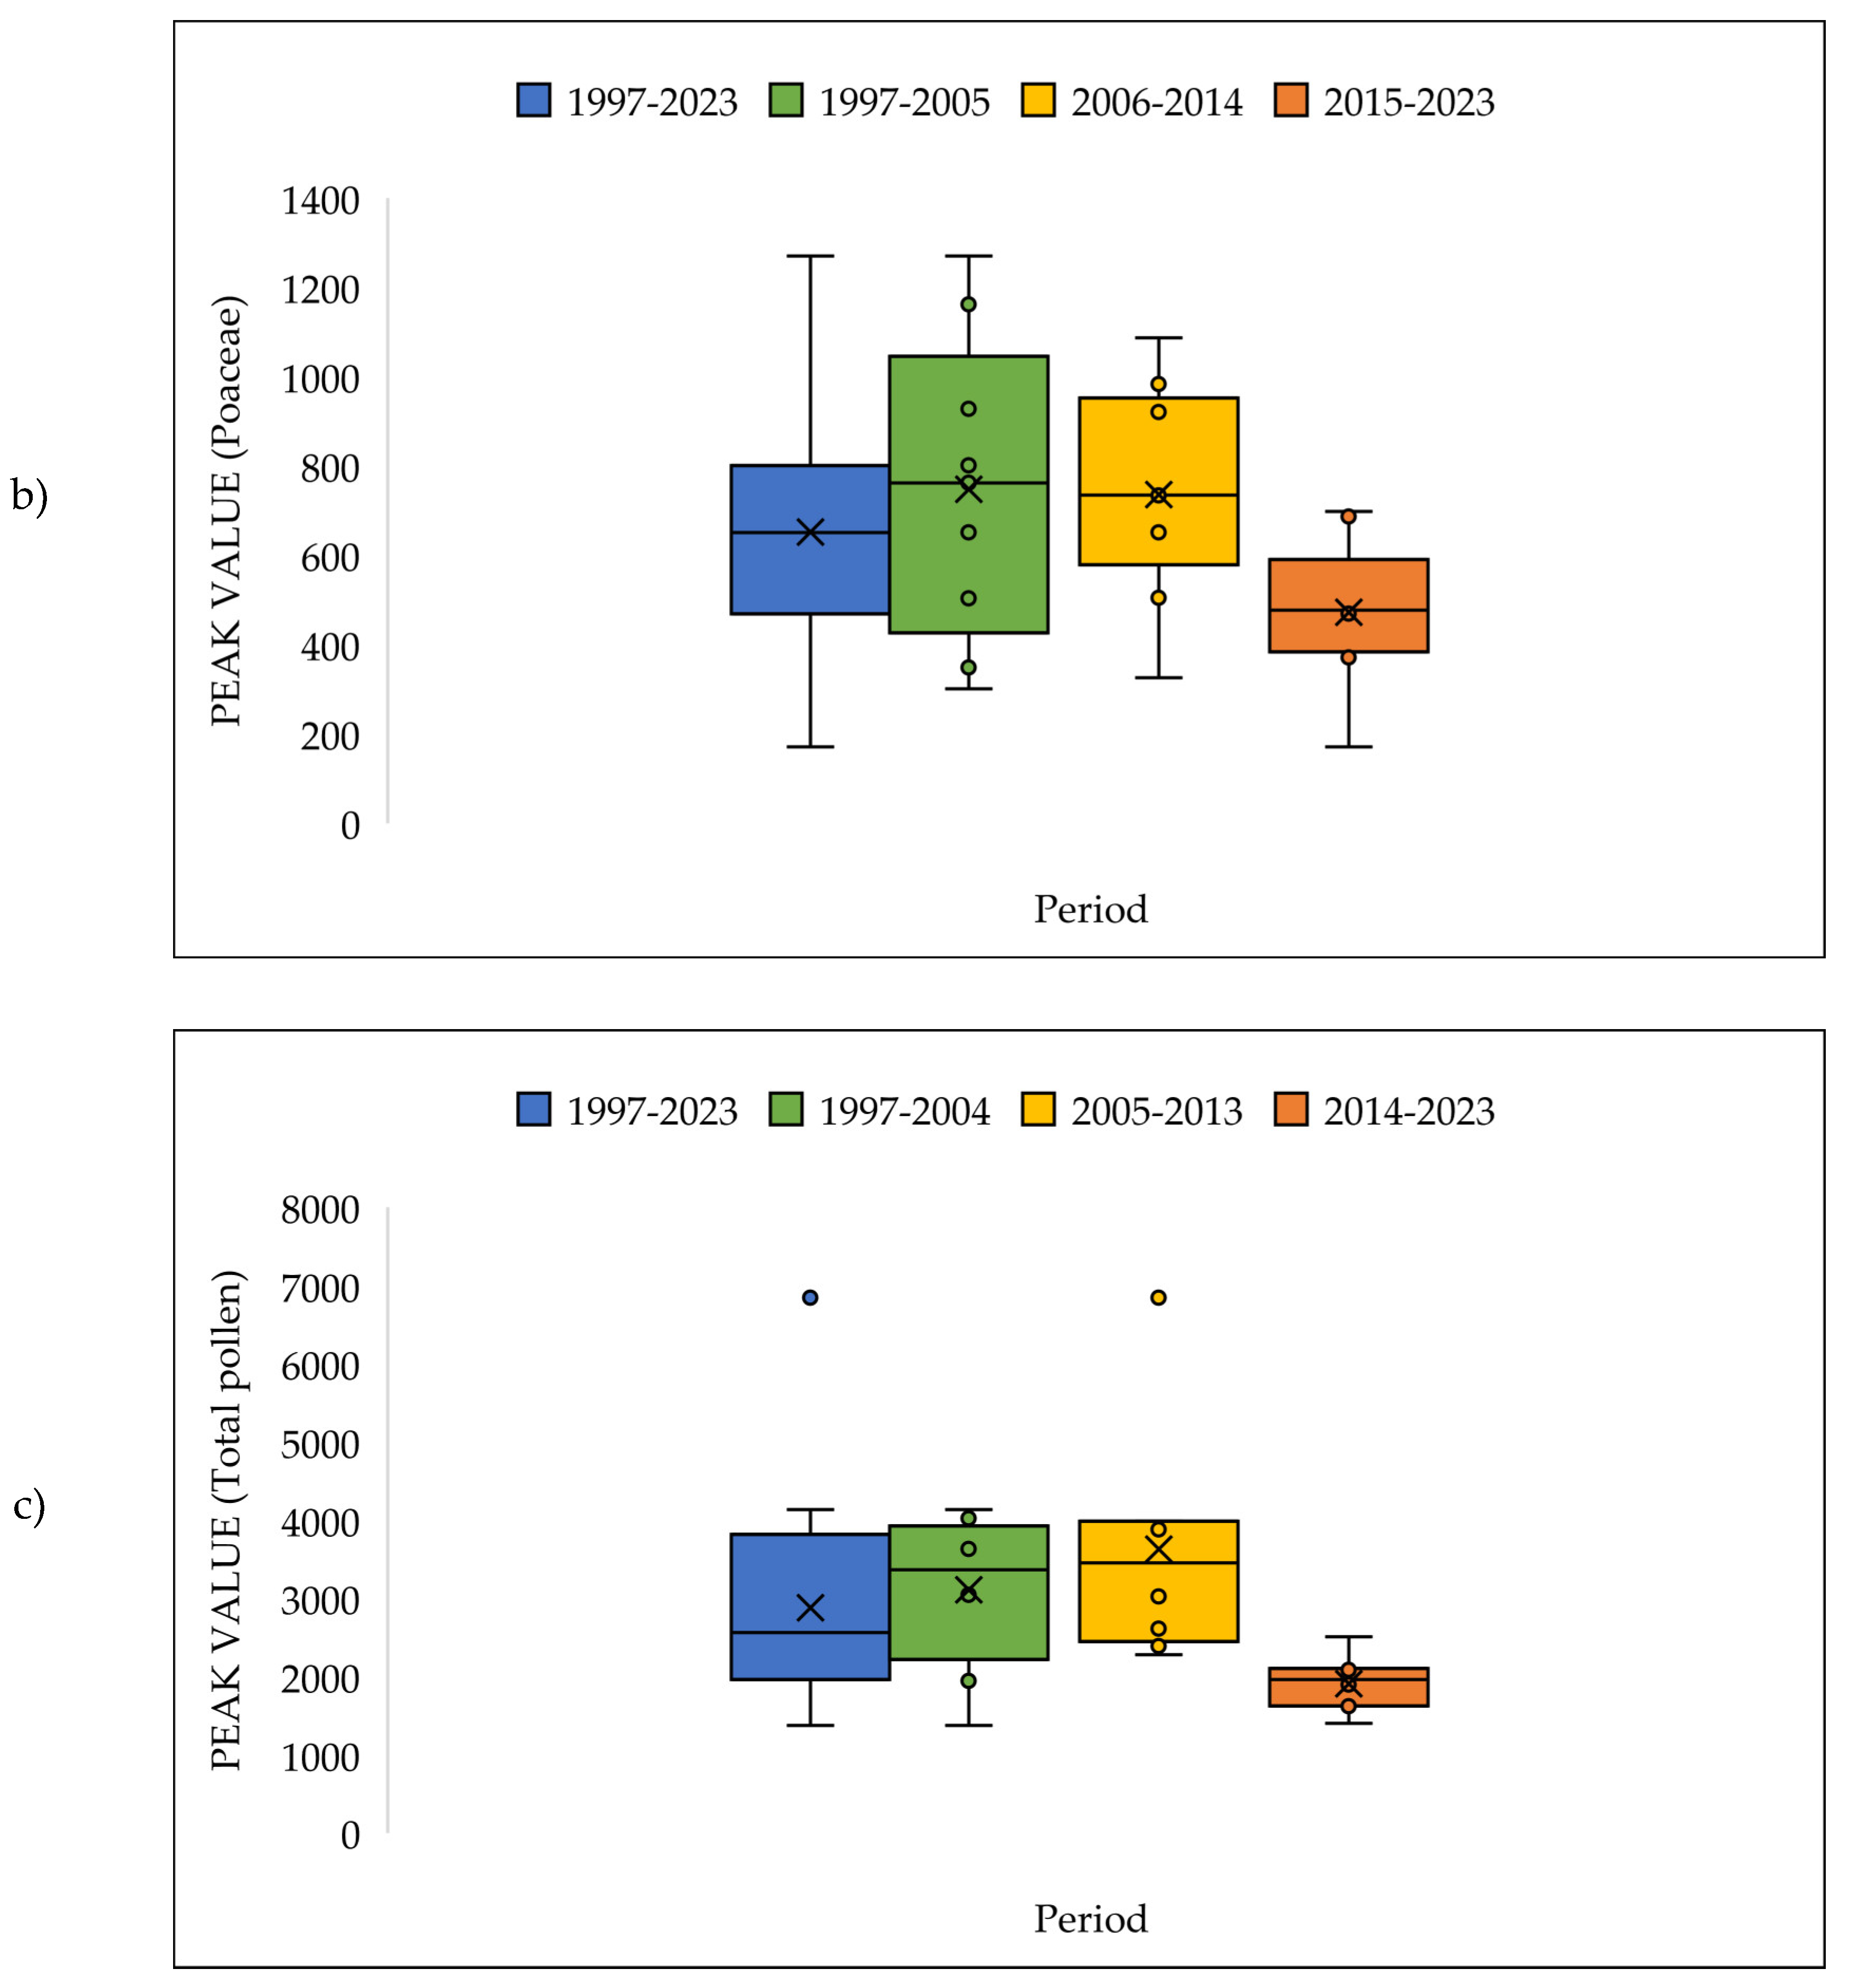
3.4. The Pollen Seasons Parameters over the Three Period 1997-2005; 2006-2014 and 2015-2023.
3.3. Trends and Correlations Between Pollen Season Parameters
4. Discussion
5. Conclusions
Author Contributions
Funding
Institutional Review Board Statement
Informed Consent Statement
Data Availability Statement
Conflicts of Interest
References
- Savoure, M.; Bousquet, J.; Jaakkola, J.J.K.; Jaakkola, M.S.; Jacquemin, B.; Nadif, R. Worldwide prevalence of rhinitis in adults: a review of definitions and temporal evolution. Clin Transl Allergy 2022, 12, e12130. [Google Scholar] [CrossRef] [PubMed]
- Luyten, A.; Bürgler, A.; Glick, S.; Kwiatkowski, M.; Gehrig, R.; Beigi, M.; Hartmann, K.; Eeftens, M. Ambient pollen exposure and pollen allergy symptom severity in the EPOCHAL study. Allergy 2024, 79, 1908–1920. [Google Scholar] [CrossRef] [PubMed]
- Bousquet, P.; Demoly, P.; Devillier, P.; Mesbah, K.; Bousquet, J. Impact of allergic rhinitis symptoms on quality of life in primary care. Int Arch Allergy Immunol 2013, 160, 393–400. [Google Scholar] [CrossRef] [PubMed]
- Vieira, R.J.; Pham-Thi, N.; Anto, J.M.; Czarlewski, W.; Sa-Sousa, A.; Amaral, R. , et al. Academic Productivity of Young People With Allergic Rhinitis: A MASK-air Study. J Allergy Clin Immunol Pract, 2022, 10, 3008–3017. [Google Scholar] [CrossRef] [PubMed]
- Vandenplas, O.; Vinnikov, D.; Blanc, P.D. , et al. Impact of rhinitis on work productivity: a systematic review. J Aller Cl Imm-Pract 2018, 6, 1274–1286. [Google Scholar] [CrossRef]
- D’Amato, G.; Murrieta-Aguttes, M.; D’Amato, M.; Ansotegui, I.J. Pollen respiratory allergy: Is it really seasonal? World Allergy Organ J 2023, 15, 100799. [Google Scholar] [CrossRef]
- Bousquet, J.; Anto, J.M; Bachert, C.; Baiardini, I.; Bosnic-Anticevich, S.; Canonica, W.G.; Melén, E.; Palomares, O.; Scadding, G.K.; Togias, A.; Toppila-Salmi, S. Allergic rhinitis. Nat Rev Dis Primers 2020, 3, 95. [Google Scholar] [CrossRef]
- Muzalyova, A.; Brunner, J.O.; Traidl-Hoffmann, C.; Damialis, A. Pollen allergy and health behavior: patients trivializing their disease. Aerobiologia 2019, 35, 327–341. [Google Scholar] [CrossRef]
- Domingo, K.N.; Gabaldon, K.L.; Hussari, M.N.; Yap, J.M.; Valmadrid, L.C.; Robinson, K.; Leibel, S. Impact of climate change on paediatric respiratory health: pollutants and aeroallergens. Eur Respir Rev 2024, 33. [Google Scholar] [CrossRef]
- D’Amato, G.; Holgate, S.T.; Pawankar, R.; Ledford, D.K.; Cecchi, L.; Al-Ahmad, M.; Al-Enezi, F.; Al-Muhsen, S.; Ansotegui, I.; Baena-Cagnani, C.E.; Baker, D.J.; Bayram, H.; Bergmann, K. C,.;Boulet, L.P.; Buters, J.T.; D’Amato, M.; Dorsano, S.; Douwes, J.; Finlay, S.E.; Garrasi, D.; Gómez, M.; Haahtela, T.; Halwani, R.; Hassani, Y.; Mahboub, B.; Marks, G.; Michelozzi, P.; Montagni, M.; Nunes, C.; Oh, J.J.; Popov, T.A.; Portnoy, J.; Ridolo, E.; Rosário, N.; Rottem, M.; Sánchez-Borges, M.; Sibanda, E.; Sienra-Monge, J.J.; Vitale, C.; Annesi-Maesano, I. Meteorological conditions, climate change, new emerging factors, and asthma and related allergic disorders. A statement of the World Allergy Organization. World Allergy Organ J 2015, 14, 25. [Google Scholar]
- Lombardi, C.; Canonica, G.W.; Passalacqua, G. IGRAM, Italian Group on Respiratory Allergy in Migrants. The possible influence of the environment on respiratory allergy: a survey on immigrants to Italy. Ann Allergy Asthma Immunol 2011, 106, 407–411. [Google Scholar] [CrossRef] [PubMed]
- Ziska, L.H.; Makra, L.; Harry, S.K.; Bruffaerts, N.; Hendrickx, M.; Coates, F.; Saarto, A.; Thibaudon, M.; Oliver, G.; Damialis, A.; Charalampopoulos, A.; Vokou, D.; Heiđmarsson, S.; Guđjohnsen, E. ; Bonini M, Oh JW, Sullivan K, Ford L, Brooks GD, Myszkowska D, Severova E, Gehrig R, Ramón GD, Beggs PJ, Knowlton K, Crimmins AR. Temperature-related changes in airborne allergenic pollen abundance and seasonality across the northern hemisphere: a etrospective data analysis. Lancet Planet Health. 2019 Mar;3, e124-e131. https://doi.org/10.1016/S2542-5196(19)30015-4. Erratum in: Lancet Planet Health. 2019 Nov;3, e446. doi: 10.1016/S2542-5196(19)30219-0. PMID: 30904111. Lancet Planet Health Erratum in: Lancet Planet Health. 2019 Nov;3, e446. doi: 10.1016/S2542-5196(19)30219-0. PMID: 30904111.. 2019, 3, e124–e131. [Google Scholar] [CrossRef] [PubMed]
- Glick, S.; Gehrig, R.; Eeftens, M. Multi-decade changes in pollen season onset, duration, and intensity: A concern for public health? Sci Total Environ 2021, 781, 146382. [Google Scholar] [CrossRef] [PubMed]
- Chapman, D.S.; Makra, L.; Albertini, R.; Bonini, M.; Páldy, A.; Rodinkova, V.; Šikoparija, B.; Weryszko-Chmielewska, E.; Bullock, J.M. Modelling the introduction and spread of non-native species: international trade and climate change drive ragweed invasion. Glob Chang Biol 2016, 22, 3067–3079. [Google Scholar] [CrossRef]
- Makra, L.; Matyasovszky, I.; Tusnády, G.; Ziska, L.H.; Hess, J.J.; Nyúl, L.G. , Chapman, D.S.; Coviello, L.; Gobbi, A.; Jurman, G.; Furlanello, C.; Brunato, M.; Damialis, A.; Charalampopoulos, A.; Müller-Schärer, H.; Schneider, N.; Szabó, B.; Sümeghy, Z.; Páldy, A.; Magyar, D.; Bergmann, K.C.; Deák, Á.J.; Mikó, E.; Thibaudon, M.; Oliver, G.; Albertini, R.; Bonini, M.; Šikoparija, B.; Radišić, P.; Josipović, M.M.; Gehrig, R.; Severova, E.; Shalaboda, V.; Stjepanović, B.; Ianovici, N.; Berger, U.; Seliger, A.K.; Rybníček, O.; Myszkowska, D.; Dąbrowska-Zapart, K.; Majkowska-Wojciechowska, B.; Weryszko-Chmielewska, E.; Grewling, Ł.; Rapiejko, P.; Malkiewicz, M.; Šaulienė, I.; Prykhodo, O.; Maleeva, A.; Rodinkova, V.; Palamarchuk, O.; Ščevková, J.; Bullock, J.M. A temporally and spatially explicit, data-driven estimation of airborne ragweed pollen concentrations across Europe. Sci Total Environ 2023, 905, 167095. [Google Scholar] [PubMed]
- D’Amato, G.; Akdis, C. Global warming, climate change, air pollution and allergies. Allergy 2020, 75, 2158–2160. [Google Scholar] [CrossRef] [PubMed]
- Beggs, P.J. Adaptation to impacts of climate change on aeroallergens and allergic respiratory diseases. Int J Environ Res Public Health 2010, 7, 3006–3021. [Google Scholar] [CrossRef] [PubMed]
- Huusko, A.; and Hicks, S. Conifer pollen abundance provides a proxy for summer temperature: evidence from the latitudinal forest limit in Finland. J Quaternary Sci. 2009, 24, 522–528. [Google Scholar] [CrossRef]
- Zhang, Y.; Steiner, AL. Projected climate-driven changes in pollen emission season length and magnitude over the continental United States. Nat Commun 2022, 15, 1234. [Google Scholar] [CrossRef]
- D’Amato, G.; Holgate, S.T.; Pawankar, R.; Ledford, D.K.; Cecchi, L.; Al-Ahmad, M.; Al-Enezi, F.; Al-Muhsen, S.; Ansotegui, I.; Baena-Cagnani, C.E.; Baker, D.J.; Bayram, H.; Bergmann, K.C.; Boulet, L.P.; Buters, J.T.; D’Amato, M.; Dorsano, S.; Douwes, J.; Finlay, S.E.; Garrasi, D.; Gómez, M.; Haahtela, T. , Halwani, R., Hassani, Y.; Mahboub, B.; Marks, G.; Michelozzi, P.; Montagni, M.; Nunes, C.; Oh, J.J.; Popov, T.A.; Portnoy, J.; Ridolo, E.; Rosário, N.; Rottem, M.; Sánchez-Borges, M.; Sibanda, E.; Sienra-Monge, J.J.; Vitale, C.; Annesi-Maesano, I. Meteorological conditions, climate change, new emerging factors, and asthma and related allergic disorders. A statement of the World Allergy Organization. World Allergy Organ J 2015, 14, 25. [Google Scholar]
- D’Amato, G.; Akdis, C.A. Global warming, climate change, air pollution and allergies. Allergy 2020, 75, 2158–2160. [Google Scholar] [CrossRef]
- Cecchi, L.; D’Amato, G.; Annesi-Maesano, I. Climate change and outdoor aeroallergens related to allergy and asthma: Taking the exposome into account. Allergy 2020, 75, 2361–2363. [Google Scholar] [CrossRef]
- Prescott, S.L. Allergy as a sentinel measure of planetary health and biodiversity loss. Allergy 2020, 75, 2358–2360. [Google Scholar] [CrossRef] [PubMed]
- Wayne, P.; Foster, S.; Connolly, J.; Bazzaz, F.; Epstein, P. Production of allergenic pollen by ragweed (Ambrosia artemisiifolia L.) is increased in CO2-enriched atmospheres. Ann Allergy Asthma Immunol 2002, 88, 279–282. [Google Scholar] [CrossRef] [PubMed]
- Kim KR, Oh JW, Woo SY, Seo YA, Choi YJ, Kim HS, Lee WY, Kim BJ. Does the increase in ambient CO2 concentration elevate allergy risks posed by oak pollen? Int J Biometeorol 2018, 62, 1587–1594. [Google Scholar] [CrossRef]
- Choi, Y.J.; Lee, K.S.; Oh, J.W. The Impact of Climate Change on Pollen Season and Allergic Sensitization to Pollens. Immunol Allergy Clin North Am 2021, 41, 97–109. [Google Scholar] [CrossRef] [PubMed]
- D’Amato, G.; Pawankar, R.; Vitale, C.; Lanza, M.; Molino, A.; Stanziola, A.; Sanduzzi, A.; Vatrella, A.; D’Amato, M. Climate Change and Air Pollution: Effects on Respiratory Allergy. Allergy Asthma Immunol Res 2016, 8, 391–395. [Google Scholar] [CrossRef]
- Gent, J.F.; Triche, E.W.; Holford, T.R.; Belanger, K.; Bracken, M.B.; Beckett, W.S.; Leaderer, B.P. Association of low-level ozone and fine particles with respiratory symptoms in children with asthma. JAMA 2003, 290, 1859–1867. [Google Scholar] [CrossRef]
- Smith, M.; Skjøth, C.A.; Myszkowska, D.; Uruska, A.; Puc, M.; Stach, A.; Balwierz, Z.; Chlopek, K.; Piotrowska, K.; Kasprzyk, I.; Brandt, J. Long-range transport of Ambrosia pollen to Poland, Agric Forest Meteor 2008, 148, 1402–1411. 2008, 148, 1402–1411. [Google Scholar]
- Ranpal, S. , von Bargen, S. , Gilles, S., Luschkova, D., Landgraf, M., Bogawski, P., Traidl-Hoffmann, C., Büttner, C., Damialis, A., Fritsch, M., Jochner-Oette, S. Continental-scale evaluation of downy birch pollen production: Estimating the impacts of global change. Environmental Research 2024, 1, 252–119114. [Google Scholar]
- Cecchi, L.; Torrigiani Malaspina, T.; Albertini, R.; Zanca, M.; Ridolo, E.; Usberti. I.; Morabito, M.; Dall’ Aglio, P.; Orlandini, S. The contribution of long-distance transport to the presence of Ambrosia pollen in central northern Italy. Aerobiologia 2007, 23, 145–151. [Google Scholar] [CrossRef]
- Bayr, D.; Plaza, M.P.; Gilles, S.; Kolek, F.; Leier-Wirtz, V.; Traidl-Hoffmann, C.; Damialis, A. Pollen long-distance transport associated with symptoms in pollen allergics on the German Alps: An old story with a new ending? Sci Total Environ 2023, 881, 163310. [Google Scholar] [CrossRef]
- Hjelmroos, M. Evidence of long-distance transport of betula pollen. Grana 1991, 30, 215–228. [Google Scholar] [CrossRef]
- D’Amato, G.; Annesi-Maesano, I.; Urrutia-Pereira, M.; et al. Thunderstorm allergy and asthma: state of the art. Multidiscip Respir Med 2021, 16, 806–811. [Google Scholar] [CrossRef]
- Xu, Y.Y. , Xue, T.; Li, H.R.; Guan, K. Retrospective analysis of epidemic thunderstorm asthma in children in Yulin, northwest China. Pediatr Res 2021, 89, 958–961. [Google Scholar] [CrossRef] [PubMed]
- Final Report: literature review on thunderstorm asthma and its implications for public health advice. Queensland University of Technology. Brisbane, Australia. Contracted by: Department of Health and Human Services, Victorian State Government. 2017, 89, 958–961.
- Ariano, R.; Canonica, G.W.; Passalacqua, G. Possible role of climate changes in variations in pollen seasons and allergic sensitizations during 27 years. Ann Allergy Asthma Immunol 2010, 104, 215–222. [Google Scholar] [CrossRef] [PubMed]
- Frenguelli, G.; Tedeschini, E.; Veronesi, F.; et al. Airborne pine (Pinus spp.) pollen in the atmosphere of Perugia (Central Italy): Behaviour of pollination in the two last decades. Aerobiologia 2002, 18, 223–228. [Google Scholar] [CrossRef]
- Frenguelli, G. Interactions between climatic changes and allergenic plants. Monaldi Arch Chest Dis. 2002, 57, 141–143. [Google Scholar] [PubMed]
- Tedeschini, E. , Javier RodrÍguez-Rajo, F., Caramiello, R., Jato, V., & Frenguelli, G. (2006). The influence of climate changes in Platanus spp. pollination in Spain and Italy. Grana 2006, 45, 222–229. [Google Scholar]
- Voltolini, S.; Minale, P.; Troise, C.; et al. Trend of herbaceous pollen diffusion and allergic sensitisation in Genoa, Italy. Aerobiologia 2000, 16, 245–249. [Google Scholar] [CrossRef]
- Rodríguez-RaJo, F. J. , Frenguelli, G., & Jato, V. The influence of air temperature on the starting date of Quercus pollination in the South of Europe. Grana 2003, 42, 145–152. [Google Scholar]
- Ciancianaini, P.; Albertini, R.; Pinelli, S.; Lunghi, P.; Ridolo, E.; & Dall’Aglio, P.; Dall’Aglio, P. Betulaceae, Corylacae, Cupressaceae, Fagaceae and Salicacae around Parma (Northen Italy): Pollen calendars from 1995 to 1997. Aerobiologia 2000, 16, 309–312. [Google Scholar] [CrossRef]
- Albertini, R.; Ciancianaini, P.; Pinelli, S.; Ridolo, E.; Dall’Aglio, P. Pollens in Parma 1995 to 2000. Allergy 2001, 56, 1232–1233. [Google Scholar] [CrossRef] [PubMed]
- Ridolo, E.; Albertini, R.; Giordano, D. , Soliani, L.; Usberti, I.; Dall’Aglio, PP. Airborne pollen concentrations and the incidence of allergic asthma and rhinoconjunctivitis in northern Italy from 1992 to 2003. Int Arch Allergy Immunol 2007, 142, 151–157. [Google Scholar] [CrossRef] [PubMed]
- Mercuri, A.M.; Torri, P.; Casini, E.; Olmi, L. Climate warming and the decline of Taxus airborne pollen in urban pollen rain (Emilia Romagna, northern Italy). Plant Biol 2013, 15, 70–82. [Google Scholar] [CrossRef]
- Mercuri, A.M.; Torri, P.; Fornaciari, R; Florenzano, A. Plant Responses to Climate Change: The Case Study of Betulaceae and Poaceae Pollen Seasons (Northern Italy, Vignola, Emilia-Romagna). Plants 2016, 5, 42. [Google Scholar] [CrossRef] [PubMed]
- Ugolotti, M.; Pasquarella, C.; Vitali, P.; et al. Characteristics and trends of selected pollen seasons recorded in Parma (Northern Italy) from 1994 to 2011. Aerobiologia, 2015, 31, 341–352. [Google Scholar] [CrossRef]
- Köppen, W. Das geographische System der Klimate (PDF), in Handbuch der Klimatologie, vol. 1, Berlino, Borntraeger, 1936.
- Hirst, J.M. An automatic volumetric spore trap. Ann Appl Biol 1952, 39, 257–265. [Google Scholar] [CrossRef]
- UNI 11108:2004 - Qualità dell’aria - Metodo di campionamento e conteggio dei granuli pollinici e delle spore fungine aerodisperse.
- EN 16868:2019. Ambient air - Sampling and analysis of airborne pollen grains and fungal spores for networks related to allergy - Volumetric Hirst method.
- Jäger, S.; Nilsson, S.; Berggren, B.; Pessi, A.; Helander, M.; and Ramfjord, H. Trends of some airborne tree pollen in the Nordic countries and Austria, 1980-1993. Grana 1996, 35, 171–178. [Google Scholar] [CrossRef]
- Pfaar, O.; Bastl, K.; Berger, U.; Buters, J.; Calderon, M.A.; Clot, B.; Darsow, U.; Demoly, P.; Durham, SR.; Galán, C.; Gehrig, R.; Gerth van Wijk, R.; Jacobsen, L.; Klimek, L.; Sofiev, M.; Thibaudon, M.; Bergmann, K.C. Defining pollen exposure times for clinical trials of allergen immunotherapy for pollen-induced rhinoconjunctivitis - an EAACI position paper. Allergy. 2017, 72, 713–722. [Google Scholar] [CrossRef]
- Galán, A.; Ariatti, M.; Bonini, B.; Clot, B.; Crouzy, A.; Dahl, D.; Fernandez-González, G.; Frenguelli, R.; Gehrig, S.; Isard, E.; Levetin, D.; W, Li, P. ; Mandrioli, C. A.; Rogers, M.; Thibaudon, I.; Sauliene, C.; Skjoth, M.; Smith, M. Sofiev Recommended terminology for aerobiological studies. Aerobiologia 2017, 33, 293–295. [Google Scholar] [CrossRef]
- Thackeray, S. J.; Sparks, T. H.; Frederiksen, M.; Burthe, S.; Bacon, P. J.; Bell, J.; Botham, M.; Brereton, T.; Bright, P.; Carvalho, L.; Clutton-Brock, T.; Dawson, A.; Edwards, E.; Elliott, J.M.; Harrington, R.; Johns, D.; Jones, I.D.; Jones, J.T.; Leech, D.I.; Roy, D.B.; Scott, A.; Smith, M.; Smithers, R.J.; Winfield, I.J.; Wanless, S. Trophic level asynchrony in rates of phenological change for marine, freshwater and terrestrial environments. Global Change Biology 2010, 16, 3304–3313. [Google Scholar] [CrossRef]
- Ziello, C.; Sparks, T.H.; Estrella, N.; Belmonte, J.; Bergmann, K. C.; Bucher, E.; Brighetti, M.A.; Damialis, A.; Detandt, M.; Galán, C.; Gehrig, R.; Grewling, L.; Gutiérrez Bustillo, A.M.; Hallsdóttir, M.; Kockhans-Bieda, M.C.; De Linares, C.; Myszkowska, D.; Pàldy, A.; Sánchez, A.; Smith, M.; Thibaudon, M.; Travaglini, A.; Uruska, U.; Valencia-Barrera, R.M.; V okou, D.; Wachter, R.; de Weger, L.A.; Menzel, A. Changes to airborne pollen counts across europe. PLoS One 2012, 7, e34076. [Google Scholar] [CrossRef]
- Smith, M.; Jäger, S.; Berger, U.; Sikoparija, B.; Hallsdottir, M.; Sauliene, I.; Bergmann, K.C.; Pashley, C.H.; de Weger, L.; Majkowska-Wojciechowska, B.; Rybníček, O.; Thibaudon, M.; Gehrig, R.; Bonini, M.; Yankova, R.; Damialis, A.; Vokou, D.; Gutiérrez Bustillo, A.M.; Hoffmann-Sommergruber, K.; van Ree, R. Geographic and temporal variations in pollen exposure across Europe. Allergy 2014, 69, 913–923. [Google Scholar] [CrossRef] [PubMed]
- Zar, J. H. Biostatistical analysis, 5th ed.; Publisher: Pearson Education, Incorporated, United Kingdom, 2018. [Google Scholar]
- Oh, JW. Pollen Allergy in a Changing Planetary Environment. Allergy Asthma Immunol Res 2022, 14, 168–181. [Google Scholar] [CrossRef] [PubMed]
- Pawankar, R. Allergic diseases and asthma: a global public health concern and a call to action. World Allergy Organ J 2014, 19, 12. [Google Scholar] [CrossRef]
- Pawankar, R.; Baena-Cagnani, C.E.; Bousquet, J.; Canonica, G.W.; Cruz, A.A.; Kaliner, M.A.; Lanier, B.Q. State of world allergy report 2008: allergy and chronic respiratory diseases. World Allergy Organ J 2008, 1, S4–S17. [Google Scholar] [CrossRef]
- Luyten, A.; Bürgler, A.; Glick, S.; Kwiatkowski, M.; Gehrig, R.; Beigi, M.; Hartmann, K.; Eeftens, M. Ambient pollen exposure and pollen allergy symptom severity in the EPOCHAL study. Allergy 2024, 79, 1908–1920. [Google Scholar] [CrossRef]
- Asthma and Allergy Foundation of America. Climate change and health. Available on line: https://aafa.org/asthma-allergy-research/our-research/climate-health/ (Accessed on 27 August 2024).
- European Climate and Health Observatory. Pollen. Available on line: https://climate-adapt.eea.europa.eu/en/observatory/evidence/health-effects/aeroallergens (Accessed on 27 August 2024).
- Li, Z.; Xu, X.; Thompson, L.A.; Gross, H.E.; Shenkman, E.A.; DeWalt, D.A.; Huang, I.C. Longitudinal Effect of Ambient Air Pollution and Pollen Exposure on Asthma Control: The Patient-Reported Outcomes Measurement Information System (PROMIS) Pediatric Asthma Study. Acad Pediatr 2019, 19, 615–623. [Google Scholar] [CrossRef] [PubMed]
- Sofia Papadogiannaki *, Serafeim Kontos, Daphne Parliari andDimitriosMelas. Machine Learning Regression to Predict Pollen Concentrations of Oleaceae and Quercus Taxa in Thessaloniki, Greece. Environ. Sci. Proc. 2023, 26, 2–6. [Google Scholar] [CrossRef]
- Goktas P, Karakaya G, Kalyoncu AF, Damadoglu E. Artificial Intelligence Chatbots in Allergy and Immunology Practice: Where Have We Been and Where Are We Going? J Allergy Clin Immunol Pract. 2023, 11, 2697–2700. [Google Scholar] [CrossRef] [PubMed]
- Agenzia regionale per la prevenzione, l’ambiente e l’energia dell’Emilia-Romagna (Arpae). Precipitazioni giornaliere cumulate in Emilia-Romagna (anno 2024) https://www.arpae.it/it/temi-ambientali/clima, accessed on October 14, 2024.
- Intergovernmental Panel on Climate Change (IPCC), AR6 Synthesis Report: Climate Change 2023. https://www.ipcc.ch/assessment-report/ar6/ accessed October 14, 2024.
- WHO, Preventing disease through healthy environments: a global assessment of the burden of disease from environmental risks. Meeting report. 13 September, 2018.
- Idrose NS, Lodge CJ, Erbas B, Douglass JA, Bui DS, Dharmage SC. A Review of the Respiratory Health Burden Attributable to Short-Term Exposure to Pollen. Int J Environ Res Public Health 2022, 19, 7541. [Google Scholar] [CrossRef]
- Lappe BL, Scovronick N, D’Souza RR, Manangan A, Chang HH, Ebelt S. Associations of pollen and cardiovascular disease morbidity in Atlanta during 1993-2018. Environ Epidemiol. 2024, 8, e296. [Google Scholar] [CrossRef] [PubMed]

| a | Start date (DOY) | |||||||||||||
|---|---|---|---|---|---|---|---|---|---|---|---|---|---|---|
| Grains | Mean | SD | R2 | slope | SE | p | N | |||||||
| Ambrosia | 219 | 19.0 | 0.04 | 0.52 | 3.71 | 0.28 | 26 | |||||||
| Betula | 82 | 19.5 | 0.32 | 1.4 | 3.75 | 0.00 | 27 | |||||||
| Corylus | 28 | 15.7 | 0.16 | -0.8 | 3.02 | 0.03 | 27 | |||||||
| Cupressaceae | 42 | 19.9 | 0.04 | -0.11 | 3.83 | 0.82 | 27 | |||||||
| Platanus | 91 | 9.10 | 0.00 | 0.03 | 1.75 | 0.88 | 27 | |||||||
| Poaceae | 109 | 6.59 | 0.19 | -0.37 | 1.26 | 0.02 | 27 | |||||||
| Total pollen | 69 | 18.8 | 0.01 | -0.31 | 3.85 | 0.52 | 24 | |||||||
| Alternaria | 168 | 12.6 | 0.00 | -0.12 | 2.43 | 0.69 | 27 | |||||||
| b | ||||||||||||||
| Duration (Days) | ||||||||||||||
| Grains | Mean | SD | R2 | slope | SE | p | N | |||||||
| Ambrosia | 47 | 19.2 | 0.12 | -0.87 | 3.7 | 0.07 | 26 | |||||||
| Betula | 41 | 19.6 | 0.16 | -0.99 | 3.7 | 0.04 | 27 | |||||||
| Corylus | 50 | 17.3 | 0.09 | 0.66 | 3.33 | 0.12 | 27 | |||||||
| Cupressaceae | 125 | 47.8 | 0.04 | 1.30 | 9.2 | 0.27 | 27 | |||||||
| Platanus | 20 | 6.68 | 0.00 | 0.00 | 1.28 | 0.96 | 27 | |||||||
| Poaceae | 95 | 20.6 | 0.23 | 1.25 | 3.9 | 0.01 | 27 | |||||||
| Total pollen | 165 | 24.9 | 0.16 | 1.23 | 5.09 | 0.05 | 24 | |||||||
| Alternaria | 115 | 20.6 | 0.00 | 0.17 | 3.97 | 0.74 | 27 | |||||||
| c | ||||||||||||||
| End date (DOY) | ||||||||||||||
| Grains | Mean | SD | R2 | slope | SE | p | N | |||||||
| Ambrosia | 266 | 12.9 | 0.04 | -0.36 | 2.54 | 0.28 | 26 | |||||||
| Betula | 122 | 10.3 | 0.01 | 0.38 | 1.99 | 0.13 | 27 | |||||||
| Corylus | 79 | 13.1 | 0.08 | -0.18 | 2.52 | 0.57 | 27 | |||||||
| Cupressaceae | 167 | 41.3 | 0.05 | 1.19 | 7.95 | 0.25 | 27 | |||||||
| Platanus | 111 | 6.5 | 0.00 | 0.02 | 1.26 | 0.88 | 27 | |||||||
| Poaceae | 204 | 18 | 0.14 | 0.88 | 3.47 | 0.04 | 27 | |||||||
| Total pollen | 234 | 16.9 | 0.19 | 0.92 | 3.45 | 0.03 | 24 | |||||||
| Alternaria | 283 | 22.3 | 0.00 | 0.04 | 4.29 | 0.93 | 27 | |||||||
| d | ||||||||||||||
| Peak date (DOY) | ||||||||||||||
| Grains | Mean | SD | R2 | slope | SE | p | N | |||||||
| Ambrosia | 243 | 8.18 | 0.24 | 0.50 | 1.60 | 0.01 | 26 | |||||||
| Betula | 102 | 13.00 | 0.07 | 0.43 | 2.50 | 0.18 | 27 | |||||||
| Corylus | 48 | 17.19 | 0.02 | -0.03 | 3.30 | 0.42 | 27 | |||||||
| Cupressaceae | 67 | 12.89 | 0.03 | -0.3 | 2.48 | 0.34 | 27 | |||||||
| Platanus | 99 | 7.51 | 0.01 | -0.12 | 1.44 | 0.50 | 27 | |||||||
| Poaceae | 120 | 6.02 | 0.34 | -0.44 | 1.15 | 0.00 | 27 | |||||||
| Total pollen | 109 | 9.92 | 0.31 | -0.69 | 2.02 | 0.00 | 24 | |||||||
| Alternaria | 236 | 27.2 | 0.06 | -0.84 | 5.24 | 0.21 | 27 | |||||||
| a | Peak value (grains/m3) | |||||||||||||
|---|---|---|---|---|---|---|---|---|---|---|---|---|---|---|
| Pollen type | Mean | SD | R2 | slope | SE | p | N | |||||||
| Ambrosia | 44 | 29 | 0.02 | 0.62 | 5 | 0.41 | 26 | |||||||
| Betula | 105 | 85 | 0.00 | -0.26 | 16 | 0.90 | 27 | |||||||
| Corylus | 111 | 67 | 0.02 | 1.45 | 13 | 0.39 | 27 | |||||||
| Cupuressaceae | 496 | 509 | 0.06 | 16.26 | 98 | 0.20 | 27 | |||||||
| Platanus | 1083 | 757 | 0.02 | -15.14 | 146 | 0.42 | 27 | |||||||
| Poaceae | 651 | 277 | 0.21 | -16.03 | 53 | 0.02 | 27 | |||||||
| Total pollen | 2883 | 1242 | 0.10 | -50.57 | 253 | 0.11 | 24 | |||||||
| Alternaria | 956 | 488 | 0.00 | -3.27 | 93 | 0.79 | 27 | |||||||
| b | SPIn (grains) | |||||||||||||
| Pollen type | Mean | SD | R2 | slope | SE | p | N | |||||||
| Ambrosia | 308 | 192 | 0.07 | 6.49 | 38 | 0.18 | 26 | |||||||
| Betula | 747 | 523 | 0.00 | -4.63 | 100 | 0.72 | 27 | |||||||
| Corylus | 902 | 571 | 0.20 | 31.07 | 110 | 0.02 | 27 | |||||||
| Cupressaceae | 3638 | 2913 | 0.09 | 113.02 | 561 | 0.11 | 27 | |||||||
| Platanus | 5707 | 3498 | 0.00 | -37.6 | 673 | 0.67 | 27 | |||||||
| Poaceae | 8803 | 2936 | 0.00 | 14.84 | 565 | 0.84 | 27 | |||||||
| Total pollen | 51044 | 14035 | 0.00 | -138.58 | 2865 | 0.71 | 24 | |||||||
| Alternaria | 24089 | 10472 | 0.00 | 341 | 2015 | 0.19 | 27 | |||||||
| Pollen types | SPIn Pollen * day/m3 |
Start date DOY |
Duration DAYS |
End date DOY |
Peak date DOY |
Peak value Pollen/m3 |
|---|---|---|---|---|---|---|
| Ambrosia | 22.7 | 13.1 | ||||
| Betula | 36.5 | -25.0 | ||||
| Corylus | 895.3 | -12.7 | 17.2 | 4.8 | ||
| Cupressaceae | 36.5 | |||||
| Poaceae | -9.6 | 32.6 | 22.9 | 11.6 | -416.8 | |
| Total pollen | 32.2 | 24.1 | 18.0 |
| Temperature | Winter | Spring | Summer | Autumn | ||||||||
| Mean | Max | Min | Mean | Max | Min | Mean | Max | Min | Mean | Max | Min | |
| 1997-2005 | 4.3 | 8.3 | 1.5 | 14.4 | 20.0 | 9.6 | 24.6 | 30.6 | 19.4 | 14.2 | 18.3 | 11.1 |
| 2006-2014 | 4.1 | 7.4 | 1.7 | 14.8 | 20.1 | 10.2 | 24.9 | 30.9 | 19.7 | 15.0 | 19.2 | 11.7 |
| 2015-2023 | 5.3 | 9.1 | 2.7 | 14.6 | 19.9 | 9.8 | 26.0 | 31.8 | 20.5 | 15.5 | 20.0 | 12.0 |
| Pollen type | a | b | c | d | e | f | g | h | i | j | k | l | m | n | o |
|---|---|---|---|---|---|---|---|---|---|---|---|---|---|---|---|
| Ambrosia | ns | ** -0.54 | ns | ns | ns | ***0.61 | *-0.44 | *-0.44 | ns | *-0.42 | *-0.39 | ns | ns | *** 0.77 | ns |
| Betula | ns | *** -0.79 | ns | ns | *0.43 | ns | ns | ns | ns | ns | ns | ns | ns | *** 0.93 | ns |
| Corylus | ns | *** -0.66 | ns | ns | ***0.67 | **0.53 | ns | ns | *0.40 | ns | ns | ns | ns | ***0.90 | ns |
| Cupressaceae | ns | *** -0.71 | ns | * -0.41 | ns | ***0.73 | ns | ns | ns | ns | ns | ns | *-0.46 | ***0.86 | ns |
| Platanus | ***0.69 | ***-0.66 | ns | ns | ***0.73 | ns | ns | ns | ***0.72 | ns | *-0.41 | ns | ns | ***0.82 | ns |
| Poaceae | ns | ***-0.60 | ns | ns | ***0.73 | ***0.91 | ***-0.55 | ns | ns | ns | *-0.48 | *-0.44 | ns | ns | ns |
| Total pollen | ns | ***-0.68 | *0.45 | ns | **0.52 | ***0.67 | ns | ns | ns | ns | *-0.51 | **-0.52 | ns | ns | *0.47 |
| Alternaria | ns | **-0.53 | ns | ns | ns | **0.52 | ns | ns | ns | ns | ns | ns | ns | ***0.58 | ns |
Disclaimer/Publisher’s Note: The statements, opinions and data contained in all publications are solely those of the individual author(s) and contributor(s) and not of MDPI and/or the editor(s). MDPI and/or the editor(s) disclaim responsibility for any injury to people or property resulting from any ideas, methods, instructions or products referred to in the content. |
© 2025 by the authors. Licensee MDPI, Basel, Switzerland. This article is an open access article distributed under the terms and conditions of the Creative Commons Attribution (CC BY) license (http://creativecommons.org/licenses/by/4.0/).


