1. Introduction
Primary liver cancer is the seventh most common cancer worldwide, posing a significant threat to human life and health. According to the latest statistics, liver cancer ranks as the second leading cause of cancer-related deaths and the fourth most prevalent cancer in China [
1]. Computed Tomography (CT) is currently one of the most widely used diagnostic methods for liver lesions. CT imaging provides essential information regarding the morphology, quantity, location, and boundaries of liver tumors, making the effective segmentation of liver tumor regions based on CT images highly valuable for clinical applications. However, challenges remain due to the similarity in grayscale values between the liver and surrounding organs in CT images, significant inter-patient variability, and the fact that liver tumors can appear at any location with indistinct boundaries. Consequently, the three-dimensional (3D) segmentation of the liver and liver tumors remains a highly complex task [
2].
Before 2016, most automatic liver and tumor segmentation methods relied on traditional machine learning techniques. These approaches included methods based on shape and geometric priors, intensity distribution, and spatial context for liver segmentation [
3,
4,
5,
6,
7], as well as thresholding, spatial regularization, or local features combined with learning algorithms for tumor segmentation [
8,
9,
10,
11,
12]. However, these methods were characterized by low efficiency, limited robustness, and a reliance on manual adjustment of numerous parameters, often requiring expert experience.
Since the first related paper was published at MICCAI in 2016, deep learning methods have gradually become the preferred approach for liver and tumor segmentation tasks. Christ et al. [
13] were the first to apply the 3D U-Net architecture for this purpose, introducing a cascaded segmentation strategy combined with 3D conditional random fields for refinement. Subsequently, numerous deep learning approaches have been developed and evaluated using the publicly available LiTS dataset [
14]. The accessibility of this dataset has facilitated the proposal of various novel deep learning solutions for liver and tumor segmentation. Among these, U-Net-based architectures have been extensively adopted and modified to enhance segmentation performance.
For example, Li et al. [
15] proposed the H-Dense UNet with hybrid dense connections, which effectively optimized in-slice features and 3D contextual information, resulting in improved segmentation accuracy. Dey et al. [
16] designed a cascaded model that utilized a 2D deep convolutional network to segment the liver and larger tumor regions, followed by a 3D network to handle smaller tumors, thereby enhancing segmentation accuracy in complex scenarios. Han et al. [
17] introduced a 2.5D deep CNN that integrated long-range connections from U-Net with short-range residual connections from ResNet, creating a deeper and wider architecture while retaining compatibility with 3D information. Gruber et al. [
18] compared two segmentation schemes: direct end-to-end segmentation using a 2D U-Net and a cascaded approach employing two 2D U-Nets. In the latter approach, the liver region was segmented first, and the region of interest (ROI) was extracted for subsequent tumor segmentation, demonstrating superior segmentation performance. Bi et al. [
19] developed a novel cascaded ResNet architecture with multi-scale fusion, achieving excellent boundary segmentation between the liver and lesions. Kaluva et al. [
20] utilized a densely connected full CNN (DenseNet) for fully automated, two-stage cascaded segmentation of the liver and tumors. Deng et al. [
21] combined a 3D densely connected network with a level set method to dynamically adjust segmentation parameters and initialize local segmentation windows, enabling precise tumor boundary detection and segmentation. Additionally, Liu et al. [
22] proposed a spatial feature fusion convolutional network that efficiently segmented both the liver and tumors from CT images.
These studies introduced techniques such as multi-scale modeling, cascaded segmentation, and dense connections, offering efficient solutions for liver and tumor segmentation while significantly improving segmentation performance. Notably, the nn-UNet, proposed during the MICCAI 2018 LiTS challenge [
23], has been recognized as one of the top-performing methods for 3D image segmentation tasks. Since then, 3D deep learning models have gained widespread popularity, frequently outperforming 2.5D and 2D models without the need for more complex preprocessing steps.
This paper introduces the ELANRes-MSCA-UNet model, an enhancement of the 3D U-Net architecture, which integrates the ELANRes residual module and the MSCA multi-scale convolutional attention module. A two-stage learning strategy is employed, wherein the liver region is segmented first, followed by tumor segmentation within the liver. This approach effectively enhances the accuracy of small-target segmentation and reduces false positives. By combining multi-scale modeling and boundary optimization, the model strikes a balance between global feature extraction and local detail refinement, leading to significant improvements in segmentation accuracy and robustness. The remainder of this paper is structured as follows:
Section 2 provides a detailed description of the proposed method;
Section 3 presents the experimental design and results analysis; and
Section 4 concludes the paper.
2. Methods
2.1. Methodology Workflow
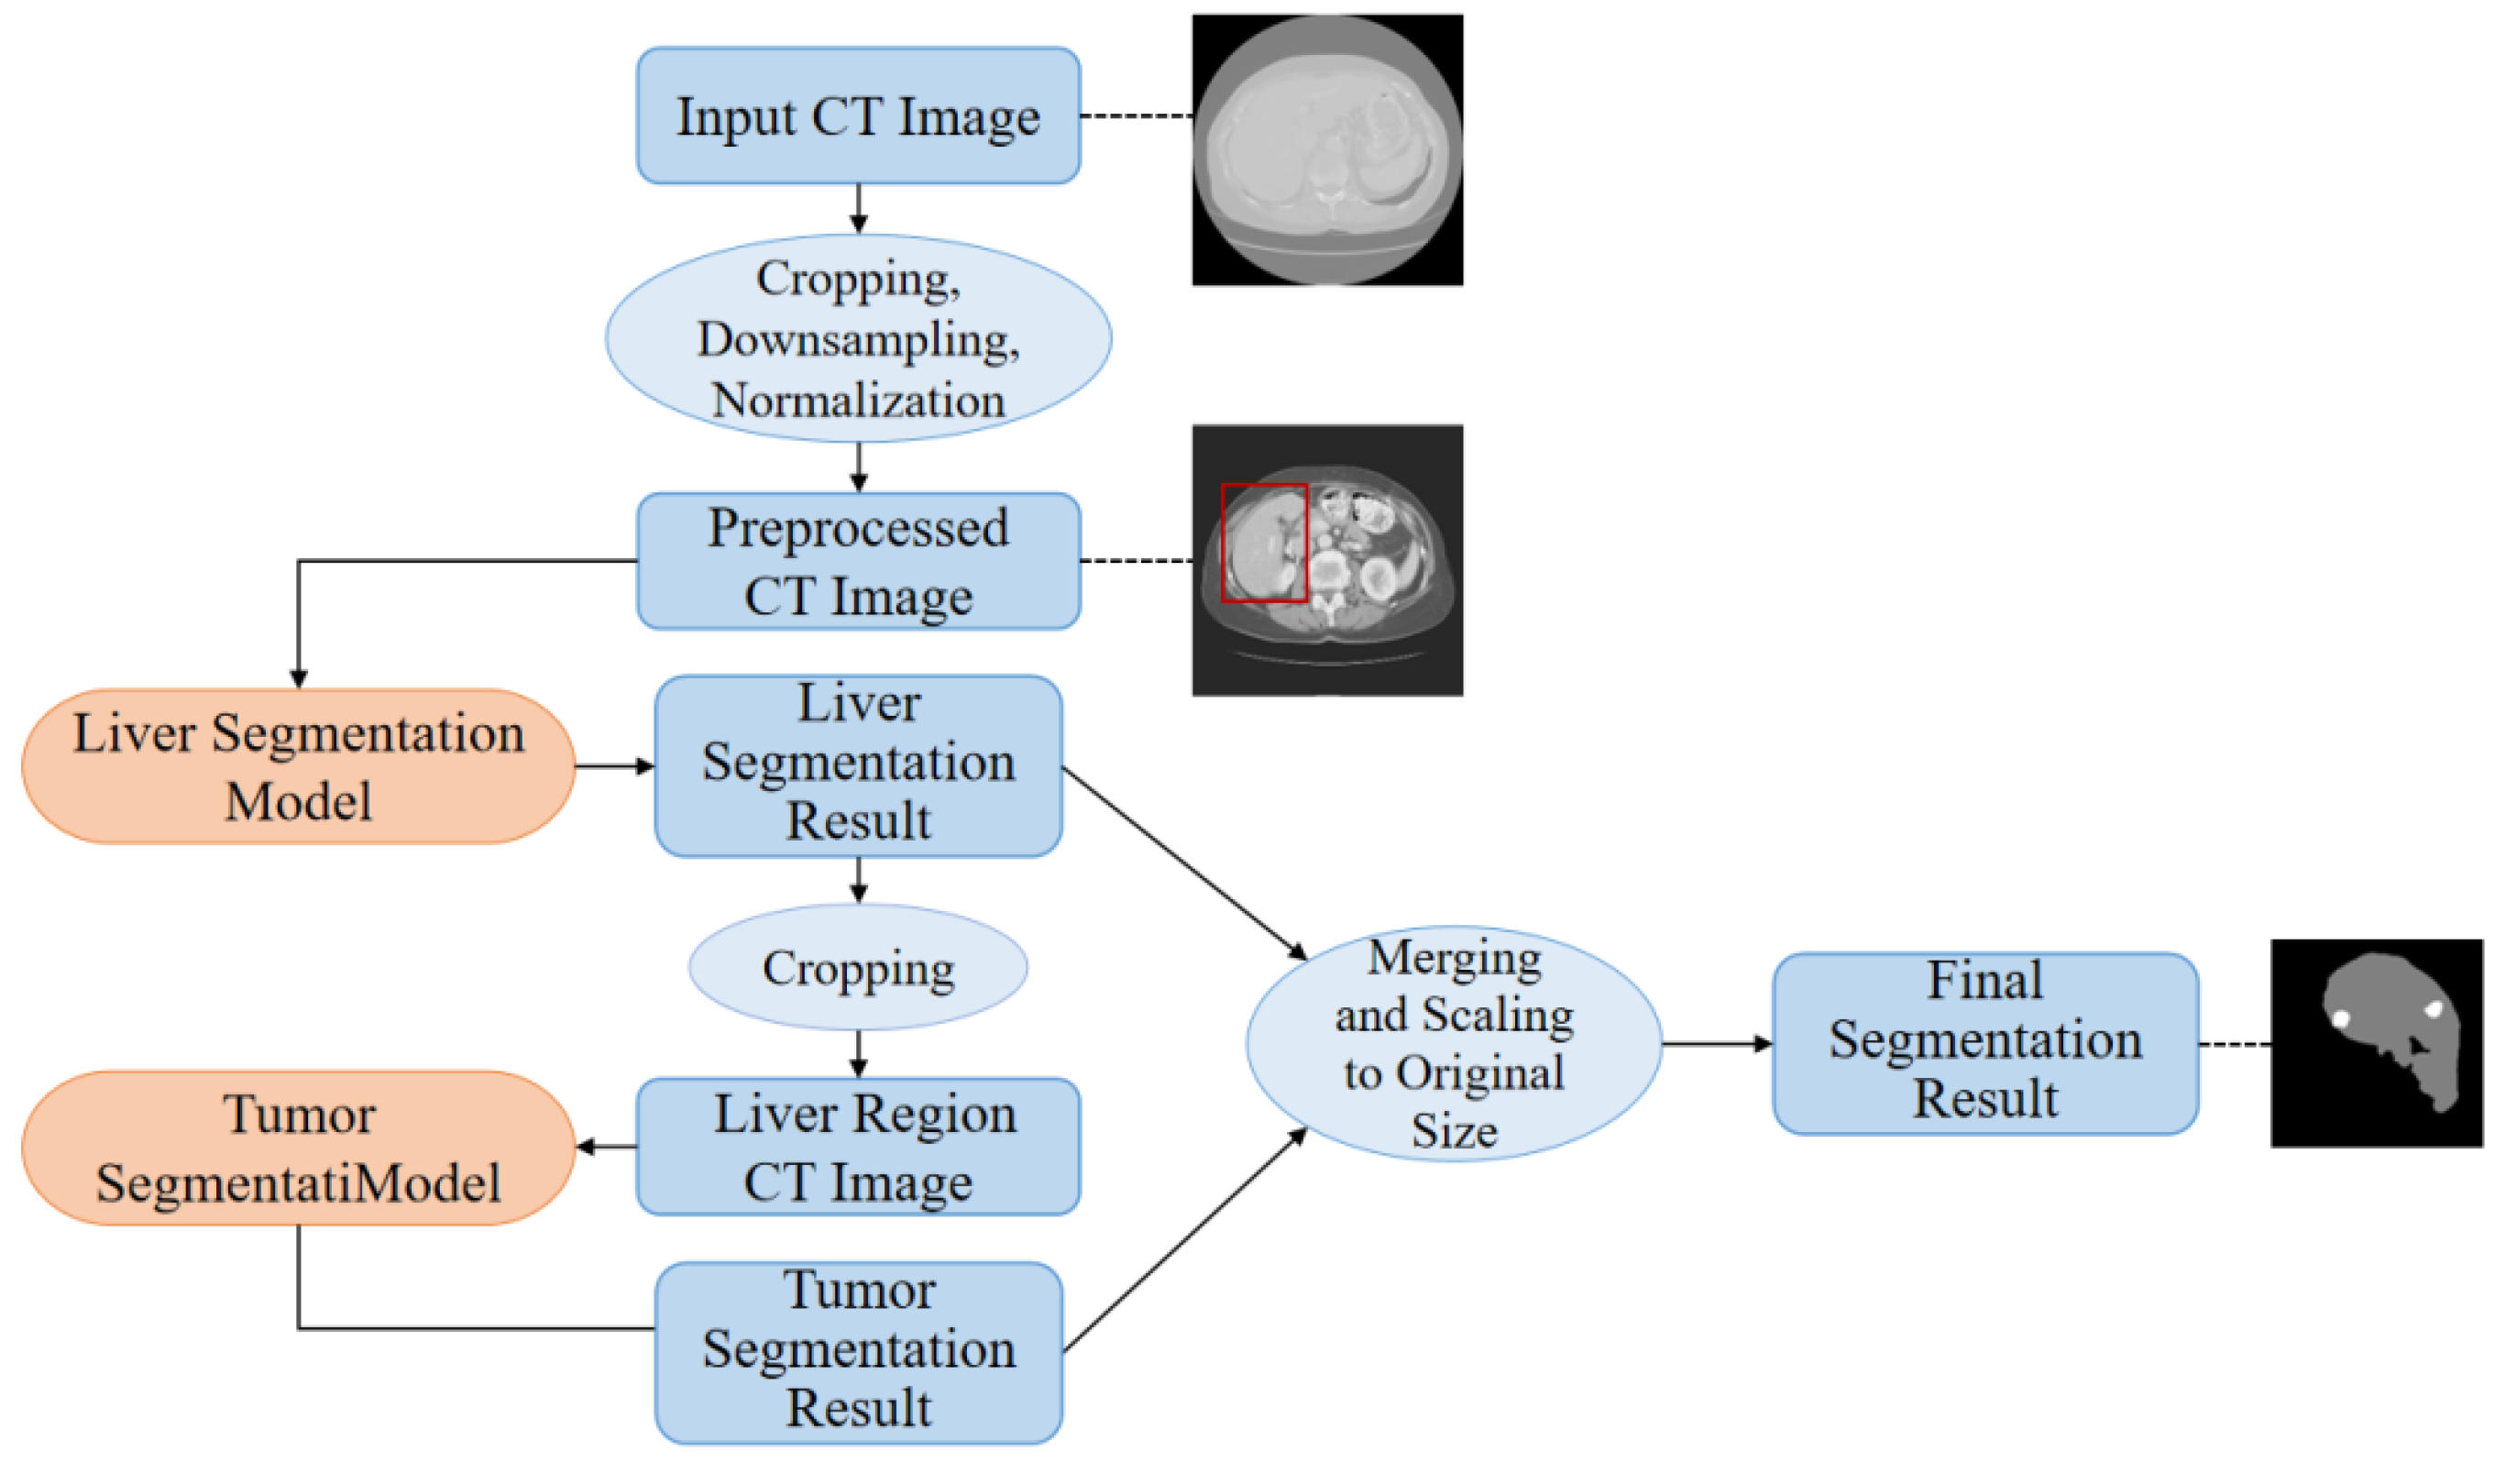
This paper proposes a high-precision liver and liver tumor segmentation method based on a two-stage strategy. The workflow, illustrated in
Figure 1, consists of four main components: data preprocessing, liver segmentation (first stage), tumor segmentation (second stage), and post-processing. The details are as follows: (1) Data Preprocessing: Threshold segmentation and morphological operations are initially applied to generate a body mask from the original CT images, which is used to crop the effective abdominal region. The cropped images are then downsampled and normalized, with the spatial resolution uniformly adjusted to 0.5 mm × 0.5 mm × 1.0 mm (where the x and y axes are halved from the original resolution, while the z-axis remains unchanged). CT intensity values are truncated to the range of -200 to 200 HU and normalized to a 0-1 range using a normalization factor of 200.0, providing standardized inputs for training the deep neural networks. (2) Liver Segmentation (First Stage): The proposed ELANRes-MSCA-UNet network is employed to accurately locate and segment the liver region from abdominal CT images, laying the foundation for subsequent tumor segmentation. This stage aims to minimize interference from non-liver tissues, ensuring a reliable liver region mask. (3) Tumor Segmentation (Second Stage): Using the liver mask generated in the first stage, tumor segmentation is confined to the liver region. By extracting tumor features within this specific area, interference from other tissues is eliminated, reducing tumor localization complexity and improving segmentation accuracy. Tumor segmentation also utilizes the ELANRes-MSCA-UNet network, which is independently trained to optimize tumor segmentation performance. (4) Post-Processing: The largest connected component method is applied to the liver segmentation results to remove false positive regions, ensuring the reliability of the segmentation output. The liver and tumor segmentation results are then combined, restored to the spatial position of the original CT image, and interpolated to match the original image size, producing the final prediction output.
This two-stage segmentation strategy optimizes liver and tumor segmentation tasks step by step, significantly improving segmentation accuracy and robustness.
2.2. Proposed ELANRes-MSCA-UNet Network
To address the challenges of medical image segmentation, including complex target morphology, multi-scale features, and blurred boundaries, this paper proposes a novel network architecture called ELANRes-MSCA-UNet. Building upon the classical 3D U-Net and inspired by the design principles introduced by Ding et al. [
24,
25,
26], the network incorporates a structurally re-parameterized residual module (ELANResBlock) and a multi-scale convolutional attention module (MSCABlock) into the 3D U-Net framework. These enhancements significantly improve the network’s feature extraction capabilities and segmentation accuracy, while maintaining high computational efficiency for tackling complex medical image segmentation tasks.
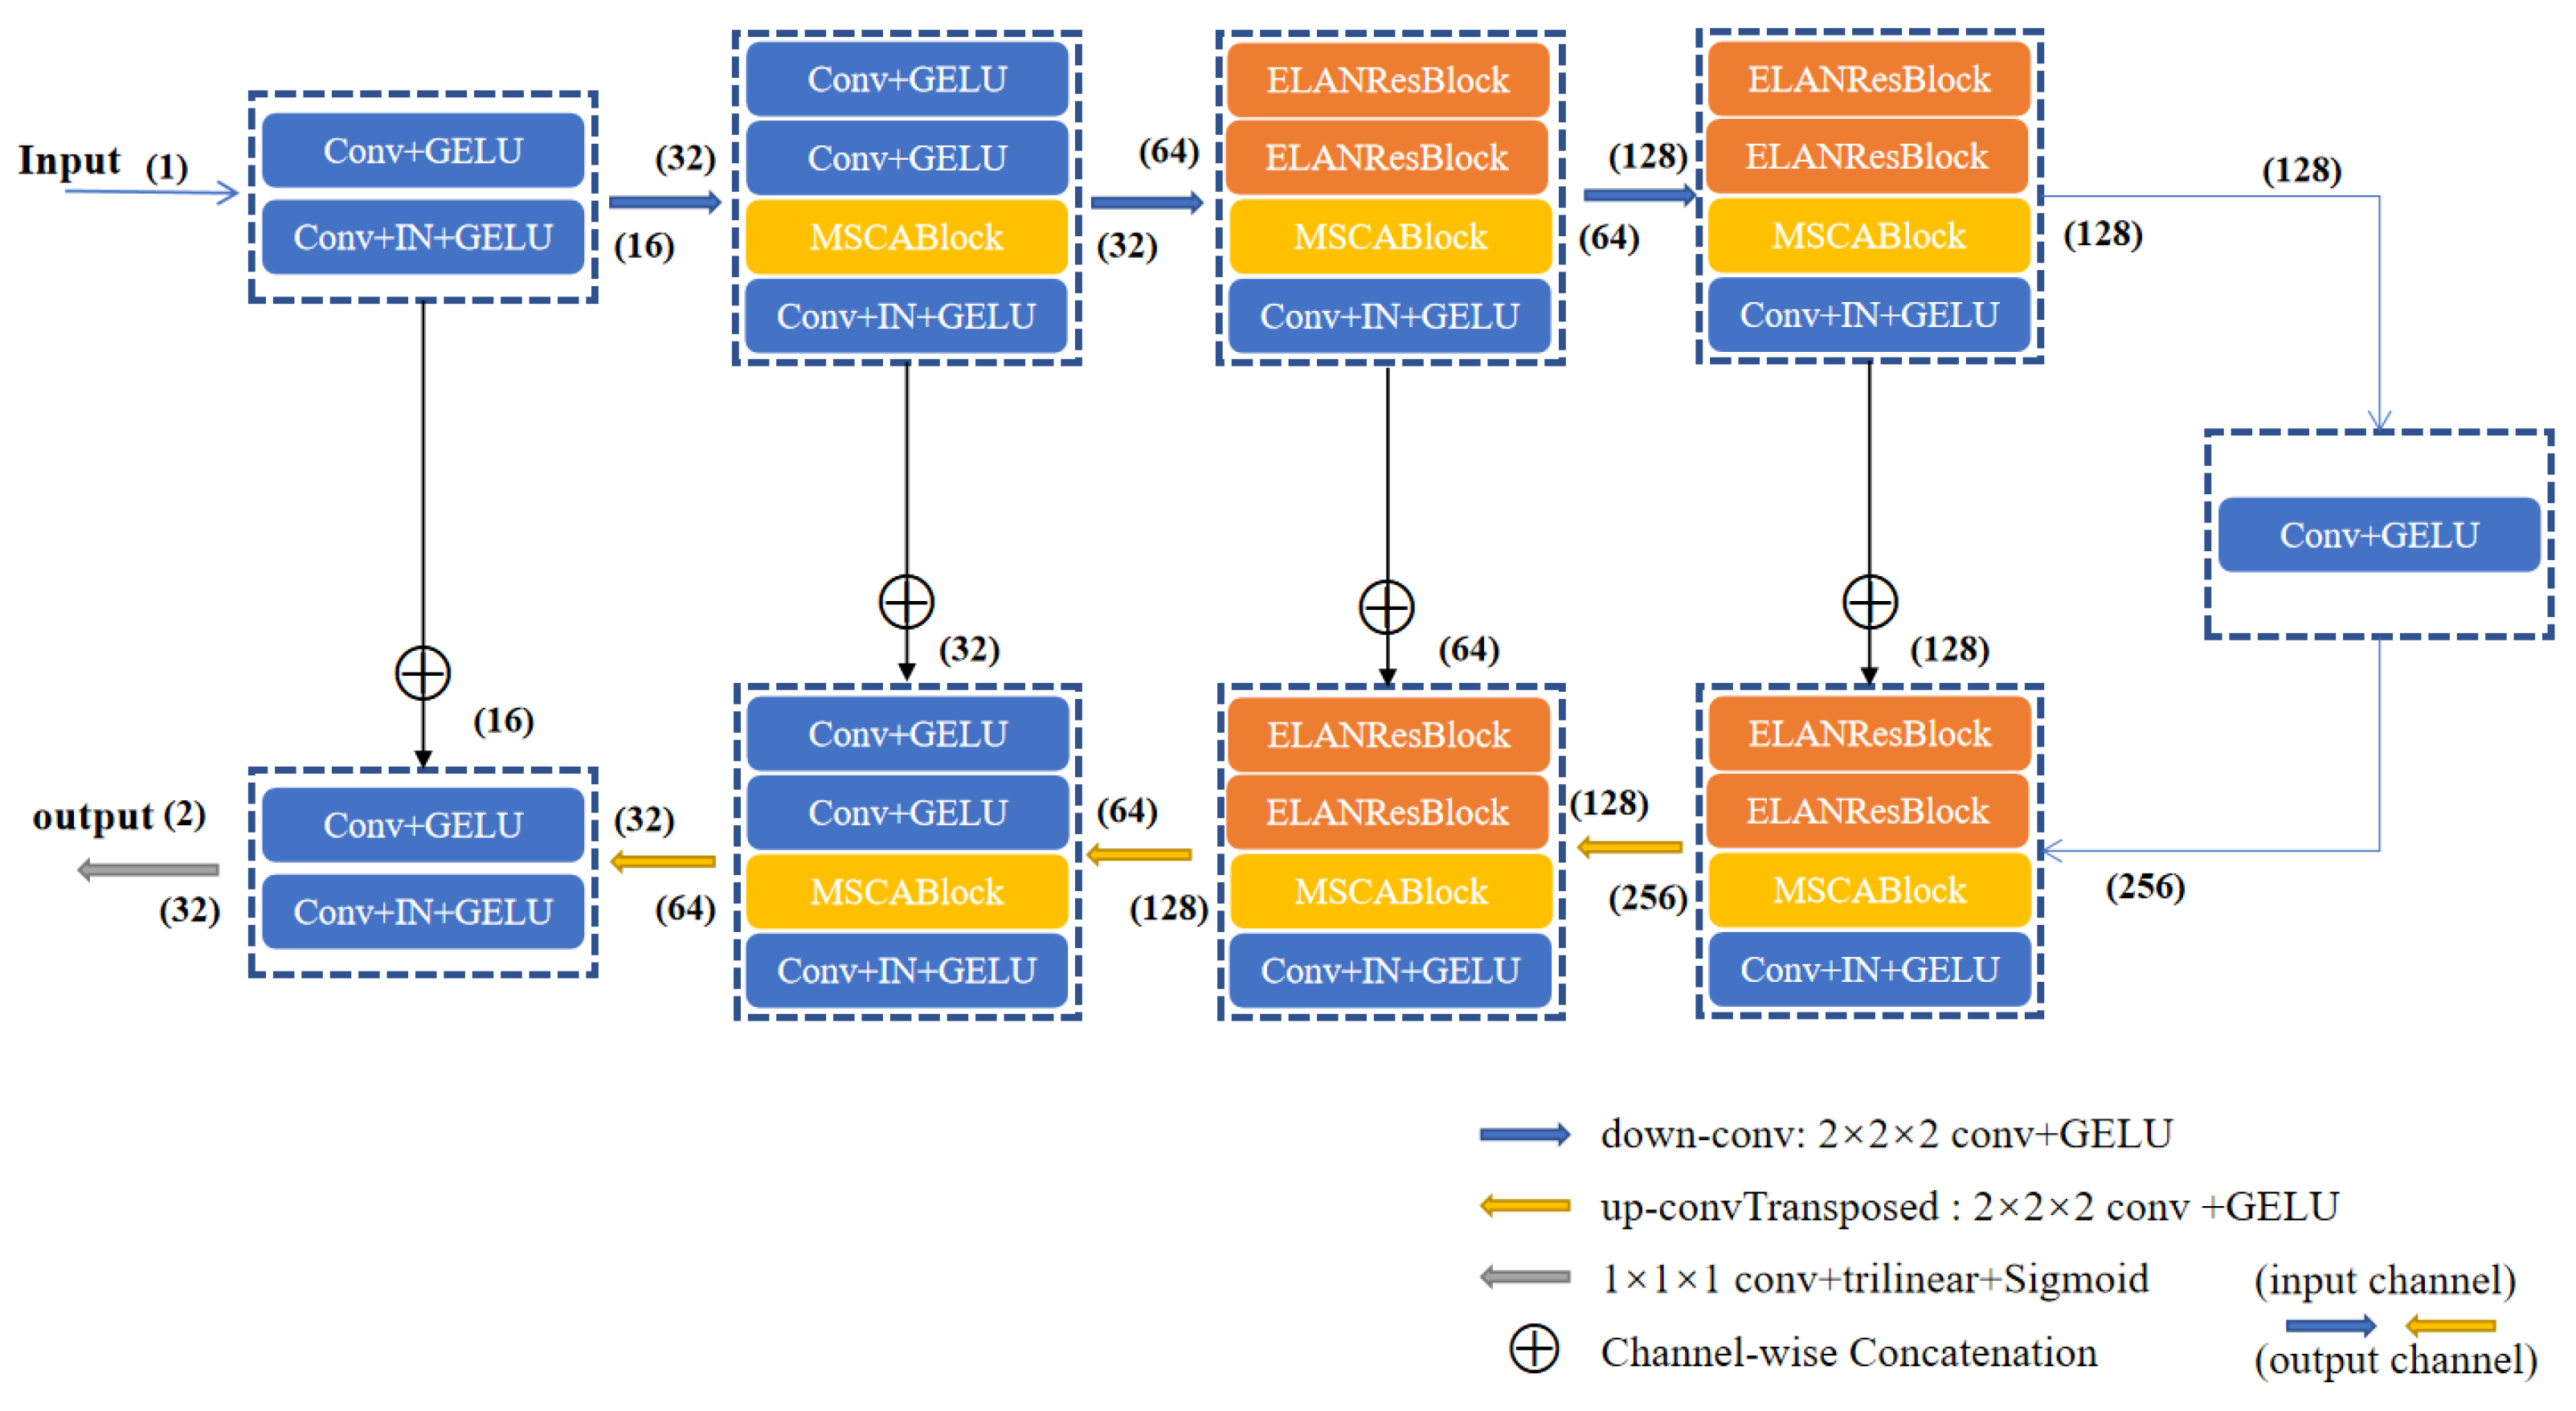
As shown in
Figure 2, the ELANRes-MSCA-UNet consists of four main components: an encoder, a decoder, a bottleneck layer, and skip connections. The encoder progressively extracts multi-scale features through downsampling, while the decoder incrementally restores spatial resolution through upsampling and refines the segmentation results by integrating features from the encoder. The bottleneck layer, acting as a critical bridge between the encoder and decoder, fuses multi-scale contextual features to provide high-level semantic information. Skip connections transfer high-resolution features from the encoder to the decoder via channel-wise concatenation, effectively mitigating information loss caused by downsampling. Finally, the network outputs high-resolution segmentation maps using a 1×1 convolution followed by trilinear upsampling. This design fully integrates semantic information across different scales, significantly enhancing segmentation accuracy.
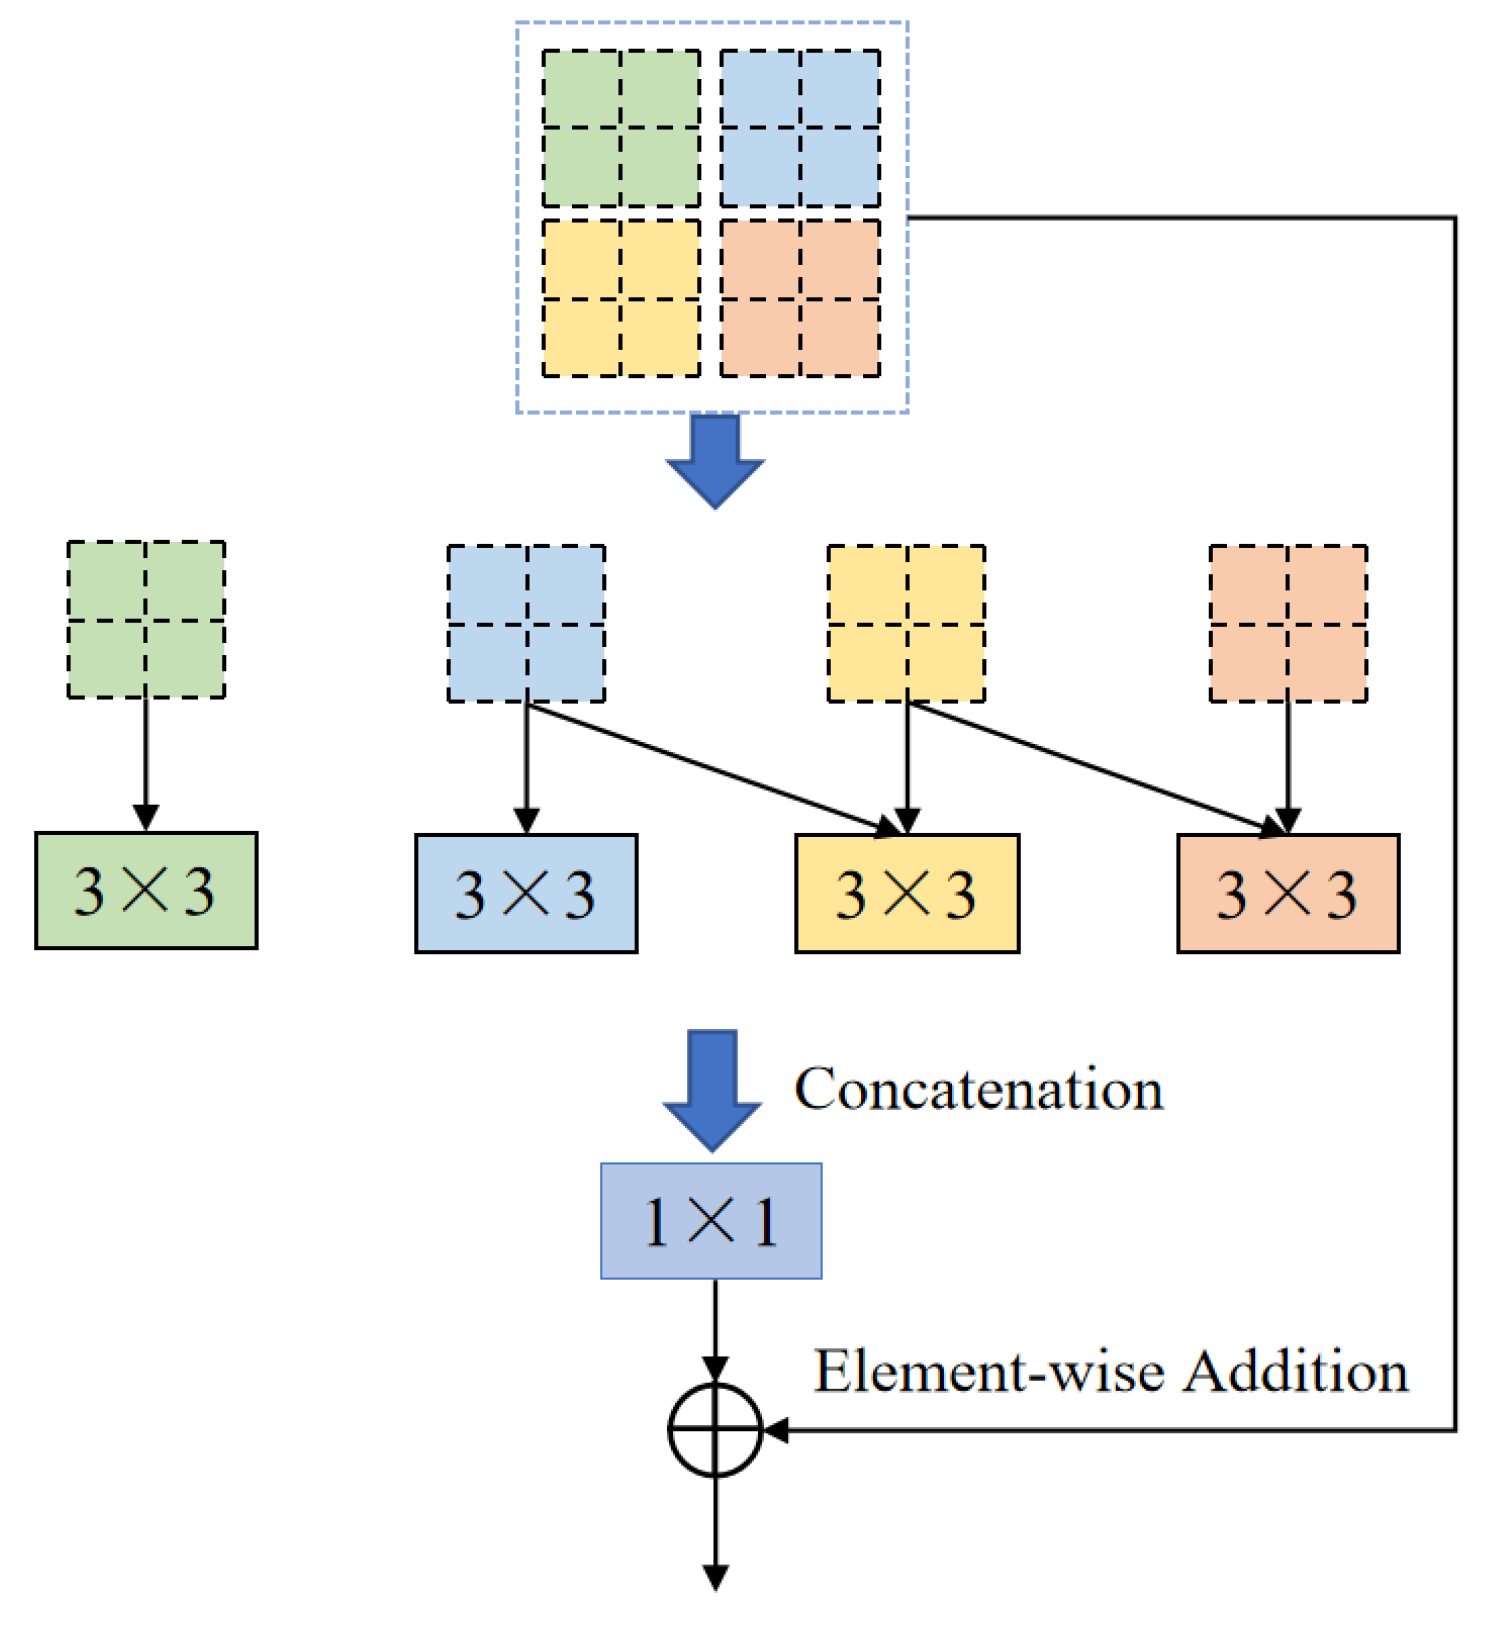
One of the core modules of ELANRes-MSCA-UNet, the ELANResBlock (illustrated in
Figure 3), extracts diverse feature representations using parallel 3×3 convolutions and employs 1×1 convolutions for channel fusion. This module incorporates structural re-parameterization technology, which enhances feature diversity during the training phase while collapsing the parallel convolutions into an equivalent single convolution during the inference phase. This design significantly boosts inference efficiency and reduces computational cost. By increasing feature representation capacity and minimizing network parameters, the ELANResBlock effectively optimizes the overall performance of the network.
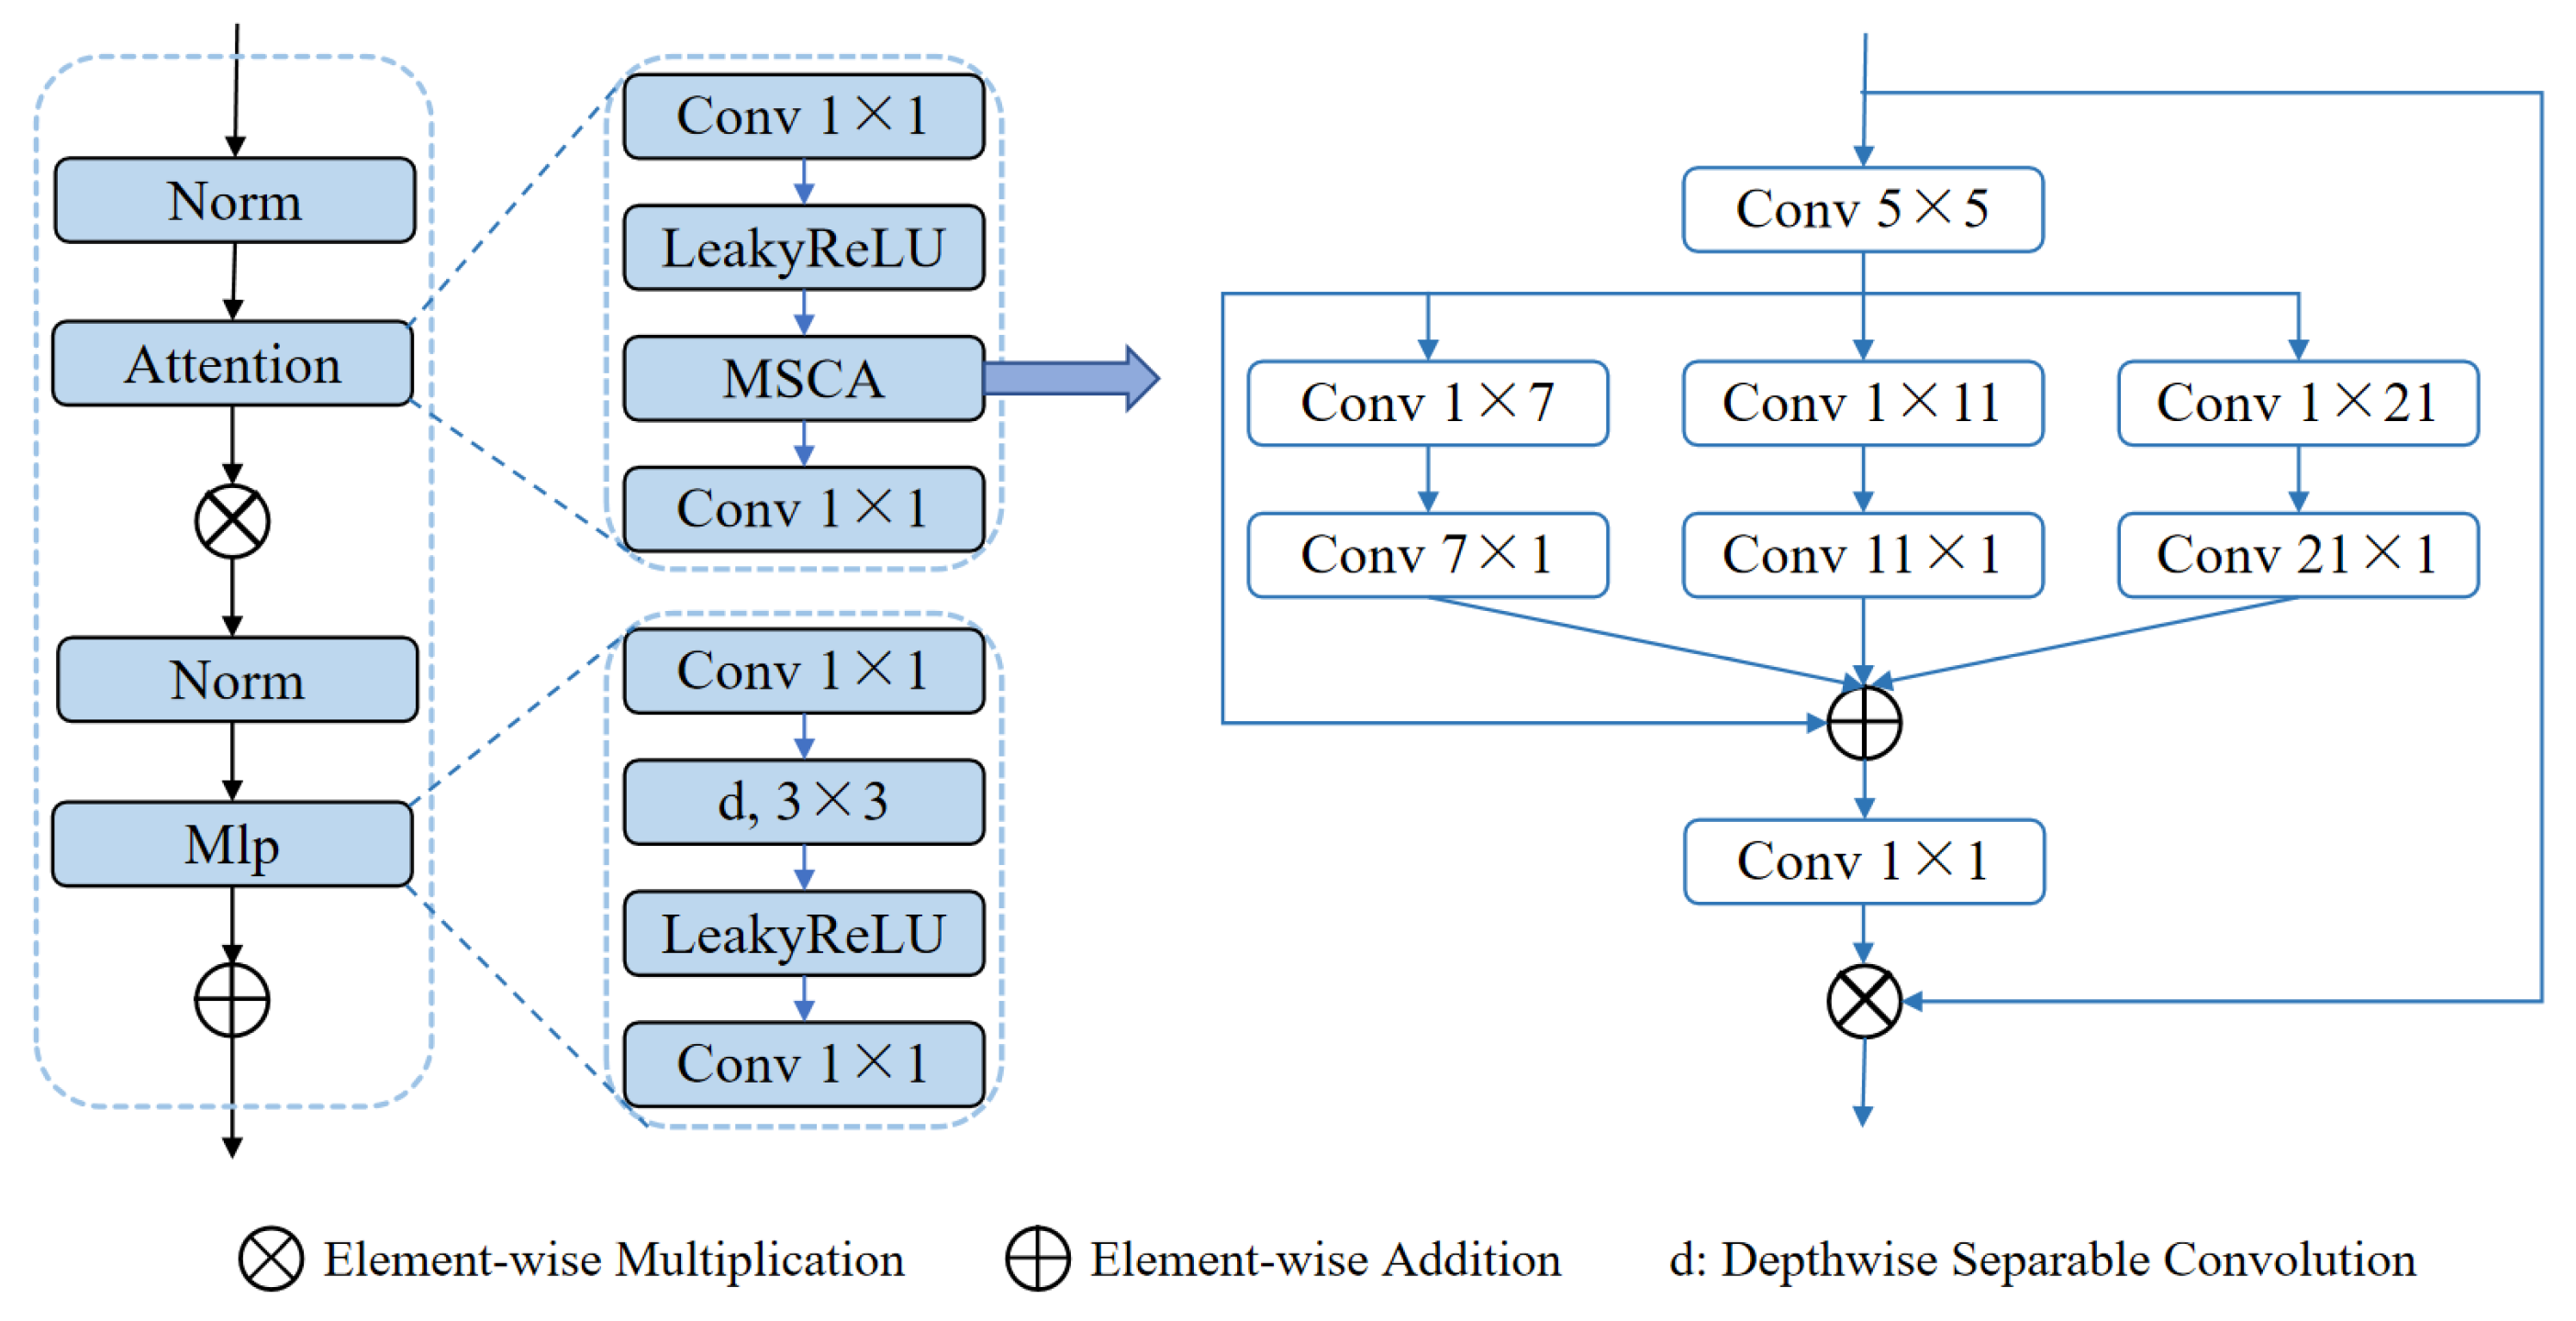
Another core module, the MSCABlock (illustrated in
Figure 4), captures rich contextual information through multi-scale convolutions and attention mechanisms. The module begins by normalizing the input features and extracting multi-level features using convolutional kernels of varying scales (5×5, 1×7+7×1, 1×11+11×1, 1×21+21×1). These features are subsequently fused via element-wise addition and refined through 1×1 convolutions for channel optimization. An embedded residual connection dynamically focuses on key feature regions, while a multi-layer perceptron (MLP) further enhances feature representation. Additionally, the module applies a 3D-to-2D transformation to exploit the efficiency of 2D convolutions, preserving both global and local multi-scale information. This design significantly enhances segmentation performance in complex scenarios.
By integrating the ELANResBlock and MSCABlock, the ELANRes-MSCA- UNet strikes an effective balance between feature extraction, multi-scale contextual modeling, and computational efficiency. This architecture exhibits exceptional segmentation performance, offering a novel and robust solution for medical image segmentation tasks.
2.3. Loss Function Combination and Deep Supervision Mechanism
To improve the model’s performance in segmentation tasks, particularly in addressing class imbalance and small-target segmentation challenges, multiple loss functions were designed and combined. By employing a weighted combination of these loss functions, complementary advantages across different tasks are achieved, effectively optimizing overall segmentation performance. These functions are specifically tailored to enhance segmentation accuracy, improve boundary recovery, and increase the model’s sensitivity to fine-grained targets.
Firstly, the Dice loss function was introduced to evaluate the overlap between predicted results and ground truth, effectively enhancing overall segmentation accuracy. To address class imbalance, the Tversky loss function was designed, assigning different weights to false positives and false negatives, thereby demonstrating strong adaptability in small-target segmentation scenarios. Additionally, to further enhance the model’s performance in complex segmentation tasks, a Hybrid Loss was proposed, combining Dice loss with Binary Cross-Entropy (BCE) loss to balance pixel-level classification accuracy with regional segmentation performance.
To address blurred boundaries, the Jaccard loss function (IoU loss) was employed, offering robust optimization for region overlap and providing strong support for fine boundary recovery. Additionally, to enhance the model’s performance in sparse small-target segmentation tasks, the Soft Spatial Loss (SSLoss) was designed. This loss function assigns different weights to target and non-target regions, significantly improving the model’s ability to capture small targets. Finally, to tackle blurred boundary regions in complex scenarios, an extended version of the ELDice loss function was proposed. This enhanced loss function incorporates logarithmic transformations and weighting mechanisms, further improving the model’s robustness in handling challenging segmentation tasks.
Here, Intersection refers to the intersection of the predicted results and the ground truth, while Union represents their union. is a smoothing term; and are the weights used to control the penalties for false positives and false negatives, respectively. is the weighting factor for the cross-entropy loss; and represent the loss weights for the target and non-target regions, respectively.
During training, the network’s multiple outputs correspond to feature maps at different scales, with each output optimized using its respective loss function. The specific loss calculation is as follows:
Here,
loss3 represents the loss for the final output, which typically has the highest resolution, while
loss0,
loss1, and
loss2 correspond to the losses of low-resolution outputs. Using a deep supervision mechanism, higher weights (
α=0.4) are assigned to the losses of low-resolution feature maps during the early training stage. These weights are gradually reduced in later stages, allowing the model to rely primarily on high-resolution outputs during the final stage. The weight
α decays periodically during the training process as follows:
This design accelerates model convergence and improves its performance in multi-scale segmentation tasks.
2.4. Evaluation Metrics
To comprehensively evaluate the model’s performance in liver and liver tumor segmentation tasks, multiple metrics were selected from various perspectives. These include the Dice Score (Dice), Average Symmetric Surface Distance (ASD), Relative Volume Difference (RVD), Precision, and Recall. Together, these metrics offer a holistic assessment of segmentation performance, addressing accuracy, geometric shape, volume discrepancy, and classification capability. For liver segmentation tasks, Dice and ASD are used as evaluation metrics, whereas all five metrics are applied to provide a comprehensive evaluation of liver tumor segmentation performance.
The Dice Score measures the overlap between the predicted results and ground truth, with higher values indicating more accurate segmentation. ASD evaluates the geometric deviation between the predicted and ground truth contours, where smaller values reflect segmentation boundaries that are closer to the ground truth. RVD quantifies the relative difference between the predicted and actual volumes, with values closer to 0 indicating better consistency between the predicted and true volumes. Precision represents the proportion of correctly identified positive samples within the predictions, while Recall measures the proportion of true positive samples that are correctly identified.
The formulas for calculating these metrics are presented in Equations (3)–(8), comprehensively addressing all critical aspects of segmentation performance and providing a reliable foundation for model evaluation.
Here, A and B represent the predicted result and ground truth region, respectively. TP、TN、FP and FN denote true positives, true negatives, false positives, and false negatives, respectively. S(A) and S(B) represent the boundary sets of the predicted region A and the ground truth region B, respectively. d(v,S(A)) represents the shortest distance from a point v to the boundary S(A) of region A.
3. Experiments and Results
3.1. Data and Implementation
We utilized the MICCAI 2017 LiTS Challenge dataset to train and test the automatic segmentation model [
27]. The LiTS dataset comprises abdominal CT images collected from seven different medical centers, including a total of 131 cases. Each case was manually annotated by radiation oncologists with liver and liver tumor contours serving as the ground truth. The pixel matrix size of the images is 512×512, with slice thicknesses ranging from 0.45 to 6.00 mm, in-plane resolutions between 0.56 and 1.00 mm, and the number of slices per case ranging from 42 to 1026, totaling 58,638 slices [
14].
For data allocation, 111 cases were used for training and validation, which were further divided into training and validation sets in a 3:1 ratio for model tuning. The remaining 20 cases were reserved as the test set to evaluate model performance. During evaluation, the model’s automatic segmentation results were compared with the ground truth annotations provided by radiation oncologists, enabling a quantitative assessment of segmentation accuracy and performance metrics.
Model training was performed using the Adam optimizer with a step decay learning rate schedule. The initial learning rate was set to 0.0001 [
28], and it was reduced by 20% every 30 epochs. This strategy effectively mitigated instability caused by an excessively large learning rate while gradually decreasing the learning rate in the later training stages to facilitate fine-tuning of the network.
The experiments were conducted in a Windows 10 64-bit operating system environment, with hardware configurations including an Intel Xeon Gold 6132 processor, 128 GB of RAM, and an NVIDIA TITAN RTX GPU. All experiments were implemented using Python 3.9 and the PyTorch 2.0 (GPU version) deep learning framework.
3.2. Ablation
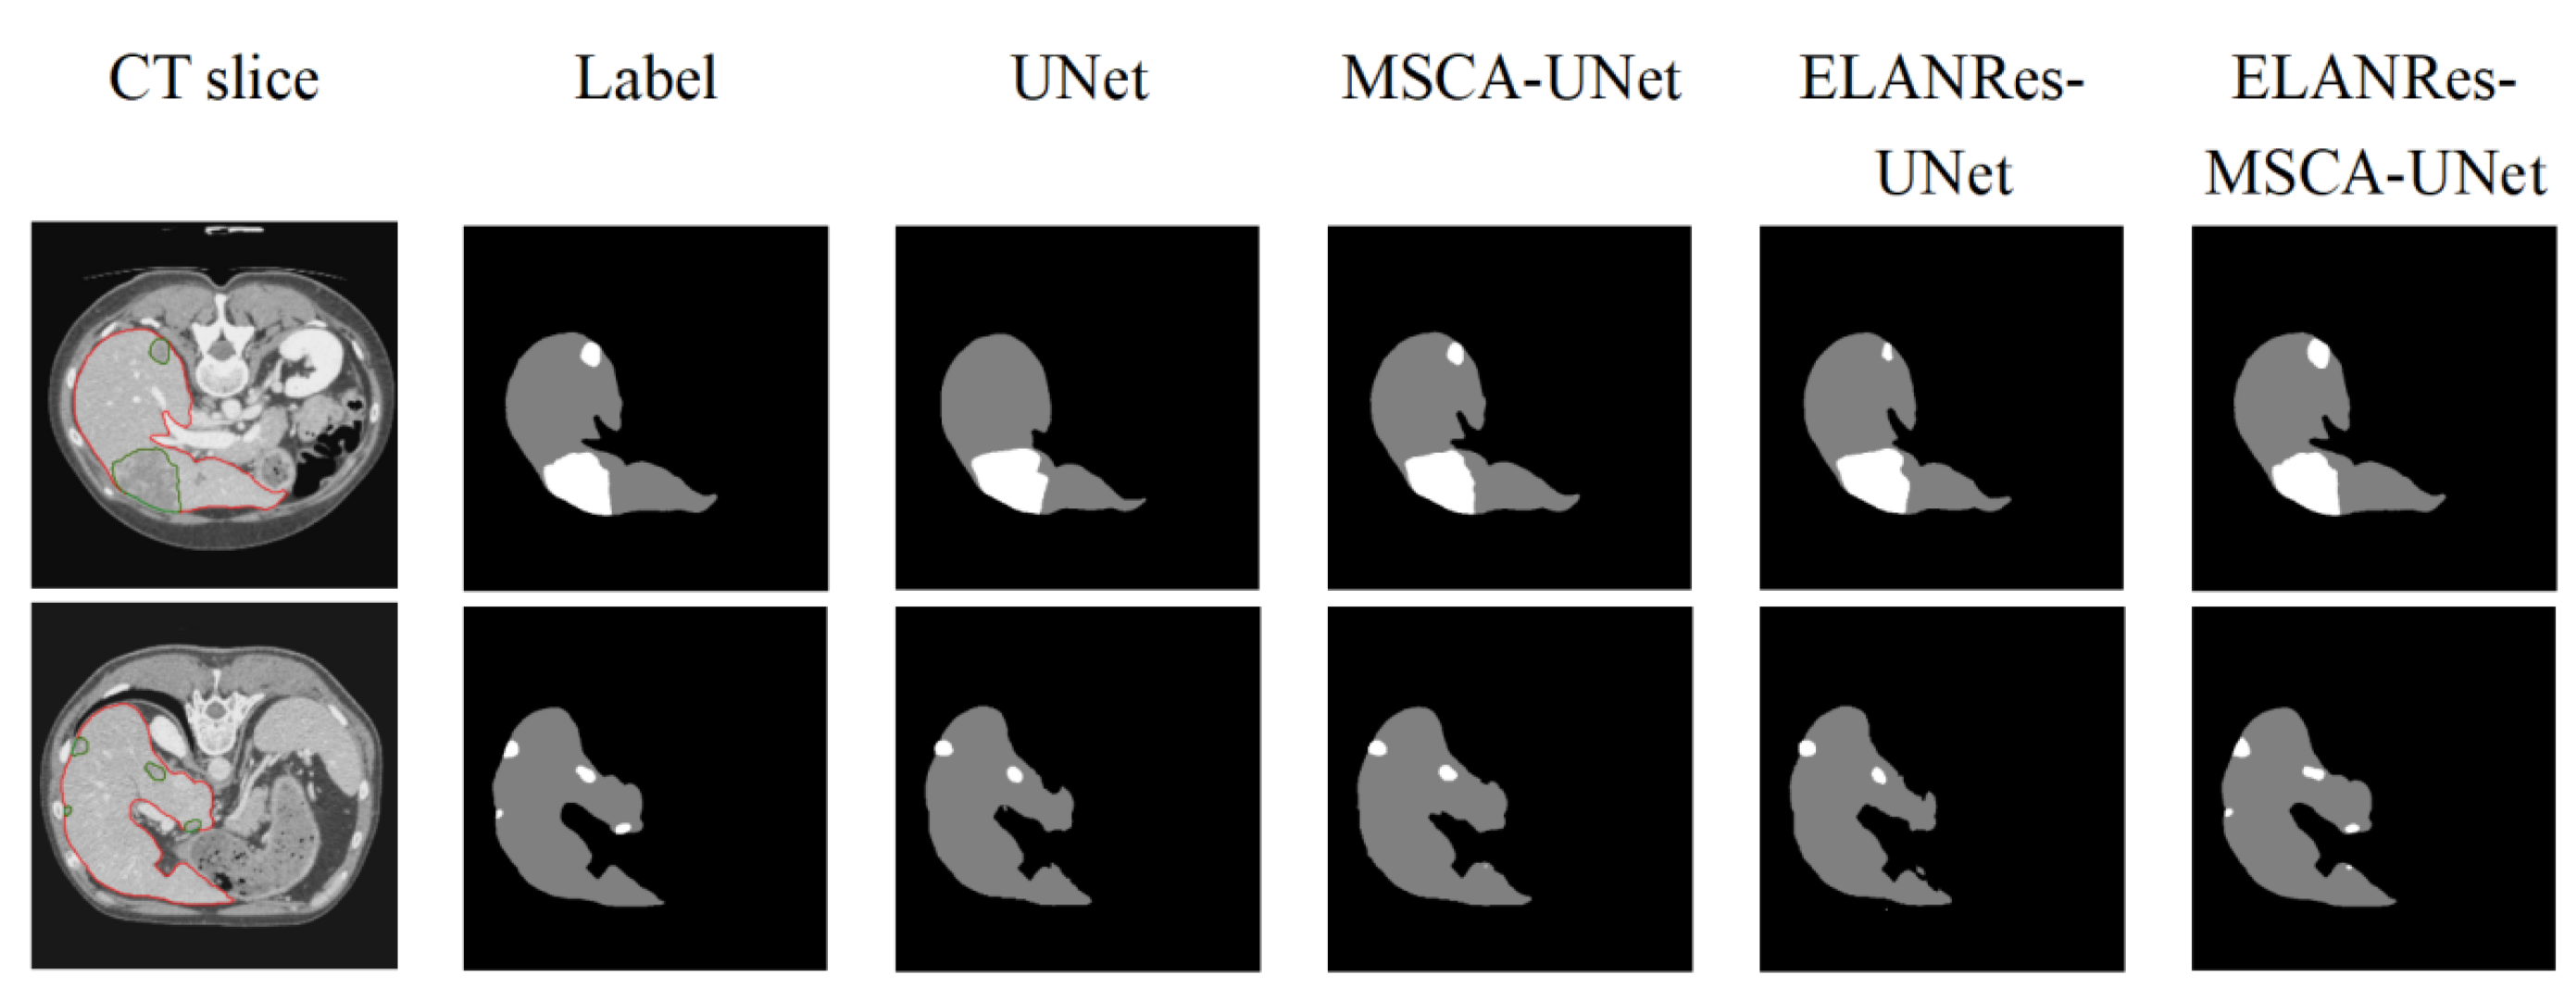
To comprehensively evaluate the effectiveness of the ELANRes-MSCA-UNet network, we conducted ablation experiments to analyze the specific contributions of the MSCA module, the ELANRes module, and their combined use on model performance. The experiments included four model configurations: (a) the baseline model, UNet; (b) MSCA-UNet, incorporating only the MSCA module; (c) ELANRes-UNet, incorporating only the ELANRes module; and (d) the complete model, ELANRes-MSCA-UNet, which combines both the MSCA and ELANRes modules.
As shown in
Table 1 and
Table 2, the complete model, ELANRes-MSCA-UNet, achieved the best performance across all evaluation metrics for the liver segmentation task, with a Dice score of 0.972 and an ASD of 1.263, significantly outperforming the other models. MSCA-UNet improved the Dice score from 0.937 in the baseline model to 0.946 by enhancing global feature modeling capabilities, while ELANRes-UNet excelled in boundary optimization, reducing the ASD from 3.242 in the baseline model to 2.369. By integrating the strengths of both modules, the complete model achieved synergistic improvements in global segmentation accuracy and boundary detail optimization.
For the liver tumor segmentation task, the complete model, ELANRes-MSCA- UNet, demonstrated exceptional performance, achieving a Dice score of 0.729 and an ASD of 1.012. It comprehensively outperformed other models in key metrics such as Precision, Recall, and RVD. These results indicate that the complete model not only accurately captures target regions but also excels in optimizing boundary details and reducing false positive rates. Further analysis revealed that the MSCA module enhances global contextual modeling, making it particularly effective in capturing small target features, while the ELANRes module excels in optimizing and refining complex boundaries. By integrating these two modules, the complete model achieved significant improvements in segmentation performance.
As shown in
Figure 5, the performance differences among the models in segmentation results are clearly evident. The baseline model, UNet, performs reasonably well in overall liver segmentation but exhibits noticeable missed and false segmentations in boundary details and tumor regions, particularly struggling to capture small tumors. MSCA-UNet enhances global feature extraction and improves tumor contour segmentation, but its ability to handle complex boundaries and small tumors remains limited. ELANRes-UNet demonstrates significant improvement in boundary optimization, effectively reducing false segmentations, yet it still faces challenges in modeling the integrity of small tumors. In contrast, the complete model, ELANRes-MSCA-UNet, achieves liver segmentation accuracy that is close to the ground truth (Label) and excels in boundary detection and detail refinement in tumor regions. It shows remarkable improvement in capturing small tumors, with a substantial reduction in missed segmentations.
In summary, the results of the ablation experiments demonstrate that the complete model, ELANRes-MSCA-UNet, effectively balances global modeling capability and local optimization by integrating the strengths of the MSCA and ELANRes modules. This integration significantly improves segmentation accuracy, enhances boundary optimization, and strengthens overall robustness, offering an efficient and reliable solution for medical image segmentation tasks in complex scenarios.
3.3. Comparison of Tumor Segmentation Performance Between Groups
In the tumor segmentation task, to further analyze the model’s performance in segmenting tumors of different sizes, the segmentation results were divided into two groups based on Dice scores: a High-performance group (Dice ≥ 0.6) and a Low-performance group (Dice < 0.6). For each group, the average major axis length of the segmented liver tumors was calculated and compared across different models.
As shown in
Table 3, the complete model, ELANRes-MSCA-UNet, achieved an average tumor major axis length of 18.16 mm in the Low-performance group, significantly outperforming the baseline model, UNet, which had an average length of 23.37 mm. This result highlights the distinct advantage of ELANRes-MSCA-UNet in segmenting small-sized tumor targets. In the High-performance group, the average tumor major axis lengths for the two models were 41.83 mm and 44.72 mm, respectively, with relatively small differences. These findings demonstrate that while the complete model performs consistently well in handling large-sized tumors, it exhibits superior performance in segmenting small targets.
In conclusion, ELANRes-MSCA-UNet, with its multi-scale modeling capability and boundary optimization mechanism, is particularly well-suited for complex scenarios involving tumors of varying sizes. Notably, in the segmentation of small tumor targets, the model achieves higher accuracy and robustness.
3.4. Comparision with State-of-the-Art Methods
To evaluate the effectiveness and robustness of the ELANRes-MSCA-UNet network in liver and liver tumor segmentation tasks, we compared its performance with state-of-the-art semantic segmentation methods, including those proposed by L. Bi et al., Y. Yuan et al., and F. Isensee et al., using the LiTS dataset.
As shown in
Table 4 and
Table 5, ELANRes-MSCA-UNet achieved the best performance in the liver segmentation task across both Dice and ASD metrics. Specifically, the Dice score reached 0.972, demonstrating a significant improvement over the best existing method (0.963 by Y. Yuan et al.). Although Y. Yuan et al.’s method showed a slight advantage in ASD, our method exhibited superior overall performance, highlighting its excellence in liver segmentation tasks.
For the liver tumor segmentation task, ELANRes-MSCA-UNet demonstrated significant advantages. As shown in the table, the model excelled in key metrics such as Dice and Precision, achieving scores of 0.729 and 0.564, respectively, significantly outperforming other existing methods. In comparison, while D. Xu et al.’s method showed a slight advantage in the ASD metric, it underperformed relative to our proposed model in core metrics such as Recall and Dice. These results indicate that ELANRes-MSCA-UNet is more effective in capturing target regions in complex scenarios, particularly in reducing false positives and optimizing boundary details.
Overall, ELANRes-MSCA-UNet integrates the strengths of multi-scale contextual modeling and structural re-parameterization, surpassing other networks in segmentation accuracy while exhibiting greater robustness. These findings validate its effectiveness and demonstrate its advancement in medical image segmentation tasks.
4. Discussion and Conclusions
This paper proposes a 3D network architecture, ELANRes-MSCA-UNet, for automatic liver and liver tumor segmentation. By integrating the structurally re-parameterized residual module (ELANRes) and the multi-scale convolutional attention module (MSCA), the model demonstrates significant advantages in global feature modeling, boundary detail optimization, and small target segmentation. Experimental results reveal that the proposed model outperforms existing methods across multiple metrics, particularly excelling in small target segmentation and its adaptability to complex scenarios. The specific advantages are as follows:
(1) Significant improvement in segmentation performance: ELANRes-MSCA- UNet achieves remarkable improvements in liver and liver tumor segmentation tasks, showing outstanding performance in key metrics such as Dice and ASD. The model accurately captures target boundaries, reduces false positives and missed segmentations, and provides an efficient solution for complex medical image segmentation tasks.
(2) Robustness in small target segmentation: Through the integration of multi-scale convolution and attention mechanisms, the model exhibits excellent robustness in small tumor segmentation. Experiments demonstrate that ELANRes- MSCA-UNet significantly reduces missed segmentations of small targets and maintains consistent performance across tumor segmentation tasks of varying sizes, making it particularly effective in complex multi-scale segmentation scenarios.
(3) Innovative module design: The ELANRes module enhances feature extraction capabilities and reduces inference costs through structural re-parameterization technology, while the MSCA module captures global contextual information using multi-scale convolution and attention mechanisms. This design improves the model’s adaptability to low-contrast and blurred boundaries. Additionally, the weighted combination of multiple loss functions (e.g., Dice loss and Tversky loss) further enhances segmentation accuracy, particularly in addressing class imbalance and recovering fine details.
(4) Broad potential for clinical applications: ELANRes-MSCA-UNet offers reliable support for clinical tasks such as tumor volume assessment, growth trend analysis, and treatment planning. Its high-precision and robust segmentation results highlight the model’s broad potential for practical applications in medical image segmentation, making it highly suitable for complex clinical scenarios.
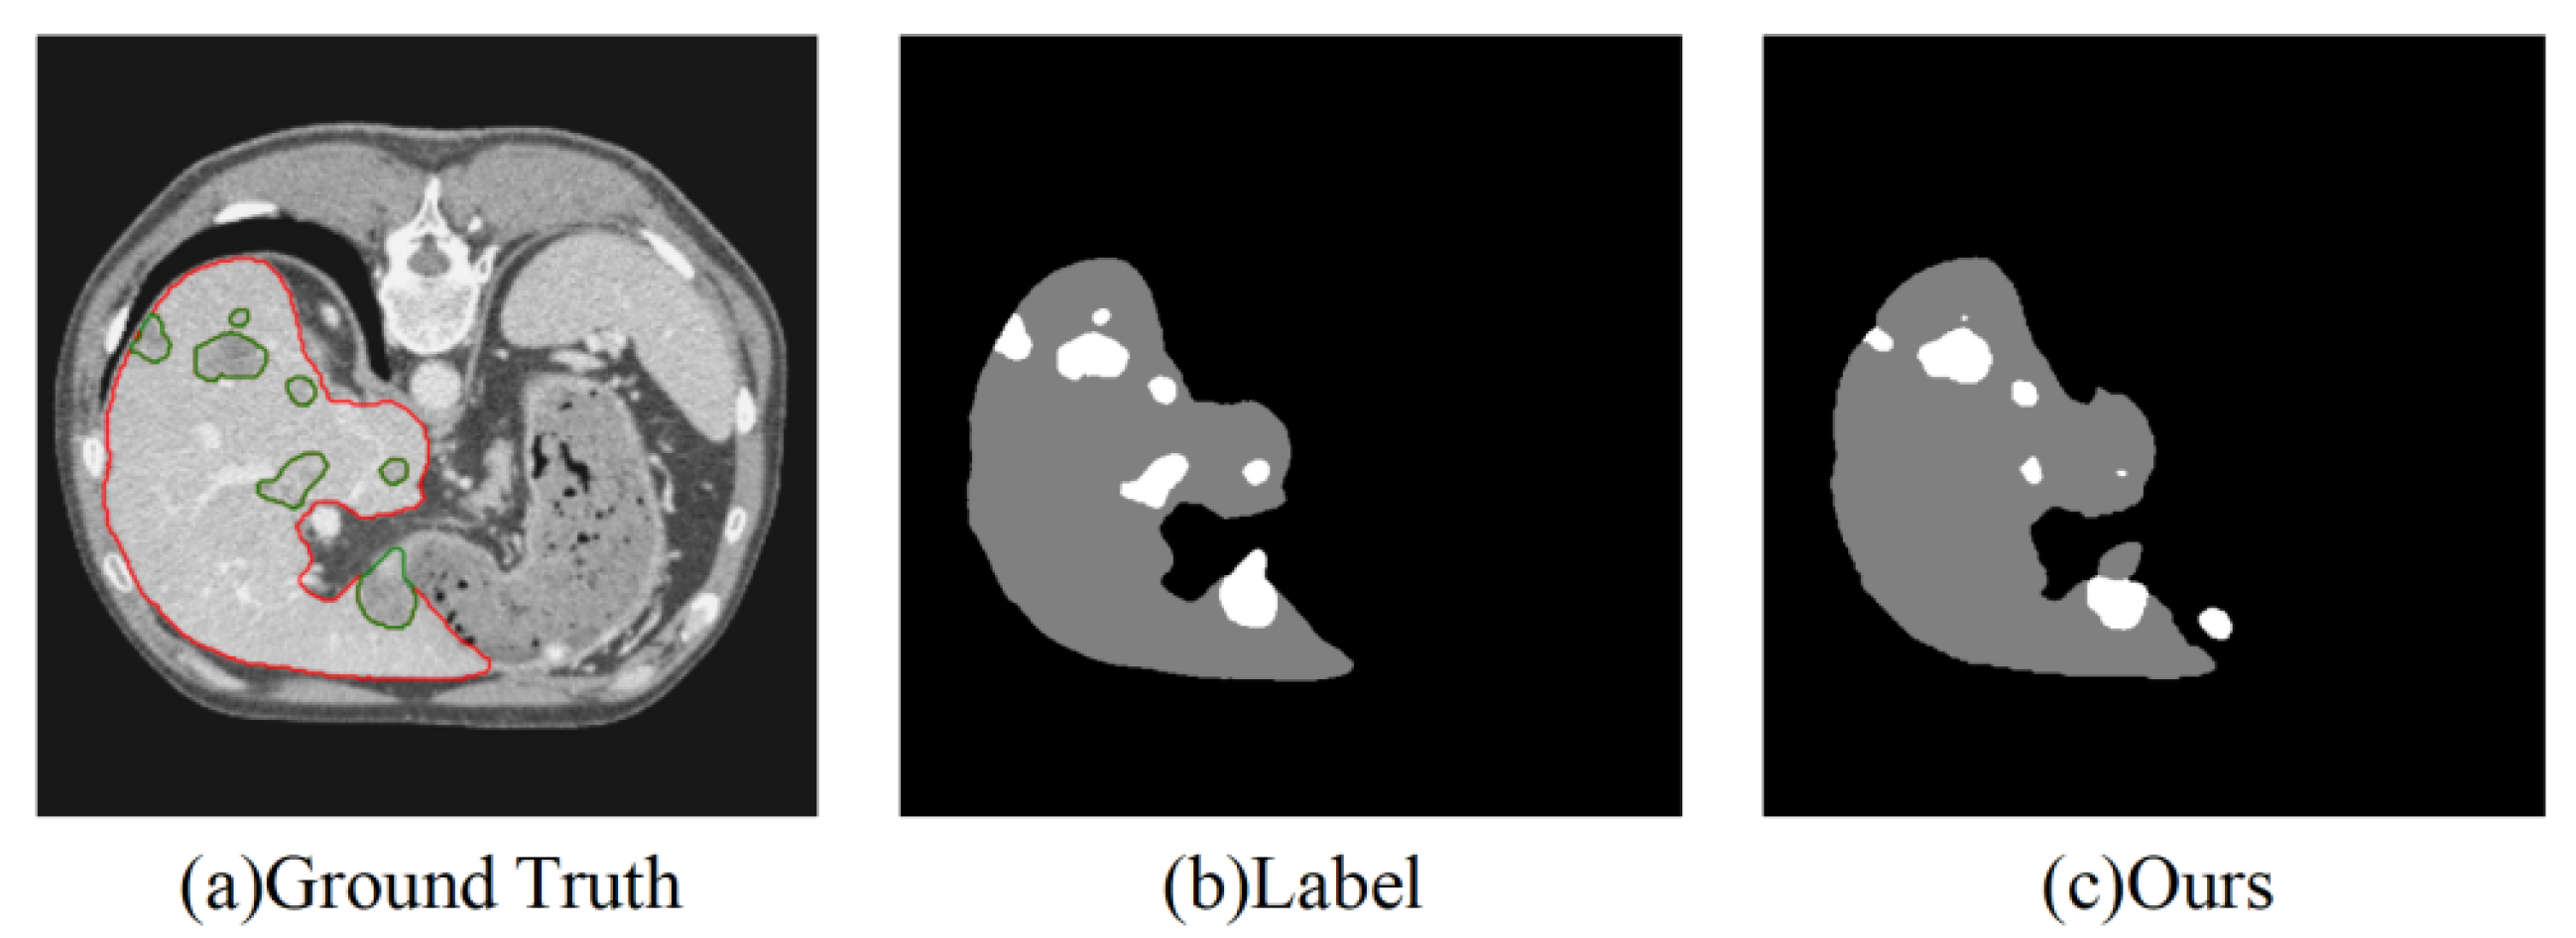
Despite the excellent segmentation performance of our model, it still has the following limitations, as shown in
Figure 6:
(1) Segmentation of very small tumors: The model may still miss segmenting very small tumors, primarily due to the weak feature representation of small targets.
(2) Accuracy in multi-target segmentation: When the number of tumors is large and their distribution is complex, the segmentation performance may become unstable.
(3) High computational resource requirements: The network demands significant computational resources during the inference stage, which may limit its applicability in resource-constrained environments.
Future work will focus on optimizing the lightweight design of the network to improve computational efficiency while enhancing its robustness in small-target and multi-target segmentation. These improvements aim to better adapt the model to more complex clinical application scenarios.
Author Contributions
Conceptualization: Z.S. and S.W.; methodology: Z.S. and W.W.; software: Z.S. and W.W.; validation: W.W. and S.W.; formal analysis: Z.S. and W.W.; investigation: Z.S. and S.W.; resources: W.W. and S.W.; data curation: Z.S., W.W. and S.W.; writing—original draft preparation: Z.S. and W.W.; writing—review and editing: Z.S. and S.W.; project administration: S.W. and W.W.; funding acquisition: W.W. and S.W. All authors have read and agreed to the published version of the manuscript.
Funding Information: This work was supported by the [R&D Program of the Beijing Municipal Education Commission] under Grant [Number KM202310025019); and [National Natural Science Foundation of China] under Grant [Number 61801312].
Funding Information
This work was supported by the [R&D Program of the Beijing Municipal Education Commission] under Grant [Number KM202310025019); and [National Natural Science Foundation of China] under Grant [Number 61801312].
Data Availability Statement
The raw data supporting the conclusions of this article may be provided upon reasonable requests for scientific research purposes.
Acknowledgments
The authors would like to thank the anonymous reviewers for their valuable comments and suggestions.
Conflicts of Interest
The authors declared they have no competing interests. The authors alone are responsible for the content and writing of the paper.
References
- Chhikara, B.S.; Parang, K. Global Cancer Statistics 2022: the trends projection analysis[J]. Chemical Biology Letters 2023, 10, 451–451. [Google Scholar]
- Luan, S.; Xue, X.; Ding, Y.; et al. Adaptive attention convolutional neural network for liver tumor segmentation[J]. Frontiers in Oncology 2021, 11, 680807. [Google Scholar] [CrossRef]
- Tomoshige, S.; Oost, E.; Shimizu, A.; et al. A conditional statistical shape model with integrated error estimation of the conditions; application to liver segmentation in non-contrast CT images[J]. Medical image analysis 2014, 18, 130–143. [Google Scholar] [CrossRef] [PubMed]
- Wang X, Yang J, Ai D, et al. Adaptive mesh expansion model (AMEM) for liver segmentation from CT image[J]. PLoS one 2015, 10, e0118064.
- Park, H.; Bland, P.H.; Meyer, C.R. Construction of an abdominal probabilistic atlas and its application in segmentation[J]. IEEE Transactions on medical imaging 2003, 22, 483–492. [Google Scholar] [CrossRef] [PubMed]
- Xu, Z.; Burke, R.P.; Lee, C.P.; et al. Efficient multi-atlas abdominal segmentation on clinically acquired CT with SIMPLE context learning[J]. Medical image analysis 2015, 24, 18–27. [Google Scholar] [CrossRef] [PubMed]
- Wu, W.; Zhou, Z.; Wu, S.; et al. Automatic liver segmentation on volumetric CT images using supervoxel-based graph cuts[J]. Computational and mathematical methods in medicine 2016, 2016, 9093721. [Google Scholar] [CrossRef] [PubMed]
- Soler, L.; Delingette, H.; Malandain, G.; et al. Fully automatic anatomical, pathological, and functional segmentation from CT scans for hepatic surgery[J]. Computer Aided Surgery 2001, 6, 131–142. [Google Scholar] [CrossRef] [PubMed]
- Linguraru, M.G.; Richbourg, W.J.; Liu, J.; et al. Tumor burden analysis on computed tomography by automated liver and tumor segmentation[J]. IEEE transactions on medical imaging 2012, 31, 1965–1976. [Google Scholar] [CrossRef] [PubMed]
- Moltz, J.H.; Bornemann, L.; Kuhnigk, J.M.; et al. Advanced segmentation techniques for lung nodules, liver metastases, and enlarged lymph nodes in CT scans[J]. IEEE Journal of selected topics in signal processing 2009, 3, 122–134. [Google Scholar] [CrossRef]
- Massoptier, L.; Casciaro, S. A new fully automatic and robust algorithm for fast segmentation of liver tissue and tumors from CT scans[J]. European radiology 2008, 18, 1658–1665. [Google Scholar] [CrossRef] [PubMed]
- Conze, P.H.; Noblet, V.; Rousseau, F.; et al. Scale-adaptive supervoxel-based random forests for liver tumor segmentation in dynamic contrast-enhanced CT scans[J]. International journal of computer assisted radiology and surgery 2017, 12, 223–233. [Google Scholar] [CrossRef] [PubMed]
- Christ, P.F.; Elshaer ME, A.; Ettlinger, F.; et al. Automatic liver and lesion segmentation in CT using cascaded fully convolutional neural networks and 3D conditional random fields[C]//Medical Image Computing and Computer-Assisted Intervention–MICCAI 2016: 19th International Conference, Athens, Greece, October 17-21, 2016, Proceedings, Part II 19. Springer International Publishing, 2016: 415-423.
- Bilic, P.; Christ, P.; Li, H.B.; et al. The liver tumor segmentation benchmark (lits)[J]. Medical Image Analysis 2023, 84, 102680. [Google Scholar] [CrossRef] [PubMed]
- Li, X.; Chen, H.; Qi, X.; et al. H-DenseUNet: hybrid densely connected UNet for liver and tumor segmentation from CT volumes[J]. IEEE transactions on medical imaging 2018, 37, 2663–2674. [Google Scholar] [CrossRef] [PubMed]
- Dey, R.; Hong, Y. Hybrid cascaded neural network for liver lesion segmentation[C]//2020 IEEE 17th International Symposium on Biomedical Imaging (ISBI). IEEE, 2020: 1173-1177.
- Han, X. Automatic liver lesion segmentation using a deep convolutional neural network method[J]. arXiv:1704.07239, 2017.
- Gruber N, Antholzer S, Jaschke W; et al. A joint deep learning approach for automated liver and tumor segmentation[C]//2019 13th International conference on Sampling Theory and Applications (SampTA). IEEE, 2019: 1-5.
- Bi, L.; Kim, J.; Kumar, A.; et al. Automatic liver lesion detection using cascaded deep residual networks[J]. arXiv:1704.02703, 2017.
- Kaluva K C, Khened M, Kori A; et al. 2D-densely connected convolution neural networks for automatic liver and tumor segmentation[J]. arXiv preprint arXiv:1802.02182, 2018.
- Deng, Z.; Guo, Q.; Zhu, Z. Dynamic regulation of level set parameters using 3D convolutional neural network for liver tumor segmentation[J]. Journal of healthcare engineering 2019, 2019, 4321645. [Google Scholar] [CrossRef] [PubMed]
- Liu, T.; Liu, J.; Ma, Y.; et al. Spatial feature fusion convolutional network for liver and liver tumor segmentation from CT images[J]. Medical physics 2021, 48, 264–272. [Google Scholar] [CrossRef] [PubMed]
- Isensee, F.; Jaeger, P.F.; Kohl SA, A.; et al. nnU-Net: a self-configuring method for deep learning-based biomedical image segmentation[J]. Nature methods 2021, 18, 203–211. [Google Scholar] [CrossRef] [PubMed]
- Ding, X.; Zhang, X.; Ma, N.; et al. Repvgg: Making vgg-style convnets great again[C]//Proceedings of the IEEE/CVF conference on computer vision and pattern recognition. 2021, 13733–13742.
- Shao, H.; Zeng, Q.; Hou, Q.; et al. MCANet: Medical Image Segmentation with Multi-Scale Cross-Axis Attention[J]. arXiv:2312.08866, 2023.
- Goodfellow, I. Deep learning[J]. 2016.
- Vorontsov, E.; Tang, A.; Pal, C.; et al. Liver lesion segmentation informed by joint liver segmentation[C]//2018 IEEE 15th International Symposium on Biomedical Imaging (ISBI 2018). IEEE, 2018: 1332-1335.
- Liu, T.; Liu, J.; Ma, Y.; et al. Spatial feature fusion convolutional network for liver and liver tumor segmentation from CT images[J]. Medical physics 2021, 48, 264–272. [Google Scholar] [CrossRef] [PubMed]
- Yuan, Y. Hierarchical convolutional-deconvolutional neural networks for automatic liver and tumor segmentation[J]. arXiv:1710.04540, 2017.
- Chlebus G, Meine H, Moltz J H; et al. Neural network-based automatic liver tumor segmentation with random forest-based candidate filtering[J]. arXiv preprint arXiv:1706.00842, 2017.
- Yang D, Xu D, Zhou S K; et al. Automatic liver segmentation using an adversarial image-to-image network[C]//Medical Image Computing and Computer Assisted Intervention−MICCAI 2017: 20th International Conference, Quebec City, QC, Canada, September 11-13, 2017, Proceedings, Part III 20. Springer International Publishing, 2017: 507-515.
|
Disclaimer/Publisher’s Note: The statements, opinions and data contained in all publications are solely those of the individual author(s) and contributor(s) and not of MDPI and/or the editor(s). MDPI and/or the editor(s) disclaim responsibility for any injury to people or property resulting from any ideas, methods, instructions or products referred to in the content. |
© 2025 by the authors. Licensee MDPI, Basel, Switzerland. This article is an open access article distributed under the terms and conditions of the Creative Commons Attribution (CC BY) license (http://creativecommons.org/licenses/by/4.0/).