
Submitted:
26 September 2023
Posted:
26 September 2023
You are already at the latest version
Abstract
U-Net, based on a deep convolutional neural network (CNN), has been clinically used to au-to-segment normal organs and potentially target volumes. However, CNNs with local geometric dependencies may limit the accuracy of segmentation. Additionally, the performance of CNNs can vary depending on the selection of network hyper-parameters, which was mitigated by the proposition of nnU-Net. We chose a vision transformer architecture called VT U-Net, which features a self-attention excluding the convolution layer, to overcome the limitations of CNNs by utilizing global geometric information of images. The VT U-Net v.2 became more powerful thanks to the adaptive hyper-parameter optimizer embedded in nnU-Net. However, despite leveraging the benefits of nnU-Net, VT U-Net v.2 still had additional network hyper-parameters that needed to be optimally chosen. Accordingly, among various hyper-parameters, this study attempted to find the optimal combination of the patch size and the embedded dimension regarding the transformer. From the 4-fold cross-validation, the modified VT U-Net v.2 showed the highest average performance for planning target volume (PTV) segmentation among the investigated networks. Though nnU-Net was based on convolution layers, the adaptive hyper-parameter optimizers turned out to enhance the performance. It was also confirmed that network hyper-parameters affected the segmentation accuracy of vision transformers.
Keywords:
Transformer
; Hyper-Parameter Selection
; Planning Target Volume
; Auto-segmentation
; Prostate Cancer
; VT U-Net v.2
1. Introduction
Segmentation of tumors and normal organs is a crucial procedure in radiotherapy (RT) treatment planning because it shows the amount of radiation delivered to the target volume and the organs delineated in the optimized plan. However, this segmentation is often time-consuming and labor-intensive, requiring a steep learning curve. Furthermore, despite several automated methods proposed over the past few decades, their segmentation accuracy has been inconsistent, primarily due to their reliance on a limited number of patient cases [1,2,3,4]. Fortunately, the advent of deep neural networks empowered by advanced computing technology, particularly graphical processing units (GPUs), has opened up new possibilities for medical image segmentation [5,6]. This utilization of deep neural networks has led to a learning-based approach, with algorithmic development and assessment carried out using a significant amount of data divided into training and testing phases. Additionally, convolutional neural networks (CNNs) have been created by incorporating convolution operators into deep neural networks, enabling the training of networks using 2D or 3D images [7,8].
U-Net has succeeded in various CNN applications, particularly in medical image processing, using the convolutional layers and the skip connections between the encoder and decoder [9]. Among these applications, the normal organ segmentations in RT have been the most active area of research and development [10,11], resulting in the current availability of several software options for auto-segmentation. However, CNN-based frameworks have yet to be widely expanded to tumor segmentation while mainly focusing on segmenting normal organs in most cases [12]. One of the reasons for this limitation is the inherent challenges and variations in tumor segmentation. For example, unlike normal organs, tumors in medical images lack clear gradients or typical characteristics regarding shape, size, or location. Another reason is the shortcomings of CNN-based architectures, including the difficulty in optimizing network hyper-parameters and the excessive dependence on local imaging information. For example, there are hyper-parameters such as image size, learning rate, the depth of the network, and the kernel size of CNN that need to be determined by users, which can affect the segmentation accuracy. Additionally, the convolutional layers of CNN in the encoders and decoders extract and propagate the image features using a small kernel matrix, typically 3×3, which limits the exploration of the global spatial information of the images.
Several studies have addressed the drawbacks of CNN-based models for medical image segmentation. Although various U-Net variants have been developed to enhance segmentation accuracy, several studies by Isensee et al. in 2018 and 2021 showed that a well-trained U-Net was still the most effective approach for achieving better segmentation accuracy [13,14]. Furthermore, their studies have confirmed that it was true by completing the well-trained U-Net by the hyper-parameter optimization on nnU-Net. Meanwhile, a new type of network architecture, the transformer, has been introduced and actively developed in the context of deep learning. Transformers extract global and remote semantic information, crucial for dense prediction tasks, especially for 3D medical image segmentation [15,16]. Unlike CNNs, transformers suppress irrelevant areas of the input image and highlight salient features useful for a specific task [17]. The combination of CNN and transformer has been studied in the encoders of 2D and 3D networks, such as TransUNet and Unetr [18,19]. In TransUNet, CNN feature maps feed into the encoder of the transformer, while in Unetr, the features extracted from the transformer enter CNN layers. Recently, fully transformers with U-Net shapes have been introduced in one 2D and two 3D networks: Swin-Unet [16], nnFormer (almost fully) [20], and VT U-Net [21,22]. These fully transformers have the characteristics of a hierarchical shifted window in the U-shaped networks.
This study aims to enhance the precision of auto-segmentation for training networks using the whole pelvis target volume for prostate cancer patients, which contains extensive lymph nodes and lacks a clear gradient in image intensity. To achieve this goal, the study focused on using a new network architecture called a vision transformer, which can overcome the defects of CNN-based networks. Furthermore, the study aims to identify the optimal network hyper-parameters that may impact segmentation accuracy. The VT U-Net v.2 was selected for the whole pelvis planning target volume (PTV) segmentation for prostate cancer patients as featured in 1) a U-shaped transformer network architecture consisting of fully self-attention blocks and 2) a function of semi-hyper-parameter optimization for transformer, based on nnU-Net. Since the VT U-Net v.2 only partially accounted for some network hyper-parameters necessary for the vision transformer, the proposed study exploited additional hyper-parameter tuning and a newly defined loss function to address this limitation. It was demonstrated that the fully vision transformer network architecture integrating optimally chosen network hyper-parameters helps improve the performance in the whole pelvis PTV auto-segmentation for prostate cancer patients relative to CNN-based.
2. Materials and Methods
2.1. Transformer VT U-Net
This work adopted the fully vision transformer for prostate target volume auto-segmentation, specifically the VT U-Net featuring self-attentions without convolution layers in a U-shaped encoder and decoder. Self-attention is a crucial component of the transformer, enabling the representation of the degree of impact as a correlation by shifting a single sequence to different sequences, thus handling the global receptive field intrinsically [23,24,25,26]. Furthermore, instead of updating the convolution filters as typically done in a CNN [27], the self-attention mechanism updates three matrices in parallel, namely query (Q), key (K), and value (V) vectors.
Among hyper-parameters required for the vision transformer, the embedded dimension was the number of channel dimensions for linearly projecting input data into the first feature map. The patch size represented the size of volumetric data for partitioning during training. The batch size was an additional dimension fixed across the epoch, representing the number of input data. The window size meant the size of the data operated in self-attention, while the head number referred to the number of self-attention units. As shown with a blue line in Figure 1b, the embedded dimension was uniformly split by the head number, thus determining the sizes of Q, K, and V vectors feeding into the self-attention mechanism. The attention map () showed how much attention was given to the entire image area to identify which features contributed the most, with N representing the cube of the window size. To set the head numbers, we based it on the embedded dimension of the pre-trained Swin-transformer model [28,29], with (3, 6, 12, 24) set to 96, (4, 8, 16, 32) set to 128, and (6, 12, 24, 48) set to 192.
2.2. Optimal Hyper-Parameters Selections for Network Architecture of VT U-Net
The new vision transformer network architecture with self-attention can help address the issue of relying on local geometric imaging information during network training. However, optimal network performance can only be guaranteed by carefully selecting network hyper-parameters and properly considering architectural details. nnU-Net demonstrated the importance of hyper-parameter optimization despite being based on convolution layers. The basic concept of nnU-Net was to ensure computational efficiency by reflecting the GPU memory budget through their statistics, which helped determine essential network hyper-parameters such as patch size of input images and batch size, and the number of convolution layers. Additionally, nnU-Net applied the post-processing to mainly remove noisy elements and a novel concept of defining the loss function, called deep supervision, serving as an overall objective function across the output layers of different resolutions.
While VT U-Net v.1 did not prioritize hyper-parameter optimizations, it emphasized the new network architecture. VT U-Net v.2 was an upgraded version incorporating an adaptive hyper-parameter optimizer embedded in nnU-Net, rather than revising the network architectures. Table 1 summarizes the features of VT U-Net v.1 and VT U-Net v.2, compared to nnU-Net. VT U-Net v.2 adopted useful features from nnU-Net to improve the performance, mainly oriented to GPU memory efficiency, which did not pay much attention to optimizing the hyper-parameters affecting the network architecture. It is worth noting that nnU-Net was based on convolution layers and did not cover the hyper-parameters needed for vision transformers. Likewise, VT U-Net v.2, referring to nnU-Net, did not fully encompass the necessary network hyper-parameters for vision transformers, such as embedded dimension, head numbers, and window size, as outlined in Table 1. Additionally, it did not provide specific guidelines for the patch size and the number of layers.
The same approach as nnU-Net was employed in this study to determine the number of layers based on the depth of the network, and a window size of 7, consistent with previous transformer-based networks, was set. Based on the pre-trained models, the embedded dimension and head numbers were adjusted accordingly. The embedded dimension and patch size played a vital role in determining the dimensional specifications of the first feature input into the network. Of the two, the patch size was crucial since it directly influenced the trade-off between global and local information processing in the network. Larger patch sizes captured more global context for recognizing larger-scale patterns and structures in the image, while smaller ones caught more local fine-grained details. Therefore, the first feature extracted from various patch sizes included other contextual information that may affect the performance of the transformer. Also, the VT U-Net v.2 did not have deep supervision in defining the loss function. To address this, the modified VT U-Net v.2 added an auxiliary segmentation output to depthwise layers by applying a 1x1x1 convolution to enable this deep supervision to alleviate the vanishing gradient issue by effectively utilizing the multi-level loss fusion [30,31,32,33]. Figure 2 illustrates the proposed network architecture, including pre-processing the given input images, post-processing the generated output, the structure of the deep supervision, and the hyper-parameter selection. Table 1 outlines the differences between VT U-Net v.2 and our proposed framework, mainly regarding hyper-parameter optimizations.
Figure 3 expands on the competence of the proposed framework against several other transformer-based networks, such as Swin-Unetr, nnFormer, VT U-Net v.1, and VT U-Net v.2, while also illustrating specific features of nnU-Net. The proposed network that modified VT U-Net v.2 had the most similarities to VT U-Net v.2, except for including deep supervision and the degree of care for hyper-parameters. Additionally, the proposed network differed from nnFormer and Swin-Unetr regarding the network architecture (fully transformer vs. a combination of transformer and convolution layers) and usage of the pre-trained model. Furthermore, the proposed network optimized the embedded dimension higher than the values suggested for tumor segmentation in other networks. Finally, while VT U-Net v.2 only partially used an adaptive optimizer oriented from nnU-Net, the proposed network handled it more comprehensively, as shown in Table 1.
2.3. Patient Cohorts and Data Pre-processing
This study protocol was approved by the ethics committee/ institutional review board (IRB) of the Yonsei University Severance Hospital, Korea (2022-2205-001), which waived the need for informed patient consent to the use of patient images. The patient cohort consisted of 160 cancer patients who received RT from 2019 to 2020 after being diagnosed with prostate cancer spread in the whole pelvis [34,35], which one radiation oncologist retrospectively observed. All data used in this work were acquired from a single institution, and the target volume was delineated by an experienced radiation oncologist from Yonsei Cancer Center. All patients were treated by intensity-modulated radiation therapy (IMRT) with a conventional linear accelerator (LINAC) and TomoTherapy. Of the 160 patient scans, 20 scans containing barium-contrast bladder and metal-inserted spine were excluded from training and testing. The remaining 140 scans were divided into four sets for 4-fold cross-validation. Each fold consisted of 105 cases for training and 35 for validating and testing (10 for validating and 25 for testing the trained network).
All PTV CT patients were volumetric datasets in three dimensions, with a median shape of 512×512×250 and median spacing (0.9766, 0.9766, 2). These datasets were resampled to the same target spacing (2, 2, 2) and embedded into a 256×256×256 3D volumetric space [36]. After normalizing and window leveling [-200, 250] [37,38,39,40], to enhance the contrast and texture of soft tissue, the foreground of input voxels was selected from the background by intersection with mask voxels images using MATLAB R2022a. To increase the number of data for training the network, we augmented the CT images (used for training phases) by rotating them randomly from -0.5 to 0.5 in horizontal, vertical, and axial directions, contrast transforming them randomly from 0.75 to 1.25, and adding noise randomly with a variance ranged from 0 to 0.1. These data augmentations used BatchGenerators Library provided by the Division of Medical Image Computing of the German Cancer Research Center (DKFZ).
2.4. Implementation and Evaluation
The modified VT U-Net v.2 networks were implemented on a personal workstation with dual accelerated GPU (NVIDIA 3090, A6000), using Python 3.8 (http://www.python.org) and PyTorch 1.11.1 (http://www.pytorch.org). The original CT images of 512×512×N voxels had an intensity corresponding to the Hounsfield unit (HU), where N ranged from 61 to 375. During training in the transformer network, the input images were normalized to a range from 0 to 1 [41]. The network was trained using the AdamW optimizer and a modified loss function that combined cross entropy and dice loss under deep supervision. The training ran 1300 epochs, each containing 250 iterations and early stopping. The learning scheduler used PolyLR with a learning rate of 1×10⁻⁴, determined empirically. Table 2 specifies the network hyper-parameters used in common for both CNN-based and transformer-based networks.
The fully transformer and hybrid networks required the determination of additional hyper-parameters, including the patch size, network architecture, and hyper-parameters, as detailed in Table 3. The hyper-parameters for the existing networks were selected as the values recommended in the published manuscripts. However, the process of hyper-parameters tuning explained in the subsequent section led to the selection of the embedded dimension (128) and patch size (128×128×128) for the modified VT U-Net v.2. The number of heads was adaptively chosen for considering the embedded dimension and the pre-trained model. Meanwhile, the window size followed the Swin-Unetr and VT U-Nets settings and was not optimized.
The proposed transformer architecture, which underwent additional hyper-parameter optimization on the VT U-Net v.2, was compared to several other networks, including the conventional 3D U-Net [42], nnU-Net, Swin-Unetr, nnFormer, VT U-Net v.1, and VT U-Net v.2. The segmentation accuracy of the proposed network was assessed using the dice similarity coefficient (DSC) and 95% Hausdorff distance (HD95) compared to the other networks. The HD95 was calculated using the 95th percentile of the lengths to minimize a small subset of outliers [19,43].
3. Results
3.1. Quantitative Analysis for PTV Auto-Segmentation
Table 4 shows the quantitative analysis of the segmentation accuracy of the networks used for the whole pelvis PTV segmentation for prostate cancer patients. On average, the modified VT U-Net v.2 outperformed the other networks in terms of DSC and HD95 across the 4-fold cross-validation. The unmodified VT U-Net v.2 was expected to perform similarly to its modification in each fold. However, some slight differences arose due to additional hyper-parameter optimization (patch size and embedded dimension) and the adoption of deep supervision in the loss function. Swin-Unetr, which combined CNN and transformer, showed competitive performance against the proposed network. It is worth noting that VT U-Net v.1, which consisted of the fully transformer network architecture, resulted in poor segmentation accuracy. Meanwhile, nnU-Net occasionally displayed comparable performance to the proposed network, despite being based on convolutional blocks. Consequentially, it implied that the hyper-parameter optimization for the specific network architecture would be important, as did the type of network architecture for auto-segmentation.
Table 5 presents the statistical analysis of the proposed network compared to other networks for the 25 testing cases in each fold and the 100 cases in the combined fold 1 to 4, represented by the p-value. In all folds combined, the differences between the proposed network and other networks were statistically significant (p<0.05) in most cases for DSC and HD95, except for HD95 against Swin-Unetr. In the fold-specific comparison, the nnU-Net and VT U-Net v.2 were highly competitive with the proposed network. VT U-Net v.2, the origin of the proposed network, showed comparable results, possibly due to the relatively small sample size. Meanwhile, the nnU-Net demonstrated the effectiveness of the hyper-parameter optimization in statistical analysis and the averaged outcomes. In a single testing case, Figure 4 illustrates the segmented contours of the whole pelvis prostate PTV from the modified VT U-Net v.2 and nnU-Net, along with the ground truth. It turned out that the two networks performed similarly, while the difference was found in the transition area from the lymphatic nodes to the prostate tumor bed, as highlighted by the dotted yellow.
3.2. Hyper-parameter Tuning
In investigating the impact of hyper-parameter selections, the patch size varied from 96×96×96 through 128×128×128 to 160×160×160 on the modified VT U-Net v.2. The embedded dimension was also chosen carefully, with options 96, 128, and 192, based on the corresponding values assigned to the pre-trained networks. In addition, as stated in the preceding section, we adaptively tuned the head numbers regarding the embedded dimension, and the window size was 7, as in the previous transformer-based networks.
Table 6 presents the DSCs and HD95s for various combinations of patch size and embedded dimension, computed over four different folds. Although there were some exceptional cases, the proposed network achieved the largest DSC and the lowest HD95 when the patch size was 128×128×128, and the embedded dimension was 128. It was also found to have a trend that a combination of the large patch size (160×160×160) of the input for the network and the smaller embedded dimension (96 or 128) or vice versa yielded greater segmentation accuracy. When averaging DSCs and HD95s for the testing cases belonging to folds 1 through 4, the selected combination of patch size of 128 for three dimensions and the embedded dimension of 128 seemed more explicit against the other possible combinations shown in Figure 5. Moreover, there was a slight indication that the patch size of 128 was a stronger constraint for enhancing the segmentation accuracy relative to the embedded dimension. Table 7 lists the p-values following the statistical analysis between the selected combination and the others. In most cases, the selected combination had statistically significant differences against the combinations in a consistently exceptional case for DSC and HD95 criterion. In the statistical analysis, however, it was difficult to discern which network hyper-parameter affected the segmentation accuracy the most.
4. Discussion
This work was motivated by a hypothesis that the limited application of CNN to auto-segmentation of PTV may be associated with the inherent characteristics of CNN-based networks. Specifically, these networks propagated local imaging features throughout the depth of layers, which could limit their ability to capture global imaging information. Therefore, the vision transformer has attempted the architectural transformation as an alternative, which can bring in more global imaging information by shifting the regional patches to the original patch during network training. Out of several variants in transformer architecture, the VT U-Net v.1 with fully transformer layers was chosen as a candidate for auto-segmenting the whole pelvis PTV for prostate cancer patients in this work to investigate the effectiveness of the architectural transformation. Additionally, it was found that the other wave was regarding the hyper-parameter optimization under the name of nnU-Net. This approach aimed to identify the optimal combinations of hyper-parameters by considering the GPU computational efficiency and the capacity based on their statistics, along with the slightly different loss definition called deep supervision. However, the updated VT U-Net (v.2) embraced some critical features of nnU-Net, especially in computational efficiency, while it may require further modifications to take transformer-oriented hyper-parameters into account. Thus, this work did not adopt the given hyper-parameters, but instead adjusted vital parameters such as the patch size and embedded dimension (associated with head numbers) to find an optimal combination that can enhance the segmentation accuracy.
As a result of the extensive investigations and comparisons against the existing networks, the modified VT U-Net v.2 yielded the highest average DSC and lowest average HD95 quantitatively, from the 4-fold cross-validations, followed by VT U-Net v.2, nnU-Net, Swin-Unetr, nnFormer, VT U-Net v.1, and 3D U-Net. Concerning the statistical analysis, the VT U-Net v.2 and nnU-Net turned out to be very competitive results. Unexpectedly, VT U-Net v.1 resulted in poor accuracy despite the fully transformer architecture applied. There are two things for discussion. First, the nnU-Net, well-customized to the CNN-based framework, did not lose its competitiveness in the PTV auto-segmentation relative to the transformer-based architecture. The auto-segmentation results showed remarkable differences between VT U-Net v.1 and VT U-Net v.2, even though they had the same network architecture, implying that considering the network hyper-parameters would be significant. In addition, we trained the proposed network while varying the important network hyper-parameters, such as patch size and embedded dimension, under nine different conditions. It involved 36 training sessions for the 4-fold cross-validation, each lasting 4.2 days. From our observation, the variation of two influential network hyper-parameters, patch size and embedded dimension, led to non-negligible differences in the segmentation accuracy, as seen in quantitative results and statistical analysis of Table 6 and Table 7. In conclusion, the VT U-Net v.2 chose the embedded dimension to be 96 as a default, but we found that to be 128 to ensure better accuracy. Along with them, the patch size of 128x128x128 yielded the best results.
The dataset used in this work consisted of 140 CT scans with a prior on the whole pelvis prostate PTV given, which was large enough for the network evaluation. The proposed network was assessed using only one case, the whole pelvis prostate PTV segmentation, which did not fully generalize the selected network hyper-parameters to be optimal for other clinical sites. However, as in our experiment, it was assumed that the chosen hyper-parameters might help set the network hyper-parameters for the datasets with CT images having analogous imaging resolution and image size. Another point for discussion is the resolution of hyper-parameters considered in this work, such as the embedded dimensions of 96, 128, and 192 and patch sizes of 96, 128, and 160. The values were chosen based on the specifications of the pre-trained models used, as the VT U-Net was based on the pre-trained model. There could be slightly different combinations of those parameters with denser sampling. Considering the network architecture consisting of down- and up-sampling, the possible values are somewhat constrained to 64, 96, 128, 160, and 192, etc., in the given hardware. The results found in this work might still be validated in this sense. Finally, the hyper-parameter tuning studied in this work could only partially comprehend some network hyper-parameters in the transformer. As shown in Table 3, the head sizes were adaptively changed from [3,6,12,24] for each layer to the enlarged extent depending on the embedded dimension, [4,8,16,32] for the embedded dimension of 128. The window size was fixed to 7 for each layer as most existing transformers selected the value. The previous work, nnFormer, attempted to adopt a variable window size across the network layers [4,4,8,4] instead of the fixed number 7. Still, it did not provide improved accuracy when applied to the proposed network (DSC of 81.9 and HD95 of 3.6). This work focused on hyper-parameters associated with the size of the first features entering the vision transformer. In the long run, further extensive investigations are required to determine the optimal parameter selections regarding network architectures. Although there may be a long journey in the hyper-parameter optimizer for the new network architecture, vision transformer, the primary findings and insights discussed in this work would be a major milestone in emphasizing the hyper-parameter setting for PTV auto-segmentation using the transformer-based networks.
5. Conclusions
This work proposed a fully transformer-based network to auto-segment the whole pelvis PTV for prostate cancer patients with appropriate hyper-parameter selections. It successfully demonstrated that the network transformation from the CNN-based to the transformer-based approach and the choice of essential hyper-parameters oriented to the transformer be important to enhance the segmentation accuracy. Additionally, our proposed network with 128 embedded layers and 128×128×128 patch size led to a promising performance compared to other investigated networks (CNN, hybrid, and transformer-based networks), with an average DSC of 82.5 and HD95 of 3.5 for 4-fold cross-validation.
Author Contributions
Conceptualization, H.Cho, J.S.Lee, W.S.Koom, H.Kim; Methodology and Validation, H.Cho, J.S.Lee, J.S.Kim, W.S.Koom, H.Kim; Software, H.Cho, H.Kim; Formal Analysis, H.Cho, J.S.Lee, J.S.Kim, W.S.Koom, H.Kim; Investigation, H.Cho, J.S.Kim,H.Kim.; Resources, W.S.Koom.; Data Curation, H.Cho, H.Kim; Writing – Original Draft Preparation, H.Cho; Writing – Review & Editing, J.S.Lee, W.S.Koom, H.Kim; Project Administration, J.S.Lee, W.S.Koom, H.Kim; Funding Acquisition, H.Kim.
Funding
This work was supported by a National Research Foundation of Korea grant funded by the Korean government (NRF-2021R1A2C2005824).
Institutional Review Board Statement
The study was conducted in accordance with the Declaration of Helsinki, and approved by the Institutional Review Board (or Ethics Committee) of the Yonsei University Severance Hospital, Korea (2022-2205-001).
Informed Consent Statement
Patient consent was waived due to the nature of the retrospective study.
Data Availability Statement
The datasets generated during the current study will be available from the corresponding author upon reasonable request.
Conflicts of Interest
The authors have no relevant conflicts of interest to disclose.
References
- Kainmüller, D.; Lange, T.; Lamecker, H. Shape constrained automatic segmentation of the liver based on a heuristic intensity model. In Proceedings of the Proc. MICCAI Workshop 3D Segmentation in the Clinic: A Grand Challenge, 2007; p. 116.
- Park, H.; Bland, P.H.; Meyer, C.R. Construction of an abdominal probabilistic atlas and its application in segmentation. IEEE Transactions on medical imaging 2003, 22, 483–492. [Google Scholar] [CrossRef] [PubMed]
- Shimizu, A.; Ohno, R.; Ikegami, T.; Kobatake, H.; Nawano, S.; Smutek, D. Segmentation of multiple organs in non-contrast 3D abdominal CT images. Int J Comput Ass Rad 2007, 2, 135–142. [Google Scholar] [CrossRef]
- Zhou, Y.; Bai, J. Multiple abdominal organ segmentation: an atlas-based fuzzy connectedness approach. IEEE Trans Inf Technol Biomed 2007, 11, 348–352. [Google Scholar] [CrossRef]
- Hinton, G.E.; Osindero, S.; Teh, Y.W. A fast learning algorithm for deep belief nets. Neural Comput 2006, 18, 1527–1554. [Google Scholar] [CrossRef]
- LeCun, Y.; Bengio, Y.; Hinton, G. Deep learning. Nature 2015, 521, 436–444. [Google Scholar] [CrossRef] [PubMed]
- LeCun, Y.; Bengio, Y. Convolutional networks for images, speech, and time series. The handbook of brain theory and neural networks 1995, 3361, 1995. [Google Scholar]
- Lecun, Y.; Bottou, L.; Bengio, Y.; Haffner, P. Gradient-based learning applied to document recognition. P Ieee 1998, 86, 2278–2324. [Google Scholar] [CrossRef]
- Ronneberger, O.; Fischer, P.; Brox, T. U-Net: Convolutional Networks for Biomedical Image Segmentation. Lect Notes Comput Sc 2015, 9351, 234–241. [Google Scholar] [CrossRef]
- He, K.; Gan, C.; Li, Z.; Rekik, I.; Yin, Z.; Ji, W.; Gao, Y.; Wang, Q.; Zhang, J.; Shen, D. Transformers in medical image analysis: A review. arXiv 2022. arXiv preprint arXiv:2202.12165. arXiv:2202.12165.
- Shamshad, F.; Khan, S.; Zamir, S.W.; Khan, M.H.; Hayat, M.; Khan, F.S.; Fu, H. Transformers in medical imaging: A survey. Med Image Anal 2023, 88, 102802. [Google Scholar] [CrossRef]
- Hatamizadeh, A.; Nath, V.; Tang, Y.C.; Yang, D.; Roth, H.R.; Xu, D.G. Swin UNETR: Swin Transformers for Semantic Segmentation of Brain Tumors in MRI Images. Brainlesion: Glioma, Multiple Sclerosis, Stroke and Traumatic Brain Injuries, Brainles 2021, Pt I 2022, 12962, 272–284. [Google Scholar] [CrossRef]
- Isensee, F.; Petersen, J.; Klein, A.; Zimmerer, D.; Jaeger, P.F.; Kohl, S.; Wasserthal, J.; Koehler, G.; Norajitra, T.; Wirkert, S. nnu-net: Self-adapting framework for u-net-based medical image segmentation. arXiv preprint arXiv:1809.10486 2018. arXiv:1809.10486 2018.
- Isensee, F.; Jaeger, P.F.; Kohl, S.A.A.; Petersen, J.; Maier-Hein, K.H. nnU-Net: a self-configuring method for deep learning-based biomedical image segmentation. Nat Methods 2021, 18, 203. [Google Scholar] [CrossRef] [PubMed]
- Wang, W.X.; Chen, C.; Ding, M.; Yu, H.; Zha, S.; Li, J.Y. TransBTS: Multimodal Brain Tumor Segmentation Using Transformer. Medical Image Computing and Computer Assisted Intervention - Miccai 2021, Pt I 2021, 12901, 109–119. [Google Scholar] [CrossRef]
- Cao, H.; Wang, Y.; Chen, J.; Jiang, D.; Zhang, X.; Tian, Q.; Wang, M. Swin-unet: Unet-like pure transformer for medical image segmentation. In Proceedings of the European conference on computer vision; 2022; pp. 205–218. [Google Scholar]
- Schlemper, J.; Oktay, O.; Schaap, M.; Heinrich, M.; Kainz, B.; Glocker, B.; Rueckert, D. Attention gated networks: Learning to leverage salient regions in medical images. Medical image analysis 2019, 53, 197–207. [Google Scholar] [CrossRef]
- Chen, J.; Lu, Y.; Yu, Q.; Luo, X.; Adeli, E.; Wang, Y.; Lu, L.; Yuille, A.L.; Zhou, Y. Transunet: Transformers make strong encoders for medical image segmentation. arXiv preprint arXiv:2102.04306 2021. arXiv:2102.04306 2021.
- Hatamizadeh, A.; Tang, Y.; Nath, V.; Yang, D.; Myronenko, A.; Landman, B.; Roth, H.R.; Xu, D. Unetr: Transformers for 3d medical image segmentation. In Proceedings of the Proceedings of the IEEE/CVF winter conference on applications of computer vision, 2022; pp. 574-584.
- Zhou, H.-Y.; Guo, J.; Zhang, Y.; Yu, L.; Wang, L.; Yu, Y. nnformer: Interleaved transformer for volumetric segmentation. arXiv preprint arXiv:2109.03201 2021. arXiv:2109.03201 2021.
- Peiris, H.; Hayat, M.; Chen, Z.; Egan, G.; Harandi, M. A volumetric transformer for accurate 3d tumor segmentation. arXiv 2021. arXiv preprint arXiv:2111.13300. arXiv:2111.13300.
- Peiris, H.; Hayat, M.; Chen, Z.; Egan, G.; Harandi, M. A robust volumetric transformer for accurate 3D tumor segmentation. In Proceedings of the International Conference on Medical Image Computing and Computer-Assisted Intervention, 2022; pp. 162-172.
- Vaswani, A.; Shazeer, N.; Parmar, N.; Uszkoreit, J.; Jones, L.; Gomez, A.N.; Kaiser, Ł.; Polosukhin, I. Attention is all you need. Advances in neural information processing systems 2017, 30. [Google Scholar]
- Shaw, P.; Uszkoreit, J.; Vaswani, A. Self-attention with relative position representations. arXiv preprint arXiv:1803.02155 2018. arXiv:1803.02155 2018.
- Tang, H.; Liu, X.; Han, K.; Xie, X.; Chen, X.; Qian, H.; Liu, Y.; Sun, S.; Bai, N. Spatial context-aware self-attention model for multi-organ segmentation. In Proceedings of the Proceedings of the IEEE/CVF winter conference on applications of computer vision, 2021; pp. 939-949.
- Ramachandran, P.; Parmar, N.; Vaswani, A.; Bello, I.; Levskaya, A.; Shlens, J. Stand-alone self-attention in vision models. Advances in neural information processing systems 2019, 32. [Google Scholar]
- Laiton-Bonadiez, C.; Sanchez-Torres, G.; Branch-Bedoya, J. Deep 3d neural network for brain structures segmentation using self-attention modules in mri images. Sensors 2022, 22, 2559. [Google Scholar] [CrossRef]
- Liu, Z.; Hu, H.; Lin, Y.; Yao, Z.; Xie, Z.; Wei, Y.; Ning, J.; Cao, Y.; Zhang, Z.; Dong, L. Swin transformer v2: Scaling up capacity and resolution. In Proceedings of the Proceedings of the IEEE/CVF conference on computer vision and pattern recognition, 2022; pp. 12009-12019. 12009–12019.
- Liu, Z.; Lin, Y.; Cao, Y.; Hu, H.; Wei, Y.; Zhang, Z.; Lin, S.; Guo, B. Swin transformer: Hierarchical vision transformer using shifted windows. In Proceedings of the Proceedings of the IEEE/CVF international conference on computer vision, 2021; pp. 10012-10022.
- Kayalibay, B.; Jensen, G.; van der Smagt, P. CNN-based segmentation of medical imaging data. arXiv preprint arXiv:1701.03056 2017. arXiv:1701.03056 2017.
- Lee, C.-Y.; Xie, S.; Gallagher, P.; Zhang, Z.; Tu, Z. Deeply-supervised nets. In Proceedings of the Artificial intelligence and statistics; 2015; pp. 562–570. [Google Scholar]
- Li, S.; Sui, X.; Luo, X.; Xu, X.; Liu, Y.; Goh, R. Medical image segmentation using squeeze-and-expansion transformers. arXiv preprint arXiv:2105.09511 2021. arXiv:2105.09511 2021.
- Atya, H.B.; Rajchert, O.; Goshen, L.; Freiman, M. Non Parametric Data Augmentations Improve Deep-Learning based Brain Tumor Segmentation. In Proceedings of the 2021 IEEE International Conference on Microwaves, Antennas, Communications and Electronic Systems (COMCAS), 2021; pp. 357-360.
- Widesott, L.; Pierelli, A.; Fiorino, C.; Lomax, A.J.; Amichetti, M.; Cozzarini, C.; Soukup, M.; Schneider, R.; Hug, E.; Di Muzio, N. Helical tomotherapy vs. intensity-modulated proton therapy for whole pelvis irradiation in high-risk prostate cancer patients: dosimetric, normal tissue complication probability, and generalized equivalent uniform dose analysis. International Journal of Radiation Oncology* Biology* Physics 2011, 80, 1589–1600. [Google Scholar] [CrossRef]
- Barlow, H.; Mao, S.; Khushi, M. Predicting high-risk prostate cancer using machine learning methods. Data 2019, 4, 129. [Google Scholar] [CrossRef]
- Wang, S.; He, K.; Nie, D.; Zhou, S.; Gao, Y.; Shen, D. CT male pelvic organ segmentation using fully convolutional networks with boundary sensitive representation. Medical image analysis 2019, 54, 168–178. [Google Scholar] [CrossRef]
- Miksys, N. Advancements in Monte Carlo dose calculations for prostate and breast permanent implant brachytherapy. Carleton University, 2016.
- iu, Y.; Khosravan, N.; Liu, Y.; Stember, J.; Shoag, J.; Bagci, U.; Jambawalikar, S. Cross-modality knowledge transfer for prostate segmentation from CT scans. In Proceedings of the Domain Adaptation and Representation Transfer and Medical Image Learning with Less Labels and Imperfect Data: First MICCAI Workshop, DART 2019, and First International Workshop, MIL3ID 2019, Shenzhen, Held in Conjunction with MICCAI 2019, Shenzhen, China, October 13 and 17, 2019, Proceedings 1, 2019; pp. 63-71.
- Elmahdy, M.S.; Jagt, T.; Zinkstok, R.T.; Qiao, Y.; Shahzad, R.; Sokooti, H.; Yousefi, S.; Incrocci, L.; Marijnen, C.; Hoogeman, M. Robust contour propagation using deep learning and image registration for online adaptive proton therapy of prostate cancer. Medical physics 2019, 46, 3329–3343. [Google Scholar] [CrossRef]
- Shahedi, M.; Ma, L.; Halicek, M.; Guo, R.; Zhang, G.; Schuster, D.M.; Nieh, P.; Master, V.; Fei, B. A semiautomatic algorithm for three-dimensional segmentation of the prostate on CT images using shape and local texture characteristics. In Proceedings of the Medical Imaging 2018: Image-Guided Procedures, Robotic Interventions, and Modeling, 2018; pp. 280-287.
- Shahedi, M.; Dormer, J.D.; Halicek, M.; Fei, B. The effect of image annotation with minimal manual interaction for semiautomatic prostate segmentation in CT images using fully convolutional neural networks. Medical physics 2022, 49, 1153–1160. [Google Scholar] [CrossRef] [PubMed]
- Çiçek, Ö.; Abdulkadir, A.; Lienkamp, S.S.; Brox, T.; Ronneberger, O. 3D U-Net: learning dense volumetric segmentation from sparse annotation. In Proceedings of the Medical Image Computing and Computer-Assisted Intervention–MICCAI 2016: 19th International Conference, Athens, Greece, October 17-21, 2016, Proceedings, Part II 19, 2016; pp. 424-432.
- Ma, J.; Chen, J.; Ng, M.; Huang, R.; Li, Y.; Li, C.; Yang, X.; Martel, A.L. Loss odyssey in medical image segmentation. Medical Image Analysis 2021, 71, 102035. [Google Scholar] [CrossRef] [PubMed]
Figure 1.
(a) VT U-Net architecture, (b) primary hyper-parameters (patch size, embedded dimension, and head numbers) in VT U-Net v.2.
Figure 1.
(a) VT U-Net architecture, (b) primary hyper-parameters (patch size, embedded dimension, and head numbers) in VT U-Net v.2.
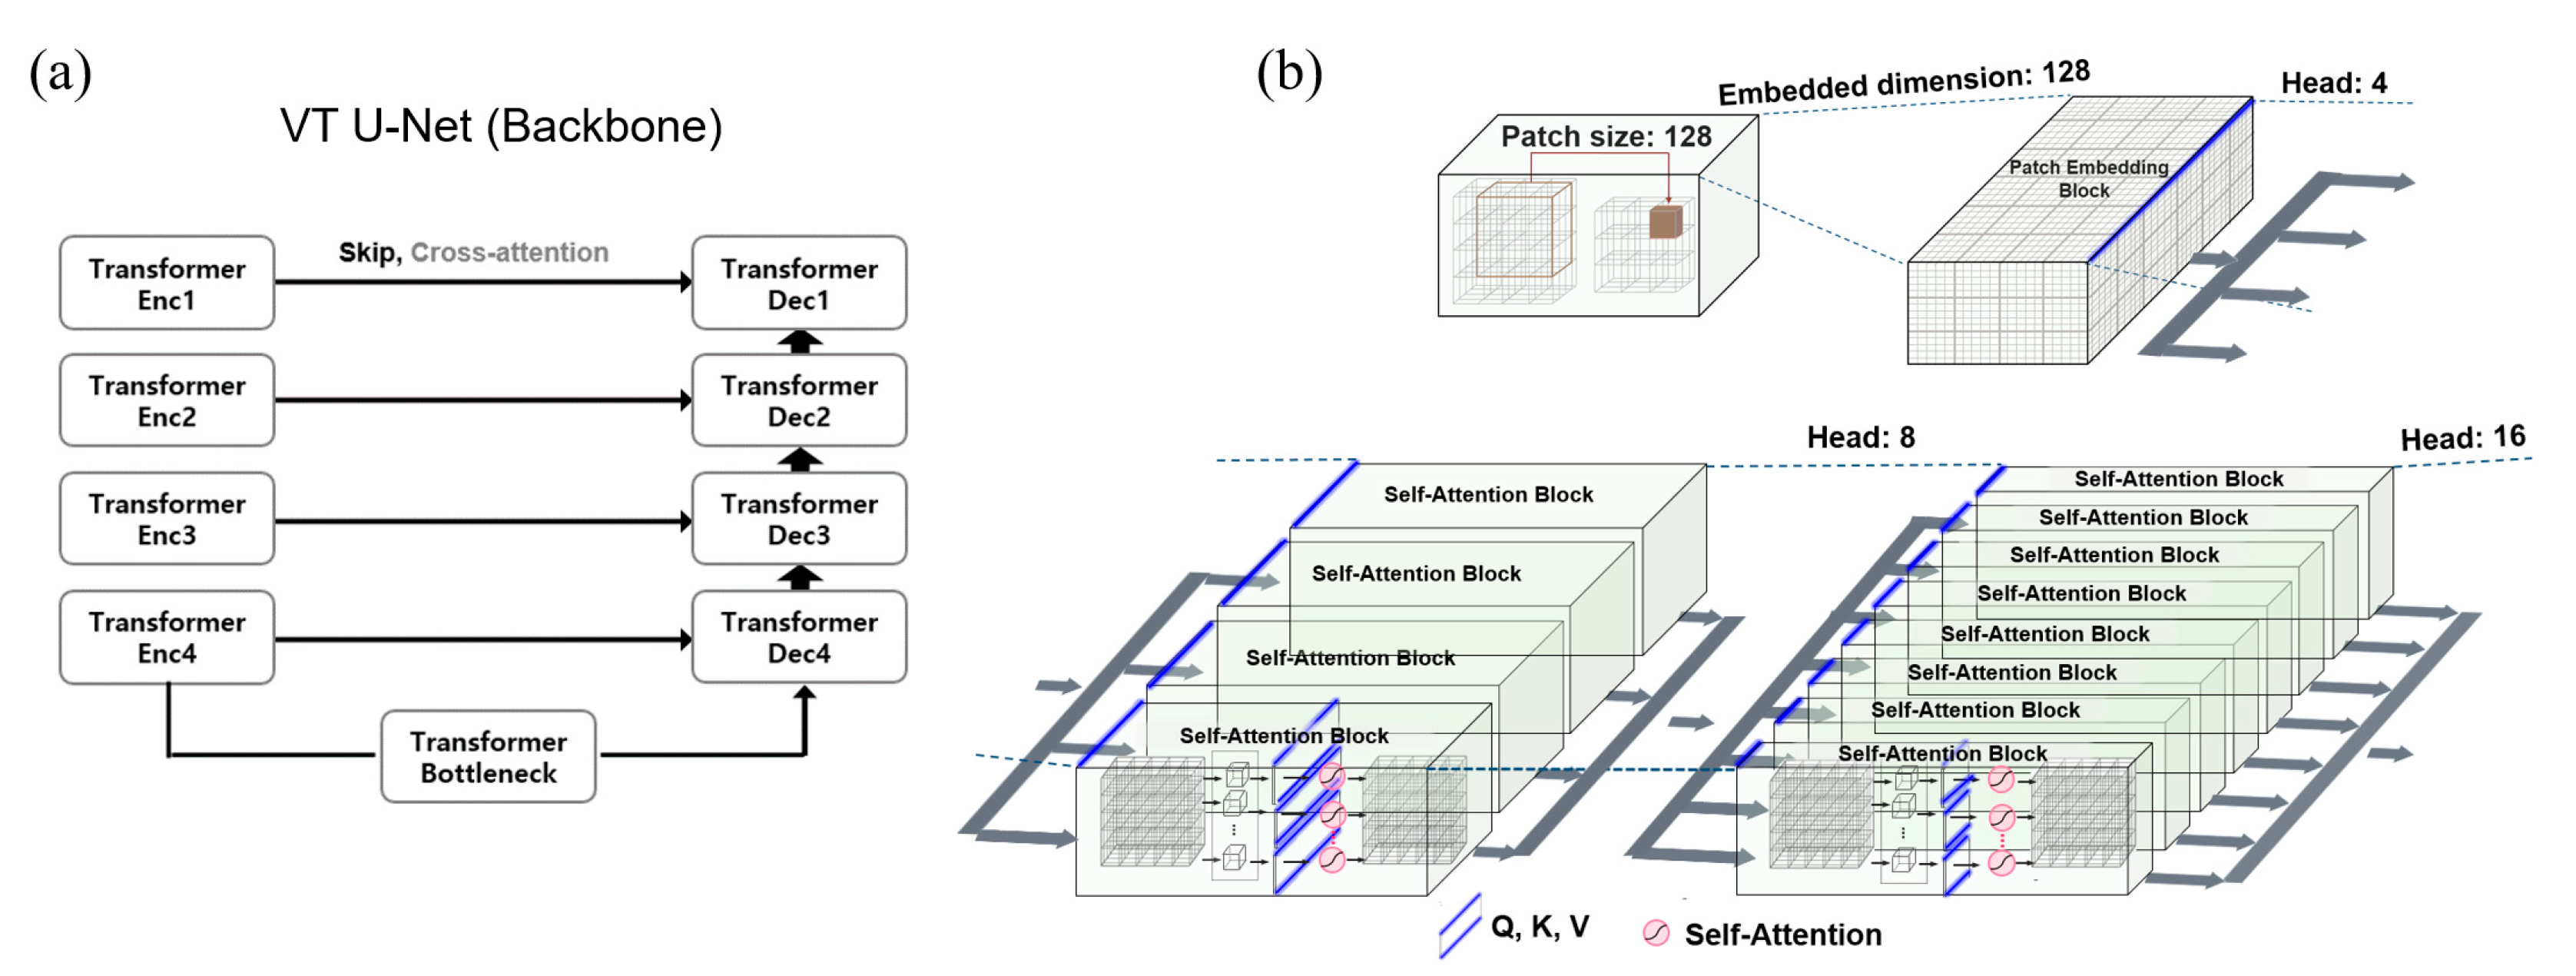
Figure 2.
The main framework of the proposed network based on VT U-Net v.2 for auto-segmentation of the whole pelvis prostate planning target volume (PTV): (a) adaptive optimizing workflow in pre-processing, (b) deep supervision and post-processing. (c) hyper-parameters and architecture optimization considering graphical processing units (GPU) memory efficiency.
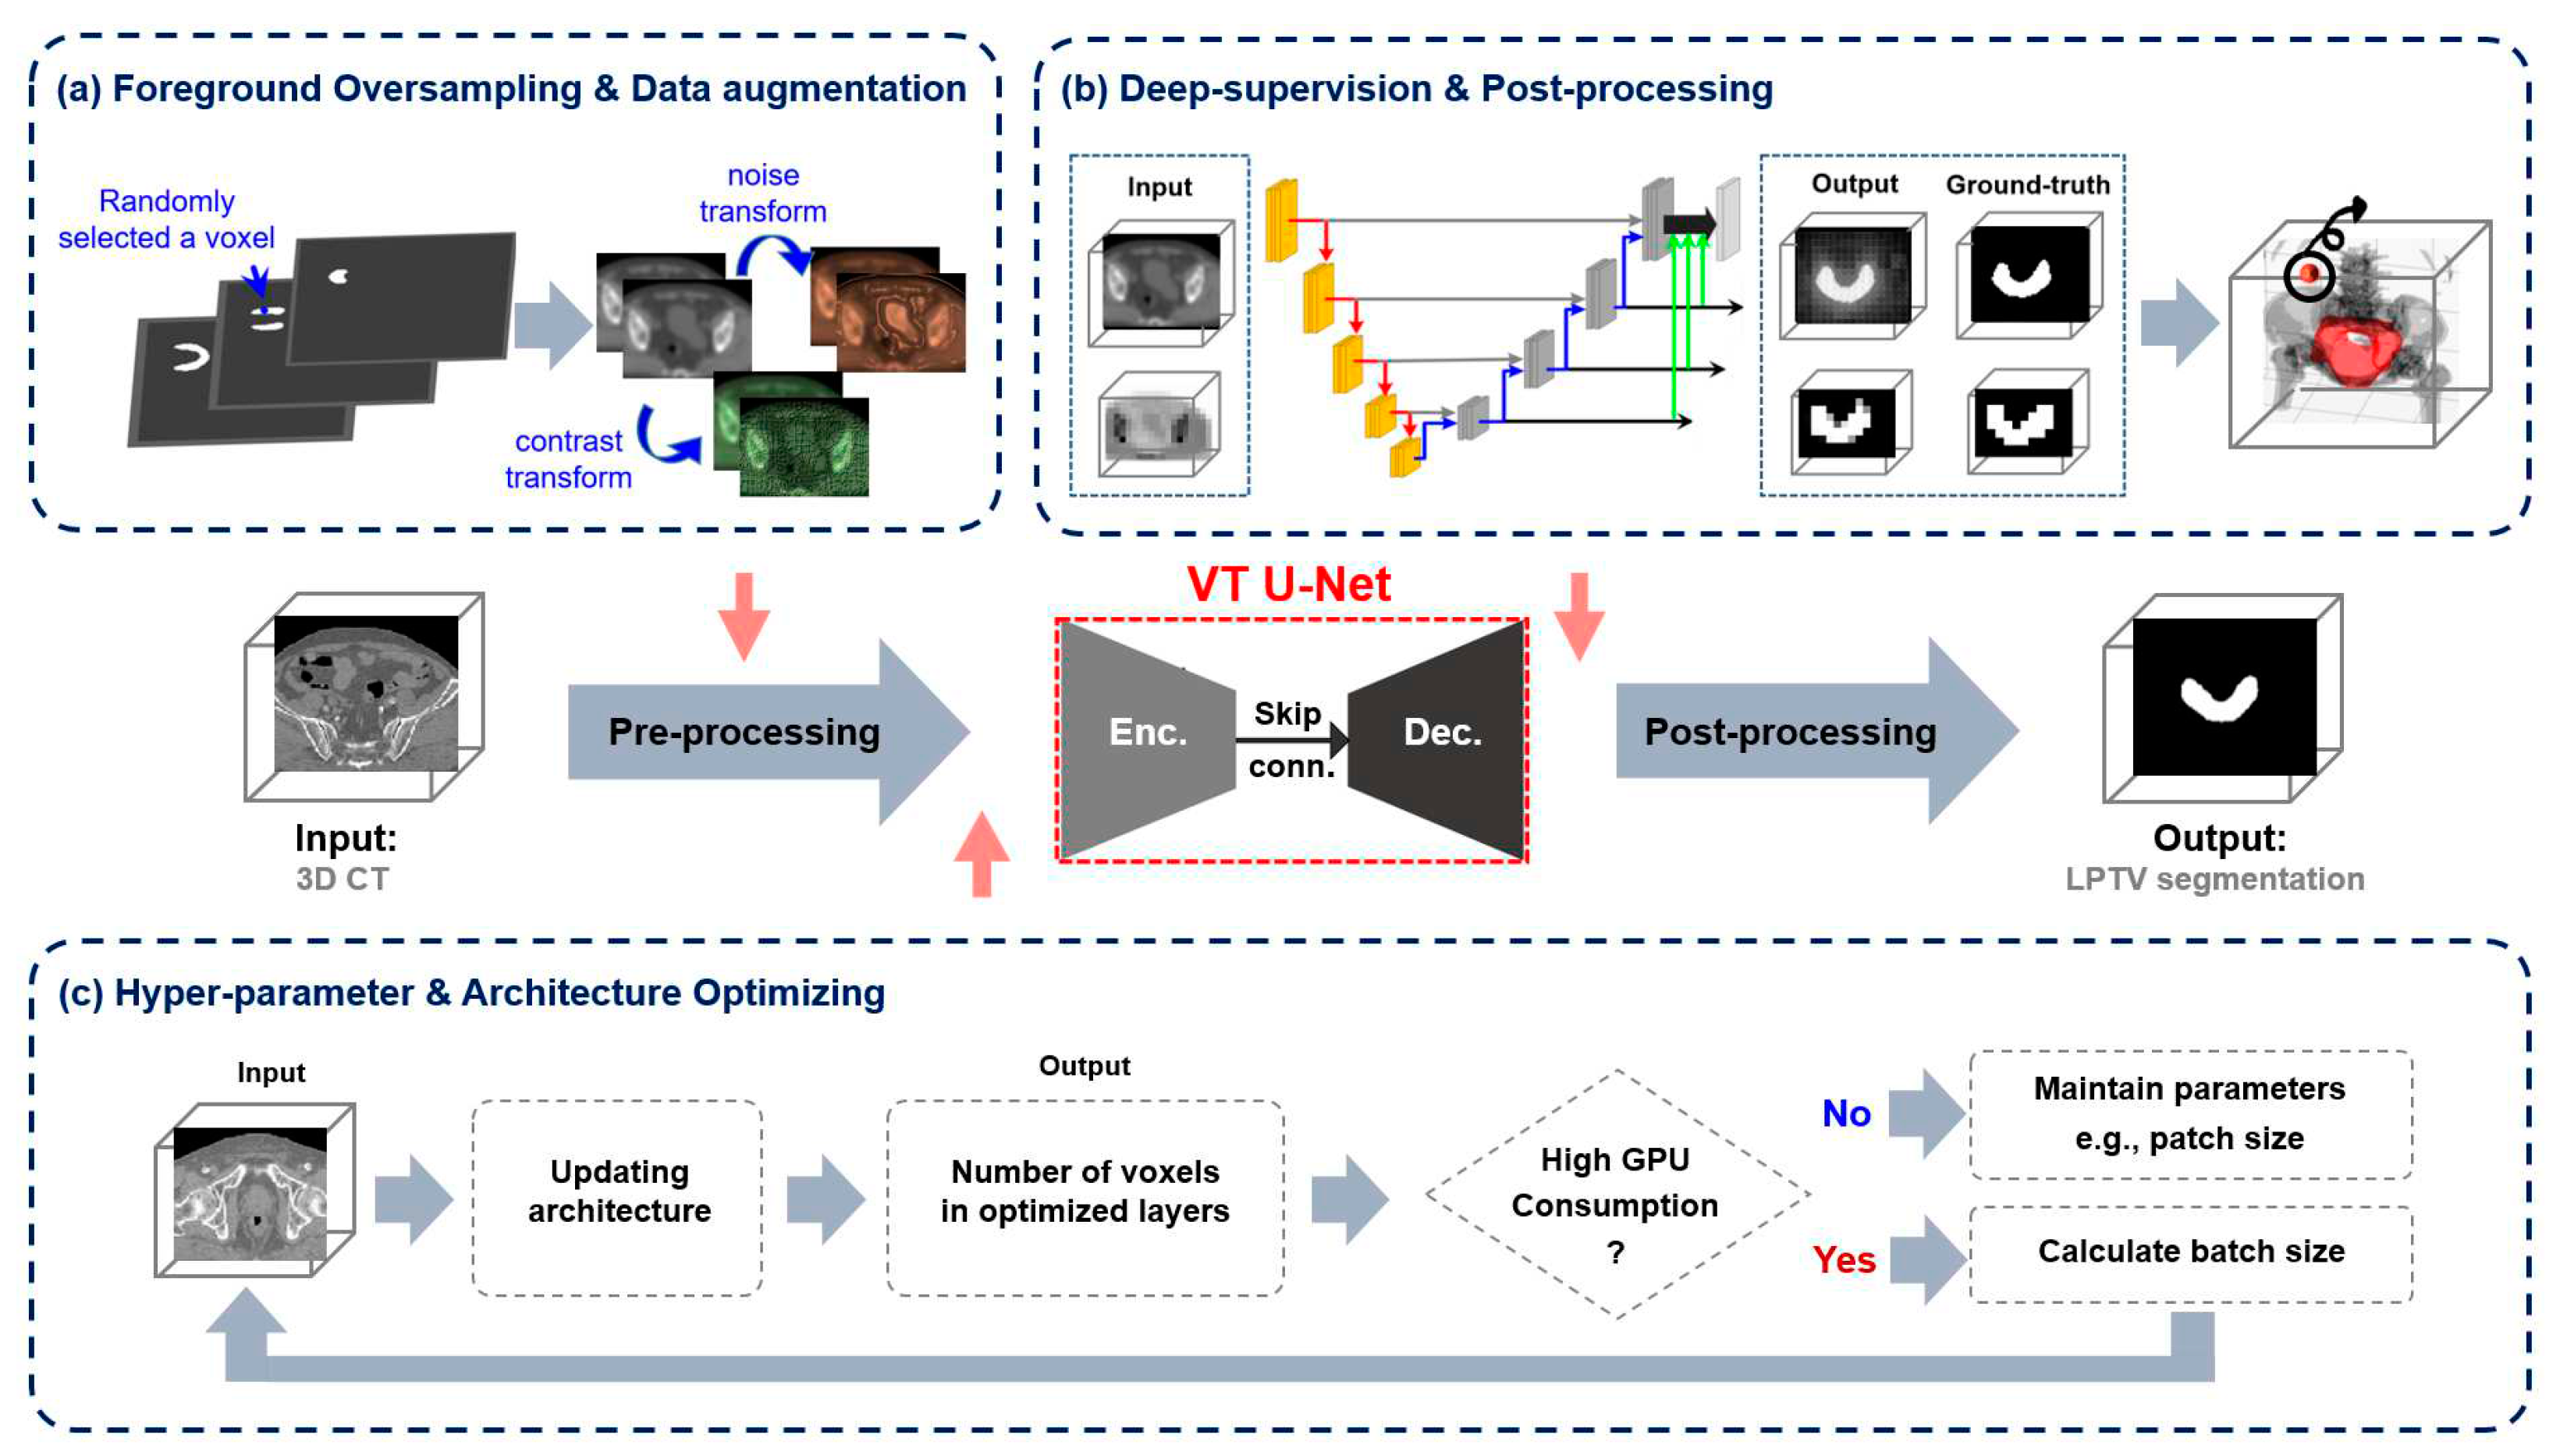
Figure 3.
Diagram of comparison with transformer-based networks (b) and the proposed network (a). All diagram components were classified into binary (yes or no).
Figure 3.
Diagram of comparison with transformer-based networks (b) and the proposed network (a). All diagram components were classified into binary (yes or no).
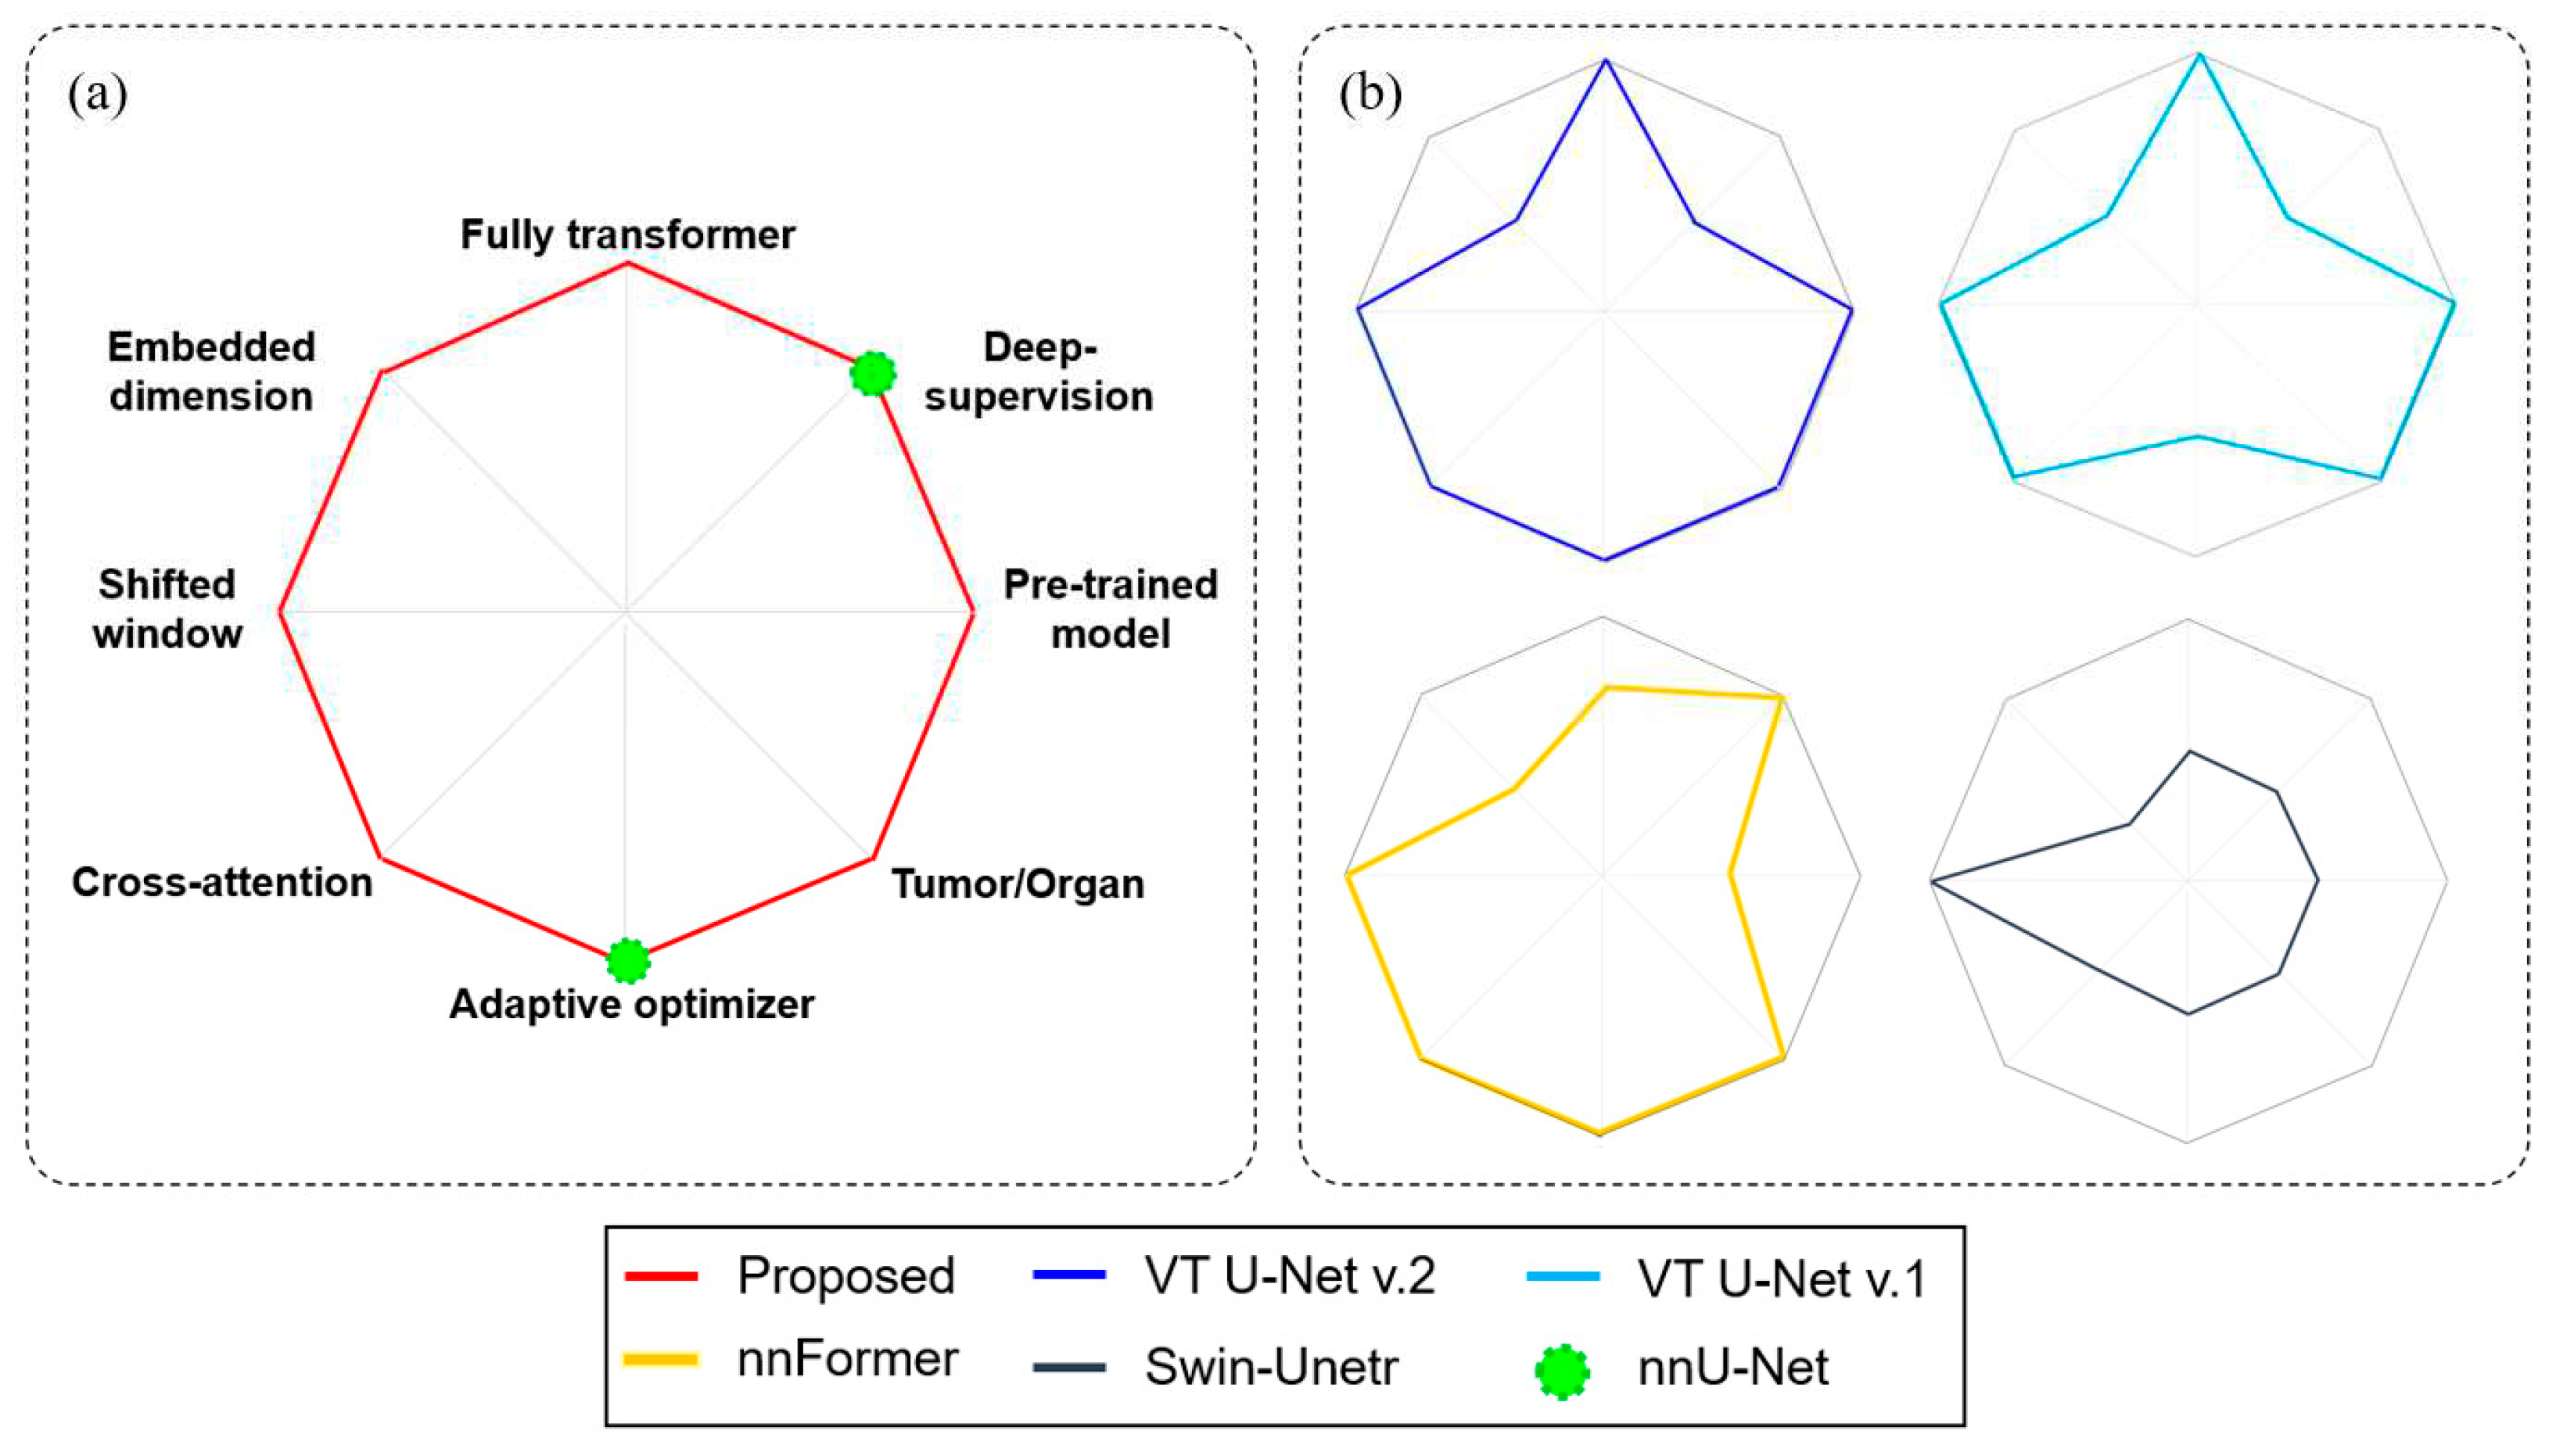
Figure 4.
Qualitative analysis of the modified VT U-Net v.2 and nnU-Net for PTV auto-segmentation. The top, bottom, and joint in PTV made a difference in performance in both models (yellow). (Upper row: original images, bottom row: enlarged view).
Figure 4.
Qualitative analysis of the modified VT U-Net v.2 and nnU-Net for PTV auto-segmentation. The top, bottom, and joint in PTV made a difference in performance in both models (yellow). (Upper row: original images, bottom row: enlarged view).
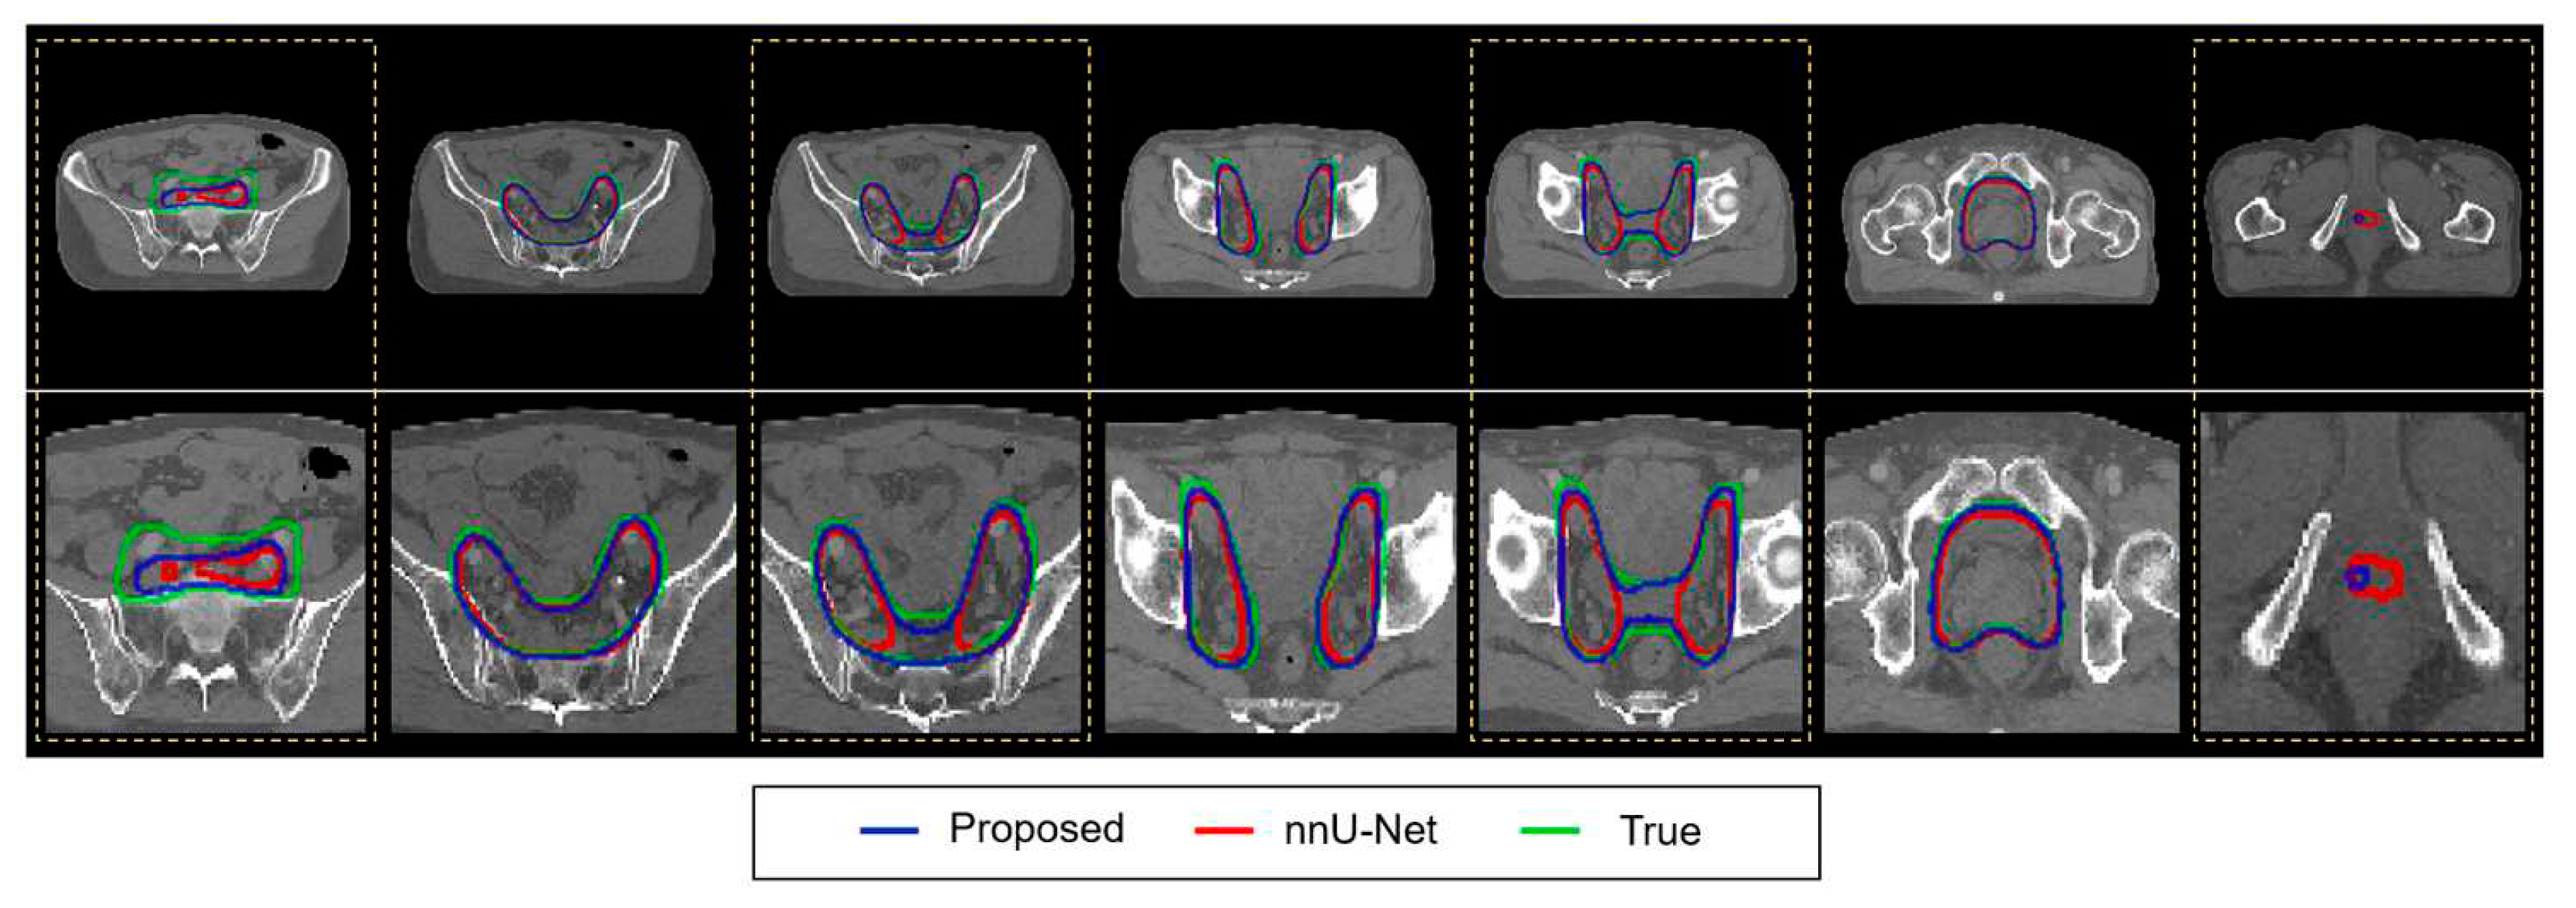
Figure 5.
Hyper-parameter optimization in the proposed network (the modified VT U-Net v.2). (a) DSC and (b) HD95 across nine combinations of embedded dimension (head numbers) and patch size.
Figure 5.
Hyper-parameter optimization in the proposed network (the modified VT U-Net v.2). (a) DSC and (b) HD95 across nine combinations of embedded dimension (head numbers) and patch size.
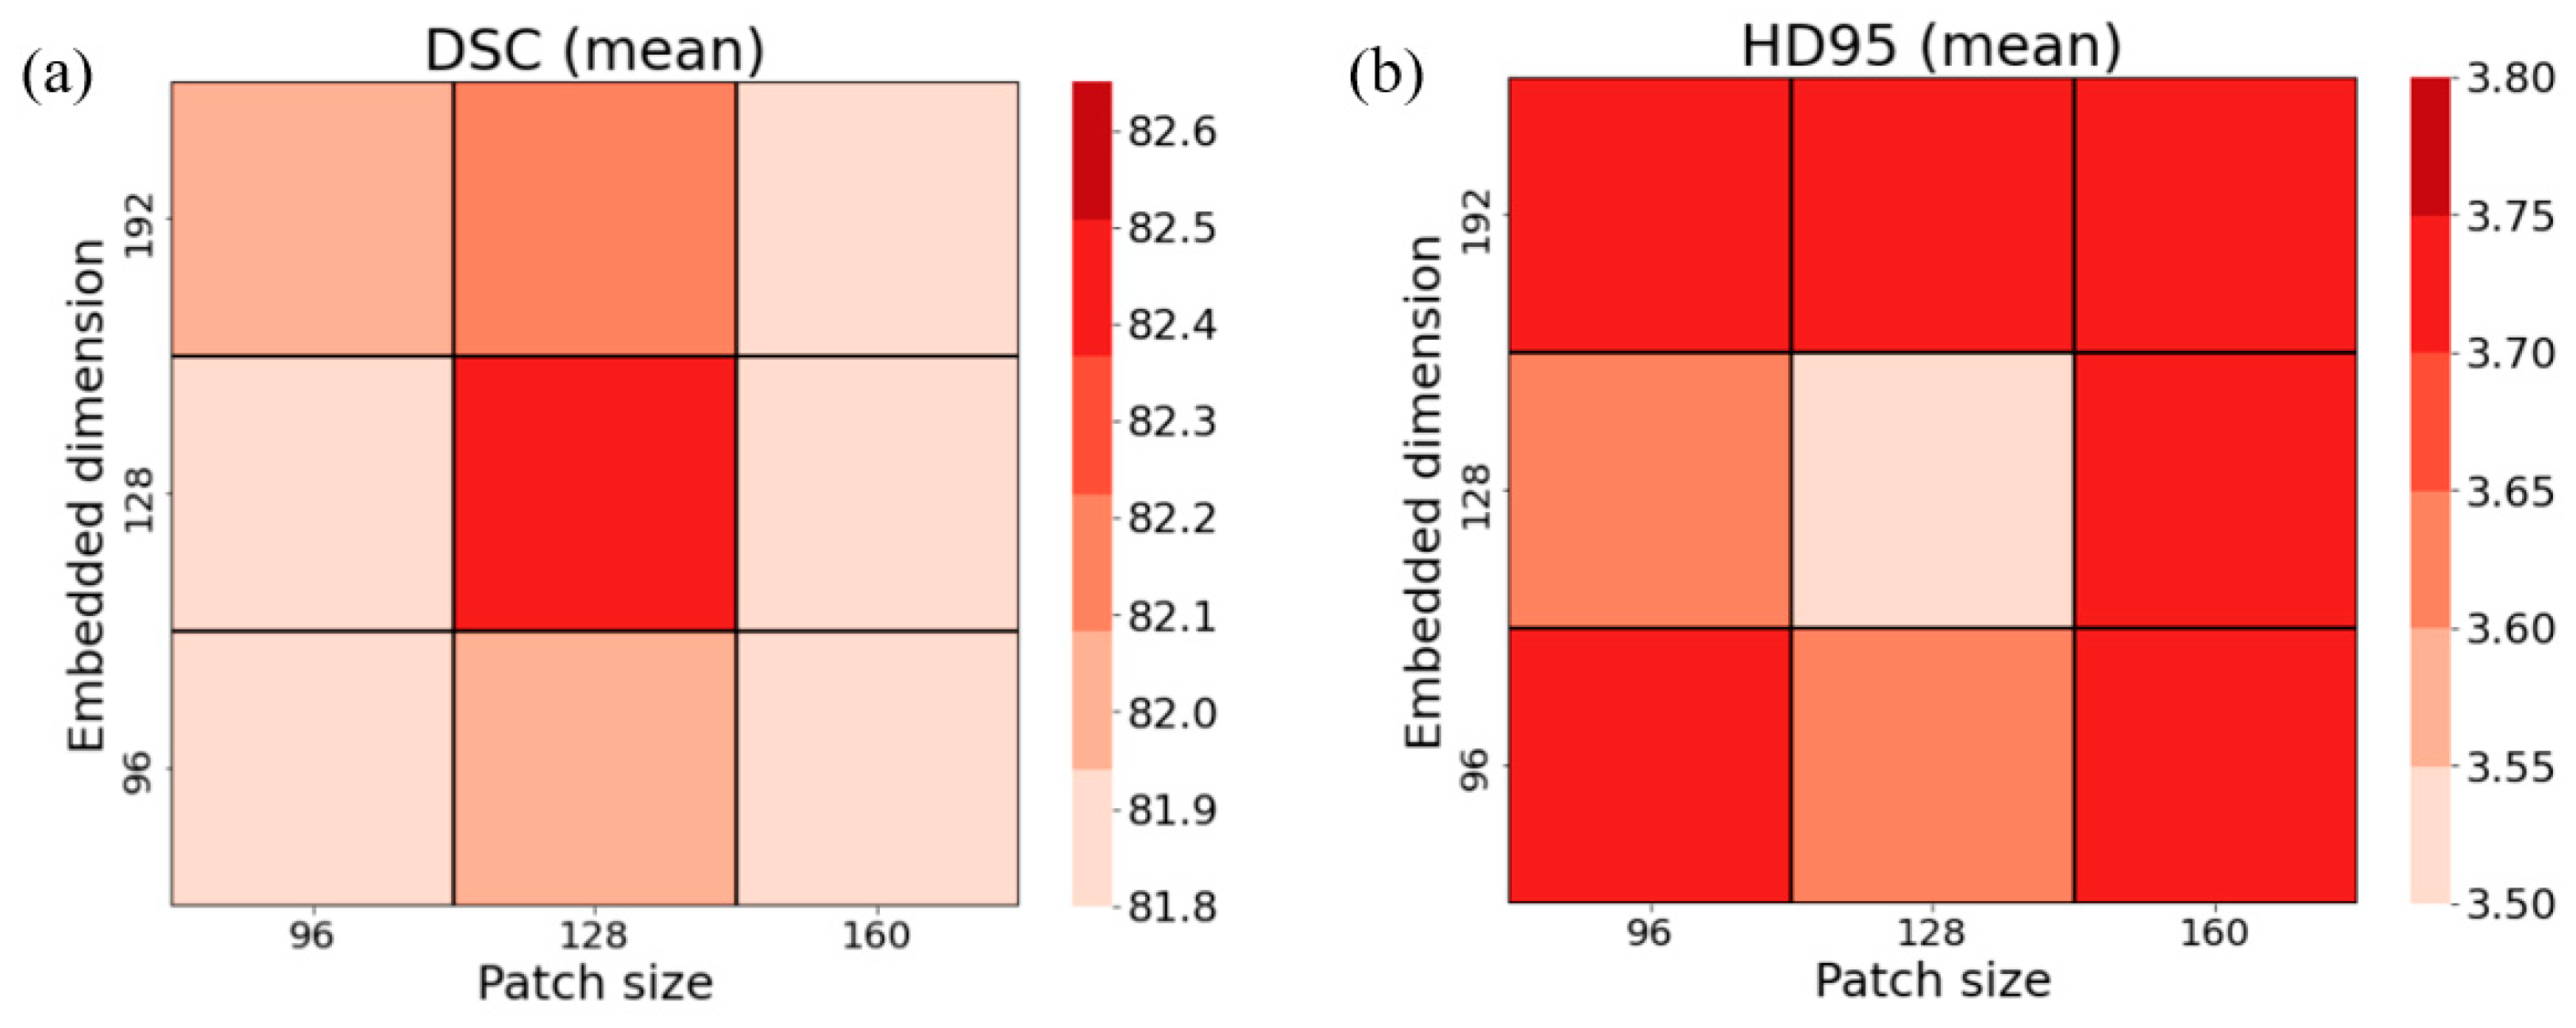

Table 1.
Functions regarding optimal network hyper-parameter selection.
| nnU-Net | VT U-Net v.1 | VT U-Net v.2 | Modified VT U-Net v.2 (Proposed) |
|
| Pre- & post-processing & loss | ||||
| AMP 1 | o | × | o | o |
| Oversampling | o | × | o | o |
| Post-processing | o | × | o | o |
| Loss (CE + dice + DS) 2 | o | × | △ | o |
| Hyper-parameter & architecture | ||||
| Batch size | o | × | o | o |
| Patch size | o | × | × | o |
| Embedded dimension | — | × | × | o |
| Head number | — | × | × | △ (adaptive to embedded dimension) |
| Window size | — | × | × | × |
| Architecture | o | × | △ | O (same as nnU-Net) |
1 Automatic mixed precision. 2 Cross entropy and deep supervision.
Table 2.
Hyper-parameters of convolutional neural network (CNN), hybrid and transformer-based networks.
Table 2.
Hyper-parameters of convolutional neural network (CNN), hybrid and transformer-based networks.
| Network | Learning rate | Optimizer | Loss function | Epoch |
| 3D U-Net | 1E-04 | Adam | Dice + BCE | 300 |
| nnU-Net | 1E-02 | SGD | Dice + CE + DS | 150 ( ×250) |
| Swin-Unetr | 1E-04 | AdamW | Dice + CE | 400 - 1000 |
| nnFormer | 1E-02 | SGD | Dice + CE + DS | 1300 ( ×250) |
| VT U-Net v.1 | 1E-04 | Adam | Dice + BCE | 400 - 500 |
| VT U-Net v.2 | 1E-04 | AdamW | Dice + CE | 1300 ( ×250) |
| Proposed | 1E-04 | AdamW | Dice + CE + DS | 1300 ( ×250) |
Table 3.
Transformer hyper-parameters of hybrid (CNN and transformer) and transformer-based methods.
Table 3.
Transformer hyper-parameters of hybrid (CNN and transformer) and transformer-based methods.
| Network | Embedded dimension | Patch size | Number of blocks | Window size | Number of heads | Parameters |
| Swin-Unetr | 48 | 96×96×96 | [2,2,2,2] | [7,7,7,7] | [3,6,12,24] | 62.8M |
| nnFormer | 96 | 128×128×128 | [2,2,2,2] | [4,4,8,4] | [3,6,12,24] | 37.7M |
| VT U-Net v.1 | 96 | 128×128×128 | [2,2,2,1] | [7,7,7,7] | [3,6,12,24] | 20.8M |
| VT U-Net v.2 | 96 | 128×128×128 | [2,2,2,1] | [7,7,7,7] | [3,6,12,24] | 30.6M |
| Proposed | 128 | 128×128×128 | [2,2,2,1] | [7,7,7,7] | [4,8,16,32] | 36.7M |
Table 4.
Segmentation results of CNN, hybrid, and transformer architectures on PTV dataset. ↑ means higher is better. The best results are bolded while the second best are underlined, and experimental results of baselines were acquired from 3D U-Net. All experiments were run as 4-fold cross-validation.
| Method | Dice similarity coefficient (DSC) ↑ | 95% Hausdorff distance (HD95) ↓ | |||||||||
| Fold1 | Fold2 | Fold3 | Fold4 | Mean | Fold1 | Fold2 | Fold3 | Fold4 | Mean | ||
| 3D U-Net | 80.96 | 77.98 | 76.46 | 76.75 | 78.0*** | 3.23 | 4.19 | 5.55 | 4.45 | 4.4*** | |
| nnU-Net | 83.95 | 82.02 | 79.25 | 82.44 | 81.9* | 2.70 | 3.60 | 5.14 | 2.94 | 3.6* | |
| Swin-Unetr | 82.68 | 81.87 | 79.47 | 83.06 | 81.8* | 3.00 | 3.65 | 4.97 | 2.75 | 3.6 | |
| nnFormer | 83.31 | 81.31 | 79.85 | 82.39 | 81.7** | 2.80 | 3.78 | 5.13 | 3.12 | 3.7* | |
| VT U-Net v.1 | 80.21 | 76.65 | 75.08 | 76.25 | 77.0*** | 3.35 | 4.34 | 5.44 | 3.93 | 4.3*** | |
| VT U-Net v.2 | 84.12 | 82.30 | 79.82 | 82.61 | 82.2** | 2.72 | 3.60 | 5.04 | 3.01 | 3.6* | |
| Proposed | 84.20 | 82.65 | 80.13 | 82.82 | 82.5 | 2.49 | 3.52 | 4.98 | 3.01 | 3.5 | |
Table 5.
Statistical analysis of CNN, hybrid, and transformer architectures. The P-value of the models < 0.05 indicates that the performance difference is statistically significant.
Table 5.
Statistical analysis of CNN, hybrid, and transformer architectures. The P-value of the models < 0.05 indicates that the performance difference is statistically significant.
| Method | DSC | HD95 | ||||||||
| Fold1 | Fold2 | Fold3 | Fold4 | All folds | Fold1 | Fold2 | Fold3 | Fold4 | All folds | |
| 3D U-Net | < .001 | < .001 | < .001 | < .001 | < .001 | 0.001 | < .001 | 0.004 | < .001 | < .001 |
| nnU-Net | 0.410 | 0.126 | 0.255 | 0.206 | 0.040 | 0.070 | 0.473 | 0.122 | 0.479 | 0.080 |
| Swin-Unetr | 0.022 | 0.020 | 0.030 | 0.339 | 0.020 | 0.007 | 0.123 | 0.091 | 0.392 | 0.210 |
| nnFormer | 0.046 | 0.013 | 0.389 | 0.122 | 0.010 | 0.028 | 0.116 | 0.468 | 0.181 | 0.020 |
| VT U-Net v.1 | < .001 | < .001 | < .001 | < .001 | < .001 | < .001 | < .001 | 0.050 | < .001 | < .001 |
| VT U-Net v.2 | 0.331 | 0.051 | 0.117 | 0.106 | 0.010 | 0.426 | 0.448 | 0.170 | 0.480 | 0.090 |
Table 6.
Hyper-parameter optimization in the proposed network (the modified VT U-Net v.2). DSC and HD95 were measured 4-fold.
Table 6.
Hyper-parameter optimization in the proposed network (the modified VT U-Net v.2). DSC and HD95 were measured 4-fold.
| Hyper-parameter | DSC ↑ | HD95 ↓ | |||||||
| Patch size | Embedded dimension | Fold1 | Fold2 | Fold3 | Fold4 | Fold1 | Fold2 | Fold3 | Fold4 |
| 96 | 96 | 83.57 | 82.09 | 79.57 | 82.33 | 2.72 | 3.78 | 5.02 | 3.12 |
| 96 | 128 | 83.78 | 82.34 | 79.35 | 82.25 | 2.52 | 3.60 | 4.98 | 3.12 |
| 96 | 192 | 84.36 | 82.05 | 79.52 | 81.98 | 2.68 | 4.03 | 5.02 | 3.22 |
| 128 | 96 | 83.72 | 82.32 | 79.77 | 82.39 | 2.73 | 3.70 | 5.05 | 3.07 |
| 128 | 128 | 84.20 | 82.65 | 80.13 | 82.82 | 2.49 | 3.52 | 4.98 | 3.01 |
| 128 | 192 | 83.96 | 81.89 | 80.45 | 82.23 | 2.63 | 3.78 | 4.94 | 3.44 |
| 160 | 96 | 84.16 | 81.87 | 79.37 | 81.87 | 2.78 | 3.59 | 5.07 | 3.26 |
| 160 | 128 | 83.65 | 82.14 | 79.65 | 82.11 | 2.64 | 3.80 | 5.02 | 3.19 |
| 160 | 192 | 84.03 | 81.54 | 79.85 | 81.88 | 2.61 | 3.78 | 4.96 | 3.25 |
Table 7.
Statistical analysis (p-value) of hyper-parameter optimization in the proposed network. The p-value of the models < 0.05 indicates that the performance difference is statistically significant.
Table 7.
Statistical analysis (p-value) of hyper-parameter optimization in the proposed network. The p-value of the models < 0.05 indicates that the performance difference is statistically significant.
| Hyper-parameter | DSC | HD95 | |||||||||
| Patch size | Embedded dimension |
Fold1 | Fold2 | Fold3 | Fold4 | All folds | Fold1 | Fold2 | Fold3 | Fold4 | All folds |
| 96 | 96 | 0.111 | 0.018 | 0.061 | 0.043 | 0.001 | 0.021 | 0.157 | 0.149 | 0.190 | 0.006 |
| 96 | 128 | 0.185 | 0.144 | 0.043 | 0.069 | 0.005 | 0.087 | 0.108 | 0.475 | 0.405 | 0.079 |
| 96 | 192 | 0.365 | 0.087 | 0.072 | 0.005 | 0.009 | 0.179 | 0.199 | 0.380 | 0.081 | 0.026 |
| 128 | 96 | 0.101 | 0.124 | 0.021 | 0.046 | 0.004 | 0.026 | 0.236 | 0.222 | 0.166 | 0.019 |
| 128 | 192 | 0.193 | 0.118 | 0.089 | 0.020 | 0.059 | 0.089 | 0.145 | 0.301 | 0.021 | 0.018 |
| 160 | 96 | 0.451 | 0.154 | 0.008 | 0.001 | <.001 | 0.058 | 0.176 | 0.076 | 0.005 | <.001 |
| 160 | 128 | 0.137 | 0.066 | 0.127 | 0.007 | 0.002 | 0.228 | 0.080 | 0.389 | 0.007 | 0.006 |
| 160 | 192 | 0.347 | 0.023 | 0.173 | <.001 | 0.001 | 0.294 | 0.036 | 0.172 | 0.003 | 0.020 |
Disclaimer/Publisher’s Note: The statements, opinions and data contained in all publications are solely those of the individual author(s) and contributor(s) and not of MDPI and/or the editor(s). MDPI and/or the editor(s) disclaim responsibility for any injury to people or property resulting from any ideas, methods, instructions or products referred to in the content. |
© 2023 by the authors. Licensee MDPI, Basel, Switzerland. This article is an open access article distributed under the terms and conditions of the Creative Commons Attribution (CC BY) license (http://creativecommons.org/licenses/by/4.0/).
Copyright: This open access article is published under a Creative Commons CC BY 4.0 license, which permit the free download, distribution, and reuse, provided that the author and preprint are cited in any reuse.


