Submitted:
20 January 2025
Posted:
21 January 2025
You are already at the latest version
Abstract
The friction between the roll and the rolled piece is the main force of plate-strip rolling, and the friction condition of the roll gap seriously affects the surface quality of the plate-strip. Therefore, the friction condition is an important boundary condition in the analysis of plate-strip rolling deformation. The finite element model of SUS304 foil rolling was established by crystal plasticity finite element method, and the accuracy of the rolling model was verified by comparing the measured grain orientation of foil after rolling with the simulation results. Based on the above model, the effects of friction conditions on rolling force, contact pressure and friction stress, slip system motion state and grain orientation of rolled SUS304 foil strip were analyzed. The results show that with the increase of friction coefficient, the length of the forward slip zone increases, the surplus frictional force increases, and the contact pressure and friction stress of the upper and lower rolls in the rolling deformation zone increase slightly. The change of friction coefficient has a great influence on the shear slip of the surface layer of the foil strip, which significantly affects the motion state of the activated slip system at the upper and lower surface positions of the foil strip, significantly improves the shear strain of the activated slip system at the upper and lower surface positions, and increases the dispersion degree of the grains in the upper and lower surface layers around the ND direction.
Keywords:
crystal plasticity finite element
; 304 stainless steel foil tape
; friction condition
; mesoscopic scale rolling deformation
1. Introduction
In recent years, with the significant improvement of computer software/hardware, the crystal plasticity finite element method (CPFEM) based on the physical nature of material deformation has been widely used in the study of microscopic plastic deformation of crystal materials [1-3]. The crystal plasticity finite element method attributes the plastic deformation of the material to dislocation slip and crystal rotation. Based on the continuum theory, the discretely distributed dislocations are homogenized to calculate the anisotropic behavior of grain-scale plastic deformation [4-6]. It is an effective method to calculate the microscopic plastic deformation [7-9], texture evolution [10-12], size effect [13-15] and so on.
Precision stainless steel foil (0.01mm-0.1mm) has excellent strength, precision and surface finish. It is widely used in high-end fields such as aerospace, national defense and military industry, machinery and electronics, and its product added value is extremely high [16-17]. With the rapid development of micro-forming field, various kinds of micro-devices and products are emerging, and the demand for raw materials of precision stainless steel foil is rapid, which puts forward higher requirements for its mechanical properties and structure properties [18-19]. There are only several layers of grains in the thickness direction of stainless steel foil, with obvious anisotropy and significant size effect [20-21].
Strip rolling is a pressure forming process that drags the rolled piece into the roll gap by the contact friction between the rotating roll and the rolled piece, and is driven by the friction force, that is, the friction force is the main force for the movement of the rolled piece. Due to the effect of friction on the contact surface of the rolled piece, the deformed surface will be scratched. The abrasion of the roll will reduce its accuracy, shorten its service life and affect the quality of the finished product. It can be seen that the friction condition is one of the most important boundary conditions in the analysis of plate-strip rolling deformation. Liu [22] used MSC. Marc finite element software to establish a three-dimensional thermal-mechanical coupling finite element model of wide and heavy plate hot rolling process, and studied the influence of friction on broadsiding. The average broadsiding of rolled pieces decreases with the increase of friction coefficient. Huang [23] analyzed the influence of the asymmetry of friction coefficient on the vibration characteristics and stability of the rolling mill system by establishing a rolling model with friction coefficient asymmetry. Wu [24] studied the influence of roll gap friction coefficient on the vibration of cold rolling mill through experiments, which showed that increasing the roll gap friction coefficient appropriately could effectively suppress and offset the vibration of cold rolling mill. Luo [25] established a finite element model of AZ31 magnesium alloy ring hot rolling based on ABAQUS software, and analyzed the influence of friction coefficient on the forming ring. The results show that with the increase of friction coefficient, the strain distribution of the formed ring is more uniform, while the rolling force and rolling torque do not change significantly.
At present, the influence mechanism of friction on the micro-plastic deformation of the surface and thickness direction of the rolled piece during the rolling process of SUS304 foil has not been revealed clearly from the mesoscopic scale. Based on the crystal plasticity finite element method and Voronoi diagram principle, a crystal plasticity finite element model is established in this paper. The effects of different friction coefficients (0.05, 0.075, 0.1) based on Coulomb friction law on the micro-uneven deformation, slip system motion state and grain rotation of rolled SUS304 foil were studied on the grain scale.
2. Rolling test
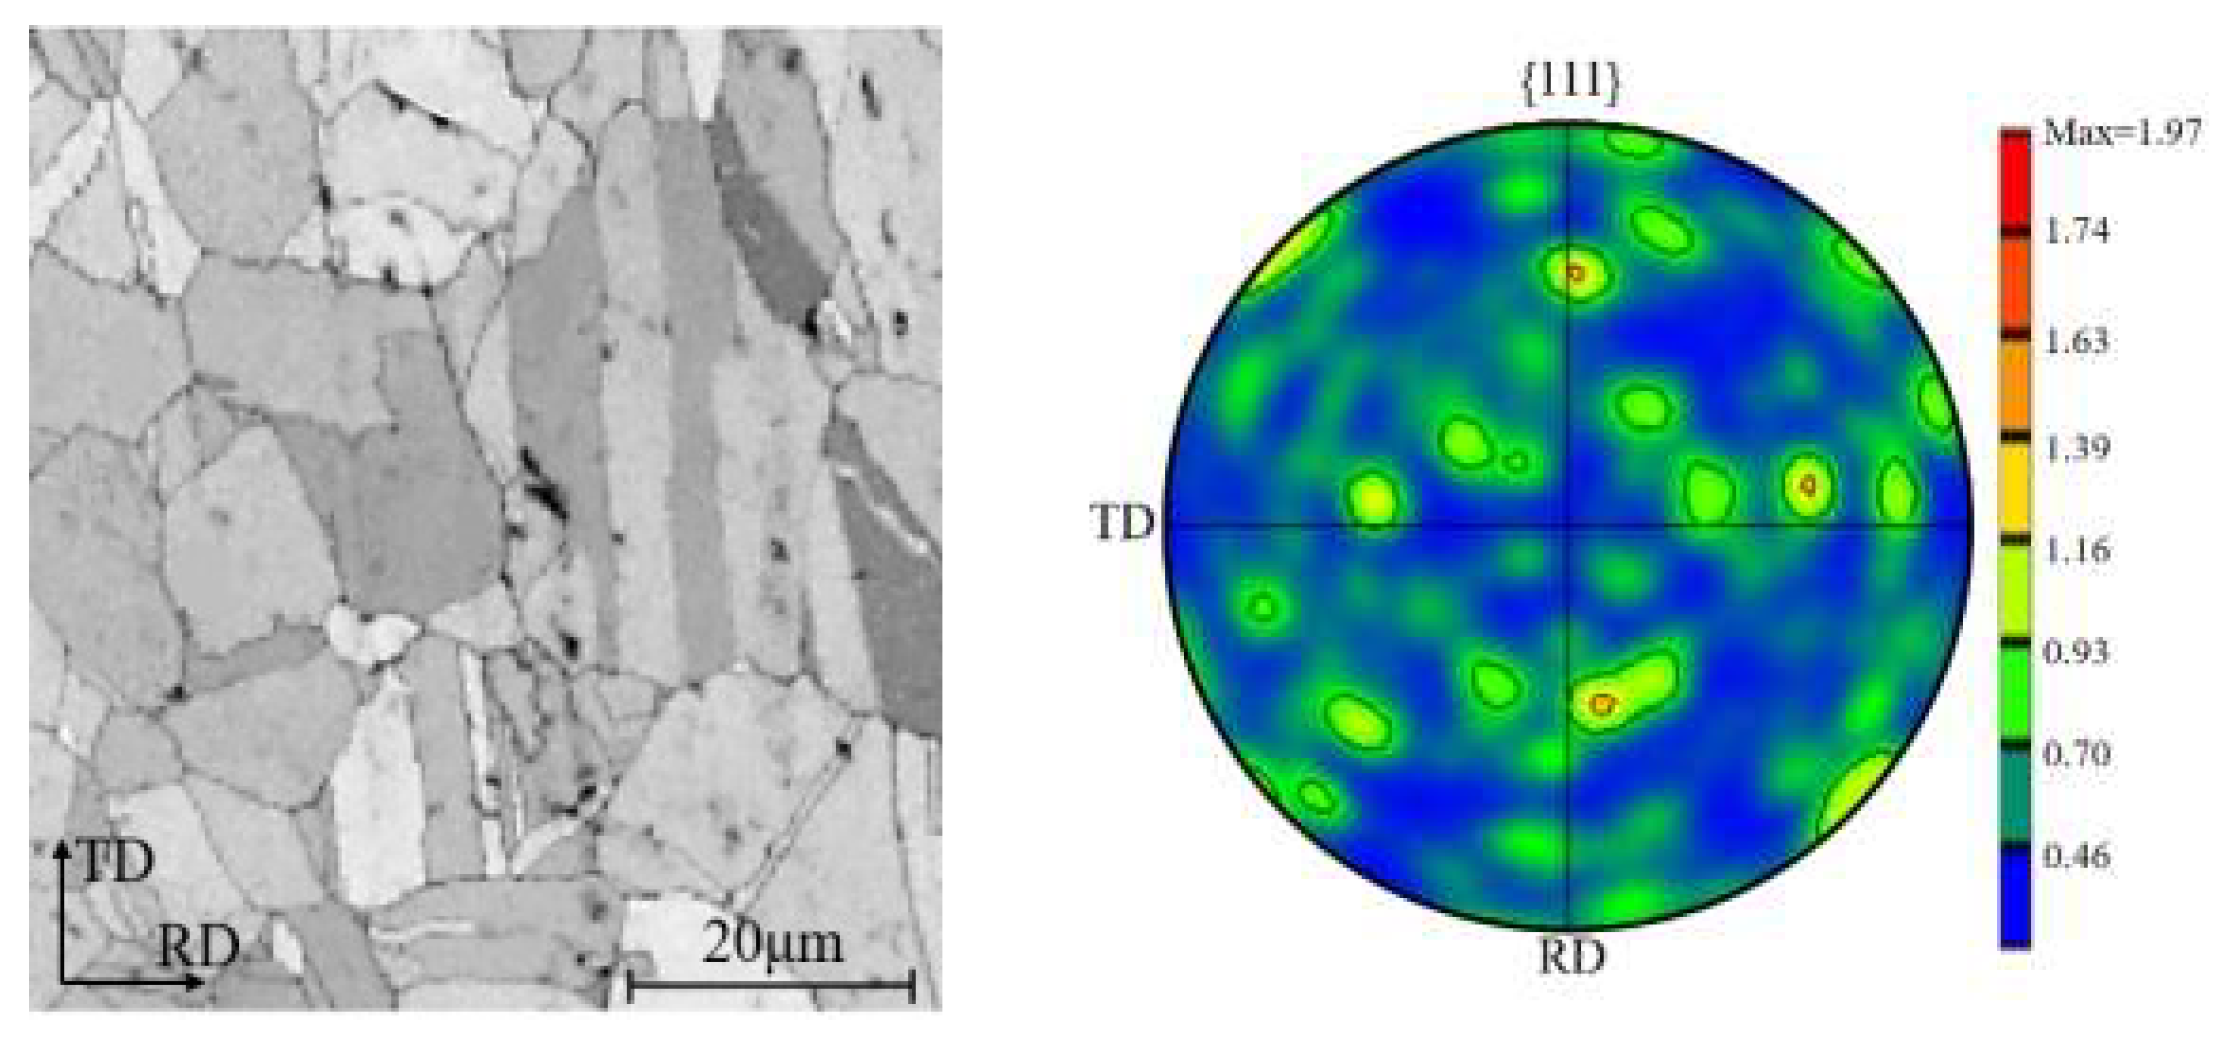
The raw materials used in the rolling experiment are SUS304 stainless steel foil strips with a size of 5000 mm (length) * 68 mm (width) * 0.05 mm (thickness) after cold rolling and annealing. The chemical composition is shown in Table 1. The XRD phase composition of the raw materials was tested (Fig.1). The results showed that the main phase composition of the SUS304 stainless steel foil was face-centered cubic austenite. The main physical mechanism of plastic deformation of face-centered cubic metals at room temperature is dislocation slip [26]. The dislocation slip motion occurs in the {111} <110> 12 slip systems shown in Table 2. The single crystal elastic constants of austenite phase are C11 = 209 GPa, C12 = 133 GPa, C44 = 121 GPa [27]. The EBSD test results of the raw materials are as shown in figure 2. The average grain size of the 304 stainless steel foil strip is about 15 , and the maximum pole density intensity is about 1.97 m.r.d, indicating that the annealed raw material contains almost no texture, and all grain orientations are randomly distributed.
The deformation resistance of 304 stainless steel foil is large and plastic deformation is difficult to occur. Therefore, a tungsten carbide work roll with a diameter of 11.5 mm was used for rolling experiments. The thickness of 304 foil strip after rolling deformation was measured by a ten-thousandth micrometer with an accuracy of 0.1 and the reduction rate was about 20%. In addition, EBSD test was carried out to analyze the change of grain orientation after rolling.
Figure 1.
X-ray diffractogram phase composition test of 304 stainless steel foil.
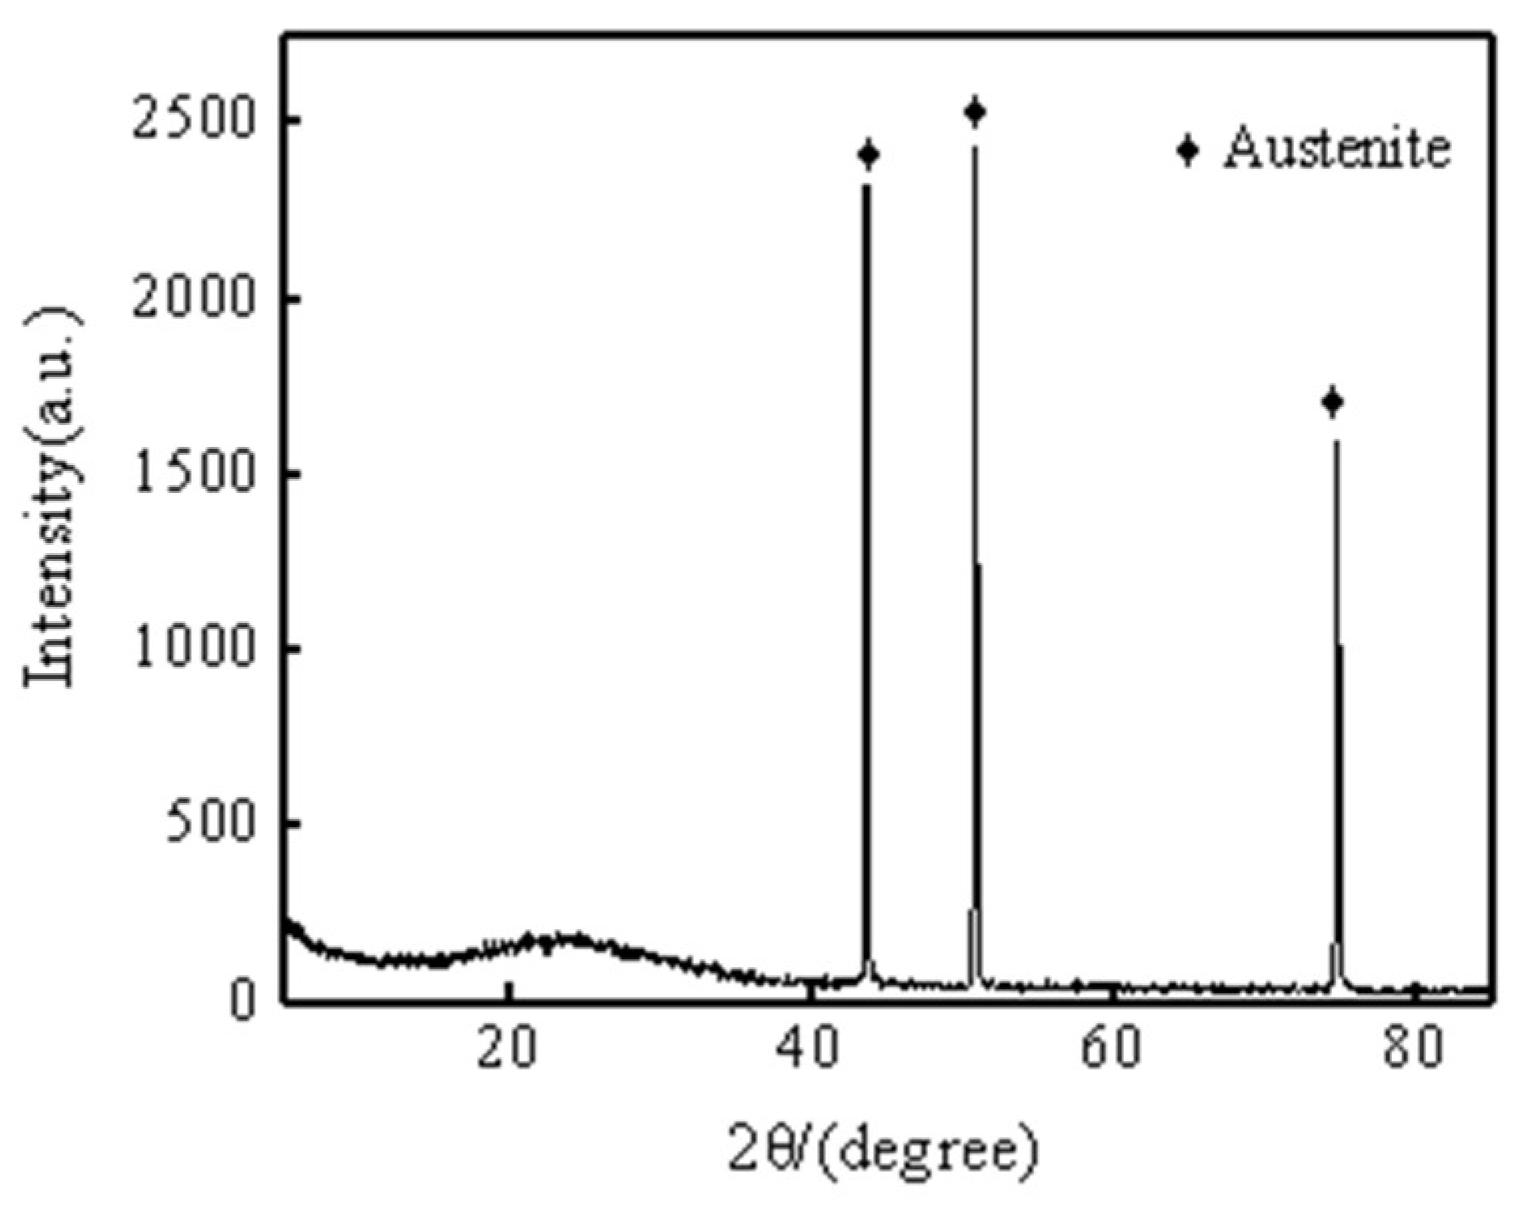
Figure 2.
EBSD map of 304 stainless steel foil: (a) grain morphology (b) {111} pole figure.
3. Results
3.1. Crystal plasticity theory
Based on the continuum deformation theory and the deformation gradient decomposition, the total deformation gradient is decomposed into the elastic deformation gradient of lattice distortion and rigid body rotation () and the plastic deformation gradient of dislocation slip () by using the rate-dependent crystal plasticity constitutive relation proposed by Asaro et al. [28].
At room temperature, the plastic deformation of face-centered cubic metals is dominated by dislocation slip, which can be treated as plastic shear strain [29]. According to Schmid, E. [30], the relationship between the shear strain rate and the shear stress of each slip system is established in the form of an exponential function. The shear stress of the slip system is the driving force of the dislocation slip motion. When it exceeds the critical value , the slip system starts.
Where is the reference shear strain rate of slip system; n is the rate-sensitive coefficient, and are viscoelastic and rate-independent, respectively. is the shear stress of slip system ; is the critical shear stress of slip system , and the critical shear strain rate can be expressed as:
Where is the shear strain rate of the -th slip system; is the latent hardening coefficient, and N is the number of slip systems.
Using different slip coefficients proposed by Bassani, J.L. and Wu, T.Y. [31] to describe the interaction between different slip systems, the slip deformation process of FCC metal in three hardening stages can be described more accurately. Here, the expression of the self-hardening modulus is as follows:
Where is the initial hardening rate; is the hardening model at the easy sliding stage; is the initial critical resolved shear stress; is the saturation value of critical resolved shear stress; is the reference shear strain; and are the cumulative shear strain of slip system and , respectively; is the self-hardening coefficient and is the ratio of latent-hardening coefficient to self-hardening coefficient. is the interaction coefficient between the and slip system, which is expressed by five constants a1-a5.
The numerical integration method of implicit differential equation is used to solve the rate-dependent crystal plasticity constitutive equation. The above equation is written as a user subroutine UMAT in Fortran language, which is used to simulate the plastic deformation process of polycrystalline by ABAQUS software.
There are some unknown crystal plasticity parameters in the above crystal plasticity constitutive equation, which involve the microscopic properties of the material and are difficult to be measured directly by experiments. For the 304 stainless steel foil used in this paper, the author established a representative volume element (RVE) uniaxial tensile model to simulate the tensile deformation, and constantly adjusted the crystal plasticity parameters to be determined. By comparing the stress-strain curves of tensile simulation and tensile test, the crystal plasticity parameters listed in Table 3 were calibrated [32].
3.2. Establishment of Rolling Model
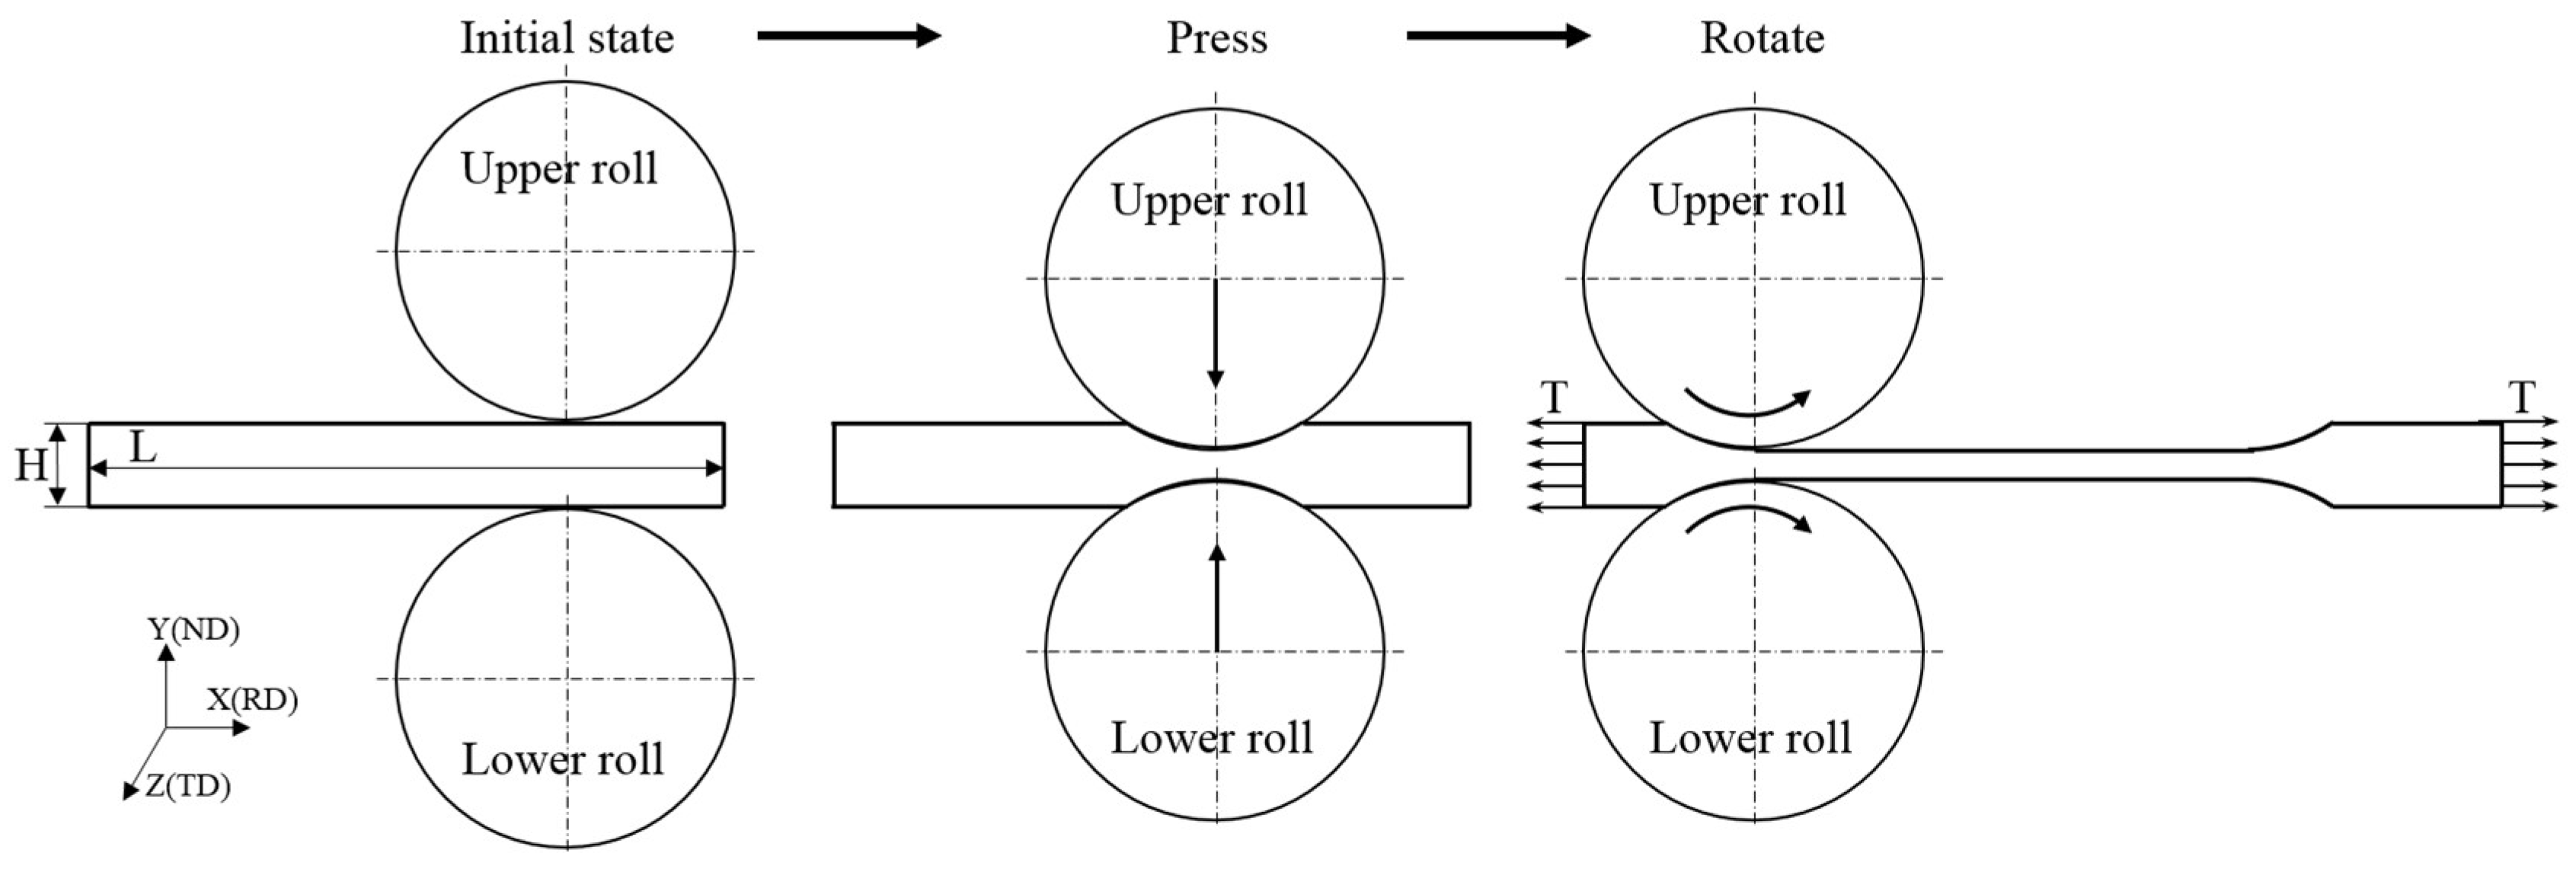
The rolling of 304 stainless steel foil strip is simplified to two-dimensional plane strain deformation. The rolling direction RD is X-axis, the normal ND is Y-axis, and the transverse TD is Z-axis. According to the EBSD test results of raw materials, based on the Voronoi polyhedron principle, a geometric structure model of 304 stainless steel foil with an average grain size of about 15 m, random grain orientation distribution and a thickness of 0.05 mm was established, as shown in figure 3. The model consists of 306 grains, with an average of about 64 regular quadrilateral plane strain reduction integral units (CPE4R) in each grain, which makes the grain boundaries jagged. The serrated grain boundary is not easy to distort and has high convergence, which greatly reduces the load on computer hardware and ensures the accuracy of plastic deformation simulation [33]. The above polycrystalline geometric structure model is imported into ABAQUS software. Combined with the rolling experiment, a reasonable boundary condition is set up to establish a complete 304 stainless steel foil rolling model. The specific rolling process is shown in figure 4. The friction coefficient μ based on the Coulomb friction law between the roll and the rolled piece is set, which remains unchanged throughout the rolling deformation process.
Figure 3.
Crystal geometry model of 304 stainless steel foil.
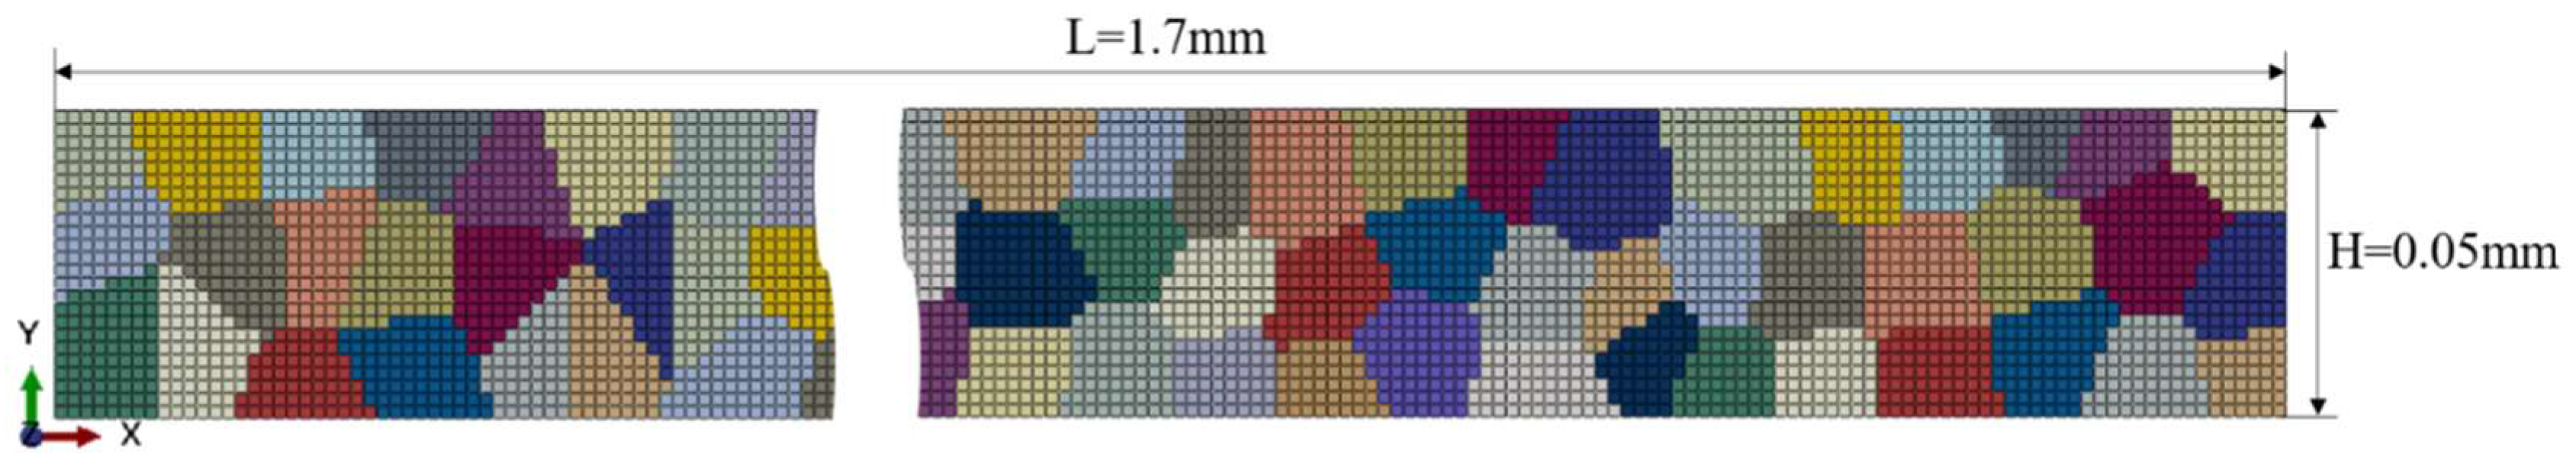
Figure 4.
Sketch of the rolling model of 304 stainless steel foil.
3.3. Verification of Rolling Model
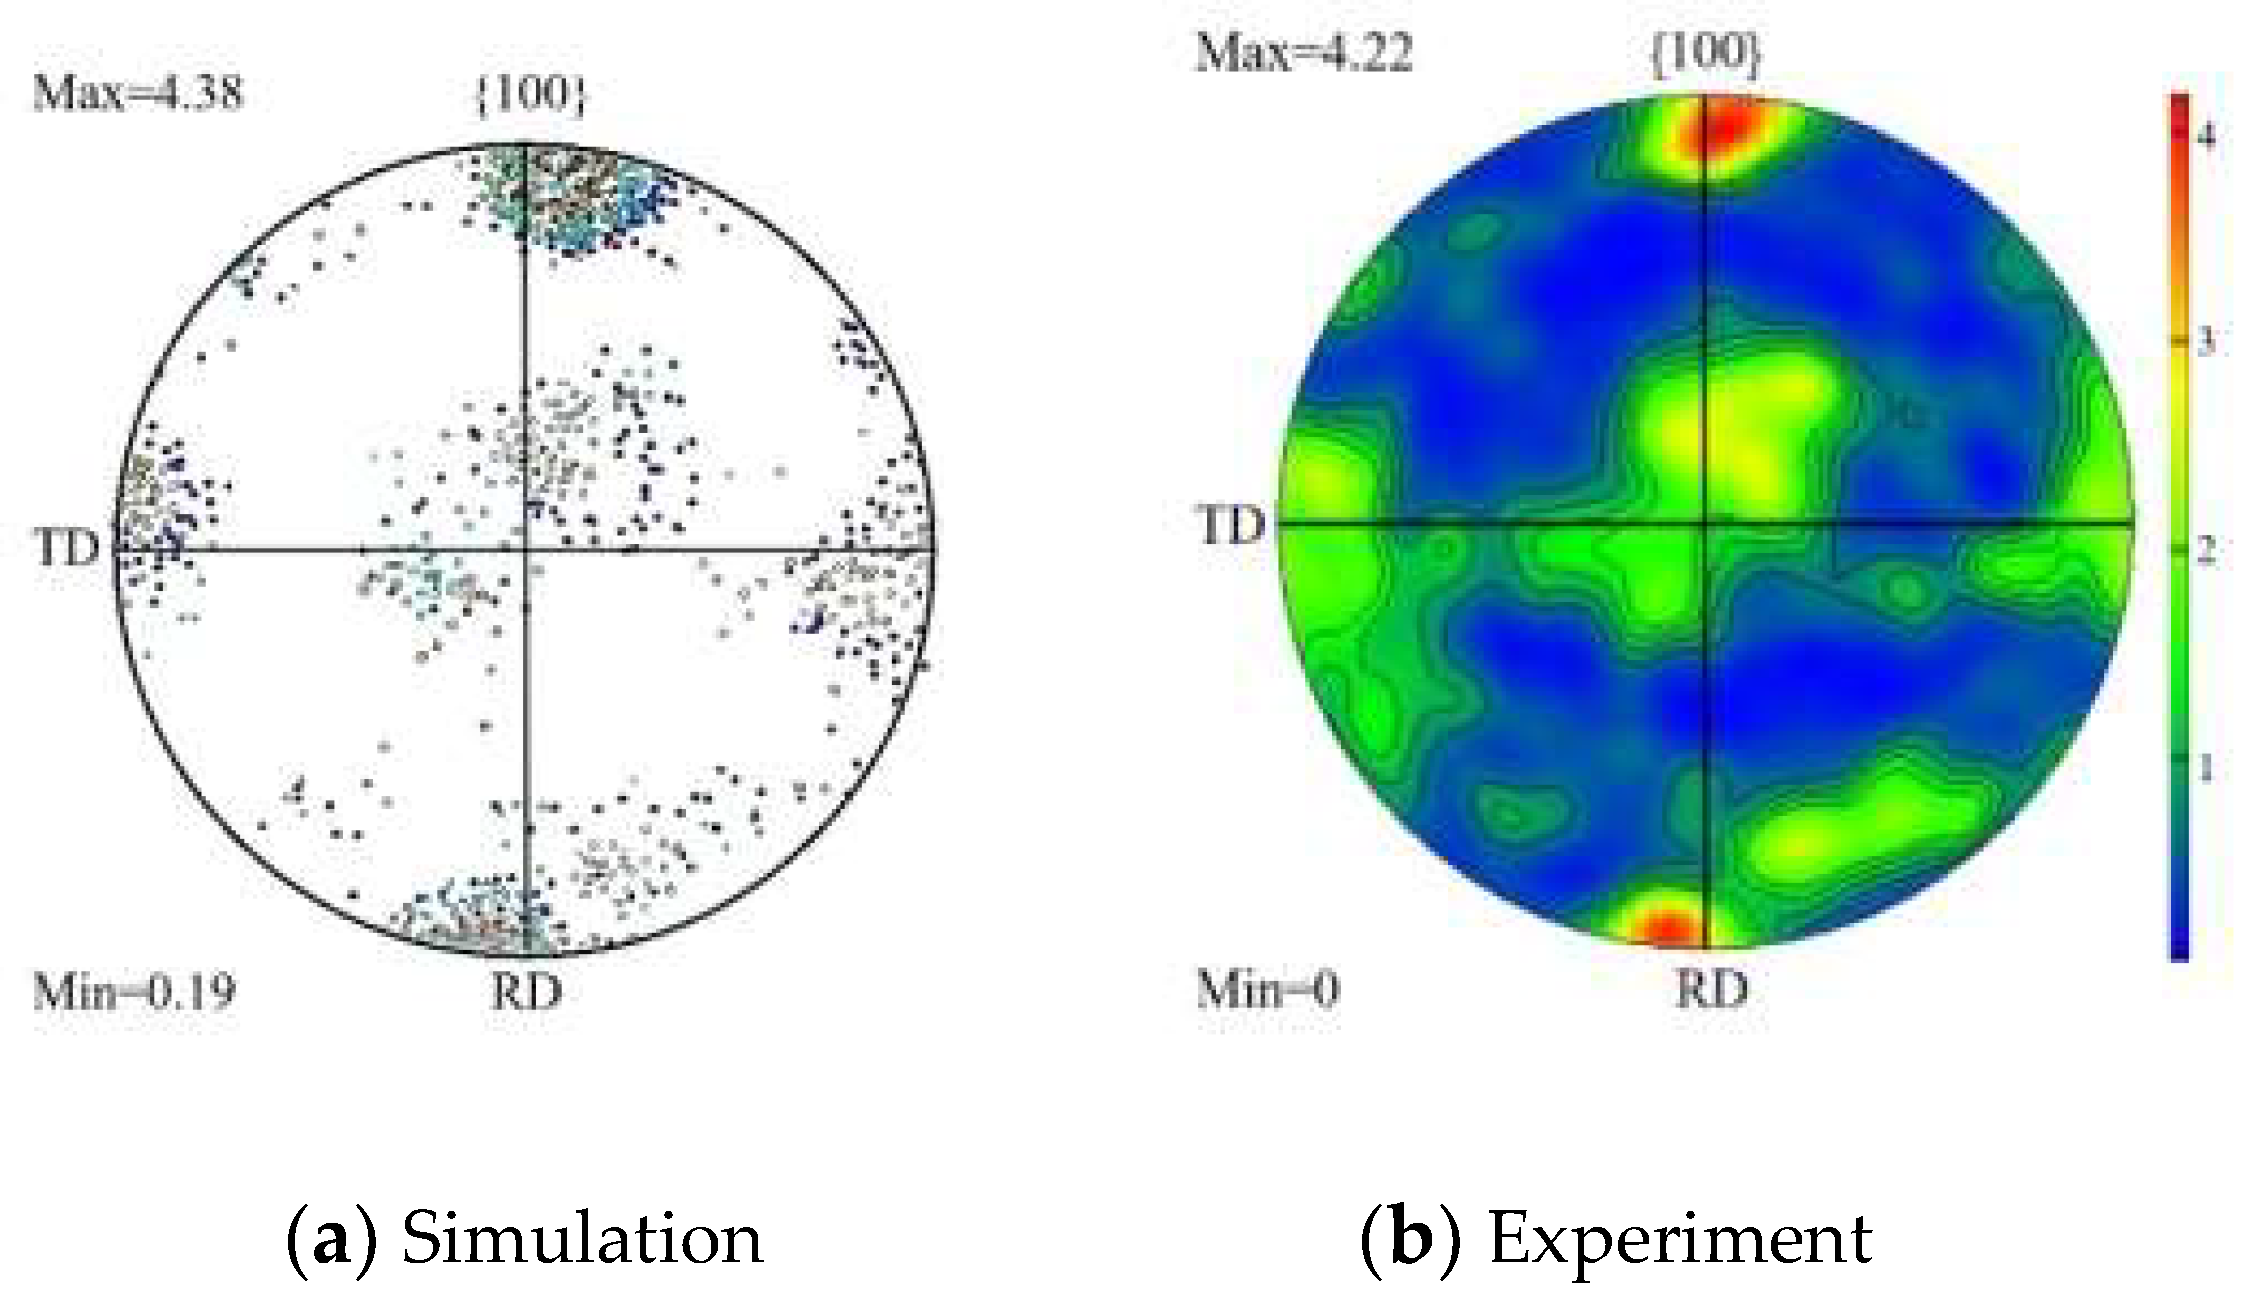
The rolling deformation of 304 stainless steel foil strip was simulated under the same process parameters, and the grain orientation information after rolling deformation was extracted. figure 5 shows the comparison between the simulation of 20% rolling reduction and the {100} pole diagram of the experimental results. It can be seen from the figure that when the rolling reduction rate of 304 stainless steel foil strip is 20%, the {110} <100> Gaussian texture is formed. It shows that during the rolling deformation of stainless steel foil strip, most grains rotate to the {110} <100> direction under the influence of interaction and rolling force, forming the {110} <100> Gaussian texture. The simulation results are in good agreement with the texture evolution results measured by EBSD (extreme density strength and distribution), which verifies the accuracy of the crystal plasticity finite element model of 304 stainless steel foil strip rolling.
Figure 5.
Comparison of {100} pole figures at 20% rolling reduction.
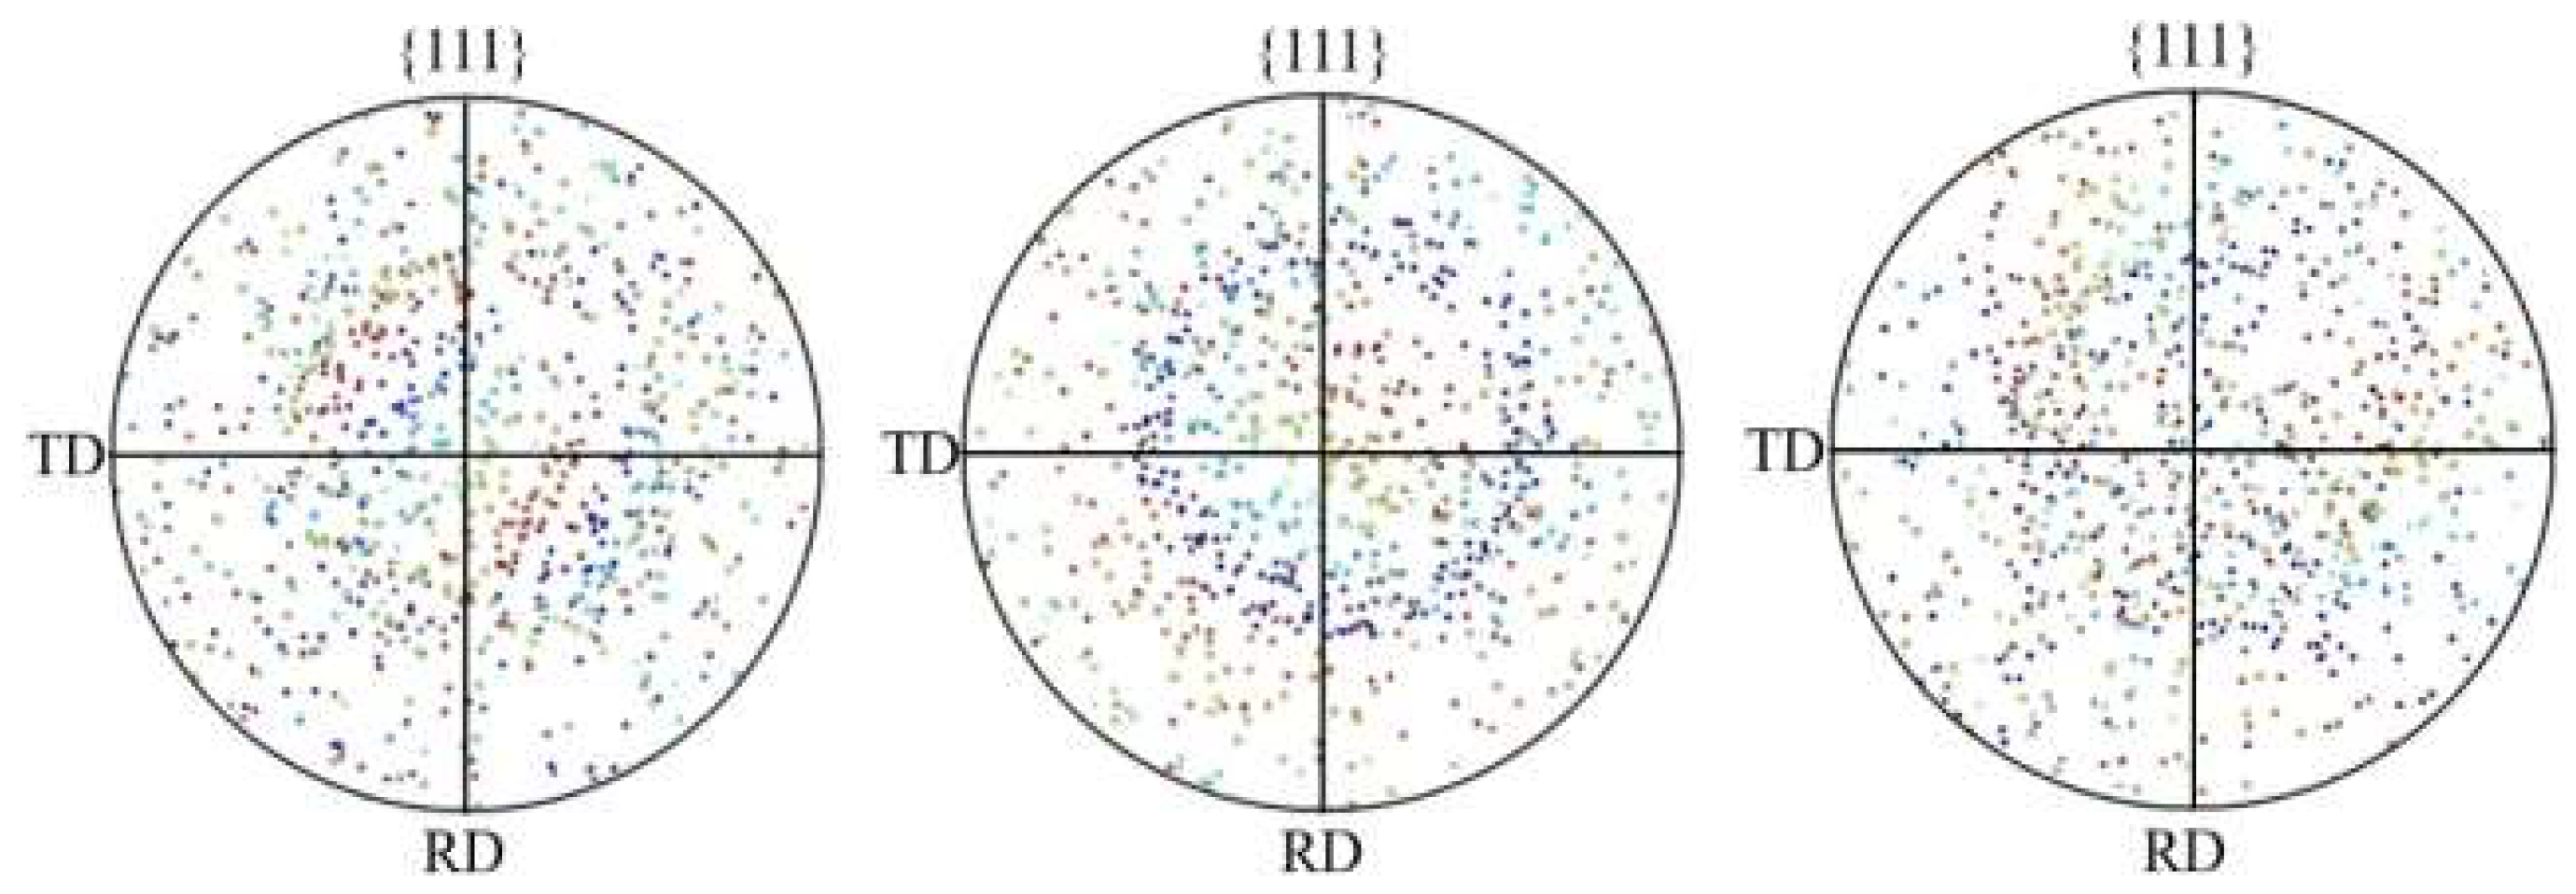
In order to study the influence of friction conditions between roll and 304 stainless steel foil on rolling deformation, this paper describes the interaction characteristics based on Coulomb friction law, and analyzes the rolling force, micro-uneven deformation, dislocation slip and grain orientation changes during the rolling deformation of 304 stainless steel foil when the friction coefficient μ is 0.05, 0.075 and 0.1, respectively. In order to reduce the influence of random grain orientation as much as possible, three kinds of random grain orientations are assigned to each friction coefficient μ rolling model, as shown in figure 6, and randomly generated in the Euler space of the (90°, 90°, 90°) value range by MATLAB software programming.
Figure 6.
{111} pole figures before deformation with three random orientations: (a) orientation 1 (b) orientation 2 (c) orientation 3.
Figure 6.
{111} pole figures before deformation with three random orientations: (a) orientation 1 (b) orientation 2 (c) orientation 3.
4. Results and Discussion
4.1. Rolling force
The relationship between rolling force and friction coefficient obtained by rolling deformation simulation under three different grain orientations is shown in figure 7. The change of micro-grain orientation will not significantly affect the average rolling force of the macro-rolling model. Therefore, the random grain orientation 1 model is selected to analyze the meso-mechanical behavior of the rolling deformation zone. It can be seen from the figure that with the increase of friction coefficient, the rolling force of the rolled piece to the roll increases at the same rolling reduction rate. The simulation results are the same as the influence of friction coefficient on rolling force in Reference [34], which further verifies the accuracy of the established rolling model.
Figure 7.
The relationship between rolling force and friction coefficient under different orientations.
Figure 7.
The relationship between rolling force and friction coefficient under different orientations.
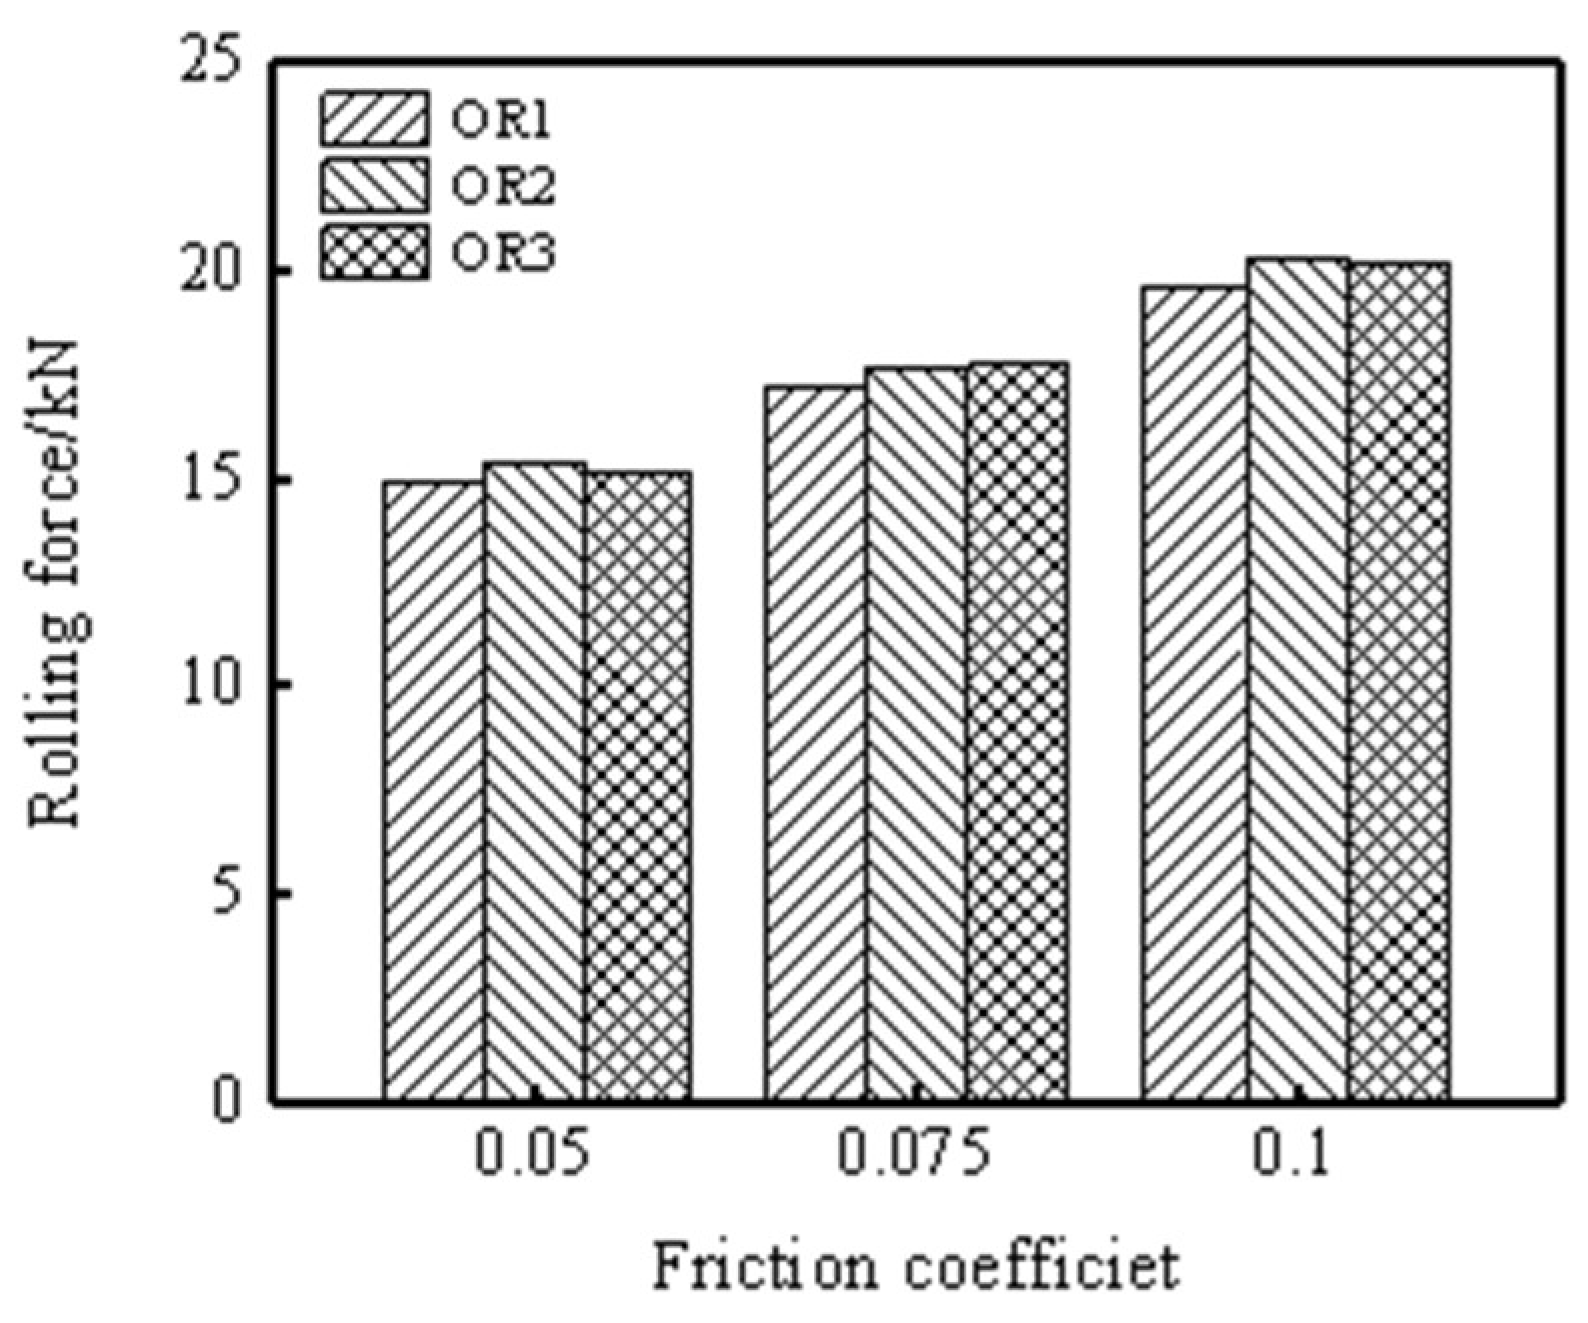
Figure 8 shows the contact pressure and friction stress in the rolling deformation zone of the model under different friction coefficients. The vertical stripe position in the figure indicates the grain boundary of the ultra-thin strip in contact with the upper and lower rolls. It can be seen from the figure that the contact pressure and friction stress fluctuate significantly in the rolling deformation zone, and they change sharply at the grain boundary and inside the grain. This is mainly due to the difference of grain morphology, orientation and deformation degree, which makes the contact position of grain boundary and grain interior may be the position where the contact pressure and friction stress are the largest. Due to the random distribution of grain morphology and grain orientation in the ultra-thin strip rolling model, the number of grains in contact with the upper and lower rolls in the rolling deformation zone is different, so the contact pressure and friction stress of the upper and lower rolls are no longer symmetrical.
As shown in the figure, the contact pressure and friction stress of the upper and lower rollers in the rolling deformation zone increase slightly with the increase of the friction coefficient. Among them, the change of friction coefficient has a great influence on the friction stress, and the friction stress at each position increases in multiples with the increase of friction coefficient.
4.2. Dislocation Slip
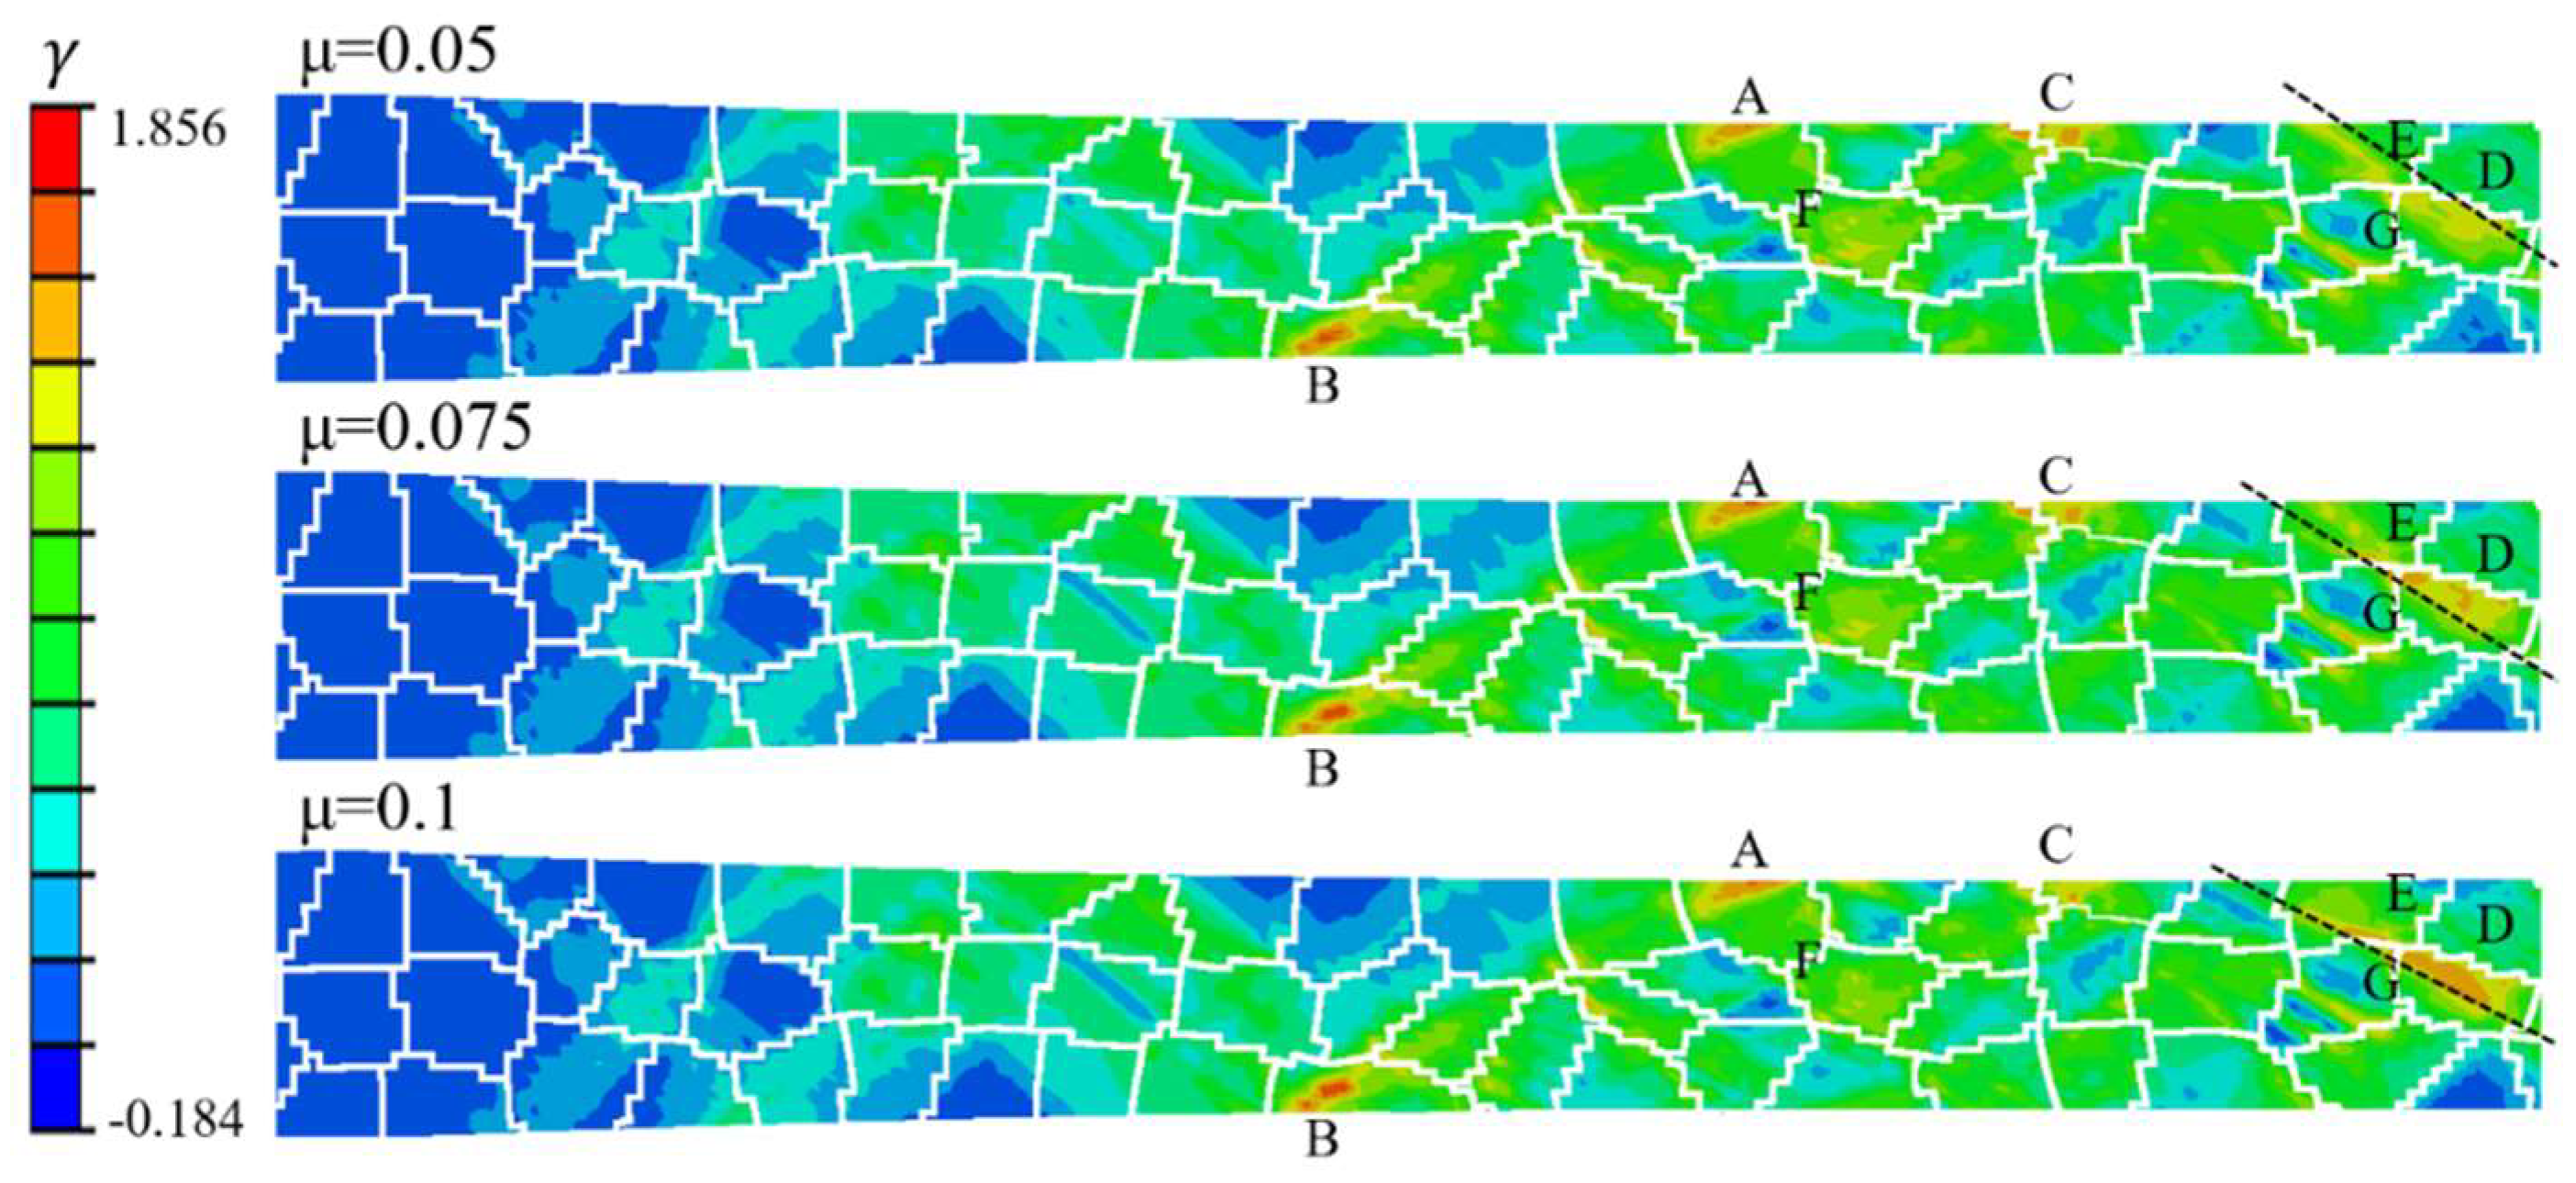
The cumulative shear slip distribution in the rolling deformation zone of the model under the same friction coefficient is shown in figure 9. The number of grains in the rolling deformation zone is small, and the cumulative shear slip distribution of each model is very uneven. Most of them are concentrated in the surface layer of the grains in contact with the upper and lower rolls, such as positions A, B, and C, and some grains inside, such as positions D, E, and F. There are even dislocation slip deformations with opposite directions in the same grain, such as grain G. The dislocation slip deformation in opposite directions is beneficial to promote the formation of subgrains. The dislocation slip in the rolling deformation zone is mostly initiated near the grain surface and grain boundary in contact with the roll, gradually expands to the interior of the less constrained grains, and then accumulates near the grain boundary. Some can even cross the grain boundary to form shear slip bands throughout the entire grain, such as positions D and E. As shown in the figure, with the increase of friction coefficient, the cumulative shear slip in the rolling deformation zone increases slightly, which has a great influence on the shear slip deformation near the surface of the ultra-thin strip.
Figure 9.
Distribution of cumulative shear strain in the rolling deformation zone under different friction coefficient.
Figure 9.
Distribution of cumulative shear strain in the rolling deformation zone under different friction coefficient.
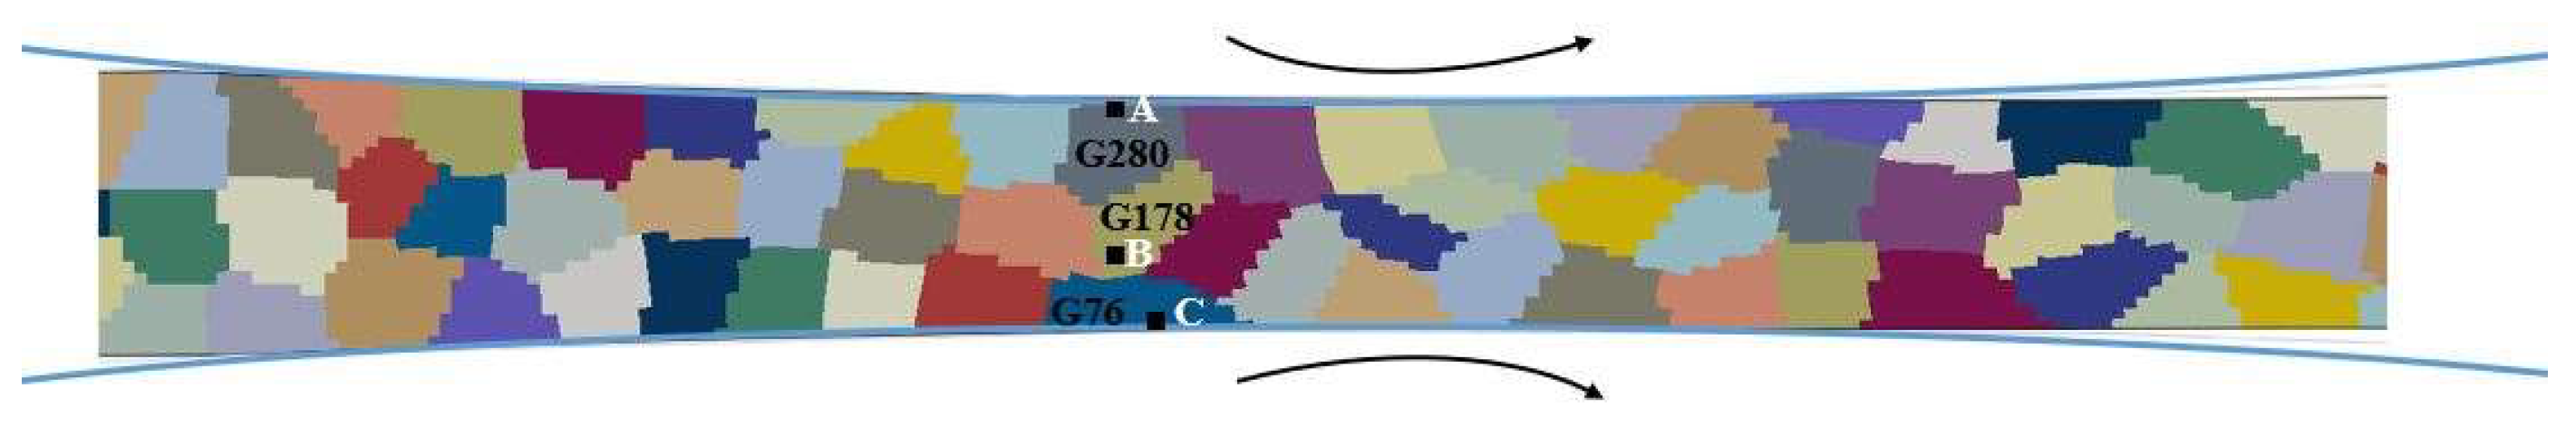
In order to better understand the influence of friction conditions on dislocation slip in rolling deformation of 304 stainless steel foil strip, the upper node A, the middle node B and the lower node C (as shown in figure 10) in the rolling deformation zone are selected. The shear strain of the slip system is used to represent the start-stop motion, slip deformation and dislocation slip direction of each slip system, and the influence of friction coefficient on the motion state of slip system at each position is analyzed. According to the crystal plasticity theory, the negative value of the slip shear strain indicates that the dislocation slips along the opposite direction of the slip system.
Figure 10.
Schematic diagram of the rolling deformation zone.
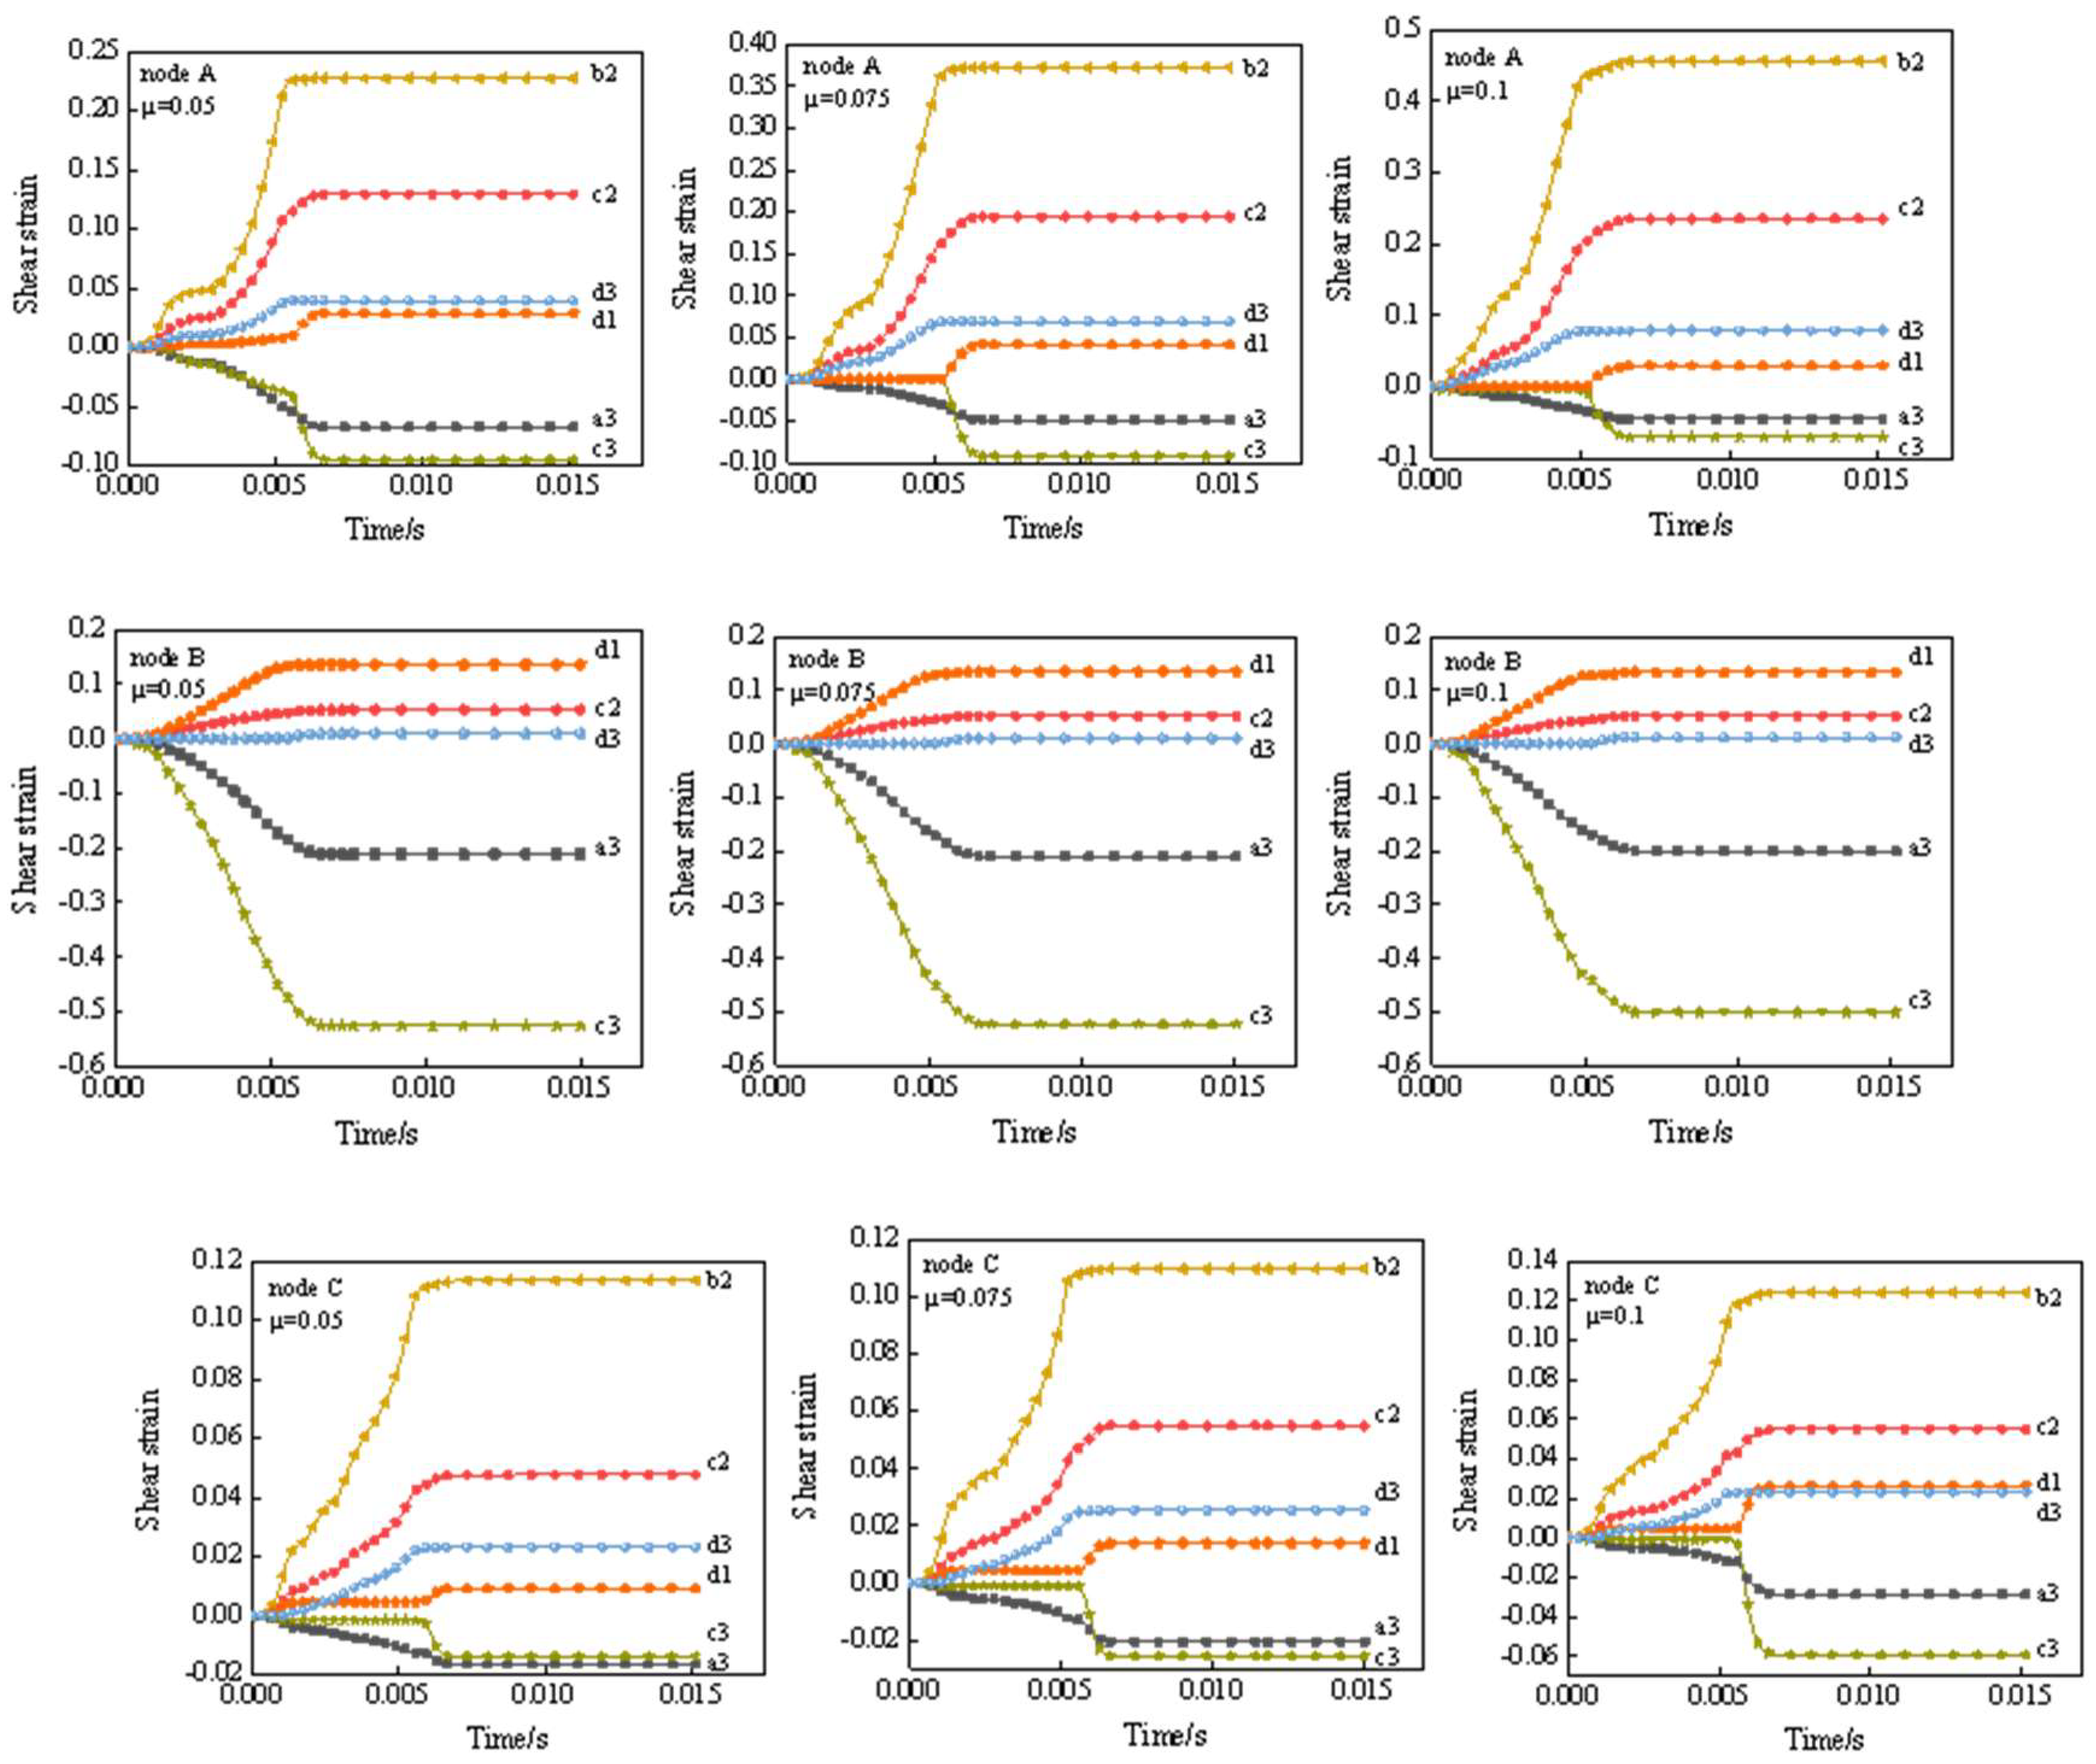
The relationship between the shear strain of each slip system at each position in the rolling deformation zone and the rolling time is shown in figure 11. The types and quantities of activated slip systems at each position are not exactly the same, and the motion states of each activated slip system are very different. The shear strains of slip systems b2, c2, d3 and d1 at joints A and C are positive, indicating that the dislocation slips along the positive direction. The slip systems a3 and c3 slip along the opposite direction. It can be seen from the figure that the change of friction coefficient almost does not affect the motion state of the slip system at the central node B. However, the motion state of the activated slip system at nodes A and C is greatly affected by the change of friction coefficient. The shear strain of slip systems b2, c2 and d3 at the upper surface node A increases significantly with the increase of friction coefficient, and the shear strain of slip system d1 remains basically unchanged, while the slip systems a3 and c3 decrease slightly with the increase of friction coefficient. At the same time, the activation time of the slip system d1 and c3 increases with the increase of the friction coefficient. As the friction coefficient increases, the shear strain of slip systems b2, c2 and d1 at the lower surface node C increases. At this time, the shear strain of slip system d3 remains unchanged, while the dislocation slip deformation of slip system c3 along its opposite direction increases significantly. The results show that the change of friction coefficient significantly affects the motion state of the activated slip system at the upper and lower surfaces of the 304 foil strip. The type and number of activated slip systems under different friction coefficients basically do not change, but the increase of friction coefficient significantly increases the shear strain of the activated slip system at the upper and lower surfaces.
Figure 11.
The relationship between shear strain and rolling time of slip systems in nodes A, B and C of the rolling deformation zone under different friction coefficient.
Figure 11.
The relationship between shear strain and rolling time of slip systems in nodes A, B and C of the rolling deformation zone under different friction coefficient.
4.2. Grain Rotation
Figure 12 shows the grain orientation changes of grain G280, G178 and G76 at the upper, middle and lower positions of the rolling deformation zone under different friction coefficients. As shown in the figure, G178 is in the middle of the rolling deformation zone, which is less affected by the change of friction coefficient. With the change of friction coefficient on the surface of the ultra-thin strip, the grain orientation of G178 hardly changes. When the friction coefficient is small, G280 diffuses about 20° along the RD direction. As the friction coefficient increases, G280 diffuses at a large angle along the RD direction and diffuses around the ND direction. When the friction coefficient is 0.05, the maximum dispersion angle of G76 along the RD direction is about 70°. When the friction coefficient is 0.1, the dispersion degree of G76 around the ND direction increases by about 10°-15°. The results show that increasing the friction coefficient of the surface of the ultra-thin strip will not affect the orientation change of the intermediate layer grains. However, it will significantly increase the dispersion degree of the upper and lower surface layer grains around the ND direction.
5. Conclusions
- As the friction coefficient increases, the surplus frictional force increases, the contact pressure and friction stress of the upper and lower rolls in the rolling deformation zone increase slightly, and the length of the forward slip zone increases, so the rolling force required under the same rolling reduction rate increases significantly.
- The contact pressure and friction stress fluctuate significantly in the rolling deformation zone, and they change sharply at the grain boundary and inside the grain. And the contact pressure and friction stress of the upper and lower rolls are not symmetrical. The contact pressure and friction stress of the upper and lower rolls in the rolling deformation zone increase slightly with the increase of the friction coefficient. Among them, the change of friction coefficient has a great influence on the friction stress, and the friction stress at each position increases exponentially with the increase of friction coefficient.
- The change of friction coefficient has a great influence on the shear slip of the surface layer of the foil strip, which significantly affects the motion state of the activated slip system at the upper and lower surface positions of the foil strip, significantly improves the shear strain of the activated slip system at the upper and lower surface positions, and increases the dispersion degree of the grains in the upper and lower surface layers around the ND direction.
References
- Li, X.X.; Xu, D.S. CPFEM Study of High Temperature Tensile Behavior of Duplex Titanium Alloy. Chin. J. Mater. Res. 2019, 33, 241–253. [Google Scholar]
- Wang, J.; Jiang, W. Numerical assessment on fatigue damage evolution of materials at crack tip of CT specimen based on CPFEM. Theor. Appl. Fract. Mech. 2020, 109, 102687. [Google Scholar] [CrossRef]
- Adzima, F.; Balan, T.; Manach, P.Y. Springback prediction for a mechanical micro connector using CPFEM based numerical simulations. Int. J. Mater. Form. 2019, 2, 649–659. [Google Scholar] [CrossRef]
- Asim, U.B.; Siddiq, A.; Kartal, M.E. A CPFEM based study to understand the void growth in high strength dual-phase titanium alloy (Ti-10V-2Fe-3Al). Int. J. Plast. 2019, 122, 188–211. [Google Scholar] [CrossRef]
- Ren, W.J.; Liu, D.J.; Liu, Q. Influence of texture distribution in magnesium welds on their non-uniform mechanical behavior: A CPFEM study. J. Mater. Sci. Technol. 2020, 46, 168–176. [Google Scholar] [CrossRef]
- Qin, S.P.; Shang, S.L.; Shimanek, J. Macroscopic plastic deformation through an integrated first-principles calculations and finite element simulations: Application to nickel single crystal. ArXiv 2020, arXiv:2022:08552. [Google Scholar]
- Fan, W.W.; Ren, Z.K.; Hou, J. Finite element simulation of mesoscale inhomogeneous deformation in 304 stainless steel foil tensile. Mater. Res. Express 2019, 6, 096540. [Google Scholar] [CrossRef]
- Zhang, C.; Zhang, L.W.; Shen, W.F. 3D Crystal Plasticity Finite Element Modeling of the Tensile Deformation of Polycrystalline Ferritic Stainless Steel. Acta Metall. Sin. 2017, 1, 1–10. [Google Scholar] [CrossRef]
- Qu, F.J.; Jiang, Z.Y.; Xia, W.Z. Evaluation and optimisation of micro flexible rolling process parameters by orthogonal trial design. Int. J. Adv. Manuf. Technol. 2019, 95, 143–156. [Google Scholar] [CrossRef]
- Ren, Z.K.; Fan, W.W.; Hou, J. A numerical study of slip system evolution in ultra-thin stainless steel foil. Materials 2019, 12, 1819–1831. [Google Scholar] [CrossRef]
- Liang, Y.L.; Jiang, S.Y.; Zhang, Y.Q. Deformation Heterogeneity and Texture Evolution of NiTiFe Shape Memory Alloy Under Uniaxial Compression Based on Crystal Plasticity Finite Element Method. J. Mater. Eng. Perform. 2017, 26, 1–12. [Google Scholar] [CrossRef]
- Hu, L.; Zhang, Y.Q. Texture evolution and inhomogeneous deformation of polycrystalline Cu based on crystal plasticity finite element method and particle swarm optimization algorithm. J. Cent. South Univ. 2017, 24, 2747–2756. [Google Scholar] [CrossRef]
- Zhang, H.M.; Dong, X.H. Experimental and numerical studies of coupling size effects on material behaviors of polycrystalline metallic foils in microscale plastic deformation. Mater. Sci. Eng. A. Struct. Mater. : Prop. Microstruct. Process. 2016, 658, 450–462. [Google Scholar] [CrossRef]
- Shang, X.Q.; Zhang, H.M.; Cui, Z.S. A multiscale investigation into the effect of grain size on void evolution and ductile fracture: Experiments and crystal plasticity modeling. Int. J. Plast. 2020, 125, 133–149. [Google Scholar] [CrossRef]
- Amelirad, O.; Assempour, A. Experimental and crystal plasticity evaluation of grain size effect on formability of austenitic stainless steel sheets. J. Manuf. Process. 2019, 47, 310–323. [Google Scholar] [CrossRef]
- Ren, Z.K.; Guo, X.W.; Fan, W.W. Research progress and prospect of precision ultra-thin strip rolling theory. J. Mech. Eng. 2017, 53, 1–9. [Google Scholar] [CrossRef]
- Liu, X.H.; Song, M.; Sun, X.K. Research and application progress of ultra-thin strip rolling. J. Mech. Eng. 2017, 53, 1–9. [Google Scholar]
- Mashalkar, A.; Kakandikar, G.; Nandedkar, V. Micro-forming analysis of ultra-thin brass foil. Mater. Manuf. Process. 2019, 34, 1509–1515. [Google Scholar] [CrossRef]
- Cheng, C.; Wan, M.; Meng, B. Characterization of the microscale forming limit for metal foils considering free surface roughening and failure mechanism transformation. J. Mater. Process. Technol. 2019, 272, 111–124. [Google Scholar] [CrossRef]
- Liu, X.; Xiao, H. Theoretical and experimental study on the producible rolling thickness in ultra-thin strip rolling. J. Mater. Process. Technol. 11652019, 278, 116537. [Google Scholar] [CrossRef]
- Ma, X.G.; Zhao, J.W.; Du, W. An Analysis of Ridging of Ferritic Stainless Steel 430. Mater. Sci. Eng A 2017, 685, 358–366. [Google Scholar] [CrossRef]
- Liu, C.R. Numerical simulation of the influence of friction on the spread of wide and heavy plate during hot rolling. Master, Dalian University of Technology, Dalian, 2016. [Google Scholar]
- Huang, J.L.; Zang, Y.; Gao, Z.Y. Effect of asymmetry of friction coefficient on vibration and stability of rolling mill during hot rolling. J. Beijing Univ. Sci. Technol. 2019, 41, 1465–1472. [Google Scholar]
- Wu, B.S.; Zhang, Y.C. T Effect of roll gap friction coefficient on vibration of cold rolling mill. Forg. Technol. 2015, 40, 92–95. [Google Scholar]
- Luo, X.D.; Liu, H.; Yang, H. Effect of friction coefficient on hot rolled ring of AZ31 magnesium alloy. Hot Process. Technol. 2015, 44, 155–157. [Google Scholar]
- Pi, H.C.; Han, J.T.; Zhang, C.G. Modeling uniaxial tensile deformation of polycrystalline Al using CPFEM. J. Univ. Sci. Technol. Beijing Miner. Metall. Mater. 2018, 15, 43–47. [Google Scholar] [CrossRef]
- Simmons, D.; Wang, H. Single crystal elastic constants and calculated aggregate properties: a handbook; MIT Press: Cambridge (MA), USA, 1970. [Google Scholar]
- Asaro, R.J.; Needleman, A. Texture development and strain hardening in rate dependent polycrystals. Acta Met. 1985, 33, 923. [Google Scholar] [CrossRef]
- Pi, H.C.; Han, J.T.; Tieu, A.K. T. Modeling uniaxial tensile deformation of polycrystalline Al using CPFEM. J. Univ. Sci. Technol. Beijing Miner. Metall. Mater. 2008, 15, 43–47. [Google Scholar] [CrossRef]
- Schmid, E. Plastic of crystal; Oxford University Press: New York, USA, 1935. [Google Scholar]
- Bassani, J.L.; Wu, T.Y. Latent hardening in single crystals II. analytical characterization and predictions. Proc. R. Soc. Lond. A 1991, 435, 21–41. [Google Scholar]
- Fan, W.W.; Wang, T.; Hou, J. Calibration of 304 stainless steel strip parameters based on CPRVE model. J. Plast. Eng. 2019, 26, 268–273. [Google Scholar]
- Zheng, Z.G.; Wang, Z.L.; Feng, Q. A polycrystalline finite element modeling method based on Voronoi diagram. J. Guangxi Univ. (Nat. Sci. Ed. ) 2016, 41, 460–469. [Google Scholar]
- Zhang, X.P.; Qin, J.P. Rolling Theory; Metallurgical Industry Press: Beijing, China, 2006; pp. 167–169. [Google Scholar]
Figure 8.
Contact pressure and friction stress in the rolling deformation zone under different friction coefficient.
Figure 8.
Contact pressure and friction stress in the rolling deformation zone under different friction coefficient.
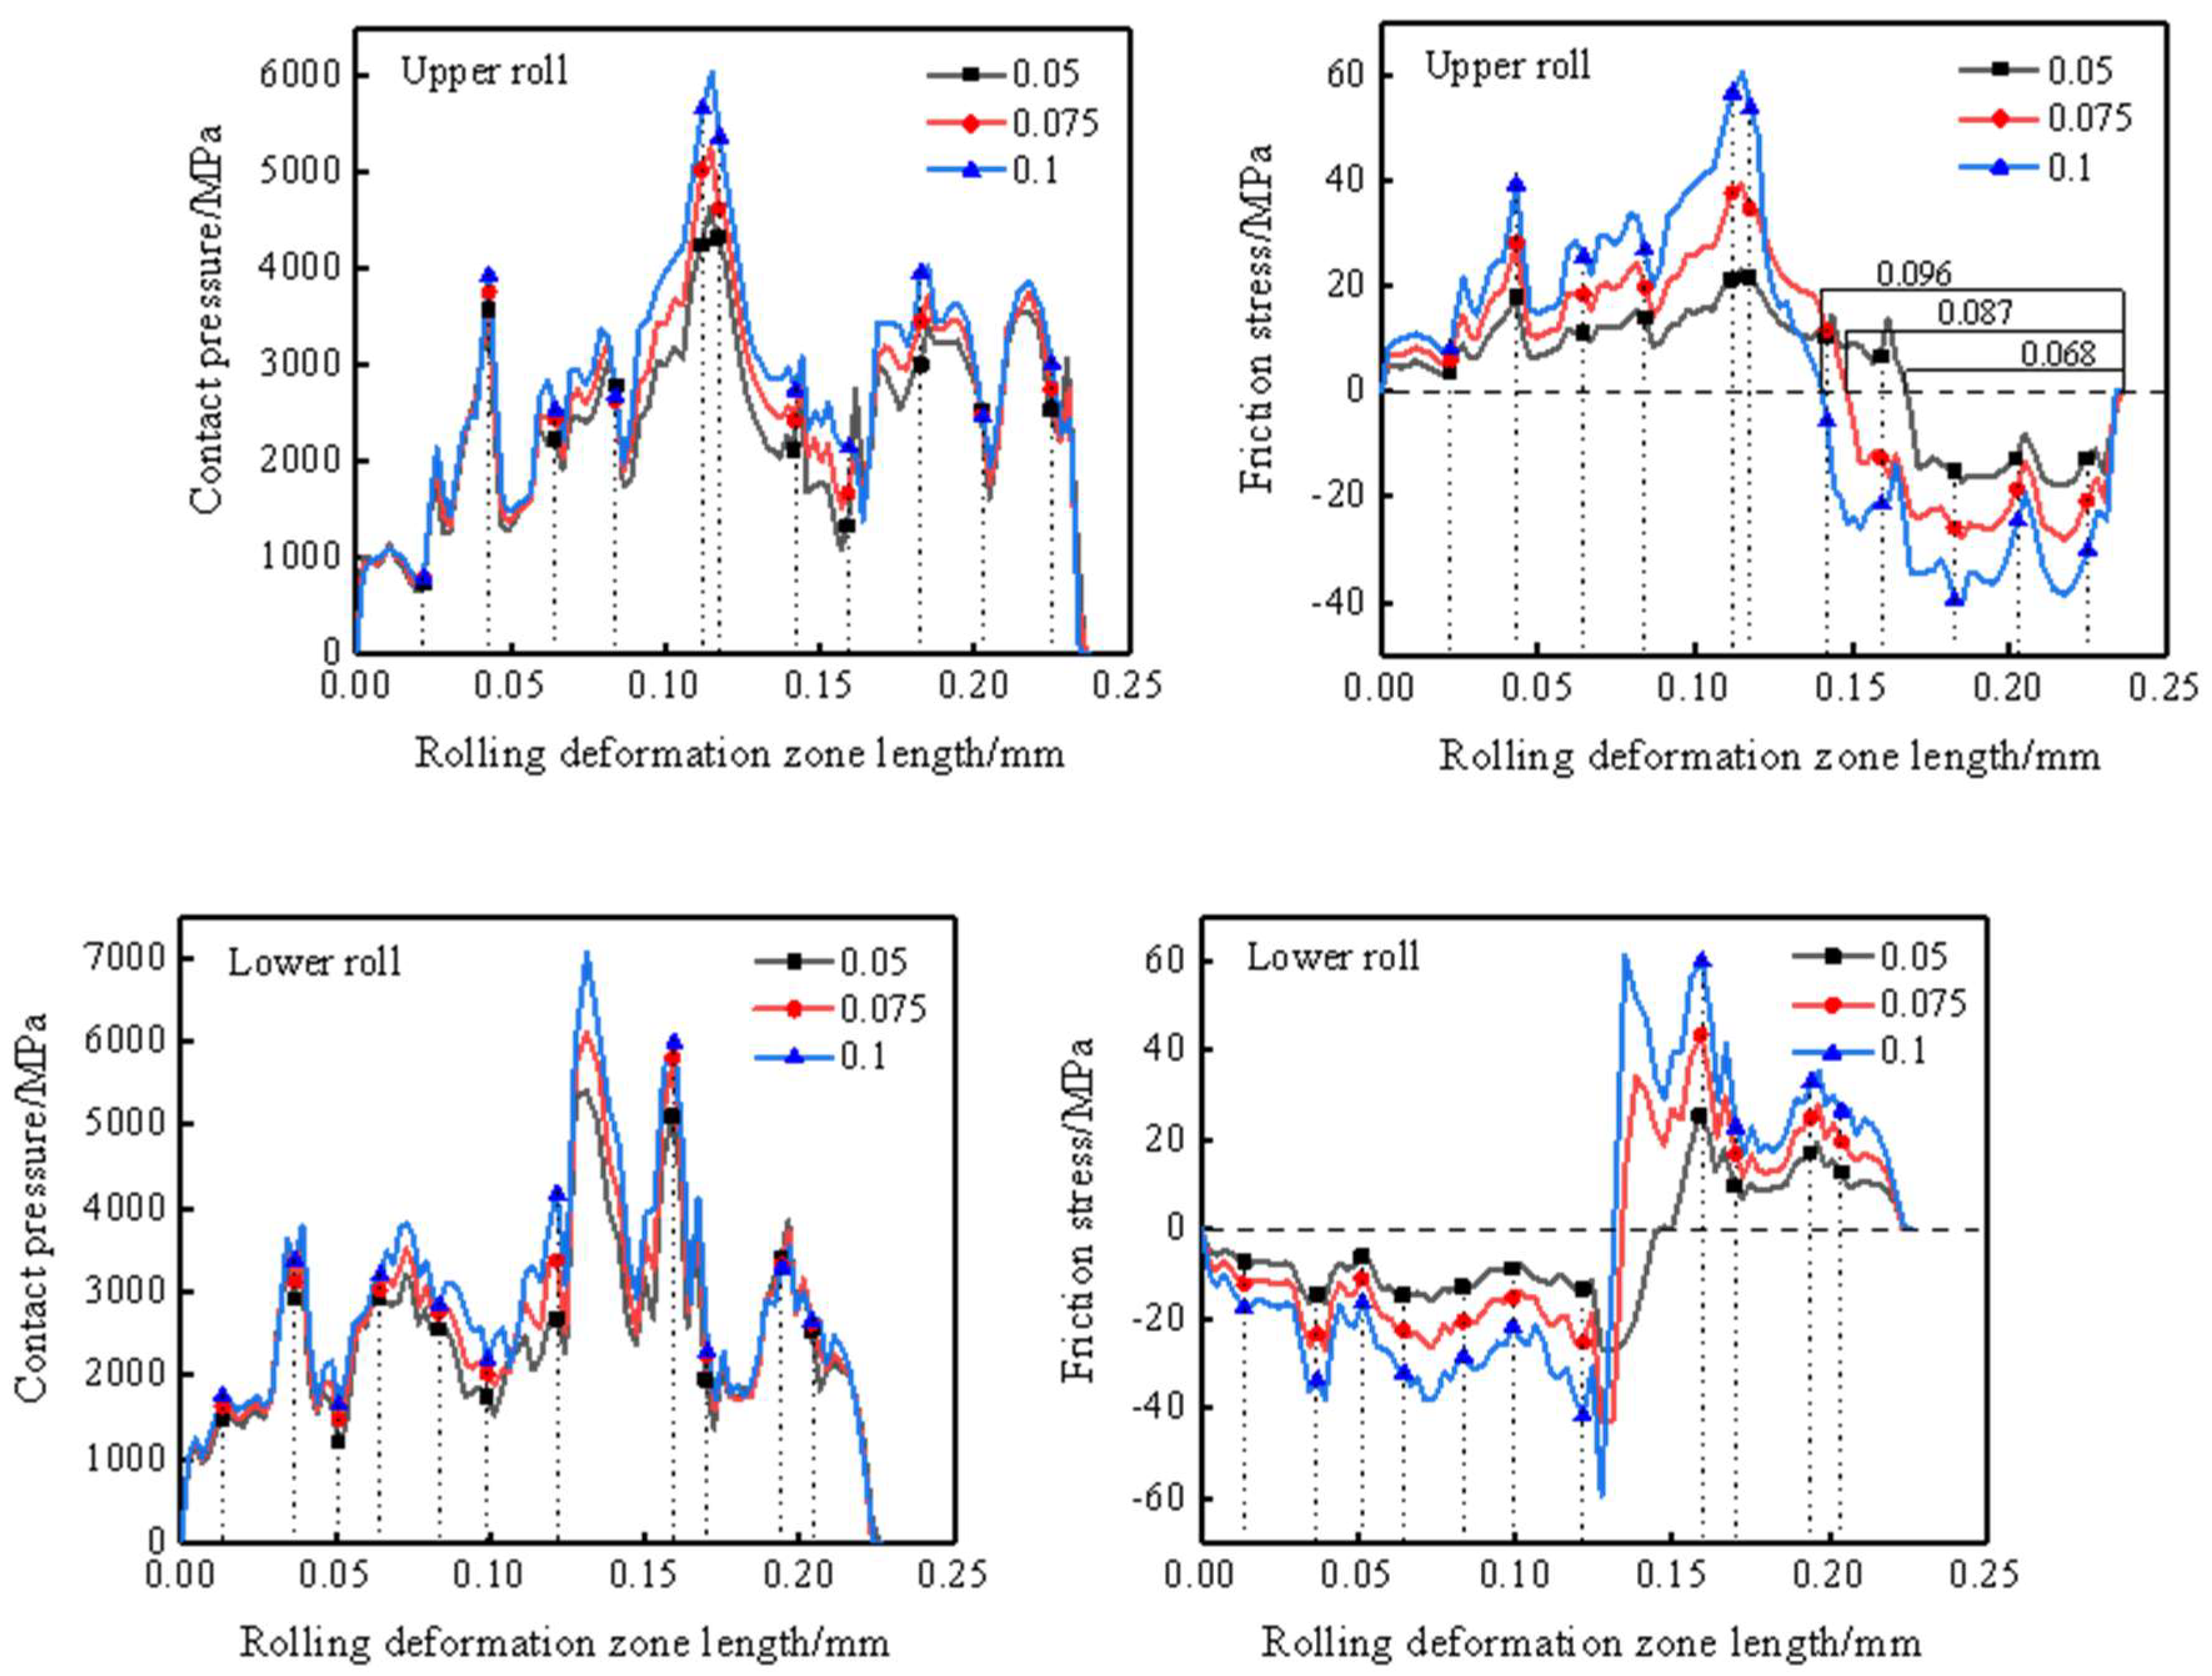
Figure 12.
{111} pole figures of G280, G178, G76 rolled deformation under different friction coefficiet.
Figure 12.
{111} pole figures of G280, G178, G76 rolled deformation under different friction coefficiet.
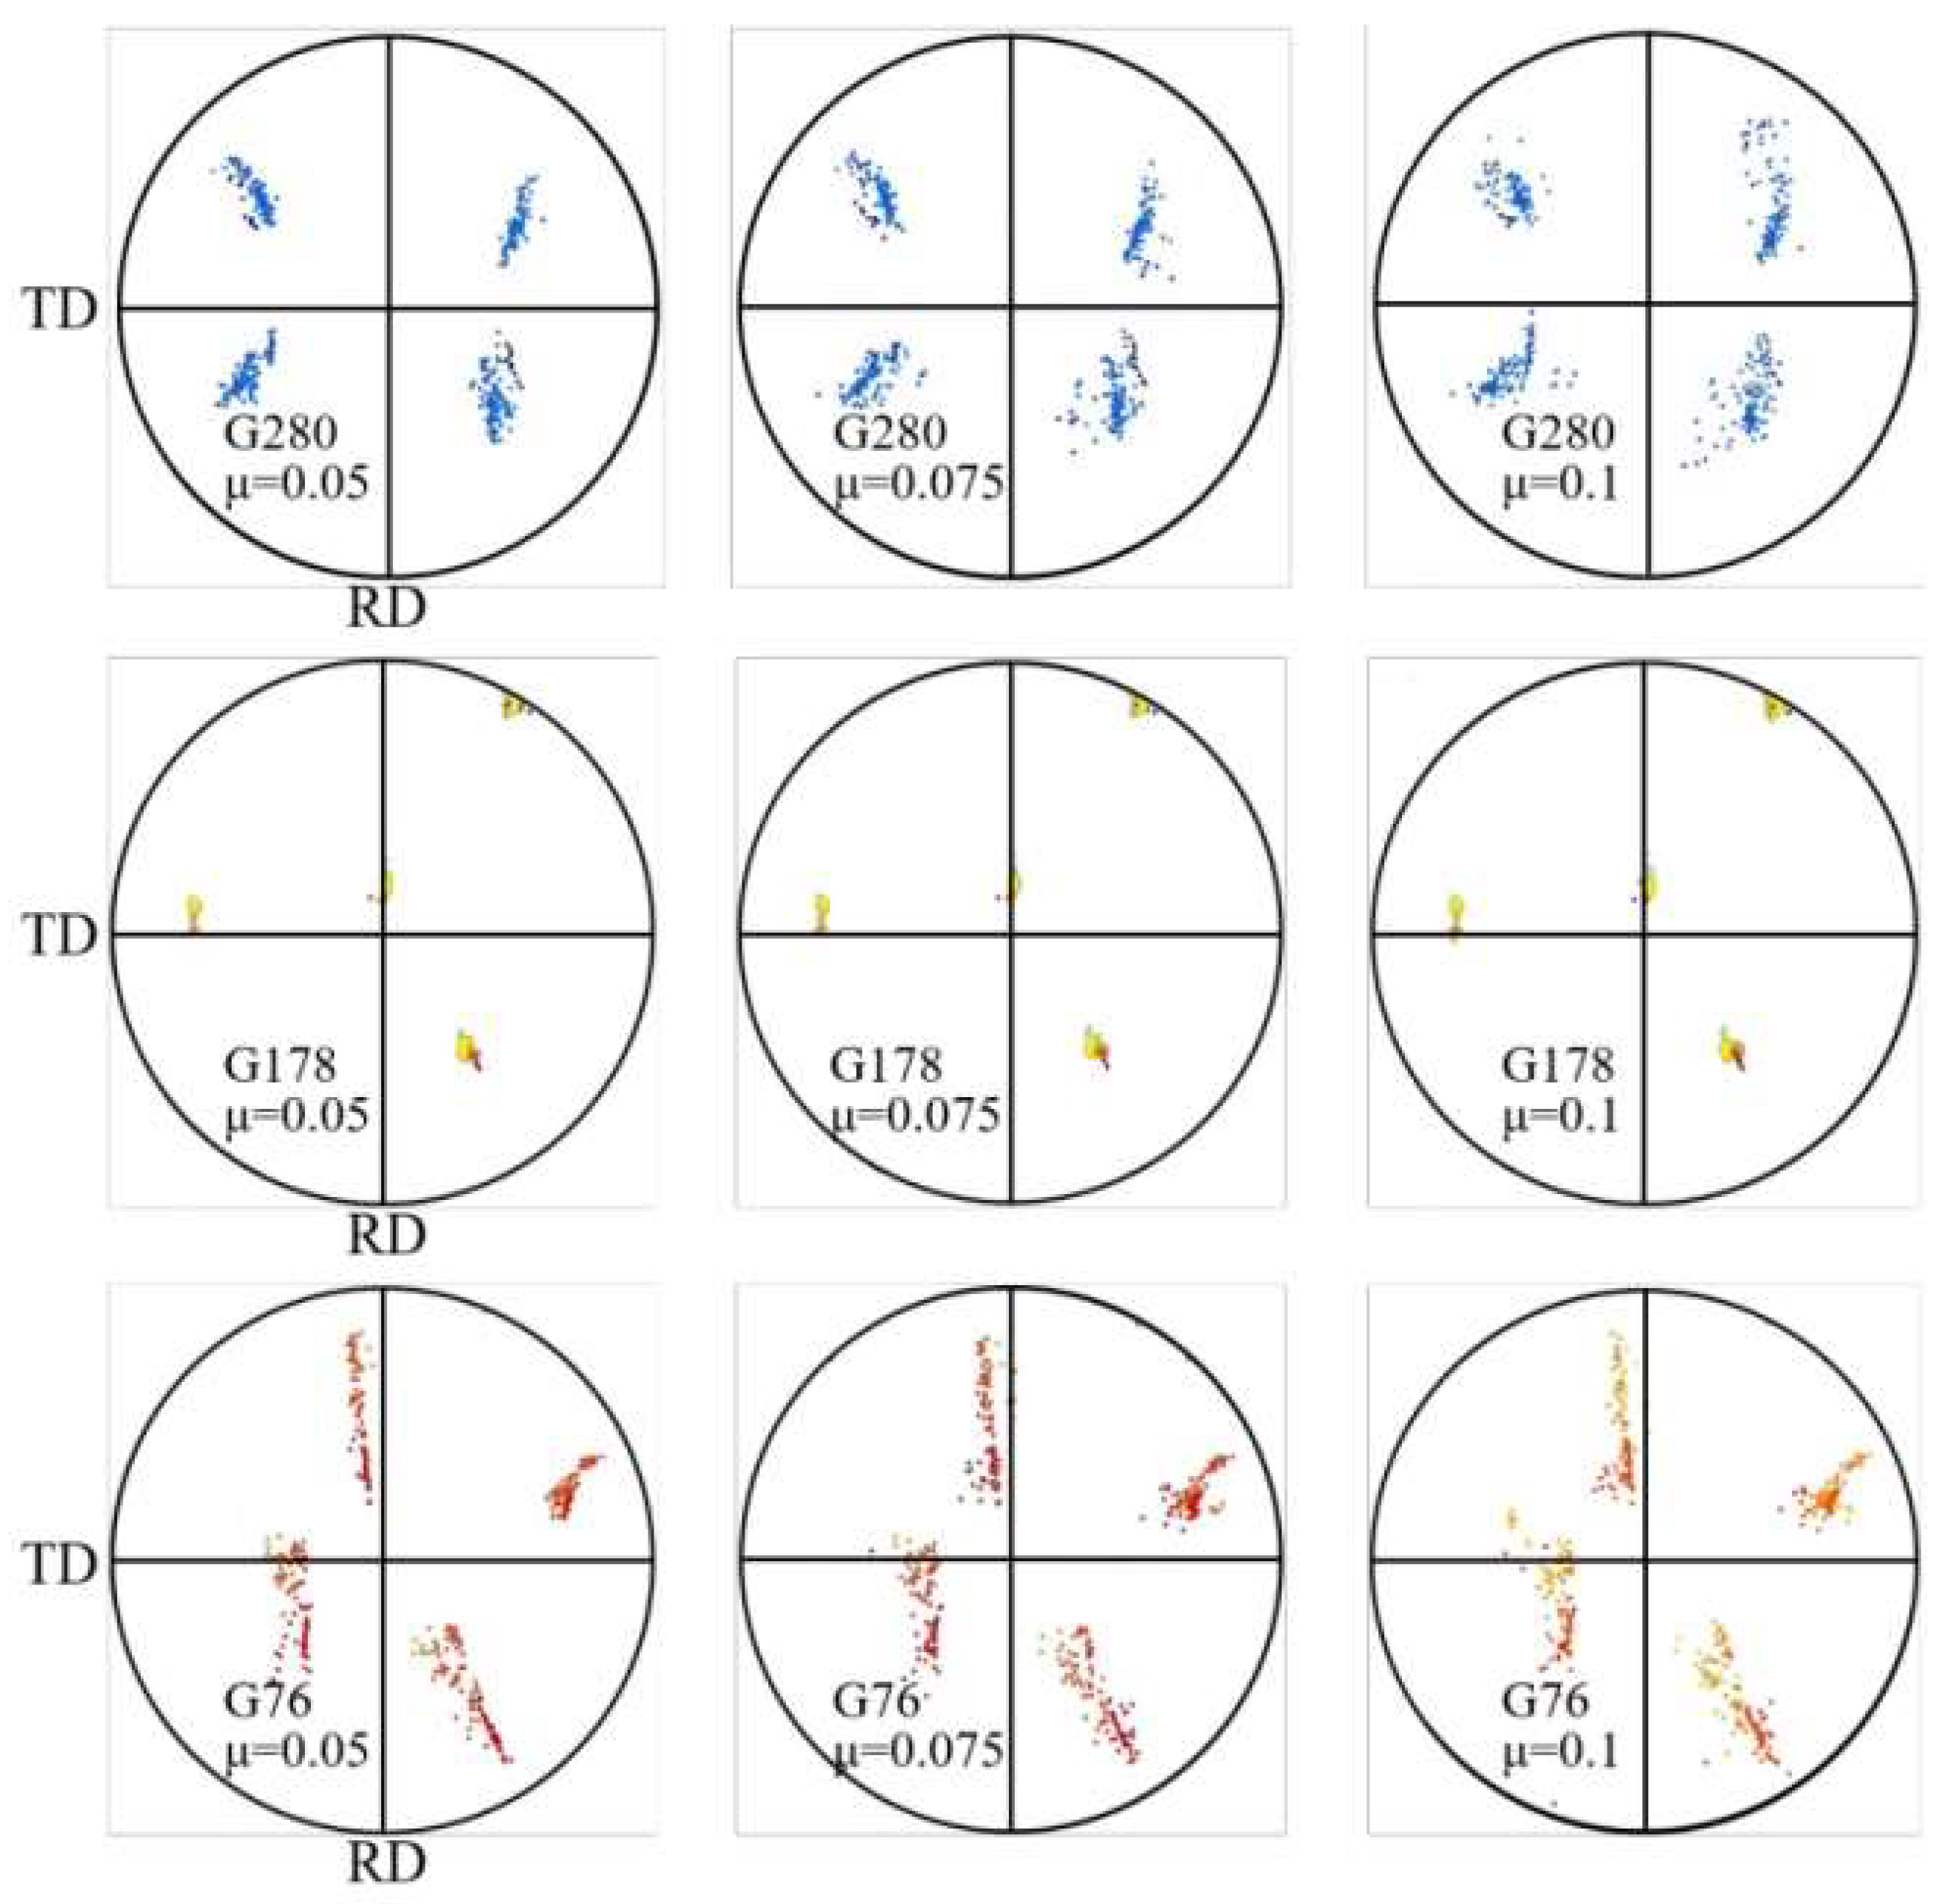

Table 1.
Chemical composition of 304 stainless steel foil (mass fraction/%).
| C | Cr | Ni | Mo | Si | Mn | P | S |
|---|---|---|---|---|---|---|---|
| 0.0484 | 18.247 | 8.1032 | 0.0419 | 0.4594 | 1.0601 | 0.0301 | 0.0036 |
Table 2.
Slip systems of FCC mental.
| Slip Plane | Slip Direction | Slip System | Slip Plane | Slip Direction | Slip System |
|---|---|---|---|---|---|
| ) | ] | a1 | ) | ] | c1 |
| ] | a2 | ] | c2 | ||
| ] | a3 | ] | c3 | ||
| ) | ] | b1 | ) | ] | d1 |
| ] | b2 | ] | d2 | ||
| ] | b3 | ] | d3 |
Table 3.
The crystal plasticity parameters of 304 stainless steel foil [32].
Table 3.
The crystal plasticity parameters of 304 stainless steel foil [32].
| 105 | 0.001 | 1.0 | 60 | 0.0001 | 245 | 30 | 74 |
Disclaimer/Publisher’s Note: The statements, opinions and data contained in all publications are solely those of the individual author(s) and contributor(s) and not of MDPI and/or the editor(s). MDPI and/or the editor(s) disclaim responsibility for any injury to people or property resulting from any ideas, methods, instructions or products referred to in the content. |
© 2025 by the authors. Licensee MDPI, Basel, Switzerland. This article is an open access article distributed under the terms and conditions of the Creative Commons Attribution (CC BY) license (http://creativecommons.org/licenses/by/4.0/).
Copyright: This open access article is published under a Creative Commons CC BY 4.0 license, which permit the free download, distribution, and reuse, provided that the author and preprint are cited in any reuse.


