
Submitted:
21 January 2025
Posted:
22 January 2025
You are already at the latest version
Abstract
Beyond their metabolic effect, SGLT-2 inhibitors reduce the risk of heart failure and have cardiovascular and nephroprotective effects, yet their exact mechanism of action remains unclear. This prospective study included 40 patients with type 2 diabetes whose physician initiated SGLT-2 inhibitor therapy. Prior to and after 4 weeks of the initiation of use of SGLT-2 inhibitors, in addition to routine clinical and laboratory measurements, hydroxyl free radical and neuropathic evaluations were performed. Body weight, BMI, fasting glucose, fructosamine, and albuminuria decreased significantly, whereas RBC count, hemoglobin, hematocrit, MCV, and platelet count increased significantly. Urinary o-tyrosine/p-tyrosine and (m-tyrosine+o-tyrosine)/p-tyrosine ratios were significantly reduced, suggesting diminished hydroxyl free radical production. Patients with neuropathy measured by the abnormal baseline CPT (current perception threshold) values showed significant improvements. Significant correlations between RBC, platelet parameters, albuminuria and hydroxyl free radical markers disappeared after SGLT-2-treatment, and changes of hydroxyl free radical markers correlated positively with CPT changes. Our results suggest that short-term SGLT-2 inhibition simultaneously recalibrates metabolic, hematologic, kidney and neuropathic endpoints, potentially through attenuating abnormal ortho- and meta-tyrosine incorporation into signaling proteins. Further studies are required to confirm long-term durability and examine whether additional strategies such as supplementation of the physiological p-tyrosine could amplify these benefits.
Keywords:
diabetic kidney disease
; diabetic neuropathy
; hydroxyl free radical
; meta-tyrosine
; ortho-tyrosine
; platelet
; red blood cell
; SGLT-2 inhibitor
1. Introduction
Distal symmetric polyneuropathy (DSPN) is one of the most common microvascular complications of type 2 diabetes mellitus (T2D), affecting approximately 50% of patients over the course of their disease [1]. This complex disorder involves both metabolic and vascular insults leading to nerve fiber damage with hyperglycemia-driven oxidative stress, reduced nerve blood flow, and chronic subclinical inflammation contributing to its pathogenesis [2,3]. The presence of DSPN impairs quality of life and is associated with increased mortality as well [4].
Despite achieving optimal glycemic control, diabetic neuropathy frequently progresses due to multifactorial influences, including chronic oxidative stress and microvascular injury [5]. Traditional therapies have focussed on symptomatic relief, such as pain management with anticonvulsants or antidepressants, and on attempts to slow disease progression by targeting hyperglycemia. Consequently, new interventions addressing additional pathogenic factors, including oxidative stress, could offer improved clinical outcomes in DSPN. In the aetiology of diabetic neuropathy, oxidative stress plays a significant role [6].
Under physiological conditions, phenylalanine is hydroxylated enzymatically at the para position, producing para-tyrosine. However, under conditions of increased oxidative stress, for instance during hydroxyl radical (OH) attack, phenylalanine can be mis-hydroxylated at the ortho and meta positions, giving rise to ortho-tyrosine (o-Tyr) and meta-tyrosine (m-Tyr) [5,7,8]. These atypical tyrosine isomers are typically negligible in healthy states; thus, their elevated levels or increased abnormal ratios serve as sensitive biomarkers of hydroxyl radical–mediated oxidative damage, which may be particularly relevant in chronic diseases associated with persistent oxidative stress [5,9]. Given these oxidative stress pathways, alpha-lipoic acid (ALA) has been explored as an antioxidant therapy that primarily targets free radical production.
ALA has been utilized as a parallel or adjunctive approach to existing glycemic management strategies, with short-term trials showing significant improvements in nerve conduction velocity and neuropathic symptoms [10,11]. At the same time, ALA therapy as a systemic antioxidant treatment, at the same time may have a beneficial effect on the cardiovascular hard endpoints, as we proved previously [12].
While ALA therapy underscores the importance of tackling oxidative mechanisms, sodium–glucose cotransporter-2 (SGLT-2) inhibitors are currently under investigation for potentially broader protective effects [13,14,15].
SGLT-2 inhibitors exert their primary effect in the proximal tubule of the kidney by blocking the reabsorption of glucose and sodium, resulting in insulin-independent glycemic control through enhanced urinary glucose excretion. This process induces a mild osmotic diuresis and natriuresis, thereby reducing blood volume and leading to clinically relevant decreases in blood pressure, typically in the range of 2–5 mmHg [16]. Additionally, SGLT-2 inhibitors have been shown to mitigate oxidative stress and inflammation, i.e., mechanisms that may underline the cardiovascular and renal protective effects observed [17].
Animal experiments have confirmed improved nerve conduction deficits and prevention of intraepidermal nerve fibre loss with SGLT-2 inhibition in diabetic rat models [18,19], presumably through reduced glycemic variability, improved microvascular function, and modulation of hydroxyl radical pathways [7,8,9].
Large cardiovascular trials (e.g., EMPA-REG, CANVAS, DECLARE) have primarily focussed on cardiovascular endpoints rather than neuropathy-specific metrics [20].
In a post hoc analysis of EMPA-REG OUTCOME, changes in hematocrit alone were estimated to account for approximately 52% of empagliflozin’s cardiovascular benefit [20]. Although other major SGLT-2 inhibitor trials (DECLARE–TIMI 58, CANVAS, EMPA-KIDNEY) did not provide a breakdown of similar percentage, they each reported hematocrit elevations that may reflect a possible erythropoietin-like effect - an effect further highlighted in DAPA-CKD, where increased hematocrit was thought to be a key factor in the nephroprotective benefits of the drug [17,21].
On the other hand, a small, mechanistic study proved a temporary elevation of the erythropoietin serum level using canagliflozin, which was present in the first 4 weeks of SGLT-2 therapy only, while the increase of hematocrit was prolonged for the whole, 12 weeks long treatment period [22]. Although there are other studies either suggesting longer duration of erythropoietin elevation even for 12 weeks by empagliflozin [23], or no increase of it at 24 weeks by dapagliflozin [24], both trials verified a retained increase in RBC-parameters for the whole treatment period by the SGLT-2 inhibitors.
However, to this date, few studies have systematically evaluated the short-term neuroprotective impact of SGLT-2 inhibitors alongside changes in hydroxyl radical markers and RBC parameters in a single cohort.
Notably, a comprehensive systematic review and meta-analysis by Kandeel [13], involving six human studies and a total of 5,312 diabetic patients, demonstrated that SGLT-2 inhibitors moderately improved diabetic peripheral neuropathy symptoms, including improved sensory and motor nerve conduction velocities and potential autonomic stabilization.
In support of these findings, Ishibashi et al. [14] reported that three years of SGLT-2 inhibitor therapy in patients with modestly controlled type 2 diabetes significantly improved neuropathy outcomes and decelerated nephropathy progression.
In addition, recent perspectives emphasize that early intervention and addressing multiple metabolic factors may stabilize or even reverse nerve damage in DSPN [25], and short-term clinical evidence shows that empagliflozin can improve electrophysiological parameters, reduce oxidative stress markers, and moderate neuropathic symptoms in type 2 diabetic patients [15].
These findings point to mechanisms extending beyond glycemic control, encompassing RBC formation, changes in hydroxyl radical metabolites (such as ortho- and meta-tyrosine), and renal hemodynamics [5,7,26].
Given this encouraging data, we tested a 4-week intervention to capture immediate RBC and hydroxyl radical changes as well as early neuropathic shifts.
Given the limited efficacy of existing treatments, these potential protective effects are particularly salient in the context of diabetic neuropathy’s complexity and, by directly or indirectly reducing oxidative stress and influencing pathways that underlie nerve damage, SGLT-2 inhibitors could herald a paradigm shift in the management of this challenging complication [2,6].
Against this background, our study focuses on evaluating the short-term effects of SGLT-2 inhibitor (dapagliflozin or empagliflozin) therapy on diabetic neuropathy-related measures, hydroxyl radical markers, abnormal albuminuria, and RBC-parameters in patients with type 2 diabetes mellitus. Specifically, we aim to determine whether a four-week SGLT-2 inhibitor therapy can produce measurable changes in neuropathic function among T2D patients with early or mild abnormalities and to review how shifts in hydroxyl radical markers relate to these clinical and laboratory findings.
2. Materials and Methods
2.1. Study Population, Inclusion/Exclusion Criteria
A total of 40 adult T2D patients were enrolled to the study. Eligible participants included those for whom, in addition to administering any existing antidiabetic regimen, the treating physician decided to initiate SGLT-2 inhibitor therapy (empagliflozin or dapagliflozin) based on standard clinical indications.
The study included T2D patients aged 18 to 75 years with HbA1C < 10% and eGFR > 30ml/min/1.73m2. Out of the 40 patients, none reported painful neuropathy (DN4 questionnaire), 9 exhibited neuropathic sensory symptoms (NTSS questionnaire), and 9 showed loss of protective sensation (monofilament test). According to the Neuropathy Disability Score (NDS), 14 patients had mild neuropathy, 16 had moderate neuropathy, and 4 had severe neuropathy, indicating that most patients had preexisting asymptomatic neuropathy. Patients were excluded in case they had neuropathies of non-diabetic etiology (i.e., hereditary, drug- or toxin-induced, untreated hypothyroidism, folate deficiency (below 3.9 µg/L), vitamin B12 deficiency (below 200 ng/L), advanced hepatic- renal disease not meeting the inclusion criteria, autoimmune disease, malignancy, or if they were engaged in regular excessive alcohol consumption (more than two units in men and more than one unit per day in women – one unit being defined as 15 g of pure alcohol). Patients with severe peripheral arterial disease, a history of foot ulceration, or recurrent genital infections were also excluded.
2.2. Study Design and Objectives
This prospective, open-label, single-arm clinical study aimed to investigate the short-term effects of sodium-glucose cotransporter-2 (SGLT-2) inhibitors on distal symmetric diabetic polyneuropathy, hydroxyl radical markers, and related hematological and renal parameters in patients with type 2 diabetes mellitus (T2D). The rationale was based on the putative mechanism whereby, beyond their glucose-lowering effect, SGLT-2 inhibitors may influence hydroxyl radical marker formation and thereby improve microvascular complications. This includes potential benefits on red blood cell (RBC) parameters, abnormal albuminuria, and early-stage diabetic neuropathy. The primary hypothesis was that short-term SGLT-2 inhibitor therapy would mitigate hydroxyl free radical pathways specifically tyrosine metabolite ratios accompanied by improved neuropathic measurements and RBC-related indices.
2.3. Intervention and Study Protocol
All participants underwent a baseline (week 0) assessment followed by a follow-up evaluation after 4 weeks of SGLT-2 inhibitor therapy. The dose and choice of SGLT-2 inhibitor were determined by the clinical team based on standard treatment indications. No additional interventions were mandated by the study.
2.4. Data Collection and Questionnaires
Participants completed lifestyle and medication questionnaires at baseline, documenting diet, exercise, smoking and alcohol habits, concomitant medications, and comorbidities. The Neuropathic Total Symptom Score (NTSS) and DN4 questionnaires were administered to evaluate subjective neuropathic complaints.
2.5. Neuropathic Assessments
Neuropathy evaluation was performed at the Neuropathy Center of the 2nd Department of Medicine and Nephrology-Diabetes Center, University of Pécs Medical School, using the CA-12 software-based system (MSB-MET Ltd., Balatonfüred, Hungary). Quantitative sensory testing was conducted to measure current perception thresholds (CPT) at three frequencies (2000 Hz, 250 Hz, and 5 Hz) on both median and peroneal nerve, providing insight into large myelinated (2000Hz Aβ), medium-size myelinated (250Hz Aδ) and unmyelinated (5Hz C) small fibers function. CPT values below the normal range indicate hyperesthesia, and values above the normal range indicate hypoesthesia.
Additional clinical examinations were conducted for distal symmetric polyneuropathy (DSPN):
- Deep tendon reflex testing, and 128 Hz calibrated tuning fork (vibration) for large fibre dysfunction, and
- Pinprick (pain), and temperature perception for small fiber dysfunction. The 10 g monofilament (protective sensation) evaluation for the risk of developing foot ulcers [25]
DSPN is one of the most common complications in patients with type 2 diabetes (T2D), even with well-controlled glycemia. DSPN can affect either small or large nerve fibers or a combination of both in a length-dependent manner, in a “stocking-glove” distribution. [25]
2.6. Laboratory Measurements
Blood and urine samples were collected at baseline and at week 4. No additional venipuncture beyond routine sampling was required; approximately 10 ml of blood was obtained for research purposes.
2.6.1. Routine Parameters
The HbA1c was measured at week 0. Serum fructosamine, fasting glucose, and serum insulin were measured at both week 0 and week 4. Serum creatinine and estimated glomerular filtration rate (eGFR) were assessed at week 0 and week 4. Serum bilirubin, AST, ALT, GGT, ALP, LDH, INR, serum total protein, albumin, total cholesterol, HDL, LDL, uric acid serum iron, transferrin, transferrin saturation, and ferritin were measured at week 0, whereas triglycerides, serum sodium, potassium, erythrocyte sedimentation rate (ESR), C-reactive protein (CRP) and urinary albumin and creatinine were measured at both week 0 and week 4.
2.6.2. Hydroxyl Free Radical Markers
To explore the hydroxyl free radical pathway and its link to neuropathy, RBC-formation, and renal parameters, markers were measured at the baseline and at week 4. Serum and urinary phenylalanine (Phe), para-tyrosine (p-Tyr), meta-tyrosine (m-Tyr), and ortho-tyrosine (o-Tyr), were quantified by high-performance liquid chromatography (HPLC). In addition to the direct concentrations of these metabolites, the following ratios were calculated to characterize changes in the oxidative milieu under SGLT-2 inhibitor therapy: p-Tyr/Phe, m-Tyr/Phe, o-Tyr/Phe, (m-Tyr+o-Tyr)/Phe, m-Tyr/p-Tyr, o-Tyr/p-Tyr, (m-Tyr+o-Tyr)/p-Tyr, m-Tyr/krea, p-Tyr/krea, o-Tyr/krea, as well as any corresponding serum and urinary values. This comprehensive panel of hydroxylation products and derived ratios aimed to provide a detailed assessment of hydroxyl free radical activity and its potential influence on diabetic complications.
2.6.3. Additional Calculations
The Homeostasis Model Assessment of Insulin Resistance (HOMAIR) was calculated to assess insulin sensitivity. Changes in the urinary albumin/creatinine ratio (ACR) and correlations with current perception threshold (CPT) parameters were also evaluated throughout the study.
The Neuropathy Disability Score (NDS) was calculated using a standardized clinical examination approach [27]. This assessment evaluates ankle reflexes, vibration sensation, pin-prick sensation, and temperature sensation at the big toe. The maximum total score is 10, categorized as follows:
- 3–5 points: mild neuropathy
- 6–8 points: moderate neuropathy
- 9–10 points: severe neuropathy
2.6.4. High Performance Liquid Chromatography (HPLC) Analyses
Venous blood was taken from patients into native tubes during routine blood sampling. Serum was extracted by centrifugation and was stored at −80°C pending further examination. Thereafter, 125 µl of trichloro-acetic acid (TCA) was added to 500 µl of serum, then samples were incubated on ice for 30 minutes. Afterwards, precipitate was separated by centrifugation and supernatant was filtered using a 0.2 μm syringe filter (Millipore Inc.). Supernatant was stored at -80 °C until undergoing further process or was immediately analyzed by HPLC.
HPLC analysis was carried out using a Shimadzu Class LC-10 ADVP HPLC device (Shimadzu Manufacturing Inc., USA). A 20 μl of filtrate was injected onto a Licrospher-C18 silica column (Merck). Different amino acids and isomers: phenylalanine (Phe), para-tyrosine (p-Tyr), meta-tyrosine (m-Tyr), ortho-tyrosine (o-Tyr) were detected using their autofluorescence. p-, m-, o-Tyr were measured at 275 nm excitation and 305 nm emission, while Phe was evaluated at 258 nm excitation and 288 nm emission using a Shimadzu RF-10AXL fluorescent detector. An isochratic flow of the eluent containing 1% acetic acid, 1% sodium acetate and 98% distilled water was performed. For determination of the concentrations of different amino acids and isomers, external standards were used.
2.6.5. Statistical Analysis
Data were analyzed by a biostatistician using appropriate methods for paired comparisons as well as correlation and regression analyses to identify potential predictors of change in neuropathy, hydroxyl radical-related and metabolic parameters. Subgroup analyses reviewed patients with abnormal baseline CPT values to discern whether SGLT-2 inhibitor therapy might confer greater neurological benefits in those with pre-existing neuropathic alterations. Distribution of parameters was tested using Kolmogorov-Smirnov’s normality test. Changes of parameters between baseline and week 4 were compared using paired sample t test. Correlational analyses were performed by Pearson’s (normal distribution) or Spearman’s rho (non-normal distribution) tests. Linear regression models with stepwise method were established for evaluating predictors of neuropathy, RBC parameters and albuminuria. The Statistical Package for Social Sciencies (SPSS) version 28 (IBM, Armonk, New York, United States) was used for statistical analyses. A ‘p’ value below 0.05 was considered as statistically significant.
In summary, the methods were designed to investigate whether short-term SGLT-2 inhibitor therapy, by reducing hydroxyl free radical generation and improving RBC indices and abnormal albuminuria, could also yield measurable improvements in diabetic neuropathic function and related hydroxyl free radicals.
3. Results
Table 1 presents the changes in anthropometric, hemodynamic, neuropathic, metabolic, kidney function related, inflammatory, hematological, and hydroxyl free radical parameters in 40 patients (19 male/21 female) undergoing 4 weeks of SGLT-2 inhibitor therapy (22 empagliflozin/18 dapagliflozin). Data are expressed as mean ± SD, and p-values are derived from paired samples t-tests comparing values at baseline (week 0) and after treatment (week 4).
Notably, body weight (p=0.004), BMI (p=0.006), fasting glucose (p=0.038), and fructosamine (p=0.001), abnormal albuminuria (MAU) (p=0.032), standing systolic blood pressure (SBP) (p=0.020) decreased significantly (Table 1).
RBC count (p=0.020), hemoglobin (p=0.029), hematocrit (p=0.002), MCV (p=0.014) and platelet count (p=0.022) increased significantly (Table 1).
Significant reductions were detected in urinary o-Tyr/p-Tyr (p=0.020) and (m-Tyr+o-Tyr)/p-Tyr (p=0.024) ratios (Table 1).
Table 2 illustrates the current perception threshold (CPT) measurements obtained at baseline (week 0) and after 4 weeks of SGLT-2 inhibitor therapy in 40 patients. CPT values, expressed as mean ± SD, were assessed at three frequencies (2000Hz, 250 Hz, 5 Hz) for both the peroneal and median nerves, bilaterally.
No statistically significant changes in CPT were noted at any frequency or nerve site following the 4-week treatment period. Both small and large fiber functions remained stable. These findings suggest that short-term SGLT-2 inhibition did not induce any generalized changes in CPT results in the entire T2D patient group during the observation period.
In the subgroup of individuals who presented above-normal baseline CPT measurements on the peroneal nerve at the frequency concerned, Figure 1 shows the effects of SGLT-2 inhibitor therapy on Current Perception Threshold (CPT) values at week 0 and week 4. CPTs were recorded at three frequencies (2000 Hz, 250 Hz, 5 Hz) for both the left and right sides.
In this subgroup a significant reduction in CPT at 2000 Hz was observed on the right side (p=0.004), and at 250 Hz on both sides (left: p=0.004, right: p=0.003). Although CPT values also decreased at 5 Hz, these changes were not statistically significant. These improvements suggest that SGLT-2 inhibitor therapy, particularly at mid to high frequencies, may beneficially influence nerve function in patients with abnormal baseline values.
Figure 2 illustrates CPT measurements on the median nerve at week 0 and week 4 in patients with above-normal baseline CPT values at the given frequency. CPT was assessed at 2000 Hz, 250 Hz, and 5 Hz on both the left and right sides.
Following 4 weeks of SGLT-2 inhibitor therapy, a significant reduction in CPT at 2000 Hz was observed on the left side (p=0.047) and at 5 Hz on the left side (p=0.022). No significant changes were detected at 250 Hz on either side. These results highlight that SGLT-2 inhibitors may exert beneficial effects on nerve function in patients with initially elevated CPT thresholds.
Figure 3 depicts the correlation between red blood cell (RBC) counts and serum and urinary (m-Tyr + o-Tyr)/p-Tyr ratios at baseline (week 0) and after 4 weeks of SGLT-2 inhibitor therapy.
At week 0, higher RBC counts correlated significantly with lower (m-Tyr + o-Tyr)/p-Tyr ratios in both serum (r = -0.559, p < 0.001) and urine (r = -0.434, p = 0.005), indicating an inverse relationship between RBC levels and hydroxyl free radical markers (Figure 3).
By week 4, these correlations were no longer significant. This loss of association suggests that SGLT-2 inhibitor therapy may have altered the oxidative and metabolic conditions affecting RBC parameters, reducing the relevance of these baseline hydroxyl radical markers (Figure 3).
Figure 4 shows the correlation between hemoglobin (Hgb) levels and serum and urinary (m-Tyr + o-Tyr)/p-Tyr ratios at week 0 and week 4.
Initially, higher Hgb levels were significantly associated with lower (m-Tyr + o-Tyr)/p-Tyr ratios in serum (r = -0.597, p < 0.001) and urine (r = -0.403, p = 0.01), reflecting a strong inverse relationship at baseline.
After 4 weeks of SGLT-2 inhibitor therapy, these associations were no longer significant. The disappearance of these baseline correlations indicates that treatment may have changed the oxidative environment linked to Hgb levels.
Figure 5 illustrates the correlation between hematocrit (Htc) levels and serum and urinary (m-Tyr + o-Tyr)/p-Tyr ratios at week 0 and week 4. At baseline, higher Htc levels correlated negatively with (m-Tyr + o-Tyr)/p-Tyr ratios in serum (r = -0.565, p < 0.001) and urine (r = -0.387, p = 0.014).
By week 4, these significant correlations were lost. This shift once again suggests that SGLT-2 inhibitor therapy influenced the oxidative and metabolic factors driving these relationships, contributing to a more balanced redox environment.
Figure 3, Figure 4, and Figure 5 show a similar pattern: before SGLT-2 inhibitor therapy, there were strong inverse relationships between red blood cell-related parameters (RBC count, hemoglobin, and hematocrit) and hydroxyl free radical marker ((m-Tyr + o-Tyr)/p-Tyr ratios) in both serum and urine. At baseline, higher RBC parameters corresponded to lower levels of these hydroxyl free radical parameters, indicating a clear link between the body’s red blood cell status and its oxidative state.
After 4 weeks of SGLT-2 inhibitor therapy, these significant correlations ceased to exist. This loss of association suggests that the treatment modified the underlying oxidative and metabolic conditions that previously tied RBC-related factors to this marker of hydroxyl free radical. In essence, while RBC count, hemoglobin, and hematocrit served as meaningful proxies for redox balance at the start of the study, short-term SGLT-2 inhibition altered the biochemical environment to such an extent that these relationships no longer exist.
In the case of platelets, a positive correlation was proved between serum (m-Tyr+o-Tyr)/p-Tyr ratio and the platelet count (R=0.320, p=0.044; data not shown in figure), which association disappeared after 4 weeks of SGLT-2 inhibitor therapy (R=0.301, p=0.059; data not shown in figure).
Similarly, before the treatment, a significant positive correlation was found between albuminuria and urinary (m-Tyr+o-Tyr)/p-Tyr (R=0.446, p=0.006; data not shown in figure), but 4 weeks therapy by SGLT-2 inhibitor abolished this association (R=-0.050, p=0.775; data not shown in figure).
Figure 6 depicts the correlations between changes in serum hydroxyl free radical markers (o-Tyr, o-Tyr/Phe, o-Tyr/p-Tyr) and changes in CPT results at 2000 Hz on the median and and 250 Hz on the peroneal nerves from week 0 to week 4.
Significant positive correlations emerged, indicating that patients who experienced favorable shifts in hydroxyl free radical parameters also demonstrated improvements in CPT measures. These findings suggest a link between oxidative adjustments due to SGLT-2 inhibitor therapy and enhanced nerve function, particularly in patients presenting abnormal baseline CPT values.
Table 3 summarizes the predictors of peripheral neuropathy (at various frequencies), red blood cell parameters (Hgb and Htc), and abnormal albuminuria (MAU) at baseline (week 0), prior to the initiation of SGLT-2 inhibitor therapy.
At week 0, several hydroxyl free radical markers, other metabolic, hemodynamic and anthropometric factors significantly predicted neuropathy severity, indices of RBC, and MAU. By week 4, all these baseline predictive relationships disappeared (data not shown in table), suggesting that SGLT-2 inhibitor therapy modulated the underlying oxidative and metabolic conditions. This shift aligns with the observed changes in correlation patterns, supporting the concept that SGLT-2 inhibition can reshape the oxidative-metabolic landscape influencing neuropathy, RBC parameters, and renal function.
4. Discussion
In this study, we have demonstrated that a short-term (4-week) therapy with SGLT-2 inhibitors in T2D patients exerts multifaceted benefits on metabolic, renal, hematological and neuropathic endpoints parallel with the changes of the hydroxyl free radical exposure. Body weight, BMI, fasting glucose, and fructosamine decreased significantly, indicating that our cohort achieved better glycemic control and experienced modest weight reduction, findings that are consistent with the known metabolic effects of SGLT-2 inhibitors [16,17].
Crucially, we observed a notable decoupling between red blood cell (RBC) and platelet parameters and hydroxyl free radical-derived markers by the end of the study period. In other words, while lower RBC and higher platelet levels were tied to higher hydroxyl free radical production at baseline, these relationships were no longer observed after four weeks of SGLT-2 inhibitor therapy. This decoupling implies that improved metabolic and hormonal conditions brought about by SGLT-2 inhibitors may reduce the production of hydroxyl radicals [7,8] leading to improved RBC parameters probably by mitigating hormonal resistances.
A well-known clinical phenomenon is the lower RBC and higher platelet count in chronic oxidative stress, e.g. in metabolic syndrome [28]. We suppose the effect of multihormonal resistances as erythropoietin, insulin and thrombopoietin resistances in the background of these hematological abnormalities. Moreover, antiapoptotic effects of these hormones is necessary not only for the physiological hematopoiesis but also for the defense of other organs as e.g. for kidney, heart and neurons.
Another key finding of our study is the significant reduction in abnormal albuminuria, mirroring evidence from large-scale trials that underscore the nephroprotective properties of SGLT-2 inhibitors [17,21].
While neuropathy metrics for the entire cohort remained largely unchanged, our subgroup analysis revealed considerable improvement in current perception threshold (CPT) values among individuals presenting with abnormal baseline readings, particularly at certain frequencies. Decrease of hydroxyl free radical markers also correlated positively with improvements in CPT (Figure 6), suggesting that the decoupling of oxidative stress may play a role in facilitating early nerve-function gains in patients showing signs of neuropathic dysfunction [14,15].
Moreover, the changes of associations between o- or m-Tyr and the number of RBC and platelets, and improvement of albuminuria and neuropathy due to the therapy of SGLT-2 inhibitors may support another approach, as well. In this sense, o- and m-Tyr could be not only markers, but also makers, since these abnormal tyrosines, according to our previous observations, could be incorporated into the signaling proteins leading to multihormonal resistances [5].
We proved the development of o-Tyr and/or m-Tyr induced insulin- [9], acethylcholine- [26] and erythropoietin resistances [29], which all together could lead to abnormal albuminuria, neuropathy and lower count of RBC.
In the case of o- and m-Tyr induced erythropoietin resistant RBC malformation we verified a STAT and ERK dependent signaling defect [29], which pathways also contribute to the thrombopoietin enhanced platelet production together with the Akt signaling [30] for which an o- and m-Tyr dependent defect was also shown by our workgroup [5].
Nonetheless, our study has several limitations: the sample size was relatively small, the design was non-randomized, nor double-blind, and the follow-up period was brief. At the same time, our investigation was strengthened by an intensively examined patient population with specialized diagnostic methodologies (HPLC for hydroxyl free radical marker, and the CA-12 software-based system (MSB-MET Ltd., Balatonfüred, Hungary) for CPT measurement), allowing for a nuanced exploration of both hydroxyl free radical and neuropathic parameters.
5. Conclusions
Overall, these findings suggest that short-term SGLT-2 inhibition triggers a coordinated recalibration of metabolic and redox processes, decoupling RBC-related parameters from hydroxyl radical production and enabling early neuropathic improvements in patients with pre-existing peripheral nerve dysfunction. By reducing albuminuria, increasing RBC indices, platelet count, and selectively enhancing nerve function, SGLT-2 inhibitors appear to engage multiple, interlinked pathogenic pathways of which common root may be found in the incorporation of abnormal tyrosines into the key signaling proteins due to the overproduction of hydroxyl free radical changing this way intracellular phosphorylation cascades and leading to multihormonal resistance and, as a consequence, to multiorgan defects. These data underscore the need to look beyond simple glycemic targets when evaluating the therapeutic value of SGLT-2 inhibitors, highlighting novel opportunities for optimizing interventions aimed at mitigating diabetic complications. Nonetheless, further research is warranted to confirm the durability of these short-term changes, clarify causality, and investigate whether additional strategies to attenuate effect of hydroxyl free radicals could enhance the overall benefits of SGLT-2 inhibitors for patients with diabetic complications.
Author Contributions
Conceptualization, Ágnes Klabuzai, István Wittmann and Szilárd Kun; Data curation, Ágnes Klabuzai, Viktória Bekő, Zsófia Sütő, Marcell Horváth and Szilárd Kun; Formal analysis, Ágnes Klabuzai and Szilárd Kun; Investigation, Ágnes Klabuzai, Viktória Bekő, Zsófia Sütő, Zoltán Wágner, Katalin Vágási and Veronika Pfeil; Methodology, Ágnes Klabuzai, István Wittmann and Szilárd Kun; Supervision, István Wittmann; Validation, Miklós Süle, György Grosz, István Wittmann and Szilárd Kun; Visualization, Ágnes Klabuzai, István Wittmann and Szilárd Kun; Writing – original draft, Ágnes Klabuzai, István Wittmann and Szilárd Kun; Writing – review & editing, Ágnes Klabuzai, István Wittmann and Szilárd Kun. All authors have read and agreed to the published version of the manuscript.
Funding
This research received no external funding.
Institutional Review Board Statement
The study was conducted in accordance with the principles of the Declaration of Helsinki. The study was approved by the National Institute of Pharmacy and Nutrition Hungary, Department of Clinical Research (Permit No.: 31779-8/2022; date of approval: 18th July 2022).
Informed Consent Statement
Informed consent was obtained from all subjects involved in the study.
Data Availability Statement
The original contributions presented in this study are included in the article. Further inquiries can be directed to the corresponding author.
Acknowledgments
The authors express their gratitude to Prof. Dr. József Andor for the thorough English language and stylistic review. The authors thank Helga Heilmann and Krisztina Szalma for excellent assistance.
Conflicts of Interest
The authors declare no conflict of interest.
Abbreviations
The following abbreviations are used in this manuscript:
| ACR | Albumin-to-creatinine ratio |
| ALA | Alpha-lipoic acid |
| ALP | Alkaline phosphatase |
| ALT | Alanine aminotransferase |
| AST | Aspartate aminotransferase |
| BMI | Body mass index |
| bpm | Beats per minute |
| CPT | Current perception threshold |
| CRP | C-reactive protein |
| DBP | Diastolic blood pressure |
| DN4 | Douleur Neuropathique en 4 (neuropathic pain questionnaire) |
| DSPN | Distal symmetric polyneuropathy |
| eGFR | Estimated glomerular filtration rate |
| ESR | Erythrocyte sedimentation rate (also shown as “We” in some tables) |
| GGT | Gamma-glutamyl transferase |
| HbA1c | Hemoglobin A1c |
| Hgb | Hemoglobin |
| HOMAIR | Homeostasis model assessment of insulin resistance |
| HPLC | High-Performance Liquid Chromatography |
| HR | Heart rate |
| Htc | Hematocrit |
| INR | International normalized ratio |
| LDH | Lactate dehydrogenase |
| MCH | Mean corpuscular hemoglobin |
| MCV | Mean corpuscular volume |
| m-Tyr | Meta-tyrosine |
| MAU | Microalbuminuria |
| NDS | Neuropathy Disability Score |
| NTSS | Neuropathy Total Symptom Score |
| o-Tyr | Ortho-tyrosine |
| p-Tyr | Para-tyrosine |
| Phe | Phenylalanine |
| PLT | Platelet count |
| RBC | Red blood cell |
| RR | R–R interval (time between R-waves on ECG) |
| SBP | Systolic blood pressure |
| SGLT-2 | Sodium–glucose cotransporter-2 |
| SPSS | Statistical Package for the Social Sciences |
| T2D | Type 2 diabetes |
| TCA | Trichloroacetic acid |
References
- Feldman, E.L.; Callaghan, B.C.; Pop-Busui, R.; et al. Diabetic neuropathy. Nat. Rev. Dis. Primers 2019, 5, 41. [CrossRef]
- Eid, S.A.; Rumora, A.E.; Beirowski, B.; et al. New perspectives in diabetic neuropathy. Neuron 2023, 111, 2623–2641. [CrossRef]
- Pop-Busui, R.; Boulton, A.J.M.; Feldman, E.L.; Bril, V.; Freeman, R.; Malik, R.A.; et al. Diabetic neuropathy: A position statement by the American Diabetes Association. Diabetes Care 2017, 40(1), 136–154. [CrossRef]
- Vági, O.E.; Svébis, M.M.; Domján, B.A.; et al. The association between distal symmetric polyneuropathy in diabetes and all-cause mortality: A meta-analysis. Front. Endocrinol. 2023, 14, 1079009. [CrossRef]
- Wittmann, I. The common single cause of chronic multi-hormonal resistance in oxidative stress. Antioxidants 2023, 12, 75. [CrossRef]
- Tesfaye, S.; Gibbons, C.H.; Malik, R.A.; Veves, A. Diabetic Neuropathy: Advances in Pathophysiology and Clinical Management, 3rd ed.; Humana Press: Cham, Switzerland, 2023.
- Molnár, G.A.; Wagner, Z.; Markó, L.; Kószegi, T.; Mohás, M.; Kocsis, B.; et al. Urinary ortho-tyrosine excretion in diabetes mellitus and renal failure: Evidence for hydroxyl radical production. Kidney Int. 2005, 68, 2281–2287. [CrossRef]
- Kun, S.; Mikolás, E.; Molnár, G.A.; et al. Association of plasma ortho-tyrosine/para-tyrosine ratio with responsiveness of erythropoiesis-stimulating agent in dialyzed patients. Redox Rep. 2014, 19, 190–198. [CrossRef]
- Mohás-Cseh, J.; Molnár, G.A.; Pap, M.; Laczy, B.; Vas, T.; Kertész, M.; et al. Incorporation of oxidized phenylalanine derivatives into insulin signaling relevant proteins may link oxidative stress to signaling conditions underlying chronic insulin resistance. Biomedicines 2022, 10, 975. [CrossRef]
- Ziegler, D.; Nowak, H.; Kempler, P.; Vargha, P.; Low, P.A. Treatment of symptomatic diabetic polyneuropathy with the antioxidant alpha-lipoic acid: A meta-analysis. Diabet. Med. 2004, 21, 114–121. [CrossRef]
- Tesfaye, S.; Kempler, P. Conventional management and current guidelines for painful diabetic neuropathy. Diabetes Res. Clin. Pract. 2023, 206(Suppl. 1), 110765. [CrossRef]
- Jermendy, G.; Rokszin, G.; Fábián, I.; Kempler, P.; Wittmann, I. Morbidity and mortality of patients with diabetic neuropathy treated with pathogenetically oriented alpha-lipoic acid versus symptomatic pharmacotherapies—A nationwide database analysis from Hungary. Diabetes Res. Clin. Pract. 2023, 201, 110734. [CrossRef]
- Kandeel, M. The outcomes of sodium-glucose co-transporter 2 inhibitors (SGLT2I) on diabetes-associated neuropathy: A systematic review and meta-analysis. Front. Pharmacol. 2022, 13, 926717. [CrossRef]
- Ishibashi, F.; Kosaka, A.; Tavakoli, M. Sodium glucose cotransporter-2 inhibitor protects against diabetic neuropathy and nephropathy in modestly controlled type 2 diabetes: Follow-up study. Front. Endocrinol. 2022, 13, 864332. [CrossRef]
- El-Haggar, S.M.; Hafez, Y.M.; El Sharkawy, A.M.; Khalifa, M. Effect of empagliflozin in peripheral diabetic neuropathy of patients with type 2 diabetes mellitus. Med. Clin. 2024, 163, 53–61. [CrossRef]
- Scheen, A.J. Pharmacodynamics, efficacy and safety of sodium-glucose co-transporter type 2 (SGLT2) inhibitors for the treatment of type 2 diabetes mellitus. Drugs 2015, 75, 33–59. [CrossRef]
- Tuttle, K.R.; Brosius, F.C.; Cavender, M.A.; Heerspink, H.J.L.; Jones, D.W.; Mahaffey, K.W.; et al. SGLT2 inhibition for CKD and T2D: Bridging pathophysiology to clinical outcomes. J. Am. Soc. Nephrol. 2021, 32, 2449–2463. [CrossRef]
- Takakura, S.; Toyoshi, T.; Hayashizaki, Y.; Takasu, T. Effect of ipragliflozin, an SGLT2 inhibitor, on progression of diabetic microvascular complications in spontaneously diabetic Torii fatty rats. Life Sci. 2016, 147, 125–131.
- Lee, K.A.; Jin, H.Y.; Lee, N.Y.; Kim, Y.J.; Park, T.S. Effect of empagliflozin, a selective sodium-glucose cotransporter 2 inhibitor, on kidney and peripheral nerves in streptozotocin-induced diabetic rats. Diabetes Metab. J. 2018, 42, 338–342.
- Inzucchi, S.E.; Zinman, B.; Fitchett, D.; Wanner, C.; Ferrannini, E.; Schumacher, M.; et al. How does empagliflozin reduce cardiovascular mortality? Insights from a mediation analysis of the EMPA-REG OUTCOME trial. Diabetes Care 2018, 41, 356–363. [CrossRef]
- Heerspink, H.J.L.; Stefansson, B.V.; Correa-Rotter, R.; Chertow, G.M.; Greene, T.; Hou, F.F.; et al. Dapagliflozin in patients with chronic kidney disease. N. Engl. J. Med. 2020, 383, 1436–1446. [CrossRef]
- Maruyama, T.; Takashima, H.; Oguma, H.; Nakamura, Y.; Ohno, M.; Utsunomiya, K.; et al. Canagliflozin improves erythropoiesis in diabetes patients with anemia of chronic kidney disease. Diabetes Technol. Ther. 2019, 21, 713–720. [CrossRef]
- Fuchs Andersen, C.; Omar, M.; Glenthøj, A.; El Fassi, D.; Møller, H.J.; Lindholm Kurtzhals, J.A.; et al. Effects of empagliflozin on erythropoiesis in heart failure: Data from the Empire HF trial. Eur. J. Heart Fail. 2023, 25, 226–234. [CrossRef]
- Koshino, A.; Neuen, B.L.; Jongs, N.; Arnott, C.; Mahaffey, K.W.; Rossing, P.; Perkovic, V.; de Zeeuw, D. Effects of dapagliflozin and dapagliflozin-saxagliptin on erythropoiesis, iron, and inflammation markers in patients with type 2 diabetes and chronic kidney disease: Data from the DELIGHT trial. Cardiovasc. Diabetol. 2023, 22, 330. [CrossRef]
- Savelieff, M.G.; Feldman, E.L. Diabetic peripheral neuropathy predictors of disease progression. Neurology 2024, 103, e209705. [CrossRef]
- Molnár, G.A.; Mikolás, E.Z.; Szijártó, I.A.; Kun, S.; Sélley, E.; Wittmann, I. Tyrosine isomers and hormonal signaling: A possible role for the hydroxyl free radical in insulin resistance. World J. Diabetes 2015, 6, 500–507. [CrossRef]
- Dyck, P.J.; Kratz, K.M.; Karnes, J.L.; Litchy, W.J.; Klein, R.; Pach, J.M.; et al. The Rochester Diabetic Neuropathy Study: Reassessment of tests and criteria for diagnosis and staging. Neurology 1992, 42, 1508. [CrossRef]
- Jesri, A.; Okonofua, E.C.; Egan, B.M. Platelet and white blood cell counts are elevated in patients with the metabolic syndrome. J. Clin. Hypertens. 2005, 7, 705–711. [CrossRef]
- Mikolás, E.; Kun, S.; Laczy, B.; Molnár, G.A.; Sélley, E.; Kőszegi, T.; Wittmann, I. Incorporation of ortho- and meta-tyrosine into cellular proteins leads to erythropoietin-resistance in an erythroid cell line. Kidney Blood Press. Res. 2013, 38, 217–225. [CrossRef]
- Bhat, F.A.; Advani, J.; Khan, A.A.; Mohan, S.; Pal, A.; Gowda, H.; et al. A network map of thrombopoietin signaling. J. Cell Commun. Signal. 2018, 12, 737–743. [CrossRef]
Figure 1.
Current perception threshold (CPT) values at baseline (week 0) and after 4 weeks of SGLT-2 inhibitor therapy in patients whose peroneal nerve CPTs were above the normal range at baseline. Data are presented as mean ± SD CPT (10μA) at 2000 Hz, 250 Hz, and 5 Hz, measured on the left and right sides. The sample size (n) for each subgroup is indicated above its respective bar, along with the p-values from paired-samples t-tests comparing week 0 and week 4.Abbreviation: CPT, current perception threshold.
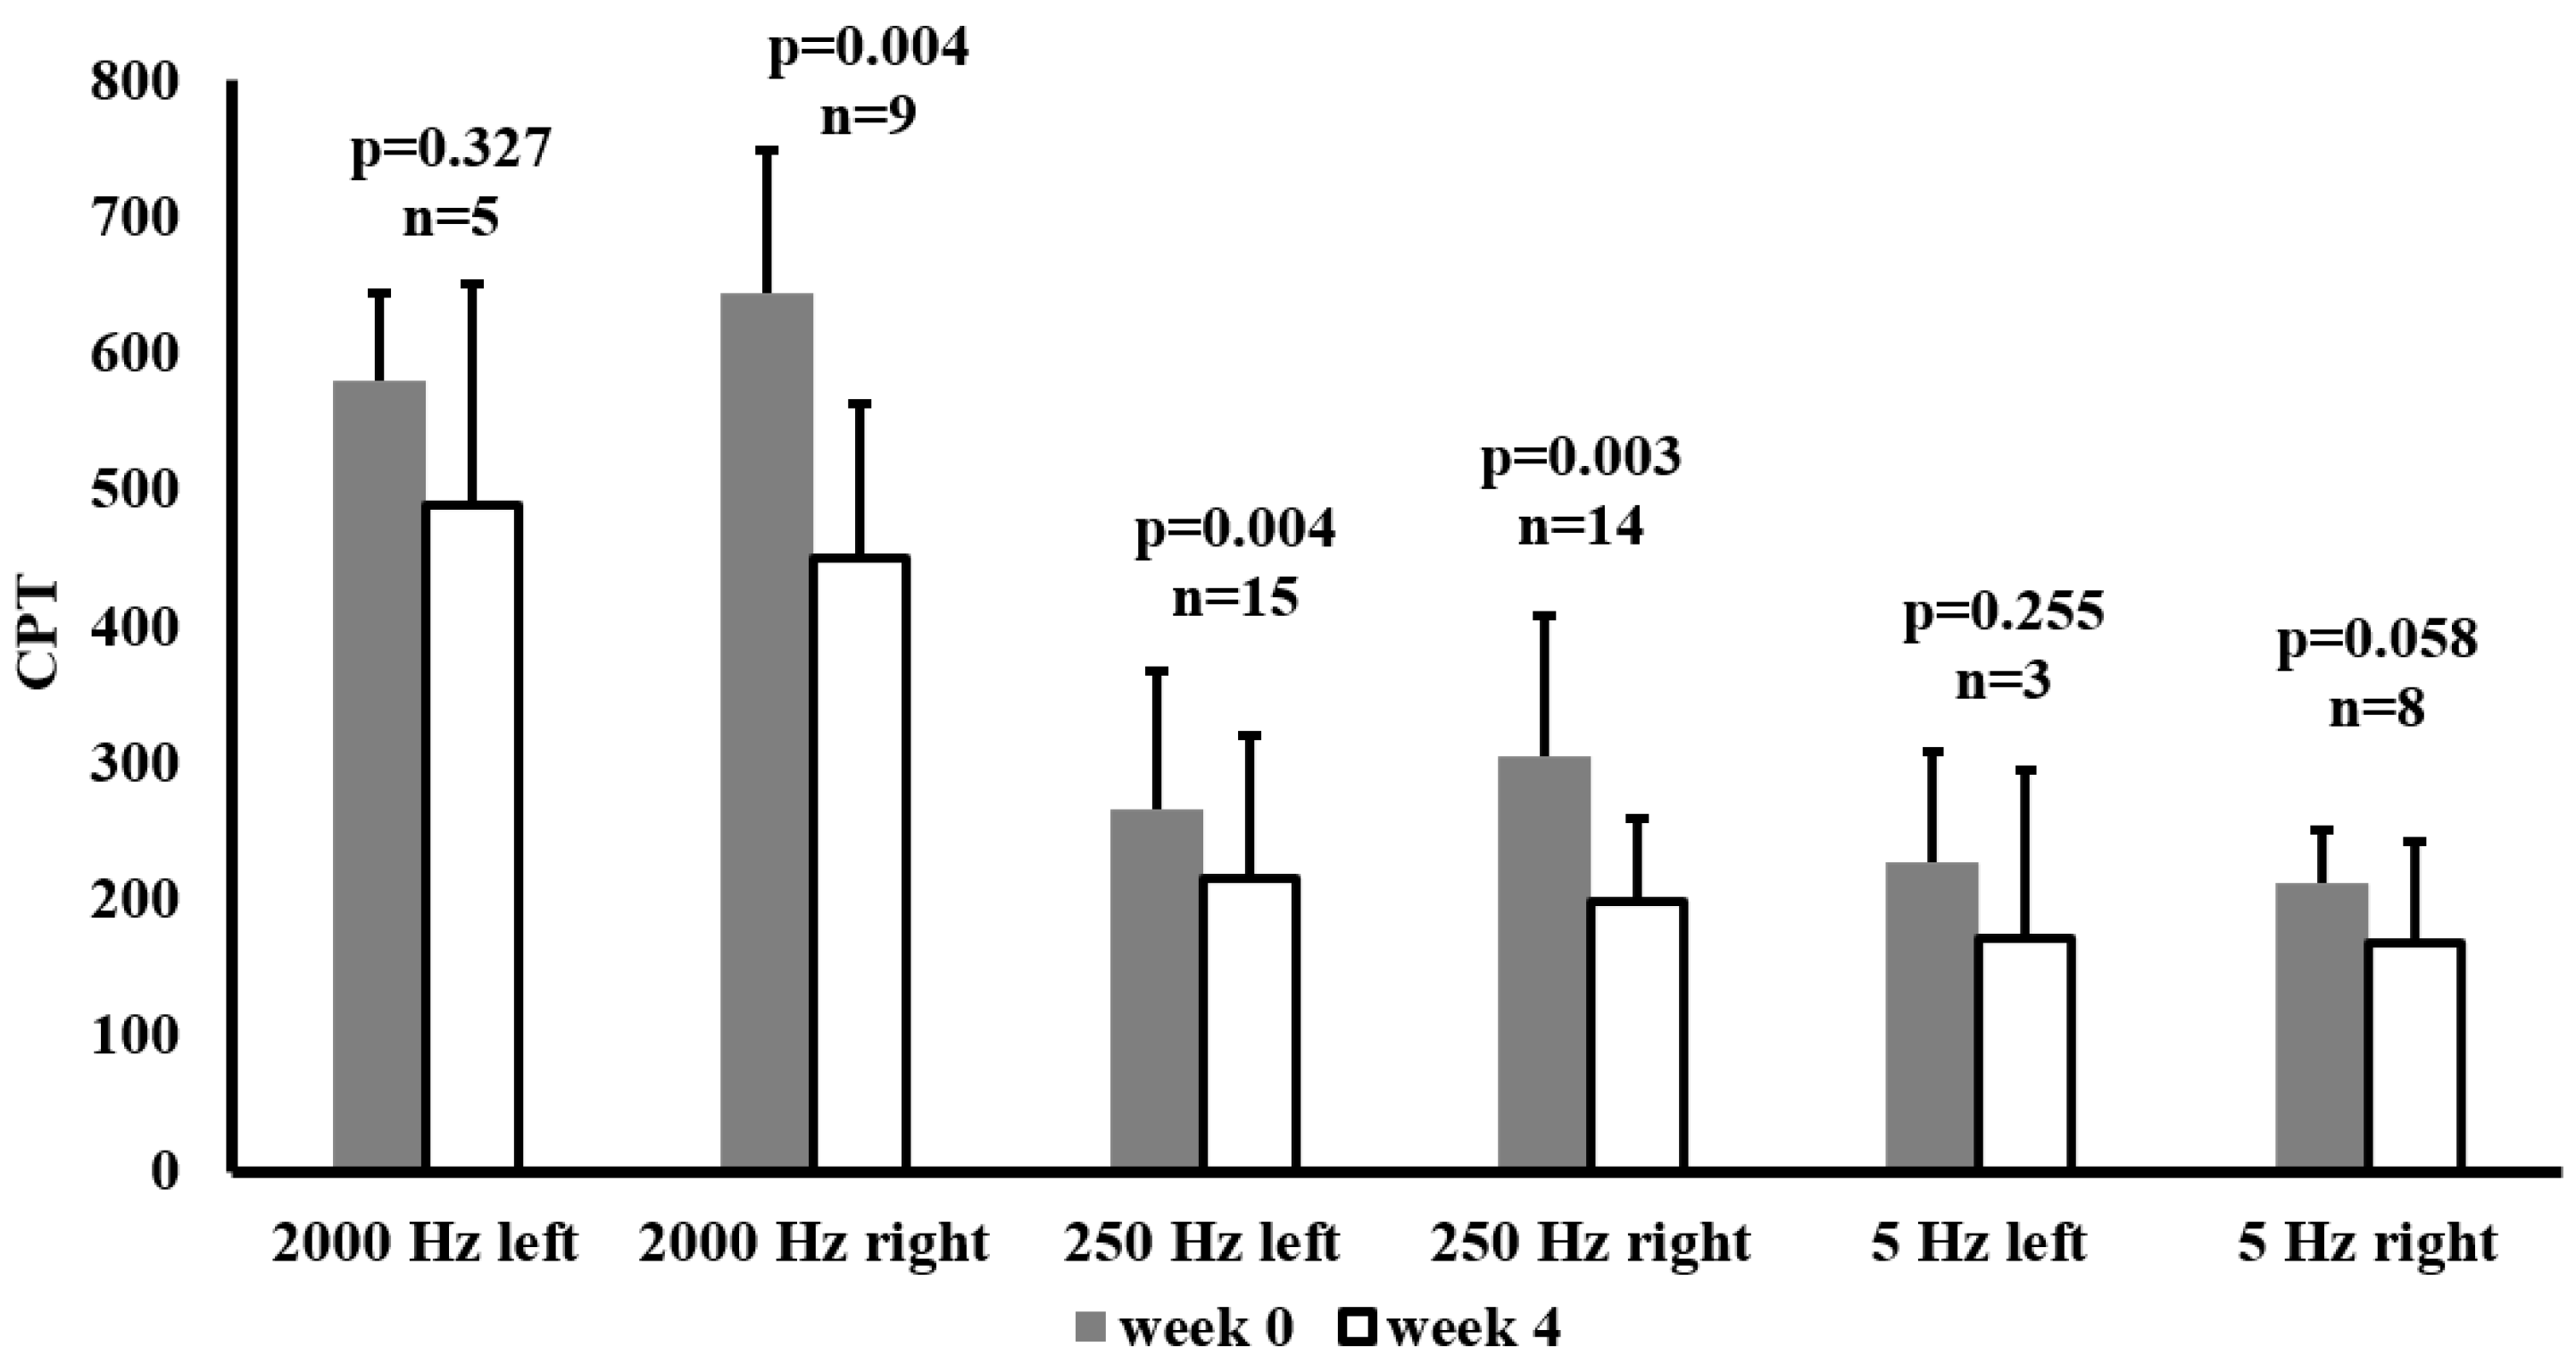
Figure 2.
Current perception threshold (CPT) values at baseline (week 0) and after 4 weeks of SGLT-2 inhibitor therapy in patients whose median nerve CPTs were above the normal range at baseline. Data are presented as mean ± SD CPT (10μA) at 2000 Hz, 250 Hz, and 5 Hz, measured on the left and right sides. The sample size (n) for each subgroup is indicated above its respective bar, along with the p-values from paired-samples t-tests comparing week 0 and week 4.Abbreviation: CPT, current perception threshold.
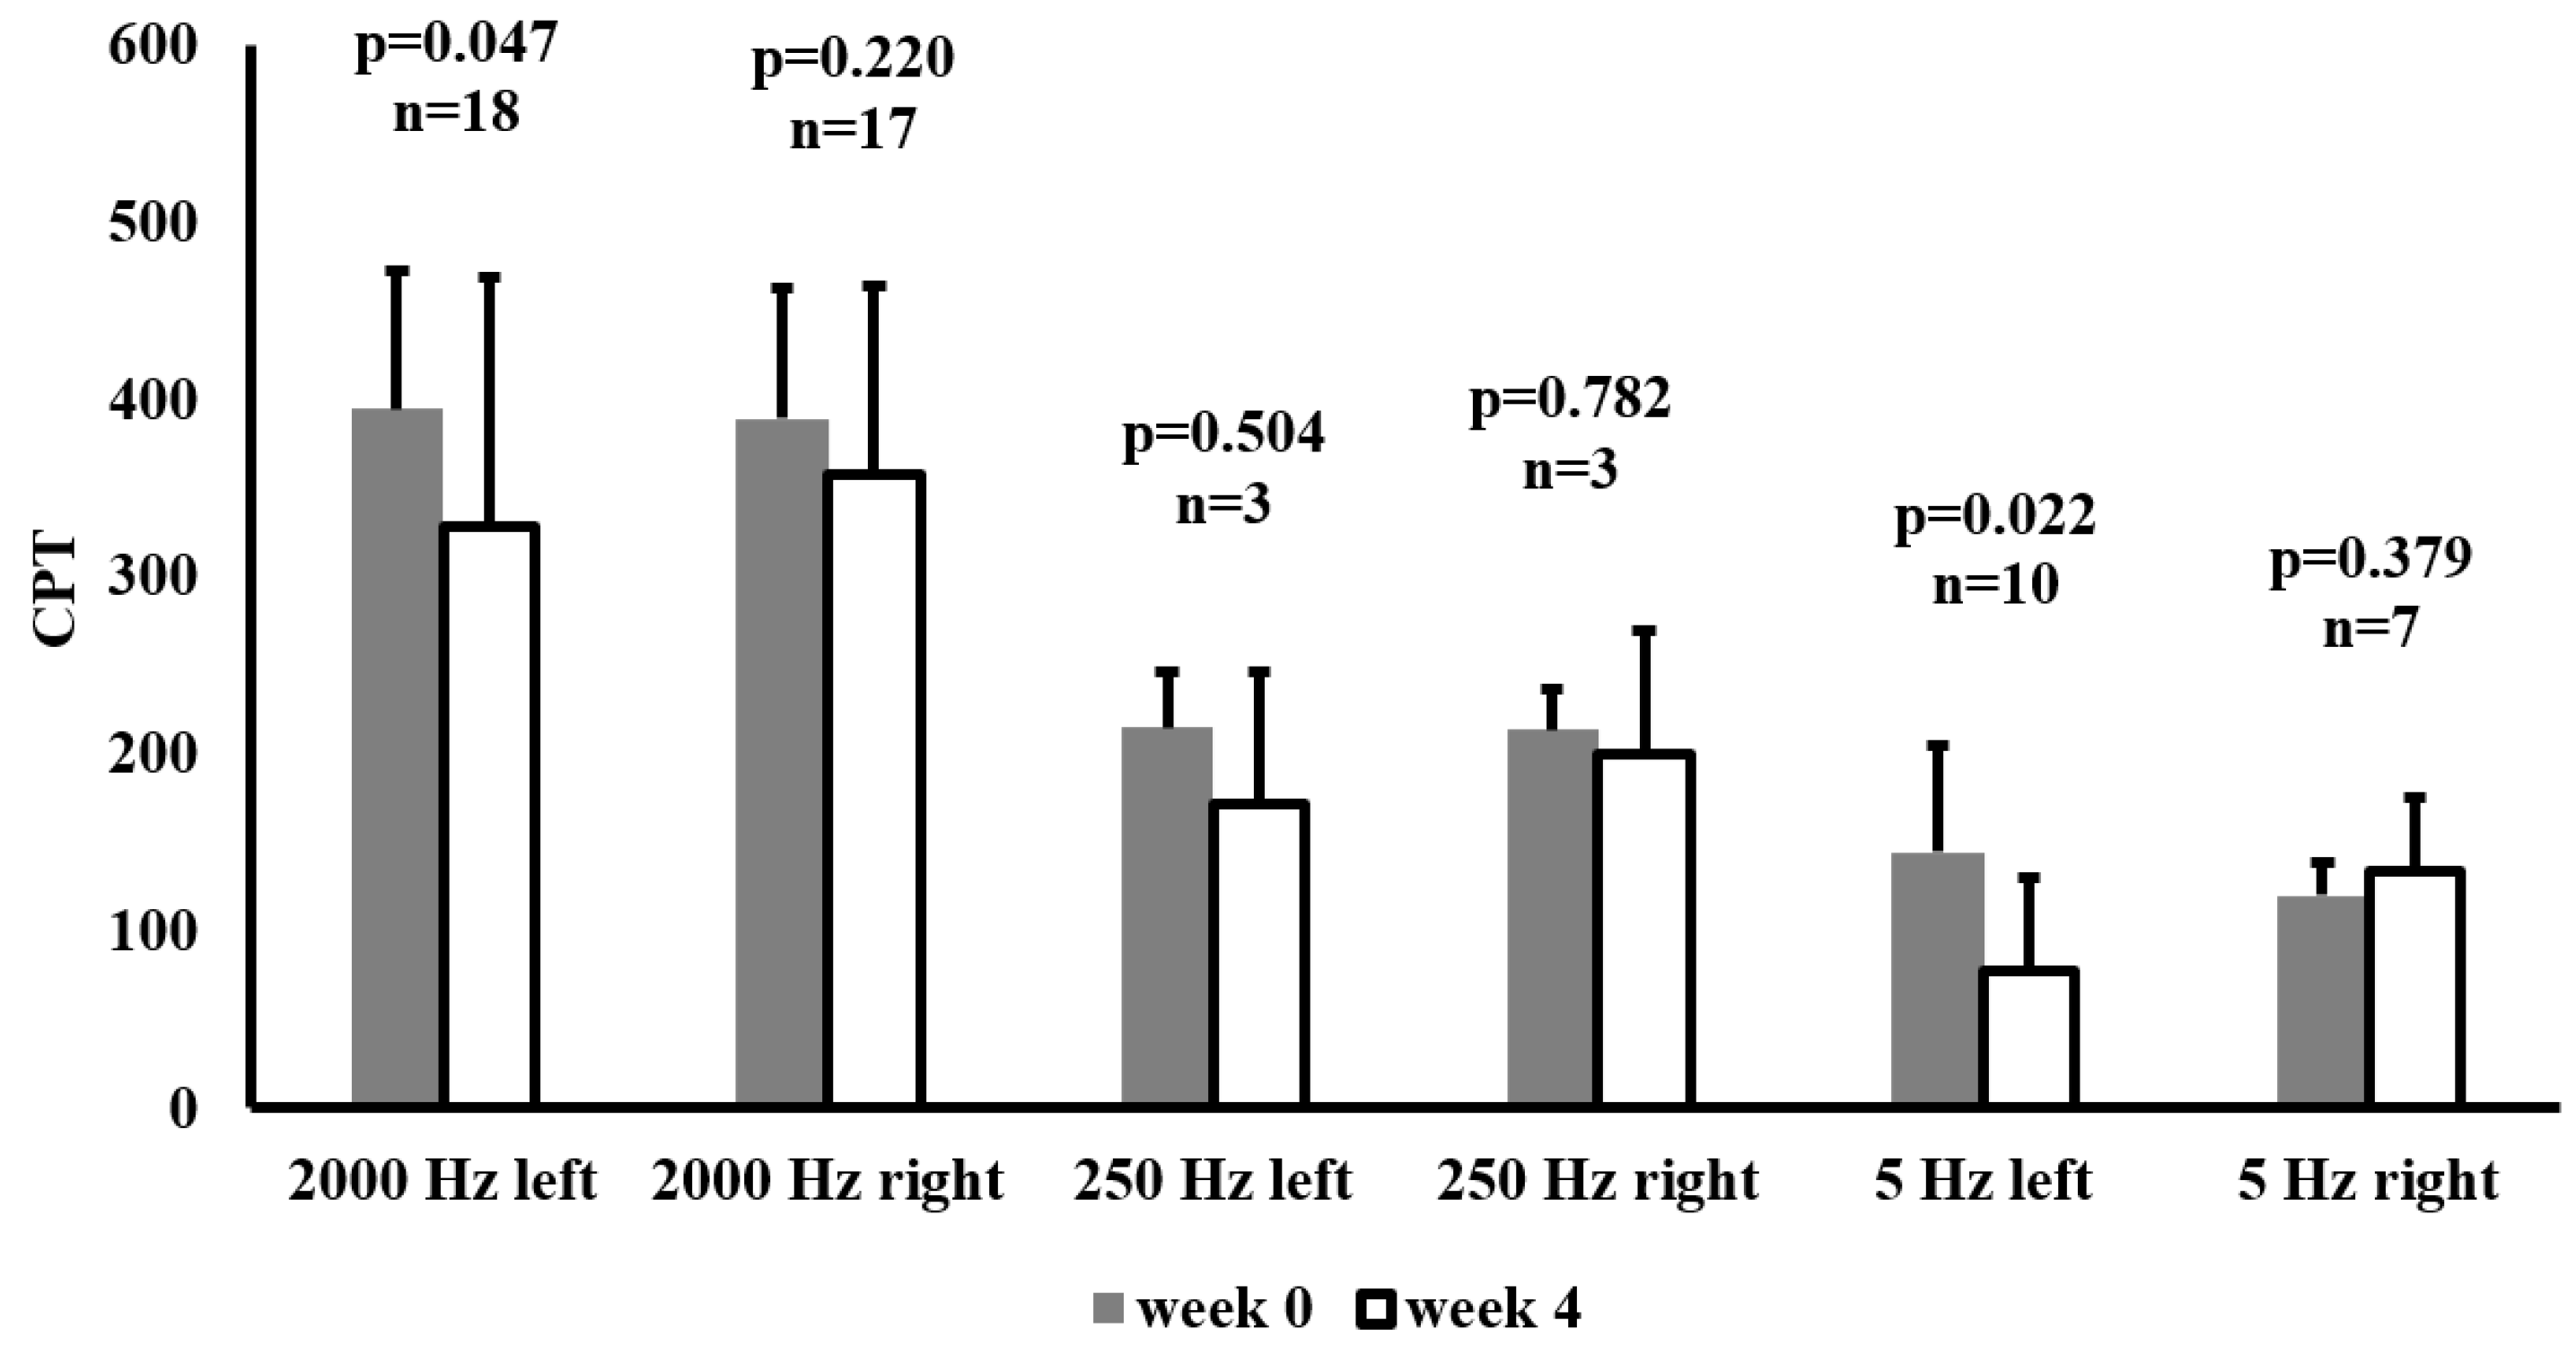
Figure 3.
Correlation between red blood cell count (RBC) and the (m-Tyr + o-Tyr)/p-Tyr ratio in serum (panels A, B) and urine (panels C, D) at week 0 (A, C) and week 4 (B, D) of SGLT-2 inhibitor therapy. Each panel indicates the Pearson correlation coefficient (r) and corresponding p-value. The fitted line represents the linear regression trend. Abbreviations: RBC, red blood cell; m-Tyr, meta-tyrosine; o-Tyr, ortho-tyrosine; p-Tyr, para-tyrosine.
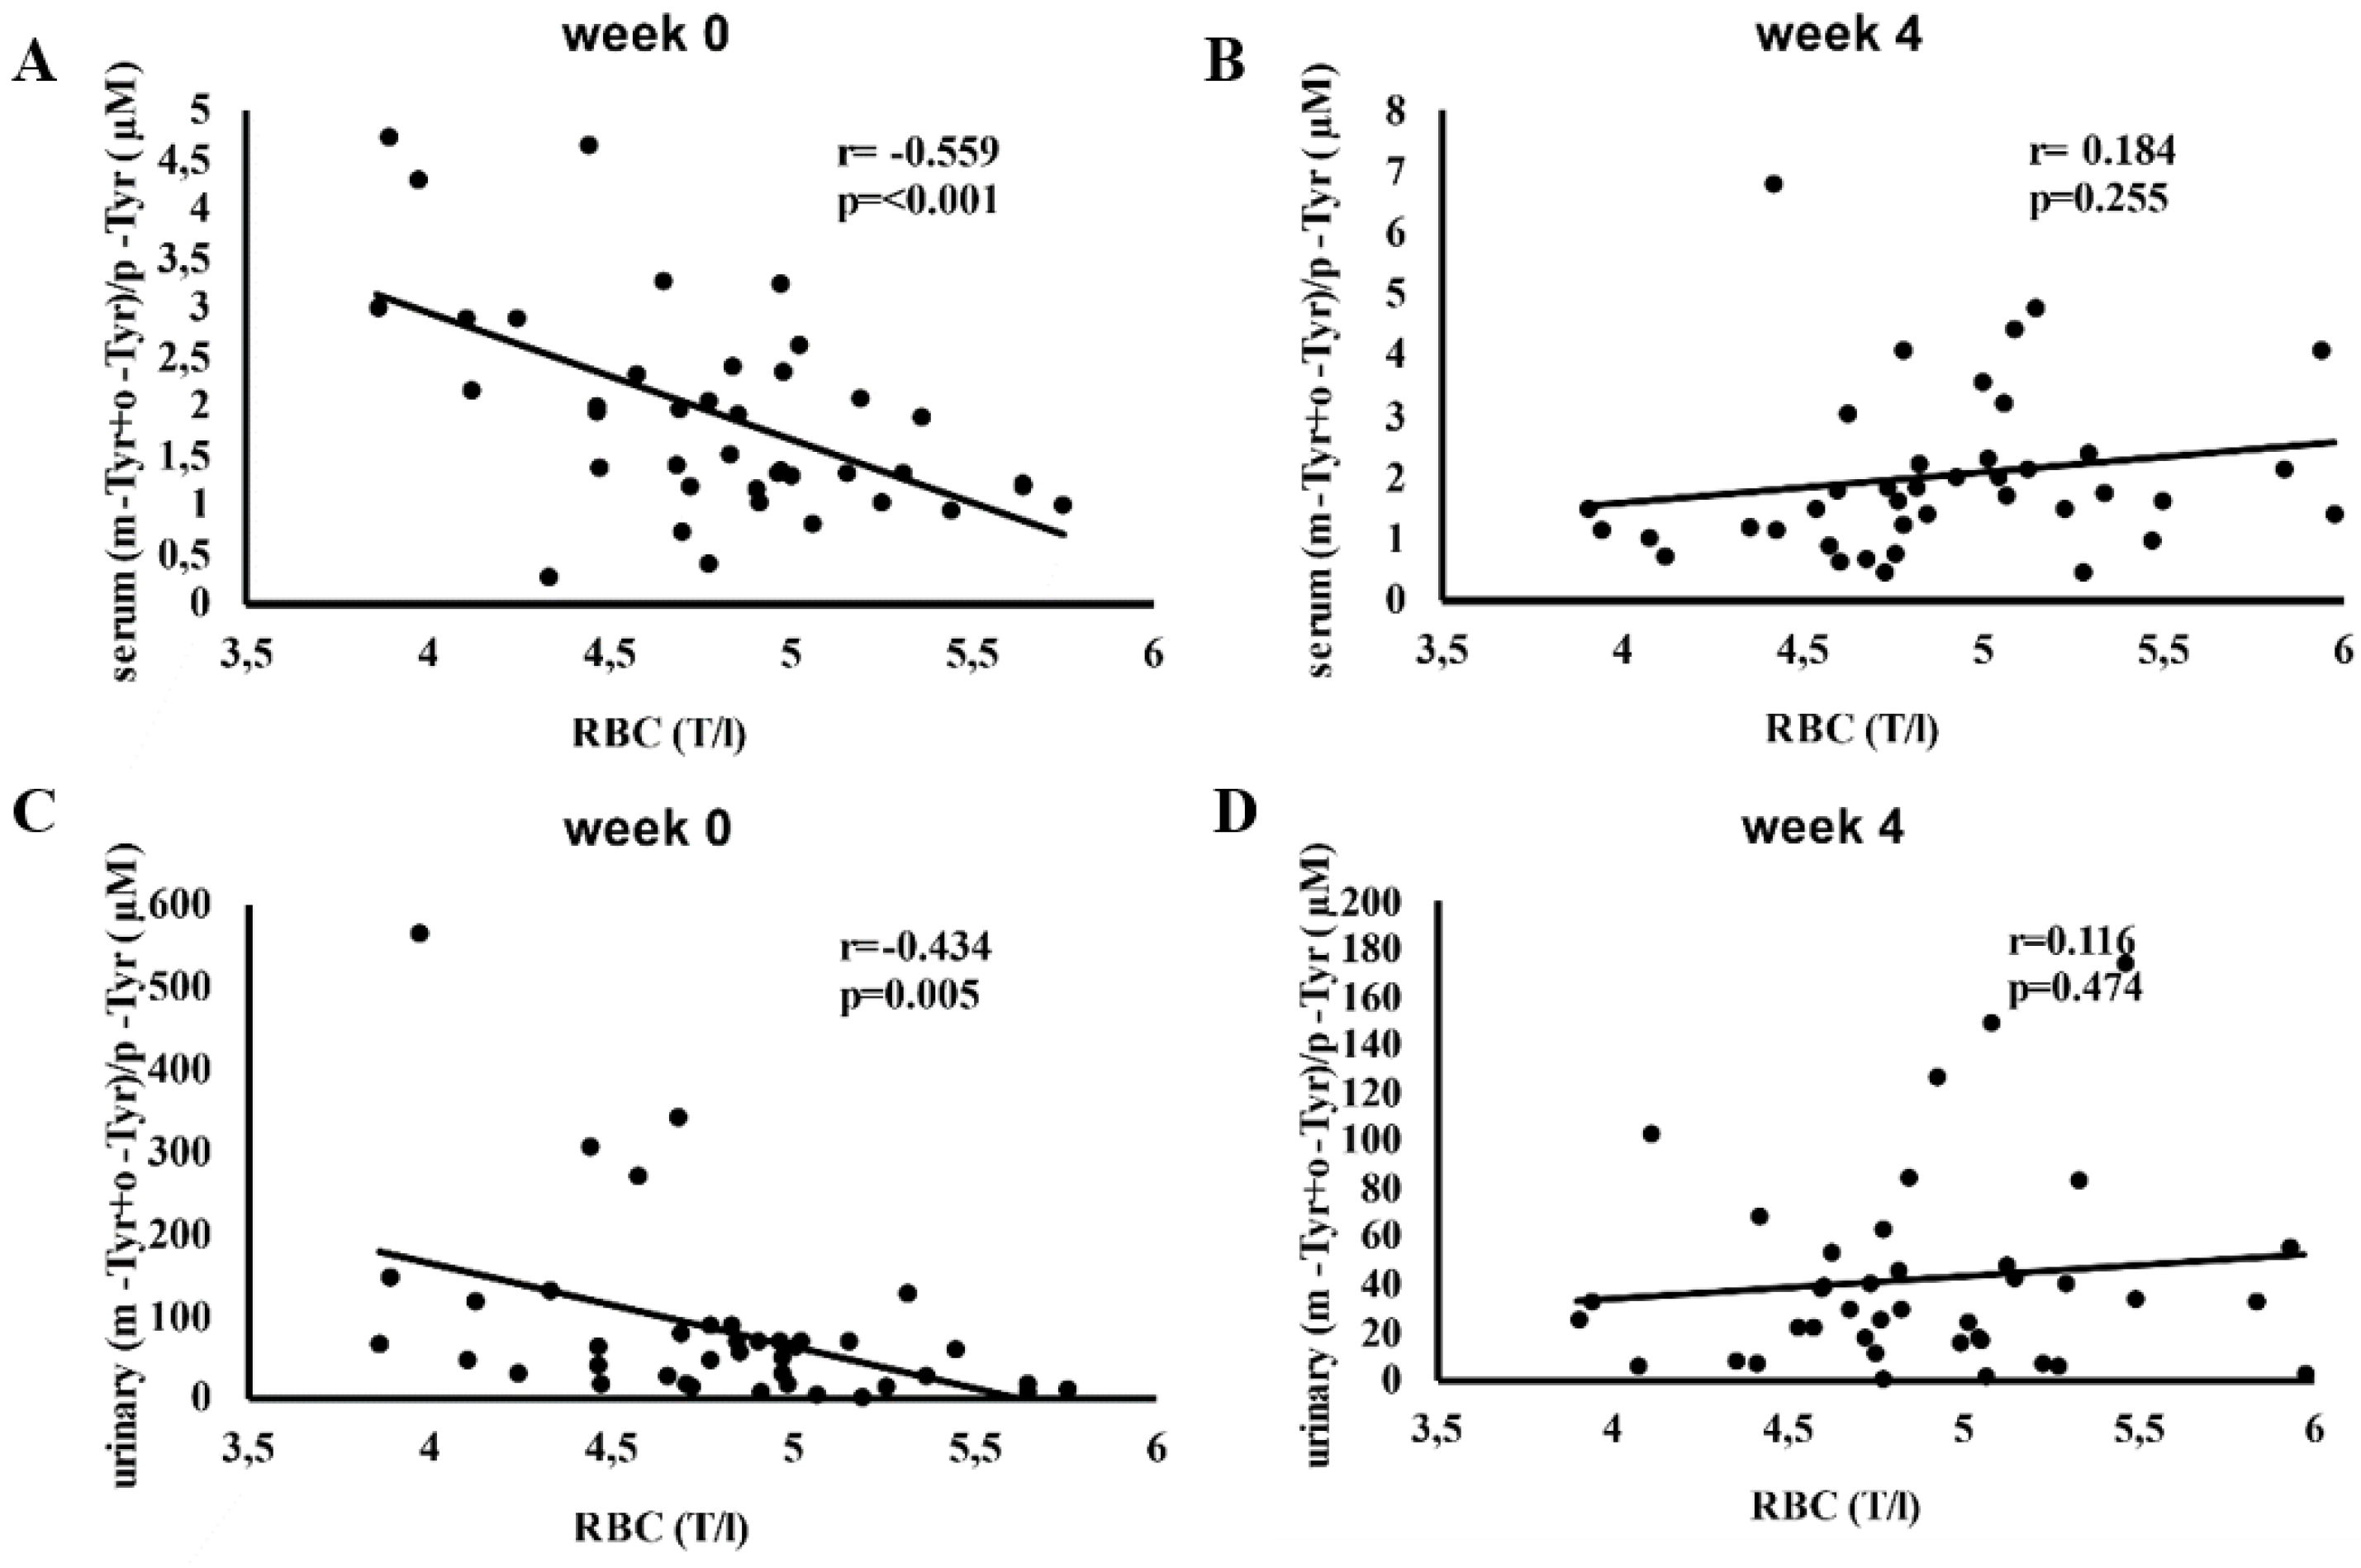
Figure 4.
Correlation between hemoglobin (Hgb) levels and the (m-Tyr + o-Tyr)/p-Tyr ratio in serum (panels A, B) and urine (panels C, D) at week 0 (A, C) and week 4 (B, D) of SGLT-2 inhibitor therapy. Each panel indicates the Pearson correlation coefficient (r) and corresponding p-value. The fitted line represents the linear regression trend. Abbreviations: Hgb, hemoglobin; m-Tyr, meta-tyrosine; o-Tyr, ortho-tyrosine; p-Tyr, para-tyrosine.
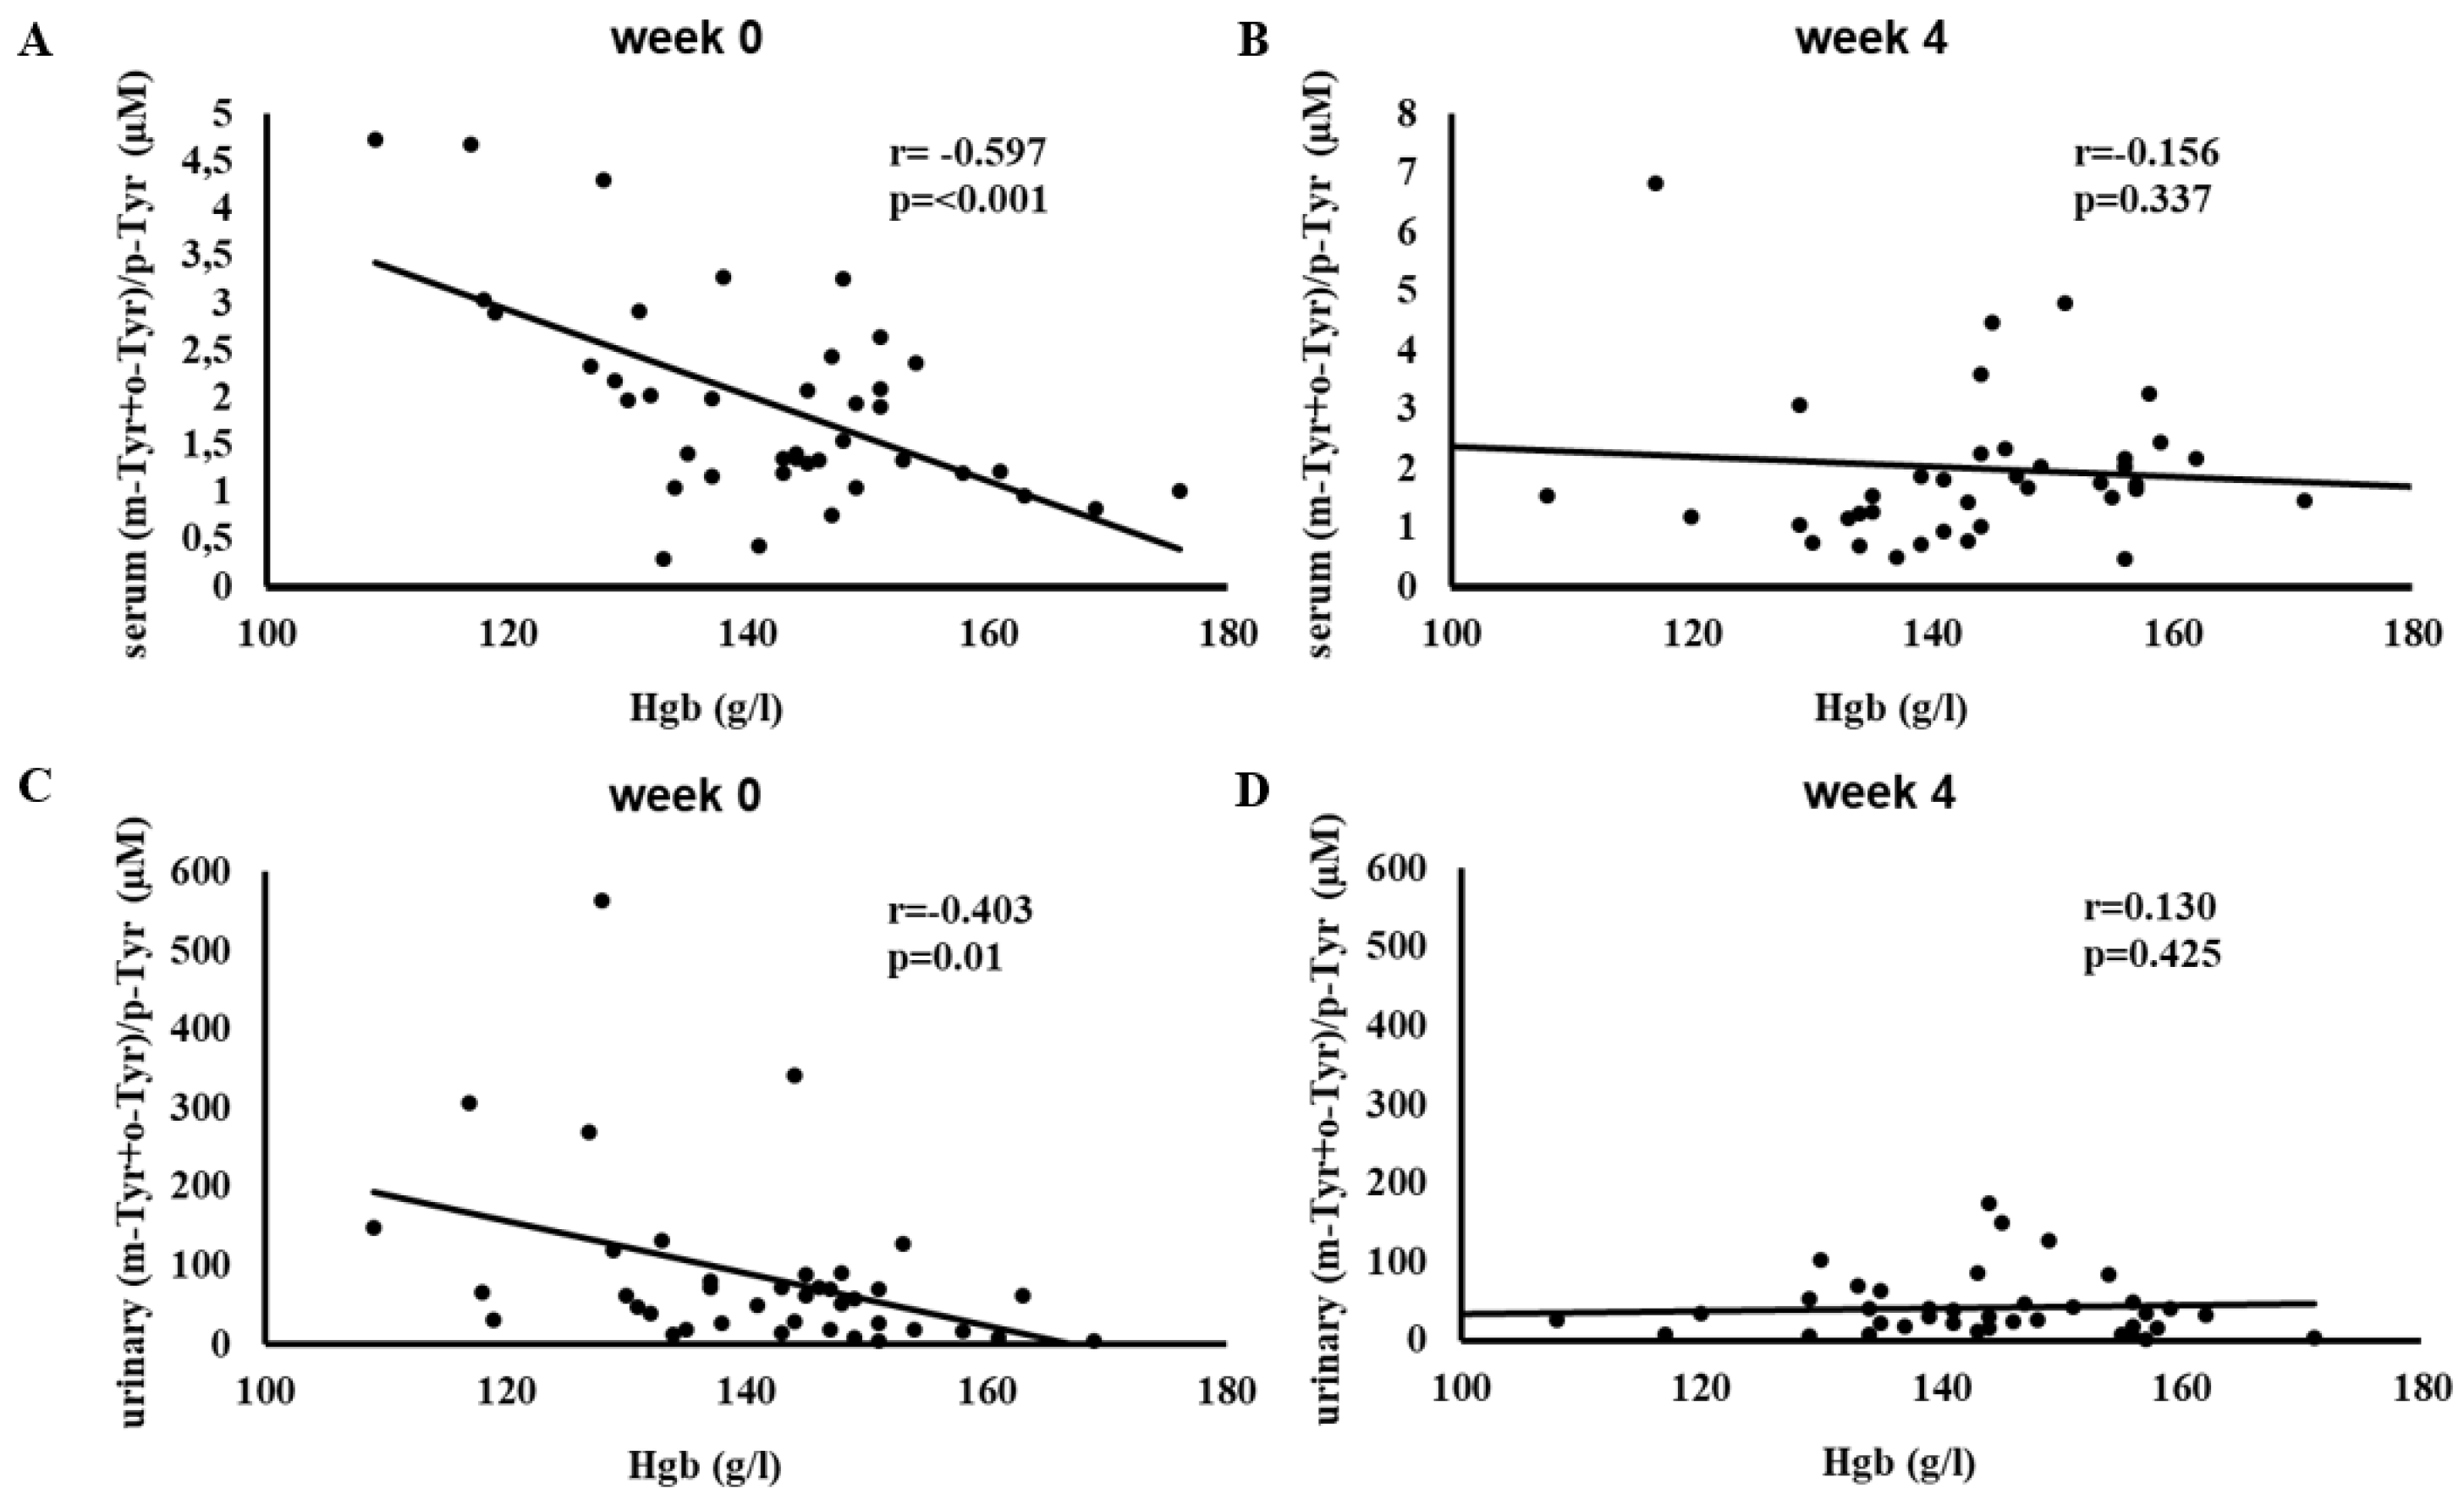
Figure 5.
Correlation between hematocrit (Htc) and the (m-Tyr + o-Tyr)/p-Tyr ratio in serum (panels A, B) and urine (panels C, D) at week 0 (A, C) and week 4 (B, D) of SGLT-2 inhibitor therapy. Each panel indicates the Pearson correlation coefficient (r) and corresponding p-value. The fitted line represents the linear regression trend. Abbreviations: Htc, hematocrit; m-Tyr, meta-tyrosine; o-Tyr, ortho-tyrosine; p-Tyr, para-tyrosine.
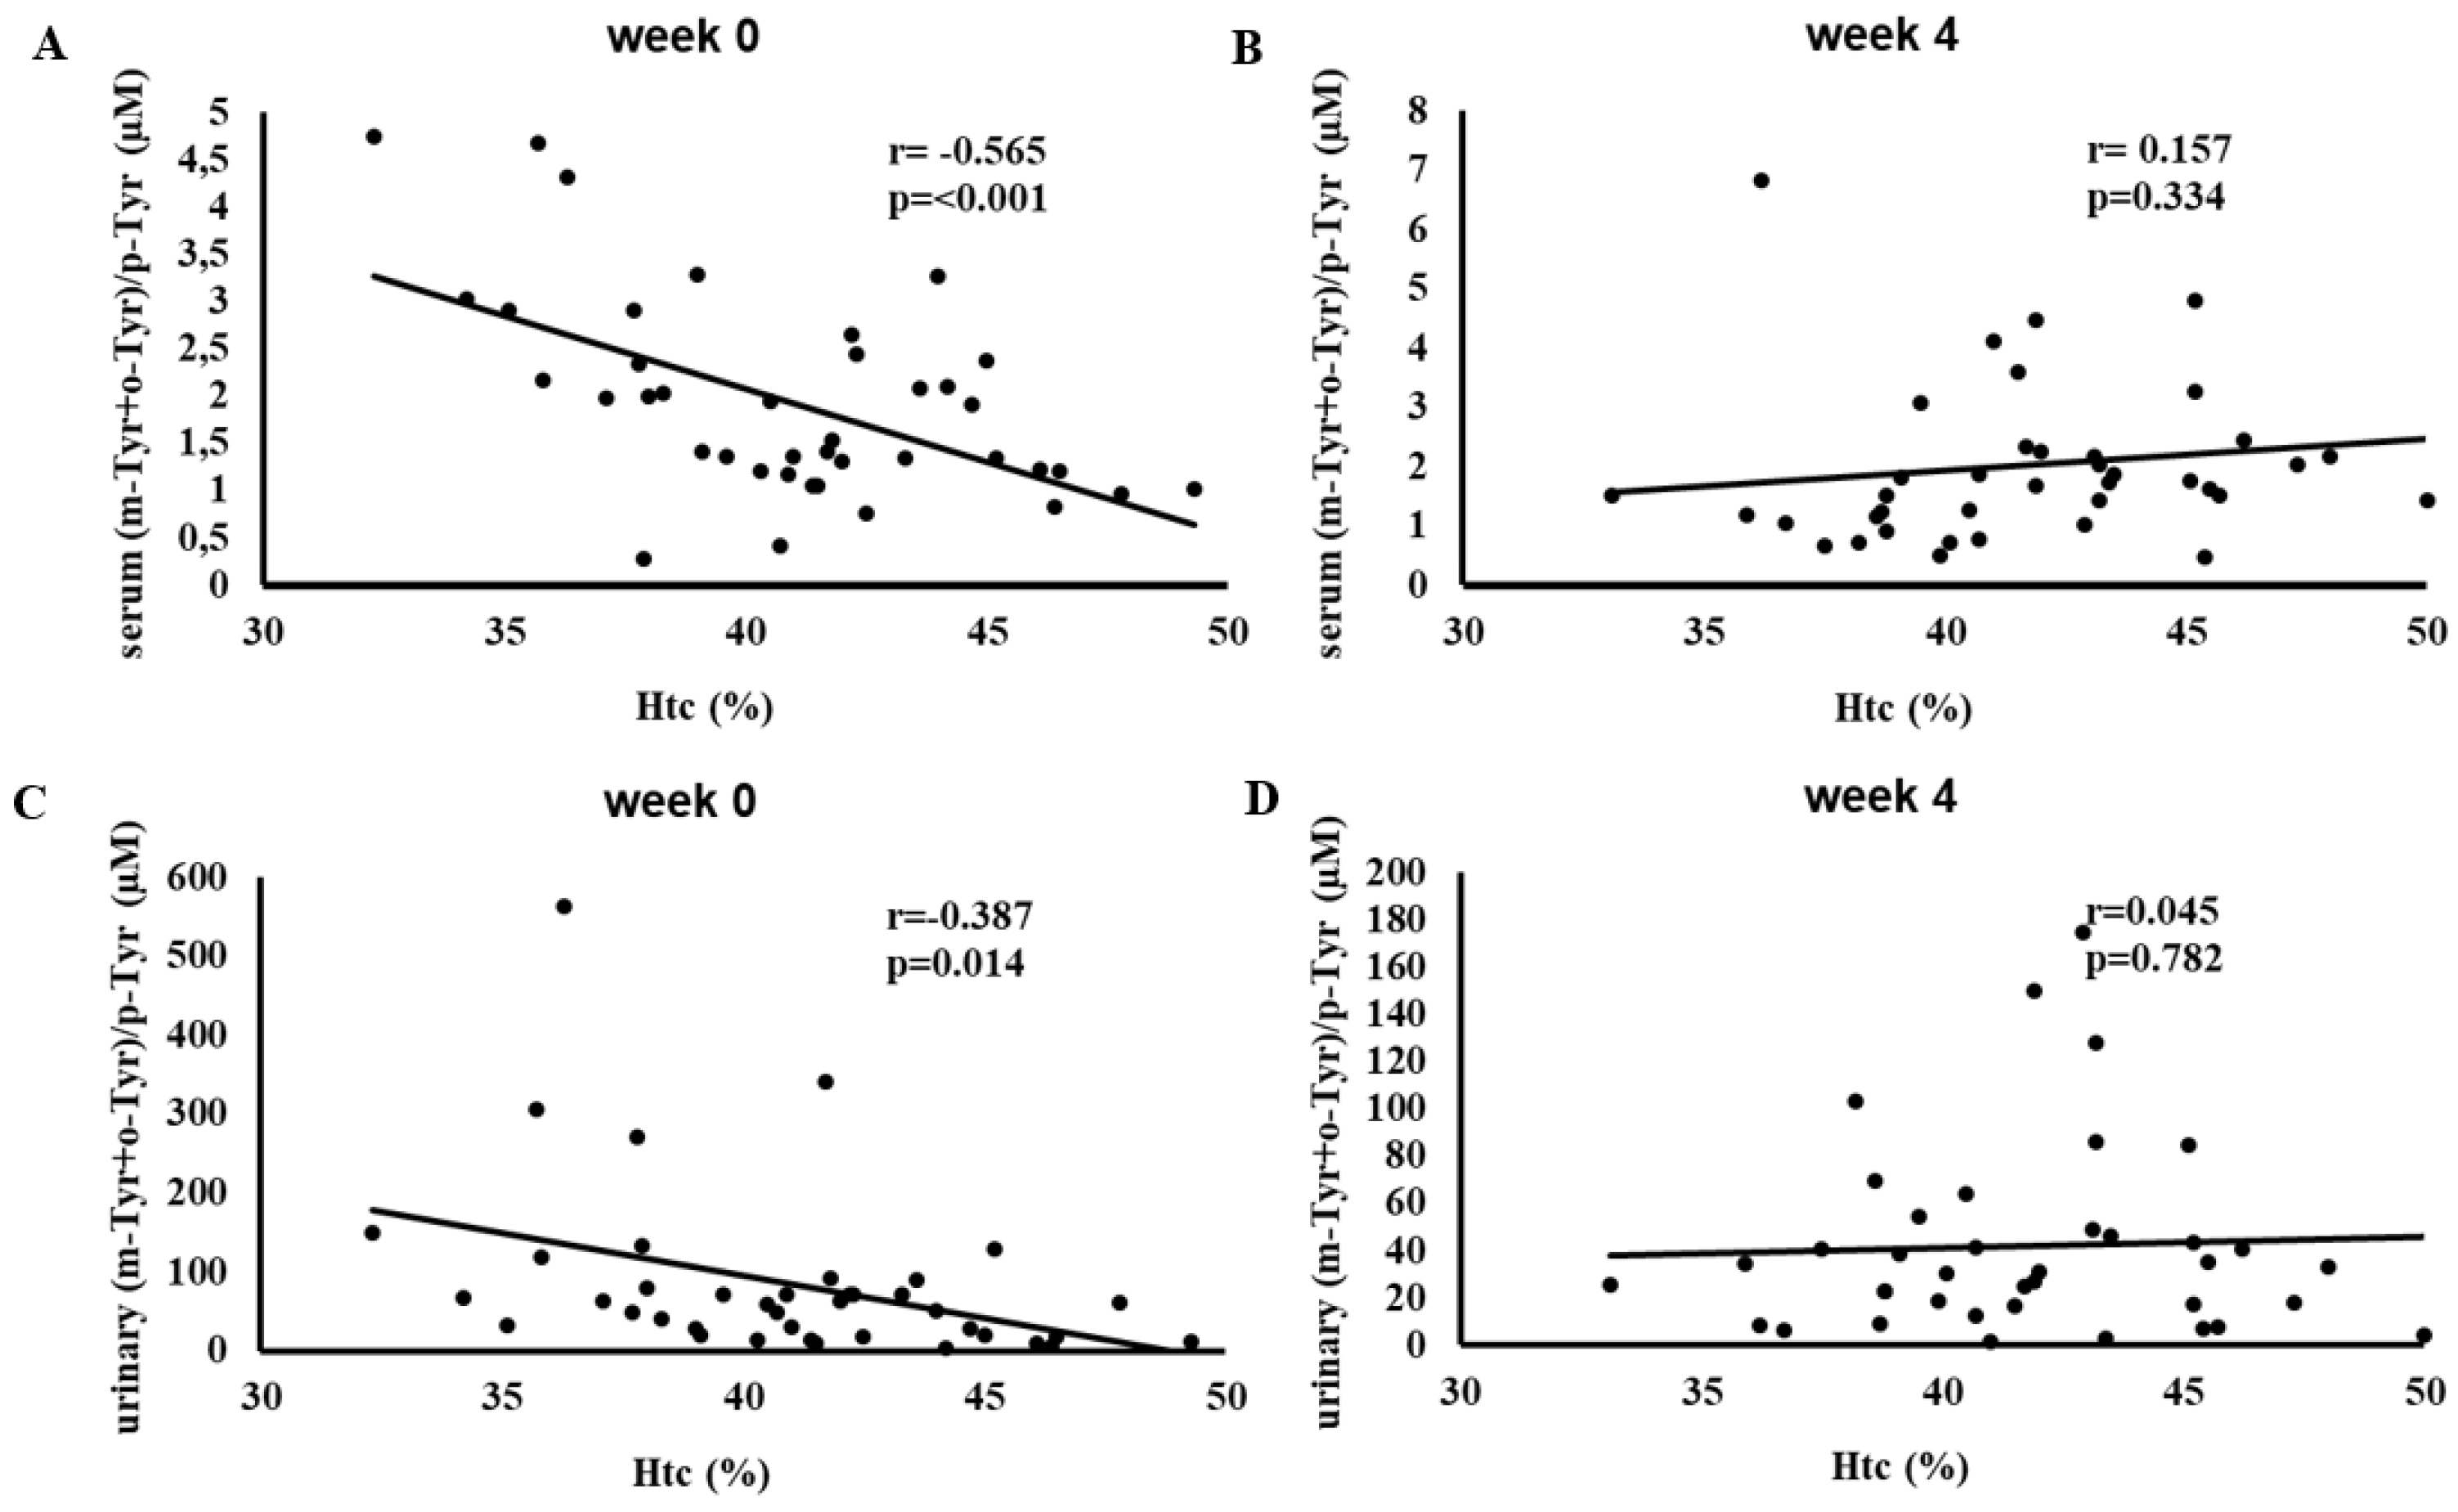
Figure 6.
Correlation between changes (week 0 to week 4) in serum o-Tyr, o-Tyr/Phe, or o-Tyr/p-Tyr and changes (week 0 to week 4) in CPT results at 2000 Hz median nerve (panels A, C, E) and 250 Hz peroneal nerve (panels B, D, F). Analyses include patients whose baseline (week 0) CPT values were above the normal range for the specified nerve and frequency (n = 25). Each panel indicates the Pearson correlation coefficient (r) and corresponding p-value. The fitted line represents the linear regression trend. Abbreviations: CPT, current perception threshold; o-Tyr, ortho-tyrosine; Phe, phenylalanine; p-Tyr, para-tyrosine.
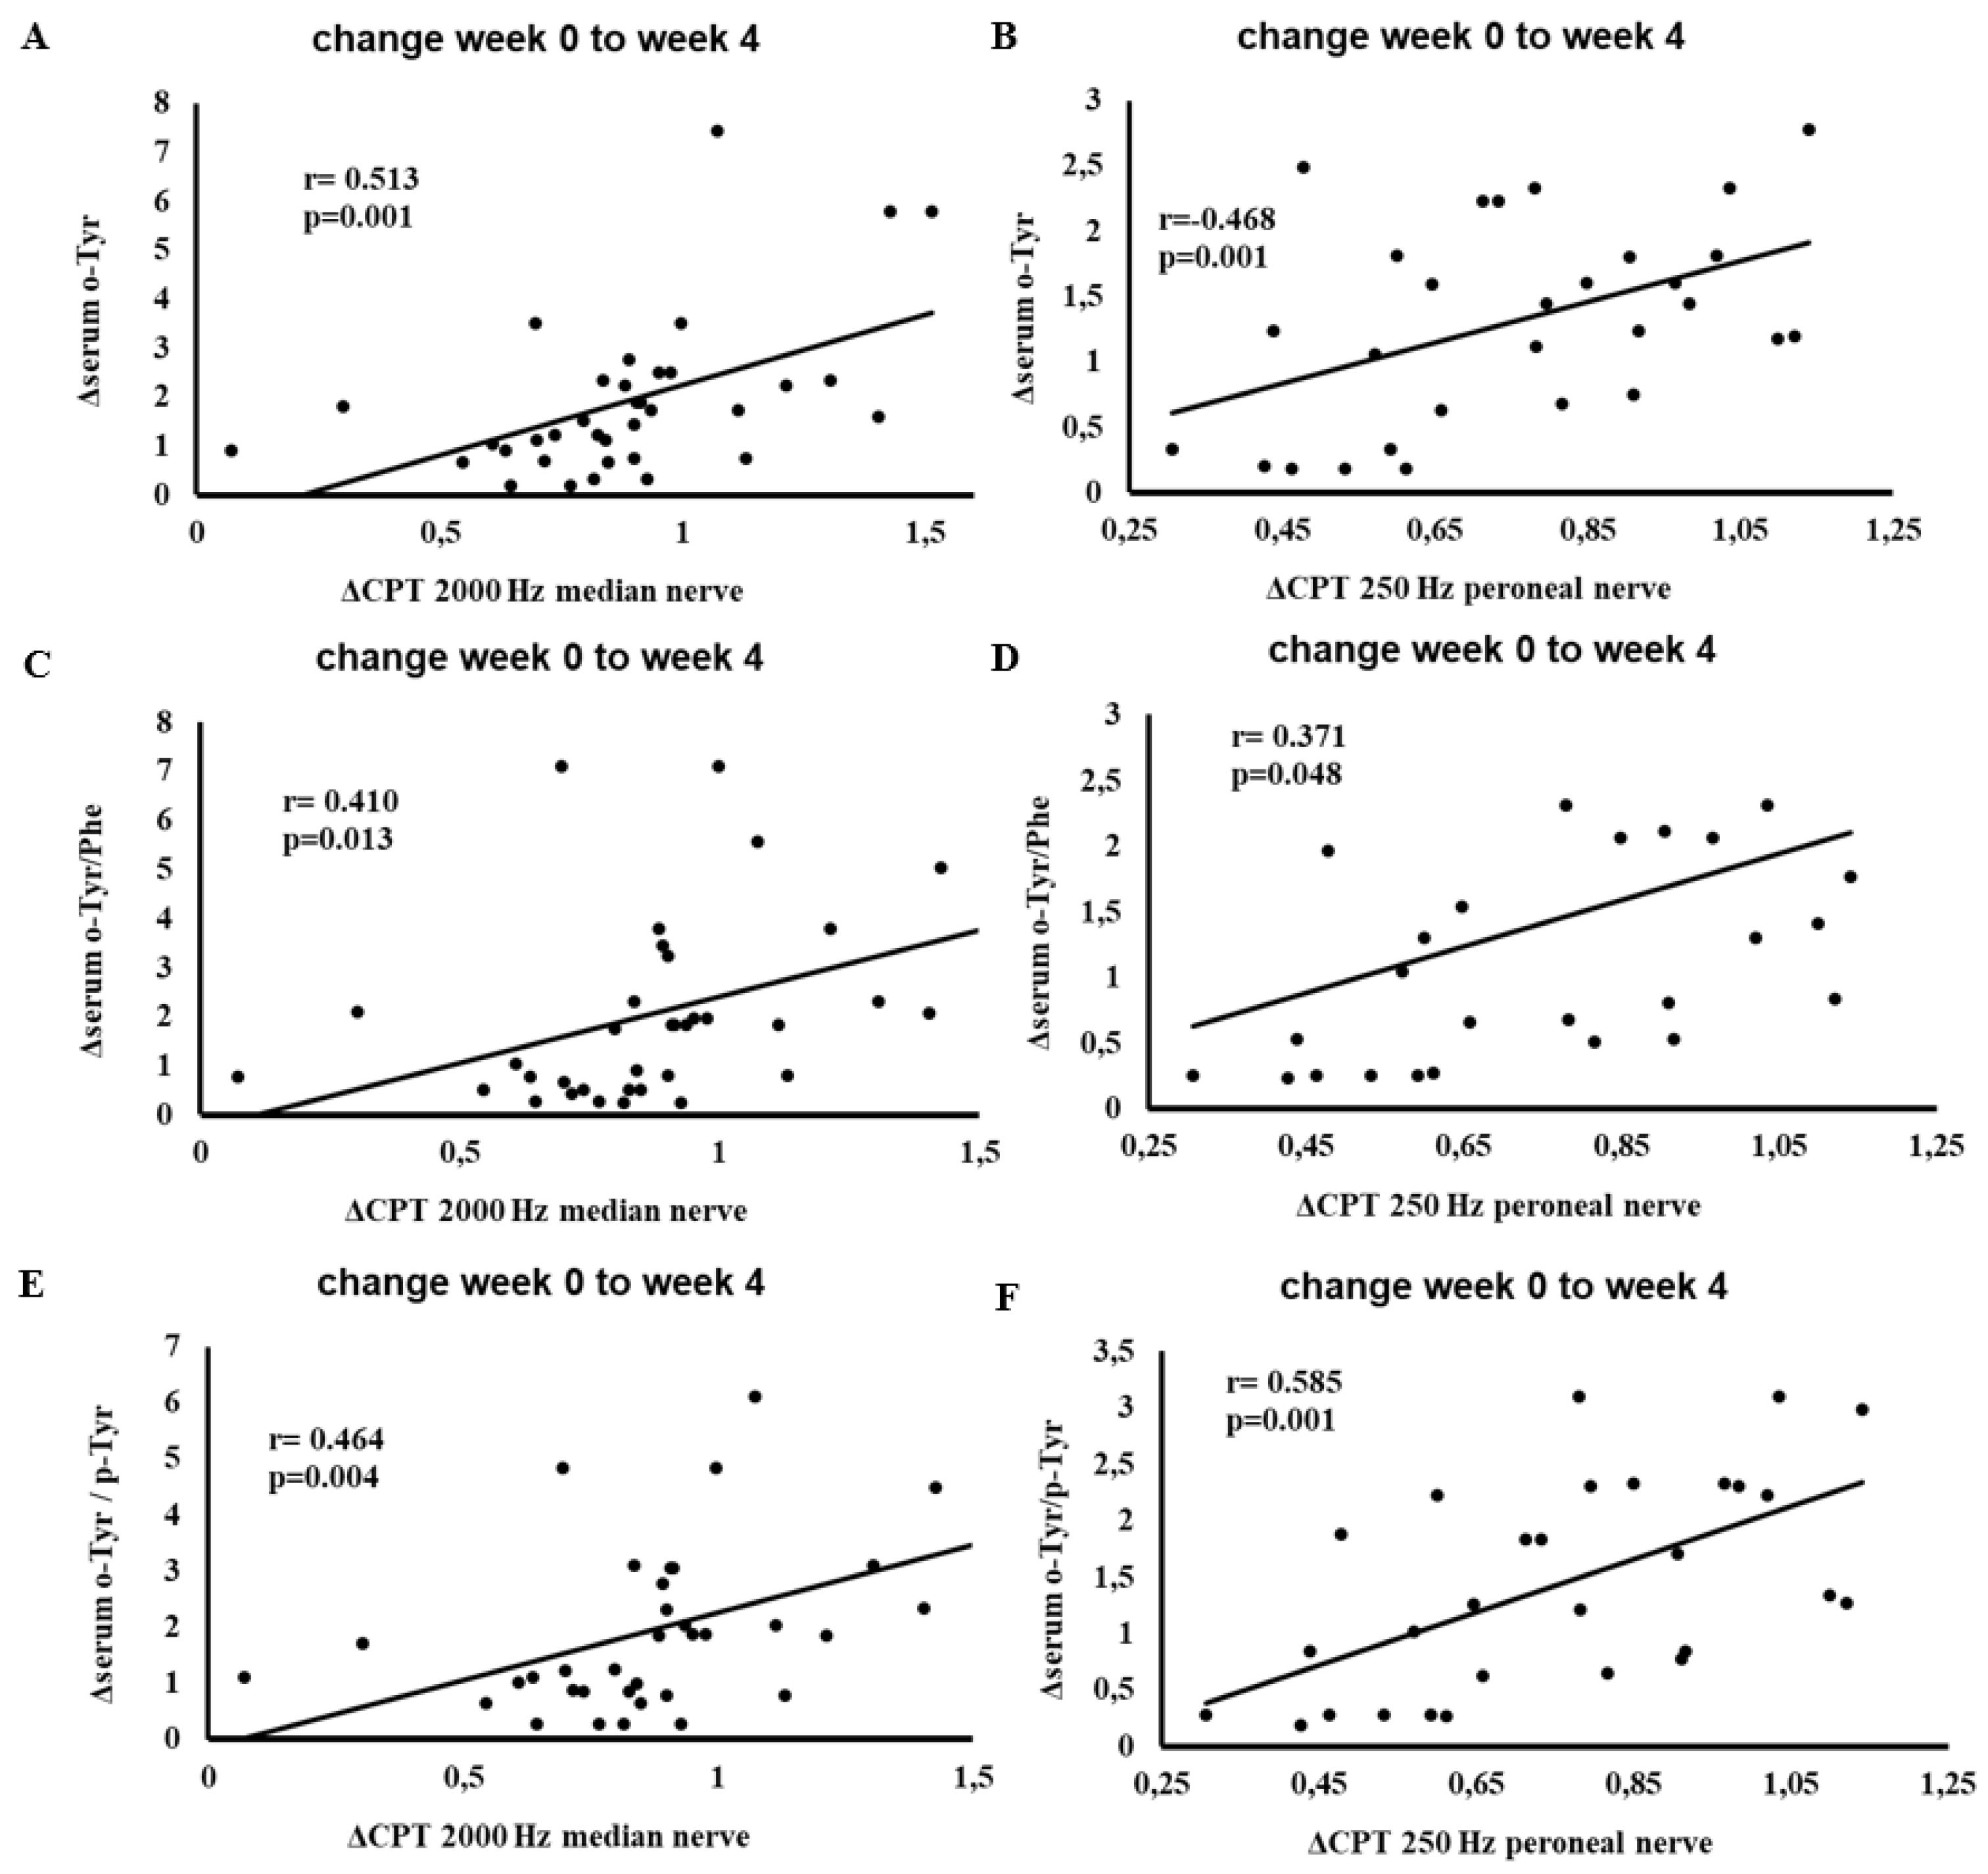

Table 1.
The effect of SGLT-2 inhibitor therapy on clinical and hydroxyl radical parameters.
| week 0 | week 4 | p | |
|---|---|---|---|
| n | 40 | ||
| Age (year) | 61±9 | ||
| Gender (male [%]) | 19 [47.5] | ||
| Diabetes duration (year) | 8.3±8.0 | ||
| Dapagliflozin/empagliflozin [%] | 18/22 [45/55] | ||
| Body weight (kg) | 92.52 ± 16.78 | 90.4 ± 15.01 | 0.004 |
| BMI (kg/m2) | 32.6 ± 4.45 | 31.94 ± 4.19 | 0.006 |
| Hemodynamic and neuropathic parameters | |||
| RR distance in SR (ms) | 808.16 ± 94.19 | 832.05 ± 82.37 | 0.054 |
| SBP supine (mmHg) | 143 ± 16.85 | 138.05 ± 19.78 | 0.106 |
| DBP supine (mmHg) | 87.78 ± 10.43 | 85.73 ± 9.14 | 0.241 |
| HR supine (bpm) | 77.7 ± 10.55 | 75.1 ± 8.57 | 0.091 |
| SBP standing (mmHg) | 137.63 ± 15.86 | 132.18 ± 17.8 | 0.020 |
| DBP standing (mmHg) | 87.08 ± 11.25 | 84.35 ± 9.76 | 0.129 |
| HR standing (bpm) | 83.18 ± 10.86 | 81.15 ± 11.13 | 0.192 |
| Deep breathing | 23.38 ± 20.35 | 23.2 ± 18.18 | 0.948 |
| Valsalva ratio | 3.63 ± 3.06 | 3 ± 2.01 | 0.198 |
| Schellong test (mmHg) | 5.38 ± 11.38 | 5.88 ± 14.07 | 0.863 |
| Handgrip | 10.53 ± 10.82 | 10.15 ± 7.91 | 0.828 |
| Right radius tuning fork | 5.88 ± 1.38 | 6.15 ± 0.89 | 0.169 |
| Left radius tuning fork | 5.95 ± 1.18 | 6.18 ± 0.96 | 0.202 |
| Right hallux tuning fork | 5.03 ± 1.4 | 5.05 ± 1.48 | 0.915 |
| Left hallux tuning fork | 4.95 ± 1.45 | 5.1 ± 1.57 | 0.520 |
| NTSS | 2.74 ± 2.67 | 3.07 ± 3 | 0.470 |
| Metabolic parameters | |||
| Glucose (mmol/l) | 9.43 ± 2.77 | 8.49 ± 2.14 | 0.038 |
| Insulin (pmol/l) | 209.82 ± 174.59 | 168.95 ± 138.23 | 0.100 |
| HOMAIR | 12.72 ± 9.23 | 9.55 ± 7.11 | 0.099 |
| Fructosamine (µmol/l) | 309.18 ± 42.07 | 297.45 ± 36.14 | 0.001 |
| Triglyceride (mmol/l) | 1.96 ± 0.79 | 1.95 ± 0.98 | 0.961 |
| Kidney function | |||
| Creatinine (µmol/l) | 81 ± 21.8 | 78.48 ± 21.62 | 0.123 |
| eGFR (ml/min/1.73 m2) | 80.88 ± 18.21 | 83.03 ± 19.56 | 0.141 |
| MAU (mg/l) | 56.73 ± 126.92 | 12.94 ± 23.01 | 0.032 |
| ACR (mg/mmol) | 4.37 ± 9.28 | 2.13 ± 4.2 | 0.082 |
| Na (mmol/l) | 139.43 ± 2.29 | 139.98 ± 2.13 | 0.094 |
| K (mmol/l) | 4.37 ± 0.38 | 4.48 ± 0.4 | 0.005 |
| Inflammatory and hematological parameters | |||
| hsCRP (mg/l) | 5.15 ± 6.23 | 5.21 ± 8.17 | 0.947 |
| We (mm/h) | 11.88 ± 8.67 | 11.64 ± 9.36 | 0.686 |
| RBC (T/l) | 4.8 ± 0.47 | 4.87 ± 0.49 | 0.020 |
| Hgb (g/l) | 142 ± 14.1 | 144.23 ± 14.2 | 0.029 |
| Htc (%) | 40.9 ± 3.93 | 41.95 ± 3.95 | 0.002 |
| MCV (fl) | 85.46 ± 3.37 | 86.17 ± 3.12 | 0.014 |
| MCH (pg) | 29.61 ± 1.53 | 29.63 ± 1.28 | 0.833 |
| PLT (G/l) | 263.65 ± 55.45 | 275.2 ± 56.84 | 0.022 |
| Hydroxyl free radical parameters | |||
| Serum p-Tyr (µmol/l) | 53.09 ± 13.35 | 56.7 ± 32.33 | 0.502 |
| Serum m-Tyr (nmol/l) | 45.83 ± 37.23 | 45.04 ± 34.4 | 0.905 |
| Serum o-Tyr (nmol/l) | 52.1 ± 36.54 | 54.44 ± 30.76 | 0.760 |
| Serum Phe (µmol/l) | 43.26 ± 10.08 | 48.87 ± 23.02 | 0.144 |
| Serum p-Tyr/Phe (µmol/µmol) | 1.29 ± 0.41 | 1.18 ± 0.27 | 0.144 |
| Serum m-Tyr/Phe (nmol/µmol) | 1.23 ± 1.39 | 1.01 ± 0.81 | 0.316 |
| Serum o-Tyr/Phe (nmol/µmol) | 1.31 ± 1.06 | 1.24 ± 0.84 | 0.711 |
| Serum m-Tyr/p-Tyr (nmol/µmol) | 0.88 ± 0.7 | 0.93 ± 0.81 | 0.699 |
| Serum o-Tyr/p-Tyr (nmol/µmol) | 1.06 ± 0.78 | 1.1 ± 0.79 | 0.795 |
| Serum (m-Tyr+o-Tyr)/Phe (nmol/µmol) | 2.55 ± 2.04 | 2.24 ± 1.27 | 0.409 |
| Serum (m-Tyr+o-Tyr)/p-Tyr (nmol/µmol) | 1.93 ± 1.07 | 2.03 ± 1.34 | 0.698 |
| Urinary p-Tyr (µmol/l) | 63.27 ± 59.32 | 52.56 ± 40.42 | 0.103 |
| Urinary m-Tyr (nmol/l) | 3.44 ± 319.36 | 275.99 ± 415.87 | 0.781 |
| Urinary o-Tyr (nmol/l) | 5562.68 ± 15755.06 | 1394.15 ± 1396.59 | 0.100 |
| Urinary Phe (µmol/l) | 56.96 ± 58.28 | 48.01 ± 31.42 | 0.331 |
| Urinary p-Tyr/Phe (µmol/µmol) | 1.88 ± 2.89 | 1.53 ± 1.81 | 0.530 |
| Urinary m-Tyr/Phe (nmol/µmol) | 10.78 ± 20.44 | 7.75 ± 11.12 | 0.424 |
| Urinary o-Tyr/Phe (nmol/µmol) | 96.56 ± 141.96 | 66.94 ± 213.28 | 0.408 |
| Urinary m-Tyr/p-Tyr (nmol/µmol) | 7.5 ± 7.64 | 7.8 ± 11.76 | 0.901 |
| Urinary o-Tyr/p-Tyr (nmol/µmol) | 77.28 ± 109.45 | 34.47 ± 36.24 | 0.020 |
| Urinary (m-Tyr+o-Tyr)/Phe (nmol/µmol) | 107.34 ± 146.24 | 74.7 ± 214.22 | 0.373 |
| Urinary (m-Tyr+o-Tyr)/p-Tyr (nmol/µmol) | 84.79 ± 109.55 | 42.26 ± 39.71 | 0.024 |
| Urinary p-Tyr/creatinine (µmol/mmol) | 38.78 ± 157.63 | 8.75 ± 5.08 | 0.243 |
| Urinary m-Tyr/creatinine (nmol/mmol) | 557.46 ± 2307.09 | 53.55 ± 68.91 | 0.183 |
| Urinary o-Tyr/creatinine (nmol/mmol) | 1279.49 ± 3653.87 | 250.1 ± 235.08 | 0.089 |
Data are presented as mean ± SD; significance was tested using a paired samples t test. Abbreviations: ACR, urinary albumin per creatinine ratio; BMI, body-mass index; DBP, diastolic blood pressure; eGFR, estimated glomerular filtration rate; Hgb, hemoglobin; HOMAIR, homeostasis model assessment of insulin resistance; HR, heart rate; hsCRP, high-sensitive C-reactive protein; Htc, hematocrit; MAU, microalbuminuria; MCH, mean corpuscular hemoglobin concentration; MCV, mean corpuscular volume; m-Tyr, meta-tyrosine; NTSS, Neuropathy Total Symptom Score; o-Tyr, ortho-tyrosine; Phe, phenylalanine; PLT, platelet number; p-Tyr, para-tyrosine; RBC, red blood cell count; SBP, systolic blood pressure; We, blood sedimentation rate.
Table 2.
Current perception threshold (CPT) results at baseline (week 0) and after 4 weeks of SGLT-2 inhibitor therapy in the complete study population.
Table 2.
Current perception threshold (CPT) results at baseline (week 0) and after 4 weeks of SGLT-2 inhibitor therapy in the complete study population.
| CPT measurement | week 0 (CPT) | week 4 (CPT) | p |
|---|---|---|---|
| 2000 Hz peroneal nerve left | 376.2±132.96 | 399.58±153.44 | 0.416 |
| 2000 Hz peroneal nerve right | 430.18±150.37 | 403.7±134.01 | 0.367 |
| 2000 Hz median nerve left | 280.6±130.81 | 284.08±127.4 | 0.867 |
| 2000 Hz median nerve right | 289±115.87 | 298±107.4 | 0.565 |
| 250 Hz peroneal nerve left | 181.08±96.89 | 178.28±89.46 | 0.828 |
| 250 Hz peroneal nerve right | 198.18±103.82 | 178.73±72.38 | 0.270 |
| 250 Hz median nerve left | 101.38±49.43 | 93.63±56.21 | 0.458 |
| 250 Hz median nerve right | 103.2±54.13 | 112.65±75.16 | 0.450 |
| 5 Hz peroneal nerve left | 102.95±62.92 | 110.79±61.51 | 0.219 |
| 5 Hz peroneal nerve right | 123.33±57.54 | 126.55±73.7 | 0.787 |
| 5 Hz median nerve left | 76.08±53.79 | 75.5±96.63 | 0.973 |
| 5 Hz median nerve right | 60.98±36.88 | 75.78±58.16 | 0.087 |
The table shows mean ± SD) CPT (10μA) for each nerve and frequency, along with p-values from paired-samples t-tests comparing week 0 vs. week 4. Abbreviation: CPT, current perception threshold.
Table 3.
Predictors of peripheral neuropathy, red blood cell, and albuminuria parameters at baseline (week 0) before SGLT-2 inhibitor therapy.
Table 3.
Predictors of peripheral neuropathy, red blood cell, and albuminuria parameters at baseline (week 0) before SGLT-2 inhibitor therapy.
| Dependent | Predictor | B | CI (95 %) | p | |
|---|---|---|---|---|---|
| NP2000 Hz | Um-Tyr | -0.142 | -0.237 | -0.047 | 0.004 |
| So-Tyr | 1.123 | 0.271 | 1.974 | 0.011 | |
| NM2000 Hz | Um-Tyr/p-Tyr | 3.932 | 0.524 | 7.340 | 0.025 |
| NP250 Hz | Um-Tyr/p-Tyr | 4.800 | 1.054 | 8.547 | 0.013 |
| NM250 Hz | So-Tyr | -0.422 | -0.753 | -0.090 | 0.014 |
| NP5 Hz | BMI | 3.575 | 0.080 | 7.070 | 0.045 |
| NM5 Hz | - | ||||
| Hgb | S(m-Tyr+o-Tyr)/p-Tyr | -10.166 | -13.280 | -7.052 | <0.001 |
| BMI | 0.829 | 0.122 | 1.536 | 0.023 | |
| Htc | S(m-Tyr+o-Tyr)/p-Tyr | -2.546 | -3.362 | -1.730 | <0.001 |
| Um-Tyr/creatinine | 0.000 | 0.000 | 0.001 | 0.034 | |
| MCV | Um-Tyr | 0.004 | 0.001 | 0.006 | 0.003 |
| SBP (standing) | 0.077 | 0.027 | 0.127 | 0.004 | |
| fructosamine | 0.024 | 0.002 | 0.045 | 0.032 | |
| MAU | U(m-Tyr+o-Tyr)/Phe | -0.738 | -0.996 | -0.481 | <0.001 |
| U(m-Tyr+o-Tyr)/p-Tyr | 1.109 | 0.843 | 1.374 | <0.001 | |
Data were obtained using a linear regression (stepwise method) model with the following independent parameters: BMI, SBP (standing), fructosamine, serum m-Tyr, serum o-Tyr, serum m-Tyr/Phe, serum o-Tyr/Phe, serum m-Tyr/p-Tyr, serum o-Tyr/p-Tyr, serum (m-Tyr+o-Tyr)/Phe, serum (m-Tyr+o-Tyr)/p-Tyr, urinary m-Tyr, urinary o-Tyr, urinary m-Tyr/Phe, urinary o-Tyr/Phe, urinary m-Tyr/p-Tyr, urinary o-Tyr/p-Tyr, urinary (m-Tyr+o-Tyr)/Phe, urinary (m-Tyr+o-Tyr)/p-Tyr, urinary m-Tyr/creatinine, and urinary o-Tyr/creatinine (evaluated at both actual week and delta).
Disclaimer/Publisher’s Note: The statements, opinions and data contained in all publications are solely those of the individual author(s) and contributor(s) and not of MDPI and/or the editor(s). MDPI and/or the editor(s) disclaim responsibility for any injury to people or property resulting from any ideas, methods, instructions or products referred to in the content. |
© 2025 by the authors. Licensee MDPI, Basel, Switzerland. This article is an open access article distributed under the terms and conditions of the Creative Commons Attribution (CC BY) license (http://creativecommons.org/licenses/by/4.0/).
Copyright: This open access article is published under a Creative Commons CC BY 4.0 license, which permit the free download, distribution, and reuse, provided that the author and preprint are cited in any reuse.


