
Submitted:
17 January 2025
Posted:
20 January 2025
You are already at the latest version
Abstract
This study is the first to scientifically investigate stock indexes and currency exchanges that affect crypto prices. The purpose is to distinguish between the USA-Japan stock markets and the currency market's short- and long-term effects on bitcoin and ethereum. Auto Regressive Distributed Lag (ARDL) is used to analyze weekly series from 1-1-2016 to 20-10-2024. An asymmetric error-checking framework employing non-linear ARDL statistical approach to study variables affecting bitcoin and ethereum prices. Bitcoin appear to have short- and long-term linear effects on the US-Japan stock markets. Euro, GBP, and USA-Japan stock markets exhibit short-term linear effects with ethereum. Ethereum linearly affects GBP. This research helps exchange brokers and crypto traders diversify their holdings, reduce stock index and currency exchange risk, and accurately predict bitcoin and ethereum price variations.
Keywords:
Currency markets
; Crypto prices
; Stock indices
; ARDL
; NARDL
1. Introduction
Cryptocurrency has been floating in the financial market for the past ten years, but its identity has yet to be apparent. Nakamoto (2008) postulated the concept of cryptocurrency. Understanding the crypto markets’ fundamental features is a matter of debate because they have striking similarities with other assets such as the dollar, gold, bonds, and stocks. Whether it is a commodity or currency (Bouri et al.,2019). It has been widely used as the medium of exchange globally, and payments are made conveniently. It has the features of multiple commodities and has been used as an investment asset. It is to be considered digital money for the current saving dynamics in the financial markets. Crypto markets have raised the importance of bitcoin; scholars and researchers are highly attentive to search. The crypto markets have become a buzzword worldwide (Mnif et al., 2020). Scholars are paying earnest attention to the crypto market to evaluate its performance by comparing it with the historical data of ancient assets and calculating the price fluctuations and return volatility of bitcoin and ethereum. The comparison is essential and pertinent since it provides valuable insights into understanding and grabbing in-depth knowledge about the emerging financial market. Bradbury (2013) described the concept of bitcoin as a distinct currency with unique features entirely different from other financial assets. The comparison is conducted by analyzing the differences in return between the cryptocurrencies (bitcoin and ethereum) and other financial assets.
Further, the evaluation of the findings indicates that bitcoin and ethereum are distinct currencies. Existing literature validates that cryptocurrencies resemble gold’s characteristics (Shahzad et al., 2019). Altan et al. (2019) have researched forecasting the instability and dynamism of bitcoin and how the fluctuations have been noticed. Guesmi et al. (2019) also estimate the stock market, exchange rate, gold, and oil returns of bitcoin. In another study conducted by Chu et al. (2021) explained the dissimilarities between gold and bitcoin along with the application of the return series of equity indices and highlighted the six equity Exchange Traded funds (ETFs), including bitcoin. Kristjanpoller et al. (2020) mentioned a cross-relationship between bitcoin and ETFs. ARDL model that presents the stock market specification and the bitcoin is developed by Dirican and Canoz (2017). Kumar et al. (2022) have researched the association of Bitcoin with other assets and specified the rate of gain on these assets and bitcoin. Cryptocurrency is considered the most effective tool for responding efficiently in panic situations (Williamson, 2022). In past studies, a hedging investment is an essential thing not considered by Huynh et al. (2020). The COVID-19 pandemic has positively impacted the returns of cryptocurrencies, so most studies suggested that it has been very influential during natural calamities Nair (2021). Nazifi et al. (2021) have compared gold and bitcoin, and the results have concluded that it has the characteristics of management and mitigating risk efficiently and effectively.
This study investigates the crypto markets, stock markets, and currency markets’ causality relationship by applying the Clive Granger Causality test (Granger, 1969) and general correlation analysis by Benesty et al. (2009). It also investigates the long-run and short-run effects of applying ARDL (Pearson et al., 2001) and, in the end, and Non-linear autoregressive distributed lag model (NARDL) model (Shin et al., 2014) for a specific period to comprehend the impact of bitcoin, ethereum, stock market indices, and currency exchanges association in USA and Japan. The main motive of the research is to analyze the role of crypto price volatility effectively and efficiently and present a better understanding of the mysterious characteristics of bitcoin and Ethereum by paying attention to the trading activities of different countries, evaluations of results for the stock indices, currency markets and also for the investments. We studied the bitcoin trading in the local currencies and compared the money and monetary unit of the European Union (EURO) against the United States Dollar (USD) and the British pound sterling (GBP) against USD with crypto trading. We presented that the different economies have different perspectives on utilizing bitcoin and Ethereum for trading activities may be because of differences in the US and Japanese economic conditions.
Moreover, the trading activities in the local currency highlight the role of bitcoin for local traders. Huang et al. (2020) concluded that significant dynamics have been noticed in the relationship between the USA & Japan’s financial markets and bitcoin. The trend is emerging rapidly. With these results, cryptocurrencies do not consider a safe and protected medium of exchange for diversified portfolios. The research is carried on an international perspective. This research is highly beneficial for providing the details regarding the financial investments so that the investors may know enough about the portfolios and investment options about the pricing decrement and losing their hedging properties. Financial institutions are proving very helpful in minimizing the risks of stocks and currencies Khan et al. (2022). This study is beneficial and provides two different perspectives. Firstly, it focuses on the relatedness of the crypto, stock, and currency markets in a specific time that helps investigate short-term market adjustments, medium-term seasonal finance cycles, and long-term government regulations. Secondly, to see how effectively it has been working, the comparison ratio has been utilized, which is essential for the investors in deciding the portfolio’s investments for crypto markets, stock indices, and currency exchanges. There needs to be clear evidence on whether the crypto markets have the potential to hedge.
There has been a need for more research for the confirmation of the characteristics. Most studies (Liang et al., 2019; Matkovskyy & Jalan, 2019; Shahzad et al., 2020) are focused on the linear relationship between bitcoin and other markets. But our research intends to fill the research gaps by using linear ARDL and Non-Linear ARDL techniques. The overall analysis comprises the following parts: Section 2 is the literature review that provides all the existing research details of crypto price volatility, currency exchanges, and stock indices. Section 3 represents the model of the estimation and the data retrieved from Yahoo Finance return on bitcoin, ethereum, National Association of Securities Dealers Automated Quotations (NASDAQ) composite, NIKKEI225, RUSSELL2000, EURO, and GBP. Section 04 describes the empirical results presenting the long-run and short-run effects of stock indices and currency exchanges on crypto price volatility. In the final section, section 6 offers the conclusion, policy implications, and recommendations.
2. Literature Review
2.1. Theoretical Framework
Schilling and Uhlig (2019) considered that cryptocurrency could be used for making transactions without being affected by the policies that the central banks have created. It has been pronounced that cryptocurrency has some different features that are helpful for the diversification of the risks. The crypto returns depend on the other asset classes, creating another level of diversification benefits (Shahzad et al., 2020). Nguyen (2020) has verified the correlation between stock performance and cryptocurrency. Furthermore, the financial markets are influenced by bitcoin with the effect of the three most important channels: monetary aggregates, inflation, and the exchange rate.
Bitcoin usage has impacted the mobilization of money, and the utilization of bitcoin has decreased as an alternative to the local currency. Moreover, the quantitative theory of money has repeatedly been used more than expected. Its features have demonstrated it as a particular type of medium of exchange and use for the diversification in portfolios. The most crucial elements involved in forming crypto currency prices are different. Moreover, the cryptocurrency’s business cycle has unique variations other than the equity markets and the other assets, enabling them for portfolio diversification Kang et al. (2019). The behavioral theories are also presenting the broader concept of cryptocurrency and stocks. The information regarding the investors clearly explained the price fluctuations accompanied by other asset changes Narayan et al. (2019). It has unique features from the shares and the other assets by the two theories. Hong and Stein (1999) have provided several changes to the equity market prices. Furthermore, the investors in the old markets needed to be more flexible, proactive, and willing to accept the change rapidly.
2.2. Impact of Stock Indices on Crypto Price Volatility
The main focus is the connectivity between crypto price volatility and the stock indices, as shown in the literature. Mizerka et al. (2020) have explored the connectivity of the bitcoin with the stock indices returns and including the users of the crypto price volatility. Most researchers have raised the point that bitcoin users only influence the return on bitcoin, not for the other market. (Shaikh, 2020; Jareno et al., 2020) have mentioned that bitcoin is affected by the economic policies of the economies and is highly reactive to those. Jareno et al. (2020) applied the NARDL and the quantile regression models to test the relationship between bitcoin and gold. Its hedging features are explored by Das et al. (2020) using quantile regression and GARCH models. GARCH models are further employed by Akhtaruzzaman et al. (2020) to study the influence of bitcoin on portfolio diversification. By adopting the most recent techniques, Matkovskyy et al. (2020) highlight the connectivity of bitcoin and the financial markets.
Most of them are highly focused on returns. Jeribi and Fakhfekh (2021), using tools like GARCH and the complete BEKK model, explore the bitcoin and S&P 500 index and gold characteristics. Moreover, the findings mentioned that bitcoin has no significant impact on gold. Similarly, Baur et al. (2018) noted that bitcoin could mitigate uncertainty by applying the DCC-GARCH model. Bouri et al. (2017) stated that it is most beneficial for the globally recognized large market. Zeng and Ahmed (2022) mentioned that it can diversify the risks of the Asian stock market by taking the day-to-day data of the bitcoin, bill rate, the United States equity market returns, precious metals, energy, bonds, and currencies. Baur et al. (2018) suggested that bitcoin is equally beneficial for regular and the worst conditions. Kumar et al. (2022) studied the causality effects of gold prices, stock prices, and crypto prices using NARDL and ARDL approaches, and findings suggest that long-run crypto prices do not affect stock prices. Guesmi et al. (2018), applying the VARMA and DCC-GARCH models, observed that bitcoin is useful in portfolio management and can mitigate the portfolio risk with other traditional assets, such as stocks, foreign exchange, CBOE VIX, and commodities. Kliber et al. (2019) mentioned that bitcoin has strong bonds with other assets and relies on the market conditions, and the bullish conditions enable them to have positive returns, whereas it reverses when market conditions become bearish. Mensi et al. (2020) observed that bitcoin, Ethereum, and Litecoin are essential assets for diversifying the risk of Asia-Pacific and Japanese stock markets. Kraaijeveld and De Smedt (2020) provided a crucial understanding of the financial markets during the pandemic. This study differs from the existing literature in three ways; at the initial point, the eight equity markets and the two cryptocurrencies are discussed: bitcoin and ethereum. Maitra et al. (2022) evaluate the ratio of mitigating the risks and the responsibilities of the currency. The data from five intervals has been assessing the properties of the bitcoin and the fluctuations of the assets Demiralay & Bayraci, (2022). Moreover, we apply ARDL and NARDL approaches to examine the non-linear and asymmetric relationships between stock markets, currency markets, and crypto markets.
2.3. Impact of Currency Exchanges on Crypto Price Volatility
Naeem et al. (2020) and Yousaf and Yarovaya (2022) analyzed average and extreme dependence between returns and trading volumes of bitcoin, ethereum, and litecoin using GARCH-copula models and concluded that there is a stronger bond when the books are higher than lower. The classification of bitcoin is a complex and critical task that still needs to be performed. Research has been widely carried out on bitcoin functionality because of its usage. However, whether it has the traits of a currency, commodity, or investment asset still needs to be determined. Bitcoin has the same characteristics as the currency; it has been widely used worldwide for transactions (Whelan, 2013). Ciaran et al. (2016) state that more than 100,000 retailers accept bitcoin as their medium of exchange. O’Leary (2017) has investigated that when the demand is high for making transactions, the usage also increases, and from the analysis of some survey reports; it has been considered globally accepted for making online transactions. Kwon (2020); Bouoiyour et al. (2015) have that bitcoin usage has increased the monetary velocity for a longer time, including the price of gold and the Shanghai market index. An interesting paper by Toyoda et al. (2019) monitored the transactions’ returns by the bitcoin addresses. The unique addresses that provide the destination of the bitcoin payment. The bivariate VAR models in this paper show strong bonds between bitcoin’s returns and its transaction activities (Koutmos, 2018). In addition, bitcoin can be classified as a fiat currency, such as the dollar and the Euro, because bitcoin has no limits on its value Baur & Dimpfl (2021).
Ciaran et al. (2016), as per the error correction model, the euro-dollar exchange rate influenced the bitcoin value. The same ECM Model with Euro/USD was presented by Parot et al. (2019). Several papers assert that bitcoin has intrinsic attributes not related to conventional assets; by using the network VAR approach, Giudici and Abu Hashish (2019) showed that the bitcoin and other asset prices relation is low. Ji et al. (2018) use the directed acyclic graph (DAG) approach to determine the association between bitcoin and the other assets and mention that they are not associated with each other and have no significant impact. Dyhrberg (2016), using the regular day-to-day data of the bitcoin, USD-EURO, USD-GBP, and the Financial Times Stock Exchange Group (FTSE) returns, observed that bitcoin mentioned hedging capabilities against the FTSE index and the United States stocks. Based on the above literature review following conceptual model has been developed (See Figure 1).
3. Methodology
This research examines the relationship with sustainability and financial perfromance such as; bitcoin, ethereum, NASDAQ, NIKKEI225, RUSSELL2000 indices, EUR/USD, and GBP/USD currencies. All the data set is taken from Yahoo Finance; the description of the data set is presented in Table 1. This study uses seven years of weekly data covering 2016 to 2024. We selected to focus on the time frame, although research during an emergency may not deliver the best results as there was a recovery in the stock indices, crypto price volatility, and the currency exchanges against Euro and GBP. (See Figure 2)
The findings from Table 1 show that each variable possesses positive means, with bitcoin having the highest average value and EURO/USD having the smallest. Asymmetrical and non-normal distributions were found for all measures except the GBP. As a result, the allocation of bitcoin, Ethereum, NASDAQ, NIKKEI, RUSSELL, and Euro are positively skewed but adversely asymmetric for GBP. The dispersion is asymmetrical and spreads to the left GBP. In actuality, the Kurtosis of all variables is positive. Therefore, we are discussing the leptokurtic, which is more frequently seen in bitcoin and currency markets such as; EURO and GBP since its endpoints are broader than normally distributed. While Ethereum and stock markets such as; NASDAQ, NIKKEI, and RUSSELL have playkurtic distribution explaining why aberrant values appear so frequently. Conversely, bitcoin have the best average and the slightest fluctuation of stock and currency markets. (See Figure 2)
The correlation matrix among the variables is shown in Table 3. The findings indicate that bitcoin has a perfect positive correlation with NASDAQ, NIKKEI225, and RUSSELL2000, while bitcoin has a weak negative correlation with EURO and a weak positive correlation with GBP. The findings also indicate that Ethereum has a moderate positive correlation with stock indices such as; NASDAQ, NIKKEI225, and RUSSELL2000, and in currency exchanges, Ethereum has a weak positive correlation with Euro and a weak negative correlation with GBP. The long-run reduced form description is defined first as follows of the two proposed models:
whereas; denotes bitcoin and is measured as closing princes, presents NASDAQ indices, is NIKKEI225 indices, is RUSSELL2000 indices, is Euro against US Dollar, is the British pound sterling against US dollar. Moreover, is Ethereum used as the dependent variable in the proposed model (2), is the intercept, are the coefficients of explanatory factors, i and t are the country and time, respectively, and is the error term.
Stationary Tests
The current research uses the updated model of ARDL, proposed by McNown et al. (2018), to examine the impact of NASDAQ, NIKKEI225, RUSSELL2000, Euro, GBP, bitcoin, and ethereum. This paper uses Augmented Dickey-Fuller (ADF) test and Philip Pearson (PP) to check the stationary of the variables of interest. Additionally, we utilized ARDL bound test and the newly developed ARDL bootstrap cointegration test. In the conventional ARDL model, F-test () is used on all lagged level variables: ). In addition, a T-test is employed on the lagged level dependent focused variable. (: ) to estimate the long linkage amid the study variables. McNown et al. (2018) upgraded the ARDL test and suggested additional F-test : ) on lagged level independent variables, which is complementary to the aforementioned () and () of conventional ARDL model. Hence, based F-test (), t-test (), and F-test () on the coefficient of all lagged levels of variable, dependent, and independent variables, respectively, an upgraded ARDL approach will be employed.
Furthermore, McNown et al. (2018) approved that these tests should be utilized to differentiate between cointegration, non-cointegration, and degenerate cases. There are two degraded situations, both of which indicate that the integration among the variables being checked is invalid. When the lagged level dependent variable is negligible, the first degenerate case occurs, and when the lagged level independent variables are unimportant, the second degenerate case occurs. The characteristics of the combined integration of each tested series using the ARDL bootstrap procedures are included in the critical values (CVs) in the bootstrap ARDL testing. The stability problem in the results of traditional cointegration procedures solves with this procedure. In this situation, the CV of the traditional ARDL technique only allows the endogeneity of one tested variable, but the CVs of the enhanced ARDL test allow for the endogeneity of several tested variables.
Furthermore, this method recommends empirical models with more than one examined variable. The cointegration among NAS, NIK, RUS, EUR, and GBP on BTC for model (1) and NAS, NIK, RUS, EUR, and GBP on ETE for model (2) will be confirmed if the values of () (), and () does not exceed the CV bootstrap model. The ARDL testing formulas are as follows:
In equations (3) and (4) represents the error term, ∆ symbolizes the first difference process operator; is the constant term; refer to coefficients of the explored variables in the short run; refer coefficients of the analyzed variables in the long runr denotes the optimum number of the lags, and is the error correction term that represents the speed with which the investigated variable adjusts.
Non-Linear ARDL:
Along with ARDL, the NARDL model applies to determine the asymmetric association between the study’s variables. Therefore, the based-on Eq. (1) NARDL model has been derived as under:
From Eq. (5) and (6), it is indicated that variable signifies the – and + sum of variation in NAS, NIK, RUS, EUR, and GBP prices as is derived in Eq. (12).
Based on equations (7), (8), (9), (10), and (11), equations (12) and (13) are derived and presented below:
On the other hand, the study uses the following diagnostic tests: The bootstrap ARDL cointegration test Bertelli et al., (2022). This method of examining the long-term interaction of variables is the best suitable strategy to cope with the dynamic, unpredictable movement and architectural break since the collection has a defined integral sequence. The bootstrap ARDL integration test was used in the analysis to look into the long-term relationship among NASDAQ, NIKKEI225, RUSSELL2000, Euro, GBP, bitcoin & ethereum after determining the relationship between the explanatory or stationarity of the parameters. In addition, the CUSUM tests are used in this study to ensure that the empirical models are valid. In this approach, () presents the speed of adjustment of variables from long-term equilibrium. The is formulated in the following Equations (14–19) for model (1) and equations (20-25) for model (2):
where ∆ denotes the first difference operator; denotes the error term, and denotes lagged ECT.
4. Empirical Results and Discussions
This research aims to explore how stock indices and currency exchanges affect bitcoin & ethereum prices and determine whether or not the USA and Japan’s stock markets and currency markets have symmetrical or asymmetrical effects.
Descriptive statistics are provided in (Table 2). All variables possess very high standard deviations. With a range of 64949.96 and 397.65 and a variation of 61,741.64, the overall highest mean is bitcoin 15133.28 among all variables. The mean value for ethereum is 1416.43, with the lowest and highest values of 4730.38 and 86.53, respectively, with a deviation of 1238.29. NASDAQ mean value is 9018.56 in the range between 15993.71 and 4266.84, and the variation is 3264.28. The average value for NIKKEI225 is 22741.41, with the lowest and highest values of 30323.34 and 15276.24, respectively, with a variation of 3943.17. The average number of RUSSELL2000 is 1621.93, with a variation of 343.23; the range is 2409.14 and 953.72. The Euro and GBP both have low average values and standard deviation. The euro average is 0.88, with the lowest and highest values of 1.03 and 0.80, respectively, with a variation of 0.044.
Meanwhile, the GBP average is 1.31, with the lowest and highest values of 1.47 and 1.08, with a standard deviation of 0.069. Bitcoin is highly skewed, and Ethereum, NASDAQ, RUSSELL2000, Euro, and GBP are moderately uneven. NIKKEI225 is symmetrical. For Kurtosis, the bitcoin, Euro, and GBP have heavier tails than the normal distribution and possess leptokurtic distribution. While NASDAQ, NIKKEI225, RUSSELL2000, and Ethereum have lighter tails than normal distribution and include Platykurtic distribution (See Figure 2).
According to the correlation analysis (Table 3), the research variables are significantly positively correlated, except the relationships between bitcoin & Euro, Ethereum & GBP, NASDAQ & Euro, NIKKEI225 & Euro, RUSSELL2000 & Euro, GBP & Euro (Inverse relationships).

Table 3.
Correlation Matrix.
| Variables | Bitcoin | Ethereum | NASDAQ | NIKKEI | RUSSELL | EURO | GBP |
| Bitcoin | 1.00 | ||||||
| Ethereum | 0.29 | 1.00 | |||||
| NASDAQ | 0.61 | 0.48 | 1.00 | ||||
| NIKKEI | 0.67 | 0.33 | 0.63 | 1.00 | |||
| RUSSELL | 0.61 | 0.27 | 0.62 | 0.65 | 1.00 | ||
| EURO | -0.19 | 0.09 | -0.14 | -0.14 | -0.25 | 1.00 | |
| GBP | 0.22 | -0.15 | 0.06 | 0.03 | 0.15 | -0.70 |
The stationarity of the parameters was assessed using Augmented dickey - fuller and Philip Pesaran unit root tests. At the first difference, all parameters are stationary using the ADF and PP unit root (Table 4). Only GBP is standing at the level. The results of the BARDL cointegration test are shown in Table 5, which suggests the research models. The H0 of “no cointegration” is rejected by (F-statistic based on the exponential upper and lower bounds), F-Statistic for IDV, and T-statistics for the DV. All the values are less than their critical values in both proposed research models. Additionally, our findings support the presence of cointegration equilibria among NASDAQ, NIKKEI225, RUSSELL2000, Euro, GBP, bitcoin, and ethereum at a 1% statistical significance.
The , , and values for both models are less than critical, suggesting the presence of cointegration among the study variables.
Table 6 provides findings from the ARDL model by showing the short-run and long-run effects of bitcoin and ethereum. In the model with bitcoin, the parameters USA and Japan’s stock markets are clearly significant in the short run. However, in the model with ethereum, all parameters are substantial in the short run. Our results also confirmed that of Nguyen (2022), Matkovskyy & Jalan (2019). Crypto is a riskier investment than stock markets in USA and Japan and currency markets in the long run for investors Dirican & Canoz (2017), according to the calculated estimates of long-run effects on the Ardl in Table 6. In bitcoin, only USA and Japan’s stock markets are significant. However, in the model with ethereum, NASDAQ, and GBP are significant. NIKKI225, RUSSELL2000, and Euro have no long-run effect on Ethereum Palazzi et al. (2021); Gillaizeau et al. (2019). We have presented additional diagnosis figures, including the F-Statistic & t-statistic, and the long-run effects model. If a t-statistic estimate is significantly negative, the parameters are closely associated and approach equilibrium more than a longer time horizon. Pesaran et al. (2001), Since such importance of this estimation is determined using the t-statistic, have included an absolute limit and a lower bound for important values because specific parameters may contain a combination of I (0) & I (1).
Table 7 presents the NARDL estimations. We see that every predictor variable has two different configurations (+ve and -ve), NASDAQ, RUSSELL 2000, Euro, and GBP have short-run adverse effects on bitcoin prices. RUSSELL2000 and EURO have a short-run positive impact on bitcoin prices. The non-linear modification of the regressor is responsible for the spike in the number of significant parameters in the short run, in Table 6 (linear modeling with bitcoin) to 7 in Table 7 (non-linear modeling with bitcoin). Within the short run, the NARDL framework with the Ethereum, USA-Japan stock markets, and GBP short run positively affects Ethereum prices. RUSSELL2000 and Euro have adverse short-run effects on Ethereum prices. Strong (poor) price volatility influences currency exchanges, stock indices, and crypto price volatility speculation, which affects the price of cryptocurrencies. The spot rate then moves up or down by the crypto prices. These findings are consistent with Jiang et al. (2021); Ahmed (2021). Using the long-term estimation methods in Table 7, we note NIKKEI225, RUSSELL2000, and EURO in the particular instance of the NARDL method with bitcoin and for all predictors. NIKKEI225 and Euro have adverse long-run effects on bitcoin prices. The predictors’ partial positive and negative impacts carry a significant and valuable co-efficiency. USA-Japan stock markets have positive long-run effects with Ethereum. Only EURO and GBP have adverse long-run effects with Ethereum. Our discovery backs up Demir et al. (2021) research, which showed NARDL superiority by establishing an asymmetrical two-way causality between bitcoin and altcoin. It is important to note that the Wald test, which shows short-run asymmetries for such a framework with bitcoin, rejects the proportionality of three sums for the NIKKEI225, RUSSELL2000 & Euro. An increase in the value of the indices (NIKKEI225t+, RUSSELL2000+t, and EUROt+) could lower the price of bitcoin, which is a bad indicator. This inverse link between the bitcoin and stock markets and Euros supports past studies Singh, (2021). However, The NASDAQt+, NIKKEI225+t, and RUSSELL2000t+ are significant with Ethereum. An increase in the value of the indices (NASDAQt+, NIKKEI225+t, and RUSSELL2000t+) could lower the price of Ethereum. There is an inverse relationship between Ethereum and stock indices. NIKKEI- and EURO- have adverse long-run effects on bitcoin. EURO- and GBP- have adverse long-run effects on Ethereum. The Wald test, presented as long-run asymmetries, supports an asymmetric impact of stock indices and currency exchanges on crypto price volatility. The results are a pretty match to Ghorbel et al. (2022). USA stock markets, Euro and GBP, have short-run asymmetric effects on bitcoin price volatility. While NIKKEI225, RUSSELL2000, and Euro have short-run asymmetric effects on bitcoin. Stock indices have long-run positive asymmetric effects on Ethereum. However, currency markets’ long-run adverse asymmetric effects on Ethereum support Bouri et al. (2018); Kumar et al. (2022). NASDAQ does not have any long-run asymmetric impact on the bitcoin model. According to the diagnostic data presented in Table 7, Ho has no level connection among the parameters in the NARDL model that can be rejected. The NARDL technique’s results outperform the Ardl technique used on the model structure. The non-linear model has eight significant parameters in the short run instead of the linear model’s three.
5. Conclusions and Policy Implications
The link between currency exchanges, stock indices, and cryptocurrency price volatility is now being studied by academics and practitioners. The asymmetrical impact of the USA-Japan stock markets, EURO, and GBP on bitcoin and ethereum has yet to receive much attention. We found asymmetrical connections among currency exchanges, stock indices, and crypto prices volatility in the long and short run using the linear ARDL and Non-Linear ARDL model for the time covering from 1st Jan 2016 to 20th June 2023 (including the bitcoin and ethereum weekly prices). Our ARDL findings revealed that upward stock indices fluctuations have a higher impact on bitcoin than falling ones over the short and long run. While not only stock indices fluctuations but EURO and GBP also have a short-run effect on ethereum. Only GBP has a long-run impact on ethereum. Consequently, this favorable long-run interaction among NIKKEI225 (Japan), RUSSELL2000 (USA), Euro, and bitcoin has a limited future potential for bitcoin as safe havens.
While the USA-Japan’s stock markets have positive asymmetric long-run effects on ethereum. Furthermore, our findings revealed that the NASDAQ and GBP would play a limited safe place effect over the long run-in crypto prices. While NASDAQ, RUSSELL2000, Euro, and GBP were found to exert a positive asymmetric impact on the values of bitcoin and ethereum in the short run, which is relatively favorable. This outcome concludes that bitcoin and ethereum are ineffective trading’s and secure mechanisms for the USA-Japan’s stock markets, Euro and GBP. However, after studying the currency exchanges and stock indices’ dynamic behavior to favorable and unfavorable crypto price shocks, we concluded that Japan’s stock market reacts to adverse crypto market shocks more strongly than positively. This research found that bitcoin and ethereum are significantly influenced by stock and currency markets (Euro and GBP). These may benefit investors who choose to adopt diversification methods for such purposes. There are significant policy ramifications of these findings. Our results offer a better grasp of linear and non-linear autoregressive distributed lag between currencies exchanges, stock indices, and crypto markets, as the increase throughout consistency could help investors, investment advisors, and foreign currency exchange brokers create the best financial derivatives. It could also alert regulatory agencies and policy experts to the economy’s extreme volatility, which has potential ramifications for the money supply. Given the unique interaction among currency exchanges, stock indices, and crypto price volatility in the short and long run, it is challenging for crypto traders to determine the best investment decision. Exchange brokers and crypto traders can use the findings of this research to stop making excessive investment decisions because it has been demonstrated that Crypto prices have more volatility in the long and short run than stock indices and currency exchanges. The results of this research can be used by exchange brokers and crypto traders to effectively diversify their holdings, mitigate for stock indices and currency exchanges, and forecast future movements of bitcoin and ethereum.
Availability of data and materials
The sources of data have been duly mentioned in the study.
Acknowledgments
Not applicable.
Competing Interests
The authors declare that they have no competing interests”.
Acknowledgments
Not applicable.
References
- Ahmed, W. M. (2021). How do Islamic equity markets respond to cryptocurrencies’ good and bad volatility? The case of Bitcoin. Pacific-Basin Finance Journal, 70, 101667.
- Akhtaruzzaman, M., Sensoy, A., & Corbet, S. (2020). The influence of bitcoin on portfolio diversification and design. Finance Research Letters, 37, 101344. [CrossRef]
- Altan, A., Karasu, S., & Bekiros, S. (2019). Digital currency forecasting with chaotic meta-heuristic bio-inspired signal processing techniques. Chaos, Solitons & Fractals, 126, 325-336. [CrossRef]
- Baur, D. G., & Dimpfl, T. (2021). The volatility of Bitcoin and its role as a medium of exchange and a store of value. Empirical Economics, 61(5), 2663-2683. [CrossRef]
- Baur, D. G., Hong, K., & Lee, A. D. (2018). Bitcoin: Medium of exchange or speculative assets?. Journal of International Financial Markets, Institutions, and Money, 54, 177-189. [CrossRef]
- Benesty, J., Chen, J., Huang, Y., & Cohen, I. (2009). Pearson correlation coefficient. In Noise reduction in speech processing (pp. 1-4). Springer, Berlin, Heidelberg.
- Bertelli, S., Vacca, G., & Zoia, M. (2022). Bootstrap cointegration tests in ARDL models. Economic Modelling, 116, 105987. [CrossRef]
- Bouri, E., Gupta, R., Lahiani, A., & Shahbaz, M. (2018). Testing for asymmetric non-linear short-and long-run relationships between bitcoin, aggregate commodity and gold prices. Resources Policy, 57, 224-235.
- Bouri, E., Gupta, R., Tiwari, A. K., & Roubaud, D. (2017). Does Bitcoin hedge global uncertainty? Evidence from wavelet-based quantile-in-quantile regressions. Finance Research Letters, 23, 87-95. [CrossRef]
- Bouri, E., Lau, C. K. M., Lucey, B., & Roubaud, D. (2019). Trading volume and the predictability of return and volatility in the cryptocurrency market. Finance Research Letters, 29, 340-346. [CrossRef]
- Bouoiyour, J., Selmi, R., & Tiwari, A. K. (2015). Is Bitcoin business income or speculative foolery? New ideas through an improved frequency domain analysis. Annals of Financial Economics, 10(01), 1550002. [CrossRef]
- Bradbury, D. (2013). The problem with Bitcoin. Computer Fraud & Security, 2013(11), 5-8.
- Chu, J., Chan, S., & Zhang, Y. (2021). Bitcoin versus high-performance technology stocks in diversifying against global stock market indices. Physica A: Statistical Mechanics and its Applications, 580, 126161. [CrossRef]
- Ciaian, P., Rajcaniova, M., & Kancs, D. A. (2016). The digital agenda of virtual currencies: Can BitCoin become a global currency? Information Systems and e-Business Management, 14(4), 883-919.
- Ciaian, P., Rajcaniova, M., & Kancs, D. A. (2016). The economics of BitCoin price formation. Applied Economics, 48(19), 1799-1815. [CrossRef]
- Das, D., Le Roux, C. L., Jana, R. K., & Dutta, A. (2020). Does Bitcoin hedge crude oil imply volatility and structural shocks? A comparison with gold, commodity, and the US Dollar. Finance Research Letters, 36, 101335.
- Demiralay, S., & Bayracı, S. (2021). Should stock investors include cryptocurrencies in their portfolios after all? Evidence from a conditional diversification benefits measure. International Journal of Finance & Economics, 26(4), 6188-6204. [CrossRef]
- Demir, E., Simonyan, S., García-Gómez, C. D., & Lau, C. K. M. (2021). The asymmetric effect of bitcoin on altcoins: evidence from the non-linear autoregressive distributed lag (NARDL) model. Finance Research Letters, 40, 101754.
- Dickey, D. A., & Fuller, W. A. (1981). Likelihood ratio statistics for autoregressive time series with a unit root. Econometrica: journal of the Econometric Society, 1057-1072. [CrossRef]
- Dirican, C., & Canoz, I. (2017). The cointegration relationship between Bitcoin prices and major world stock indices: An analysis with ARDL model approach. Journal of Economics Finance and Accounting, 4(4), 377-392. [CrossRef]
- Dyhrberg, A. H. (2016). Hedging capabilities of bitcoin. Is it the virtual gold?. Finance Research Letters, 16, 139-144. [CrossRef]
- Ghorbel, A., Frikha, W., & Manzli, Y. S. (2022). Testing for asymmetric non-linear short-and long-run relationships between crypto-currencies and stock markets. Eurasian Economic Review, 1-39. [CrossRef]
- Gillaizeau, M., Jayasekera, R., Maaitah, A., Mishra, T., Parhi, M., & Volokitina, E. (2019). Giver and the receiver: Understanding spillover effects and predictive power in cross-market Bitcoin prices. International Review of Financial Analysis, 63, 86-104. [CrossRef]
- Giudici, P., & Abu-Hashish, I. (2019). What determines Bitcoin exchange prices? A network VAR approach. Finance Research Letters, 28, 309-318. [CrossRef]
- Granger, C. W. (1969). Investigating causal relations by econometric models and cross-spectral methods. Econometrica: journal of the Econometric Society, 424-438. [CrossRef]
- Guesmi, K., Saadi, S., Abid, I., & Ftiti, Z. (2019). Portfolio diversification with virtual currency: Evidence from bitcoin. International Review of Financial Analysis, 63, 431-437. [CrossRef]
- Hong, H., & Stein, J. C. (1999). A unified theory of underreaction, momentum trading, and overreaction in asset markets. The Journal of Finance, 54(6), 2143-2184. [CrossRef]
- Huang, Y., Duan, K., & Urquhart, A. (2022). Time-varying dependence between Bitcoin and green financial assets: A comparison between pre-and post-COVID-19 periods. Journal of International Financial Markets, Institutions and Money, 101687. [CrossRef]
- Huynh, T. L. D., Nasir, M. A., Vo, X. V., & Nguyen, T. T. (2020). “Small things matter most”: the spillover effects in the cryptocurrency market and gold as a silver bullet. The North American Journal of Economics and Finance, 54, 101277. [CrossRef]
- Jareño, F., de la O González, M., Tolentino, M., & Sierra, K. (2020). Bitcoin and gold price returns: A quantile regression and NARDL analysis. Resources Policy, 67, 101666. [CrossRef]
- Jeribi, A., & Fakhfekh, M. (2021). Portfolio management and dependence structure between cryptocurrencies and traditional assets: evidence from FIEGARCH-EVT-Copula. Journal of Asset Management, 22(3), 224-239. [CrossRef]
- Jiang, Y., Wu, L., Tian, G., & Nie, H. (2021). Do cryptocurrencies hedge against EPU and the equity market volatility during COVID-19?–New evidence from quantile coherency analysis. Journal of International Financial Markets, Institutions, and Money, 72, 101324. [CrossRef]
- Ji, Q., Bouri, E., Gupta, R., & Roubaud, D. (2018). Network causality structures among Bitcoin and other financial assets: A directed acyclic graph approach. The Quarterly Review of Economics and Finance, 70, 203-213.
- Kang, J., Xiong, Z., Niyato, D., Ye, D., Kim, D. I., & Zhao, J. (2019). Toward secure blockchain-enabled internet of vehicles: Optimizing consensus management using reputation and contract theory. IEEE Transactions on Vehicular Technology, 68(3), 2906-2920.
- Khan, M. A., Abbas, K., Su’ud, M. M., Salameh, A. A., Alam, M. M., Aman, N., ... & Aziz, R. C. (2022). Application of Machine Learning Algorithms for Sustainable Business Management Based on Macro-Economic Data: Supervised Learning Techniques Approach. Sustainability, 14(16), 9964. [CrossRef]
- Kliber, A., Marszałek, P., Musiałkowska, I., & Świerczyńska, K. (2019). Bitcoin: Safe haven, hedge or diversifier? Perception of Bitcoin in the context of a country’s economic situation—A stochastic volatility approach. Physica A: Statistical Mechanics and Its Applications, 524, 246-257.
- Koutmos, D. (2018). Bitcoin returns and transaction activity. Economics Letters, 167, 81-85. [CrossRef]
- Kraaijeveld, O., & De Smedt, J. (2020). The predictive power of public Twitter sentiment for forecasting cryptocurrency prices. Journal of International Financial Markets, Institutions, and Money, 65, 101188.
- Kristjanpoller, W., Bouri, E., & Takaishi, T. (2020). Cryptocurrencies and equity funds: Evidence from an asymmetric multifractal analysis. Physica A: Statistical Mechanics and Its Applications, 545, 123711. [CrossRef]
- Kumar, S., Kumar, A., & Singh, G. (2022). Gold, crude oil, bitcoin, and Indian stock market: recent confirmation from non-linear ARDL analysis. Journal of Economic Studies, (ahead-of-print).
- Kwon, J. H. (2020). Tail behavior of Bitcoin, the dollar, gold, and the stock market index. Journal of International Financial Markets, Institutions, and Money, 67, 101202.
- Liang, J., Li, L., Chen, W., & Zeng, D. (2019, July). Towards an understanding of cryptocurrency: a comparative analysis of cryptocurrency, foreign exchange, and stock. In 2019 IEEE International Conference on Intelligence and Security Informatics (ISI) (pp. 137-139). IEEE.
- Maitra, D., Rehman, M. U., Dash, S. R., & Kang, S. H. (2022). Do cryptocurrencies provide better hedging? Evidence from major equity markets during the COVID-19 pandemic. The North American Journal of Economics and Finance, 62, 101776. [CrossRef]
- Matkovskyy, R., Jalan, A., & Dowling, M. (2020). Effects of economic policy uncertainty shocks on the interdependence between Bitcoin and traditional financial markets. The Quarterly Review of Economics and Finance, 77, 150-155. [CrossRef]
- Matkovskyy, R., & Jalan, A. (2019). From financial markets to Bitcoin markets: A fresh look at the contagion effect. Finance Research Letters, 31, 93-97. [CrossRef]
- McNown, R., Sam, C. Y., & Goh, S. K. (2018). Bootstrapping the autoregressive distributed lag test for cointegration. Applied Economics, 50(13), 1509-1521. [CrossRef]
- Mensi, W., Rehman, M. U., Maitra, D., Al-Yahyaee, K. H., & Sensoy, A. (2020). Does bitcoin co-move and share risk with Sukuk and world and regional Islamic stock markets? Evidence using a time-frequency approach. Research in International Business and Finance, 53, 101230. [CrossRef]
- Mizerka, J., Stróżyńska-Szajek, A., & Mizerka, P. (2020). The role of Bitcoin on developed and emerging markets–on the basis of a Bitcoin users graph analysis. Finance Research Letters, 35, 101489.
- Mnif, E., Jarboui, A., & Mouakhar, K. (2020). How the cryptocurrency market has performed during COVID-19? A multifractal analysis. Finance research letters, 36, 101647.
- Naeem, M., Bouri, E., Boako, G., & Roubaud, D. (2020). Tail dependence in the return volume of leading cryptocurrencies. Finance Research Letters, 36, 101326.
- Nakamoto, S. (2008). Bitcoin: A peer-to-peer electronic cash system. Decentralized Business Review, 21260.
- Nair, S. T. G. (2021). On extreme value theory in the presence of technical trend: pre and post Covid-19 analysis of cryptocurrency markets. Journal of Financial Economic Policy. [CrossRef]
- Narayan, P. K., Narayan, S., Rahman, R. E., & Setiawan, I. (2019). Bitcoin price growth and Indonesia’s monetary system. Emerging Markets Review, 38, 364-376.
- Nazifi, A., Murdy, S., Marder, B., Gäthke, J., & Shabani, B. (2021). A Bit (coin) of Happiness after a Failure: An empirical examination of the Effectiveness of Cryptocurrencies as an innovative recovery tool. Journal of Business Research, 124, 494-505.
- Nguyen, K. Q. (2022). The correlation between the stock market and Bitcoin during COVID-19 and other uncertainty periods. Finance research letters, 46, 102284. [CrossRef]
- O’Leary, D. E. (2017). Configuring blockchain architectures for transaction information in blockchain consortiums: The case of accounting and supply chain systems. Intelligent Systems in Accounting, Finance, and Management, 24(4), 138-147.
- Palazzi, R. B., Júnior, G. D. S. R., & Klotzle, M. C. (2021). The dynamic relationship between bitcoin and the foreign exchange market: A non-linear approach to test causality between bitcoin and currencies. Finance Research Letters, 42, 101893.
- Parrot, A., Michell, K., & Kristjanpoller, W. D. (2019). Using Artificial Neural Networks to forecast Exchange Rate, including VAR-VECM residual analysis and prediction linear combination. Intelligent Systems in Accounting, Finance, and Management, 26(1), 3-15.
- Pesaran, M. H., Shin, Y., & Smith, R. J. (2001). Bounds testing approaches to the analysis of level relationships. Journal of applied econometrics, 16(3), 289-326. [CrossRef]
- Phillips, P. C., & Perron, P. (1988). Testing for a unit root in time series regression. Biometrika, 75(2), 335-346.
- Schilling, L., & Uhlig, H. (2019). Some simple bitcoin economics. Journal of Monetary Economics, 106, 16-26. [CrossRef]
- Shaikh, I. (2020). Policy uncertainty and Bitcoin returns. Borsa Istanbul Review, 20(3), 257-268. [CrossRef]
- Shin, Y., Yu, B., & Greenwood-Nimmo, M. (2014). Modeling asymmetric cointegration and dynamic multipliers in a non-linear ARDL framework. In Festschrift in honor of Peter Schmidt (pp. 281-314). Springer, New York, NY.
- Shahzad, S. J. H., Bouri, E., Roubaud, D., Kristoufek, L., & Lucey, B. (2019). Is Bitcoin a better safe-haven investment than gold and commodities? International Review of Financial Analysis, 63, 322-330.
- Shahzad, S. J. H., Bouri, E., Roubaud, D., & Kristoufek, L. (2020). Safe haven, hedge and diversification for G7 stock markets: Gold versus bitcoin. Economic Modelling, 87, 212-224. [CrossRef]
- Singh, A. (2021). Investigating the dynamic relationship between litigation funding, gold, bitcoin, and the stock market: The case of Australia. Economic Modelling, 97, 45-57.
- Toyoda, K., Mathiopoulos, P. T., & Ohtsuki, T. (2019). A novel methodology for hyip operators’ Bitcoin addresses identification. IEEE Access, 7, 74835-74848.
- Whelan, K. (2013). Sovereign default and the Euro. Oxford Review of Economic Policy, 29(3), 478-501.
- Williamson, S. D. (2022). Central bank digital currency and flight to safety. Journal of Economic Dynamics and Control, 142, 104146. [CrossRef]
- Yousaf, I., & Yarovaya, L. (2022). The relationship between trading volume, volatility and returns of Non-Fungible Tokens: evidence from a quantile approach. Finance Research Letters, 50, 103175. [CrossRef]
- Zeng, H., & Ahmed, A. D. (2022). Market integration and volatility spillover across major East Asian stock and Bitcoin markets: an empirical assessment. International Journal of Managerial Finance, (ahead-of-print).
Figure 1.
Conceptual model. Source: Author’s Compilation.
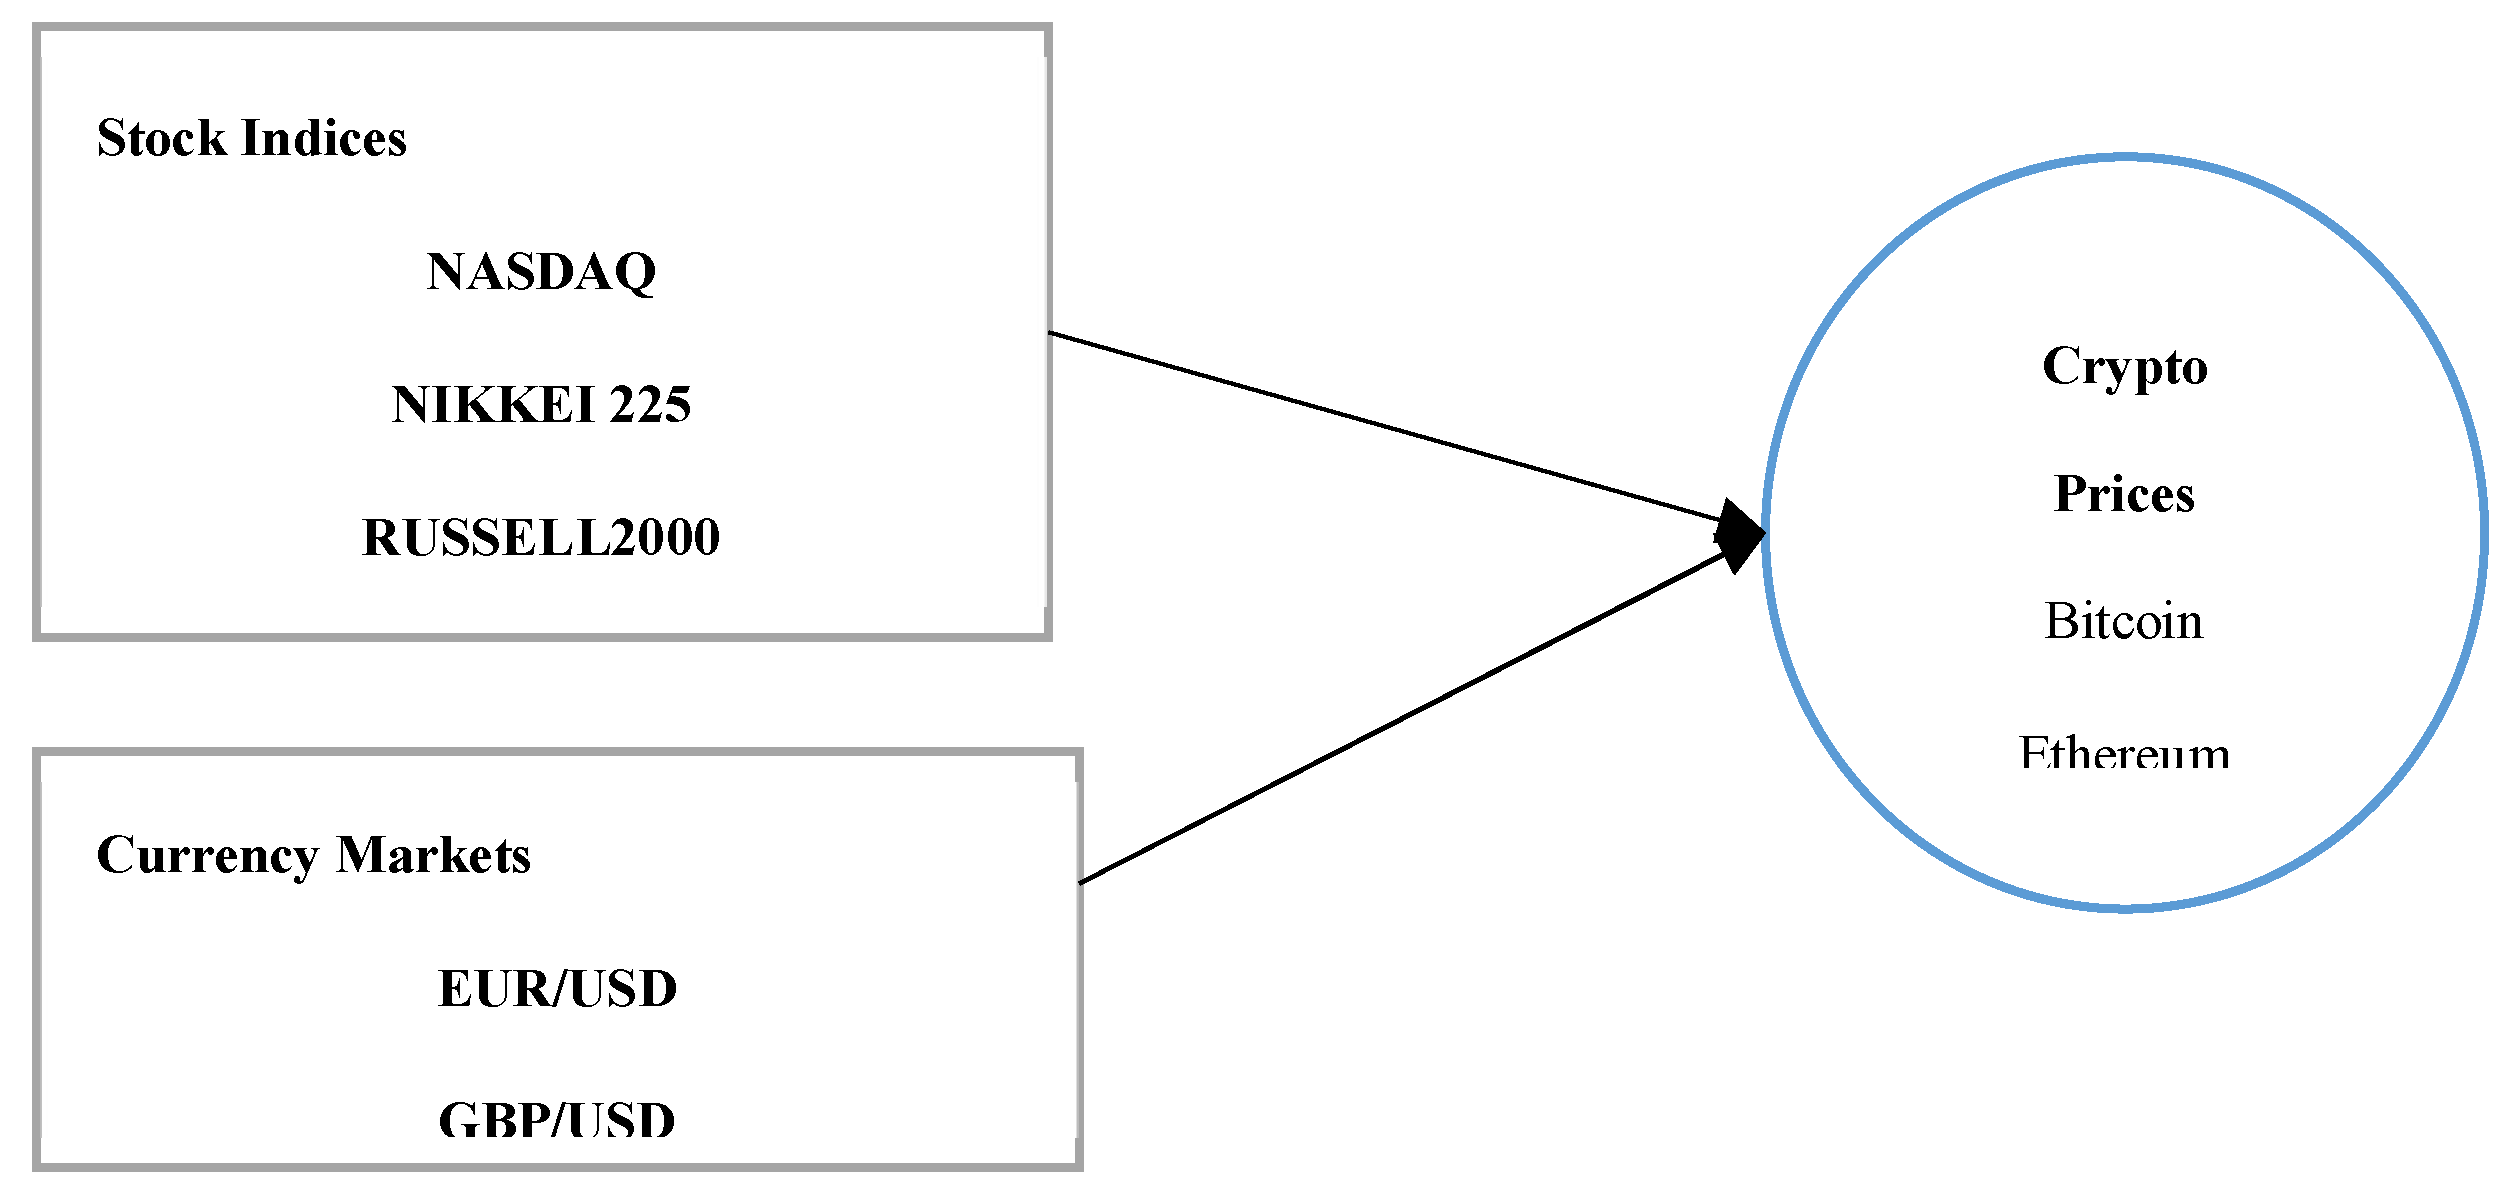
Figure 2.
Spike graphs of variables. Source: Yahoo Finance.
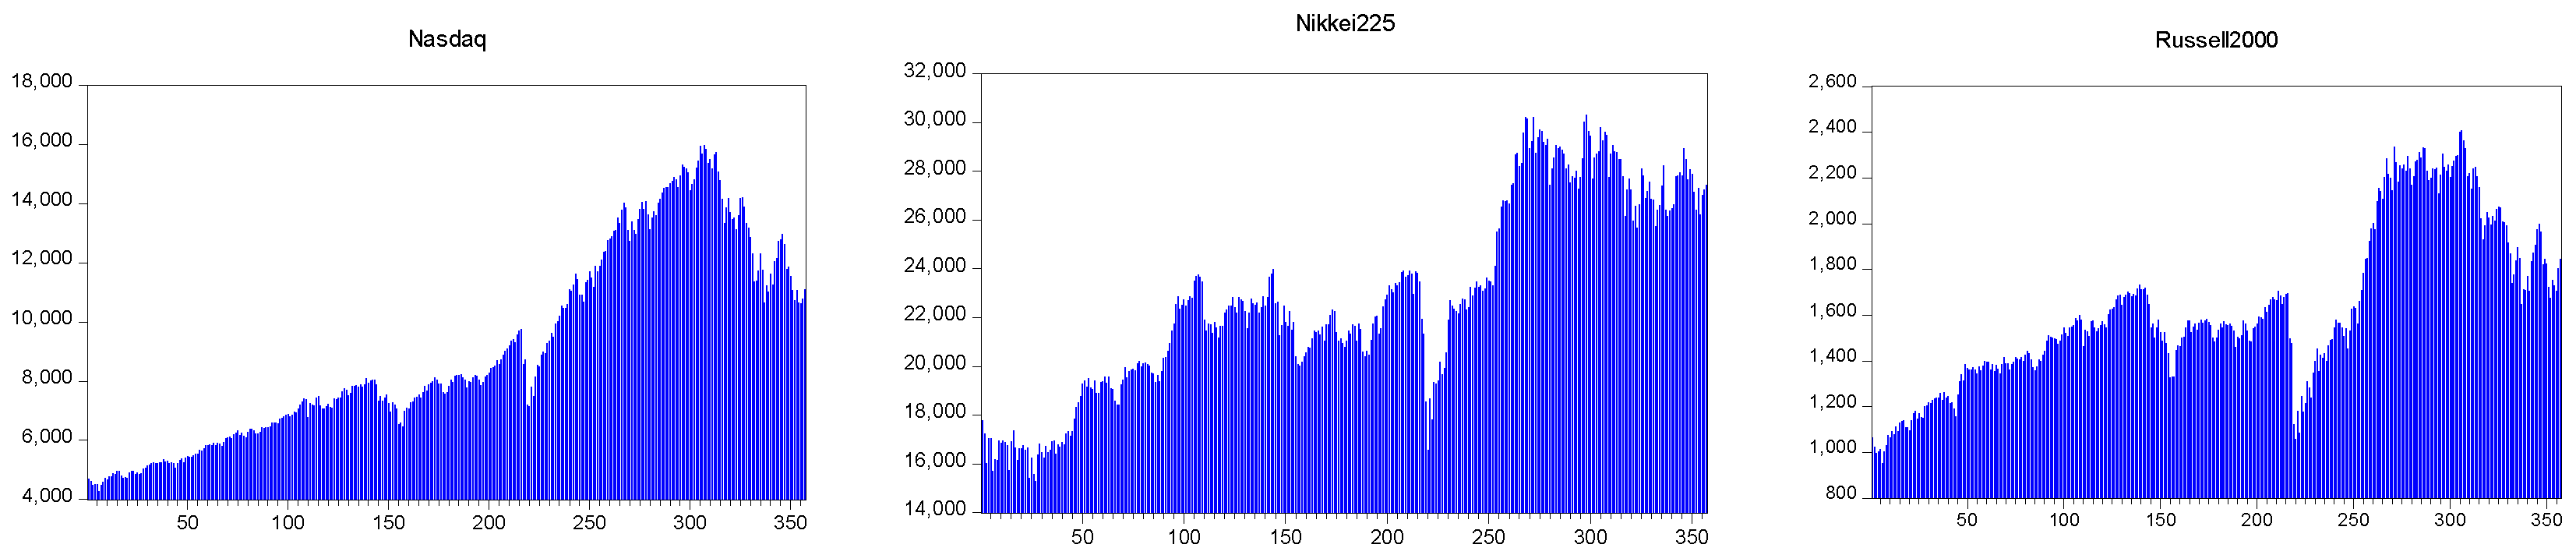
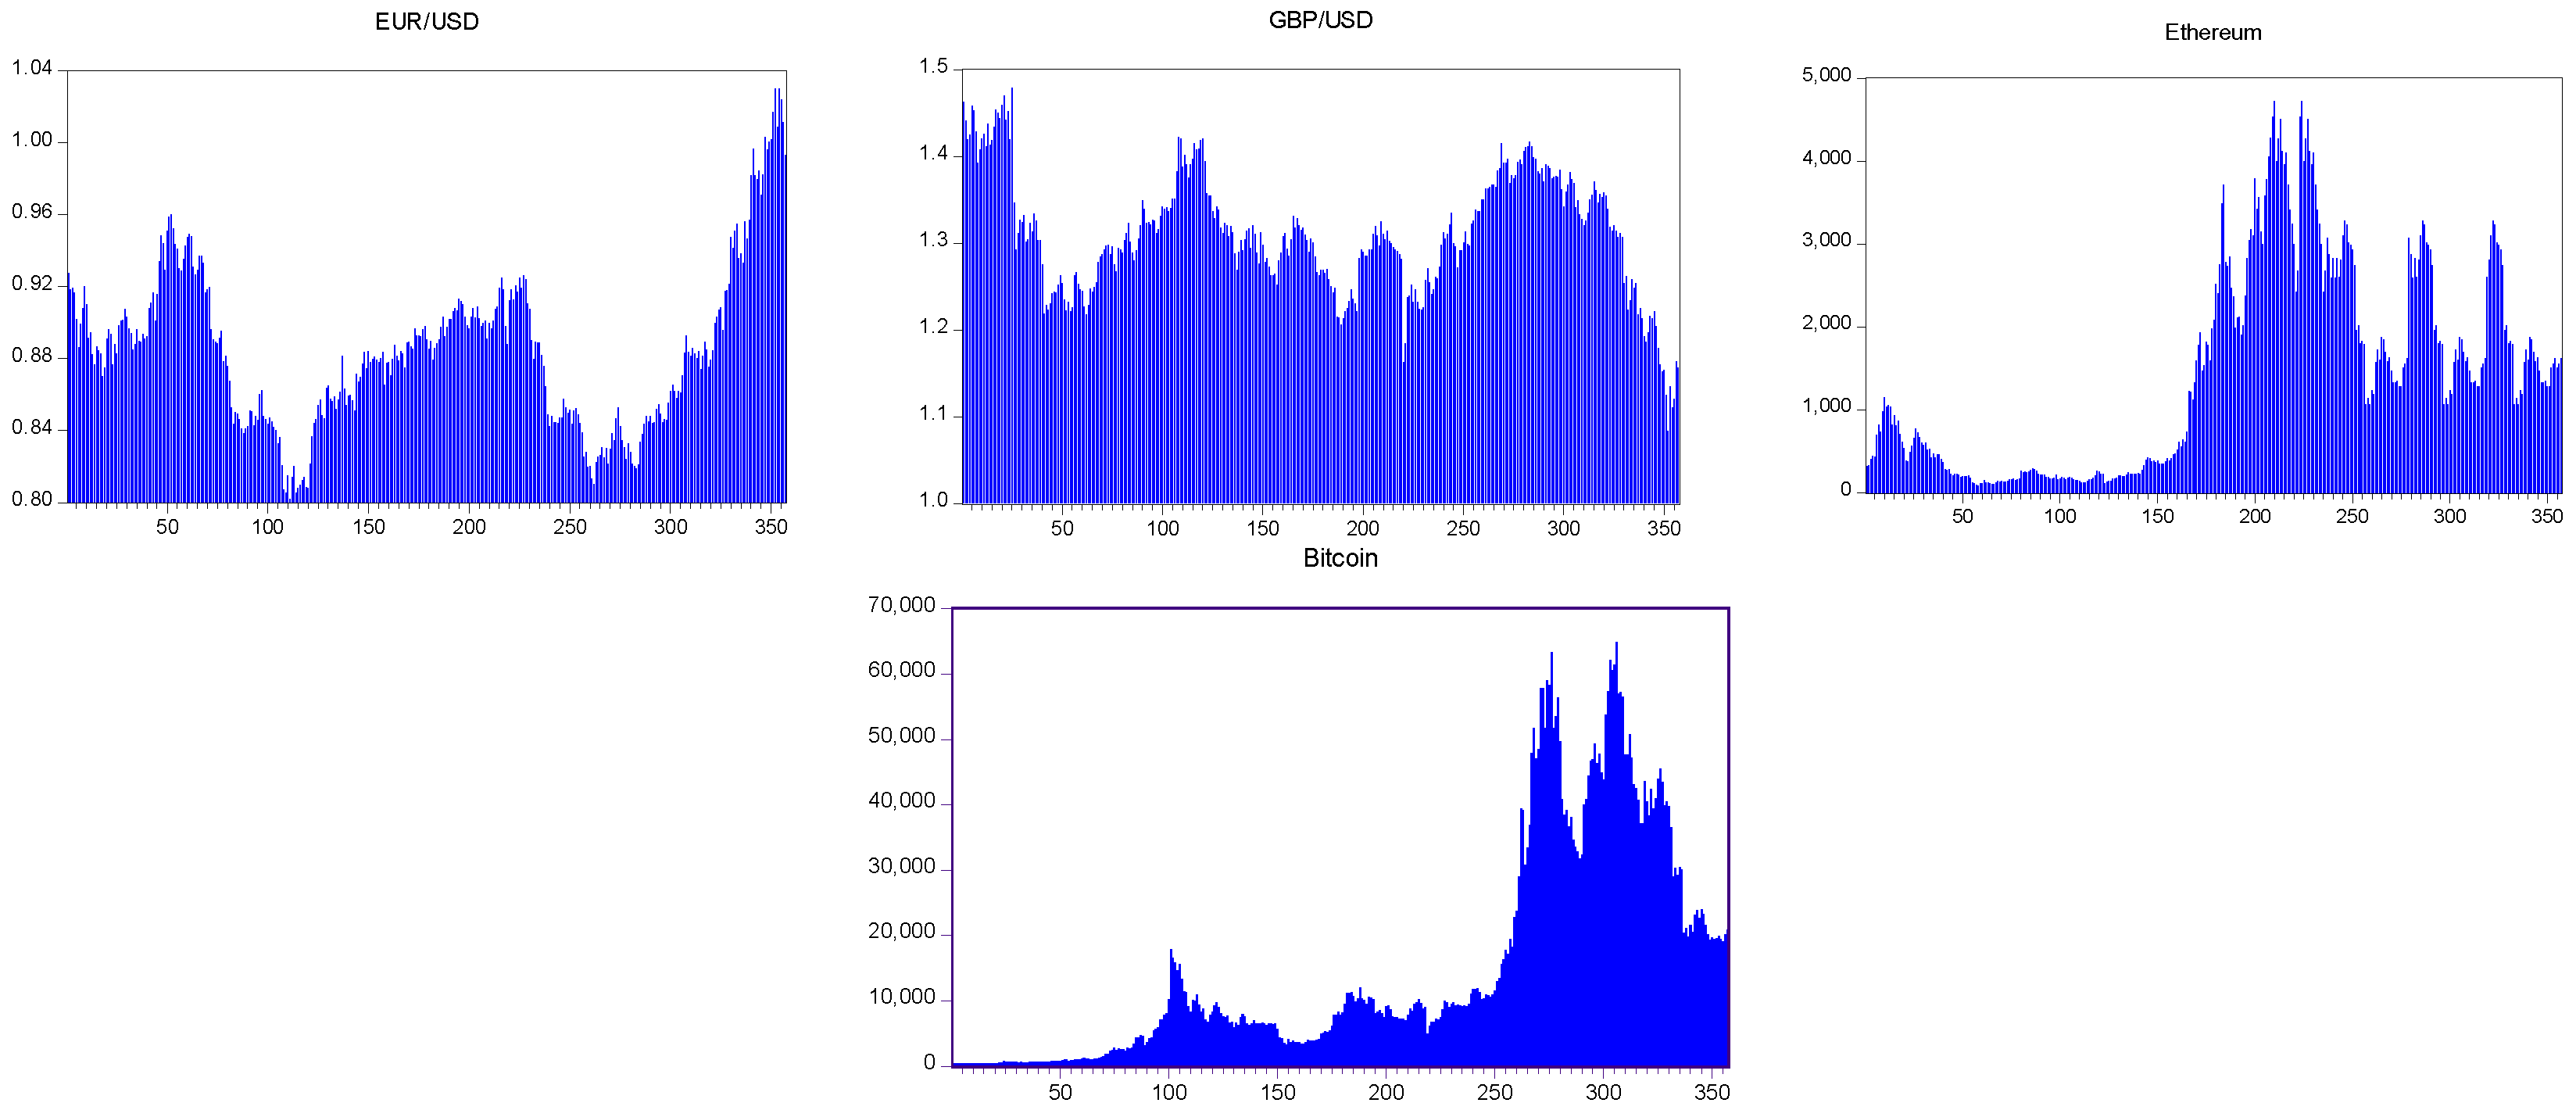
Figure 3.
CUSUM Graphs (Model with Bitcoin).
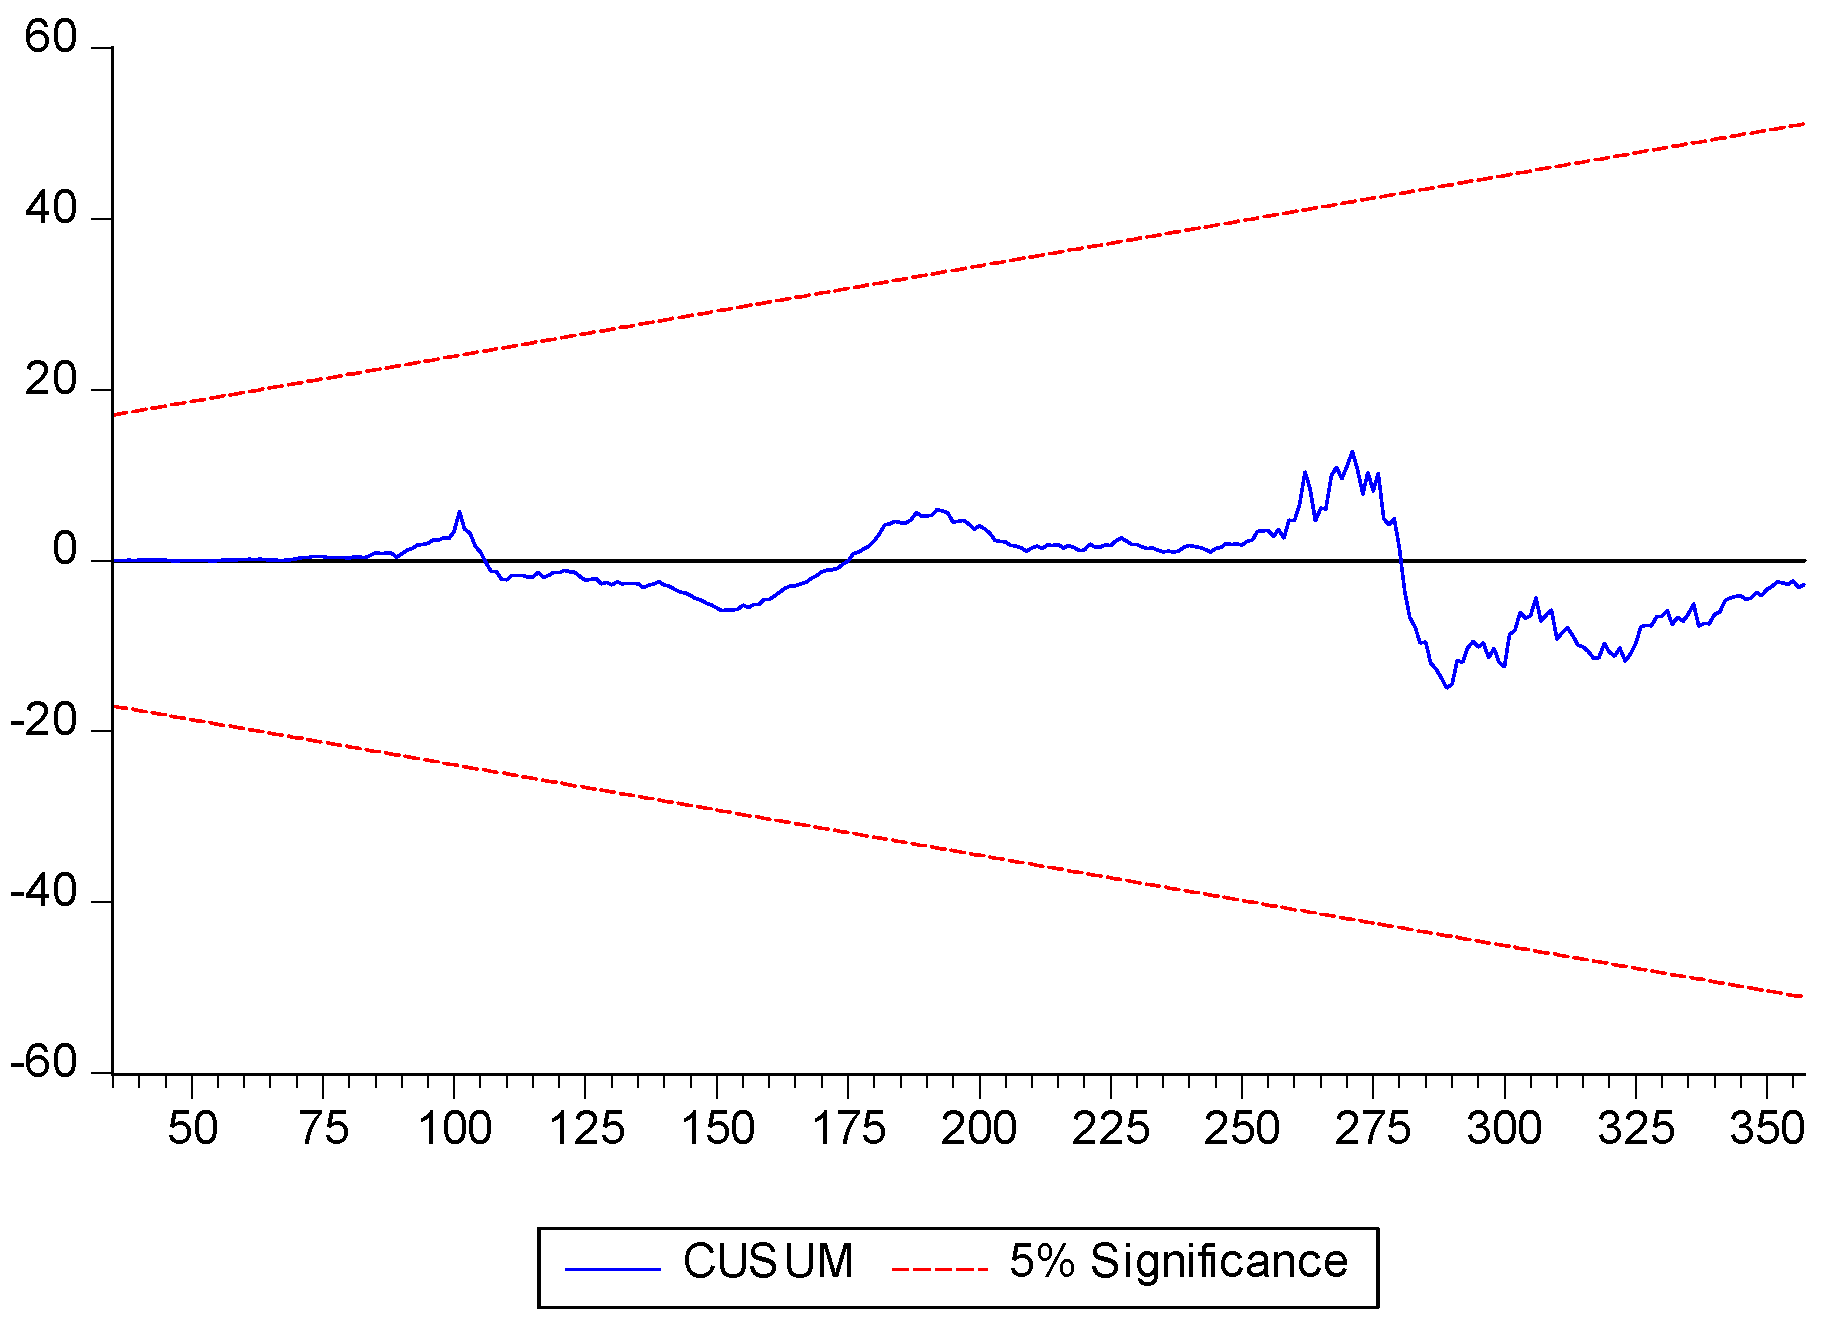
Figure 4.
CUSUM Graphs (Model with Ethereum).
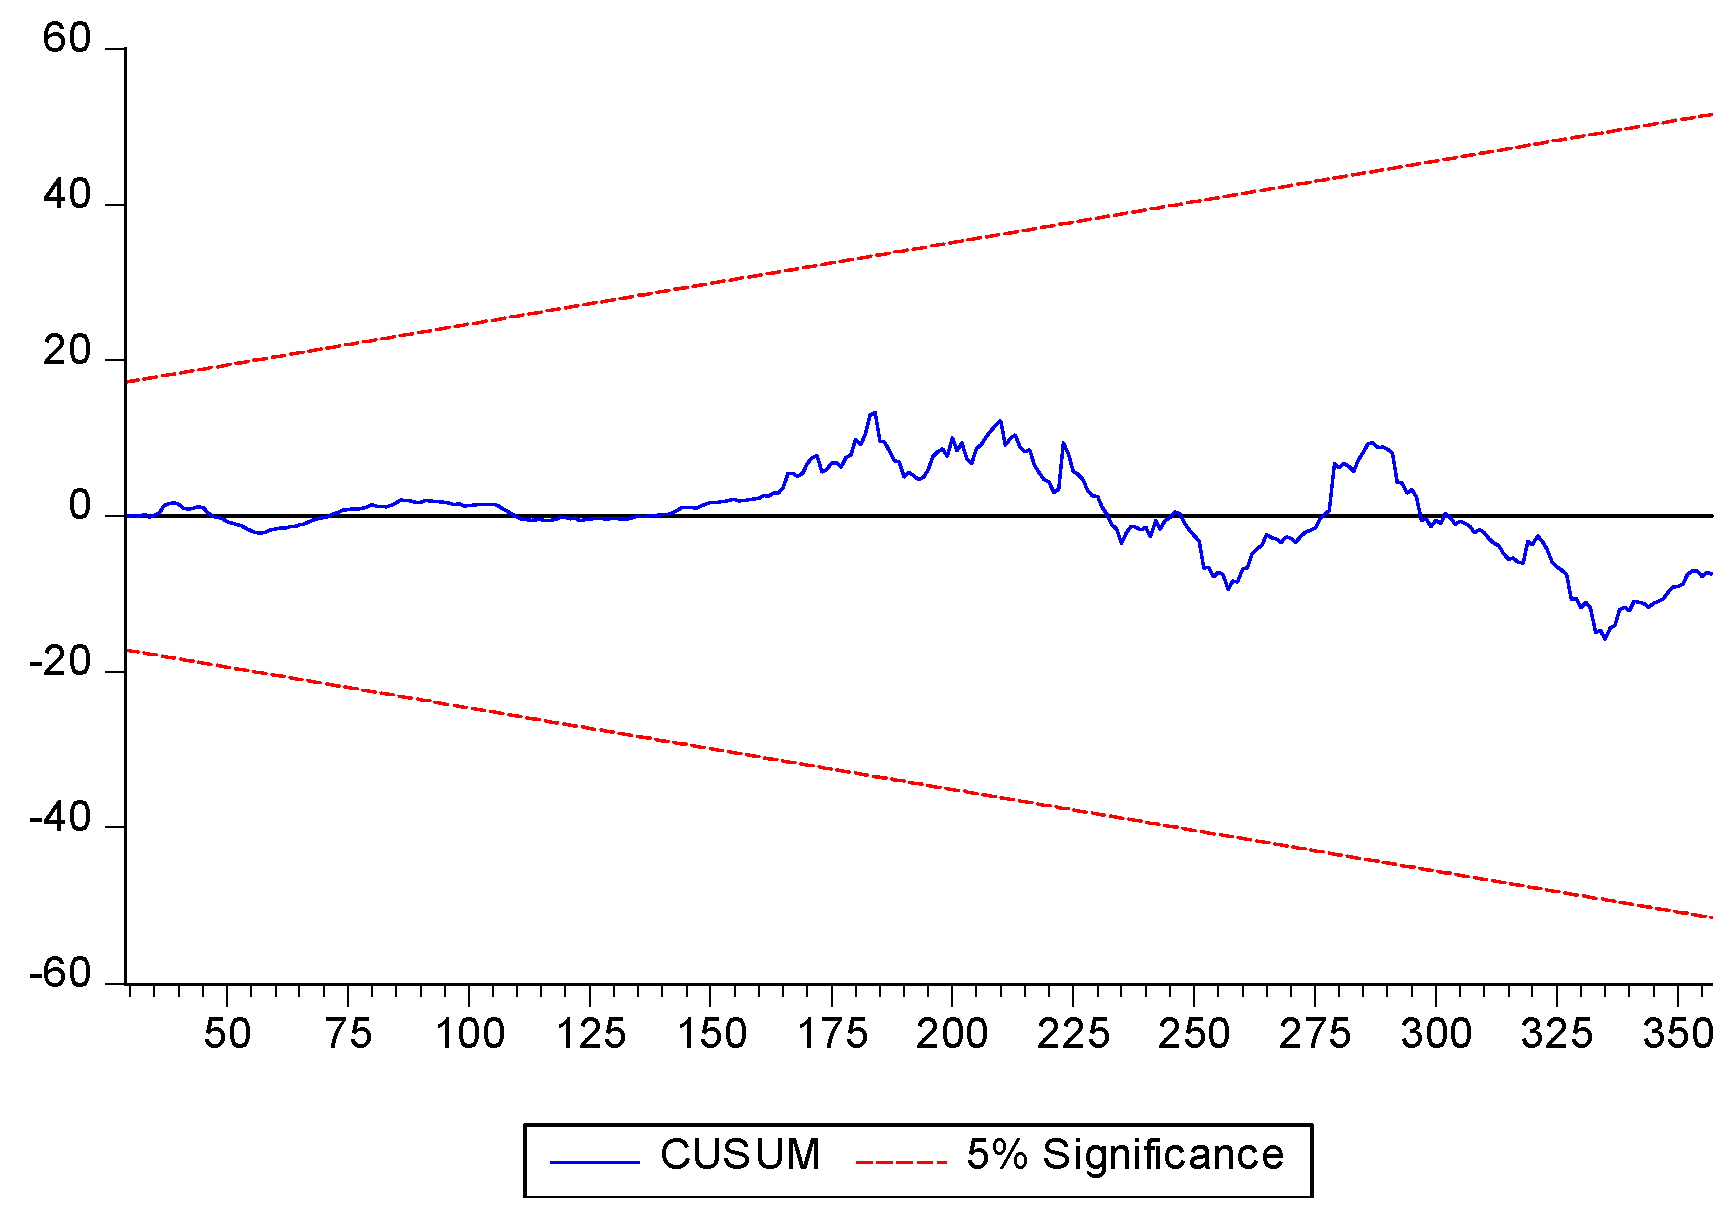
Table 1.
Data description.
| Variable | Abbreviations | Measurement Units | Source |
|---|---|---|---|
| Bitcoin | BTC | Bitcoin closing prices | Yahoo Finance |
| Ethereum | ETE | Ethereum closing prices | Yahoo Finance |
| NASDAQ indices | NAS | NASDAQ closing prices | Yahoo Finance |
| NIKKEI 225 indices | NIK | NIKKEI closing prices | Yahoo Finance |
| RUSSELL2000 indices | RUS | RUSSELL closing prices | Yahoo Finance |
| EURO/USD | EUR | EUR/USD closing prices | Yahoo Finance |
| GBP/USD | GBP | GBP/USD closing prices | Yahoo Finance |
Source: Authors compilation.
Table 2.
Descriptive Statistics.
| Variables | Mean | Std. Dev. | Max. | Min. | Skewness | Kurtosis |
| Bitcoin | 15133.28 | 16741.64 | 64949.96 | 379.6540 | 1.323818 | 3.532739 |
| Ethereum | 1416.431 | 1238.294 | 4730.384 | 86.53931 | 0.766367 | 2.528494 |
| NASDAQ | 9018.563 | 3264.283 | 15993.71 | 4266.840 | 0.542944 | 2.031689 |
| NIKKEI | 22741.41 | 3943.179 | 30323.34 | 15276.24 | 0.174095 | 2.065888 |
| RUSSELL | 1621.937 | 343.2355 | 2409.140 | 953.7200 | 0.530018 | 2.536800 |
| EURO | 0.884716 | 0.044201 | 1.030080 | 0.802100 | 0.708092 | 3.705539 |
| GBP | 1.310384 | 0.069257 | 1.478940 | 1.083600 | 0.112677 | 3.077686 |
Table 4.
Unit root estimation.
| Model with Bitcoin | Model with Ethereum | |||||
| Values | CV at 1% Level | Values | CV at 1% Level | |||
| 2.301 | 3.92 | 0.684 | 3.748 | |||
| 2.453 | 4.287 | 0.775 | 4.174 | |||
| -3.392 | -4.02 | -1.064 | -3.723 | |||
Table 5.
Bootstrap ARDL cointegration results.
| Variables | Level | 1st Dif. | Level | 1st Diff. | |||
| Philip Pearson (PP) | ADF | ||||||
| 1 | Bitcoin | 0.5763 | 0.000 | I (1) | 0.4695 | 0.000 | I(1) |
| 2 | Ethereum | 0.2939 | 0.000 | I (1) | 0.2340 | 0.000 | I(1) |
| 3 | NASDAQ | 0.6635 | 0.000 | I (1) | 0.6637 | 0.000 | I(1) |
| 4 | NIKKEI225 | 0.5341 | 0.000 | I (1) | 0.6208 | 0.000 | I(1) |
| 5 | RUSSELL2000 | 0.3640 | 0.000 | I (1) | 0.3748 | 0.000 | I(1) |
| 6 | Euro/USD | 0.6814 | 0.000 | I(1) | 0.7185 | 0.000 | I(1) |
| 7 | GBP/USD | 0.0917 | 0.000 | I(0) | 0.1312 | 0.000 | I(1) |
Table 6.
Short-run and Long run coefficients (Linear ARDL Model with Bitcoin and Ethereum).
| Model with Bitcoin | Model with Ethereum | ||||
| Variable | Coefficients | t-Stat | Coefficients | t-Stat | |
| 1.077** | 2.501 | -0.040** | -1.993 | ||
| -0.191* | -1.634 | -0.024** | -1.417 | ||
| 0.124*** | -2.393 | 0.609** | 2.044 | ||
| 0.112 | 0.280 | 0.162*** | 0.132 | ||
| 0.377 | 1.371 | -1.755** | 2.526 | ||
| 0.358** | 2.99 | -0.040** | -2.67 | ||
| -0.191* | -1.63 | -0.024 | -1.99 | ||
| 0.374* | 2.66 | 0.209 | 1.16 | ||
| 0.112 | 0.280 | 5.793 | 0.13 | ||
| 0.377 | 1.371 | 5.976** | 1.78 | ||
| -0.105** | -5.188 | 0.04*** | -3.78 | ||
Notes: ***, **, * reflect the significance level at 1%,5%, and 10%.
Table 7.
Short-run & Long run coefficients estimations for + and - in (Non-Linear ARDL Model with Bitcoin and Ethereum).
Table 7.
Short-run & Long run coefficients estimations for + and - in (Non-Linear ARDL Model with Bitcoin and Ethereum).
| Model with Bitcoin | Model with Ethereum | ||||
| Variable | Coefficients | t-Stat | Coefficients | t-Stat | |
| 2.37** | 2.054 | 0.009** | -1.652 | ||
| 3.417*** | 3.176 | -0.042 | -1.348 | ||
| 0.051 | 0.242 | -0.049** | -1.979 | ||
| 0.919*** | 3.133 | 0.052 | 1.298 | ||
| 2.418*** | 2.011 | 1.088** | 2.071 | ||
| 2.562*** | -3.950 | 0.167*** | -0.098 | ||
| -2.33** | -2.230 | 6.318 | -0.027 | ||
| 2.07** | 2.343 | 2.905** | 3.543 | ||
| 4.9 | -0.759 | 2.390* | 0.447 | ||
| -2.34* | -1.306 | -2.668** | 2.176 | ||
| -0.701 | -1.40 | -0.090* | -1.65 | ||
| 0.346 | 1.21 | -0.042 | -1.34 | ||
| 0.051* | 0.24 | -0.049** | -1.97 | ||
| 0.417* | 1.94 | -0.003 | -0.16 | ||
| 0.863*** | 2.79 | 1.088** | 1.12 | ||
| -0.228 | -0.94 | -0.146 | -0.060 | ||
| 0.233** | -2.23 | -3.135 | -0.02 | ||
| 0.271** | 2.34 | 4.030*** | 3.54 | ||
| -0.494 | -0.75 | 6.318 | 1.92 | ||
| -0.520 | -1.30 | 8.677* | 1.77 | ||
| -0.165*** | 0.414 | -0.098*** | -0.700 | ||
Notes: ***, **, * reflect the significance level at 1%,5%, and 10%. .
Disclaimer/Publisher’s Note: The statements, opinions and data contained in all publications are solely those of the individual author(s) and contributor(s) and not of MDPI and/or the editor(s). MDPI and/or the editor(s) disclaim responsibility for any injury to people or property resulting from any ideas, methods, instructions or products referred to in the content. |
© 2025 by the authors. Licensee MDPI, Basel, Switzerland. This article is an open access article distributed under the terms and conditions of the Creative Commons Attribution (CC BY) license (http://creativecommons.org/licenses/by/4.0/).
Copyright: This open access article is published under a Creative Commons CC BY 4.0 license, which permit the free download, distribution, and reuse, provided that the author and preprint are cited in any reuse.


