
Submitted:
17 January 2025
Posted:
17 January 2025
You are already at the latest version
Abstract
Understanding the changes in land use and land cover (LULC) in national parks and their corresponding ecosystem service value (ESV) shifts are crucial for shaping future management policies and directions. However, comprehensive analyses in this research area that integrate tourism development perspectives are lacking. Therefore, this interdisciplinary study considers Akan-Mashu National Park in Japan as a case study. Using remote sensing data, LULC maps for the past 10 years were generated using the Google Earth Engine. The benefit transfer method was employed to calculate the corresponding ESV for each year, followed by a qualitative analysis of local tourism policy documents to explore how the park ecosystem has changed in the context of promoting tourism development. The results showed that LULC changes in Akan-Mashu National Park have been relatively stable over the past decade, with the most noticeable changes occurring in built-up areas. The results also confirm that tourism development has not had a significant negative impact on the ESV of the Akan-Mashu National Park. The recommendations proposed in this study can also be applied to other similar national parks or protected areas worldwide to achieve a dynamic balance between environmental protection and tourism development.
Keywords:
Ecosystem services
; Land use land cover
; National Park
; Sustainable tourism
; Recreation
1. Introduction
Ecosystem services (ES) refers to the benefits to human society obtained directly or indirectly from nature [1]. ES are fundamental to sustaining life and promoting human well-being, providing critical benefits, such as air and water purification, climate regulation, and biodiversity support [1,2]. Natural resources can enhance human wellbeing; however, some human activities can also affect the natural environment [3]. This interaction is particularly pronounced in protected areas such as national parks, which serve as key reservoirs of biodiversity and natural habitats. Palomo et al. [4] have demonstrated that national parks and their buffer zones offer a diverse array of ecosystem services that benefit the surrounding lands. These areas support an ecological balance and offer recreational, cultural, and spiritual benefits to society.
Japan is renowned for its diverse and picturesque natural landscapes and hosts a network of national parks that are pivotal to its ecological conservation efforts. Japan’s national park system was established in 1931 through the passage of the National Park Law. Japan’s national parks are “regional” (chiikisei) parks that can be designated by setting areas regardless of land ownership, and within the designated areas, various actions that alter the natural environment are regulated as actions that require permission or notification [5]. In addition, various facilities have been developed as places to interact with nature. The Ministry of the Environment (MoE) has set up branch offices to handle various management tasks, including issuing permits and licenses. These parks play a dual role in preserving biodiversity and supporting substantial tourism. The ecological value of Japan’s national parks is immense, as they provide critical ecosystem services that contribute to environmental stability and resilience.
Economically, these parks are significant tourism destinations that attract millions of visitors annually and contribute to local and national economies. The Japanese government is working on the “Tourism Vision to Support Japan’s Future,” which aims to increase the number of foreign visitors to Japan to 60 million by 2030. National parks are positioned as one of the pillars of the “Tourism Vision to Support Japan’s Future,” which was compiled by the government in March 2016, and the “Project to Fully Enjoy National Parks” has been promoted (https://www.env.go.jp/en/nature/enjoy-project/index.html). This project is targeting the branding of Japan’s National Parks as world-class National Parks and initially focused on eight selected national parks (the “Priority Eight Parks”) to implement pioneering and intensive initiatives. Nevertheless, an increase in visitor numbers can exacerbate ecological pressures, leading to issues such as increased waste in the community, habitat destruction, pollution, and a decline in biodiversity, ultimately impacting the provision of ecosystem services [6,7].
Quantifying ecosystem service value (ESV) and monitoring its changes are crucial for assessing the effectiveness of conservation efforts (Costanza et al., 1997) One of the efficient methods for this purpose is the benefit transfer method (BTM) is an efficient method for this purpose. The BTM is used to estimate the value of ES in one location or context by applying valuation data from a similar location or study. In a pioneering valuation study, Costanza et al. [8] combined the unit area values of 17 ecosystem services across 16 ecosystem types with global distribution data to first attempt to estimate the global value of ecosystem services and natural capital. De Groot et al. [9] updated the 1997 valuation by incorporating data from the Economics of Ecosystems and Biodiversity (TEEB) Initiative. Costanza et al. [10] estimated losses and gains in ecosystem services from 1997 to 2011. Therefore, these studies established favorable conditions for utilizing BTM to assess ESV. Changes in land use and land cover (LULC), driven by various factors, significantly influence ecosystem services [11]. Based on these foundations, the value coefficients and adjusted coefficients combined with LULC change analysis are widely used in the value transfer method when estimating the ESV [12,13,14,15].
Remote sensing has been widely used in LULC classification, enabling the analysis of land cover changes over time [16,17]. Previous studies have employed remote sensing to map LULC classifications at the national park scale, providing evidence for further analysis of ESV changes in these areas [18,19,20,21].
Some studies have demonstrated how tourism can alter LULC and affect landscape and ecosystem functions. Research has indicated that the rise in tourism in Nepal’s national parks may be linked to observed LULC changes such as the expansion of built-up areas and a decline in forest cover [22]. A study conducted in Bali found that tourism growth drove changes in LULC, and an increase in visitors encouraged the construction of tourism-related buildings. [23]. Vijay et al. [24] found that areas with rapid tourism growth also experienced a rapid expansion of built-up land, confirming the impact of tourism pressure on LULC. Despite advancements in assessing ESV dynamics based on LULC changes, a gap still exists in integrating the tourism context with ESV change analysis, particularly from a policy-driven perspective. As the “Project to Fully Enjoy National Parks” has been implemented in selected national parks in Japan, these policy-driven tourism initiatives may have influenced land use and, in turn, affected ecosystem services. However, current research frequently neglects the intersection of policy-driven tourism initiatives and environmental conservation strategies for ecosystem services. Addressing this gap is vital to develop comprehensive strategies that balance ecological preservation with socioeconomic development in Japan’s national parks and similar environments.
This interdisciplinary study aims to bridge these gaps by examining the interplay between tourism development, LULC changes, and ecosystem service values, providing a nuanced understanding of the socio-ecological dynamics within Japan’s national parks. Specifically, the research objectives of this study are: first, to map the LULC of Akan-Mashu National Park (one of the “Priority Eight Parks”) from 2014 to 2023 through remote sensing technology; second, to calculate the ESV for each year from 2014 to 2023 using the value transfer method; third, to explore the changes in LULC and ESV of national parks from the perspective of promoting tourism development in combination with the qualitative analysis of tourism planning policy documents; fourth, to propose future national park management recommendations based on the research results. As a baseline study, our research aims to verify the effectiveness of the policy and provide a scientific basis for the long-term monitoring and policy optimization of protected areas such as national parks.
2. Materials and Methods
2.1. Study Sites
Designated in 1934, Akan-Mashu National Park (Figure 1) is one of the oldest national parks in Hokkaido, Japan. It is characterized by extensive natural forests, primarily subarctic mixed coniferous forests. These are among the most primeval forests in Japan’s national park system. The park’s foundation is shaped by three caldera formations, the Akan, Kussharo, and Mashu calderas, created through volcanic activity associated with the Chishima Volcanic Zone. The proximity of multiple volcanic–lake systems within a relatively compact area enhances the park’s national significance and ecological value. There is a strict zoning system in Japan to ‘maintain the scenic beauty’ of national parks. The national park was divided into special and ordinary zones. Special areas are divided into four categories based on the strictness of the regulations: Special Protection Zone, Class I Special Zone, Class II Special Zone, and Class III Special Zone. Protective regulations are applied accordingly (Enforcement Regulations of the Natural Parks Act). Based on the MoE data, we determined the areas and proportions of the different zones in Table 1. The ordinary zone accounts for approximately 20% of the national park’s total area, whereas the remaining 80% are special zones with restrictive rules.
2.2. Workflow
The workflow of this study mainly has four steps, as shown in Figure 2: first, using remote sensing to classify the LULC of the study site; second, performing the value transfer method to estimate the ESV; and third, calculating the single dynamic index and coefficient of sensitivity (CS) to analyze the dynamics of LULC and validate the result of ESV estimation; and fourth, through qualitative analysis we finalized a tourism planning policy document that summarized the operations conducted in Akan-Mashu NP and proposed future tasks based on the “Project to Fully Enjoy National Parks.”
There are some existing LULC datasets in Japan, such as GIS-based products from the National Land Numerical Information (NLNI, National Land Information Division, National and Regional Policy Bureau: https://nlftp.mlit.go.jp/ksj/gml/datalist/KsjTmplt-L03-b-2021.html) and the Japan Aerospace Exploration Agency supports a high-level satellite product. However, these products do not cover all years investigated in this study; therefore, we applied the Google Earth Engine (GEE) to prepare the LULC map from to 2014-2023. Referring to existing LULC products in Japan, related policy documents, and the classification from the ESVD, we considered six LULC types for the Akan-Mashu NP; detailed descriptions are shown in Table 2.
2.3. Land Use Land Cover Classification
2.3.1. Data Collection
We utilized 30-m spatial resolution Landsat 8 Level 2, Collection 2, and Tier 1 surface reflectance data, which are atmospherically corrected products provided by the United States Geological Survey (USGS). We selected the Red, Green, Blue, Near-infrared (NIR), and shortwave infrared (SWIR-1 and SWIR-2) spectral bands for the analysis. Boundary data for the three national parks were obtained from an online platform (https://www.geospatial.jp/ckan/organization/biodic). These data were used to extract sections corresponding to the study areas from all Landsat images.
Based on previous studies [25,26], a comprehensive set of spectral indices, topographic attributes, climatic variables, and texture features was derived and integrated into a unified dataset to enhance the accuracy of LULC classification. Spectral indices were calculated using Landsat 8 Surface Reflectance data to enhance the separability of land cover classes. Topographic variables derived from Shuttle Radar Topography Mission (SRTM) data [27] included elevation, slope, and aspect. The climatic data from the TerraClimate dataset were averaged for the targeted year [28], including soil moisture, runoff, minimum temperature, and vapor pressure, were averaged for the target year [28]. Gray-level co-occurrence matrix (GLCM) texture metrics were derived from a grayscale image created using Landsat 8 bands. These features were selected because of their ability to capture the diverse biophysical and environmental characteristics of the study area. All indices used in this study are summarized in Table 3.
2.3.2. Data Processing
The pre-processing steps ensured the generation of a clean, representative image of the study area for each target year. This image served as the base layer for the subsequent feature extraction and classification processes. The cloud and snow masking functions combined with the median composite approach minimized data contamination and improved the reliability of the LULC classification results. For the Akan-Mashu NP, there are records of snowfall in winter according to the records of the Japan Meteorological Agency. Hence, the cloud- and snow-masking functions were applied to these datasets. The masking process utilizes the QA_PIXEL band to identify and remove pixels affected by clouds and snow.
A manual interpretation method based on existing LULC products was employed to label the reference points. Specifically, authoritative LULC products (ESA LULC dataset and a dataset from the Japan Aerospace Exploration Agency) were selected as references and combined with high-resolution satellite imagery and the actual geographical characteristics of the study area for manual interpretation and verification of each reference point. Furthermore, to avoid classification bias, a series of candidate samples for each land-cover type were randomly generated, manually interpreted, and screened to finalize a reliable reference dataset. This process aimed to provide high-quality reference data for subsequent training and validation of the classification algorithm.
2.3.3 Machine-Learning Algorithm
Random Forest (RF) is an ensemble machine learning algorithm that operates by constructing multiple decision trees during training and outputs the mode (classification) or mean (regression) of individual tree predictions [29]. It is widely known for its robustness, ability to handle large datasets, and effectiveness in handling continuous and categorical data. The algorithm selects random subsets of features and samples to build each tree, which improves the accuracy of the model and reduces overfitting. Many studies have shown that RF produces a relatively high accuracy for LULC classification [25,30]. Therefore, in this study, an RF classifier was used for the LULC mapping.
Following a previous study, we used 80% of the training sample points and 20% of the verification sample points to calculate the corresponding confusion matrix [31]. By calculating the confusion matrix, we obtained overall accuracy (OA), kappa coefficient, producer accuracy (PA), and user accuracy (UA) for each year to assess the accuracy of the classification results.
2.3.4. Dynamic Analysis of LULC
To assess the changes in LULC from to 2014-2023, we applied a single dynamic index. The single dynamic index of land use serves as a quantitative measure for describing the rate of land-use change. It is instrumental in comparing differences in land-use changes and analyzing trends over time [32,33]. The magnitude of a single dynamic index reflects the intensity and pace of land-use change. Higher values signify more intense or rapid changes, whereas lower values indicate slower or less significant changes in land use. The formula used is as follows:
where K represents the rate of LULC change, A₁ and A₂ denote the area of land class A at the start and end of the evaluation period, respectively, and t is the duration of the evaluation in years.
2.4. Estimation of Ecosystem Services Values
This study employed the value-transfer method to estimate ESV. The value transfer method is a practical and efficient tool for estimating ESV when resources or data are limited. It can also be applied across multiple sites, enabling regional- or national-level evaluation of ecosystem services [34].
This study employed value coefficients from the latest 2020 updated Ecosystem Service Valuation Database (ESVD), which is a follow-up to the TEEB [8]. The ESVD comprises 4,042 value records from 693 case studies spread across six continents, including Asia. As stated in the original document, the selected common currency for ESVD is the international dollar, which reflects the value of the US dollar in the United States based on purchasing power (as of 2020). Therefore, this unit was used to calculate the ESV.
The LULC classes in our study differed slightly from those in the ESVD. For this research, we applied coefficient values for land-use types that were closely aligned with the biomes identified in the ESVD [8]. Specifically, to estimate the ESV for ‘forests’ and ‘water bodies’ in our study site, we used the coefficient values for ‘temperate forests’ and ‘rivers and lakes,’ respectively, as provided in the ESVD (Table 4). For ‘built-up areas’ and ‘bare land,’ referring to a series of previous studies [19,20], we believe that they have no ecological value, so the coefficient of ‘desert’ is assigned here, which is 0. Detailed descriptions of the coefficients for each land-use type and the corresponding ecosystem services they offer are presented in Table 4.
To compute the ESV of the LULC types, LULC functions, and total ESV, the following equations were applied:
where, ESVft is the estimated ESV of function f at time t, Ak and VCk are the area (ha), and the ecosystem service value coefficient of function f (US$ha−1 yr−1) for the LULC type k.
where, ESVt is the estimated total ESV at time t, Akt is the area (ha) of LULC type k at time t and VCk is the ecosystem services value coefficient (US$ha−1 yr−1) of the LULC type k.
To assess the results of the ESV evaluation, researchers have applied the concept of the elasticity coefficient, which is commonly used in economics, to calculate the sensitivity coefficient of the ESV. This helps to determine the impact of value changes over time on ecosystem service functions and the extent of reliance on these coefficients. [35]. In this study, we performed a sensitivity analysis to assess how changes in the value coefficients would impact the ESV [10]. To achieve this, the value coefficients for each LULC type were adjusted to 50% and the corresponding coefficient of sensitivity (CS) was calculated using the following equation:
In this equation, ESV represents the estimated ecosystem service value and VC denotes the value coefficient. where the subscript i refers to the initial value, j indicates the adjusted value, and k represents the LULC type. A CS greater than 1 suggests that the ESV is elastic with respect to the coefficient, whereas a CS less than 1 implies that the ESV is inelastic. In such cases, the results remain reliable, even if the accuracy of the value coefficient is relatively low.
3. Results
3.1. LULC analysis
3.1.1. Results of LULC
According to the classification conducted on the GEE, we obtained LULC classes from to 2014-2023 per year in the study areas. The average OA was 89.93%, and the average kappa coefficient was 87.81%. The detailed results of the OA, Kappa coefficient, producer accuracy, and user accuracy for 2014 and 2023 are summarized in Table 5. Owing to space limitations, detailed accuracy assessment data for each of the ten years are summarized in Table S1 in the Appendix.
In Akan-Mashu NP, there are six types of LULC: forests, cultivated areas, built-up areas, water bodies, grassland, and bare land (Figure 3). The main water bodies in this park are lakes, and built-up areas mainly converge around the lakes and northeast. We further analyzed the percentages of different classes in the study areas. According to Figure 4, forests are the land use type with the largest area, covering more than 70% of the area, followed by water bodies, cultivated areas, grassland, bare land, and built-up areas. The LULC maps at the study site are presented in Figure S1 in the Appendix.
3.1.2. Dynamic of LULC
Table 6 summarizes the area of different land-use types (Unit: Hectare) and their proportion of the total area in each year during the study period. Table 7 shows the area of different land use types in 2014 and 2023, as well as their corresponding single dynamic index. In Akan-Mashu NP, the forest area has hardly changed during the study period, with a single dynamic index of -0.06%. Cultivated areas experienced an increase, expanding from 4364.25 hm² in 2014 to 4834.85 hm² in 2023, with a single dynamic index of 1.20%. Following cultivation, built-up areas expanded by 281.48 hm², with a single dynamic index of 2.89%. The area of the water bodies increased slightly with a single dynamic index of 0.11%. Grassland and bare land had a slight decrease, with a single dynamic index of -0.79% and -0.66% respectively.
Figure 5 shows the changing trend in the area of each land-use type during the study period. Forests, water bodies, and bare land are land-use types that changed relatively slowly, whereas grassland, cultivated areas, and built-up areas changed more obviously.
3.2. Ecosystem Services Valuation
3.2.1. The Results of ESV
Table 8 shows the annual ESV (unit: million USD) of the study site during the study period and the ESV provided by different land-use types and their proportions. Although water bodies only occupy approximately 12% of the area, they provide more than 70% of the ESV, making them the largest land use type in the overall ESV, followed by forests, which provide approximately 22% of the ESV, and then cultivated areas and grasslands; these two types of land use only offered little value from the overall perspective.
Figure 6 illustrates the ESV of the four types of ecosystem services and their respective shares of total ESV. In the Akan-Mashu NP, the most valuable ecosystem service type is regulating services, which make up approximately 50% of the total value, followed by cultural services, roughly 25% of the total ESV, habitat services at approximately 13%, and provisioning services.
3.2.2. The Temporal Variation of the ESV
Table 9 shows the changes in ESV provided by different land use types in the study area from 2014 to 2023. In Akan-Mashu NP, the ESV of forests decreased by 1.85 million USD, and that of grasslands decreased by 0.77 million USD; while both cultivated areas and water bodies increased, of which the ESV of water bodies increased by 12.69 million USD, and the value of cultivated areas increased by 3.78 million USD. The total ESV in the study area increased by 13.85 million USD in the last decade.
3.2.3. Sensitivity Analysis
Table 10 shows the sensitivity coefficient results for different land-use types after adjusting the coefficients by 50%. The results showed that the sensitivity coefficients of all land-use types were less than 1 in the study year. This indicates that the overall ESV reacted little to variations in the equivalence value coefficients, suggesting that ecosystem service values are not highly elastic relative to the ecological value coefficients. Overall, the ESV results are robust and reliable.
3.3. Summary of the Tourism Promotion Policy Document
From the ‘Akan-Mashu National Park Enjoyment Project Step-up Program 2025,’ we mainly summarize the measures to promote tourism by 2020 and future plans through a qualitative analysis. In Table 11, we present only selected cases instead of all details. By 2020, four aspects had been conducted to promote tourism in Akan-Mashu NP: promoting adventure travel (AT), new use of the national park, promoting private investment through public-private partnerships, and developing public spaces. Noteworthy, AT is defined as “a trip consisting of two or more of the following three elements: nature, activities, and cross-cultural experiences. We also summarized seven main measures to promote the future tourism development of national parks. These seven aspects are as follows: (1) responding to the COVID-19 pandemic and the Post-COVID Era, (2) promotion of AT in Eastern Hokkaido, (3) rehabilitation of usage hubs through public-private collaboration, (4) formation of the Akan-Mashu National Park Trail Network, (5) new utilization to enhance the added value of nature, (6) prompt response to simple improvements from the user’s perspective, and (7) promotion of sustainable tourism. For a detailed description of each aspect, please refer Appendix Table S2.
4. Discussion
4.1. Changes of LULC
The LULC results of this study revealed that the land use type in the Akan-Mashu NP was dominated by forests, followed by water bodies and grasslands. Human activities engaged in land use types: Cultivated and built-up areas cover only a small portion of the study area. This result is consistent with the features of the NP, which has a magnificent landscape that weaves volcanoes, forests, and lakes together. Although the single dynamic index of forests decreased from 2014 to 2023, the absolute change was 0.06%, indicating almost no significant changes. Similar to forests, changes in water bodies, grasslands, and bare land were slow. The single dynamic indices of built-up areas (2.89%) and cultivated areas (1.20%) were relatively higher than those of the other land-use types. As of 2020, the management department has implemented numerous measures to attract tourists, as summarized in Section 3.3. Among these measures, projects increase the construction area by opening and building new walking trails, viewing platforms, and parking lots. Previous studies have indicated a marked increase in abandoned farmland in Japan due to the substantial decline and aging of its rural population [36,37]. Our research showed that cultivated land within national parks has developed steadily over the past decade, with a steady increase from 2014 to 2023. This result may be because our study period was in the last decade and the coverage area was not large enough, which does not reflect the more significant phenomenon of farmland abandonment.
As summarized in Table 1, most of the zoning in this area is classified as special zoning, which has several restrictions and regulations. Our findings regarding changes in LULC indicate that land use has not shifted significantly over the past decade, demonstrating the success of protection and management strategies.
4.2. Changes of ESV
Our results show that different land-use types contribute to different ESV. Although water bodies account for only approximately 12% of the total area of the national park, they provide more than 70% of the ESV, which shows the importance of this land use type in the overall ecosystem service. In particular, the three major lakes, Lake Akan, Lake Mashu, and Lake Kussharo, not only have supporting services, regulating services, and provide habitat functions for plants and animals but are also important scenic spots. According to the policy documents of the management department, there are artificial facilities, such as observation platforms and campsites, around the lakes. Therefore, we believe that the areas around the three major lakes need to focus on monitoring ecological changes and tourism pressure. Another interesting point is that although the proportions of grassland and cultivated areas in the total area are almost the same, cultivated areas can provide more ESV. The main reason for this was that the coefficient value represented by cultivated areas was larger than that of grassland. The coefficient table (Table 4) shows that cultivated areas can provide objective regulation and cultural service values. However, because of the serious phenomenon of farmland abandonment in Japan, especially in remote areas such as Hokkaido and Kyushu [36,37], the area of cultivated land will gradually decrease in the future. This requires management departments and local town governments to make efforts to balance local agricultural development with the national park management.
Among the four types of ecosystem services, the value provided by regulating services was the largest, which was consistent with the characteristics of the national park itself. It is a national park dominated by natural landscapes. Secondly, cultural services account for a considerable proportion of the population. Based on these results, we believe that national parks are ideal places for the development of AT and ecotourism.
From the time-series results of the ESV, the changes in the past decade have been very slow, and the overall ESV has increased by 13.85 million USD. Our research results reflect that management planning is very effective, and the plan to promote the development of tourism has not brought too much pressure and impact on the local land use type and ecological environment. Although our results showed minor changes in LULC and ESV, they do not imply that conservation efforts should be overlooked. Instead, a stable ecological state should promote the ongoing implementation of effective policies to sustain existing ecological service values.
4.3. Management Recommendations
Based on the main findings of this study, we propose several management recommendations for balancing ecological conservation and tourism development in national parks. We hope that these recommendations will not only apply to the subjects of this study—Japan’s national parks—but will also provide a reference for managing similar environments worldwide. First, our results validate the effectiveness of Japan’s national park zoning management system over the past decade. Zoning management systems should continue to be strictly followed in the future to ensure the ecological conservation of national parks. This recommendation is applicable globally, especially in developing countries such as China, which has recently begun to establish national parks. Second, we suggest that abandoned vacant lands or buildings in Akan-Mashu National Park be demolished and replaced with new tourism facilities. This approach would not occupy additional construction land and could enhance the area’s appeal and tourism experiences for visitors. Third, as summarized in Section 3.3, national parks plan to conduct additional trials in the future. Given the region’s ecological fragility and referring to a previous study [38], we recommend introducing a new “utilization zoning system, “ in addition to the existing zoning management system, to further optimize the coordination between human activities and ecological conservation. For example, for areas around lakes, management can establish various utilization rules depending on the ecological situation; these can be divided into areas for limited use with guides and areas that can accommodate mass tourism. Finally, by identifying the value share of different types of ecosystem services, we can provide a reference for future tourism planning goals of national parks. For instance, our research found differences in the proportion of value across different ecosystem services, with regulatory services having the highest proportion, followed by cultural services. This finding emphasizes the rationale for promoting the AT model in tourism planning policies. Considering that national parks integrate the natural environment with local cultural features, the AT model can better protect the local natural environment while attracting tourists. We believe that this strategy is not only suitable for the study area but can also be applied to other national parks. For instance, when cultural services have the highest proportion, management can use the local culture as the main feature to attract visitors.
4.4. Limitations and Future Research
This study has the following limitations. First, there are constraints related to data sources and accuracy. The temporal and spatial resolutions of remote sensing data may not be sufficient to accurately capture small-scale land-use changes. The ESV coefficients used in this study were based on comprehensive global assessments, which may not fully reflect the ecosystem characteristics of the study area. Secondly, there were limitations to the timescale. Since this study is an interdisciplinary project focusing on changes in LULC and ESV in Japan’s national parks after the implementation of the “To Fully Enjoy National Parks” project, only data from the past ten years were obtained, rather than a longer period. However, LULC and ESV changes may have been influenced by historical land use and management practices over a longer period. Third, this study did not integrate socioeconomic dimensions. This research mainly focuses on the ecological dimensions of LULC and ESV, potentially overlooking the interrelationship between tourism development and socioeconomic factors.
To address these limitations, we plan to improve future research projects as follows. High-resolution remote-sensing data can be used to improve data accuracy. For ESV evaluation, multi-source data can be integrated to reflect local characteristics, such as ecosystem modeling based on local environmental data, visitor surveys, and social media review data. Owing to the limitations of the time scale, future research could extend this period to analyze long-term trends. Additionally, scenario simulations (e.g., InVEST models) can be used to predict the potential impacts of policies on future ESV, compensating for a short time span. To address the third point, future research should expand on these dimensions by incorporating social and economic indicators to establish a more comprehensive analytical framework. For example, the coupled coordination degree model can be used to comprehensively analyze the coordinated development of ecology, socioeconomics, and tourism within national parks.
5. Conclusion
This study analyzed the LULC changes in the Akan-Mashu National Park over the past decade and found that the changes were relatively stable, with the most notable changes observed in built-up areas, with a single dynamic index of 2.89%. Similar to the LULC changes, the ESV in the Akan-Mashu National Park also showed steady growth during this period, with an overall increase of 13.85 million USD. These results reveal that tourism development has not substantially harmed the ESV of Akan-Mashu National Park, highlighting the success of the park’s conservation efforts over the last ten years. Although water bodies account for only approximately 12% of the park’s total area, they contribute more than 70% of the ESV, highlighting the crucial role of water bodies in sustaining the park’s ecosystem services. Our analysis of the contributions of different ecosystem service types revealed that regulating services accounted for the highest proportion at approximately 52%, followed by cultural, habitat, and provisioning services. Additionally, we summarize the tourism development policies implemented in Akan-Mashu National Park up to 2020, and based on the analysis of LULC and ESV, we propose four management recommendations to promote sustainable tourism. These recommendations aim to better balance ecological conservation and tourism development, ensuring the long-term sustainability of Akan-Mashu National Park. The management recommendations we propose are not only targeted at the study area but are also intended to be applicable to other similar national parks or protected areas worldwide, providing a reference for sustainable tourism and land use management on a global scale.
Supplementary Materials
The following supporting information can be downloaded at the website of this paper posted on Preprints.org.
References
- Millennium Ecosystem Assessment [Program] (Ed.), 2005. Ecosystems and Human Well-Being: Synthesis; Island Press.
- Wu, J. Landscape sustainability science: Ecosystem services and human well-being in changing landscapes. Landsc. Ecol. 2013, 28, 999–1023. [Google Scholar] [CrossRef]
- Wang, H.; Xie, J.; Luo, S.; Ta, D.T.; Wang, Q.; Zhang, J.; Su, D.; Furuya, K. Exploring the interplay between landscape planning and human well-being: A scientometric review. Land 2023, 12, Article 7. [Google Scholar] [CrossRef]
- Palomo, I.; Martín-López, B.; Potschin, M.; Haines-Young, R.; Montes, C. National Parks, buffer zones and surrounding lands: Mapping ecosystem service flows. Ecosyst. Serv. 2013, 4, 104–116. [Google Scholar] [CrossRef]
- Hiwasaki, L. Toward sustainable management of national parks in Japan: Securing local community and stakeholder participation. Environ. Manag. 2005, 35, 753–764. [Google Scholar] [CrossRef] [PubMed]
- Adewumi, I.B.; Usui, R.; Funck, C. Perceptions of multiple stakeholders about environmental issues at a nature-based tourism destination: The case of Yakushima Island, Japan. Environments 2019, 6, Article 8. [Google Scholar] [CrossRef]
- van der Duim, R.; Caalders, J. Biodiversity and tourism. Ann. Tourism Res. 2002, 29, 743–761. [Google Scholar] [CrossRef]
- Costanza, R., d’Arge, R., De Groot, R., Farber, S., Grasso, M., Hannon, B., ... & Van Den Belt, M. (1997). The value of the world’s ecosystem services and natural capital. nature, 387(6630), 253-260.
- R. de Groot, L. R. de Groot, L. Brander, S. Solomonides, Update of Global Ecosystem Service Valuation Database (ESVD), 2020. FSD report No 2020-06, Wageningen, The Netherlands.
- Costanza, R.; De Groot, R.; Sutton, P.; Van Der Ploeg, S.; Anderson, S.J.; Kubiszewski, I.; Farber, S.; Turner, R.K. Changes in the global value of ecosystem services. Glob. Environ. Change 2014, 26, 152–158. [Google Scholar] [CrossRef]
- Foley, J.A.; DeFries, R.; Asner, G.P.; Barford, C.; Bonan, G.; Carpenter, S.R.; Chapin, F.S.; Coe, M.T.; Daily, G.C.; Gibbs, H.K.; et al. Global consequences of land use. Science 2005, 309, 570–574. [Google Scholar] [CrossRef]
- Song, W.; Deng, X. Land-use/land-cover change and ecosystem service provision in China. Sci. Total Environ. 2017, 576, 705–719. [Google Scholar] [CrossRef] [PubMed]
- Sannigrahi, S.; Bhatt, S.; Rahmat, S.; Paul, S.K.; Sen, S. Estimating global ecosystem service values and its response to land surface dynamics during 1995–2015. J. Environ. Manag. 2018, 223, 115–131. [Google Scholar] [CrossRef] [PubMed]
- Arowolo, A.O.; Deng, X.; Olatunji, O.A.; Obayelu, A.E. Assessing changes in the value of ecosystem services in response to land-use/land-cover dynamics in Nigeria. Sci. Total Environ. 2018, 636, 597–609. [Google Scholar] [CrossRef] [PubMed]
- Duan, X.; Chen, Y.; Wang, L.; Zheng, G.; Liang, T. The impact of land use and land cover changes on the landscape pattern and ecosystem service value in Sanjiangyuan region of the Qinghai-Tibet Plateau. J. Environ. Manag. 2023, 325, 116539. [Google Scholar] [CrossRef] [PubMed]
- Amindin, A.; Siamian, N.; Kariminejad, N.; Clague, J.J.; Pourghasemi, H.R. An integrated GEE and machine learning framework for detecting ecological stability under land use/land cover changes. Glob. Ecol. Conserv. 2024, 53, e03010. [Google Scholar] [CrossRef]
- Bessinger, M.; Lück-Vogel, M.; Skowno, A.; Conrad, F. Landsat-8 based coastal ecosystem mapping in South Africa using random forest classification in Google Earth Engine. S. Afr. J. Bot. 2022, 150, 928–939. [Google Scholar] [CrossRef]
- Lahon, D.; Sahariah, D.; Debnath, J.; Nath, N.; Meraj, G.; Kumar, P.; Hashimoto, S.; Farooq, M. Assessment of ecosystem service value in response to LULC changes using geospatial techniques: A case study in the Merbil wetland of the Brahmaputra valley, Assam, India. ISPRS Int. J. Geo Inf. 2023, 12, Article 4. [Google Scholar] [CrossRef]
- Pu, L.; Lu, C.; Yang, X.; Chen, X. Spatio-temporal variation of the ecosystem service value in Qilian Mountain National Park (Gansu area) based on land use. Land 2023, 12, Article 1. [Google Scholar] [CrossRef]
- Simeon, M.; Wana, D. Impacts of Land use Land cover dynamics on Ecosystem services in maze national park and its environs, southwestern Ethiopia. Heliyon 2024, 10, e30704. [Google Scholar] [CrossRef] [PubMed]
- Lahon, D.; Meraj, G.; Hashimoto, S.; Debnath, J.; Baba, A.M.; Farooq, M.; Islam, M.N.; Singh, S.K.; Kumar, P.; Kanga, S.; et al. Projected trends in ecosystem service valuation in response to land use land cover dynamics in Kishtwar High Altitude National Park, India. Landsc. Ecol. Eng. 2024. [Google Scholar] [CrossRef]
- Gupta, A. Analyzing land use/land cover dynamics in mountain tourism areas: A case study of the core and buffer zones of Sagarmatha and Khaptad national parks, Nepal. Sustainability 2024, 16, Article 23. [Google Scholar] [CrossRef]
- Rimba, A.B.; Atmaja, T.; Mohan, G.; Chapagain, S.K.; Arumansawang, A.; Payus, C.; Fukushi, K. Identifying land use and land cover (LULC) change from 2000 to 2025 driven by tourism growth: A study case in BALI. Int. Arch. Photogramm. Remote Sens. Spatial Inf. Sci. 2020, XLIII–B3, 1621–162. [CrossRef]
- Vijay, R.; Kushwaha, V.K.; Chaudhury, A.S.; Naik, K.; Gupta, I.; Kumar, R.; Wate, S.R. Assessment of tourism impact on land use/land cover and natural slope in Manali, India: A geospatial analysis. Environ. Earth Sci. 2016, 75, 20. [Google Scholar] [CrossRef]
- Qu, L.; Chen, Z.; Li, M.; Zhi, J.; Wang, H. Accuracy improvements to pixel-based and object-based LULC classification with auxiliary datasets from Google earth engine. Remote Sens. 2021, 13, Article 3. [Google Scholar] [CrossRef]
- Piao, Y.; Xiao, Y.; Ma, F.; Park, S.; Lee, D.; Mo, Y.; Jeong, S.; Hwang, I.; Kim, Y. Monitoring land use/land cover and landscape pattern changes at a local scale: A case study of Pyongyang, North Korea. Remote Sens. 2023, 15, Article 6. [Google Scholar] [CrossRef]
- Jarvis, A.; Guevara, E.; Reuter, H.I.; Nelson, A.D., 2008. Hole-Filled SRTM for the Globe: Version 4 : data grid. Available online: https://research.utwente.nl/en/publications/hole-filled-srtm-for-the-globe-version-4-data-grid.
- Abatzoglou, J.T.; Dobrowski, S.Z.; Parks, S.A.; Hegewisch, K.C. TerraClimate, a high-resolution global dataset of monthly climate and climatic water balance from 1958–2015. Sci. Data 2018, 5, 170191. [Google Scholar] [CrossRef] [PubMed]
- Breiman, L. Random forests. Mach. Learn. 2001, 45, 5–32. [Google Scholar] [CrossRef]
- Sankalpa, J.K.S.; Rathnayaka, A.M.R.W.S.D.; Ishani, P.G.N.; Liyanaarachchi, L.A.T.S.; Gayan, M.W.H.; Wijesuriya, W.; Karunaratne, S. Fusion of spectral and topographic features for land use mapping using a machine learning framework for a regional scale application. Environ. Monit. Assess. 2024, 196, 1030. [Google Scholar] [CrossRef] [PubMed]
- Piao, Y.; Jeong, S.; Park, S.; Lee, D. Analysis of land use and land cover change using time-series data and random forest in North Korea. Remote Sens. 2021, 13, Article 17. [Google Scholar] [CrossRef]
- Sarıkaya Levent, Y.; Şahin, E.; Levent, T. The role of tourism planning in land-use/land-cover changes in the Kızkalesi tourism destination. Land 2024, 13, Article 2. [Google Scholar] [CrossRef]
- Li, Y.; Liu, G.; Huang, C. Dynamic changes analysis and hotspots detection of land use in the central core functional area of Jing-Jin-Ji from 2000 to 2015 based on remote sensing data. Math. Probl. Eng. 2017, 2017, 2183585. [Google Scholar] [CrossRef]
- Kubiszewski, I.; Muthee, K.; Rifaee Rasheed, A.; Costanza, R.; Suzuki, M.; Noel, S.; Schauer, M. The costs of increasing precision for ecosystem services valuation studies. Ecol. Indic. 2022, 135, 108551. [Google Scholar] [CrossRef]
- Wang, Y.; Pan, J. Building ecological security patterns based on ecosystem services value reconstruction in an arid inland basin: A case study in Ganzhou District, NW China. J. Cleaner Prod. 2019, 241, 118337. [Google Scholar] [CrossRef]
- Sofue, Y.; Kohsaka, R. Conversion patterns of agricultural lands in plains and mountains: An analysis of underpinning factors by temporal comparison with geographically weighted regression in depopulating rural Japan. Environ. Sustain. Indic. 2024, 22, 100346. [Google Scholar] [CrossRef]
- Huang, W.; Hashimoto, S.; Yoshida, T.; Saito, O.; Meraj, G. Understanding Japan’s land-use dynamics between 1987 and 2050 using land accounting and scenario analysis. Sustain. Sci. 2024, 19, 1561–1577. [Google Scholar] [CrossRef]
- Iwaasa, Y. Current status and issues of protected areas (national parks, etc.) in Japan. Environmental Information Science 2022, 51, 27–32. [Google Scholar] [CrossRef]
Figure 1.
The location of the study site.
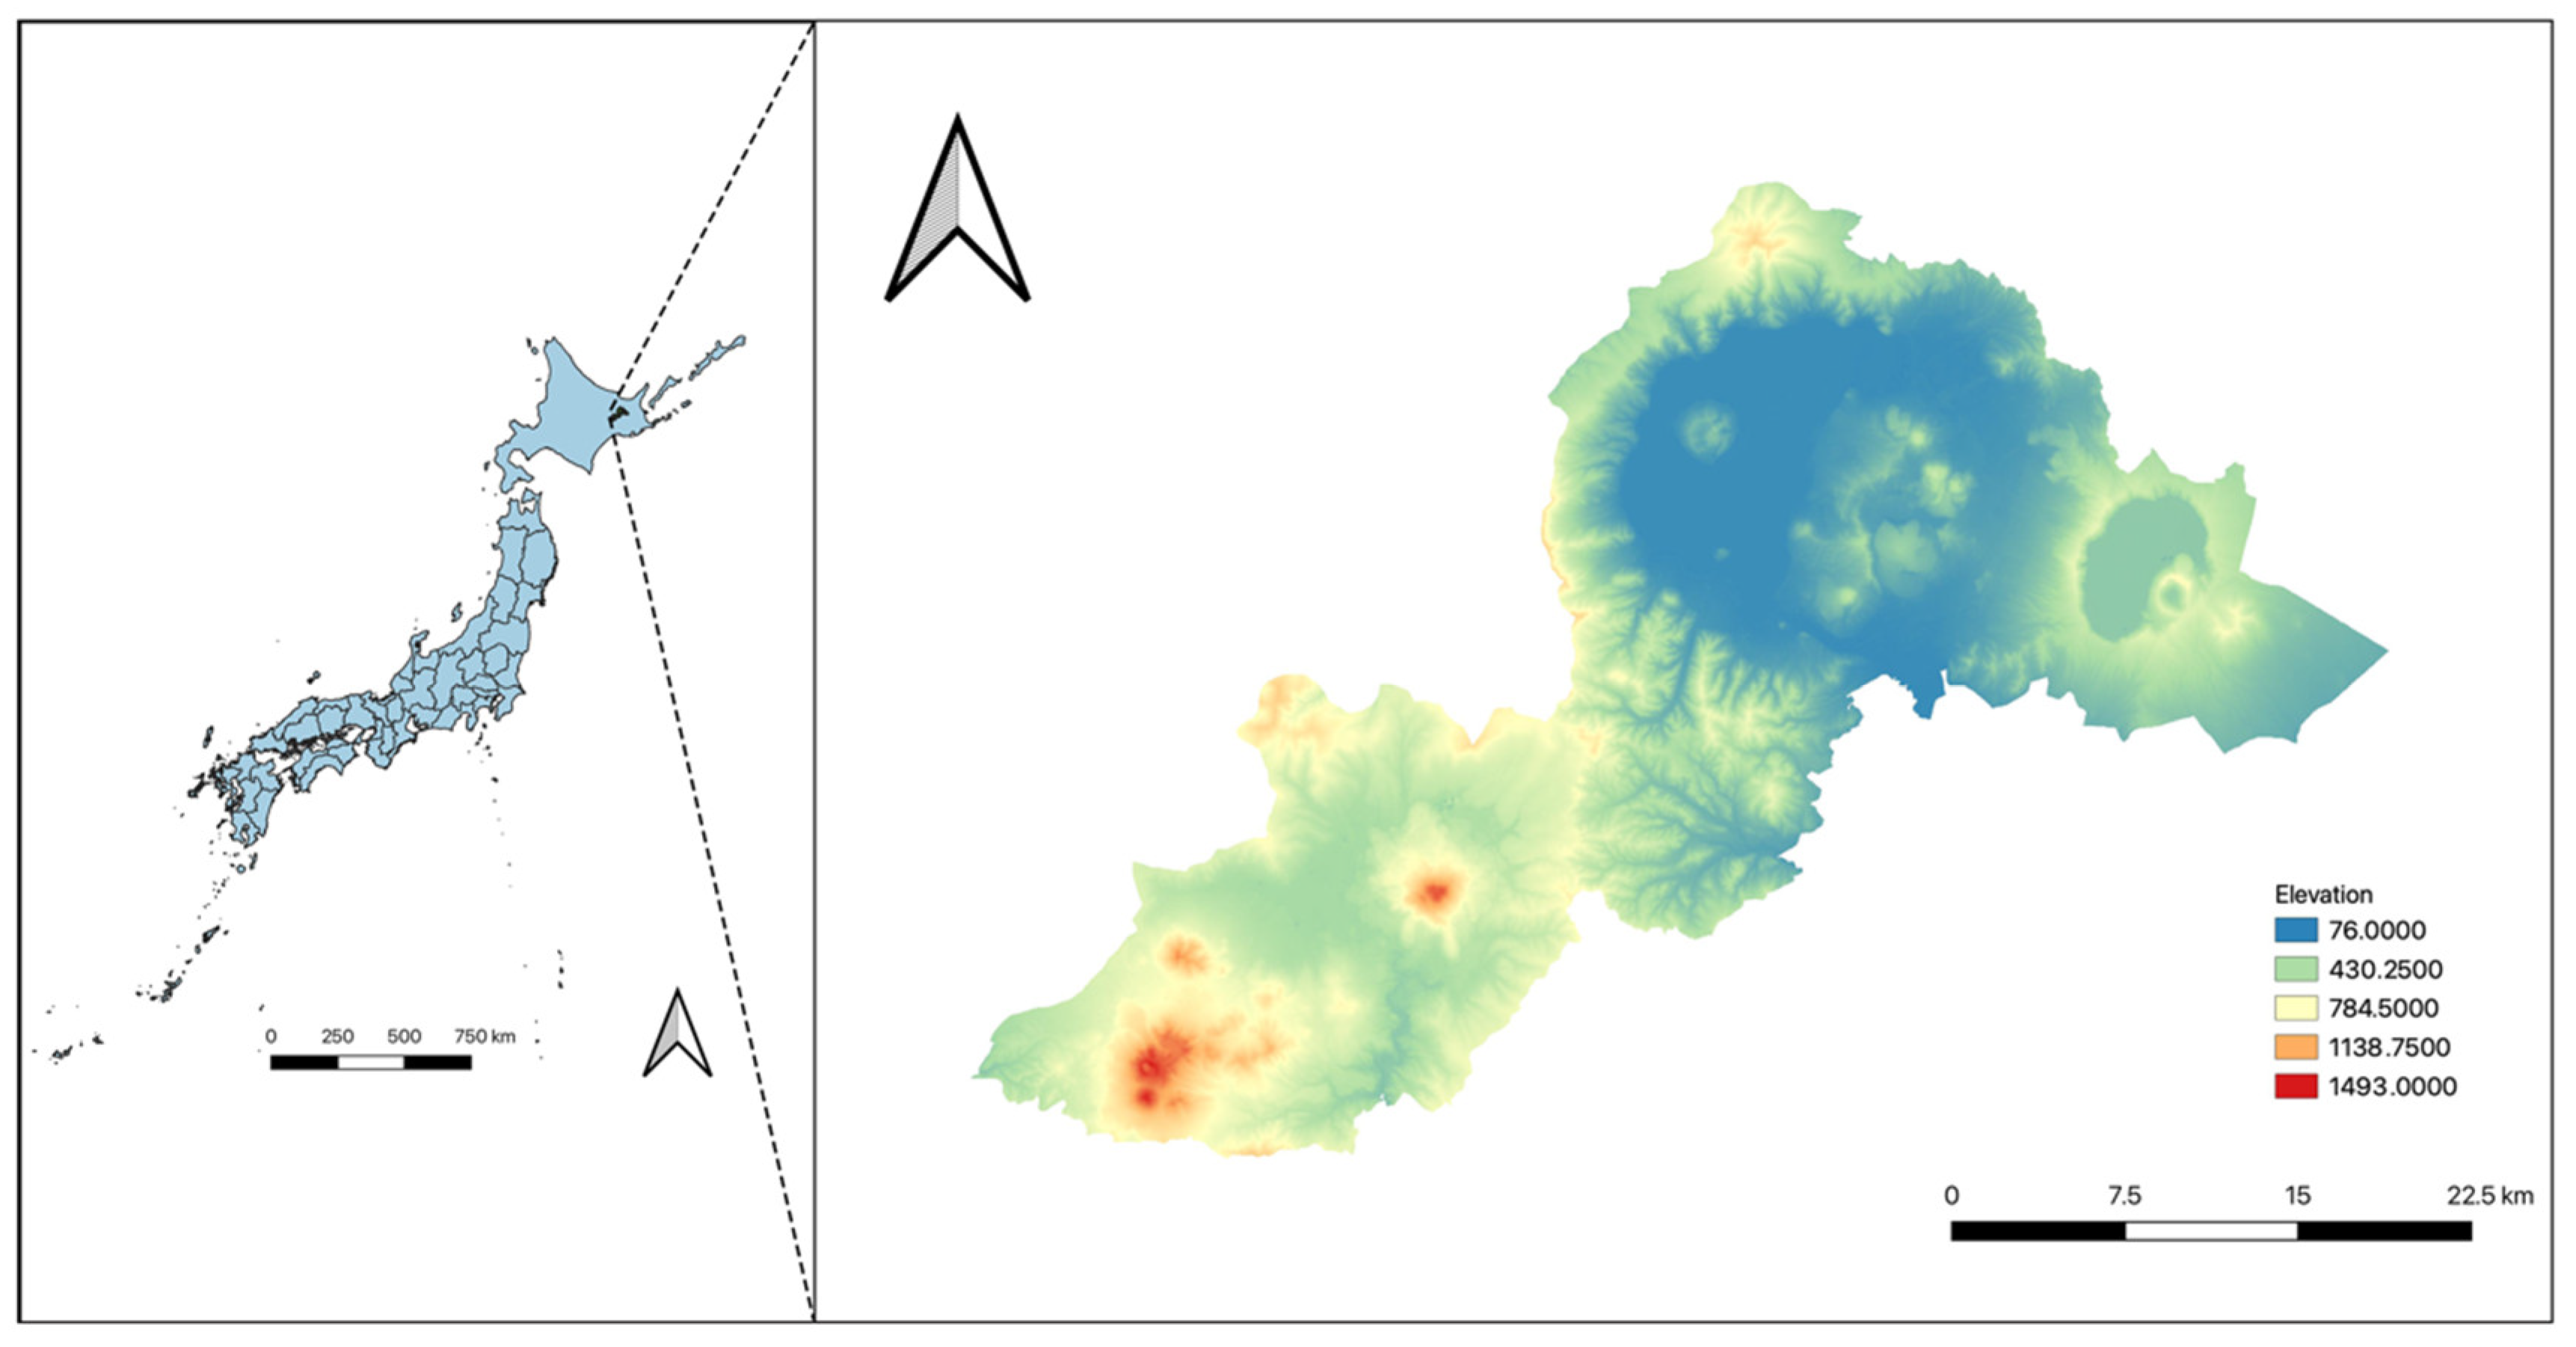
Figure 2.
Framework of this study.
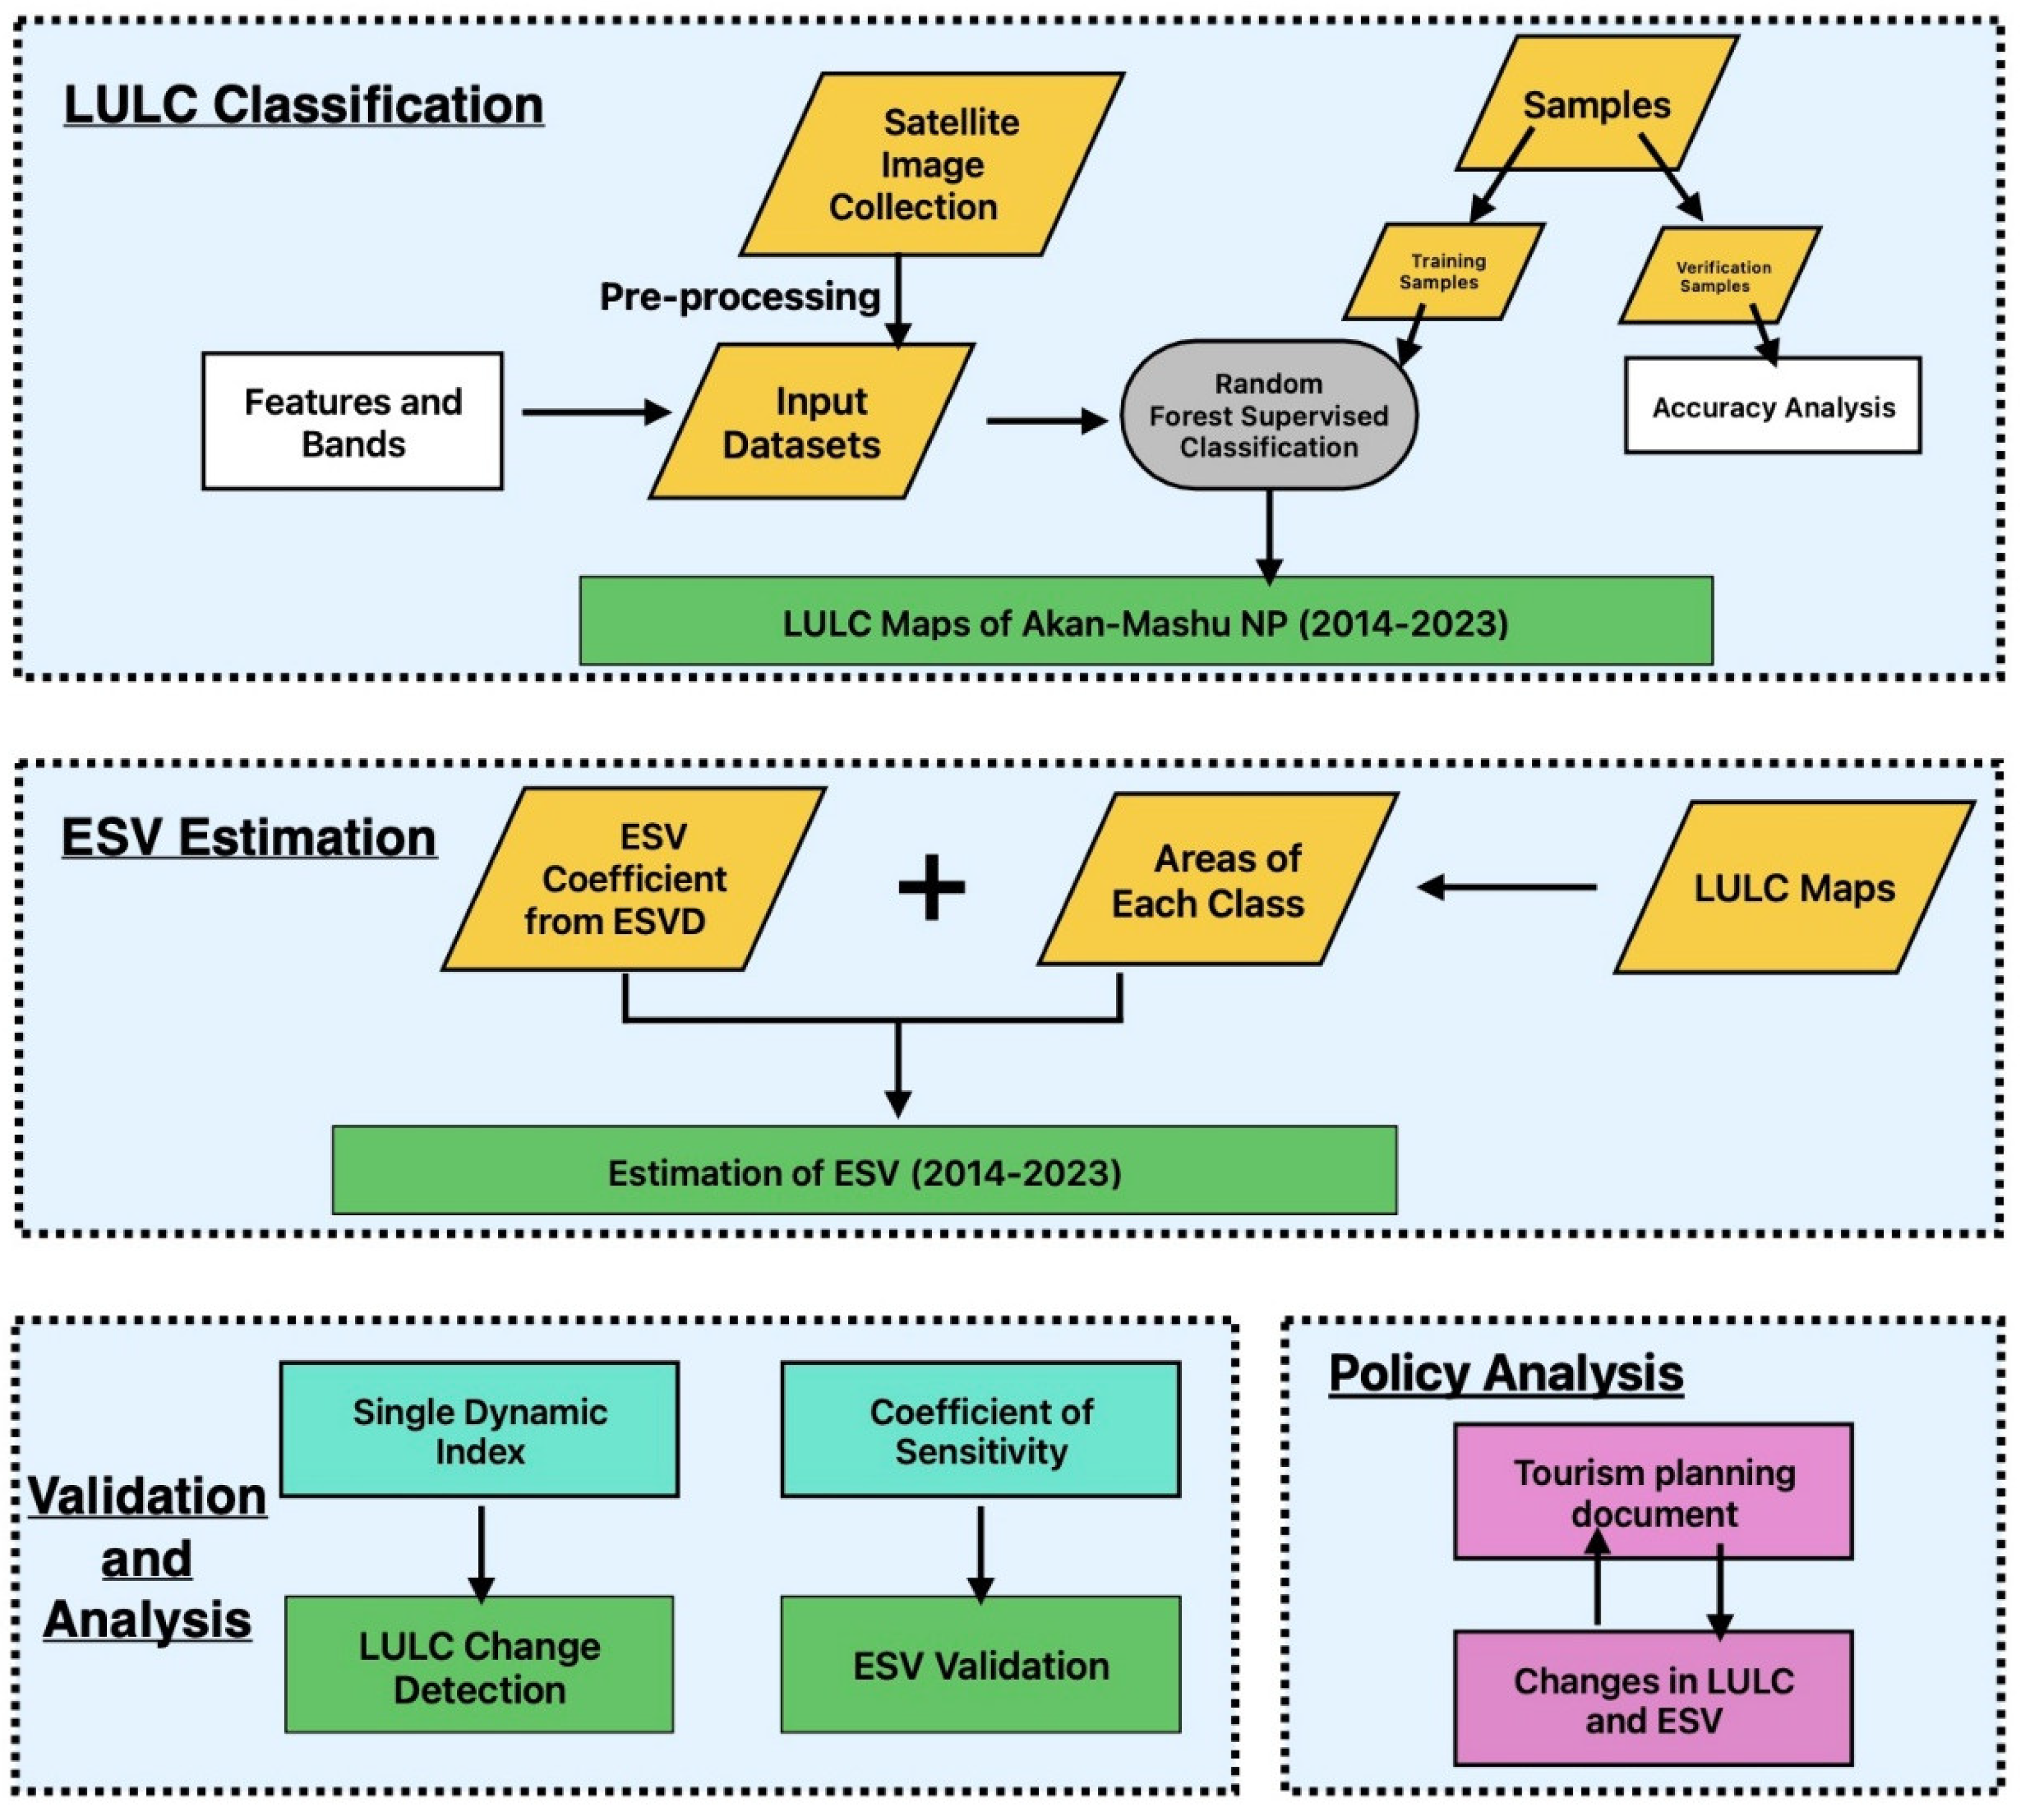
Figure 3.
LULC maps of 2014 and 2023.

Figure 4.
The proportion of land use types in the total study area.
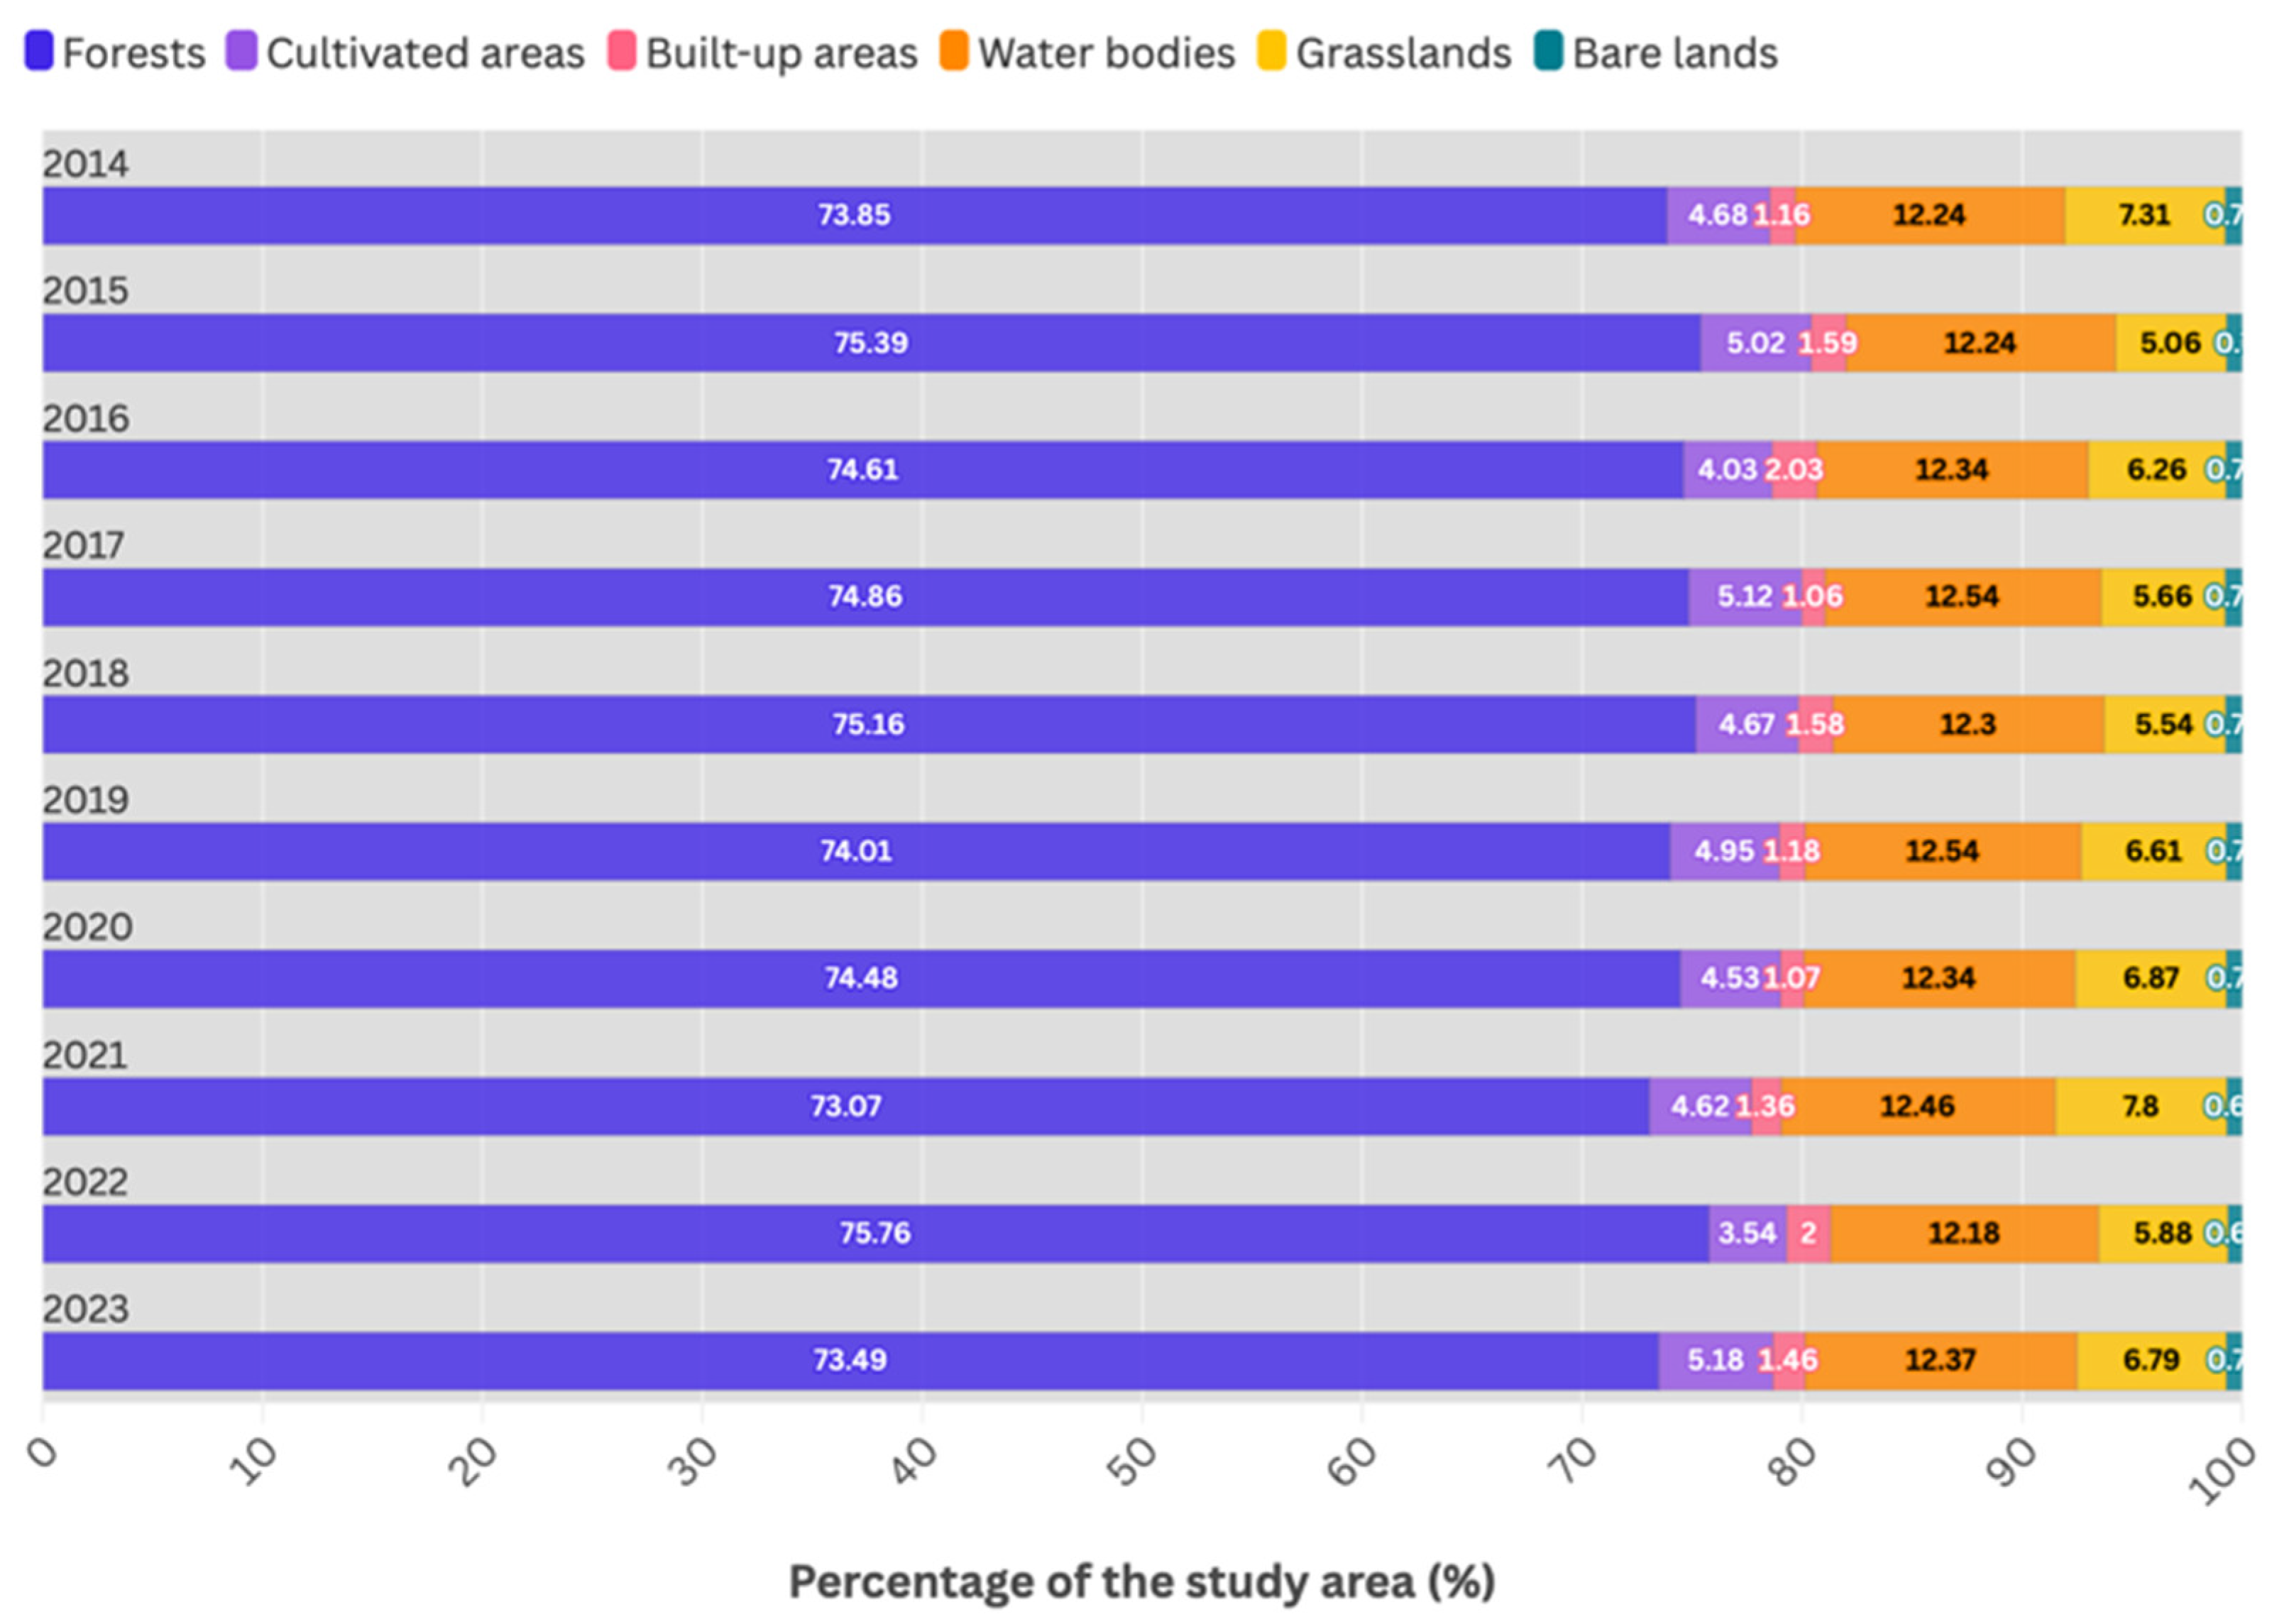
Figure 5.
The changing trend of the area of each land use type in the study period.
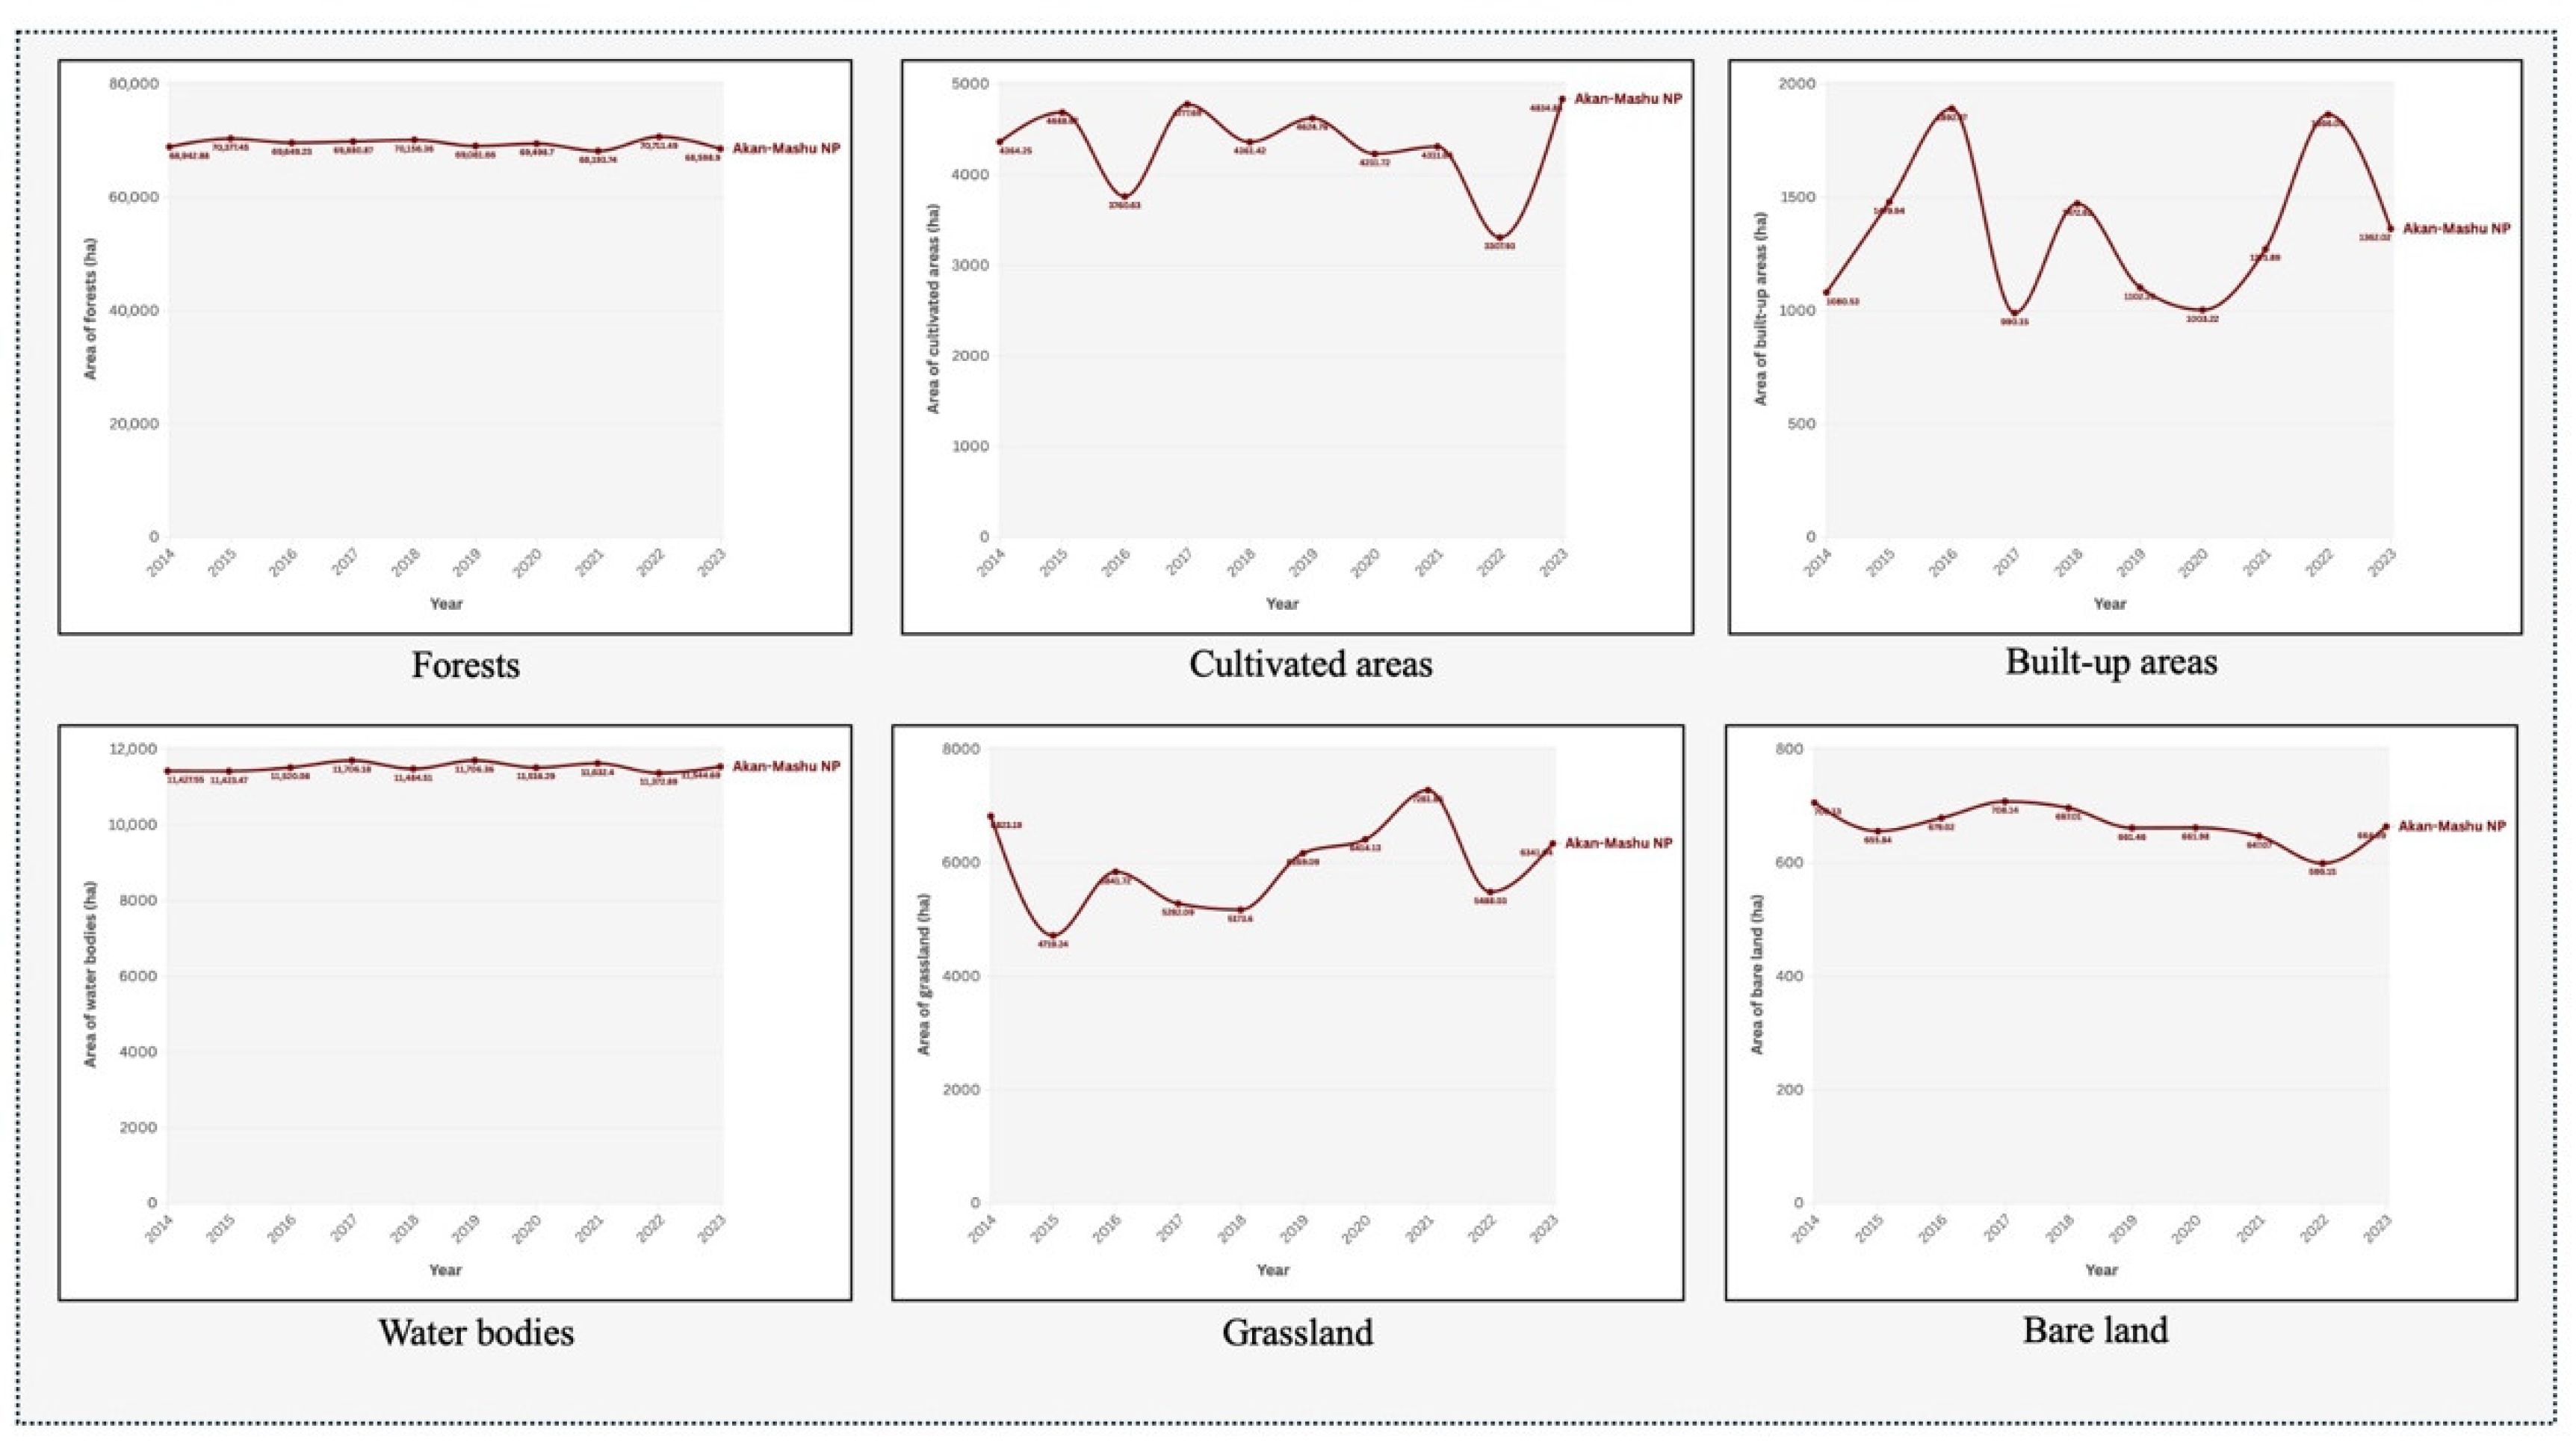
Figure 6.
ESV provided by different ecosystem service types and their proportions.
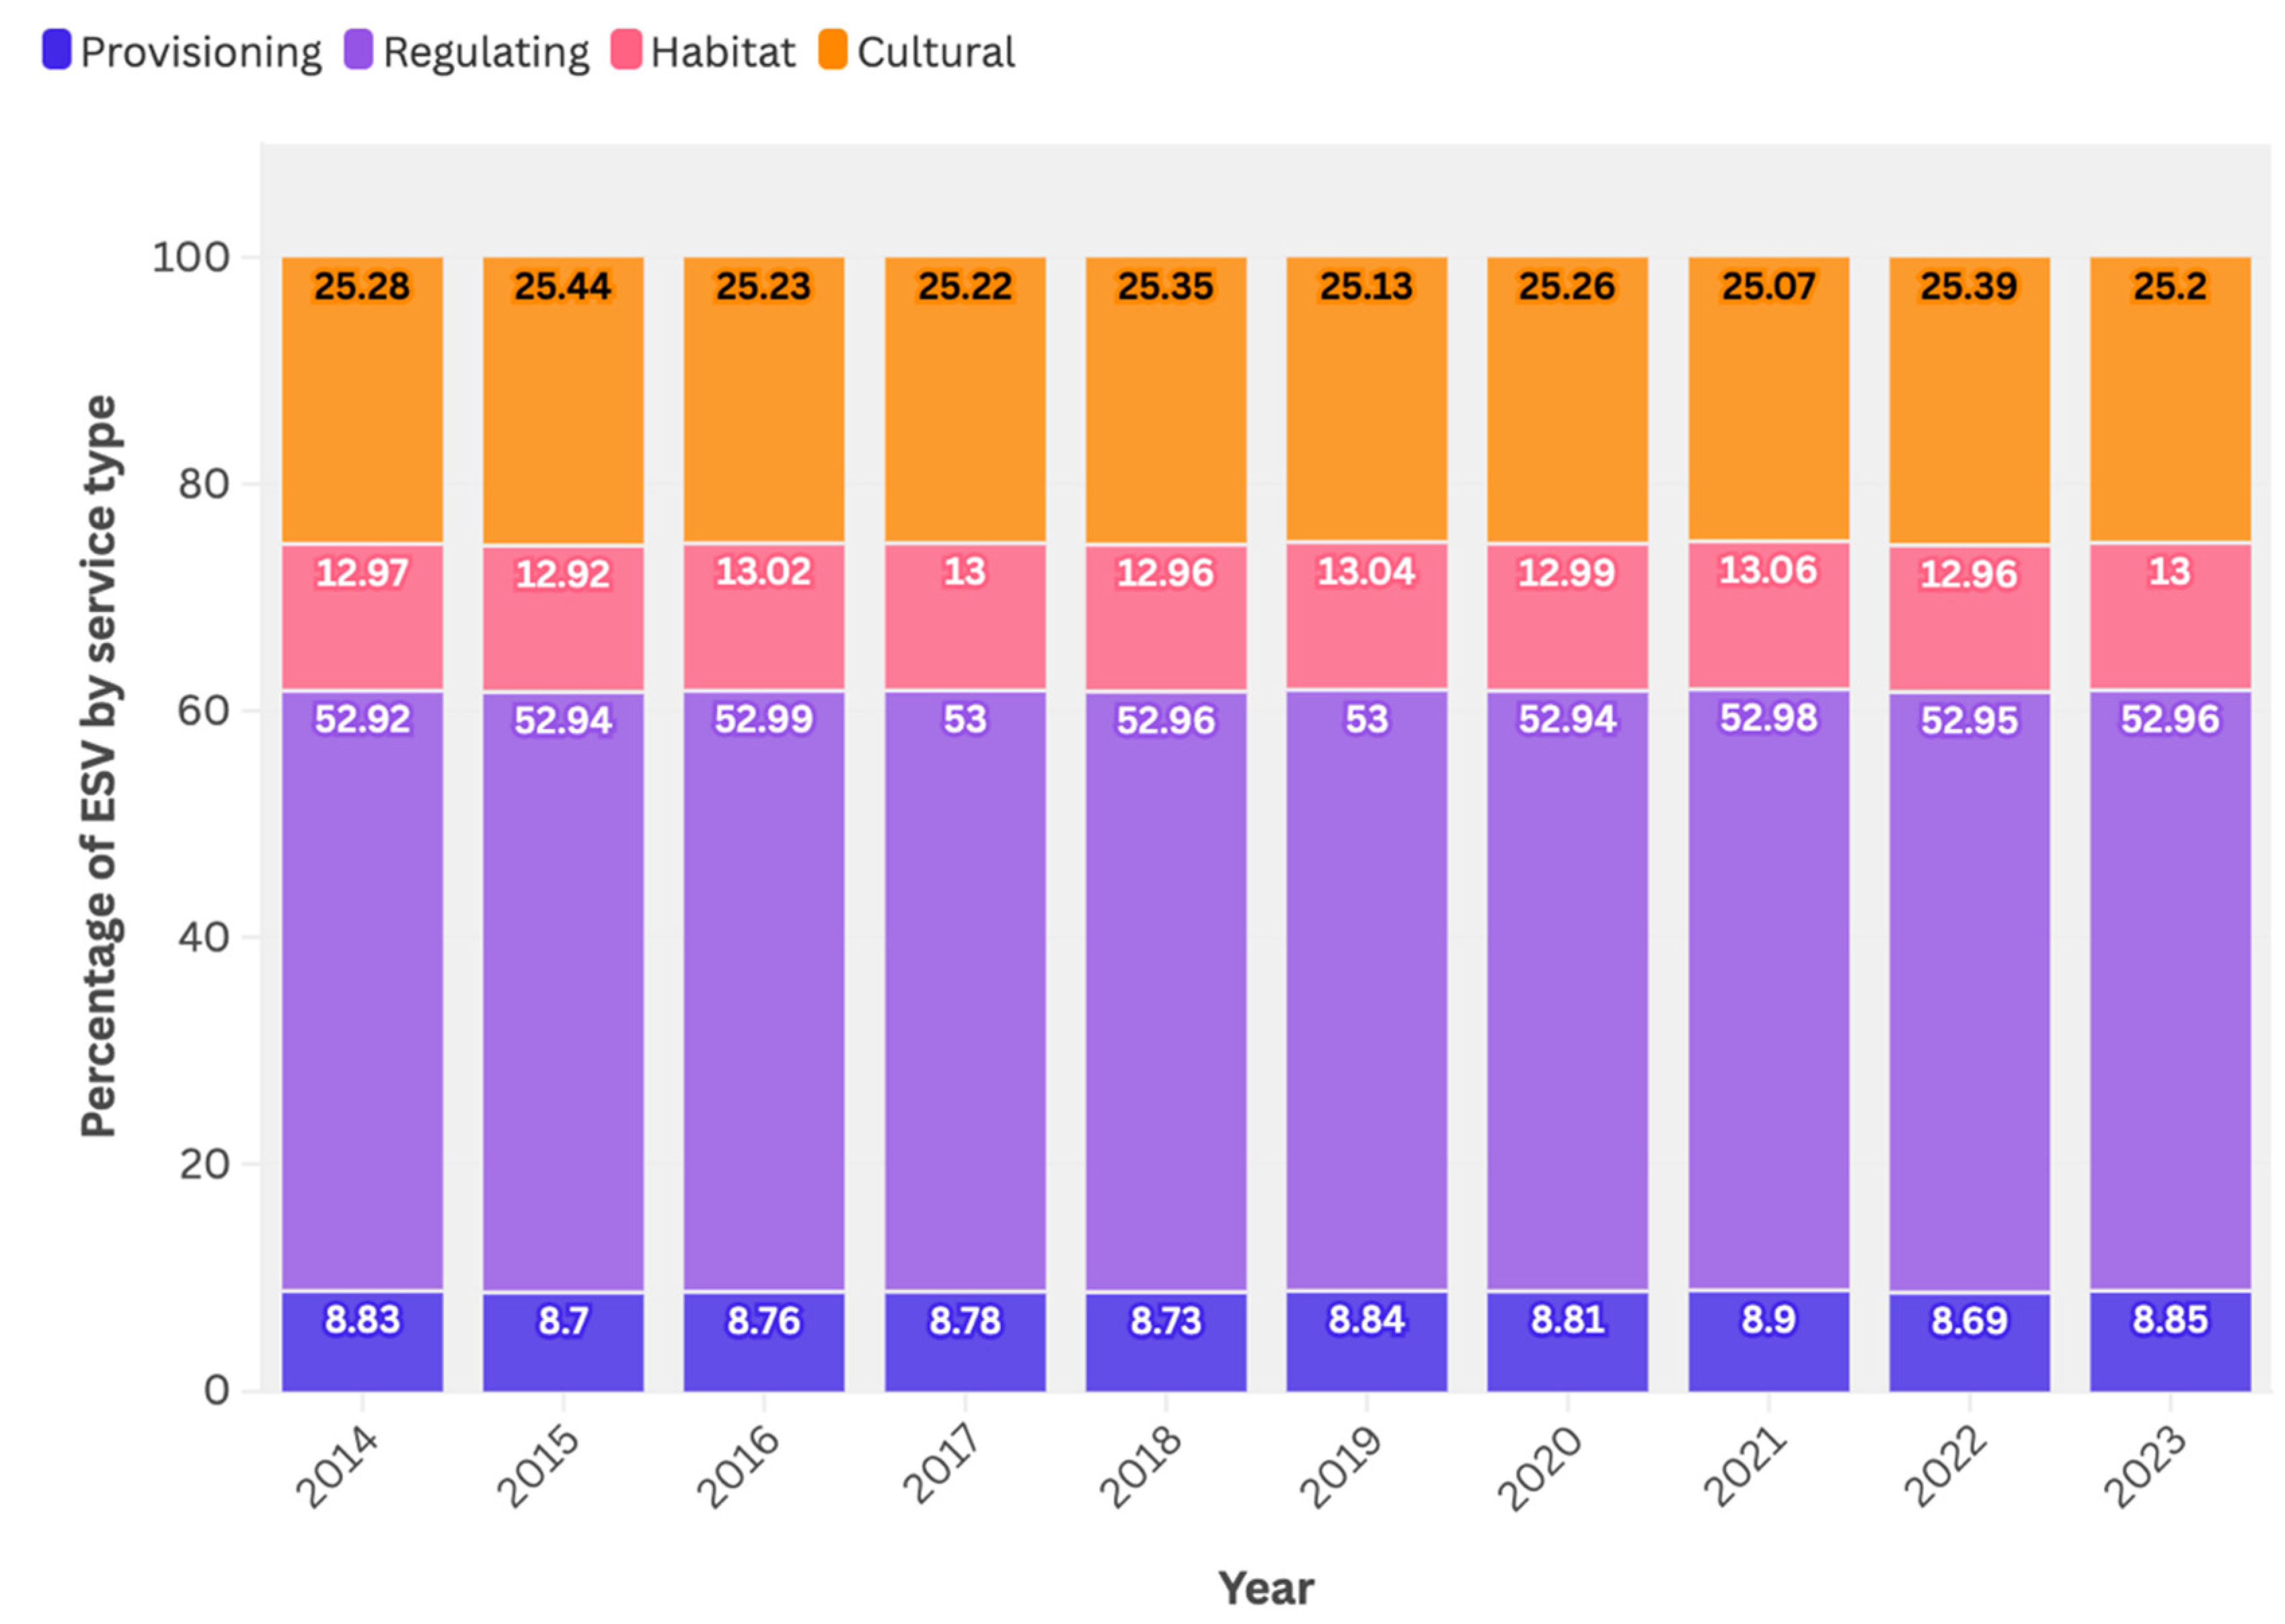

Table 1.
Zoning system in Akan-Mashu national park.
| Special Zone | Ordinary Zone | ||||
| Special Protection Zone | Class I Special Zone | Class II Special Zone | Class III Special Zone | ||
| Area | 10,460 | 20,718 | 24,299 | 17,386 | 18,550 |
| Proportion | 11.44% | 22.66% | 26.58% | 19.02% | 20.29% |
Table 2.
LULC classes in this study.
| LULC types | Referred biome from ESVD | Description |
| Forests | Temperate forests | Forests in the study area including plantation and non-plantation forests. |
| Cultivated areas | Cultivated areas | All land used for artificial cultivation and planting, including paddy fields, dry fields and greenhouse planting areas |
| Built-up areas | Desert | All artificial construction land, including buildings, parking lots and some hard paving. |
| Water bodies | Rivers and lakes | Rivers and lakes in the study area |
| Grassland | Grassland | Grasslands with scattered trees, herbs and shrubs |
| Bare land | Desert | Non vegetated area dominated by rock outcrops, eroded and degraded lands |
Table 3.
Features in the LULC classification.
| Features | Description | Data Source |
| Spectral features | Red, Green, Blue, Near-infrared (NIR), and Short-wave infrared (SWIR-1 and SWIR-2) spectral bands | Landsat 8 Surface Reflectance data |
| Spectral indices | Modified Normalized Difference Water Index (MNDWI), Normalized Difference Built-up Index (NDBI), Normalized Difference Vegetation Index (NDVI), Green Chlorophyll Index (GCI), Bare Soil Index (BSI), Index-Based Built-up Index (IBI) | Landsat 8 Surface Reflectance data |
| Topographic features | Elevation, slope, and aspect | Shuttle Radar Topography Mission (SRTM) digital elevation dataset |
| Climatic features | Soil moisture, runoff, minimum temperature, and vapor pressure | TerraClimate dataset |
| Gray-level co-occurrence matrix (GLCM) texture metrics | Mean (SAVG), Contrast (CON), Correlation (CORR), Variance (VARI) | Landsat 8 bands |
Table 4.
Coefficients for each land use type (original biome from the ESVD) per ecosystem service biome (Int$/hectare/year; 2020 price levels).
Table 4.
Coefficients for each land use type (original biome from the ESVD) per ecosystem service biome (Int$/hectare/year; 2020 price levels).
| Forests (Temperate forests) | Cultivatedareas (Cultivated areas) | Built-up areas (Desert) | Water bodies (Rivers and lakes) | Grassland (Grassland) | Bare land (Desert) | |
| Provisioning | ||||||
| Food | 4 | 510 | 0 | 2,288 | 0 | 0 |
| Water | 0 | 604 | 0 | 9,198 | 313 | 0 |
| Raw materials | 33 | 6 | 0 | 92 | 637 | 0 |
| Genetic resources | 0 | 0 | 0 | 0 | 0 | 0 |
| Medicinal resources | 0 | 0 | 0 | 0 | 0 | 0 |
| Ornamental resources | 0 | 0 | 0 | 0 | 0 | 0 |
| Regulating | ||||||
| Air quality regulation | 1,593 | 10 | 0 | 0 | 8 | 0 |
| Climate regulation | 481 | 10 | 0 | 251 | 73 | 0 |
| Moderation of extreme events | 6 | 993 | 0 | 18 | 0 | 0 |
| Regulation of water flows | 68 | 17 | 0 | 4,221 | 43 | 0 |
| Waste treatment | 0 | 40 | 0 | 50,760 | 0 | 0 |
| Erosion prevention | 6 | 173 | 0 | 0 | 0 | 0 |
| Maintenance of soil fertility | 117 | 34 | 0 | 6,189 | 0 | 0 |
| Pollination | 0 | 1498 | 0 | 0 | 0 | 0 |
| Biological control | 0 | 621 | 0 | 142 | 0 | 0 |
| Habitat | ||||||
| Maintenance of species’ life cycles (incl. nursery service) | 0 | 0 | 0 | 803 | 0 | 0 |
| Maintenance of genetic diversity | 0 | 0 | 0 | 17,987 | 0 | 0 |
| Cultural | ||||||
| Aesthetic information | 35 | 395 | 0 | 2,276 | 0 | 0 |
| Opportunities for recreation and tourism | 281 | 3,101 | 0 | 13,633 | 92 | 0 |
| Inspiration for culture, art and design | 196 | 16 | 0 | 310 | 284 | 0 |
| Spiritual experience | 0 | 0 | 0 | 76 | 0 | 0 |
| Information for cognitive development | 147 | 0 | 0 | 116 | 147 | 0 |
| Existence and bequest ‘values’ | 2,416 | 0 | 0 | 0 | 0 | |
| Sum | 5,383 | 8,026 | 0 | 108,361 | 1,597 | 0 |
Table 5.
Accuracy assessment results in 2014 and 2023.
| Year | 2014 | 2023 | ||
| PA | UA | PA | UA | |
| Forests | 93.88% | 86.79% | 96.55% | 80.00% |
| Cultivated areas | 96.88% | 83.78% | 87.18% | 89.47% |
| Built-up areas | 80.00% | 96.00% | 86.67% | 86.67% |
| Water bodies | 96.30% | 100.00% | 96.00% | 96.00% |
| Grassland | 87.10% | 96.43% | 84.38% | 96.43% |
| Bare land | 100.00% | 100.00% | 96.97% | 100.00% |
| Overall Accuracy | 92.15% | 90.96% | ||
| Kappa Coefficient | 90.42% | 89.12% |
Table 6.
Area of different land use types and their proportion of the total area during the study period.
Table 6.
Area of different land use types and their proportion of the total area during the study period.
| LULC class | 2014 | 2015 | 2016 | 2017 | 2018 | 2019 | 2020 | 2021 | 2022 | 2023 | ||||||||||
| area(hm2) | area(hm2) | area(hm2) | area(hm2) | area(hm2) | area(hm2) | area(hm2) | area(hm2) | area(hm2) | area(hm2) | |||||||||||
| Forests | 68942.8785 | 73.86% | 70377.4499 | 75.40% | 69649.235 | 74.62% | 69880.8654 | 74.86% | 70156.3573 | 75.16% | 69081.6613 | 74.01% | 69498.7014 | 74.47% | 68193.7356 | 73.06% | 70711.4947 | 75.75% | 68598.8978 | 73.49% |
| Cultivated areas | 4364.25052 | 4.68% | 4688.67459 | 5.02% | 3760.63177 | 4.03% | 4777.6933 | 5.12% | 4361.42325 | 4.67% | 4624.7566 | 4.95% | 4231.72013 | 4.53% | 4311.64218 | 4.62% | 3307.92823 | 3.54% | 4834.85305 | 5.18% |
| Built-up areas | 1080.53479 | 1.16% | 1479.93539 | 1.59% | 1892.46735 | 2.03% | 990.151991 | 1.06% | 1472.62318 | 1.58% | 1102.25916 | 1.18% | 1003.21742 | 1.07% | 1271.88982 | 1.36% | 1866.09296 | 2.00% | 1362.01801 | 1.46% |
| Water bodies | 11427.5531 | 12.24% | 11423.4668 | 12.24% | 11520.0819 | 12.34% | 11706.1796 | 12.54% | 11484.5071 | 12.30% | 11706.3583 | 12.54% | 11516.2852 | 12.34% | 11632.3961 | 12.46% | 11372.8875 | 12.18% | 11544.6874 | 12.37% |
| Grassland | 6823.1937 | 7.31% | 4719.23774 | 5.06% | 5841.72346 | 6.26% | 5282.09077 | 5.66% | 5173.59898 | 5.54% | 6169.09123 | 6.61% | 6414.13216 | 6.87% | 7281.84952 | 7.80% | 5488.03348 | 5.88% | 6341.037 | 6.79% |
| Bare land | 706.125799 | 0.76% | 655.837246 | 0.70% | 679.024175 | 0.73% | 708.143944 | 0.76% | 697.007179 | 0.75% | 661.455819 | 0.71% | 661.979856 | 0.71% | 647.074711 | 0.69% | 599.145504 | 0.64% | 664.08909 | 0.71% |
Table 7.
Coverage of LULC classes and changes in the study periods.
| Area (ha) in 2014 | Area (ha) in 2023 | Single dynamic index (2014-2023) | |
| Forests | 68942.87848 | 68598.89781 | -0.06% |
| Cultivated areas | 4364.250524 | 4834.85305 | 1.20% |
| Built-up areas | 1080.534794 | 1362.018005 | 2.89% |
| Water bodies | 11427.55309 | 11544.68741 | 0.11% |
| Grassland | 6823.193704 | 6341.036997 | -0.79% |
| Bare land | 706.1257991 | 664.0890898 | -0.66% |
Table 8.
ESV provided by different land use types and their proportions.
| Year | Forests | Cultivated areas | Built-up area | Water bodies | Grassland | Bare land | Sum | |
| 2014 | ESV | 371.12 | 35.03 | 0.00 | 1,238.30 | 10.90 | 0.00 | 1,655.34 |
| Proportion | 22.42% | 2.12% | 0.00% | 74.81% | 0.66% | 0.00% | ||
| 2015 | ESV | 378.84 | 37.63 | 0.00 | 1,237.86 | 7.54 | 0.00 | 1,661.87 |
| Proportion | 22.80% | 2.26% | 0.00% | 74.49% | 0.45% | 0.00% | ||
| 2016 | ESV | 374.92 | 30.18 | 0.00 | 1,248.33 | 9.33 | 0.00 | 1,662.76 |
| Proportion | 22.55% | 1.82% | 0.00% | 75.08% | 0.56% | 0.00% | ||
| 2017 | ESV | 376.17 | 38.35 | 0.00 | 1,268.49 | 8.44 | 0.00 | 1,691.44 |
| Proportion | 22.24% | 2.27% | 0.00% | 74.99% | 0.50% | 0.00% | ||
| 2018 | ESV | 377.65 | 35.00 | 0.00 | 1,244.47 | 8.26 | 0.00 | 1,665.39 |
| Proportion | 22.68% | 2.10% | 0.00% | 74.73% | 0.50% | 0.00% | ||
| 2019 | ESV | 371.87 | 37.12 | 0.00 | 1,268.51 | 9.85 | 0.00 | 1,687.35 |
| Proportion | 22.04% | 2.20% | 0.00% | 75.18% | 0.58% | 0.00% | ||
| 2020 | ESV | 374.11 | 33.96 | 0.00 | 1,247.92 | 10.24 | 0.00 | 1,666.23 |
| Proportion | 22.45% | 2.04% | 0.00% | 74.89% | 0.61% | 0.00% | ||
| 2021 | ESV | 367.09 | 34.61 | 0.00 | 1,260.50 | 11.63 | 0.00 | 1,673.82 |
| Proportion | 21.93% | 2.07% | 0.00% | 75.31% | 0.69% | 0.00% | ||
| 2022 | ESV | 380.64 | 26.55 | 0.00 | 1,232.38 | 8.76 | 0.00 | 1,648.33 |
| Proportion | 23.09% | 1.61% | 0.00% | 74.77% | 0.53% | 0.00% | ||
| 2023 | ESV | 369.27 | 38.80 | 0.00 | 1,250.99 | 10.13 | 0.00 | 1,669.19 |
| Proportion | 22.12% | 2.32% | 0.00% | 74.95% | 0.61% | 0.00% |
Table 9.
Amount of change of ESV in the study period (unit: million USD).
| 2014-2023 | |
| Forests | -1.85 |
| Cultivated areas | 3.78 |
| Built-up area | 0.00 |
| Water bodies | 12.69 |
| Grassland | -0.77 |
| Bare land | 0.00 |
| Total | 13.85 |
Table 10.
Ecosystem service value sensitivity index by land type in study areas.
| Forests | Cultivated areas | Water bodies | Grassland | Built-up area | Bare land | |
| 2014 | 0.2242 | 0.0212 | 0.7481 | 0.0066 | - | - |
| 2015 | 0.2280 | 0.0226 | 0.7449 | 0.0045 | - | - |
| 2016 | 0.2255 | 0.0182 | 0.7508 | 0.0056 | - | - |
| 2017 | 0.2224 | 0.0227 | 0.7499 | 0.0050 | - | - |
| 2018 | 0.2268 | 0.0210 | 0.7473 | 0.0050 | - | - |
| 2019 | 0.2204 | 0.0220 | 0.7518 | 0.0058 | - | - |
| 2020 | 0.2245 | 0.0204 | 0.7489 | 0.0061 | - | - |
| 2021 | 0.2193 | 0.0207 | 0.7531 | 0.0069 | - | - |
| 2022 | 0.2309 | 0.0161 | 0.7477 | 0.0053 | - | - |
| 2023 | 0.2212 | 0.0232 | 0.7495 | 0.0061 | - | - |
Table 11.
Local measures to promote tourism as of 2020.
| Main types of measures | Specific implementation measures | Selected Cases Description |
| Promoting Adventure Travel (AT) | AT is positioned as an important target. As a result of aggressive activities to attract visitors, the Adventure Travel World Summit (ATWS) will be held in Hokkaido in 2021. | The first Adventure Connect event was held in Sapporo in September 2017 to promote networking with people involved in AT. Activity counter opened in a private hotel as a base for AT in the Akan area in 2018. |
| New Use of the National Park | The project promoted new utilization of previously unused resources and areas of national parks, considering the conservation of the natural environment. | From 2020, guided trekking tours will be offered on Atosanupuri, which had been off-limits to hikers, with rules based on the Ecotourism Promotion Act. From June 2019, a guided trail from Uramashu Observatory to Kaminoko-ike Pond will begin. |
| Promote private investment through public-private partnerships | The project to fully enjoy the national park has encouraged new private investment from within and outside the region, and efforts to revitalize the region have progressed. | In 2018 and 2019, trial glamping at Wakin Campground in cooperation with private operators to study effective use of the off-season. |
| Development of public spaces | Reorganization and multilingual support were promoted to ensure stress-free and comfortable use of public facilities such as visitor centers, park grounds, and restrooms within national parks, which are frequently used by many travelers. | Reorganization of the boardwalk and installation of camping decks in 2020. |
Disclaimer/Publisher’s Note: The statements, opinions and data contained in all publications are solely those of the individual author(s) and contributor(s) and not of MDPI and/or the editor(s). MDPI and/or the editor(s) disclaim responsibility for any injury to people or property resulting from any ideas, methods, instructions or products referred to in the content. |
© 2025 by the authors. Licensee MDPI, Basel, Switzerland. This article is an open access article distributed under the terms and conditions of the Creative Commons Attribution (CC BY) license (http://creativecommons.org/licenses/by/4.0/).
Copyright: This open access article is published under a Creative Commons CC BY 4.0 license, which permit the free download, distribution, and reuse, provided that the author and preprint are cited in any reuse.


