Submitted:
16 January 2025
Posted:
17 January 2025
You are already at the latest version
Abstract
Innovation through applied research is a valuable component of decision-making, as it alters process parameters and conditions that can be detected by special devices at high speed. In the case of materials such as steel, the thermal field analysis while a component is being heat treated is essential for controlling the evolution of its microstructure and its state of internal stresses. The mathematical models proposed in the observation of the behaviour of this material can be consolidated by being implemented in computational systems that can be validated with physical measurements and, once a low uncertainty in the state predictions is acquired, established as management tools. In this sense, the recording of thermal histories represents a fundamental methodology to achieve the objective of diagnosing the result of handling the material. In this regard, it is proposed to implement automated testing devices that implement computer systems for recording, processing, calculating, estimating and transferring data to transform production lines' efficiency by optimising or cancelling continuity. A prototype for measuring thermal histories with a degree of reproducibility and mitigation of systematic errors is presented as a utility model for analysing the thermal processing of steels.
Keywords:
decision‐making
; automated prototype for analysis
; heat treatment of steel
; computational application
1. Introduction
Innovation through applied research is a valuable component of the concept of decision-making, as process parameters and conditions are altered and can be detected by special devices at high speed. At the beginning of the 21st century, ASTM D6200 D6482 and D6549 [1,2,3] standards were issued, in which commercial test procedures and devices (Drayton and Tensi) were defined for determining the cooling potential of oils and polymeric solutions. These tests evaluate the phases of the heat extraction capacity by analysing cooling curves using a nickel alloy 600 (UNS N06600) test piece of standard dimensions. During the same period of publication of the standards, proposals arose to perform cooling curve analysis using inverse heat conduction problems (IHCP). In this process, Hernández-Morales et al. [4] proposed using steel with a very low content of alloying elements called interstitial-free to manufacture test specimens. This alloy change made the material properties more closely adjusted to thermally treatable alloys, unlike those of Inconel 600 and AISI 304 stainless steel. This analysis method was incorporated into the development of Meekisho et al. [5], called WinProbe, due to the visual environment in the Windows environment of the application.
In the case of materials such as steel, the thermal field analysis while a component is being heat treated is essential for controlling the evolution of its microstructure and its state of internal stress. The mathematical models proposed in the observation of the behaviour of this material [6,7,8,9,10,11,12] can be consolidated by being implemented in computational systems that can be validated with physical measurements and, once a low uncertainty in the state predictions is achieved, established as management tools. In this sense, the recording of thermal histories represents a fundamental methodology to achieve the objective of diagnosing the result of handling the material.
In 2010, Felde et al. [13] reported the development of a new application with a graphical user interface called SQi software with similar features to WinProbe. In addition to the IHCP solution obtained from recorded thermal responses, the researchers extended the analysis to the microstructural field through formulations of the nonlinear additivity principle based on time-temperature-transformation curves or TTT diagrams. In addition, this allowed them to correlate the final state of the treated steel with the determination of mechanical properties. However, the test technique was limited to the procedure defined in the ISO 9950 standard, in which a device similar to the Drayton unit is used with a strong component of manual manipulation and, therefore, with a high possibility of introducing systematic errors in each test performed. Additionally, it is not clearly explained how the heat transfer coefficient functions are modified depending on the surface temperature.
In this regard, it is proposed to implement automated testing devices that implement computer systems for the recording, processing, calculation, estimation, and transfer of data, which would allow for the transformation of the efficiency of production lines by optimisation or by cancellation of continuity. A prototype for measuring thermal histories with a degree of reproducibility and mitigation of systematic errors includes the availability of a heating device designed to optimise the use of energy, a reliable data acquisition system, and an infrastructure that allows handling and processing samples in combination with various cooling systems governed by standards.
2. Materials and Methods
Progress towards project consolidation requires the completion of stages that support the quality of information generation for the decision-making process. Therefore, this paper presents the details of 1) the design and manufacture of the heating furnace, 2) the partial development of software for processing and generating relevant data, and 3) the design and construction of the sample handling prototype.
2.1. Manufacture of Heating Furnaces
The so-called electric resistance heating furnaces are those that obtain heat energy through materials that are heated by the Joule effect. In this way, the high-temperature resistors transfer heat predominantly by radiation to the load placed inside the furnace (hearth). According to the equipment built in a semi-open scheme, conditions are usually present in which temperatures of 1200 °C can be reached in the exposed materials. The electric resistors can typically be made of wound wire. In particular, the alloy called Kanthal A1 was selected to manufacture the resistors with a spiral arrangement, although other materials and shape arrangements are available [14].
The basis for the design of the furnace operating with electrical energy is the knowledge of the calculated heat output considering heat flow in a steady state. Therefore, knowledge of the constituent parts of the furnace is required based on a geometric design. Each part’s material implicitly dictates thermal conductivity properties and specific heat capacity, so the general heat balance equation can be strategically applied under maximum test temperature conditions in a room temperature environment.
The definition of the wall structure and spaces required for the primary operations of the furnace is the source of information necessary for the computer application developed for calculating the thermal power. The magnitude of the calculated thermal power is related to Ohm’s law, which determines the magnitude of the electrical resistance, which is associated with the physical characteristics and wire conformation shape, including the total estimated length with the technical data of ohmic resistance. According to the above, a cylindrical armoured furnace was designed and built, with a concentric enclosure of refractory walls to efficiently heat steels to their test temperature in the austenitic phase.
Therefore, references to construction materials and their thermophysical properties were obtained, a part’s design was carried out using the graphical interface of the COMSOL Multiphysics® program [15] to build the steady-state heat transfer computational case study (CAE), and various simulation cases were executed with modifications to obtain an optimal use so that the temperatures of interest reached in the test samples were as homogeneous as possible. Once the design was decided, the quotation and procurement of materials, consumables and specialised services by third parties necessary for the furnace construction were carried out. Subsequently, start-up and operation tests were carried out. Figure 1 shows the design diagram for determining the construction of a furnace.
2.2. Programming Thermal and Microstructural Evolution Models from Thermal Histories
Analyzing the thermal cycle curves recorded during heating operations with the designed furnace and cooling assisted by the fluid sources specified in the standard test procedures requires mathematical models representing the phenomenology of heat transfer. For iron material, it has been shown that, in cylindrical samples with a 4:1 length-diameter ratio, the preferred direction of heat flow is radial, thus reducing the complexity of the mathematical treatment in one dimension. Therefore, as part of the process of integrating models into the prediction system, the project developed the programming of the solution of the distribution of radial isotherms in a transient state without the effect of internal heat sources or wells using the finite difference method, as defined in Figure 2 [16,17]. The calculation results were easily verified with the results of an equivalent model processed with COMSOL to give it reliability.
Subsequently, exclusive models of austenite-martensite and austenite-pearlite transformation during cooling of a corresponding steel were considered. Therefore, the approach in Figure 2 was modified by assigning to the calculation component of heat generated or absorbed by the nature of the transformation, [18]. The corresponding approaches are merged with a mathematical strategy to account for the evolution of the phases in the austenite-pearlite-martensite sequence and, in a more complex modification, other possible transformations that are not considered in the scope of this initial work.
2.3. Programming the Thermal Evolution Model by Estimating Boundary Conditions
Before considering the microstructural phase transformations, it should be noted that the temperature distribution was calculated by determining the interaction condition at the boundary between the solid body and the medium in which it is immersed. This boundary condition establishes the speed at which heat flows in any direction of the radial direction and, therefore, the speed at which the temperature changes in each isotherm. The concept of heat transfer coefficient has characterized the boundary conditions; however, this information is not always available when performing thermal evolution analyses.
The solution model for the inverse heat conduction problem (IHCP) was proposed as an implicit methodology for determining thermal boundary conditions in this project. Initially, the same case as in Figure 2 was adopted and represented by the approach in Figure 3.
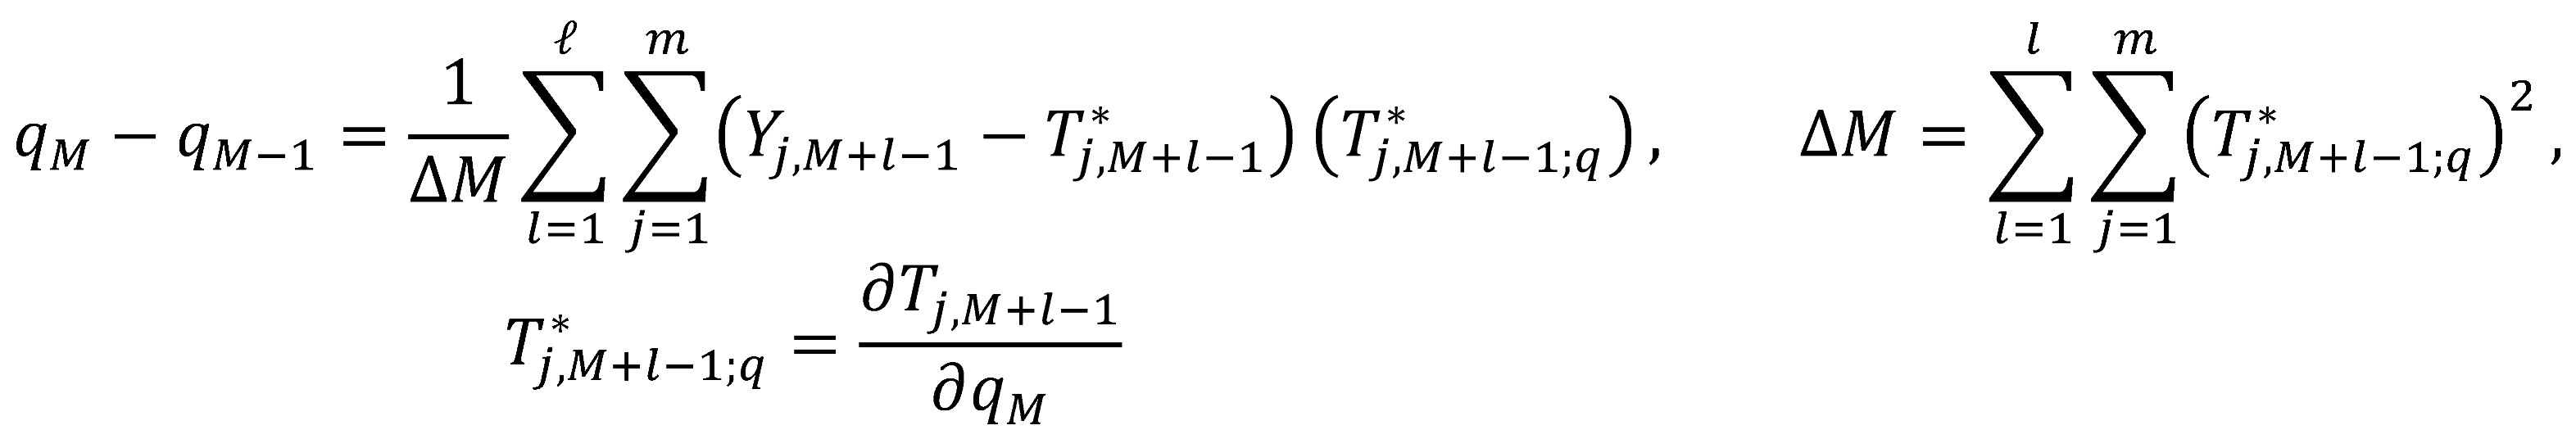
Specifying a Neumann-type condition to describe the complete transient process of heat transfer implies formulating an objective function as the least squares standard defined by Equation 1.
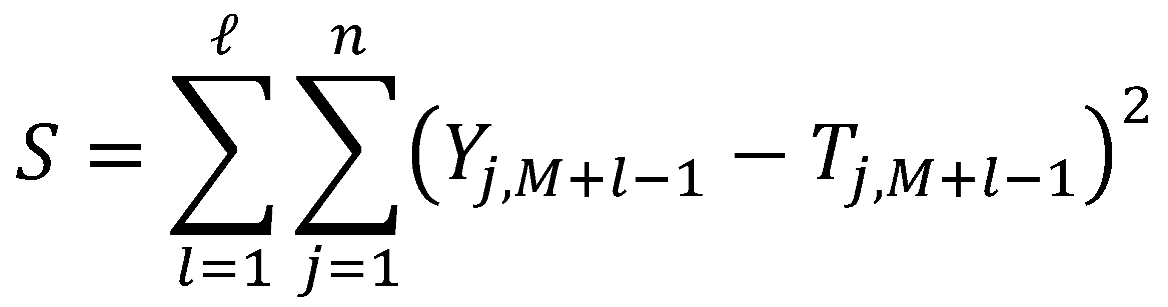
The methodology developed for the mathematical model in Figure 2, from Equation 2, assists in solving the model in Figure 2, as detailed by Téllez-Martínez et al. [19].
Determining specific thermal boundary conditions provides the appropriate characterisation means to evaluate mathematical models of microstructural evolution. Therefore, subsequent projects to this work will also modify the approaches to heat transfer models by considering the effects of heat sources or sinks in estimating thermal boundary conditions.
2.4. Programming the Thermal and Microstructural Evolution Model
A microstructural evolution feature of the iron-carbon system can be classified as a crystallographic phase transformation called martensite. In this case, the adopted structure is comparatively deformed, as expected under equilibrium conditions. The newly induced morphology generates a large amount of concentrated stresses and, consequently, the feasibility of developing cracks that cause fractures when propagating. However, this condition is promoted by the magnitude of the hardness obtained in the steel. The transformation percentage will depend on the susceptibility of the steel grade and the control of the heat treatment in the sample. Although the transformation is athermal, there is a need to know a priori the fraction of the transformed phase based on the evolution of the temperature field in the treated object in each section of the same [20].
In experimental processes, detailed instrumentation on the valued sample is impossible. Excess sensors significantly interrupt the solid’s continuity; therefore, the measurements cannot be considered close to the actual phenomenon. For this reason, the calculation of the temperature distribution is required by solving the inverse heat conduction problem, which is developed with at least one recorded thermal history. Consistent with the calculation of the temperature history distribution using the approach in Figure 4a, the possible evolution of the martensitic structure can be detected by superimposing it on phase transformation diagrams by continuous cooling, as clearly illustrated in Figure 4b, where the possible trajectory of the cooling curve determines the avoidance of crossing the equilibrium lines of transformation to phases such as pearlite and bainite.
Therefore, once the austenite-martensite evolution has been verified, it can be calculated in terms of the fraction of the transformed solid because the athermal transformation kinetics is very well approximated by the Koistinen-Marburger equation [21,22,23,24], for which the corresponding algorithm programming was developed.
Similarly, the evolution of diffusive phases, such as the austenite-pearlite transformation, can be modelled according to the Avrami additivity principle and the information provided by Continuous Cooling Phase Transformation (CCT) diagrams. However, Time-Temperature-Transformation (TTT) diagrams can also be applied under isothermal cooling conditions. The problem statement is defined in Figure 5a, and the additivity principle based on the Johnson-Mehl-Avrami-Kolmogorov (JMAK) equation is presented in Figure 5b in the schematic of a TTT diagram [26]. In this case, the cooling curves or thermal histories intersect the transformation equilibrium lines.
The development of equipment construction and computer programs obtained an appropriate direction towards automating tests to analyse data relevant to steel processing by recording thermal histories. Steel heat treatment processes are developed in a state of high added value of components; therefore, knowledge of the microstructural evolution is required based on the speed of temperature change [27,28].
2.5. Design of the Positioning System for Steel Probes
Simultaneously with the advances in the design of the furnace and the programming, verification and validation of mathematical models, the dimensions and construction characteristics of the horizontal and vertical sample displacement system were established by installing two ball screw linear stage equipment for loads of up to 5 kg, which controllers, switches and a power source assist.
The main equipment was implemented with the following:
-
2 -FUYU ball screw linear stage
- o
- X - Model FSL120-C710 E1000 BC B86 - Nema 34 3-phase stepper motor 128 mm length Model FMDT220A42NOM
- o
- Z - Model FSL80-C710 E800 BC B60S - Nema 24 2-phase brake motor Model FMDD50D40NOM
- 3-axis controller Model FMC4030
- 100W DC power supply Model LRS-100-24
- Limit Switch NPN-NO
- Cable chain, brackets and screws
- 2 m aluminium frame height
3. Results
Once the equipment is fully consolidated in the next stage, it will be subjected to the requirements of industrial-level tests to establish it as a utility model.
In modelling and validating the furnace’s operation, the heating of a 0.5-inch diameter and 2-inch long AISI 304 stainless steel test piece was simulated. In the confined space for heating, the test piece was placed at the geometric centre, and the solution of a combined heat transfer problem by radiation, conduction, and convection mechanisms was considered until reaching a stable state. As a result, the temperature distribution was calculated to define isothermal profiles that determine the critical temperatures in the test piece and the furnace shell. The test piece’s thermal homogeneity is fundamental, while the casing’s primary interest is the user’s safety. The lowest temperature value in the test piece was determined at the coupling of the guide tube, and the maximum value in the casing was located on the lower surface, considered an area of low contact with the user. The guide tube was also manufactured from the same steel as the test piece and fitted with a fastening clamp. Figure 6a,b show the isotherm and contour plots of the temperature distribution simulation in the designed furnace. The semi-rectangular shape of the isotherms in the steady-state heating process originated from the dissipation effect at the corners or edges of the shell. Table 1 summarises the critical temperatures in degrees Celsius from the CAE simulation and the recording of K-type thermocouples with a 1 mm diameter OMEGA KMTXL-IM100G-450. The thermocouple in the probe was embedded through a borehole near the subsurface at mid-height (see Figure 6c), while measurements on the casing were obtained by contact. Thermal history records were obtained with an IOTech TemScan/1100 data logger at 10 readings per second.
In the experimental process, after heating, the specimen was cooled from 900°C and 850°C by immersing it in water at room temperature. Using the SFS method, the thermal history obtained at the specimen position through simulation was used to solve the IHCP posed in Figure 3a. In the solution methodology, the estimated thermal boundary condition was optimized by varying the number of future time steps defining values in an interval between 2 and 10 [18]. In turn, the thermal boundary condition was used to solve the approaches described in Figure 4 and Figure 5, considering data from SAE 4140 and 1080 steels, respectively. The calculations of fractions transformed in microstructural evolution processes of austenite-martensite and austenite-pearlite were not validated but are presented as evidence of the development of algorithm programming in Figure 7a,b, respectively.
The above-mentioned thermal cycling process can be adapted to automated handling with the linear displacement devices shown in Figure 8a. The displacement was designed in two axes, X and Z, to mimic the manual movement of the test pieces. It is obtained by implementing the devices in an aluminium metal frame, as detailed in the technical and isometric drawings in Figure 8b,y,c. Each device’s motor was linked to the 3-axis displacement controller, initially programmed with three states: zero position, heating position, and cooling position.
The zero position is the starting and ending point of the thermal cycle and is the state in which it is checked that the specimen and the instrumentation are in the appropriate conditions for a test. The heating position is when the specimen is inside the furnace to raise its temperature. Finally, the cooling position is the state in which the specimen interacts with a low-temperature medium that promotes heat extraction. Each state can vary depending on the requirements of the designed thermal cycle. However, the specimen is manipulated at constant intervals once defined. In addition to invariably timed tests, the controlled temperature conditions that originate the movement orders are determined by sensors and controllers activated by control systems.
Specifically, the sequence of states of the steel hardenability procedure associated with the ASTM A255 standard is shown in Figure 9, in which the temperature of a standard-sized 1-inch diameter and 4-inch long test piece is increased to around 1000°C and cooled by placing it vertically over a water jet that impacts on a base surface. Such a sequence allows the temperature records obtained on an instrumented test piece to be reproducible to construct a database that can subsequently be used to develop prediction models that support decision-making in applied processes.
Integrating each part developed in another more advanced consolidation stage is still required. The requirement for data on the physical properties of the treated steels must be part of the points to be supplemented to offer a broad calculation base. In software development, the most appropriate user interface for each type of processing and the standard reference framework for the processes are also created.
4. Discussion
The results show that work on the prototype will be improved with more tests and further electronic adaptations for sensor control. A more significant number of controllers and software programming developments are planned.
5. Conclusions
The results demonstrate the need to integrate all the elements that make up the test automation project on steel samples to verify reproducibility, which is one of the factors expected from this prototype. Although a correct direction is demonstrated towards the objective, physical aspects must be considered when controlling electronic devices and data processing. The data that is decided to accumulate will represent opportunities to avoid carrying out tests on already identified alloys and, therefore, by applying data science concepts, establish argumentation methodologies for decision-making in operations that require prompt response.
The continuity of the work will allow adjustments to be made to create automated controlled procedures. Such processes are expected to generate datasets that can be used for analysis implementations with neural network models. As a result, indicators will be presented in executive reports that help engineers make decisions in critical processes. Therefore, it is expected that lean manufacturing optimization will also be supported.
Author Contributions
All authors worked on mathematical modelling, software generation, prototype design and construction. All authors have read and agreed to the published version of the manuscript.
Acknowledgements
The authors would like to thank the Tecnológico Nacional de México for its financial support, called PROYECTOS DE INVESTIGACIÓN CIENTÍFICA, DESARROLLO TECNOLÓGICO E INNOVACIÓN.
Conflicts of Interest
The authors declare no conflicts of interest.
Abbreviations
The following abbreviations are used in this manuscript:
| CAE | Computer-Aided Engineering |
| IHCP | Inverse Heat Conduction Problem |
| CCT | Continuous Cooling Transformation Diagrams |
| TTT | Temperature Time Transformation Diagrams |
| JMAK | Johnson-Mehl-Avrami-Kolmogorov equation |
| SFS | Sequential Function Specification |
| ASTM | American Society for Testing and Materials |
References
- ASTM Standard D6200-01. Standard Test Method for Determination of Cooling Characteristics of Quench Oils by Cooling Curve Analysis. ASTM International 2012, West Conshohocken.
- ASTM Standard D6482-06. Standard Test Method for Determination of Cooling Characteristics of Aqueous Polymer Quenchants by Cooling Curve Analysis with Agitation (Tensi Method). ASTM International 2011, West Conshohocken.
- ASTM Standard D6549-06. Standard Test Method for Determination of Cooling Characteristics of Quenchants by Cooling Curve Analysis with Agitation (Drayton Unit). ASTM International 2011, West Conshohocken.
- Hernández-Morales, B. , et al. Cooling curve analysis using an interstitial-free steel probe. In 19th ASM Heat Treating Society Conference and Exposition including Steel Heat Treating in the New Millenium: An International Symposium in Honor of Professor George Krauss. 1999, 284-291.
- Meekisho, L. , Hernandez-Morales, B., Tellez-Martinez, J.S., Chen, X. Computer-aided cooling curve analysis using WinProbe. International Journal of Materials and Product Technology 2005, 24, 155–169. [Google Scholar] [CrossRef]
- Campbell, P.C. , Hawbolt, E. B., Brimacombe, J.K. Application of microstructural engineering to the controlled cooling of steel wire rod, Editor(s): G.E., Ruddle, A.F., Crawley, In Proceedings of Metallurgical Society of Canadian Institute of Mining and Metallurgy, Pergamon, 1988, 309-330, ISBN 9780080357706., Editor(s): G.E. [CrossRef]
- Campbell, P.C. , Hawbolt, E.B. & Brimacombe, J.K. Microstructural engineering applied to the controlled cooling of steel wire rod: Part, I. Experimental design and heat transfer. Metall Trans A 1991, 22, 2769–2778. [Google Scholar] [CrossRef]
- Campbell, P.C. , Hawbolt, E.B. & Brimacombe, J.K. Microstructural engineering applied to the controlled cooling of steel wire rod: Part II. Microstructural evolution and mechanical properties correlations. Metall Trans A 1991, 22, 2779–2790. [Google Scholar] [CrossRef]
- Campbell, P.C. , Hawbolt, E.B. & Brimacombe, J.K. Microstructural engineering applied to the controlled cooling of steel wire rod: Part III. Mathematical model formulation and predictions. Metall Trans A 1991, 22, 2791–2805. [Google Scholar] [CrossRef]
- Prasanna Kumar, T. Coupled Analysis of Surface Heat Flux, Microstructure Evolution, and Hardness during Immersion Quenching of a Medium Carbon Steel in Plant Conditions. Materials Performance and Characterization 2012, 1, 1–MPC104477. [Google Scholar] [CrossRef]
- Babu, K. , Prasanna Kumar, T. Mathematical Modeling of Surface Heat Flux During Quenching. Metall Mater Trans B 2010, 41, 214–224. [Google Scholar] [CrossRef]
- Babu, K. , Prasanna Kumar, T.S. Comparison of Austenite Decomposition Models During Finite Element Simulation of Water Quenching and Air Cooling of AISI 4140 Steel. Metall Mater Trans B 2014, 45, 1530–1544. [Google Scholar] [CrossRef]
- Felde, I. , Réti, T., Evaluation Of Hardening Performance of Cooling Media by Using Inverse Heat Conduction Methods and Property Prediction. Strojniski Vestnik - Journal of Mechanical Engineering 2010, 56, 77–83. [Google Scholar]
- Méndez, J. Diseño Y Construcción de un Horno Eléctrico para el Secado de los Bobinados de Motores de hasta 10 Hp, Thesis in Engineering, ESFOT, Quito Ecuador, 12. http://bibdigital.epn.edu.ec/handle/15000/4639. 20 January 1500. [Google Scholar]
- https://www.comsol.
- Bird, R.B. , Stewart, W.E., & Lightfoot, E.N. Transport Phenomena, 2nd ed.; John Wiley & Sons Inc.: New York, United States of America, 2007. [Google Scholar]
- Wicks, C.E. , & Wilson, R.E., Fundamentals of Momentum Heat & Mass Transfer., 6th ed.; John Wiley & Sons Inc.: New York, United States of America, 2015. [Google Scholar]
- Cengel, Y.A. , & Boles, M.A. Thermodynamics. An Engineering Approach. The McGraw‐Hill Companies, Inc.; New York, U.S.A., 2011.
- Téllez-Martínez, J.S. , Sánchez-Hernández, M.Z., Vega-Flores, M.J., Pintor-Estrada, A.A., Alva-Medrano, H.E, & Herrera-Sandoval, N.E., Analysis of a Fundamental Procedure for Solving the Inverse Heat Conduction Problem Applied to Simple Systems. In Book Heat Transfer - Advances in Fundamentals and Applications, 1st ed.; Muhammad Ali, H., and Indra Mahlia, T.M., IntechOpen. UK, 2023. [CrossRef]
- Guimarães, J.C.R. , Rios, P.R. (2009). Unified description of martensite microstructure and Kinetics. J Mater Sci 2009, 44, 998–1005. [Google Scholar] [CrossRef]
- Koistinen, D.P. , Marburger, R.E., A General Equation Prescribing the Extent of the Austenite-Martensite Transformation in Pure Iron-Carbon Alloys and Plain Carbon Steels. Acta Metall 1959, 59–60. [Google Scholar] [CrossRef]
- Lee, SJ. , Van Tyne, C.J. A Kinetics Model for Martensite Transformation in Plain Carbon and Low-Alloyed Steels. Metall Mater Trans A 2012, 43, 422–427. [Google Scholar] [CrossRef]
- Huyan, F. , Hedström, P. , Borgenstam, A., Modelling of the Fraction of Martensite in Low-alloy Steels, In Proceedings Materials Today, 2015, 2, S561–S564. [Google Scholar] [CrossRef]
- Wen, Y. , Huang, F., Rong, Y., Guo, Z., Evaluation of Kinetic Equation of Athermal Martensitic Transformation in Low Carbon Steels. In: Marquis, F. (eds) Proceedings of the 8th Pacific Rim International Congress on Advanced Materials and Processing. 2013. Springer: Cham. [CrossRef]
- Groover, M.P. , Fundamentals of Modern Manufacturing, 4th ed.; John Wiley & Sons Inc.: USA, 2010. [Google Scholar]
- Agarwal, P.K. , Brimacombe, J.K. Mathematical Model of Heat Flow and Austenite-Perlite Transformation in Eutectoid Carbon Steel Rods for Wire. Metall Trans B 1981, 12, 121–133. [Google Scholar] [CrossRef]
- Wong, A. , Modelling the stability and transformation kinetics of retained austenite in steels. Materials Science and Technology 2022, 38, 676–688. [Google Scholar] [CrossRef]
- Canale, L.C.F. , Albano, L., Totten, G.E., Meekisho, L., 12.03 Hardenability of Steel. In Comprehensive Materials Processing, editor(s): Hashmi, S., Ferreira Batalha, G., Van Tyne, C.J., Yilbas, B., Elsevier: 2014; pp. 39–97, ISBN 9780080965338. [CrossRef]
Figure 1.
Sequential design diagram for determining the construction characteristics of a circular hearth heating furnace using electric resistance. a) Constituent materials; b) Schematic for the steady-state heat flow balance; c) Design of electrical resistance wire coils; and d) Determination of design parameters.
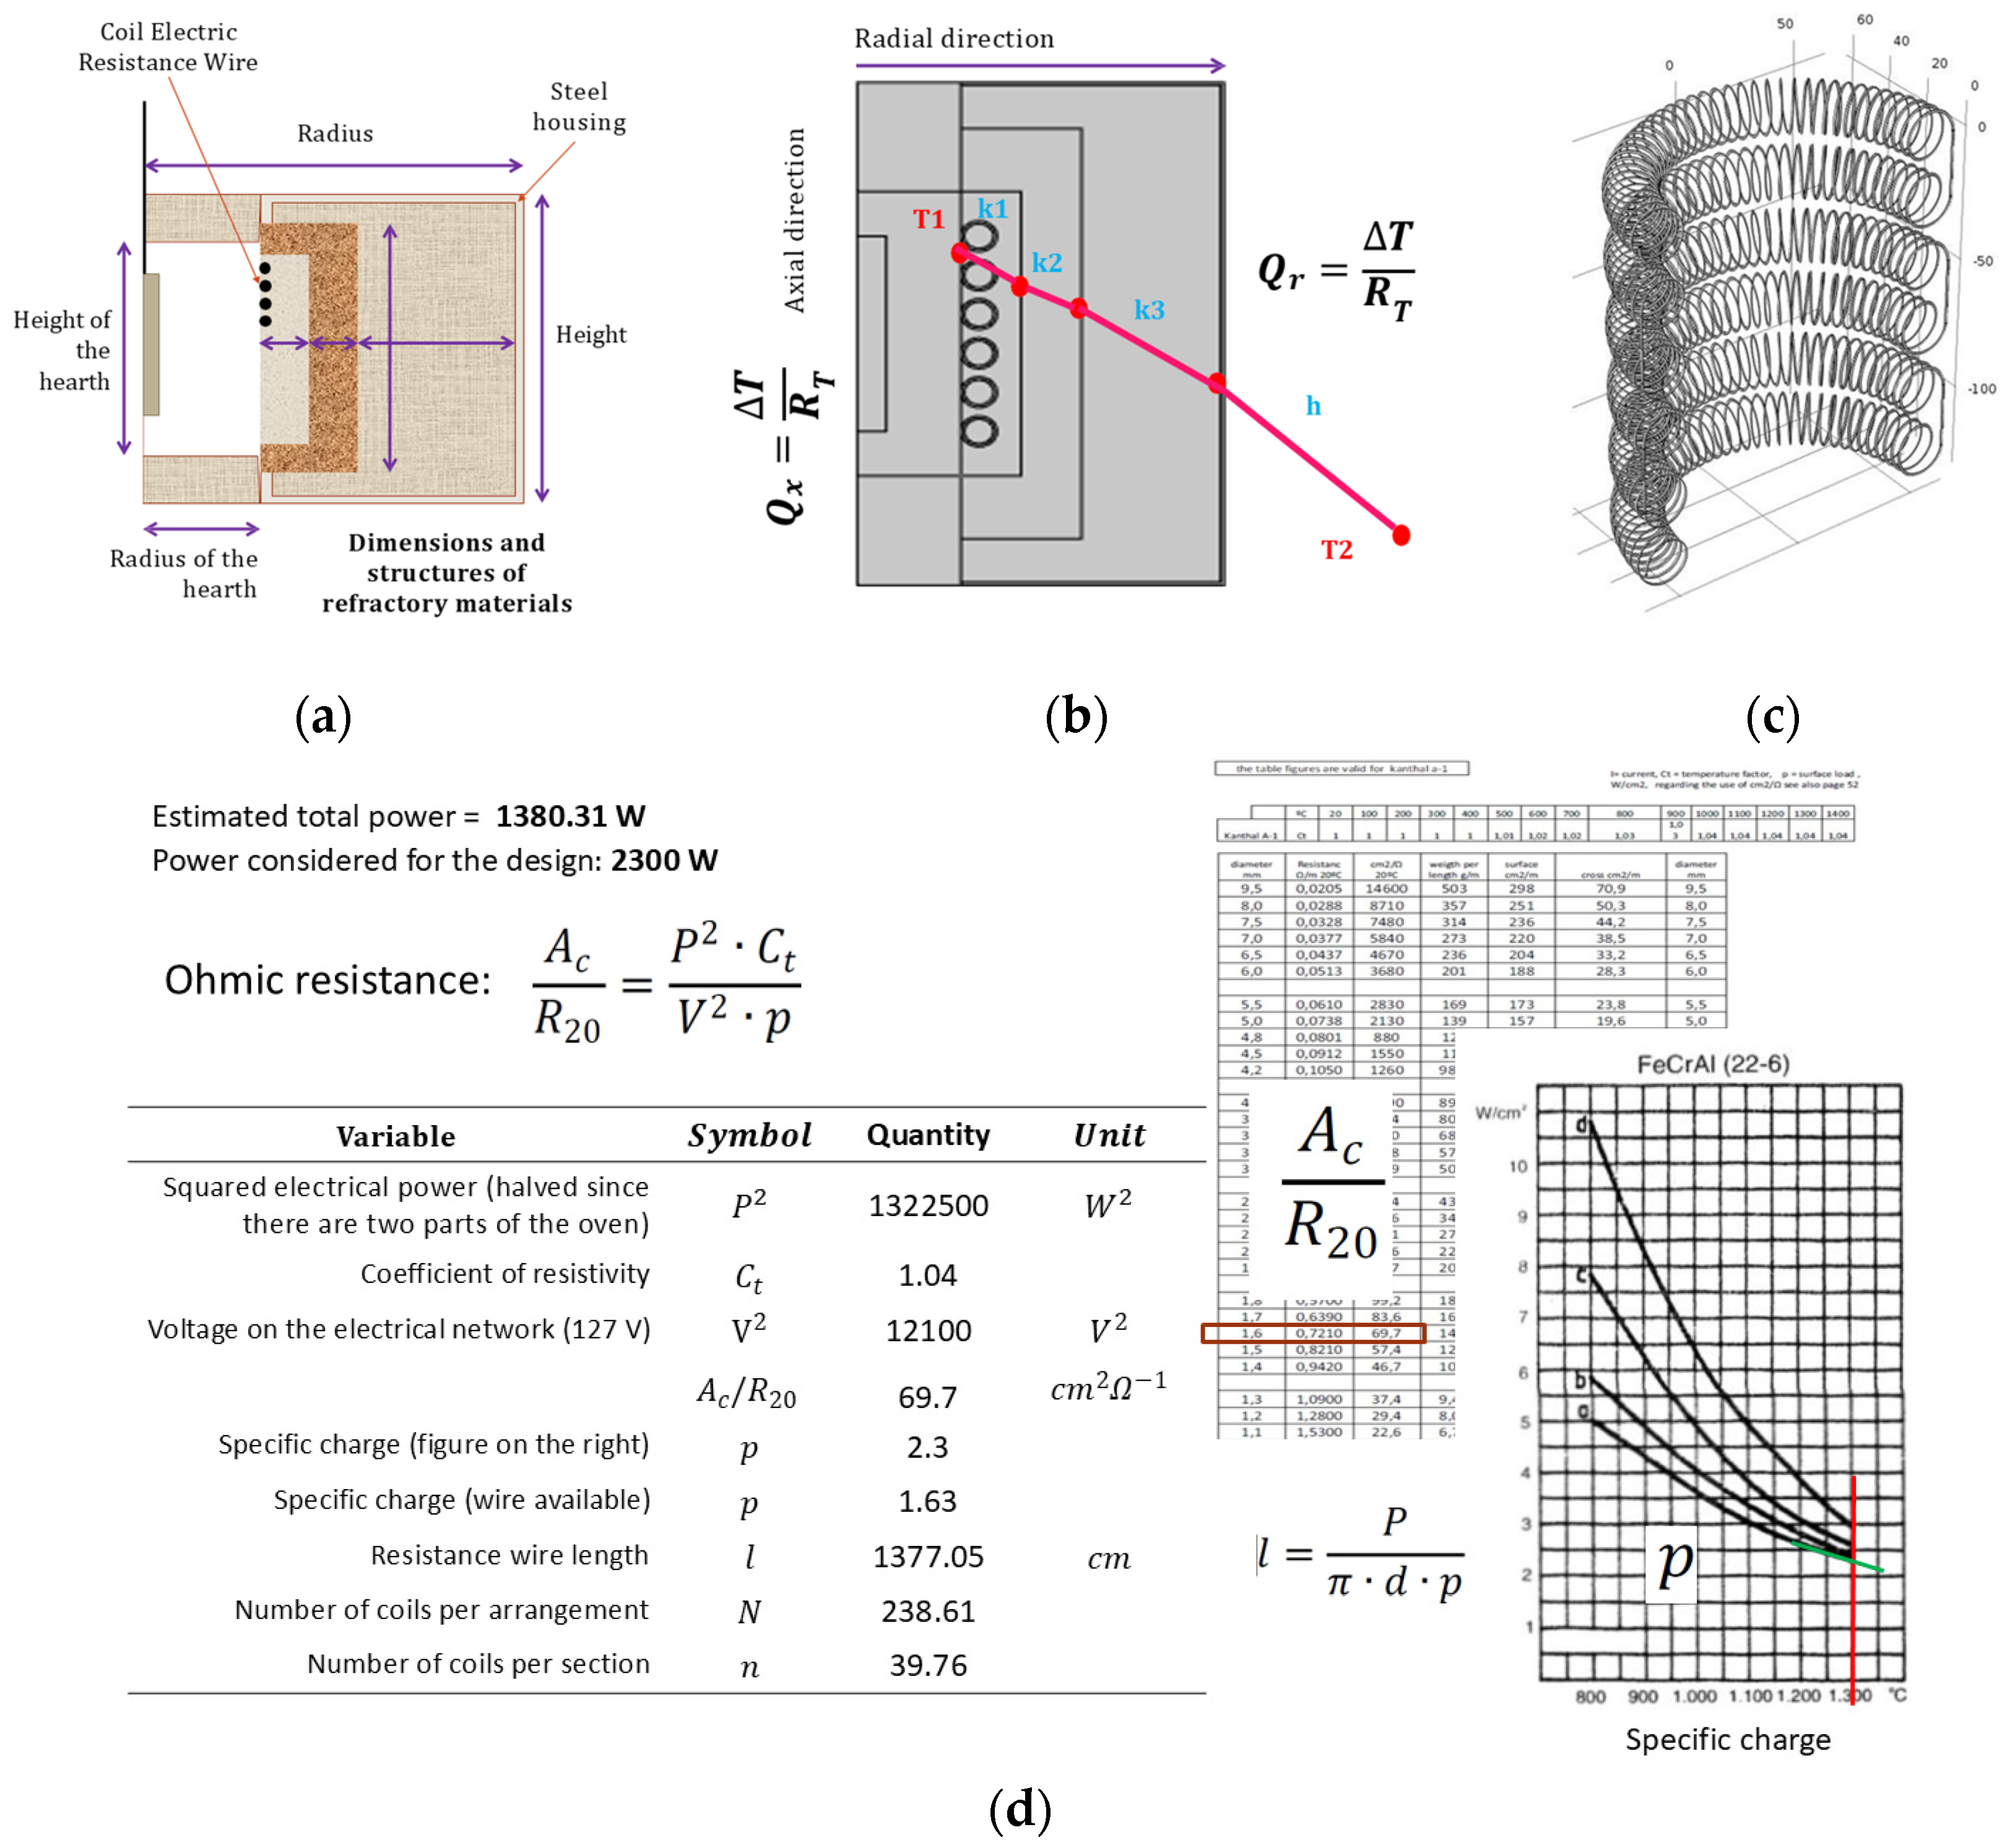
Figure 2.
A basic mathematical model for the calculation of radial isotherms for cylindrical geometry.
Figure 2.
A basic mathematical model for the calculation of radial isotherms for cylindrical geometry.
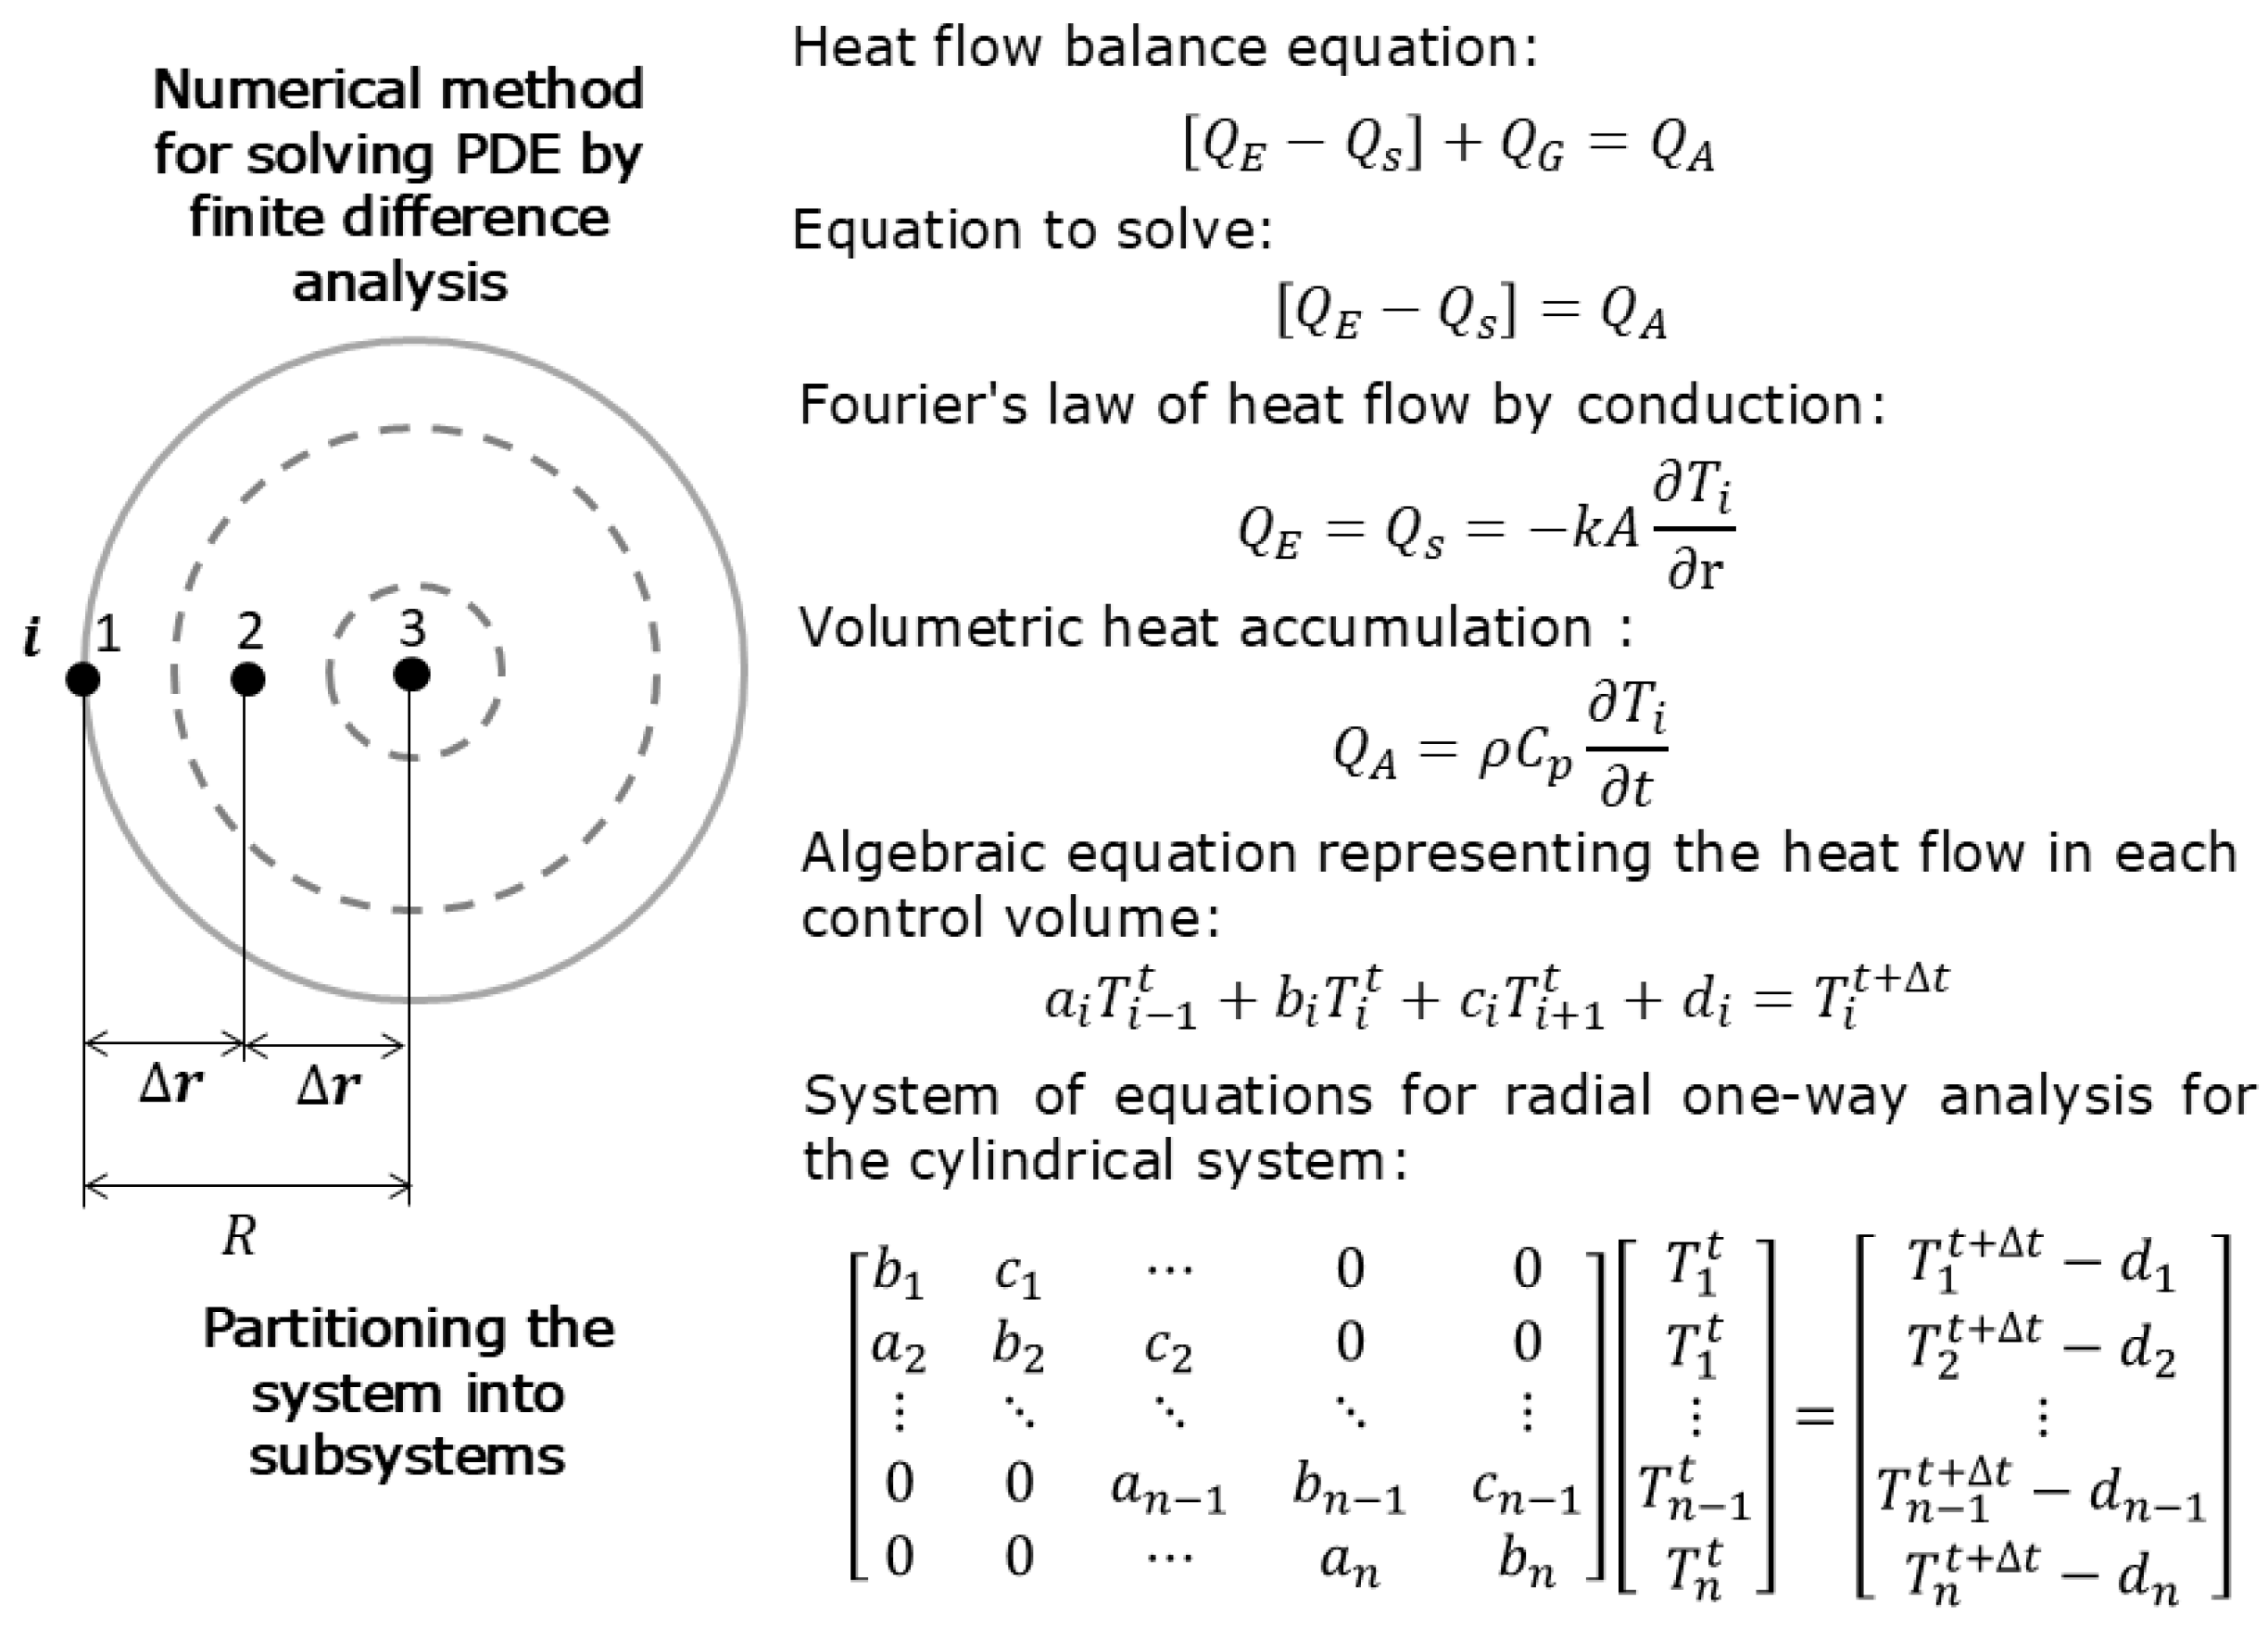
Figure 3.
a) Mathematical model proposed for the solution of the inverse heat conduction problem (IHCP), b) Thermal boundary condition estimated from a thermal history in the subsurface of the cylinder, and c) Comparison of the experimental and calculated thermal histories with the estimated thermal boundary condition.
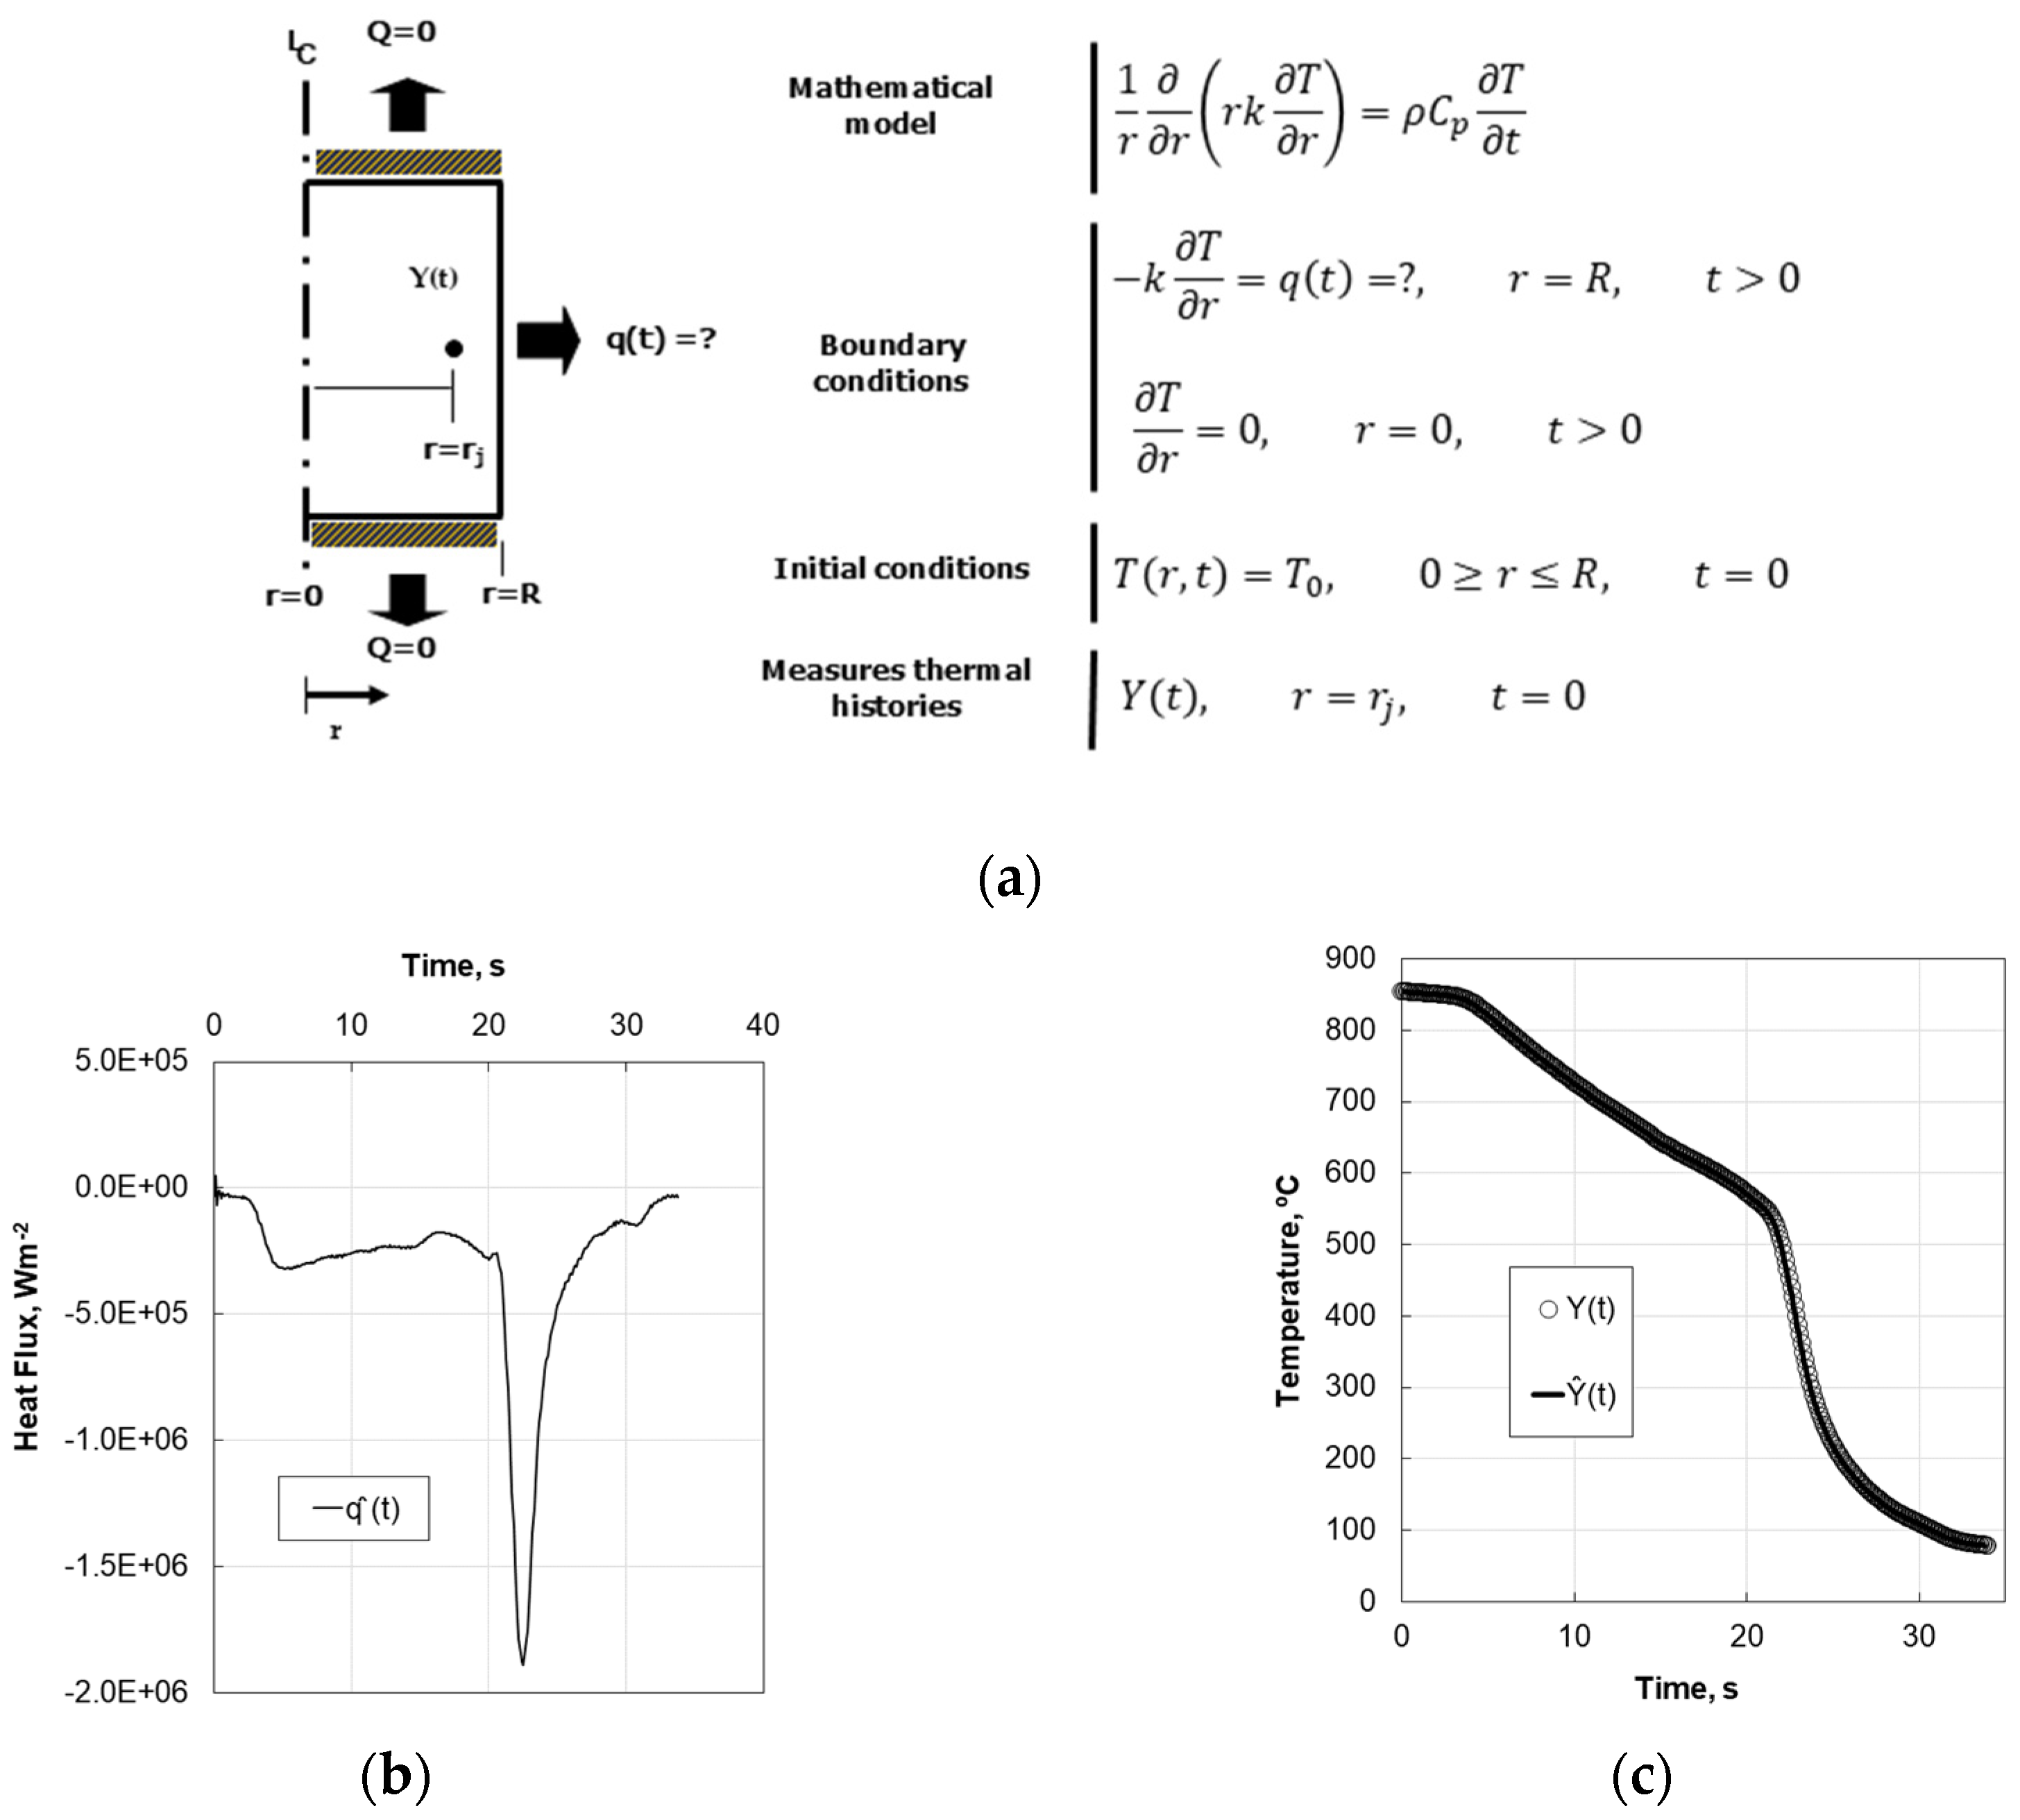
Figure 4.
a) Mathematical model proposed for solving the austenite-martensite transformation problem, and b) Superposition of a cooling curve or thermal history on a continuous cooling transformation diagram indicating a path towards martensitic transformation [25].
Figure 4.
a) Mathematical model proposed for solving the austenite-martensite transformation problem, and b) Superposition of a cooling curve or thermal history on a continuous cooling transformation diagram indicating a path towards martensitic transformation [25].
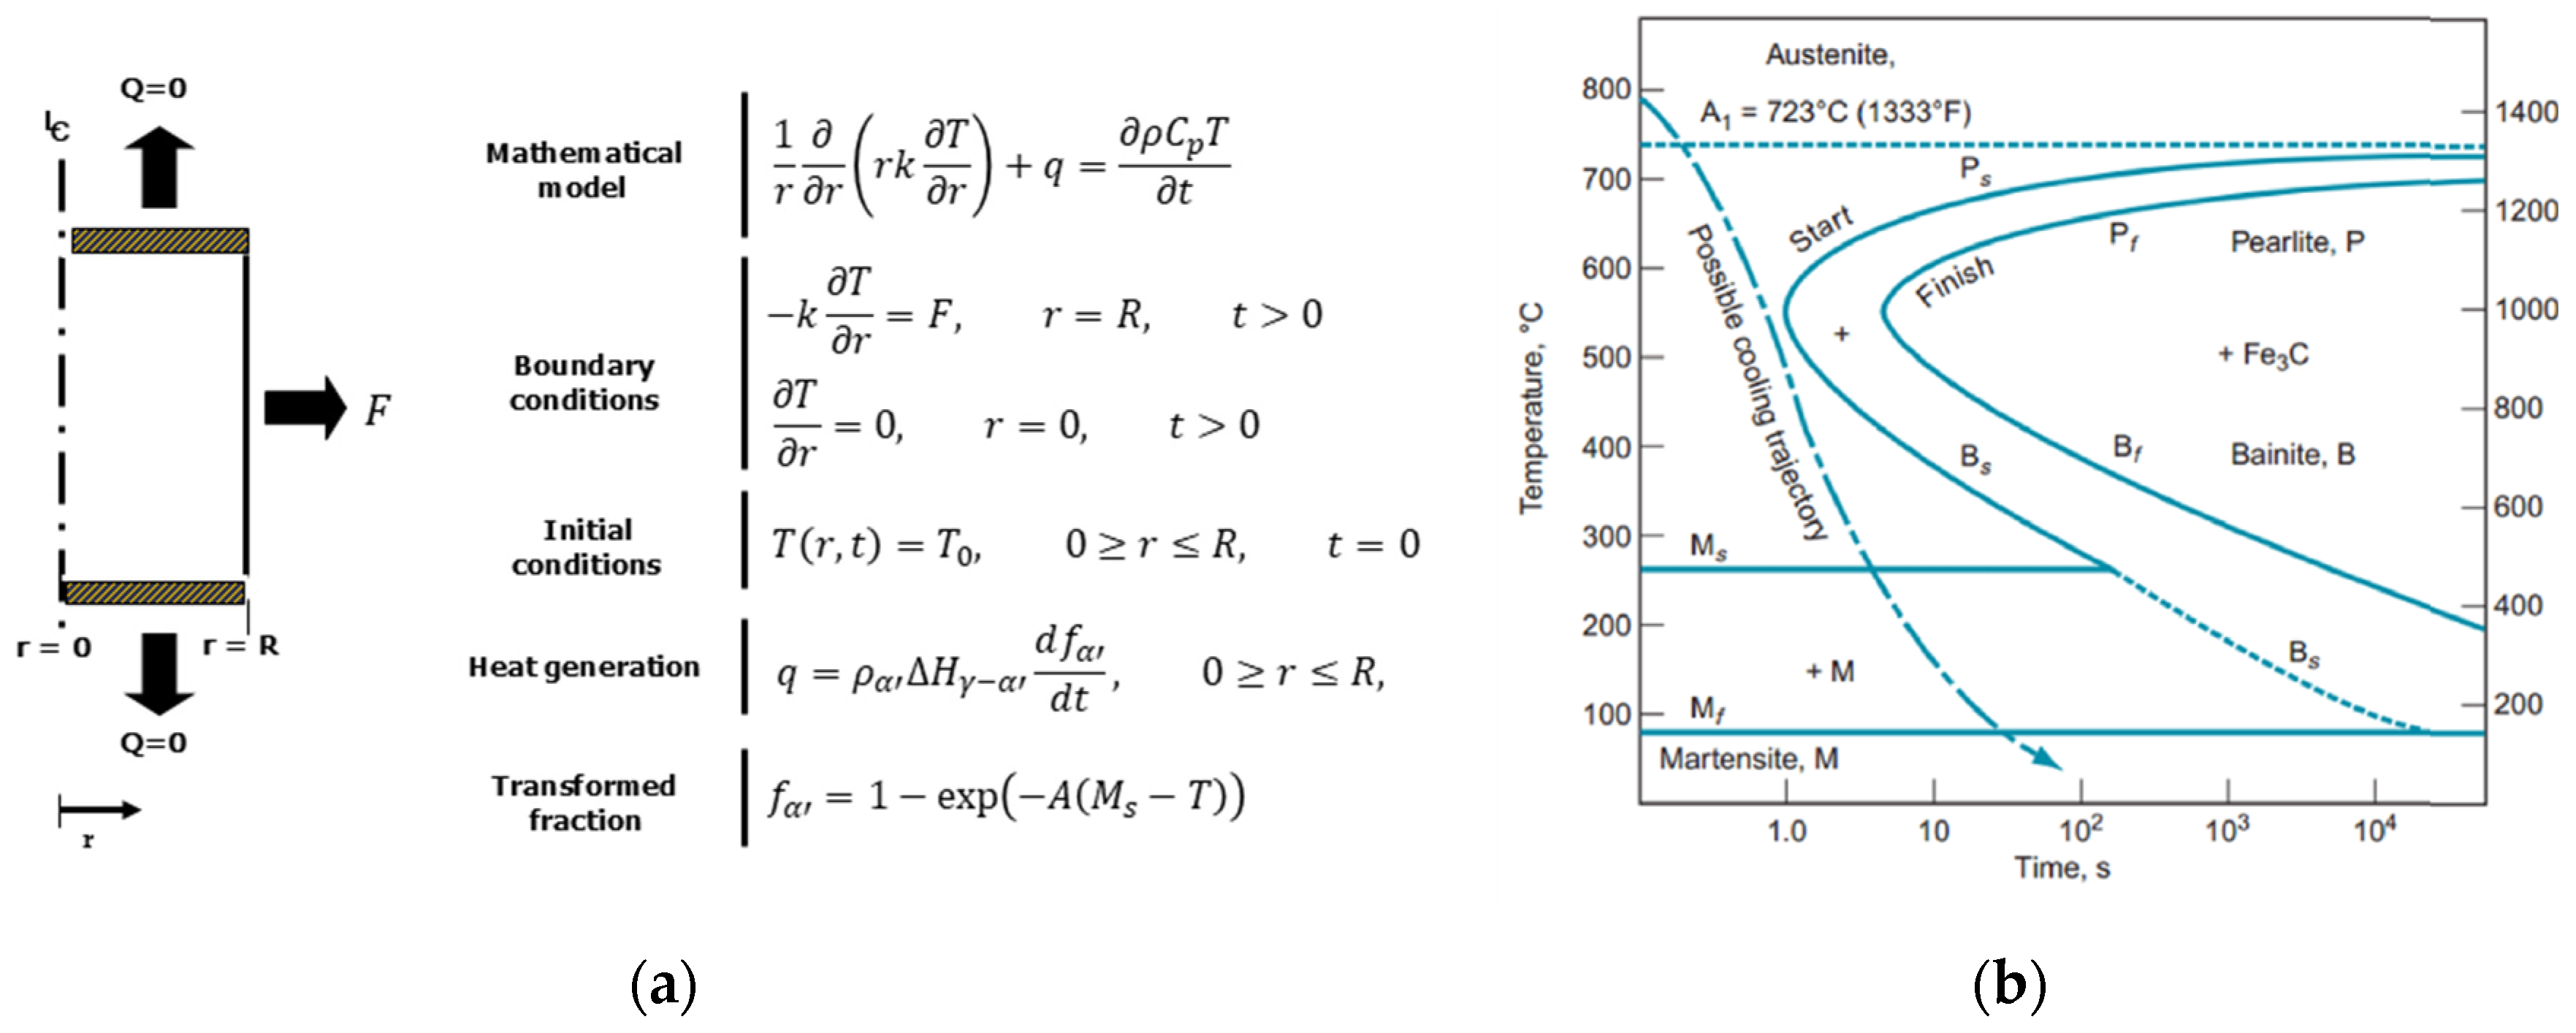
Figure 5.
a) The mathematical model proposed for solving the austenite-pearlite transformation problem, and b) the Additivity principle based on the Johnson-Mehl-Avrami-Kolmogorov (JMAK) equation [26].
Figure 5.
a) The mathematical model proposed for solving the austenite-pearlite transformation problem, and b) the Additivity principle based on the Johnson-Mehl-Avrami-Kolmogorov (JMAK) equation [26].
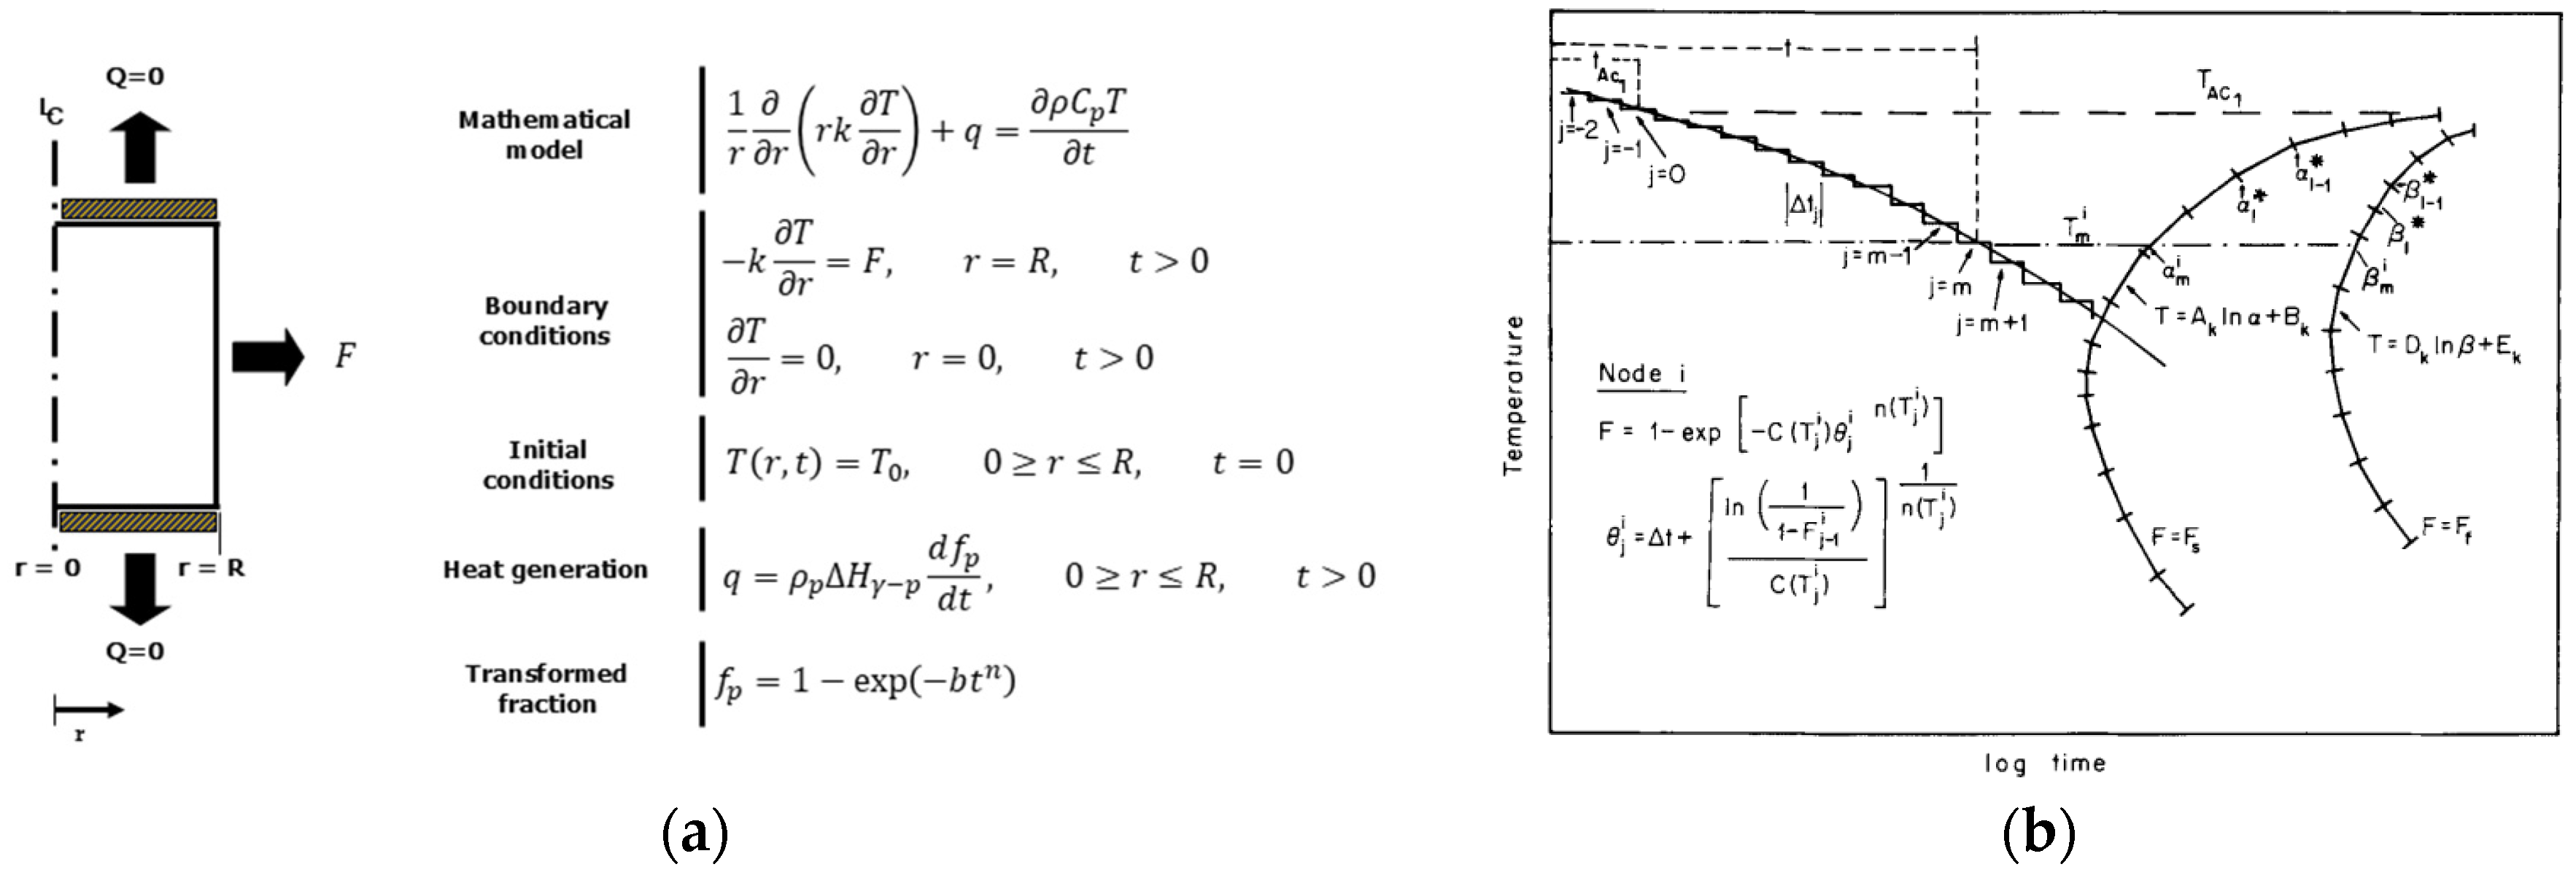
Figure 6.
a) Isothermal graph and critical temperature data in the middle section of the furnace, b) contour plot of temperature distribution, and c) instrumented specimen with dimensions specified in mm.
Figure 6.
a) Isothermal graph and critical temperature data in the middle section of the furnace, b) contour plot of temperature distribution, and c) instrumented specimen with dimensions specified in mm.
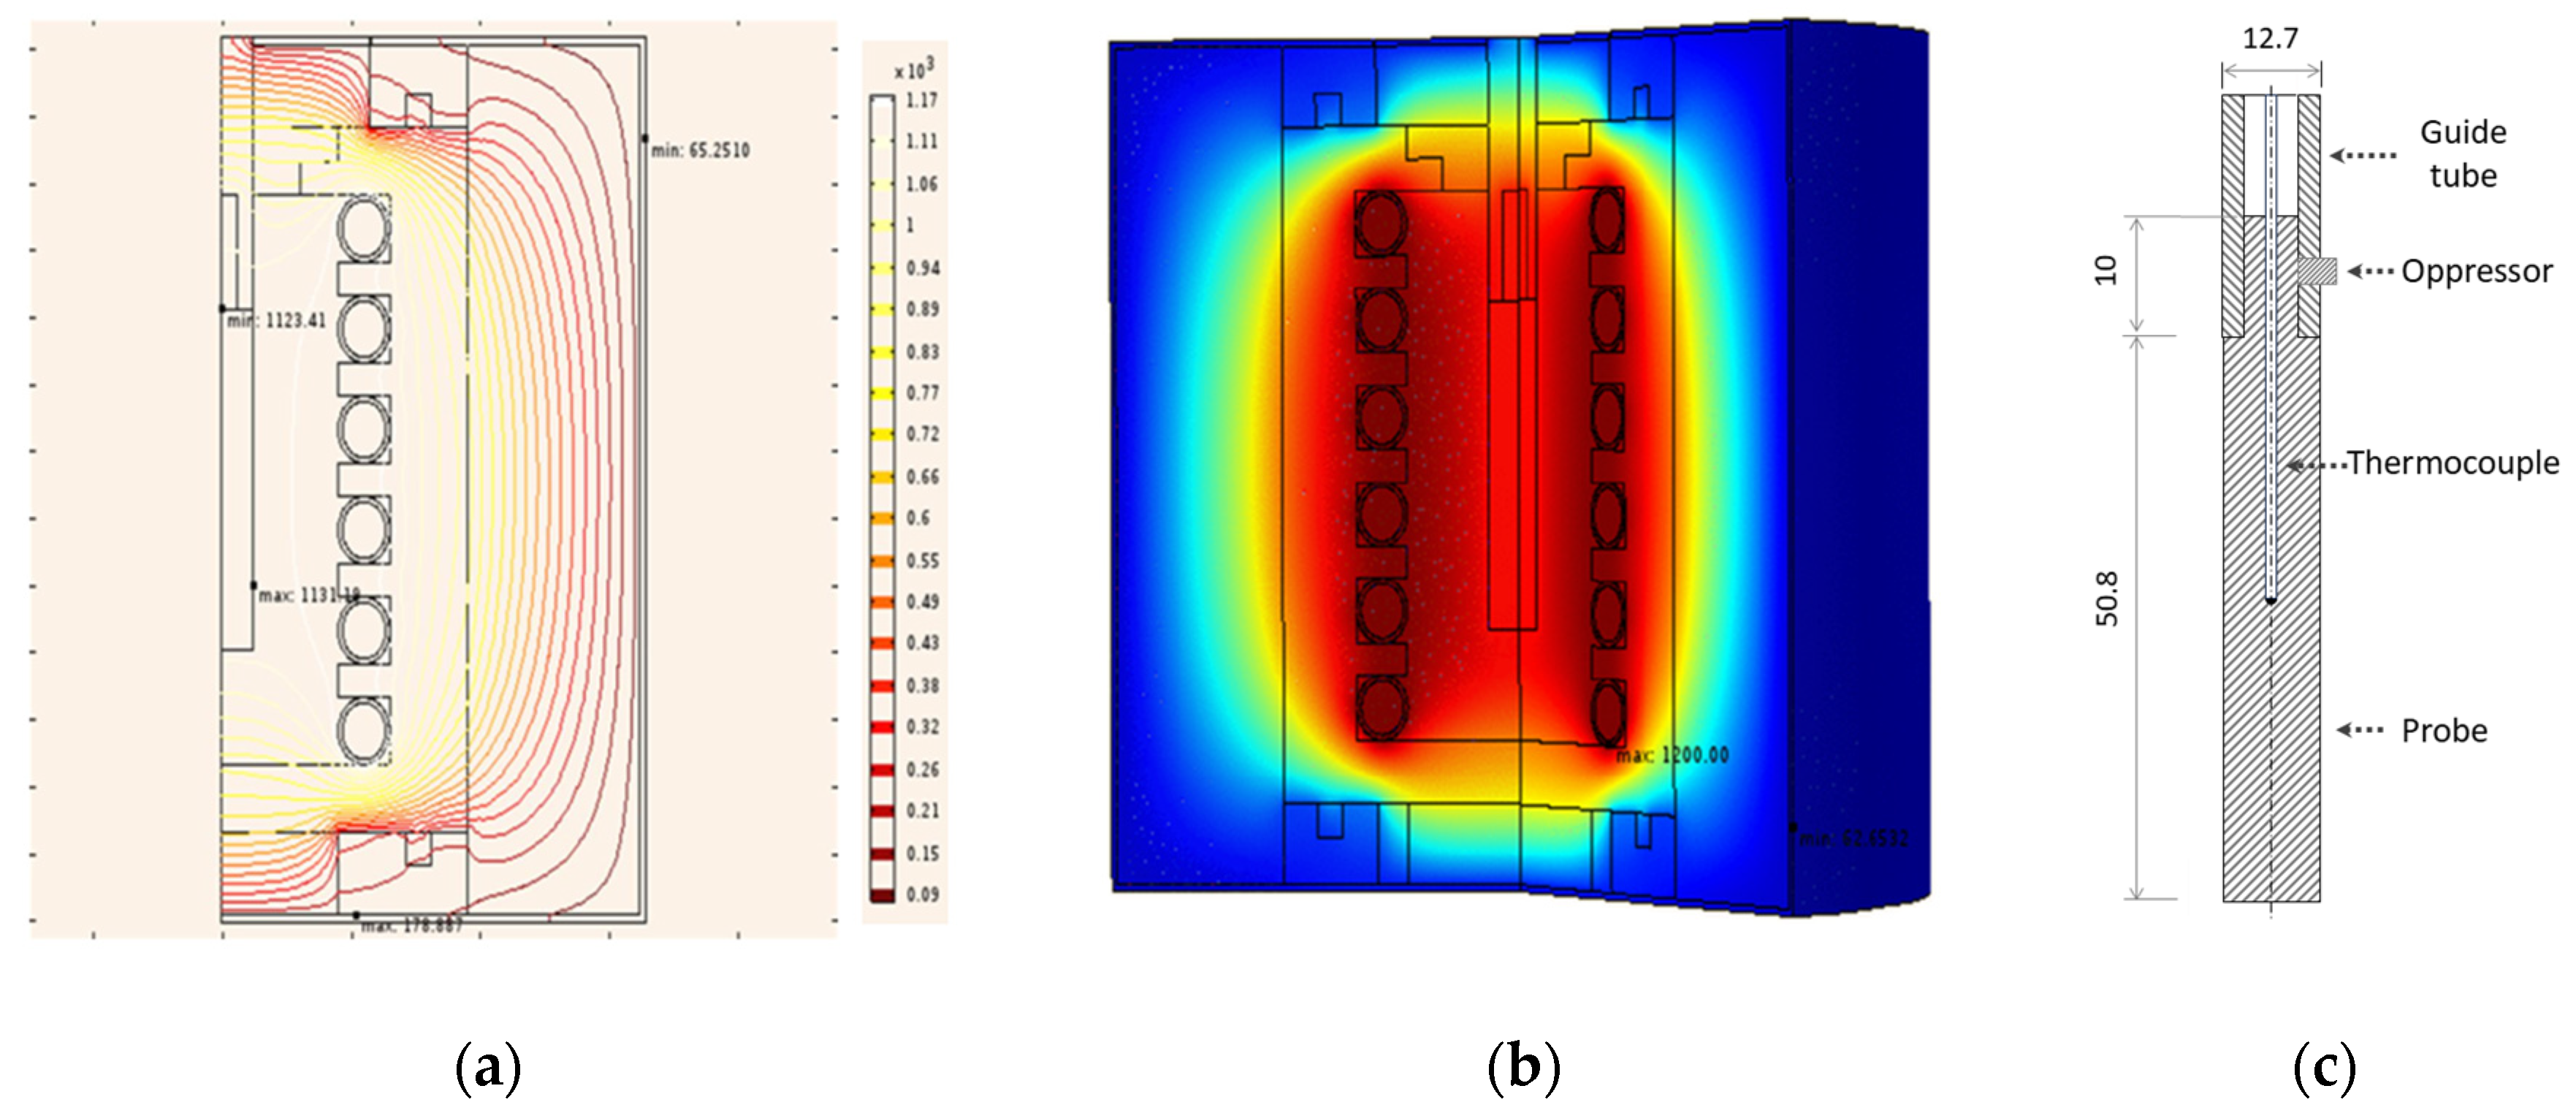
Figure 7.
a) Curves of the thermal history calculated at the surface of the specimen and of the fraction of martensite transformed in the subsurface region, b) example of a graphical user interface for parameter control for calculating the pearlite fraction obtained in the transformation of a hypoeutectic steel.
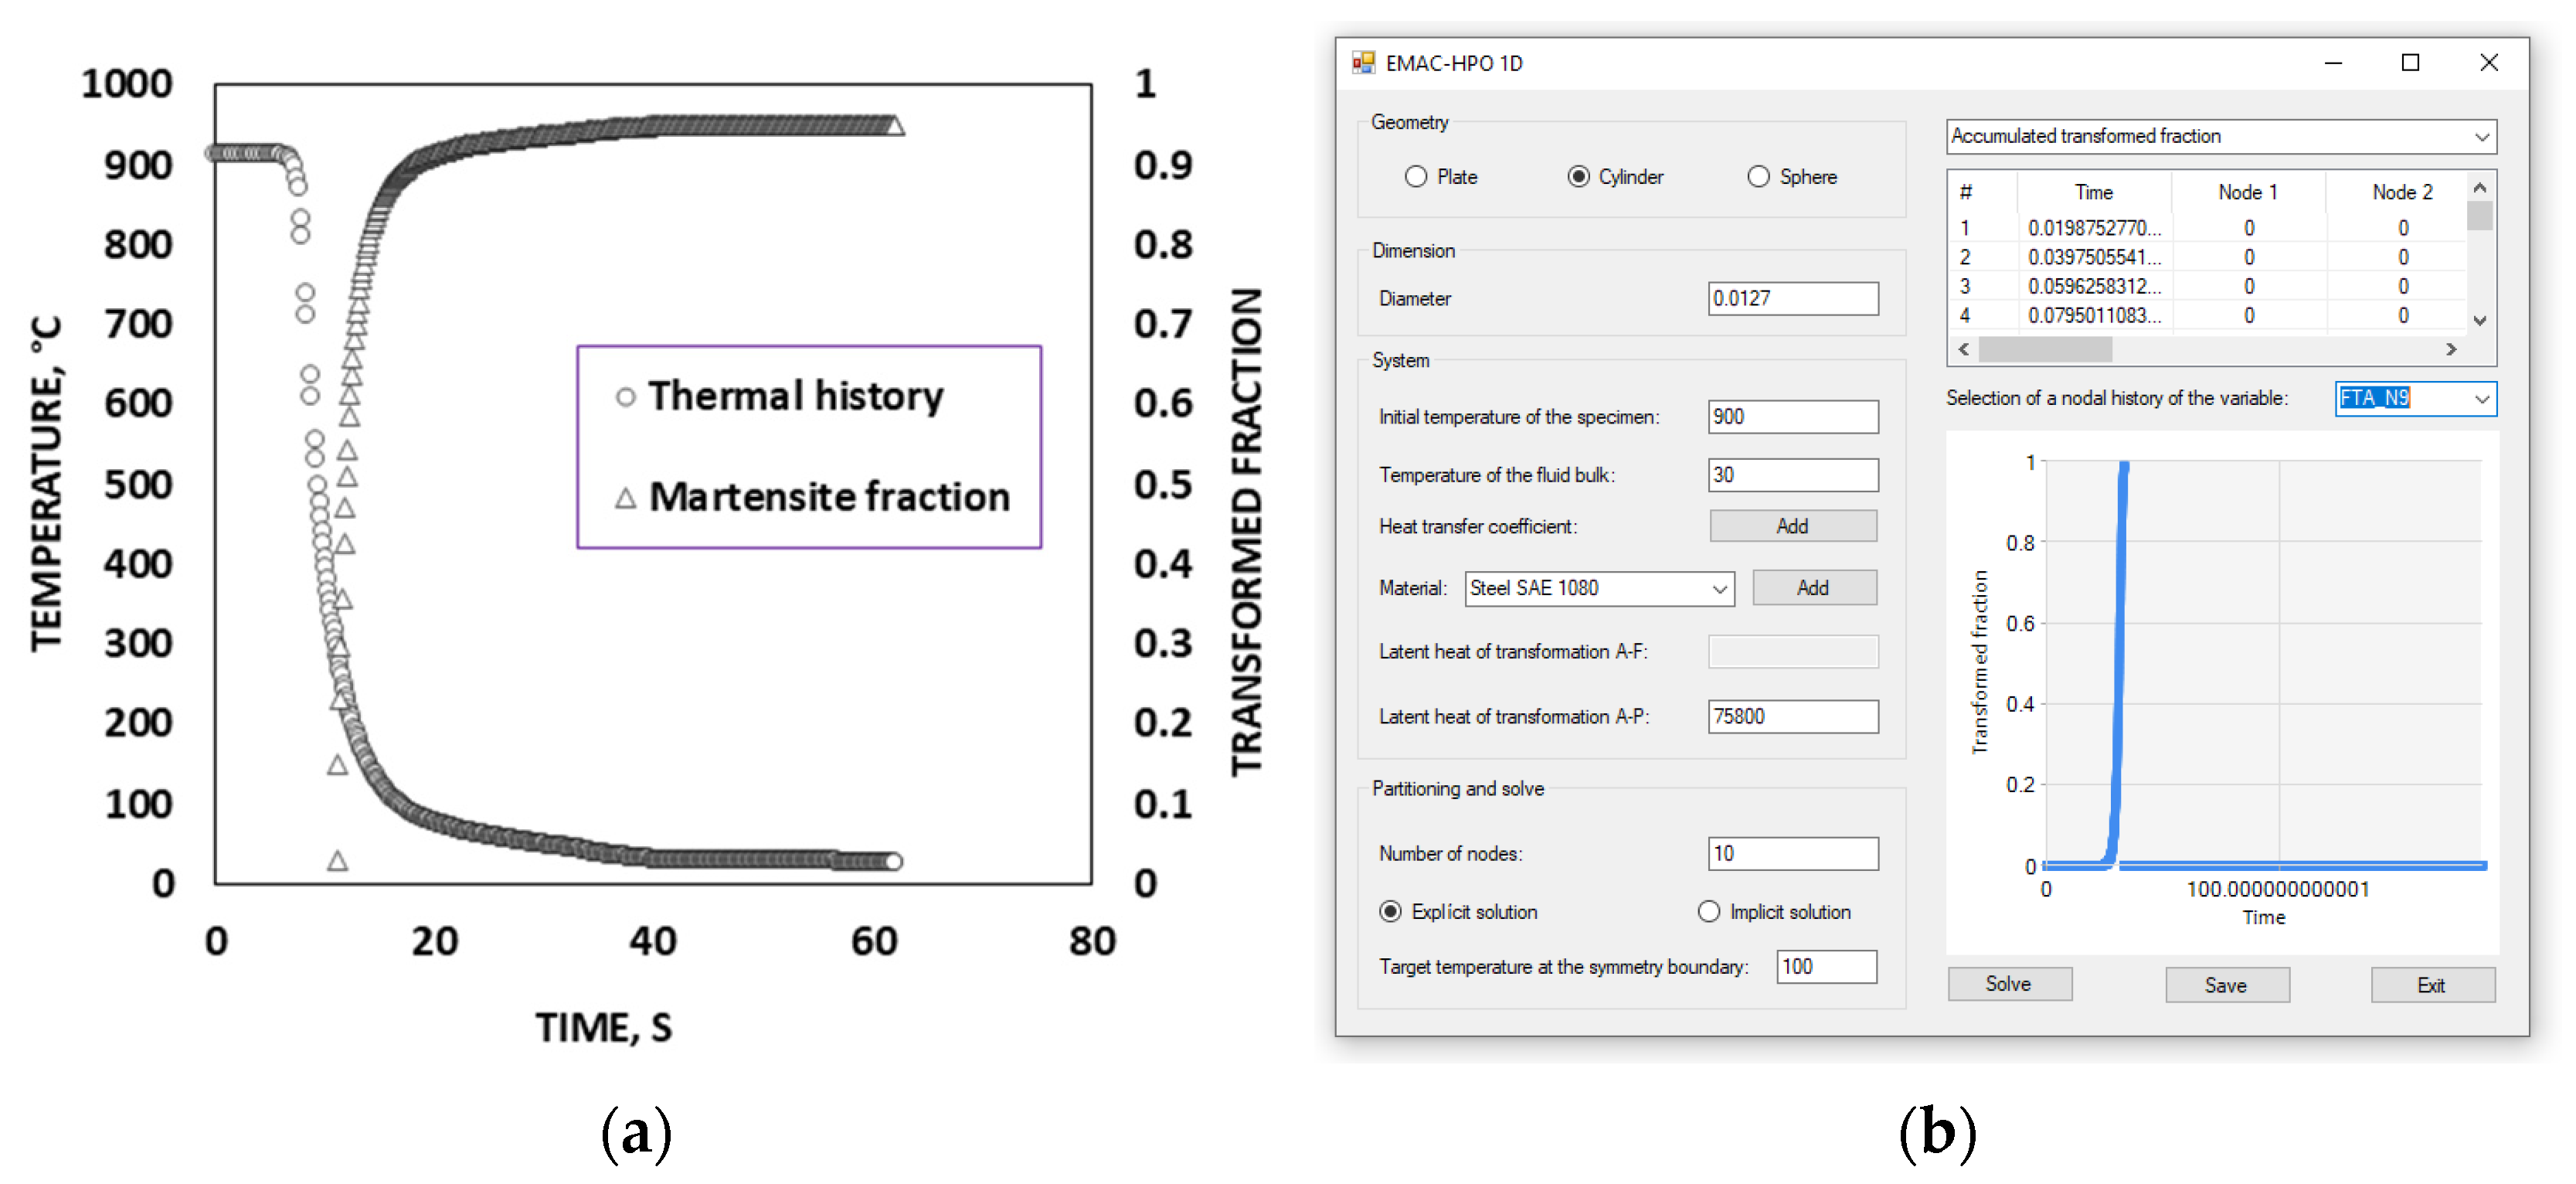
Figure 8.
a) Dimensions of the aluminium frame and linear displacement devices, b) technical drawing of the frame system and displacement devices, and c) isometric drawing with implementations of test piece positioning systems on the X and Z axes.
Figure 8.
a) Dimensions of the aluminium frame and linear displacement devices, b) technical drawing of the frame system and displacement devices, and c) isometric drawing with implementations of test piece positioning systems on the X and Z axes.
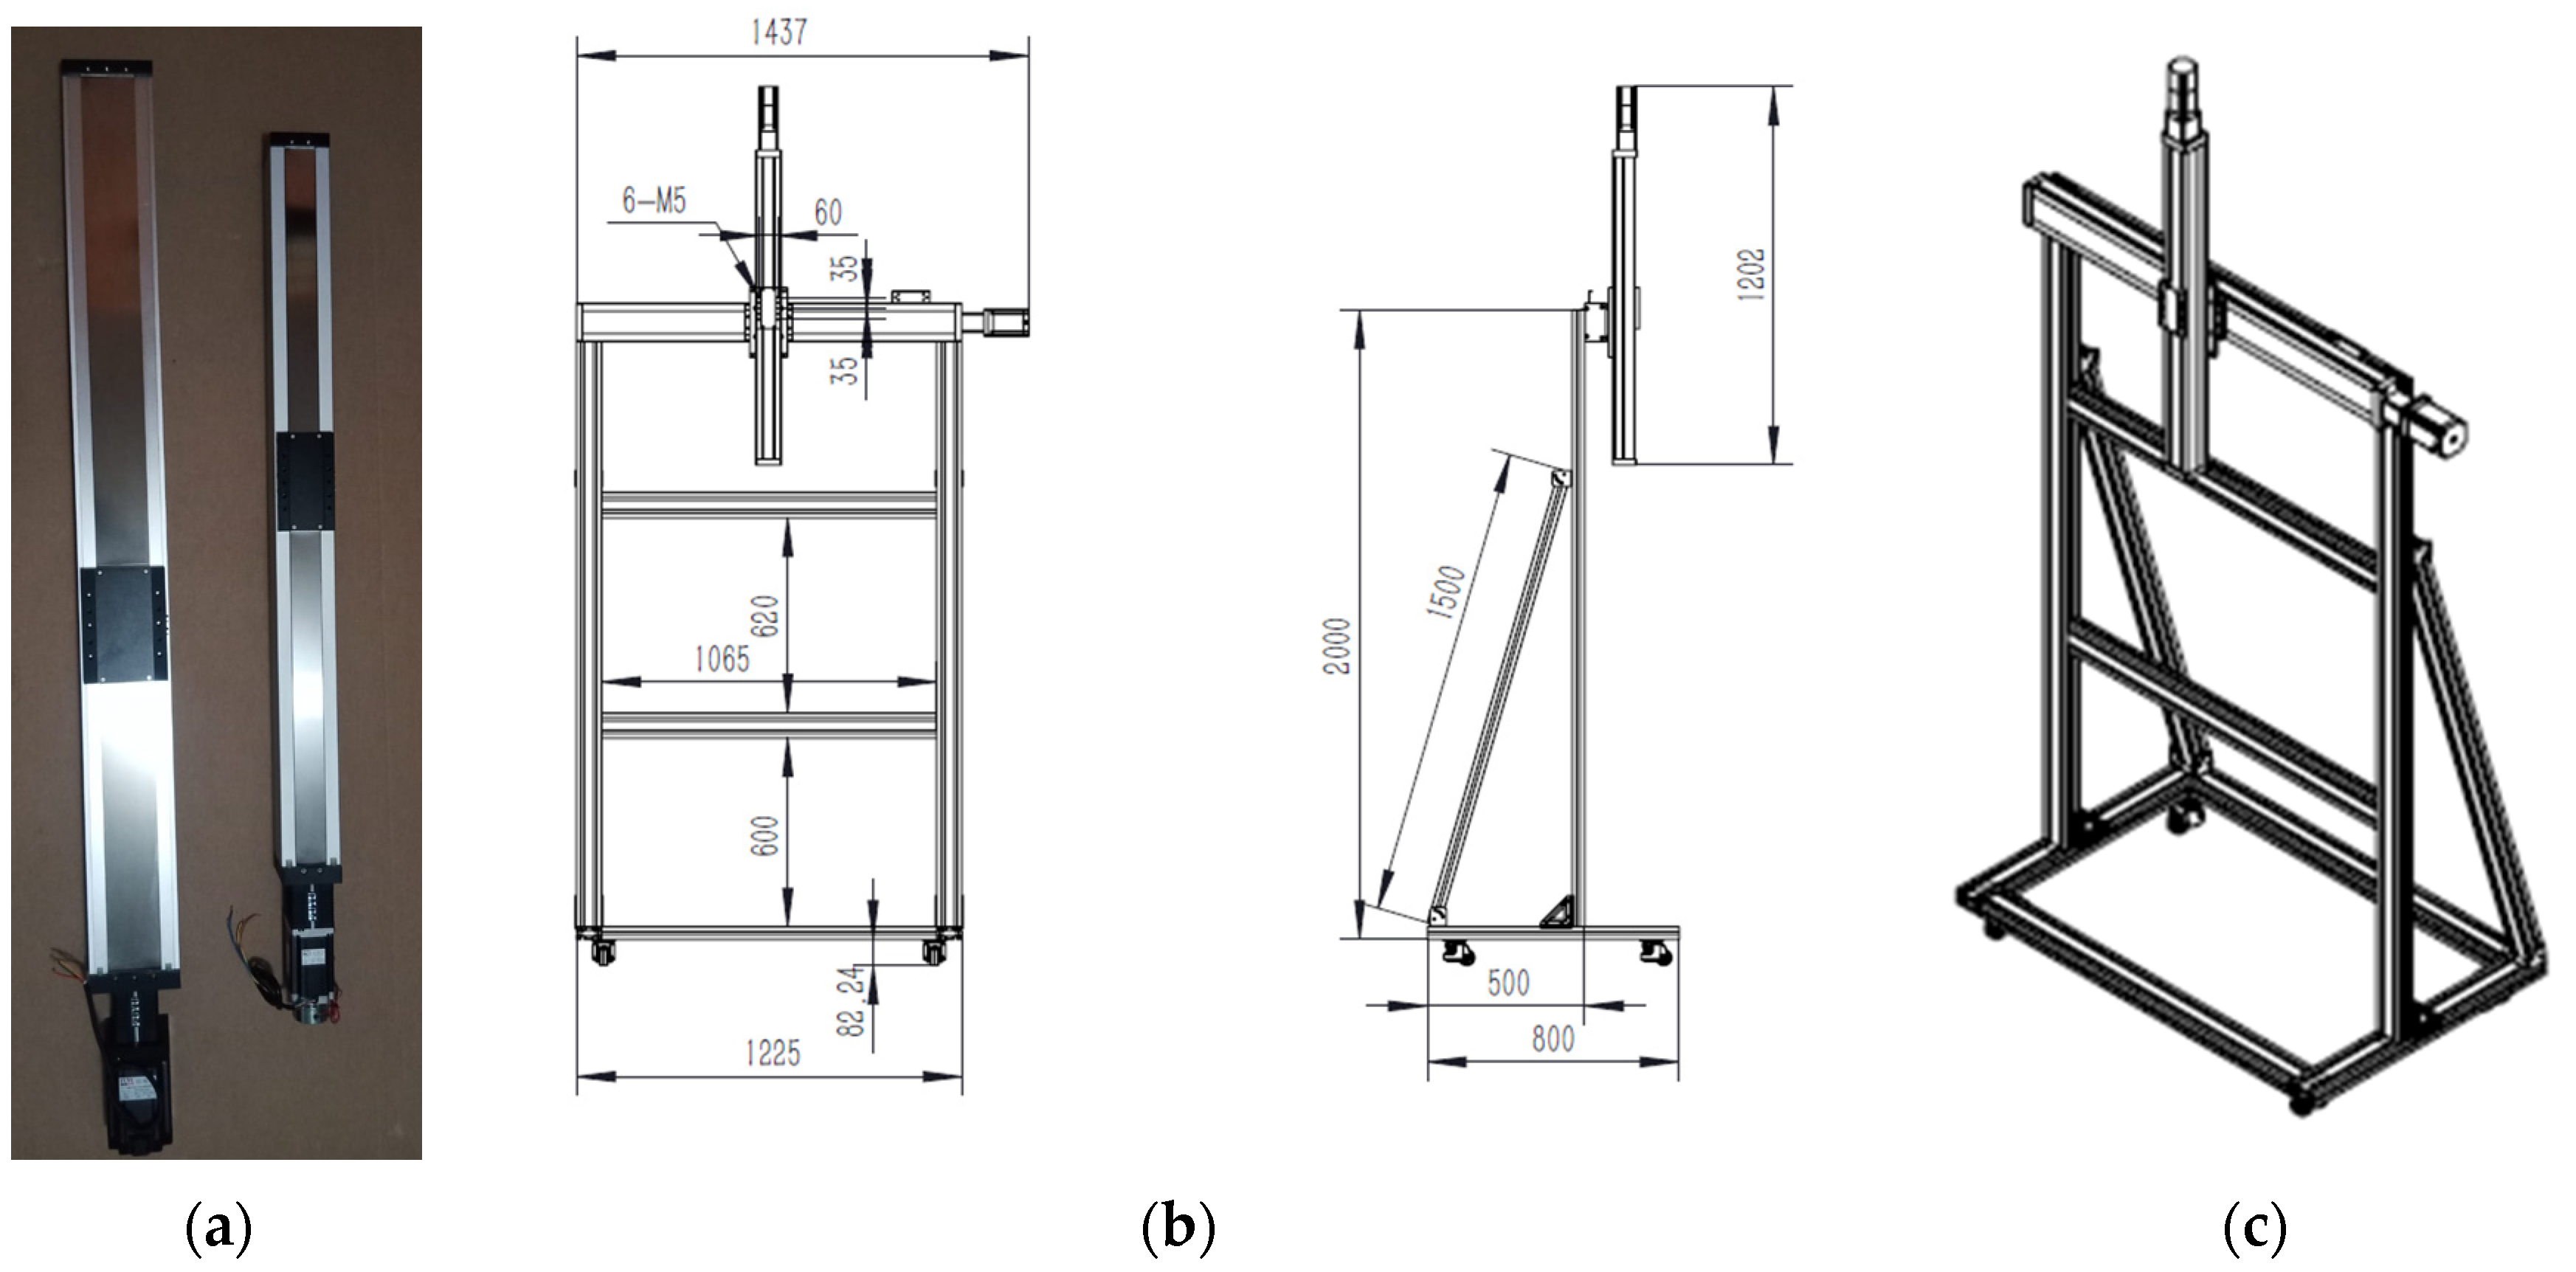
Figure 9.
a) Zero position for starting and ending point of the thermal cycle, b) heating position in electric resistance furnace to test temperature, and c) cooling position on Jominy device.
Figure 9.
a) Zero position for starting and ending point of the thermal cycle, b) heating position in electric resistance furnace to test temperature, and c) cooling position on Jominy device.
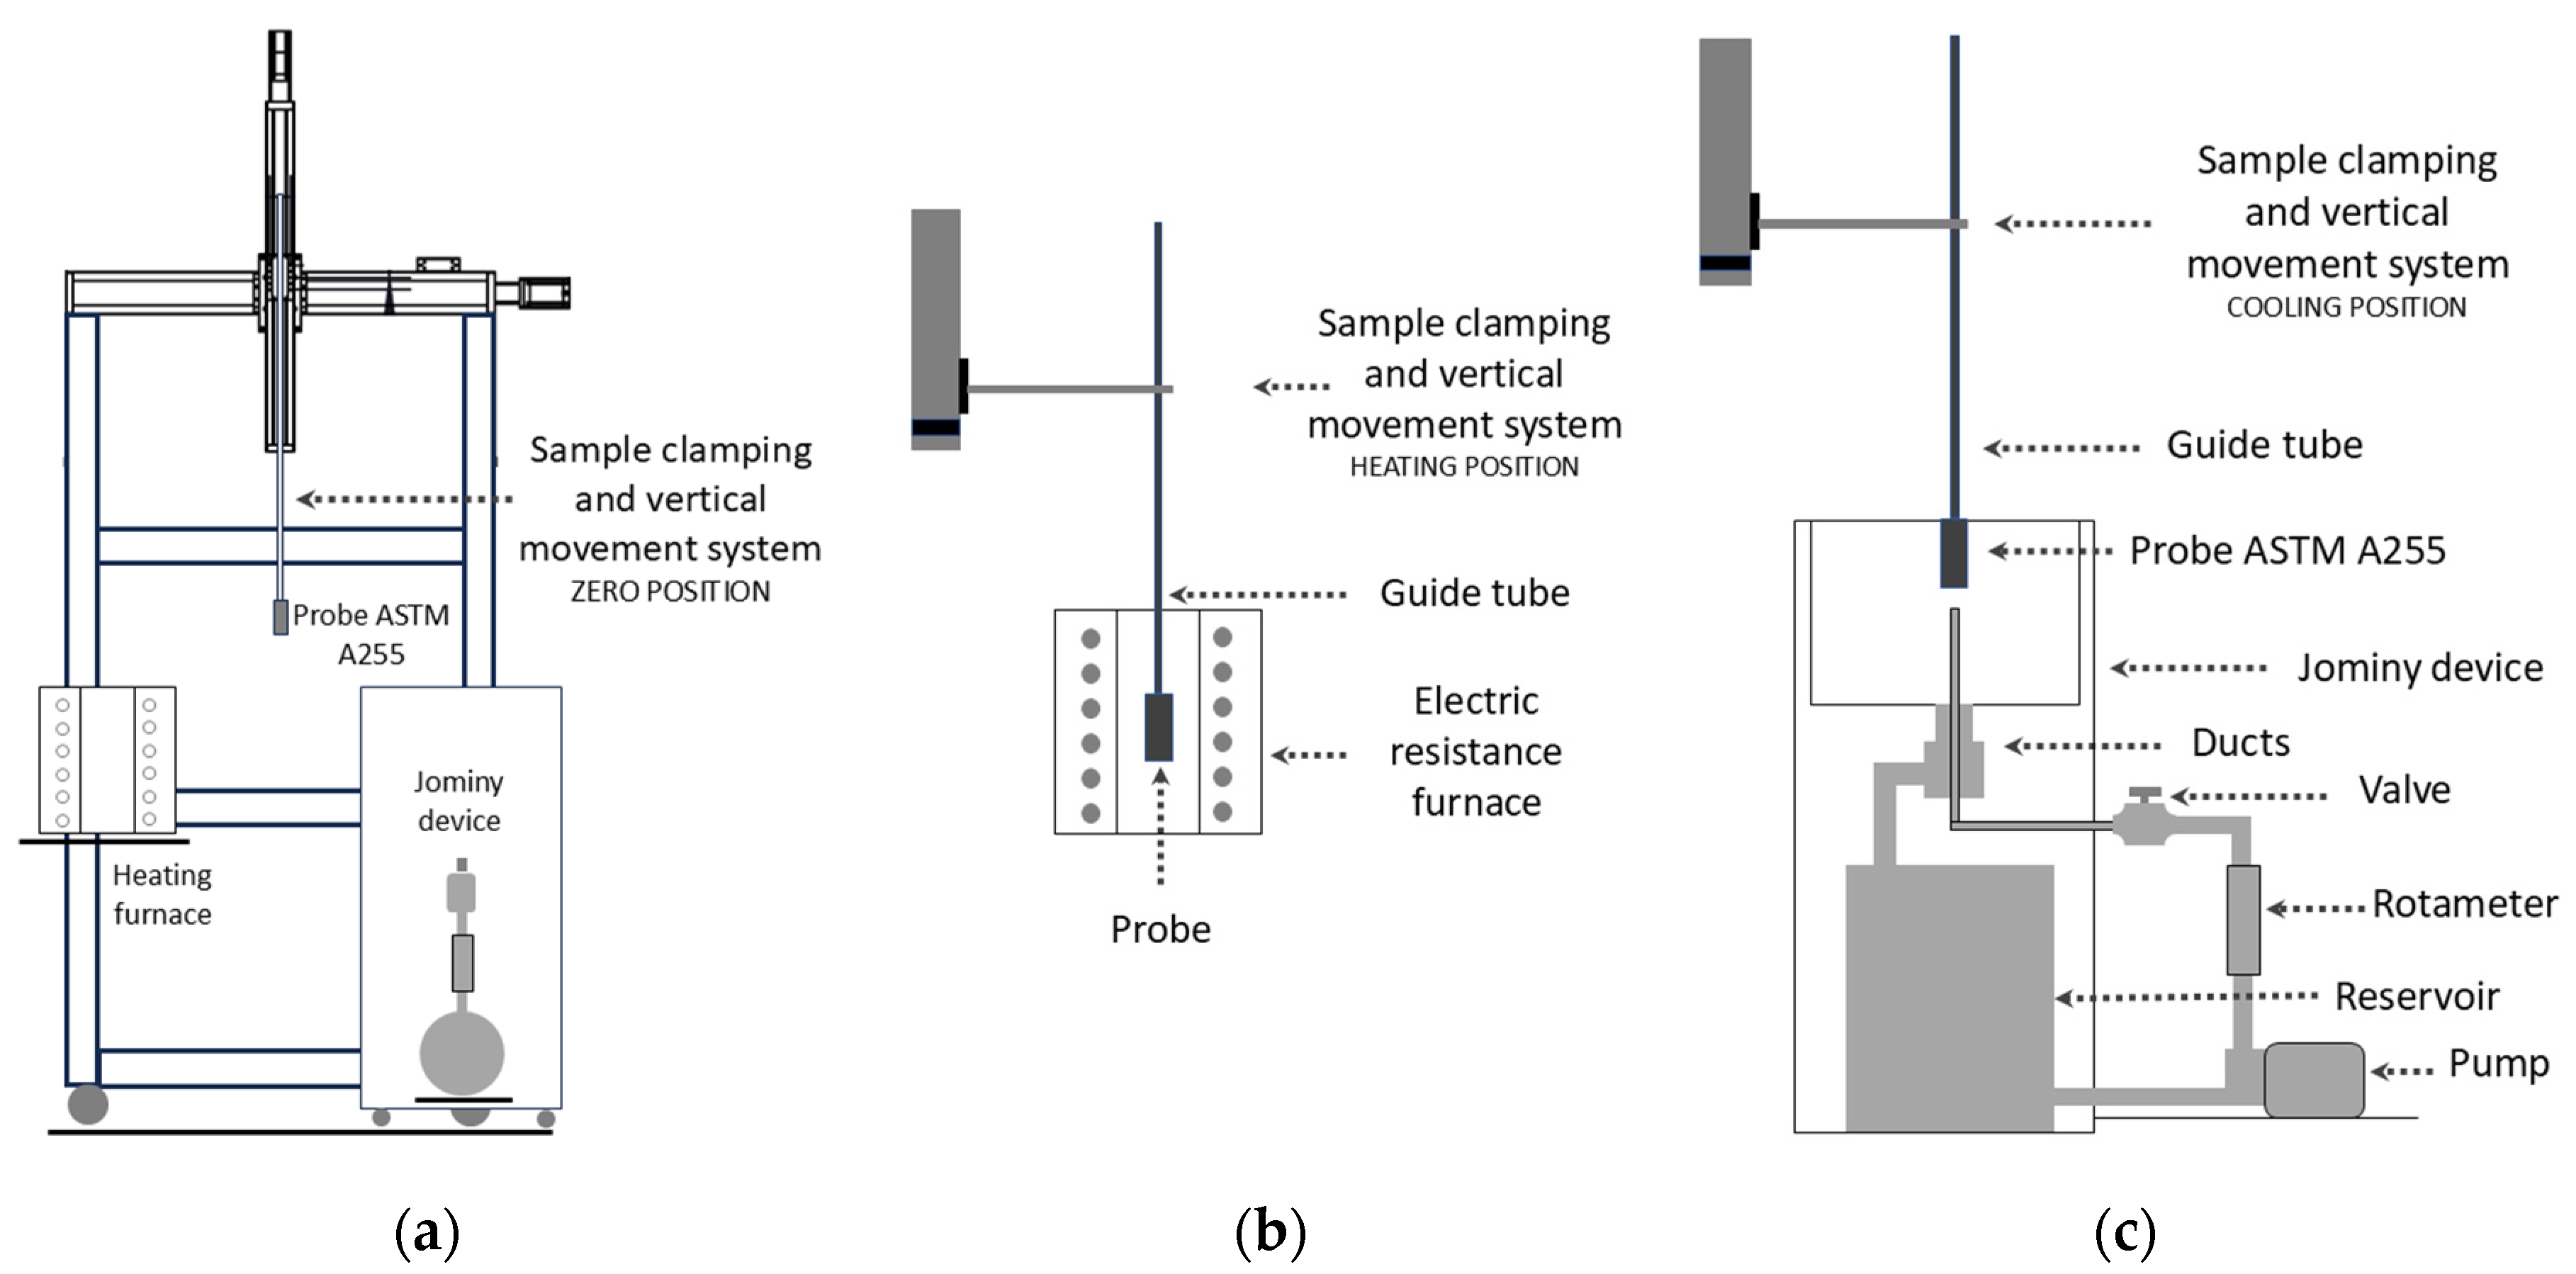

Table 1.
Temperatures in degrees Celsius recorded at critical points for the furnace design.
| Record | Minimal in housing | Maximum in housing | Minimum in Probe |
|---|---|---|---|
| CAE | 65.25 | 178.88 | 1123.41 |
| Furnace | 36 | 167.8 | 1098 |
Disclaimer/Publisher’s Note: The statements, opinions and data contained in all publications are solely those of the individual author(s) and contributor(s) and not of MDPI and/or the editor(s). MDPI and/or the editor(s) disclaim responsibility for any injury to people or property resulting from any ideas, methods, instructions or products referred to in the content. |
© 2025 by the authors. Licensee MDPI, Basel, Switzerland. This article is an open access article distributed under the terms and conditions of the Creative Commons Attribution (CC BY) license (http://creativecommons.org/licenses/by/4.0/).
Copyright: This open access article is published under a Creative Commons CC BY 4.0 license, which permit the free download, distribution, and reuse, provided that the author and preprint are cited in any reuse.


