Submitted:
16 January 2025
Posted:
17 January 2025
You are already at the latest version
Abstract
Alcalá de Ebro is located 35 kms northwest of the city of Zaragoza. On the banks of the river Ebro itself. And more specifically at the outlet, towards the river, of a ravine (Juan Gastón), with a basin of reception of contributions of more than 230 km2. Over time, urbanisation and agricultural development have eliminated the final stretch of the drainage channel, and these water inputs have become sub-surface, filtering through the ground. This section of the Ebro River valley is located on a Tertiary substratum, marliferous, which favours dissolution-socavation processes that, in turn, cause sinkholes. The land tends to sink progressively or generates sudden collapses in the ground. Many studies have been carried out to try to understand not only the origin of the phenomenon, but also its geometry and the area affected by it in the town of Alcalá de Ebro. In this sense, it has been possible to model an area around the main access road, where numerous collapsing sinkholes have been found, blocking the way and affecting houses. It also affects the mote that protects the village from the floods of the river Ebro. Based on these studies, specific knowledge has been obtained, which has allowed us to evaluate measures to consolidate the ground, which have been implemented with apparent success up to now. Several injection campaigns have been carried out; first using expansive resins and finally with columnar development, with special low-mobility mortars, to fill-consolidate the undermined areas and prevent new subsidence. The actions have produced satisfactory results, but it is considered necessary to continue with the observation of the situation, extending the attention to a wider area to prevent, as far as possible, new problems of subsidence-collapse.
Keywords:
collapse hazard
; sinkhole mitigation
; gypsum karst
; Alcalá de Ebro
; injections
; geogrid
; evaporitic rocks
; topographic auscultation
; results obtained
1. Introduction
Alcalá de Ebro is a small town on the banks of the Ebro River, the largest river of the Iberian Peninsula and which collects a large part of the meltwater from the southern slopes of the Pyrenees. Thus, Alcalá de Ebro is located in the Ebro Corridor, a 6-km-width corridor defined by a succession of low and medium terraces on the right bank of the river that, in a staggered manner, make the relief descend from heights of about 300 m to 215 m at the current riverbed. The urban centre is found between heights 221 m and 226 m, occupying the lowest terrace (considered the current flood plain). The river adopts here a meandering geometry, according to its low longitudinal slope (around 0.06 %), and constitutes the regional base level Geologically, it is located in the sedimentary basin of the Ebro River and surrounded by three mountain systems: Pyrenees, Iberian Mountain Range and Coastal-Catalan Mountain Range. The stratigraphy of the area consists mainly of a Tertiary rock substratum of marls and gypsum, strongly altered in its superficial levels, on which Quaternary materials are deposited of variable thickness and compactness. The gypsum presents a rather monotonous aspect, being constituted by white gypsum with nodular structure. Gray-greenish marls and shales appear associated with the gypsum materials or alternating with them [1, 2]. Quaternary formations outcrop widely throughout the area, arranged in several terrace levels associated with the Ebro River, as well as different glacial deposits and colluviums [2].
In a first phase of research (between 2013 and 2021), work was done on the recognition of the area affected by the sinkholes, on the development of a geological-geotechnical model, and on the assessment and application of measures (between 2015 and 2018) to consolidate the land through injections; initially with expansive resins, and later with special low mobility mortars [3]. In the latter, intakes and injection pressures were methodically controlled. These injections reached between -21 and -24 meters and presented very different mortar admissions depending on the compactness-cohesion of the terrain, recorded at different depths. The largest admissions are concentrated fundamentally in a section, between -14.0 meters and -21.0 meters (between 5 and 7 meters thick), where it was recognized that there is a dissolution-undermining process associated with levels or strata of salts (type glauberite, halite...) that are exceptionally soluble [3].
In a second phase of work (between 2021 and 2024), all the existing data obtained for the investigation of the recorded subsidence have been processed again, both geotechnical tests (probing and dynamic penetration tests) and geophysical prospecting (gravimetry, georadar, electrical tomography...), and new research has been incorporated, expanding the study area. But, above all, a specific procedure has been carried out to analyse the surface of the land through topographic auscultation, at the highest level of detail possible, allowing plans to be obtained with which to interpret apparent areas of relative subsidence that may be related. with all these apparent collapses that have been occurring for years.
All this information has been concentrated on the precision topography obtained by means of the terrestrial laser scanner (an RTC360 laser scanner, from Leica Geosystems, has been used) and has served as a basic contrast element that, in turn, allows better placement of the affected areas and assess the effectiveness of the measures already applied (columnar injections of low-mobility mortar), appreciating how these evolve.
The result confirms the good performance (in the last 6-7 years) of the treated areas (on the moat and on the access road to Alcalá) except at a point located towards the limit located towards the east, where apparently the injection campaign was not sufficiently completed. The purpose is to continue with the control and monitoring of possible phenomena related to subsidence-subsidence problems, in the affected area and its immediate surroundings, in anticipation of recognizing and, where appropriate, being able to anticipate subsidence or collapse phenomena that affect the body of the embankment, and the population of Alcalá de Ebro could be put at risk due to flooding.
2. Methodology
The control and research method used has been based on the following works [4]:
- Review, at source, of all the information accumulated in recent years and results of the consolidation procedure of the undermined terrain by injections of “low mobility” (B.M.) mortar. Composing a map of integration and synthesis of all the information which includes rotational surveys and other tests (pit pits, dynamic penetration tests...). It also incorporates the superposition of all the geophysical techniques carried out, locating the main anomalies recorded in plan.
- Topographic auscultation. For this, the RTC360 laser scanner, from Leica Geosystems, has been used, in collaboration with the company Tecnitop, specialists in digitization and three-dimensional applications in heritage, engineering and industrial metrology. This laser takes panoramic images, superimposed on a cloud of high precision points, at a speed of 2,000,000 points/second. It has a range of up to 130 m, presenting millimetres precision. This type of analysis allows us to obtain 3D images composed of point clouds. By processing (Cloud Compare software: 3D point cloud editing and processing software) of these images, detailed topographies are generated that will serve to relocate all the existing information from tests and trials carried out. It also helps to identify differential movements, deduced from small depressions and crack systems recognized both on the surface and on the façades of some houses.
- New geophysical surveys and verification surveys in the identified areas, expanding the work area, to be able to assess whether the consolidation carried out transfers possible effects to other neighbouring areas, within a nearby environment.
3. Results
3.1. Results of the Consolidation Procedure of the Undermined Terrain Using “Low Mobility” (B.M.) Mortar Injections
As a reference to the results obtained, in the section of the avenue protection area affected by scour, the admissions/injection pressures of those carried out in row 2 are included (Figure 1). This turns out to be probably the most representative of the situation based on the geotechnical model carried out.
An average mortar consumption of up to 250 litres per linear meter of drilling (two manoeuvres of 0.5 meters) was estimated. However, as an example of the disparity of the situation, in one case admissions of up to 9,000 litres were recorded in an extraordinary manner (injection No. 13), and in many other cases no admissions were recorded outside the filling of the borehole itself:
- In the first row (closest to the river) consumption has been exceptionally high. The total, injected in the first row: 135,165.85 litres in 13 injections of 24 meters of relative length. Of the order of 433.22 litres/m.l.
- In the second row these consumptions were moderated by being “protected by the injections of the first row” and by having recalibrated the injection procedure. Total, injected in the second row: 76,331.50 litres in 13 injections of 24 meters of relative length. Of the order of 244.65 litres/m.l.
- In the third, 46,339.30 litres were injected in 7 injections of 24 meters in relative length. Of the order of 275.83 litres/m.l.
- In the fourth row, these consumptions moderated even more as they were confined between the first three rows and the injections carried out in 2015 on the street (very close). Total, injected in the second row: 33,321.45 litres in 7 injections of 24 meters of relative length. Of the order of 198.34 litres/m.l.
Conclusions and relevant aspects to evaluate about the results obtained in the injection campaign are the following:
- Admissions are mainly concentrated in the recognized section, between -14.0 meters and -21.0 meters (between 5 and 7 meters) where it is assessed that there is a dissolution-undermining process associated with levels or strata of salts. (type glauberite, halite...) exceptionally soluble.
- More than half of the registered admissions are concentrated in that section. Of the order of 35,000 litres of mortar.
- It is confirmed that, during drilling, at -24 meters deep, the resistance to drilling is greater. It is not considered necessary to continue going deeper. Based on the developed model, the injections penetrate on the order of 3-5 meters into the apparently undercut rock substrate. In this first interval, admissions are recorded, once the drilling-injection pipe is filled, of the order of 20 to 30 litres/m.l. which practically corresponds to the filling of the perforation itself.
- The intakes, between -14.0 and -6.0 meters, present intakes ranging between 200 and 250 litres/m.l., on average. Although volumes of up to double the injected mortar are occasionally recorded, where it can be interpreted that there are fillings from previous sinkholes and/or collapses that connected with the undermined lower level.
- The upper section (from -6 meters to the surface) corresponds to the body of the motte, built with compacted gravel. In dry terrain most of the time, it has admissions of 100-150 litres/m.l., and in many cases, the admission is reduced to the volume of the drilling itself. However, in some cases, overconsumption is striking, which implies the possibility of a hole already close to the surface. In row 1, in injections 4 and 5, consumption of up to 4 m3 was recorded, at a depth of around -6 meters.
- In this row 2, overconsumptions were also recorded in injections 15 and 18 with more than 700 litres/m.l. less than 2-3 meters from the surface. Although they do not constitute volumes that involve large voids, they can be related to fissures that connect them in depth. The same could be interpreted in the case of perforation No. 29 in row 3, and injection 34 in row 4.
The working method has been controlled by a recording system in which, during the injection process, the volume and pressure reached in the manoeuvre can be recognized at each step (relative depth). The Figure 2 includes the monitor where the injection number (24), the relative depth (at -20 meters), the total volume injected (373.2 litres) and the pressures reached (up to 20.4 bars) are recognized.
A rigorous control was carried out on the characteristics of the mortar. Specifically, its dosage to control its density and viscosity, with the intention that it remain in the environment of the application itself, generating semi-columnar structures. (Figure 3).
The Figure 4 the position and relative dimensions of the injections carried out on the geological-geotechnical profile obtained through the correlation of surveys and geophysical prospecting techniques. In practically all cases, the firm substrate was reached, and at least 2-3 meters were embedded.
The only thing that has failed, in the most marginal row, towards the village, is injection No. 27, which was apparently made on an old well and which was filled with waste of all kinds. The problem is expressed in the graph.
3.2. Control Work on the Consolidation Measures Carried out. Topographic Auscultation
The procedure is based on taking panoramic colour images, superimposed on a high-precision point cloud at a speed of 2,000,000 points/second. It has a range of up to 130 m, presenting millimetre precision.
The use of this 3D technology (Figure 5) provides a series of advantages, compared to the usual 2D one, which we list below:
- Greater “as-built” information: The capture of reality data is much more complete than usual acquisitions, which represents an increase in reliability and precision, as well as better visualization than dealing with 2D plans.
- Allows greater access to information: Information is better available, since we can manage the model in 3 dimensions, which allows excellent structuring of it.
- Provides better use of information: The multiple possibilities of obtaining final results provide us with a better design.
- Better capture and post-processing method: If we compare with any traditional method, we can obtain great advantages by using 3D laser scanner technology.
The fundamental objective of this type of analysis is to obtain a detailed topography of the studied area, obtaining a 3D image, and perform a topographic comparison between the different auscultations, thus identifying the differential movements produced in a certain time interval. In this way, it will be possible to focus on the origin of the problem that has led to the deformations recorded.
A total of 51 stations have been made for this campaign (09/24/2024), between the town (27 stations) and moat (24 stations). In this case, a total overlap of 47% and a set error were achieved. 0.7cm.
The use of this 3D technology provides a series of advantages, compared to the usual 2D one, which we list below:
- Mayor information “as built”: The capture of reality data is much more complete than usual acquisitions, which means an increase in reliability and precision, as well as better visualization than dealing with 2D plans.
- Allows greater access to information: Information is better available, since we can manage the model in 3 dimensions, which allows excellent structuring of it.
- Provides better use of information: The multiple possibilities of obtaining results provide us with a better design.
- Better capture and post-processing method: If we compare with any traditional method, we can obtain great advantages by using 3D laser scanner technology [4, 5].
The fundamental objective of this type of analysis is to obtain a detailed topography of the studied area, obtaining a 3D image, and perform a topographic comparison between the different auscultations, thus identifying the differential movements produced in a certain time interval. In this way, it will be possible to focus on the origin of the problem that has led to the deformations recorded [6, 7].
A total of 51 stations (Figure 6) have been made for this campaign (09/24/2024), between the town (27 stations) and moat (24 stations). In this case, a total overlap of 47% and a set error were achieved 0.7cm.
The conclusions from comparative between 2021 and 2023 are:
- The landslide identified in the monitoring carried out in 2022 (transverse sections 1 to 4) has not undergone a significant evolution since that date. In some points it may have suffered a slight relative settling at the top of the mote.
- In the regrowth of the moat, carried out in the winter of 2021-2022, a slight accommodation of the crown of the moat has been identified.
- The ruts and other deformations generated by the work on the crown of the moat continue to be observed.
- The deformations identified in the stairs continue to suffer slow subsidence. In the topographic comparison carried out between the 2021 and 2023 auscultations (Figure 7 and 8), anomalies are identified on both sides of the stairs. These, in part, may be due to the presence of vegetation in the 2021 campaign and its absence in 2023. However, towards the north, between PPKK 90-100, the identified anomalies tend to join those identified in the point 1., corresponding to the slip.
- There are no apparent seats in the park surroundings. At this point, in the UGPR-1 profile (points 200 to 260 of the longitudinal profiles), an anomaly in depth was identified. Possible cavity.
The deformations recorded in Station path are as follows:
- Old sinkhole (1975). Old sinkhole [8].
- 75. Deformations of up to 0.9 – 1.2 cm are observed between November 2021 and October 2023. This differential movement is reflected in cracks identified in the pavement, as well as in the walls that would make up old structures of houses or corrals. In these years, a significant increase in the size and dimension of these cracks has not been observed, given that the recorded evolution is not very high.
- Deformations in the public park. Between November 2021 and October 2023, minor, specific deformations are identified, which generally vary between 0.5 and 0.8 cm, although it can reach 2.0 cm.
- Concentric contour curves are identified in topography. This point is related to deformations in structure No. 11 of Station path. It would be related to points 1 and 2, presenting the rocky substrate at a depth of 22 m.
- Deformation at the corner of Station path and Royal path. Related, in depth, to the collapses that occurred previously in the parking lot area.
- Deformations close to the moat dam wall. In the area around point 5, in the access ramp-stairs to the motte located next to the park, outside the detailed topography, a series of cracks have been observed that indicate a certain relative settlement. Apparently, it is related to the deformation No. 5. According to the topographic comparison carried out, in the time interval 11/22/2021-10/05/2023, a relative settlement of between 0.8 and 1.3 cm has occurred.
- Parking area. Related to the collapses that occurred at this point, which were partially treated in 2016-2017 by injections of low-mobility mortar columns.
- Station path and Don Miguel Cervantes Street. A small deformation has been identified next to the bar, and another larger one, which seem to indicate differential settlements towards the motte. In the area around point 7, a concentric depression is identified, right at the intersection between Station path and Don Miguel Cervantes Street. A subsidence has been measured from 11/22/2021 to 10/05/2023 of the order of 1cm around greatest deformation. This point is in a sewage or supply network manhole, although it appears to move, to a lesser extent, towards the sewer located to the north.
- On the other hand, the following have been detected in the moat:
- Small deformations of the motte towards the free face that faces the Ebro River, apparently related to slow movements of the slope due to the undermining of the river current.
- Deformation of the slope towards the interior; towards the town side. Up to 15-20 cm maximum descent towards the slope spill.
- Deformations at the top of the hill, next to the park. These topographic subsidences would correlate with certain anomalies pointed out in previous studies.
- Apparent collapse in the motte that projects towards the access “ramp”. Made to go up from the street. At this point, the presence of new cracks has been observed (in the concrete of the access staircase), which mark possible deformations or differential settlements, and which correlate well with the slight subsidence indicated in point 5, identified, just below. Hey, on the sidewalk itself.
- Indications of sliding towards the free face of the slope; towards the river. The possible origin may be related to scour processes of the river current, which erosively affects this margin, or also related to settlements caused by a deeper scour connected with the karst activity of the specific area.
3.3. New Geophysical Surveys and Verification Surveys in the Identified Areas, Expanding the Work Area, to Be Able to Assess Whether the Consolidation Carried out Transfers Possible Conditions to Other Neighbouring Areas, Within a Nearby Environment
In the affected area and its surroundings, we consider that the combination of Electrical Tomography in 3D mode and UltraGPR-type Georadar constitute the geophysical tools with the greatest capacity to detect subsoil areas affected by dissolution processes of halite levels [2, 9, 10]:
- Electrical Tomography. The campaign carried out includes an Electrical Tomography profile and Ultra GPR profiles (mainly on the bike). The geophysical prospecting campaign was carried out by the company IGT (International Geophysical Technology, S.L.) in November 2021.
The tomography profile extended 150 m, was composed of 16 electrodes placed 5.5 m apart, and reached a depth of approximately 30 m. In the report written by IGT, it is indicated that the most significant part of a surface level of about 5 m thick, corresponding to the body of the mote and the possible detrital alluvial, is the resistive level interpreted as gypsum (Figure 10) located from 10 - 12 meters deep. This resistive level is abruptly interrupted between meters 45 and 85, where a moderately conductive anomaly is defined, interpreted as a karstified zone in the gypsum materials, and which extends below 30 meters deep.
- UltraGPR type georadar. The most notable section is that of the UGPR-1 profile, measured along the edge of the Ebro River, since it reveals the existence of an anomalous zone with considerable lateral and depth extension.
Its clearest manifestation is seen between meters 120 and 220 from 35 meters deep, but it is interesting that the anomaly extends to more superficial levels towards the North, in correspondence with the anomaly defined in the measurements. of Electrical Tomography, as can be seen by observing the results of both measurements (Figure 11).
The TE1 electrical tomography profile correlates with the UGPR-1 section, measured along the Ebro River moat. This georadar profile also reveals the existence of an anomalous zone with a considerable lateral extension and in depth. It is reasonable to interpret that this anomaly is due to the effect of an intensely karstified or altered area of the subsoil because there is no evidence of possible interference in the georadar records by elements located on the ground.
Its most apparent manifestation is observed between meters 100-165 and 180-245m. In the first section, especially in its central part (between 129 and 145m.), it clearly coincides with the anomalies recorded through the survey carried out using electrical tomography. The projection of the disturbance is even recognized towards the surface. In this same sense, it coincides with the projection towards the river (towards the north) of the area that has registered subsidence in recent years on Station path and the parking area.
The consolidation work of the injected section using mortar columns by B.M. They do not seem to manifest themselves in either of the two methods applied.
A second section in which a situation in latent development could be assessed and that could pose an obvious threat, is recorded in the section 180 to 245m. In this case, the anomaly is located at a relative depth of between -30 and -45 meters. Towards the south there is an apparent projection towards the surface.
As in the previous case, it could be interpreted as a reflection in continuity towards the moat, in the direction of the river, with the area of arrival to Alcalá from the south, where the first recorded sinkings (that we know of) are located. in the 70s-80s of the last century. Also with some manifestations, now recorded as apparent sinking on the surface. Both sections seem to converge at depth in what is interpreted as a strongly karstified area that would be located at depths below the order of 40-70 meters.
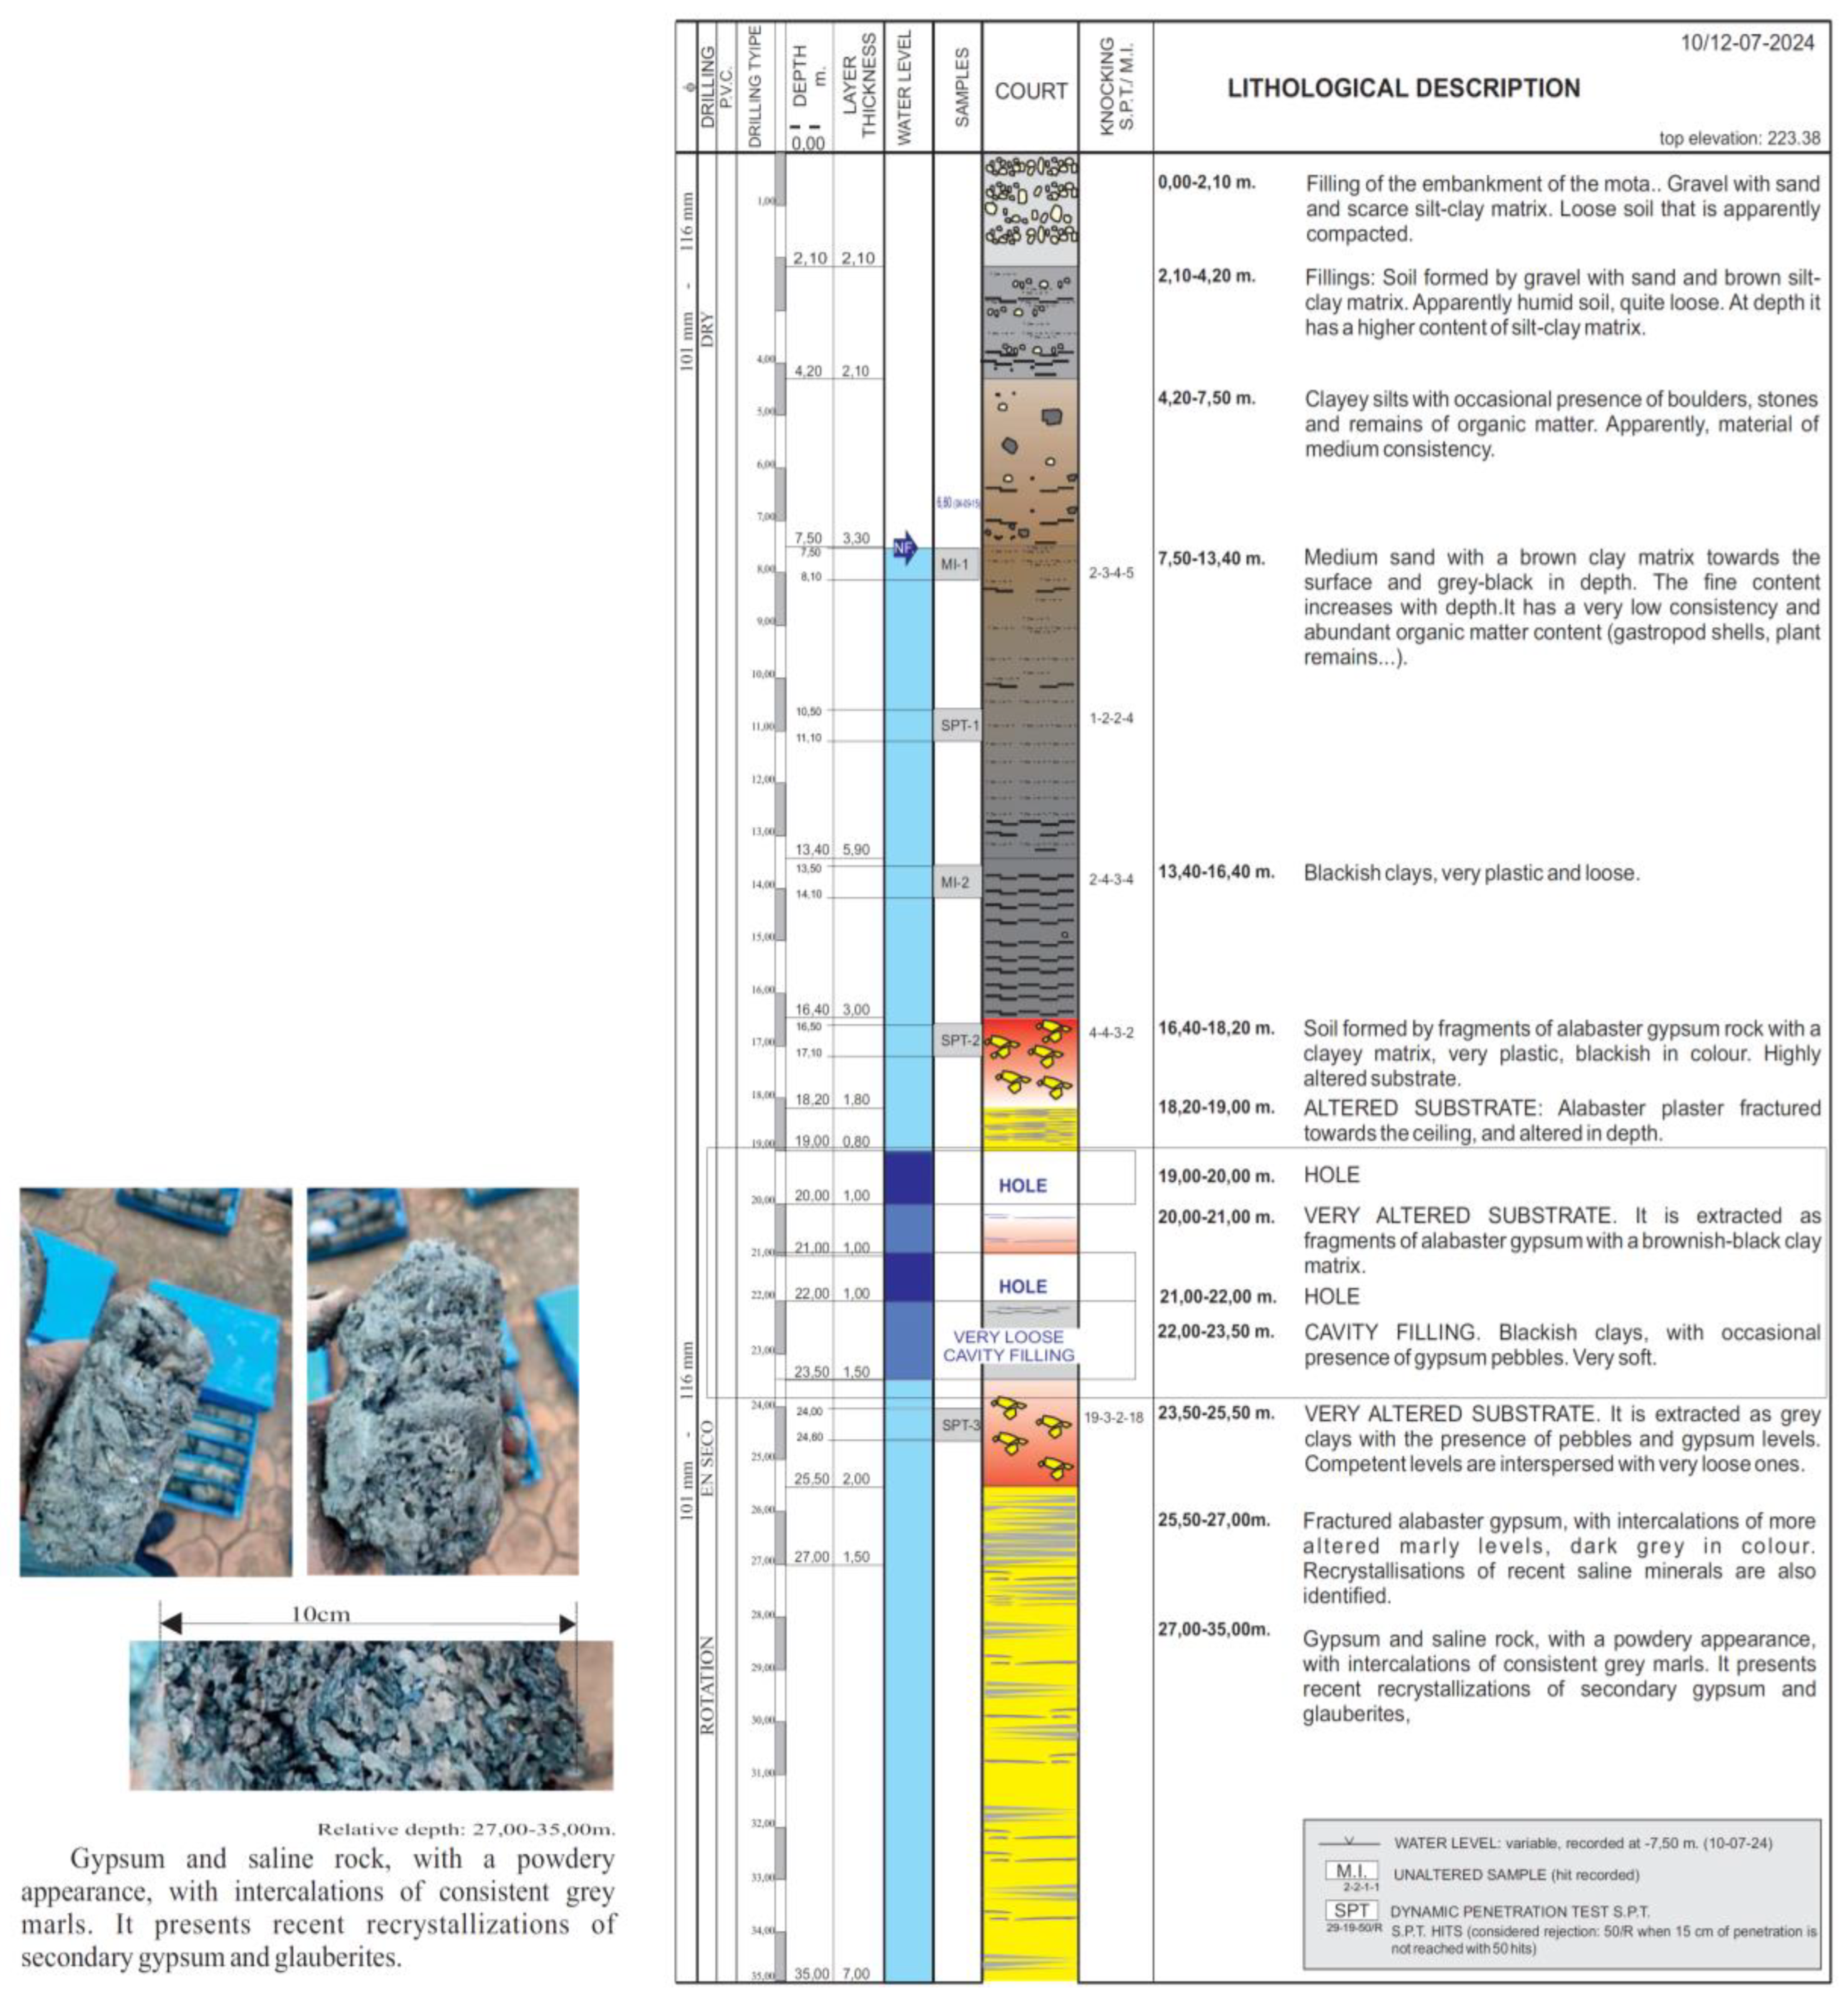
- Verification survey in the area indicated by the geophysical anomalies. Due to the presence of these anomalies at depth, it was especially interesting to carry out deep surveys to contrast the information obtained. For this reason, survey 1 was carried out (07-10-2024), which reached a depth of 35 m (figure 12).
Below the surface level of the motte fill, 4.20 m thick, a fundamentally sandy and silty level is identified, with occasional presence of boulders and gravel ridges. Towards the surface, the matrix is brown, but at depth, due to its greater apparent content of organic matter, it becomes dark brown. The consistency of this level is very low, with N15 SPT hits of 4 to 7. These values correlate very well, laterally, with the graphs extracted from the dynamic penetration tests carried out in 1998.
Below, between -13.40 and -14.60), a transitional terrain to the rocky substrate has been identified, composed of blackish clays, very plastic, and of very low consistency. It is possible that it is a very altered rock substrate, as a consequence of the presence and continuous circulation of water.
From -14.60 m, levels of gypsum and marl begin to be identified with very variable degrees of alteration. It should be noted that what is generally defined as “gypsum rock” is, more specifically, halitic and polyhalitic salts in which, in addition to massive gypsum (generally in the form of nodules), halite, crystals are recognized. of glauberite and, possibly, thenardite and epsomite.
This substrate is altered in the area closest to the contact with the alluvial cover, affected by variations in the water table, especially in the area closest to the bed of the Ebro River. The infiltration of water to deeper levels, from cracks or more altered levels, they can give rise to karst processes. Consequently, internal dissolution-undermining processes are being generated that favour the formation of chasms or sinkholes.
In this case, in the S-1 survey (2024) a hole has been identified between 19.00 and 20.00m deep, and between -21.00 and -22.00 m, with a clay fill level between - 22.00 and -23.50 m depth. Practically, at the same topographic level, a gap of 80 cm (between -17.30 and 18.10 m) was identified in the S-7 survey carried out in 1979 by the SGOP, under which haulages were identified that, we understand, they would fill the cavity.
4. Discussion and conclusions
The work carried out to consolidate the land in the areas most affected by subsidence and collapse problems is proving effective. The result confirms the good performance (in the last 6-8 years) of the treated areas (on the protection speck and on the access road to Alcalá) except at one point, located towards the limit located towards the east, where they appear Unfortunately, the injection campaign was not sufficiently completed. It is the intention, shortly, to undertake complementary works, applying the same procedure.
The geomorphological analysis of the land surface by processing the information obtained using a laser-scanner (RTC360, from Leica Geosystems) allows obtaining a topographic plan of the highest precision. The interest of this detailed topographic base is to allow:
- Have a support base on which to incorporate all the information collected in previous studies. Areas where the sinking-collapses that have been occurring are located are also included. It has made it possible to locate all the tests and surveys carried out; the geophysical anomalies of different nature recognized and the drilling campaigns, dynamic penetration tests, pits...
- The areas in which land consolidation work has been carried out have also been located with greater precision. Specifically, the two low mobility mortar injection campaigns. The first on Station path, and the second on the river protection moat.
- It has been possible to recognize areas where apparent relative sinking or subsidence is recorded. The formation of those points or small areas where closed or semi-closed contour curves are located, in this environment, can indicate the situation of a deformation process on the surface, related to the situation of sunken areas, in the process of subsidence and/or in risk of collapse. New trials and research have focused on these points. In a survey carried out in the last research campaign, undermined levels and holes have been recognized again at a depth very similar to that recognized in previous work phases.
- Taking the first measurements as a reference, new measurements by this work procedure allow and will allow us to assess whether the process is stopped, and/or if it is still underway. Even its speed of development.
The differential analysis of the measurements made has made it possible to create a synthesis plan in which apparent aspects of the surface can be related to deep surveys and investigations carried out through surveys and geophysical investigations. It has also been possible to contrast the effectiveness of the land consolidation measures carried out almost 6-8 years ago. In this sense, the area treated by injections of B.M. mortar. In the area where problems of subsidence and collapse occurred for years, it registers a very high level of stability. Only, and as a reference to the stability achieved, an evident subsidence is recorded on one edge of the treated area (car parks on street on the Way to the Station), where the injections carried out could be insufficient. It has been planned to intensify the consolidation work at that point.
Currently, no significant subsidence problems have been observed on the motte and in its immediate surroundings, despite the cavity identified at depth, the S-1 survey of 2024. Above all, considering that up to -18.20 m the terrain is very loose, and at -19.00 m depth, a hole is identified. It is possible that, if this apparent dissolution-undermining process continues, it could be reflected towards the surface in the form of slow subsidence (sima) or, less likely, collapse.
For this reason, in anticipation of recognizing and, where appropriate, being able to anticipate phenomena of subsidence or collapse that affect the body of the embankment, which could put the population of Alcalá de Ebro at risk due to flooding, it is recommended to continue carrying out At least a topographical control of the motte and its closest surroundings.
Author Contributions
Conceptualization, A.G., F.J.T., and A.B.; methodology, A.G. and A.G.; software, A.G. and A.G.; validation, A.G., F.J.T., and A.B.; formal analysis, A.G., A.G., and A.B.; investigation, A.G., A.G., and A.B.; resources, A.G. and A.G.; data curation, A.G. and A.B.; writing—original draft preparation, A.G.; writing—review and editing, F.J.T., A.B., and A.G.; visualization, F.J.T., A.B., and A.G.; supervision, A.B. and F.J.T.; project administration, F.J.T. All authors have read and agreed to the published version of the manuscript.
Funding
Funded with Aid for First Research Projects (PAID-06-24), Vice-rectorate for Research of the Universitat Politècnica de València (UPV).
Data Availability Statement
The data may be available on request from the first author but not publicly available due to being private.
Acknowledgments
We would like to thank the City Hall of Alcalá village for providing permissions and logistic support during the measurement campaigns. Thanks are also given to the Environmental Management Area of the Ebro Hydrographic Confederation (CHE). We are also grateful to MSc. Jesús Rico and Miguel Ángel Pérez-Picallo (CTA Associated Technical Consultants, S.A.P.) for his collaboration in the geotechnical reports.
Conflicts of Interest
The authors declare no conflicts of interest.
References
- Esnaola, J.M.; Leyva, F.; Marqués, L.; Ramírez del Pozo, J.; Granados, M.; Herranz, J.M. Geological map sheet 353 (Pedrola). Spanish Geological map scale 1:50000. Instituto Geológico y Geominero de España (IGME), Madrid, 1992 [in Spanish].
- Gutiérrez, F.; Benito-Calvo, A.; Carbonel, D.; Desir, G.; Sevil, J.; Guerrero, J.; Martínez-Fernández, A.; Karamplaglidis, T.; García-Arnay, A.; Fabregat, I. Review on sinkhole monitoring and performance of remediation measures by high-precision leveling and terrestrial laser scanner in the salt karst of the Ebro Valley, Spain. Engineering Geology 2019, 248, 283–308. [Google Scholar] [CrossRef]
- Gracia, A.; Torrijo, F.J.; Garzón-Roca, J.; Pérez-Picallo, M.; Alonso-Pandavenes, O. Identification and Mitigation of Subsidence and Collapse Hazards in Karstic Areas: A Case Study in Alcalá de Ebro (Spain). Appl. Sci. 2023, 13, 5687. [Google Scholar] [CrossRef]
- Sowers, G.F. Building on Sinkholes: Design and Construction of Foundations in Karst Terrain; American Society of Civil Engineers: Reston, VA, USA, 1996. [Google Scholar]
- Gutiérrez, F.; Galve, J.P.; Lucha, P.; Bonachea, J.; Jorda, L.; Jorda, R. Investigation of a large collapse sinkhole affecting a multi-storey building by means of geophysics and the trenching technique (Zaragoza city, NE Spain). Environ. Geol. 2009, 58, 1107–1122. [Google Scholar] [CrossRef]
- Cooper, A.H.; Gutiérrez, F. Dealing with gypsum karst problems: hazards, environmental issues and planning. Treatise on Geomorphology 2013, 6, 451–462. [Google Scholar]
- Sanz Pérez, E.; Sanz Riaguas, C. Identification and Investigation of Subsidence Areas to Mitigate Karstic Risks in Urbanized Areas of Madrid, Spain: A Case Study. Sustainability 2021, 13, 7716. [Google Scholar] [CrossRef]
- Zaragoza Gumis, G. Study for the Project of defenses against flooding in the urban area of Alcalá de Ebro. Geological Service for Public Works (SGOP), Ebro Hydrographic Confederation (CHE), Zaragoza, 1980 [in Spanish].
- Sanz Pérez, E.; Sanz Riaguas, C. Identification and Investigation of Subsidence Areas to Mitigate Karstic Risks in Urbanized Areas of Madrid, Spain: A Case Study. Sustainability 2021, 13, 7716. [Google Scholar] [CrossRef]
- Guerrero, J.; Gutiérrez, F.; Bonachea, J.; Lucha, P. A sinkhole susceptibility zonation based on paleokarst analysis along a stretch of the Madrid-Barcelona high-speed railway built over gypsum- and salt-bearing evaporites (NE Spain). Engineering Geology 2008, 102, 62–73. [Google Scholar] [CrossRef]
Figure 1.
Pressure/admission control in row nº2. Admission volumes recorded at each work level. Average in the 13 injections performed.
Figure 1.
Pressure/admission control in row nº2. Admission volumes recorded at each work level. Average in the 13 injections performed.
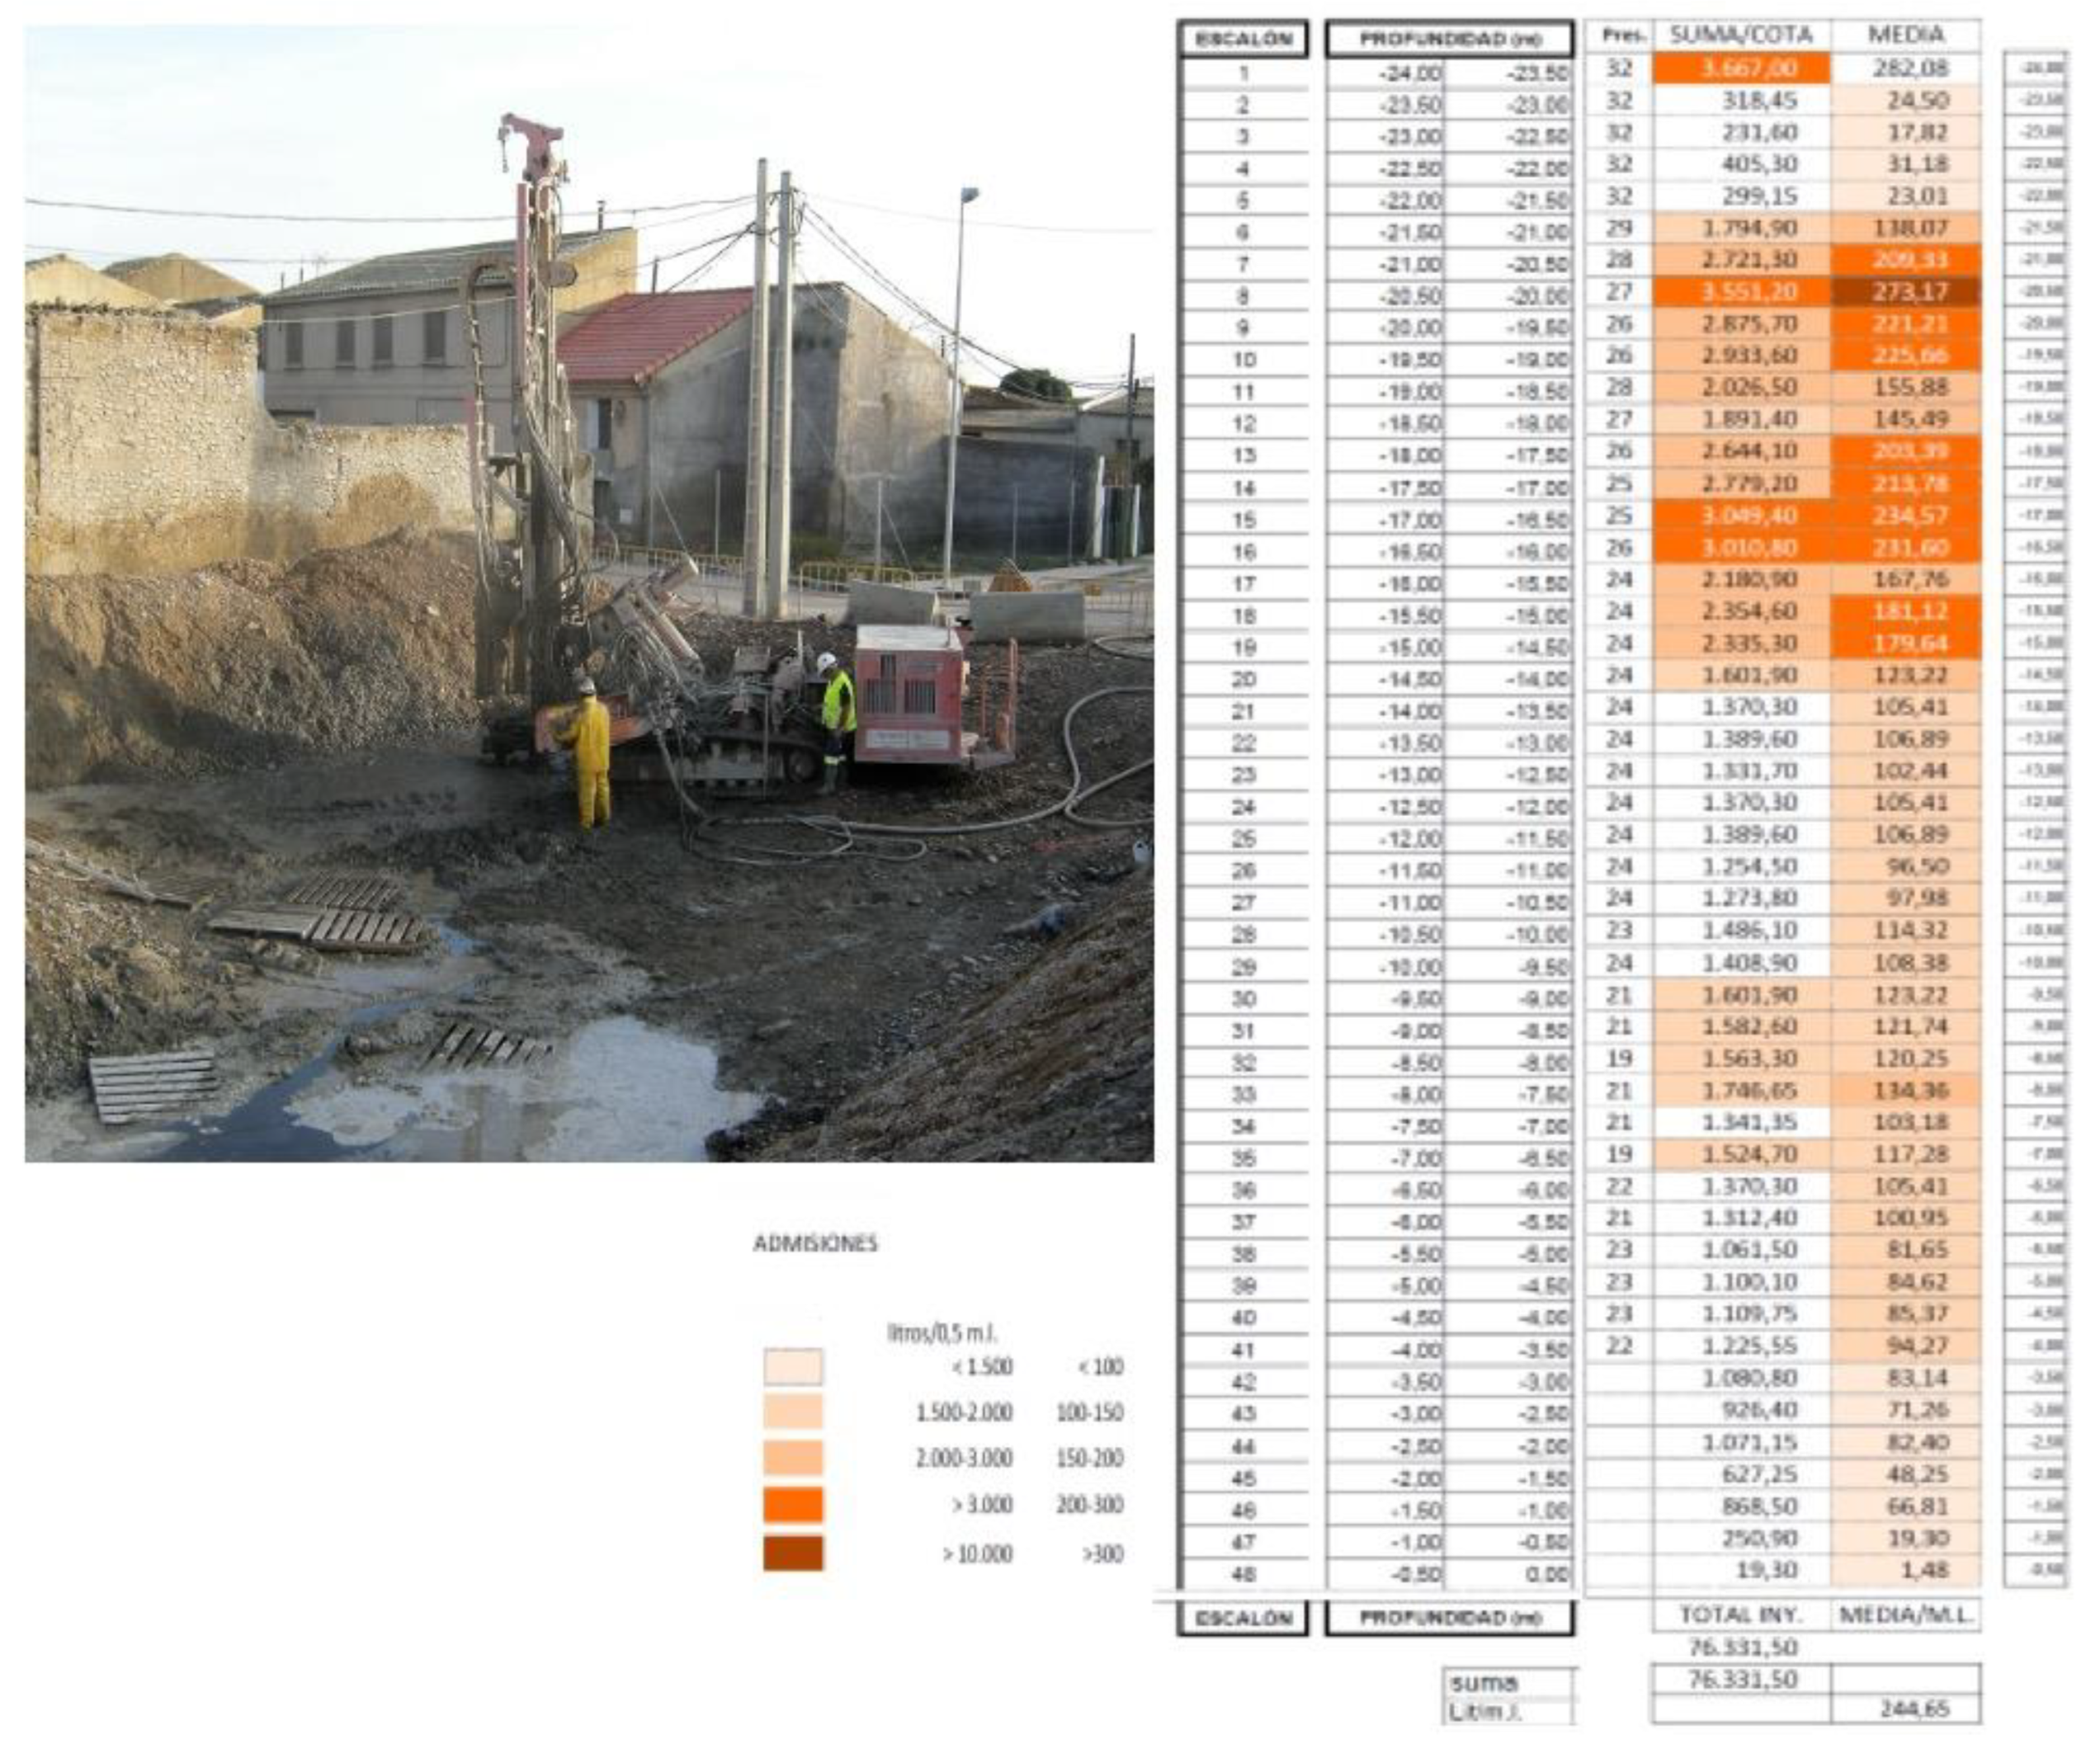
Figure 2.
Injection control equipment.
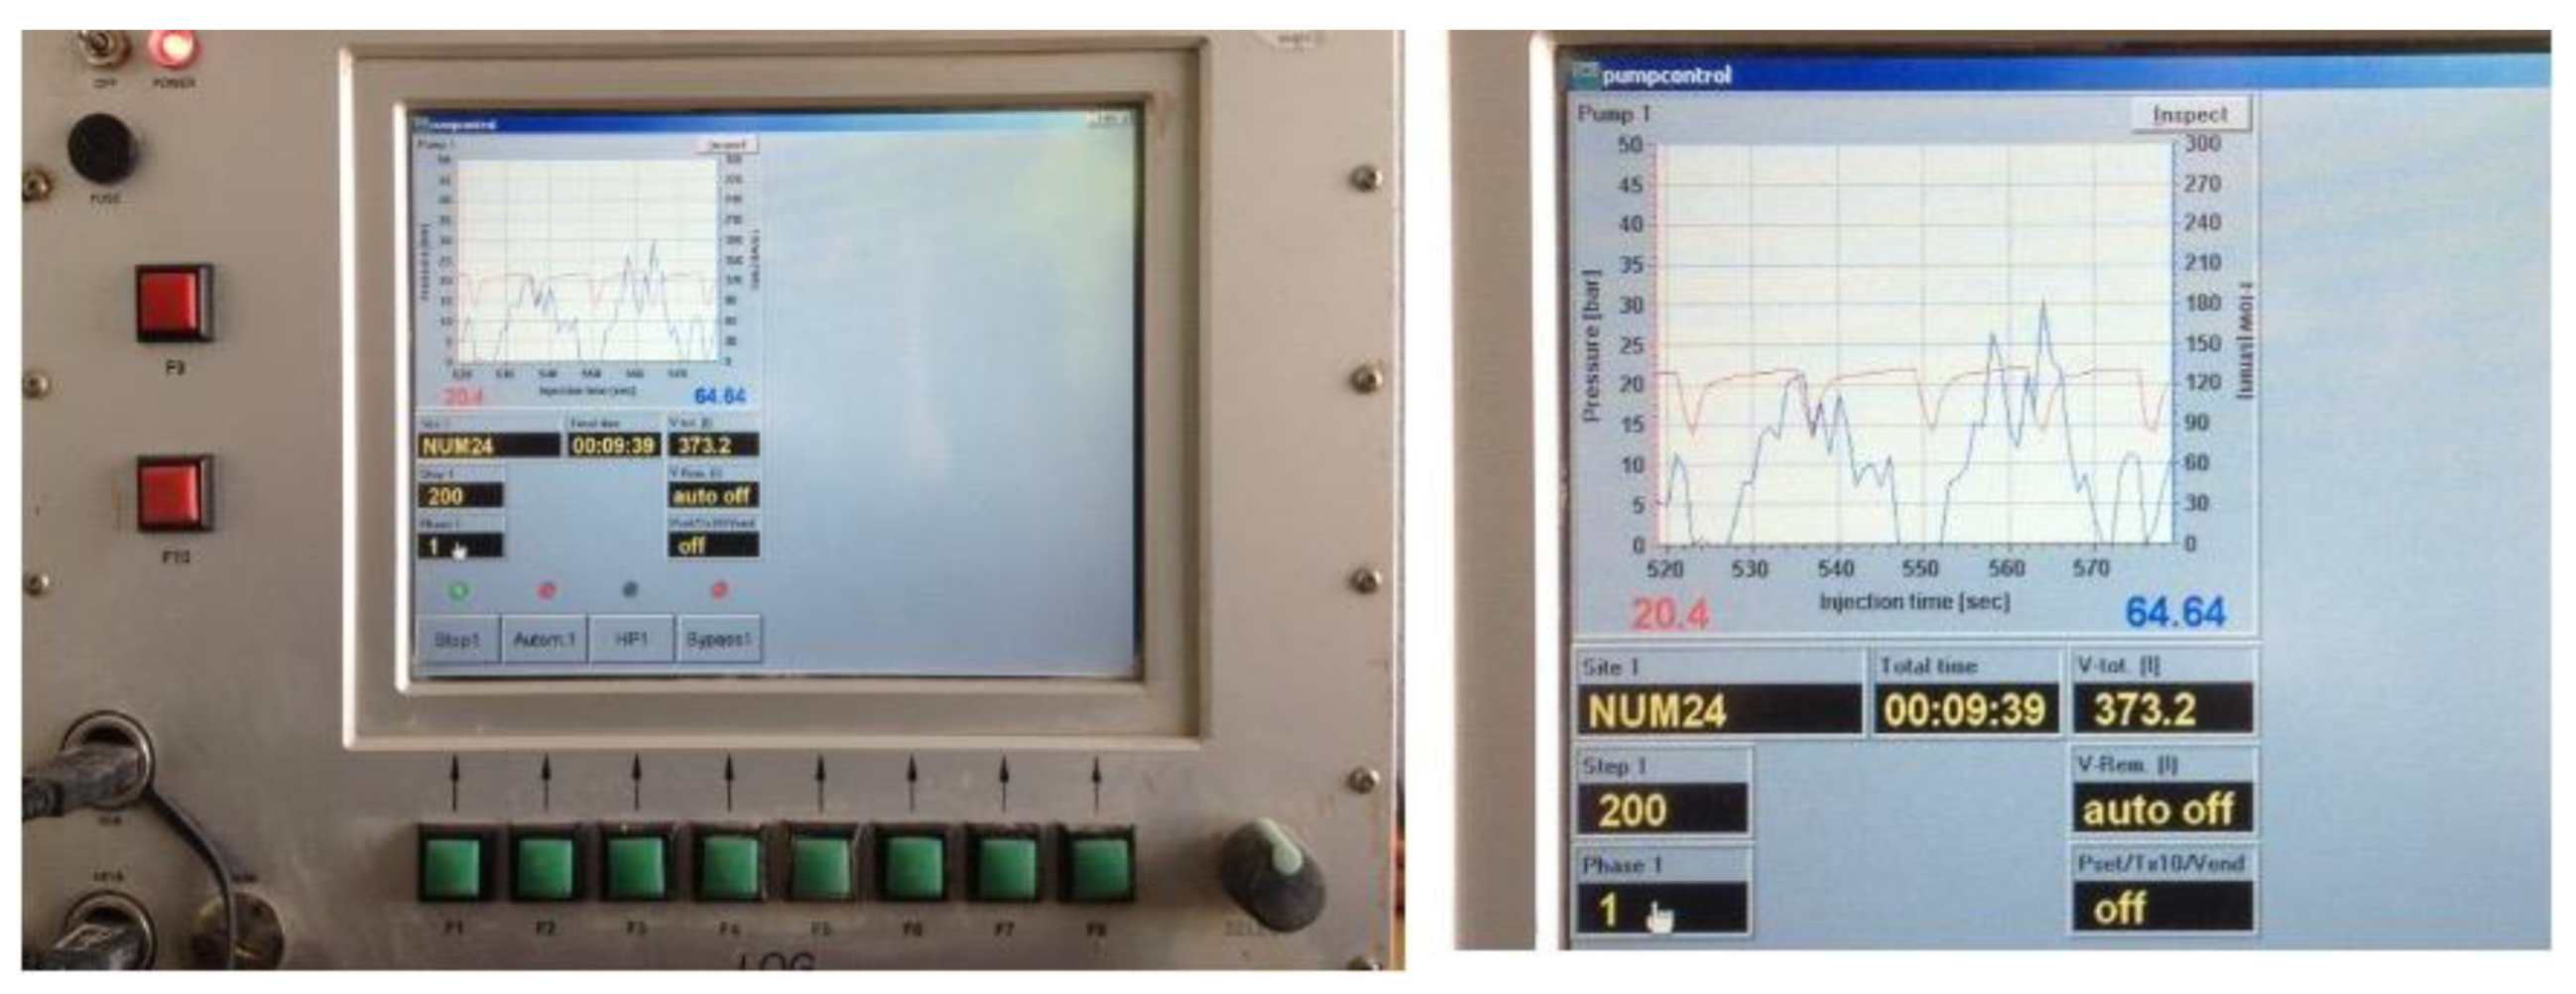
Figure 3.
Control of the consistency of the mortar B.M. Abrams cone between 8 and 12 cm.
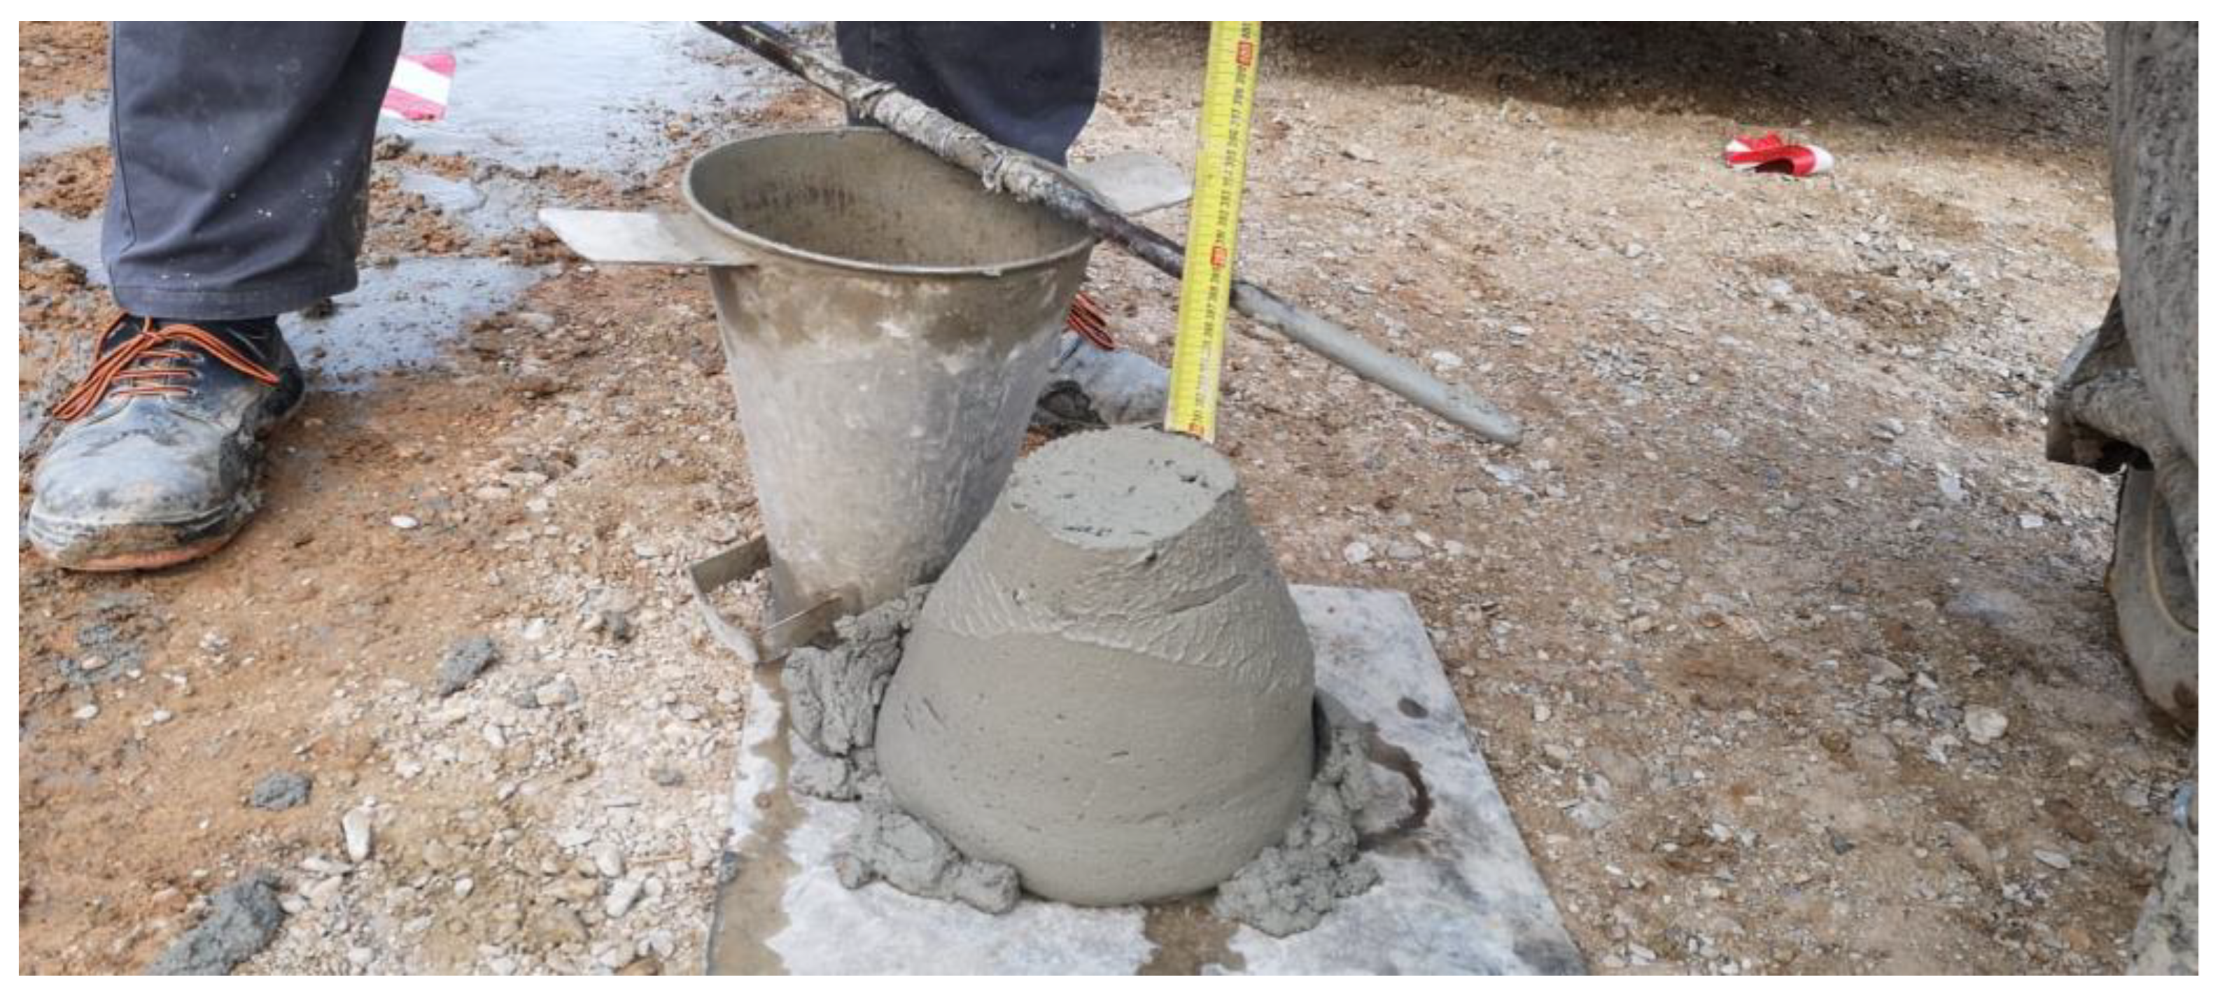
Figure 4.
Position of mortar columns B.M. in the geological-geotechnical profile carried out.
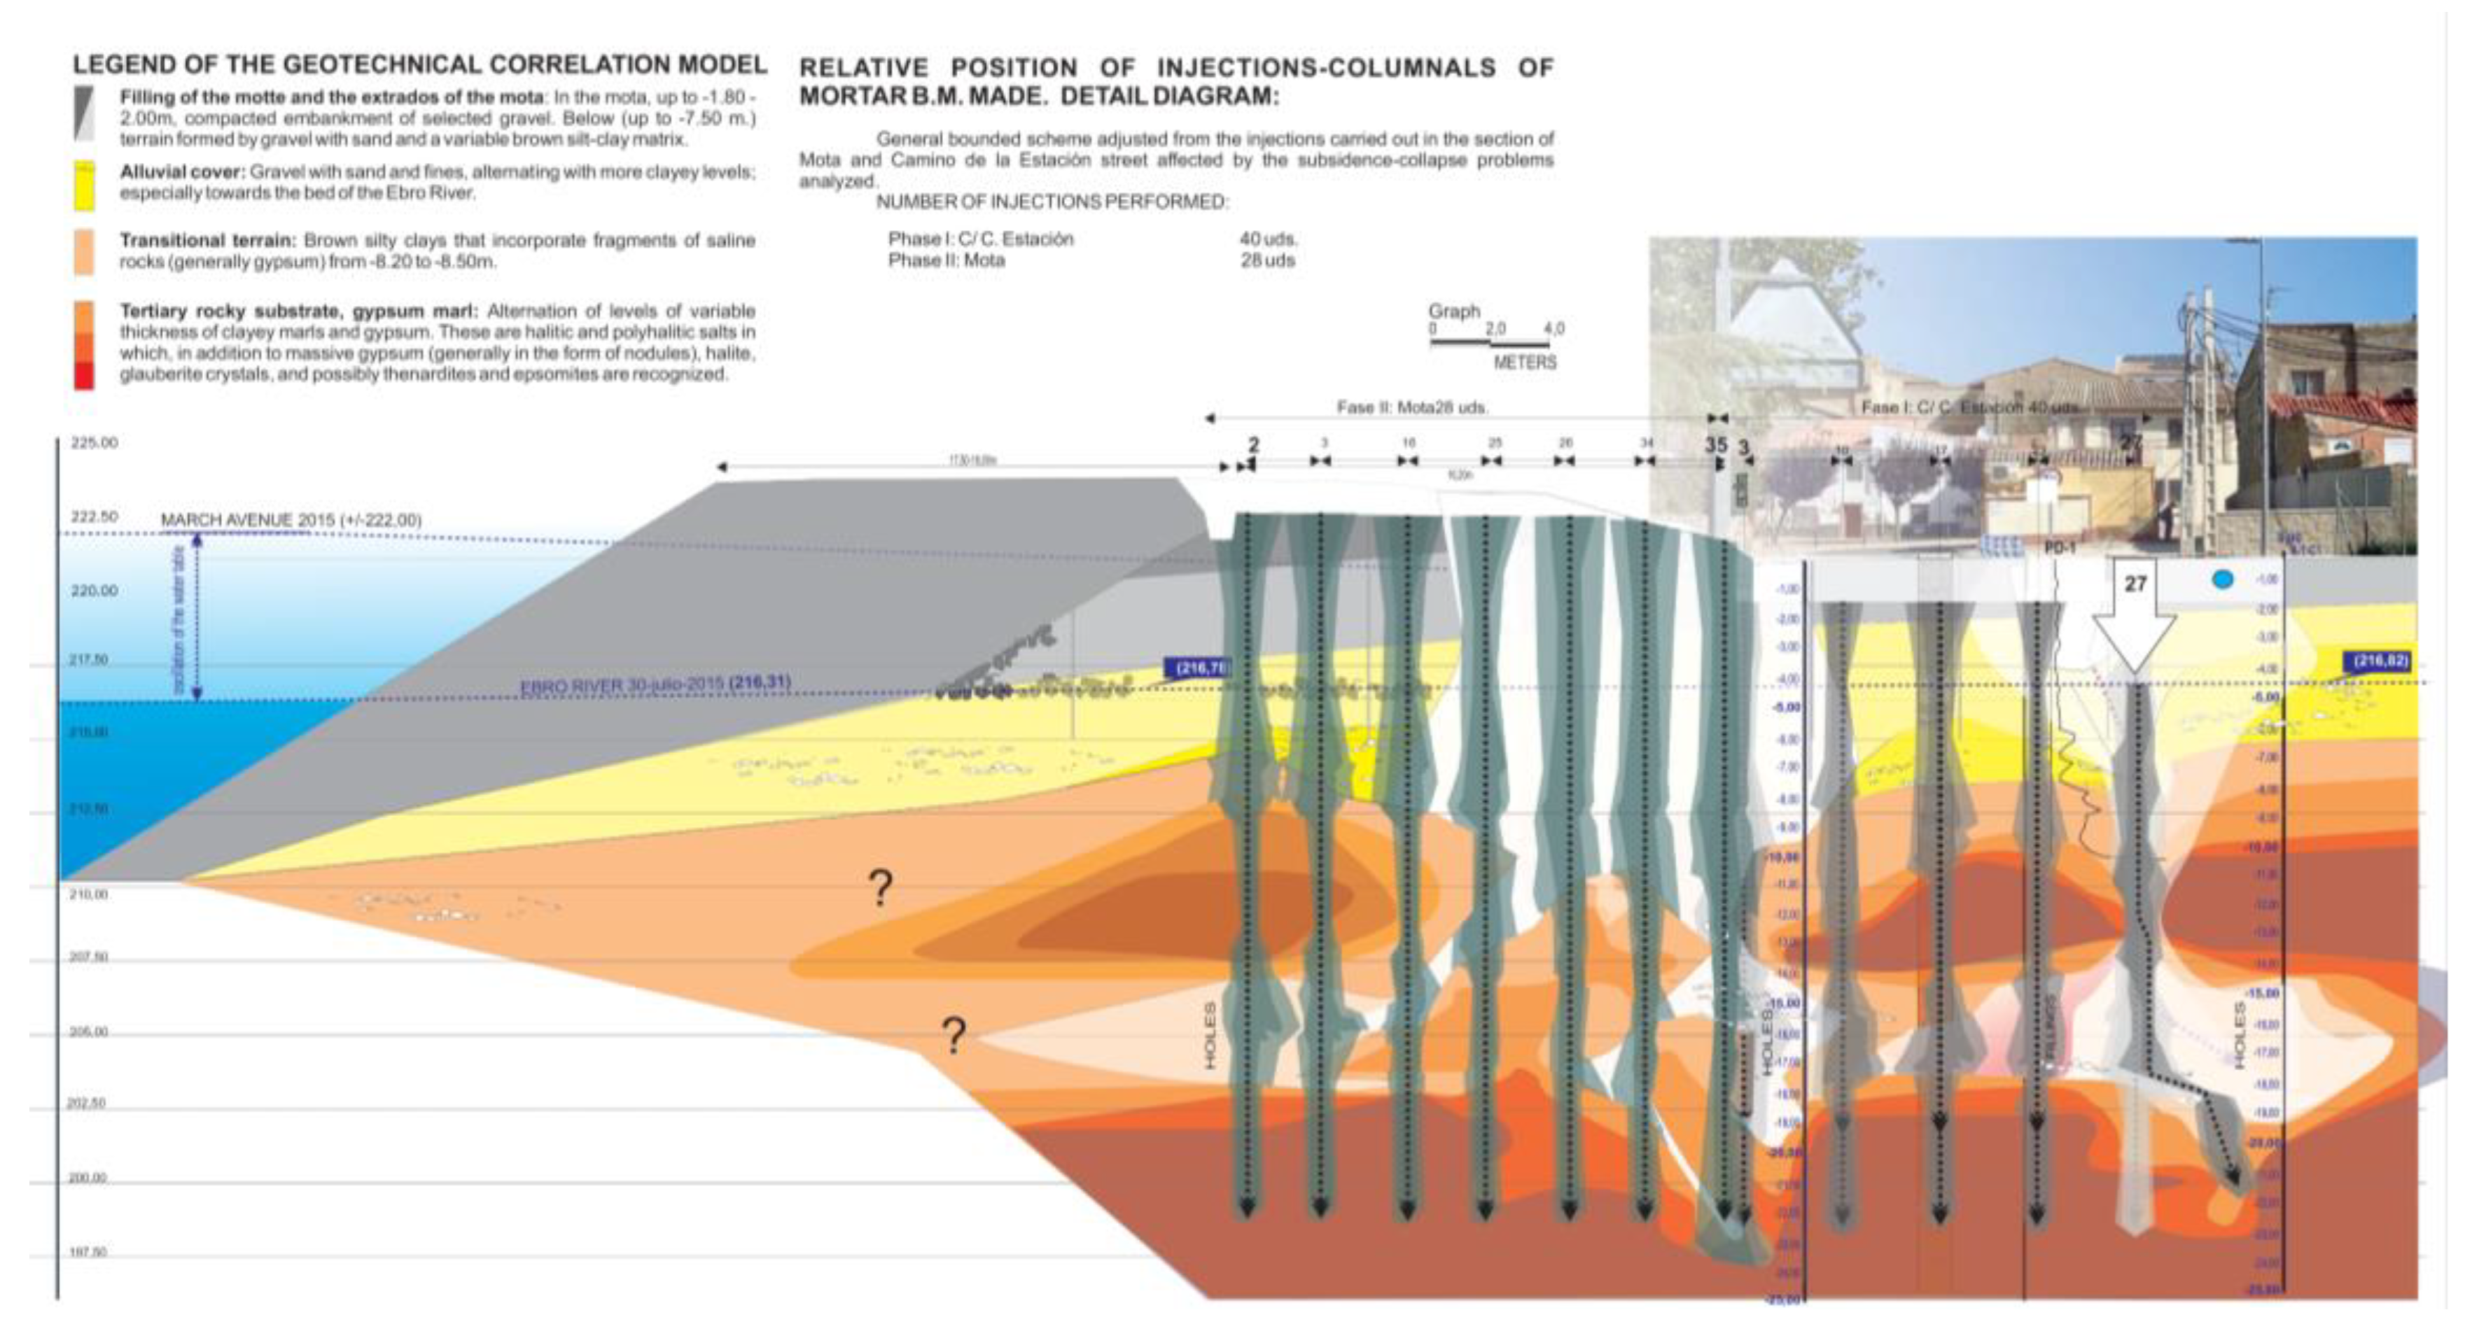
Figure 5.
RTC360 laser scanner during topographic auscultation work.
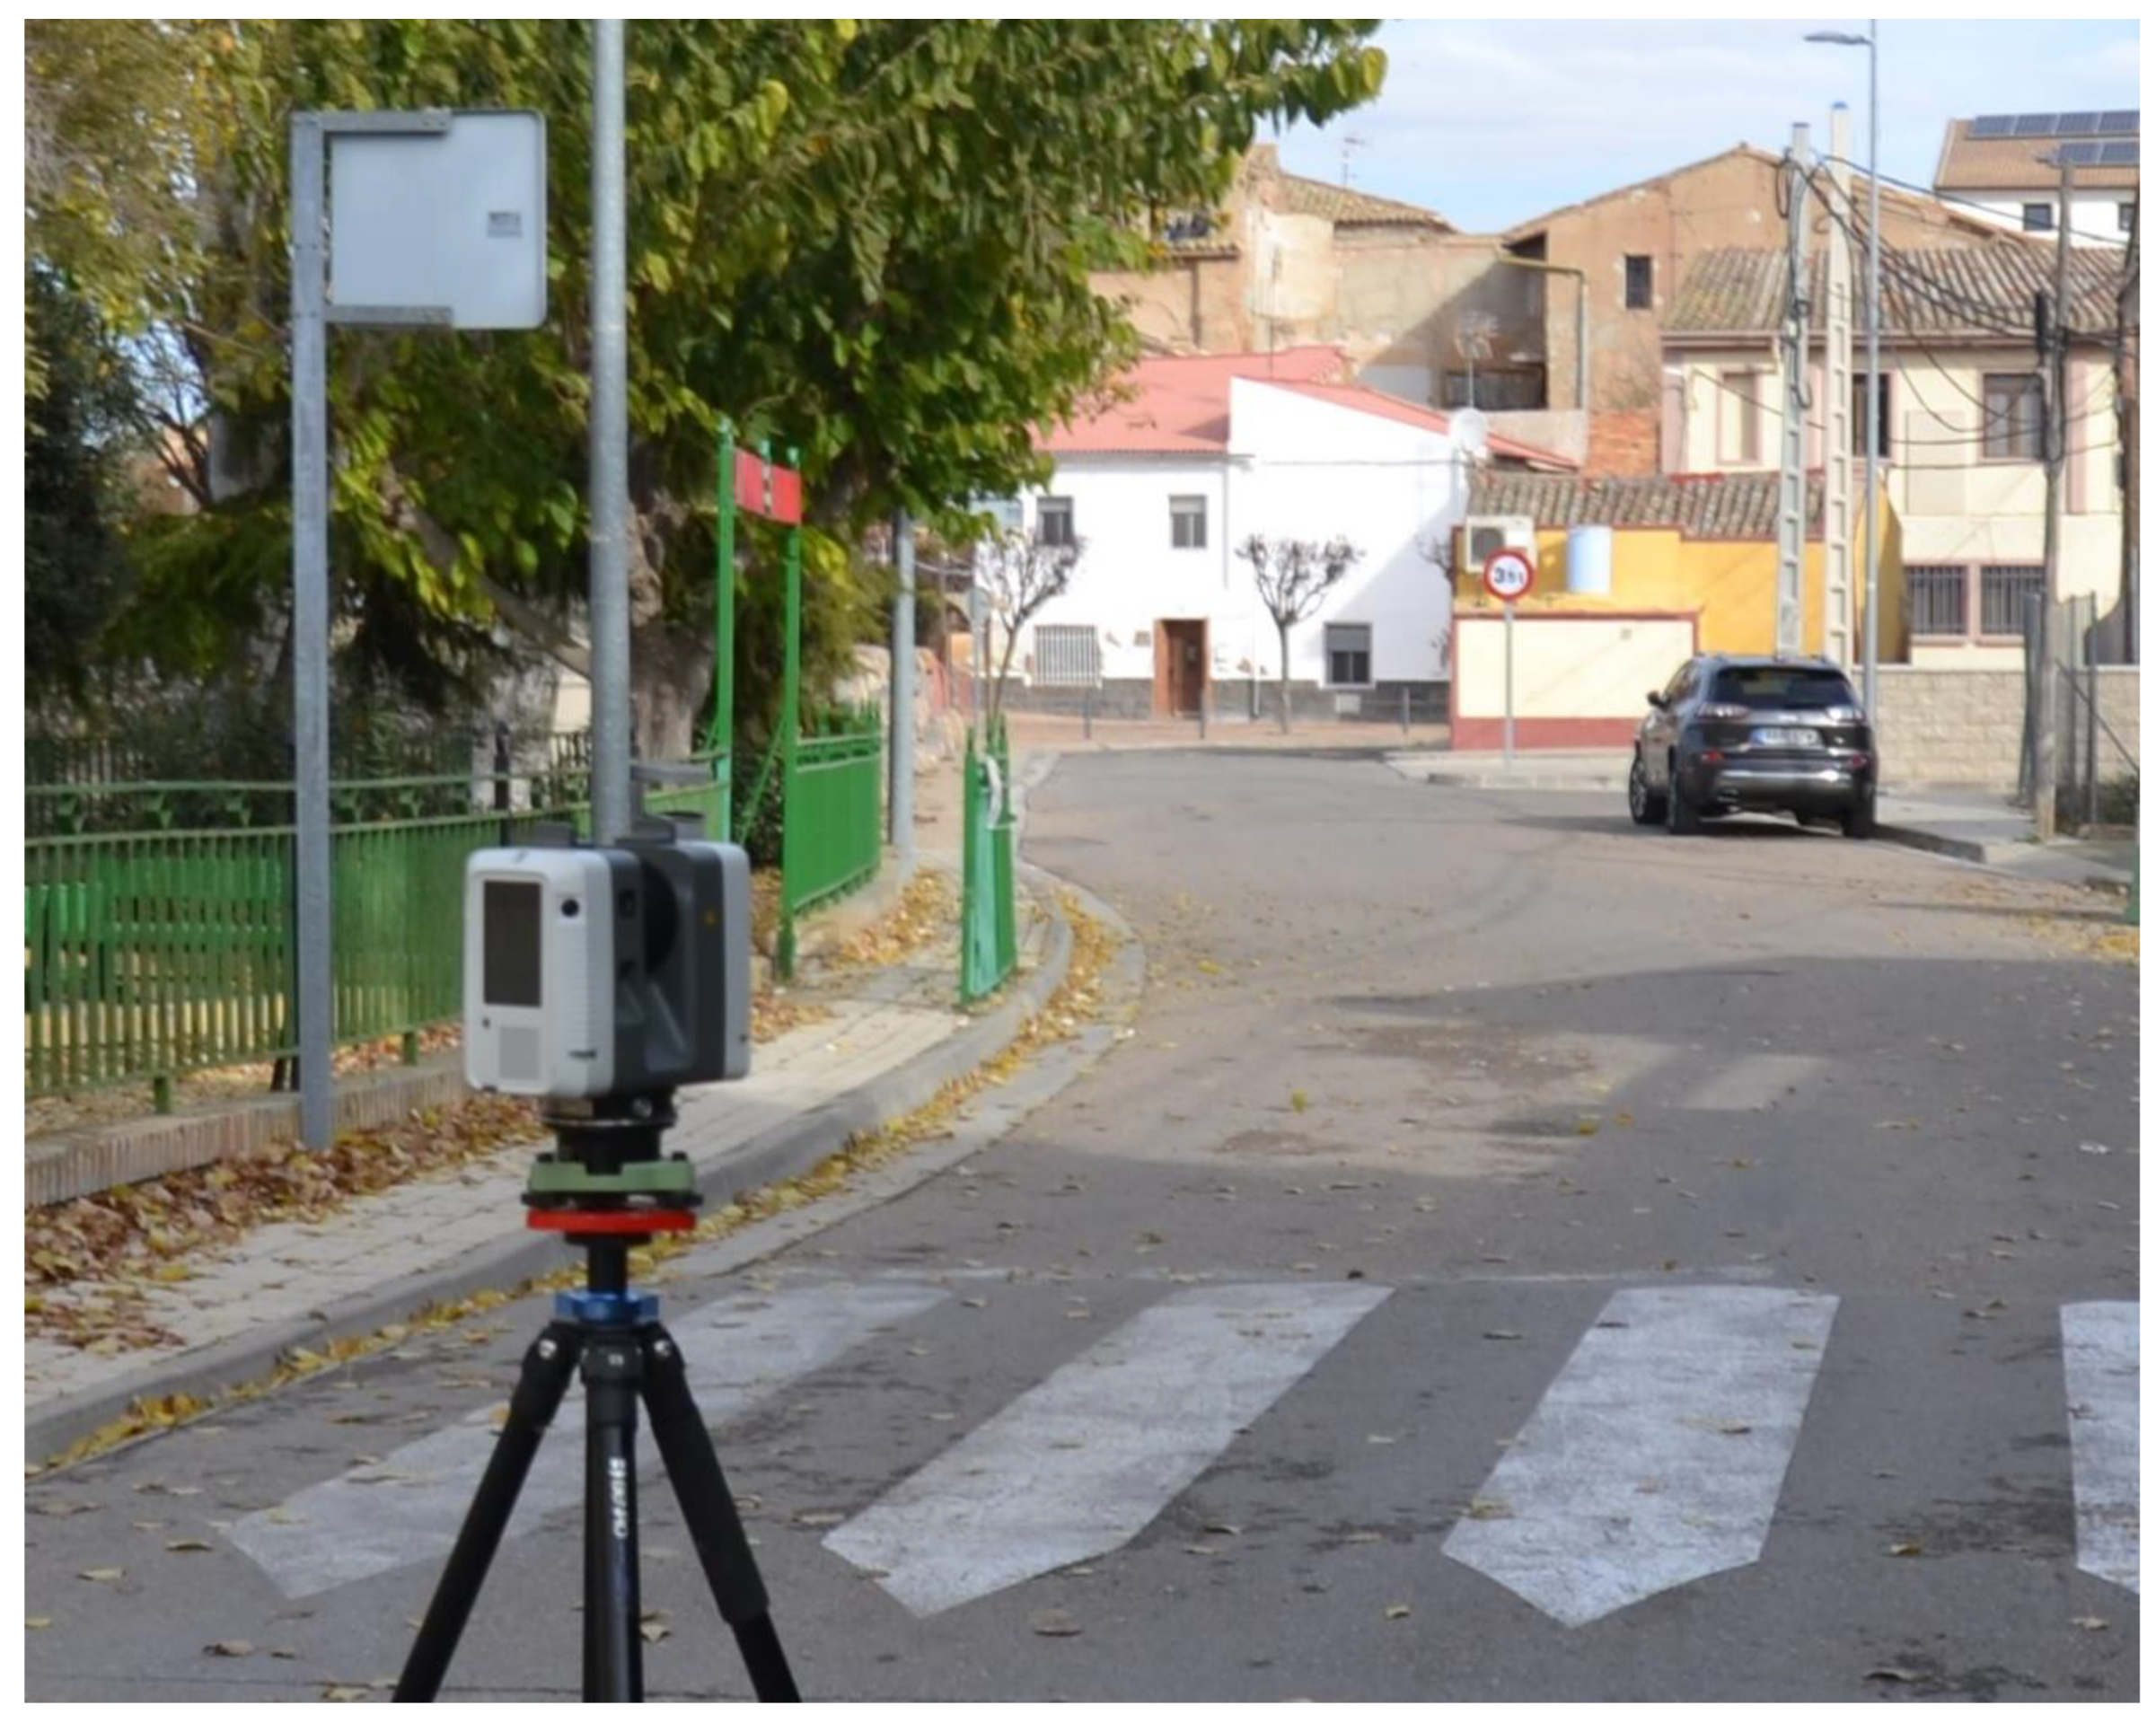
Figure 6.
Measuring stations used for topographical auscultation. 24 at the moat (red colour) and 27 in the village (blue colour). Result of the precision achieved in September 2024.
Figure 6.
Measuring stations used for topographical auscultation. 24 at the moat (red colour) and 27 in the village (blue colour). Result of the precision achieved in September 2024.
Figure 7.
Topographic comparison between the data obtained on November 22, 2021, and November 5, 2023. Obtained with the RTC360 laser scanner. General situation plan.
Figure 7.
Topographic comparison between the data obtained on November 22, 2021, and November 5, 2023. Obtained with the RTC360 laser scanner. General situation plan.
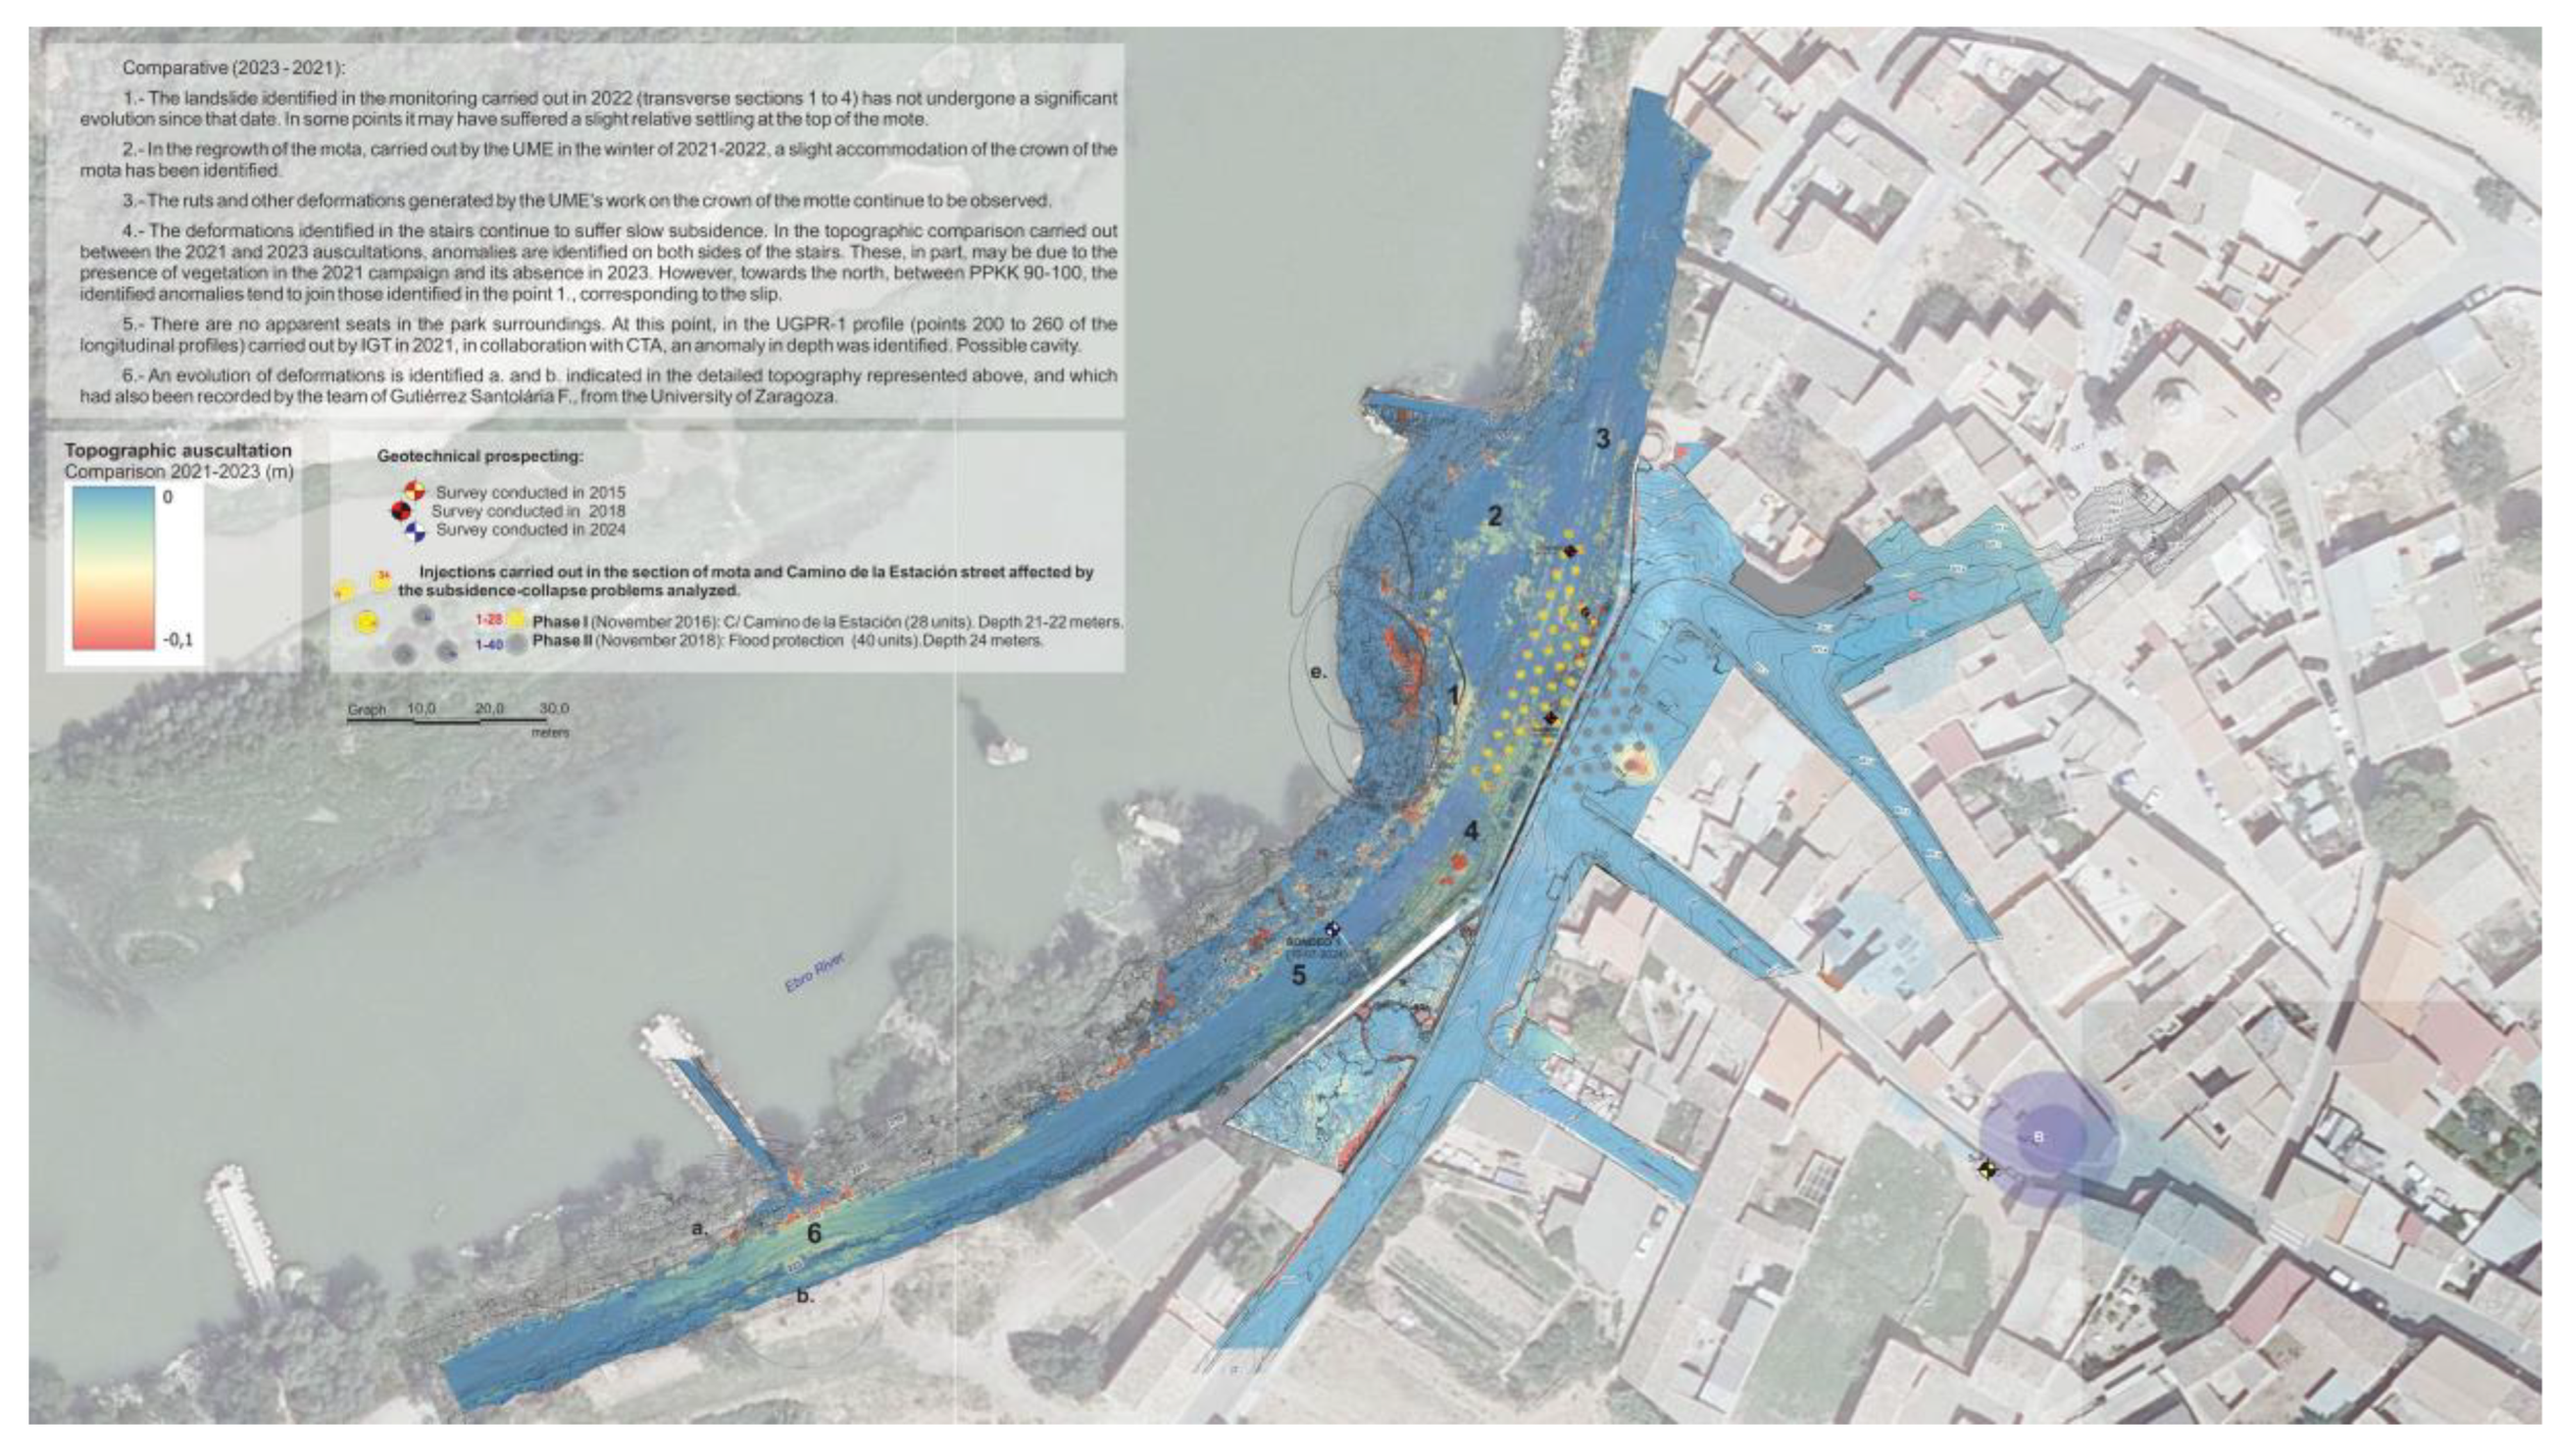
Figure 8.
Topographic comparison between the data obtained on November 22, 2021, and November 5, 2023. Obtained with the RTC360 laser scanner. Detail of the area in which consolidation measures were carried out using B.M. mortar injections.
Figure 8.
Topographic comparison between the data obtained on November 22, 2021, and November 5, 2023. Obtained with the RTC360 laser scanner. Detail of the area in which consolidation measures were carried out using B.M. mortar injections.
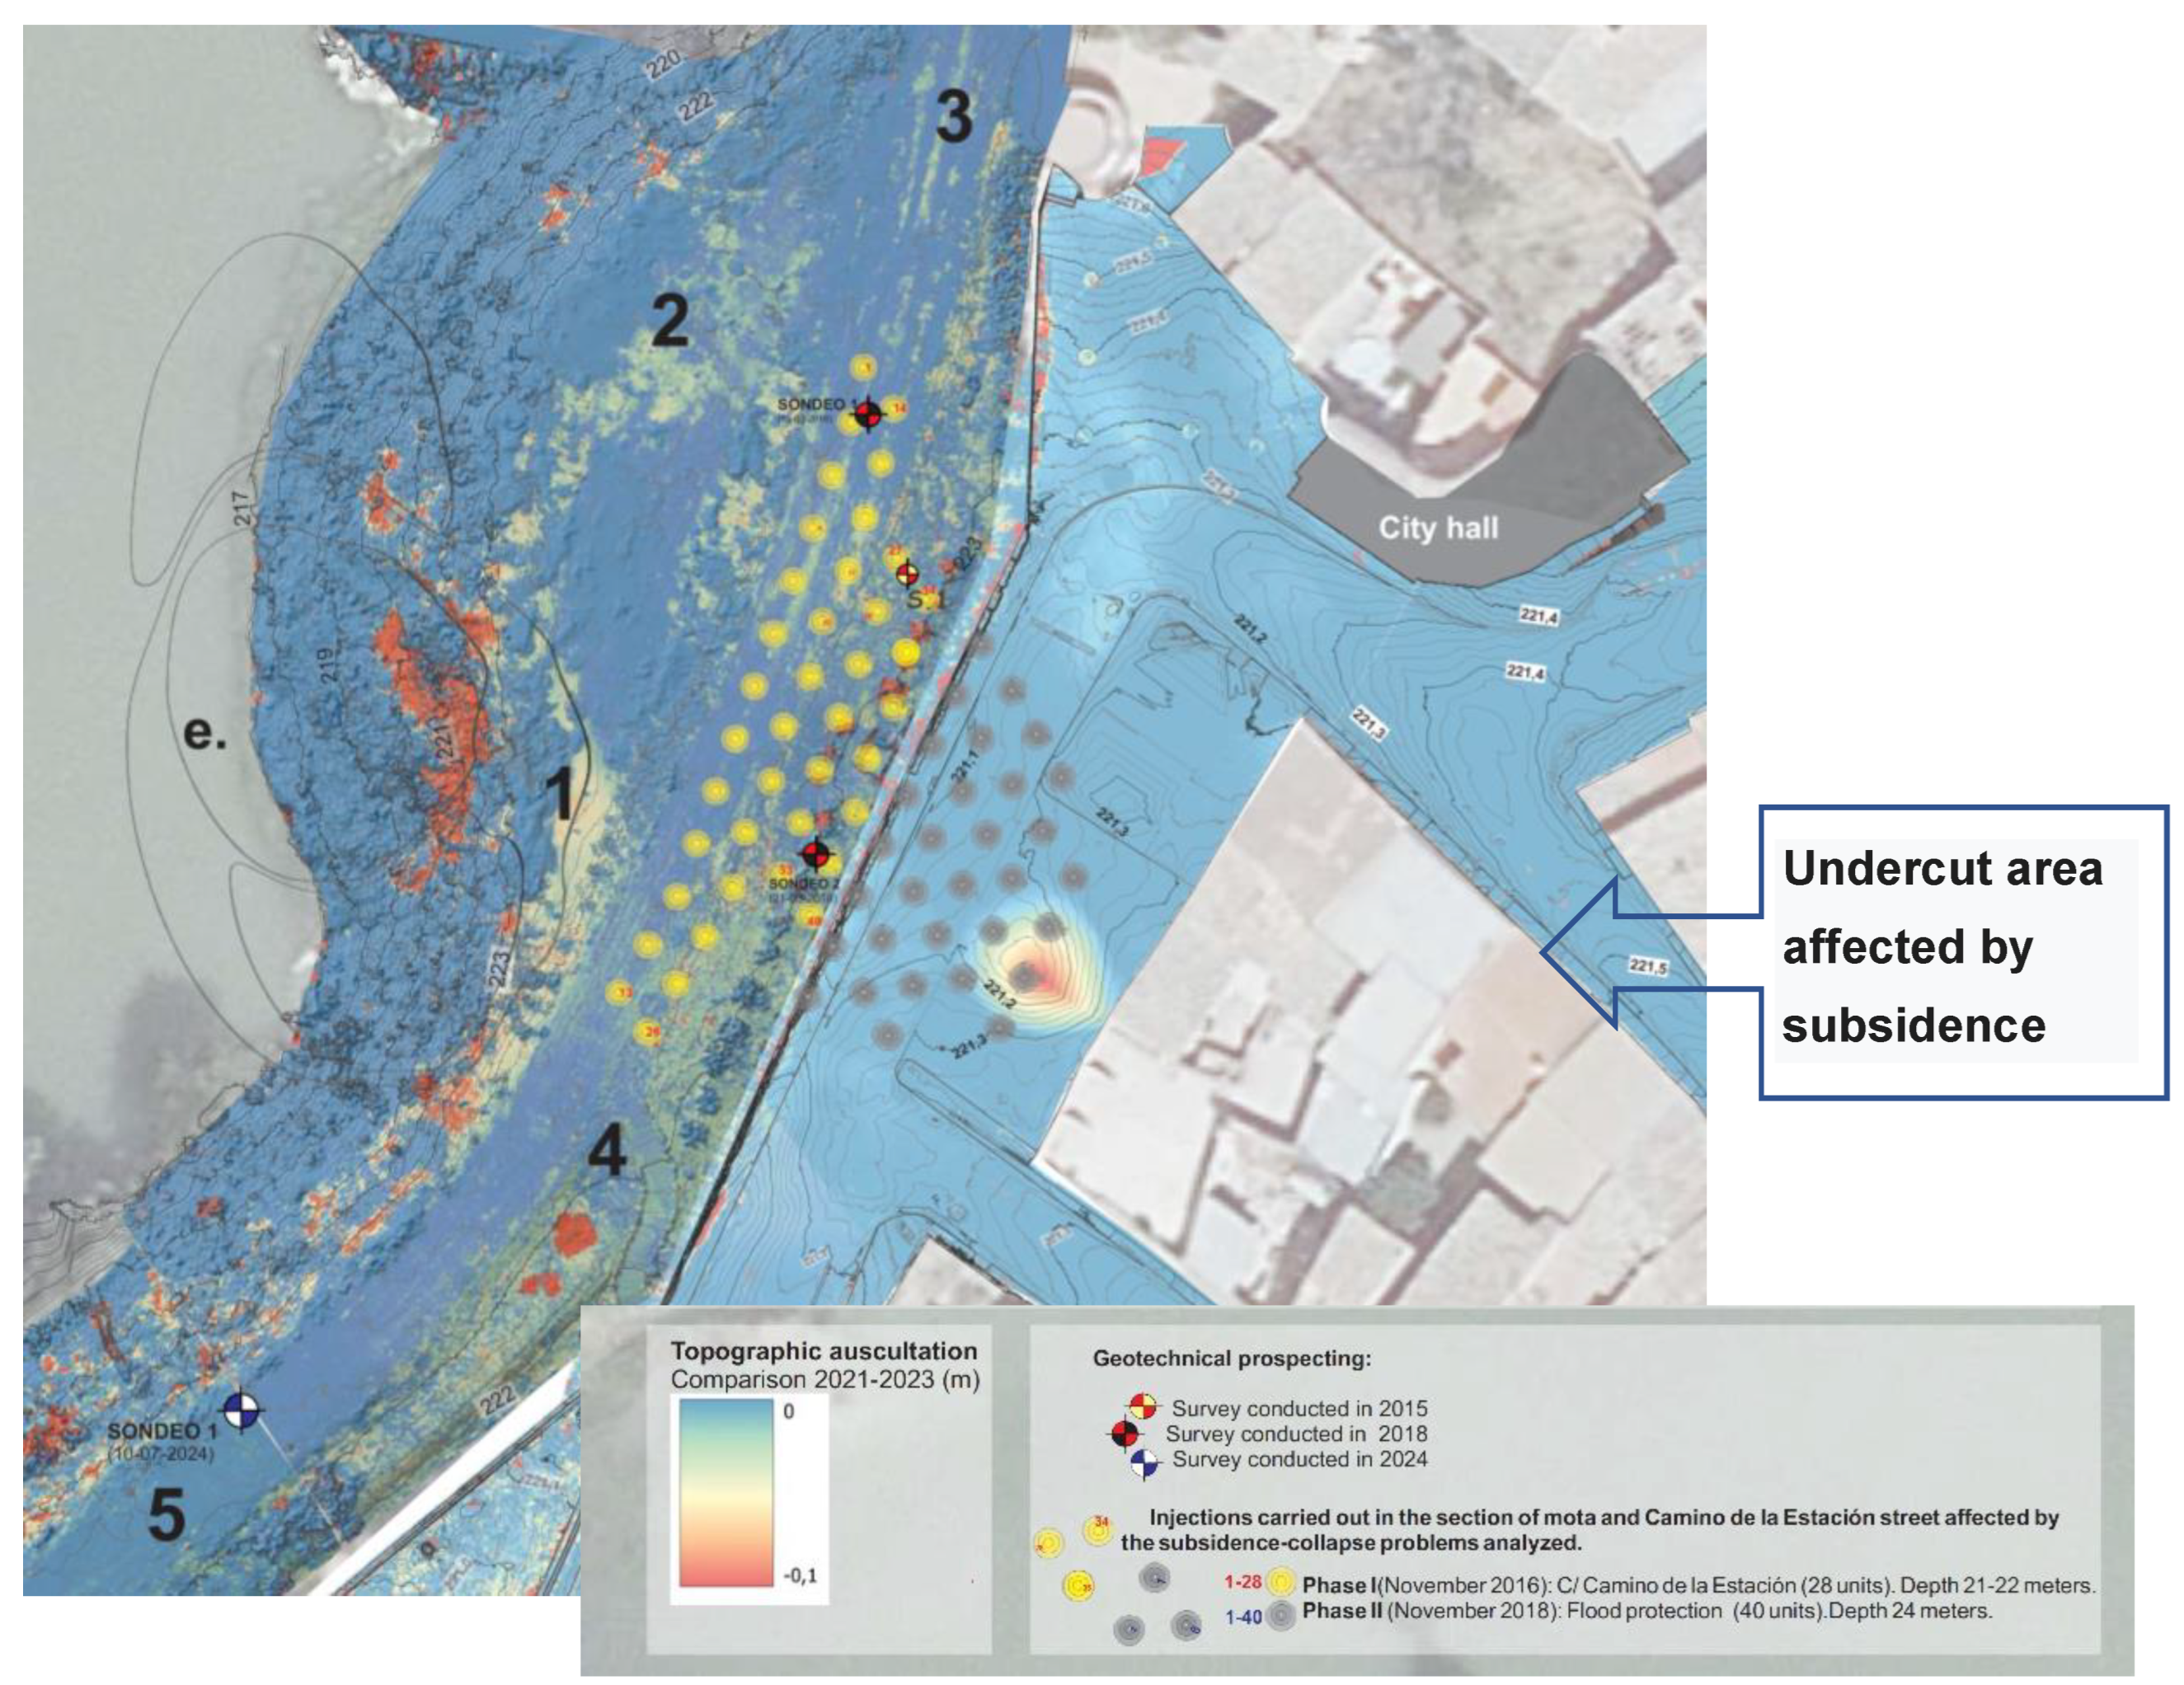
Figure 9.
Zoning obtained with the anomalies observed in the detailed topography carried out and the different geophysical prospecting campaigns.
Figure 9.
Zoning obtained with the anomalies observed in the detailed topography carried out and the different geophysical prospecting campaigns.
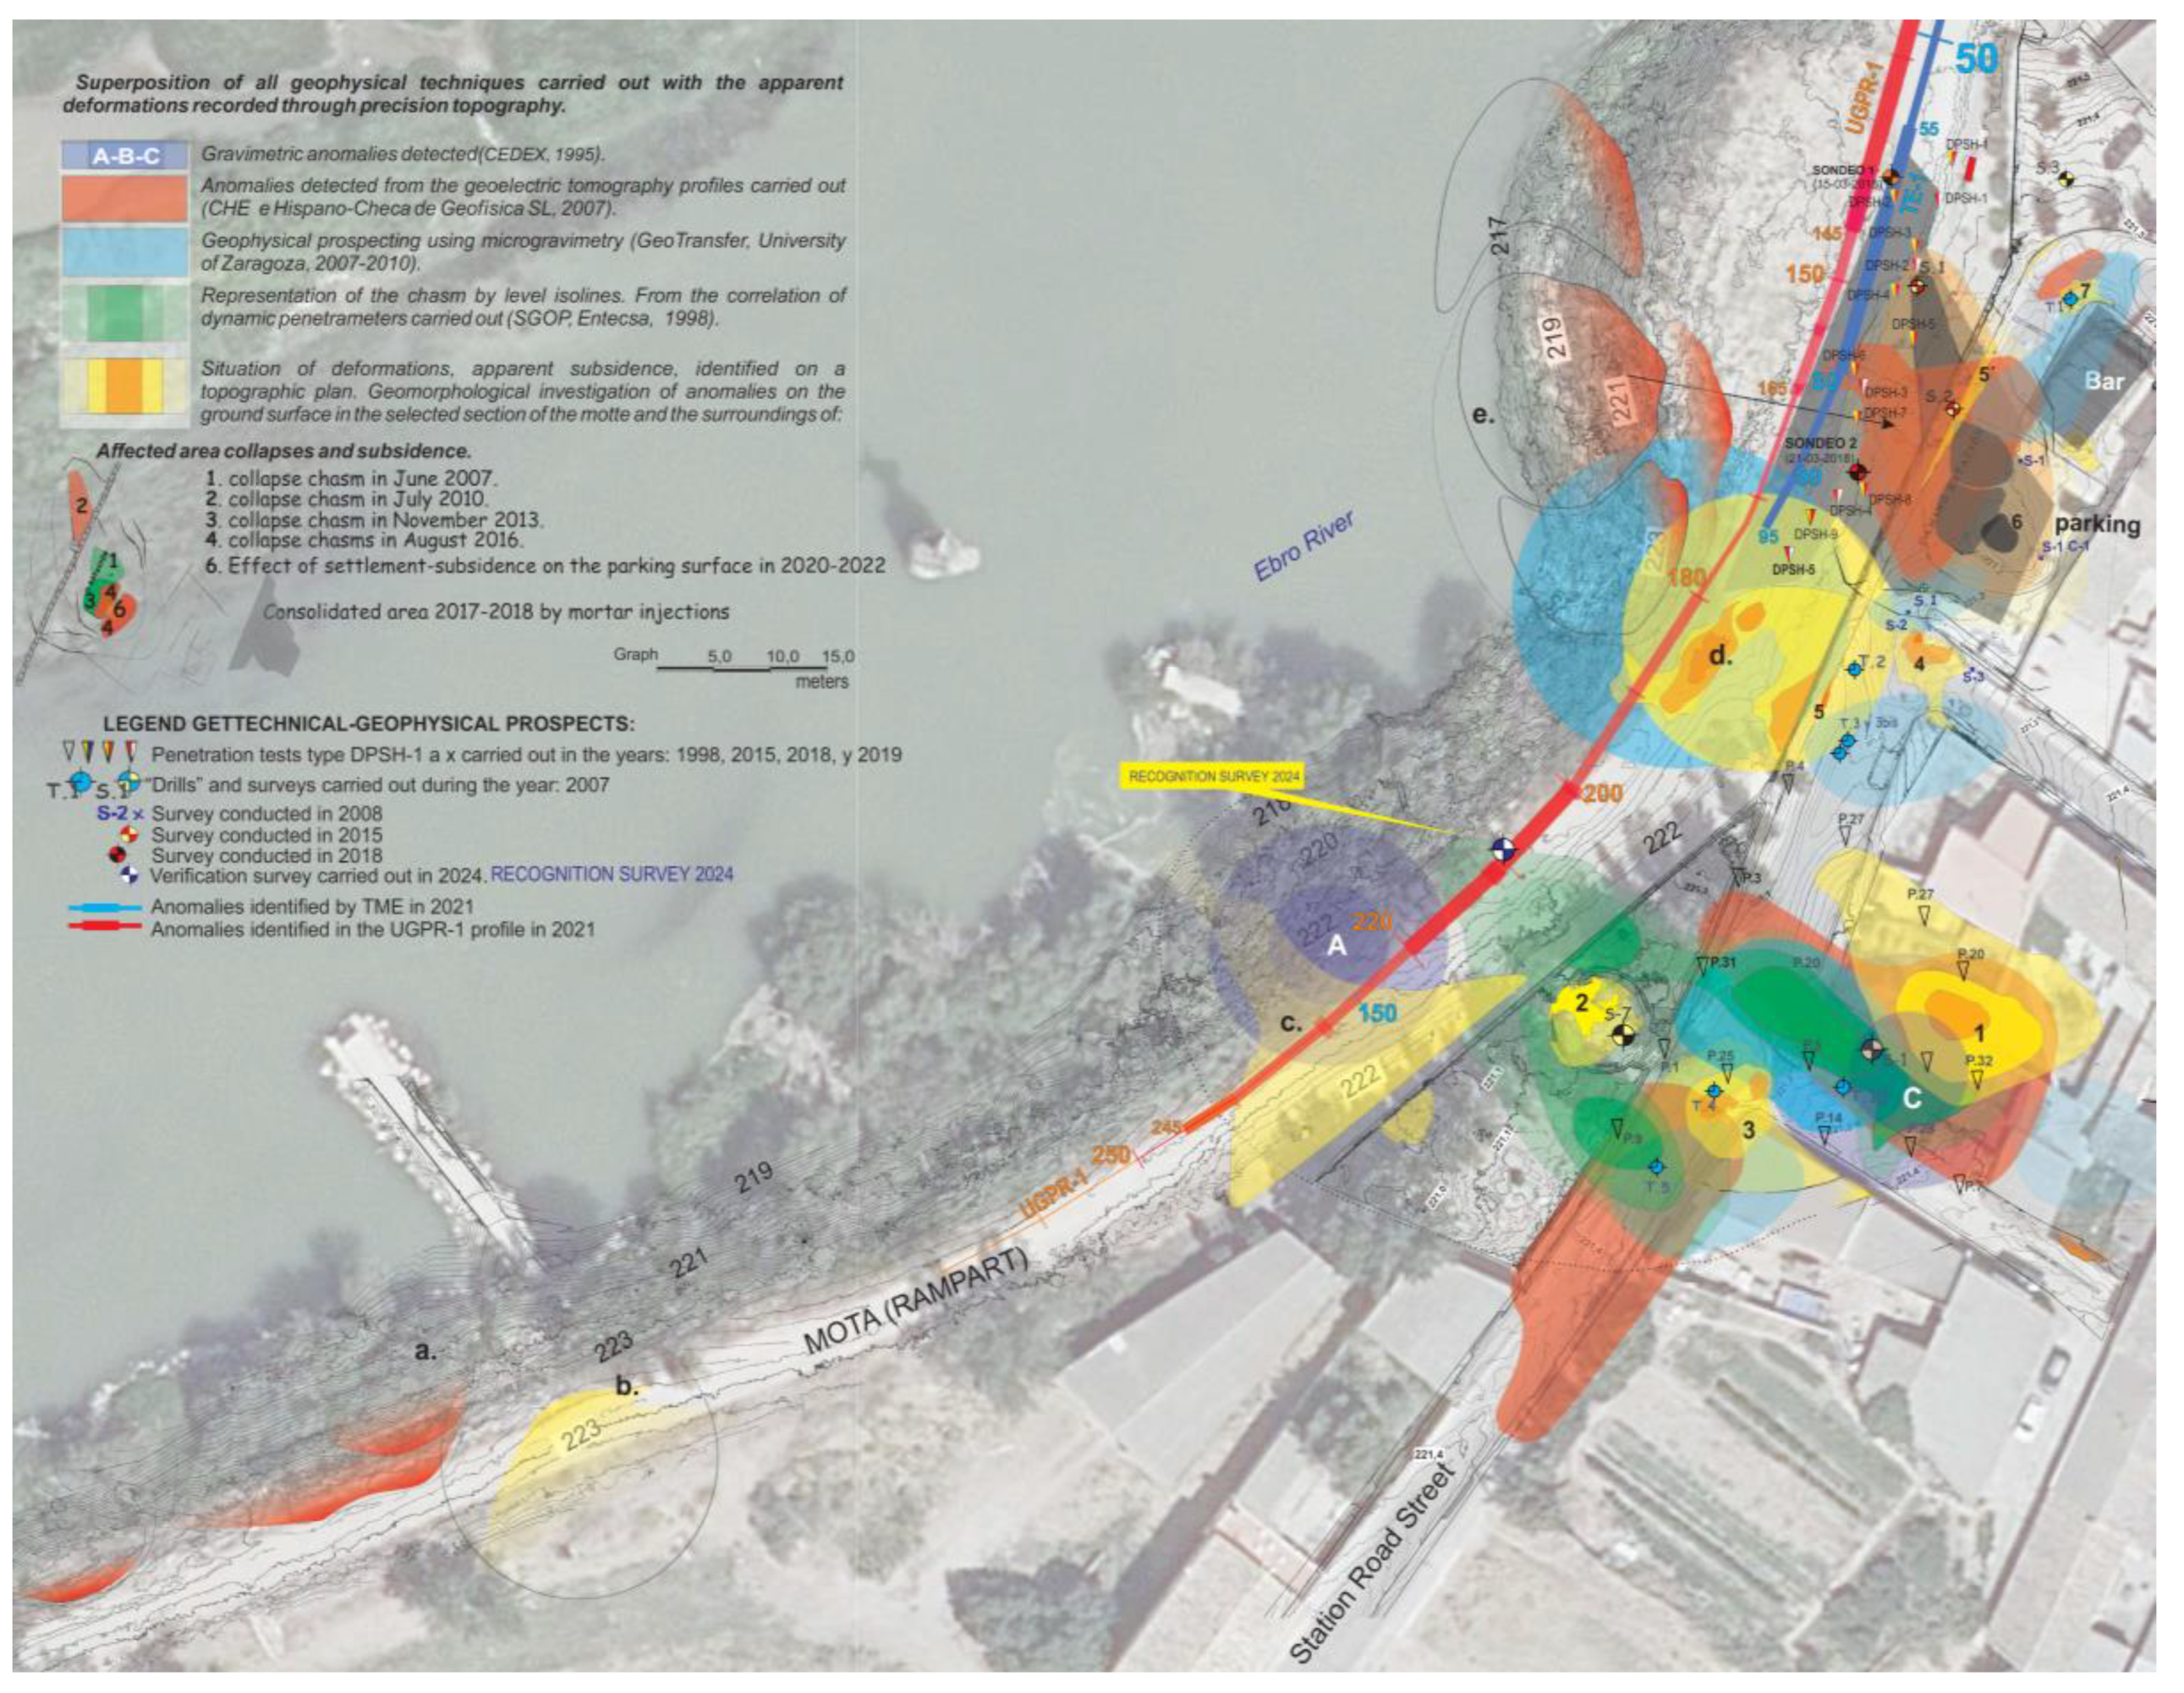
Figure 10.
TE 1 Electrical Tomography Profile.
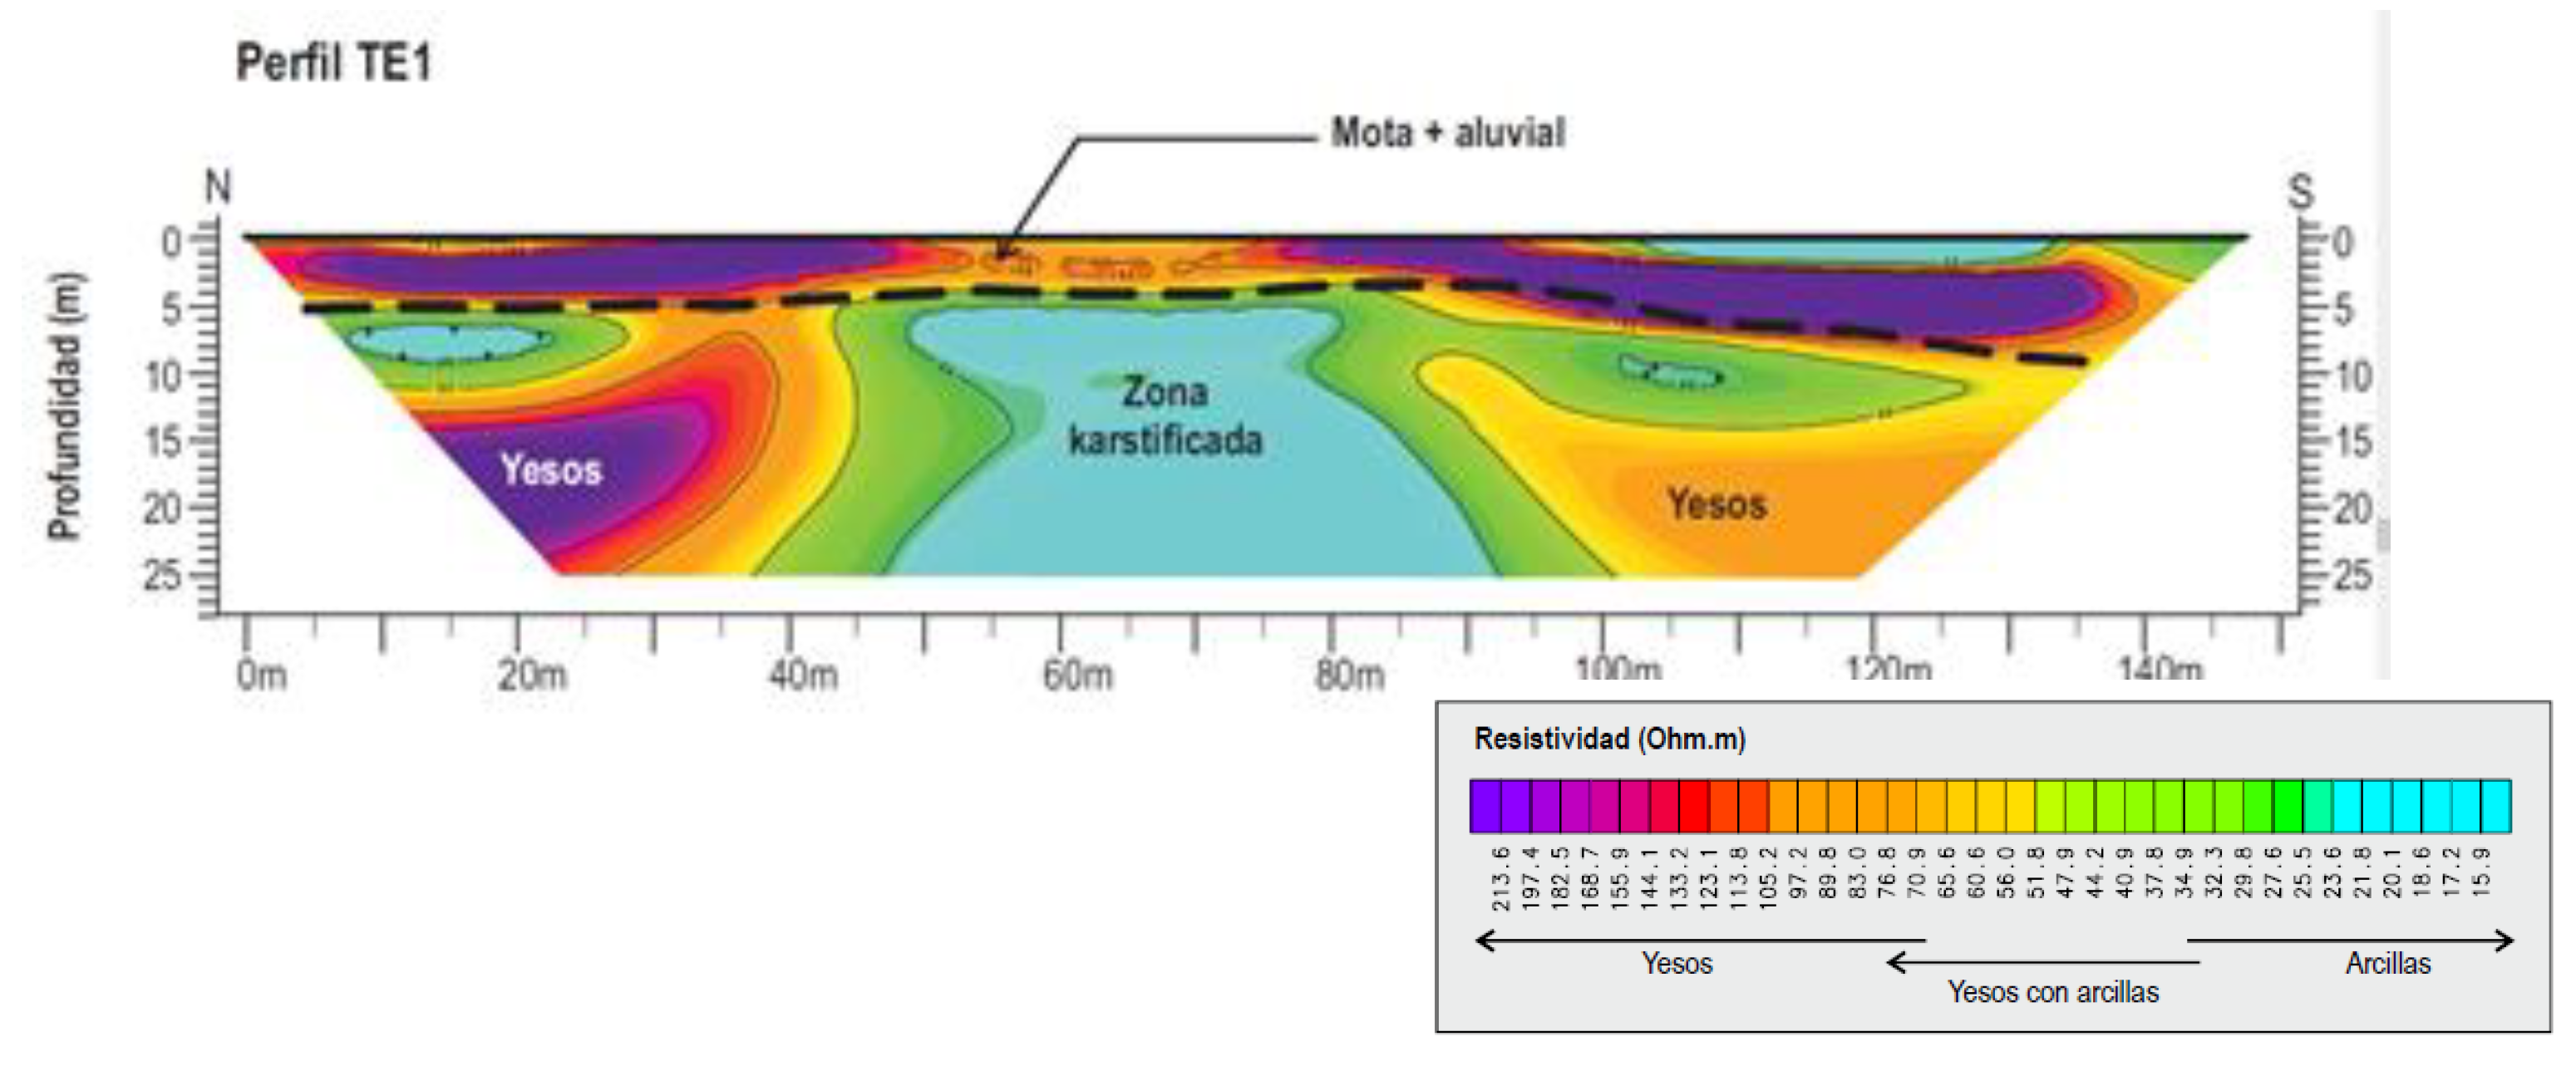
Figure 11.
Combination of Electrical Tomography in 3D mode and the UltraGPR type Georadar.
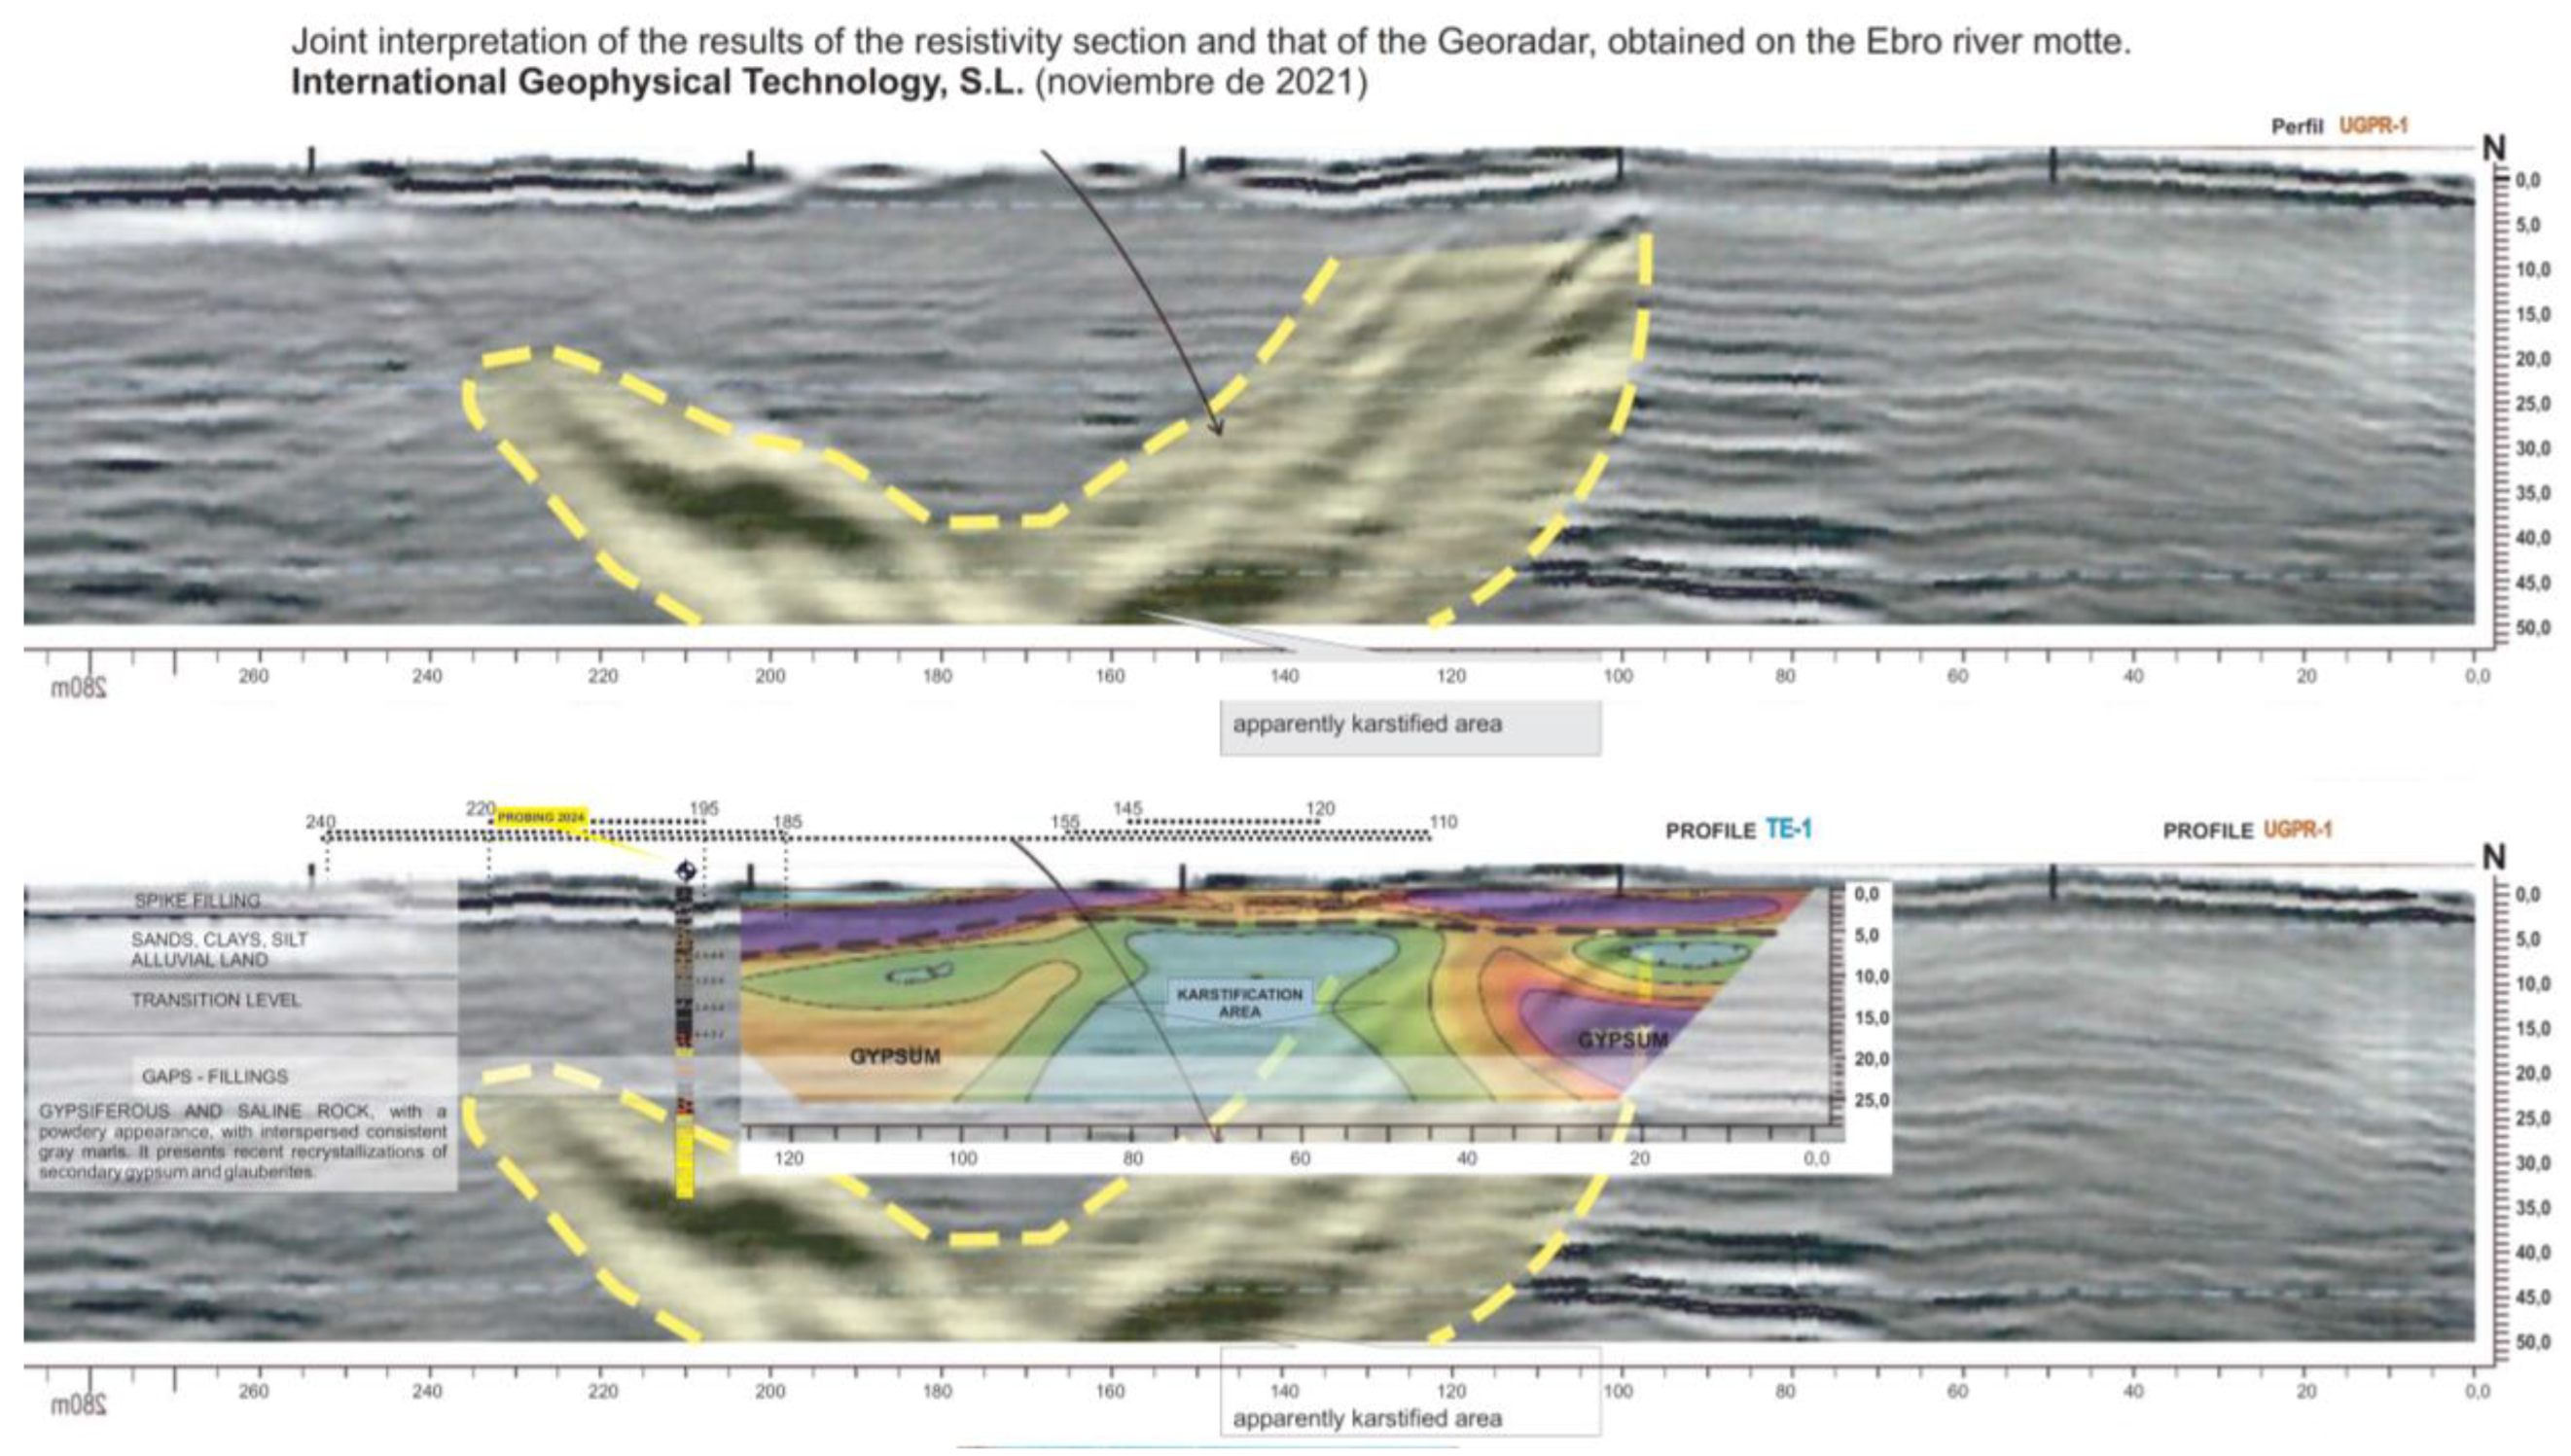
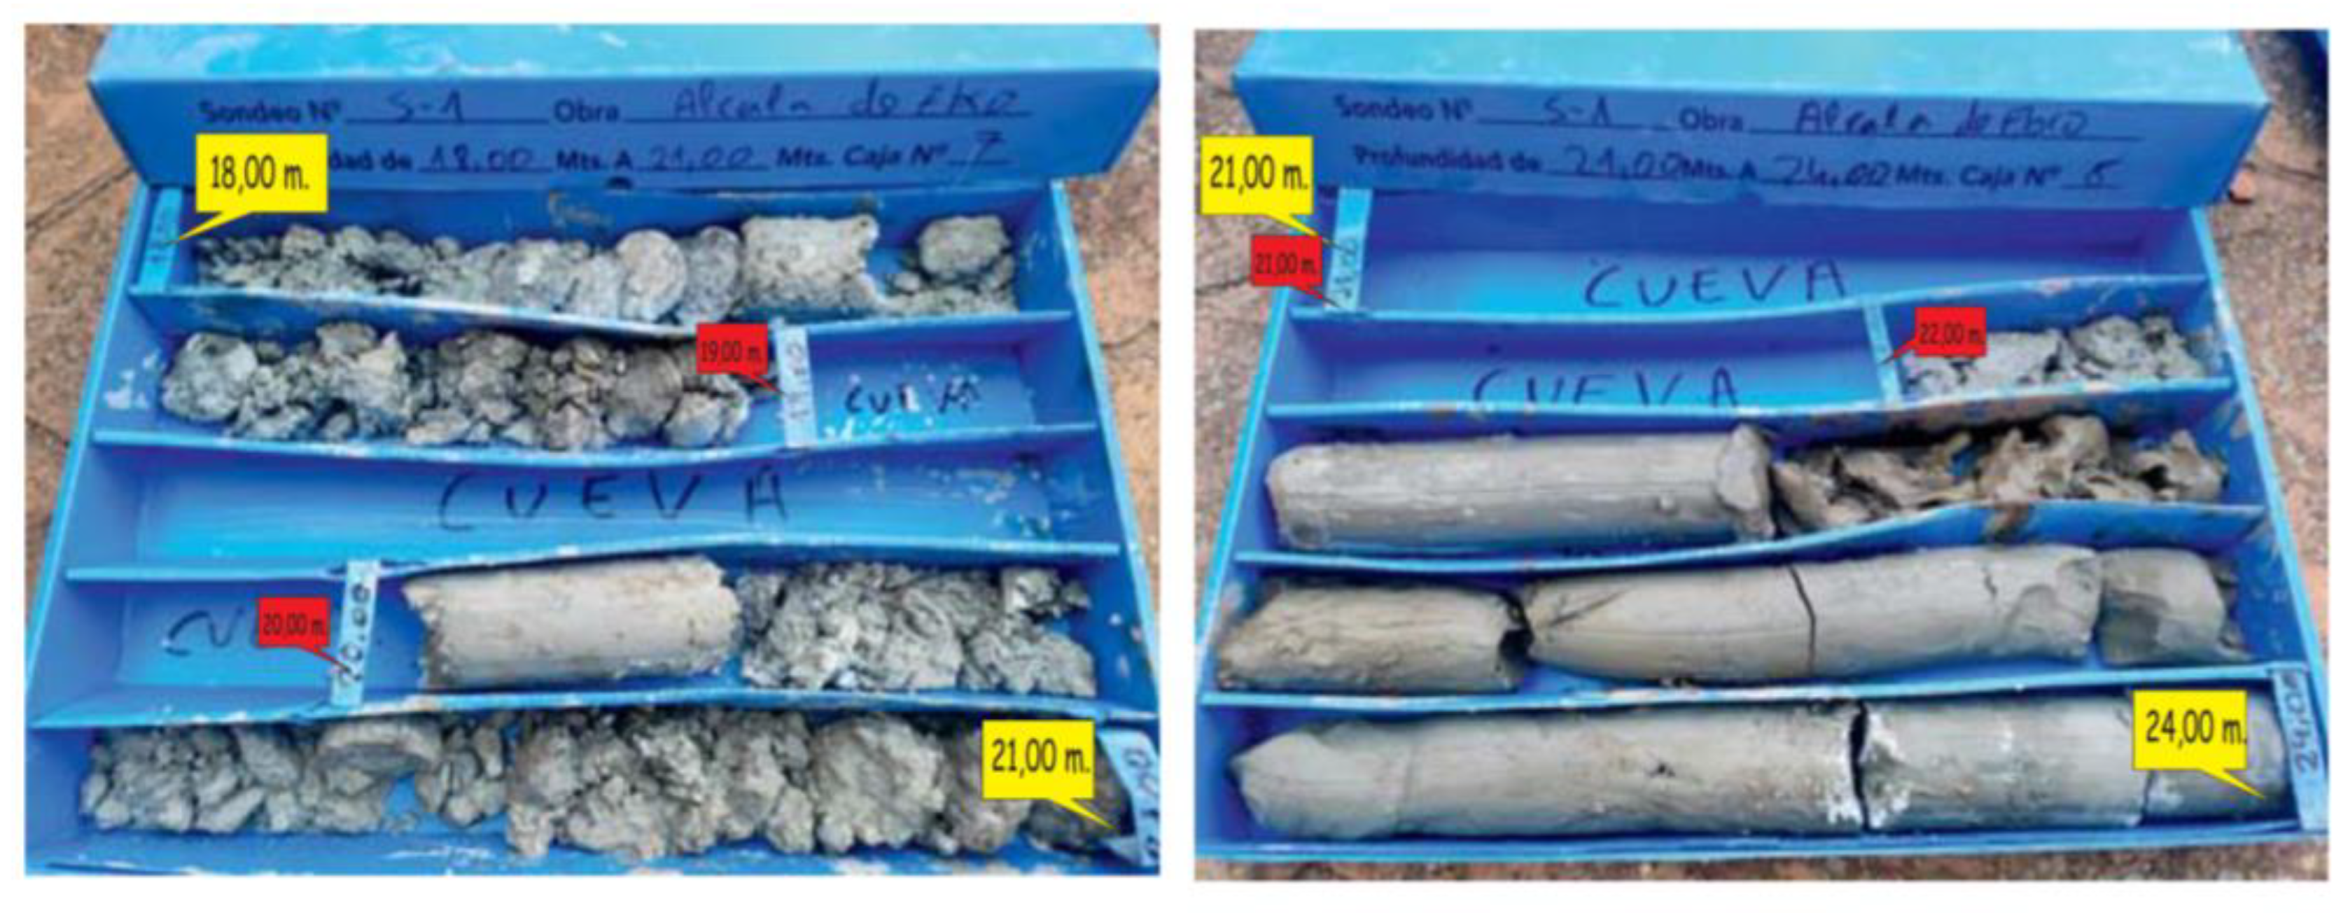
Figure 12.
: Rotation survey with continuous core extraction located in an area with apparent anomalies recorded through geophysical prospecting.
Figure 12.
: Rotation survey with continuous core extraction located in an area with apparent anomalies recorded through geophysical prospecting.
Disclaimer/Publisher’s Note: The statements, opinions and data contained in all publications are solely those of the individual author(s) and contributor(s) and not of MDPI and/or the editor(s). MDPI and/or the editor(s) disclaim responsibility for any injury to people or property resulting from any ideas, methods, instructions or products referred to in the content. |
© 2025 by the authors. Licensee MDPI, Basel, Switzerland. This article is an open access article distributed under the terms and conditions of the Creative Commons Attribution (CC BY) license (http://creativecommons.org/licenses/by/4.0/).
Copyright: This open access article is published under a Creative Commons CC BY 4.0 license, which permit the free download, distribution, and reuse, provided that the author and preprint are cited in any reuse.


