1. Introduction
MS is an immune-mediated demyelinating disease of the central nervous system (CNS) [
1,
2] that develops in genetically susceptible individuals and likely requires environmental triggers [
3,
4]. Recently, several studies have revealed a dysbiosis in the gut microbiota of MS patients that might play a role in disease pathogenesis [
5]. Supporting this hypothesis, it has been demonstrated that the transfer of gut microbiota from MS patients but not healthy controls into mice can induce or exacerbate experimental autoimmune encephalomyelitis [
6,
7]. Since gut microbiota and their metabolites are important for maintaining the gut epithelial barrier [
8] and influence systemic immunity [
9,
10], microbiota dysbiosis affect the intestinal barrier function and immune homeostasis. In addition, gut enrichment in mucin-degrader bacteria can reduce mucus thickness and facilitate mucosal damage [
11]. A leaky gut can then enable the translocation of commensal bacteria across intestinal epithelium [
12] enabling activation of the immune system. Bacterial lipopolysaccharides (LPS) and metabolites from translocated bacteria can access the blood and circulate to distant organs such as the brain and affect BBB permeability [
13] as well as the maturation and function of microglia [
14] and astrocytes [
15]. Supporting a role of leaky gut in MS pathogenesis, altered biomarkers of gut barrier leakiness are common in MS patients and correlate with disease progression and with increased BBB permeability [
16,
17]. Furthermore, circulating LPS, as a measure of gut microbiota translocation, is increased in MS patients and correlates with disability [
18].
Among the different bacteria reported to be enriched in MS patients [
6,
7,
19], one of the most interesting is the mucin-degrader
Akkermansia muciniphila [
11]. We recently demonstrated higher intrathecal levels of anti-
A. muciniphila immunoglobulin G (IgG) in MS patients compared with controls and a significant correlation with disease disability [
20], which supports a putative role of this bacterium in MS. Furthermore, two studies demonstrated cross-recognition between recently identified MS autoantigens and
A. muciniphila derived peptides by CD4+ T cells from MS patients [
21,
22].
In order to better understand the involvement of intrathecal anti-A. muciniphila IgG in MS, we identified MS patients with different anti-A. muciniphila IgG indices and characterized them in depth by analysis of CSF measures, ex vivo immunophenotyping of CSF and paired blood samples as well as a demographic-, clinical-, and MRI characteristics.
2. Materials and Methods
Patient material
Paired CSF and blood samples were collected from 61 untreated MS patients (
Table 1). All CSF samples were obtained for diagnostic purposes. Patients were recruited from the Neuroimmunology and MS Research Section, Neurology Clinic, University Hospital Zurich (USZ). MS diagnosis was based on the revised McDonald criteria [
23]. Fifty patients had never been treated.
Eleven had previously been treated but were considered untreated at the time of lumbar puncture (7 patients received steroids, not during the last 4 weeks prior to enrolment and 4 patients received glatimer acetate not during the last 3 months prior to enrolment).
Quantification of anti-bacteria antibodies
ELISA tests were performed in paired serum and CSF samples as previously described to detect antibodies against
Akkermansia muciniphila [
20]. Bacterial proteins were coated at 1µg/ml in phosphate buffer saline (PBS) overnight at 4°C. Blocking was performed using Bovine serum albumin (Sigma Aldrich) at 1% in PBS during 1 hour at 37°C. Patient samples were incubated for 2 hours at 37°C in PBS, 1% bovine serum albumin (dilutions 1/100 for serum, 1/10 for CSF). Anti-human IgG antibodies coupled with horseradish peroxidase (Bethyl Laboratories) at 1/5 000, 1 hour at 37°C, were used for detection. The reaction with the substrate (3,3′,5,5′-Tetramethylbenzidine, BD Biosciences) was stopped with sulfuric acid (0.18M, Sigma Aldrich) after 10 min. Plates were read at 450 nm using a Spark 10M multimode microplate reader (Tecan).
Routine CSF and Serum/Blood Measures
CSF measures were determined as previously reported [
24]. Intrathecal indices for anti-
A. muciniphila IgG were calculated using the following formula (Ig Index= (Ig CSF/ Alb CSF)/(Ig Serum / Alb Serum)). Routine blood analyses including cell counts for neutrophils, eosinophils, basophils and monocytes were performed in the Hematology Department, USZ.
HLA Typing
Patients were typed for HLA-class II (DRB1*, DRB3*, DRB4*, DRB5*, DQA1* and DQB1*) as previously reported [
24].
Immunophenotyping
Flow cytometric immunophenotyping of CSF-infiltrating and paired circulating lymphocytes was performed as previously reported [
24,
25]. Antibodies: anti-CD3 AF700, anti-CD4 PE TR, anti-CD8 BV510, anti-CD45RA BV711, anti-CCR7 BV421, anti-CD27 APC Cy7, anti-CD28 PE Cy7, anti-CCR4 APC, anti-CRTh2 PE, anti-CCR6 BV785, anti-CD19 PerCPCy5.5, anti-IgD BV605 and anti-CD138 FITC. SPHEROTM AccuCount Particles (Sperotech, Inc. Lake Forest, IL) were added to determine absolute counts following manufacturer’s instructions. Sample acquisition was done in a LSR Fortessa cytometer (BD Biosciences, Franklin Lakes, NJ) and data was analyzed using FACSDiva (BD) and FlowJO (TreeStar Inc., Ashland, OR, USA) software. The gating strategy is summarized in
Figure 1.
Magnetic Resonance Imaging
Patients were scanned with a 3T Philips Ingenia or 3T Siemens Skyra. The MRI protocol included a 3D fluid-attenuated inversion recovery (FLAIR) sequence. The number and the total volume in ml of all hyperintense lesions were determined from the FLAIR images by an automatic algorithm based on convolutional neural networks [
26]. Whole brain volume in ml was determined on the pre-contrast MPRAGE image using the automatic processing pipeline Biometrica MS
® analysis platform (version 2.1, jung diagnostics GmbH, Hamburg, Germany) [
27].
Statistics
Statistical analysis was performed using GraphPad Prism 8.0 (GraphPad Software, La Jolla, California, USA). For the comparison of two groups of patients we used U-test (Mann-Whitney) for not-normally distributed variables. For the comparison of more than two groups of patients we used Kruskal-Wallis test for not-normally distributed variables. Linear correlation between variables was tested using Spearman r for not-normally distributed variables. The significance level was set at p < 0.05. Associations were calculated using Fisher’s Exact Test with 5% significance.
3. Results
3.1. IgGs Specific for Gut Commensal Bacteria
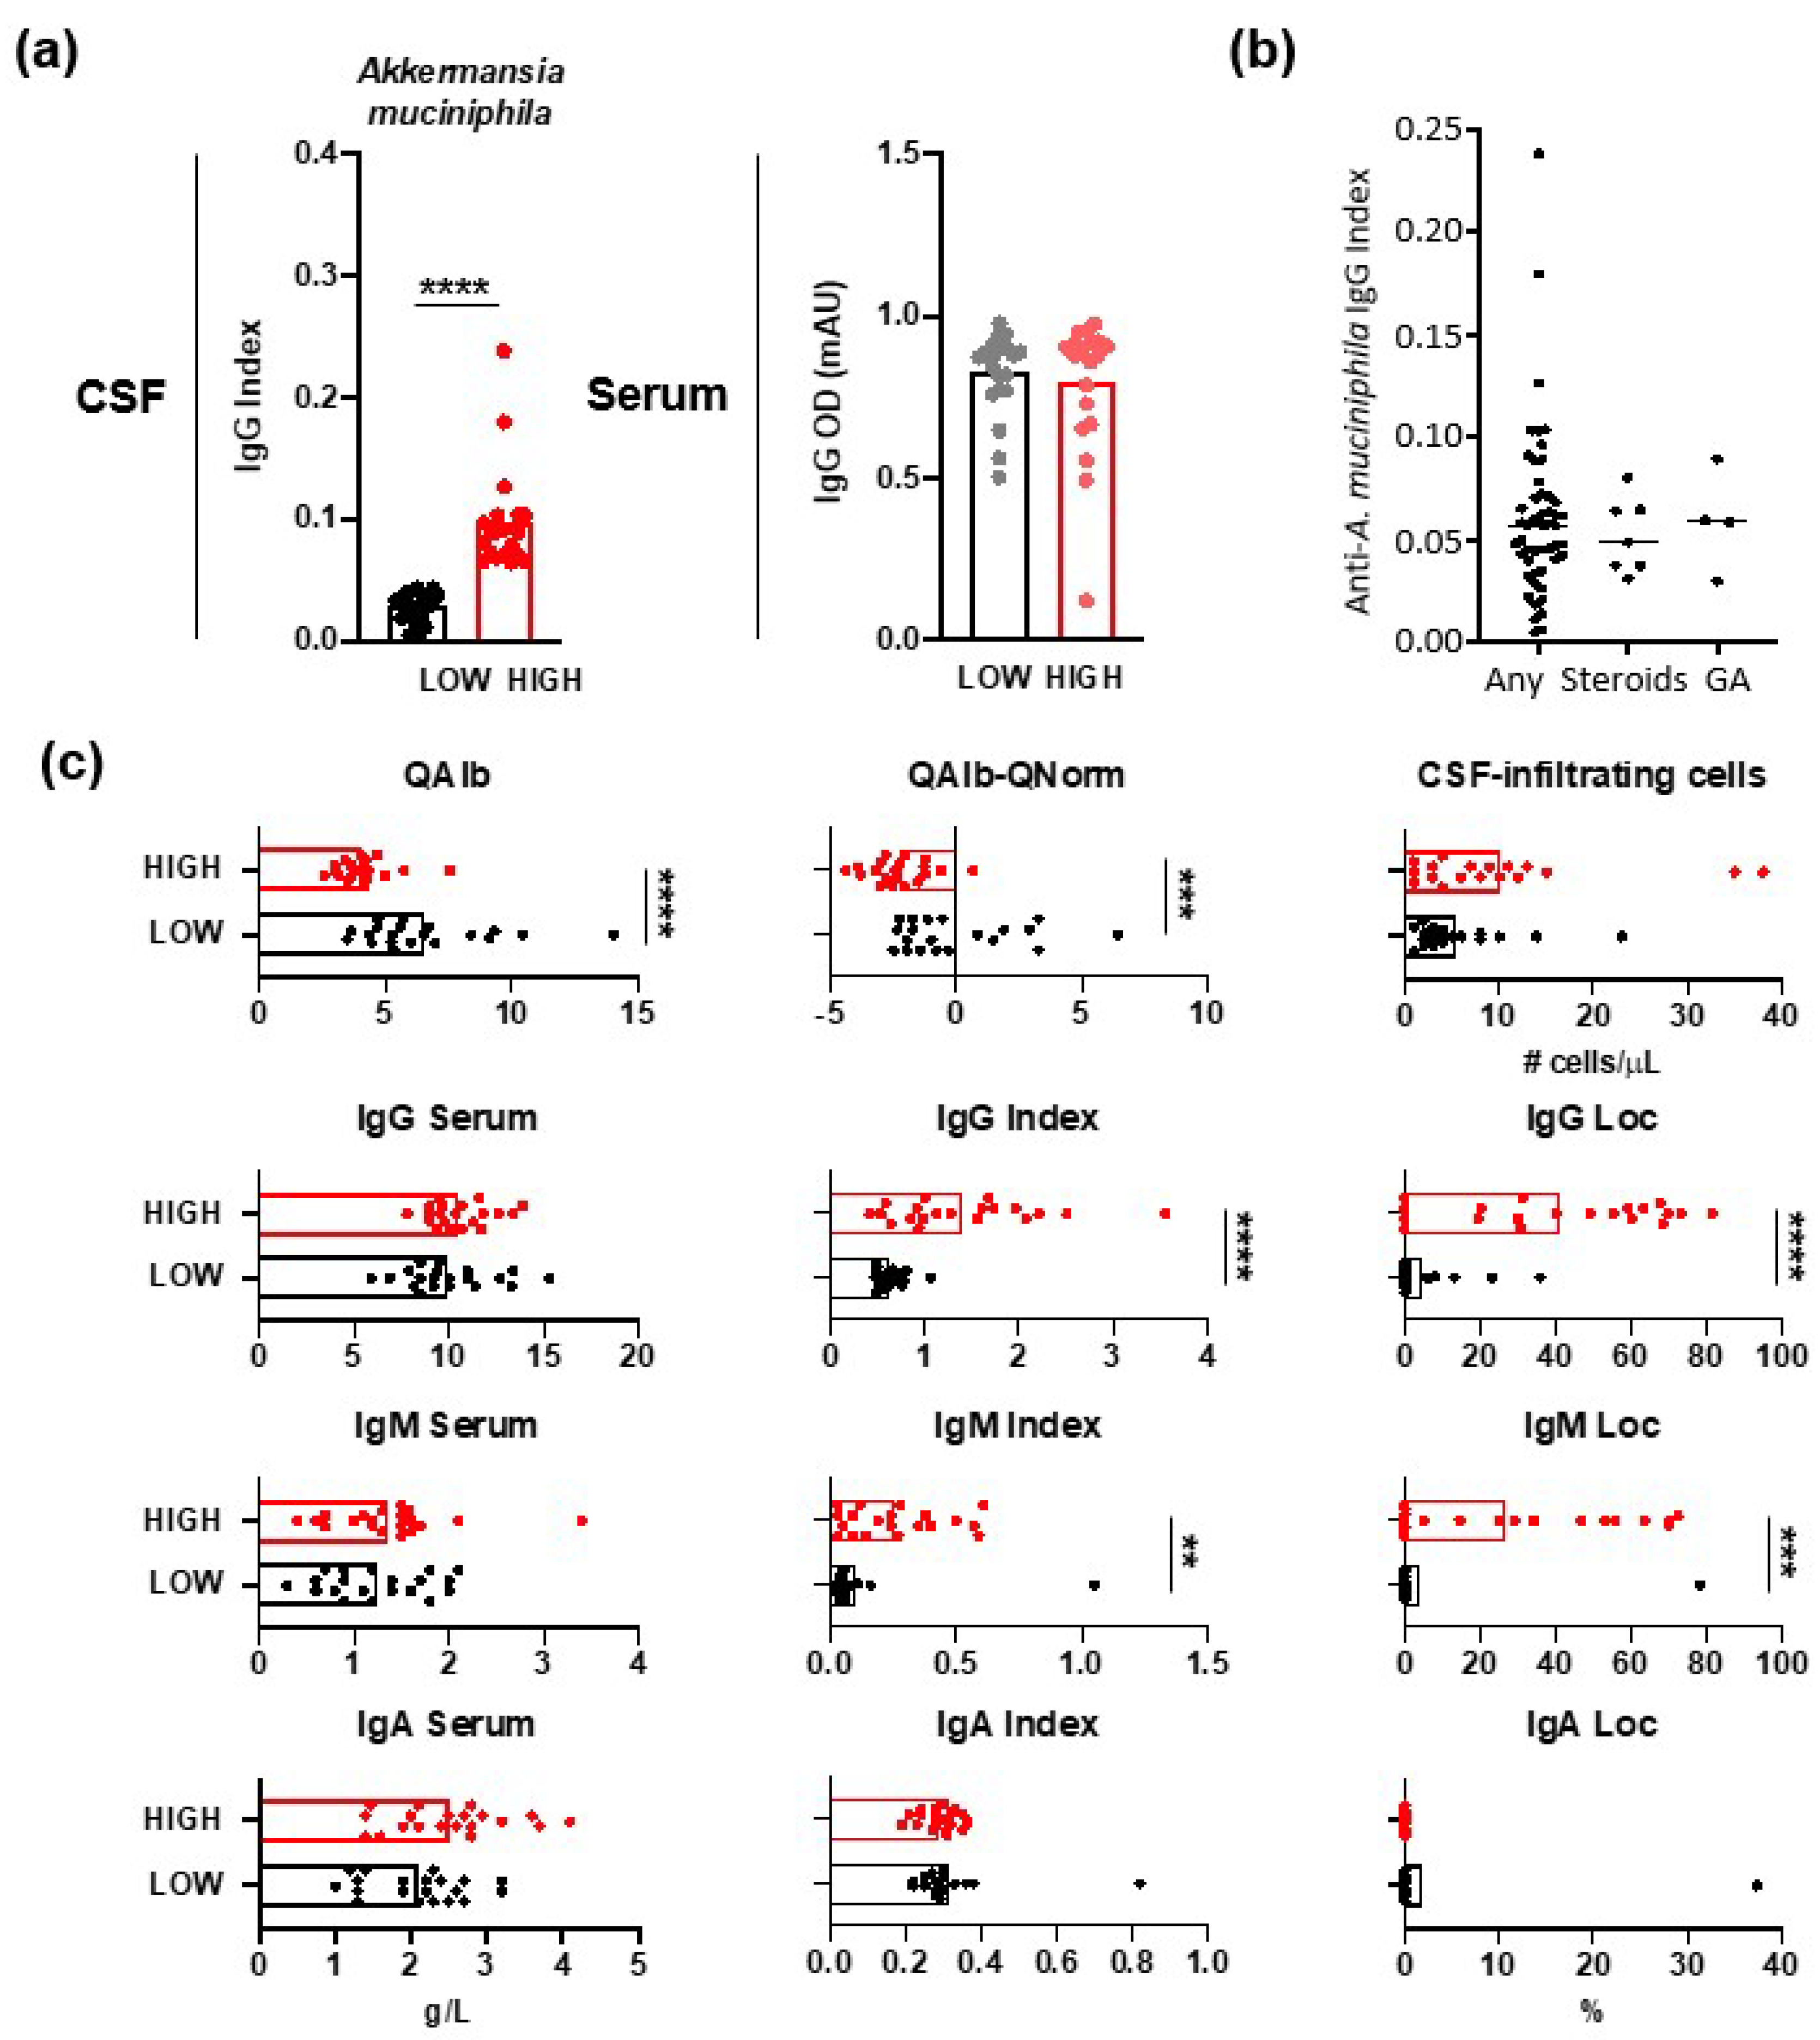
Intrathecal and serum levels of anti-
A. muciniphila IgG were measured in 61 MS patients (
Figure 2a). In order to characterize patients differing in anti-
A. muciniphila IgG index, we formed two patient groups, one with low and one with high index, by selecting the twenty patients with the lowest and highest anti-
A. muciniphila IgG index. There were no significant differences between anti-
A. muciniphila IgG indices in patients, who had never been treated and those with prior treatment (
Figure 2b).
3.2. CSF Measures in MS Patients with Different Anti-A. muciniphila IgG Index
Patients with low anti-
A. muciniphila IgG index showed significantly higher QAlb as well as QAlb-QNorm values, suggesting altered BBB permeability, but not higher numbers of CSF-infiltrating cells (
Figure 2e). Intrathecal IgG and IgM indices and synthesis were increased in patients with high anti-
A. muciniphila IgG index (
Figure 2e).
3.2.1. B Cells in MS Patients with Different Anti-A. muciniphila IgG Index
Immunophenotyping of CSF samples demonstrated significantly elevated relative frequencies (
Figure 3a) and absolute numbers (
Figure 3b) of plasma blasts (CD3- CD138+ CD19+) and B cells (CD3- CD138- CD19+) in patients with high anti-
A. muciniphila IgG index. Further, these frequencies (
Figure 3a) and numbers (
Figure 3b) correlated positively with the total- and anti-
A. muciniphila IgG indices. The absolute numbers of circulating plasma blasts and B cells were also significantly higher in patients with high anti-
A. muciniphila IgG index (Figure. 3c). While these counts did not correlate with the total IgG indices, they interestingly did with the anti-
A. muciniphila IgG indices (Figure. 3c).
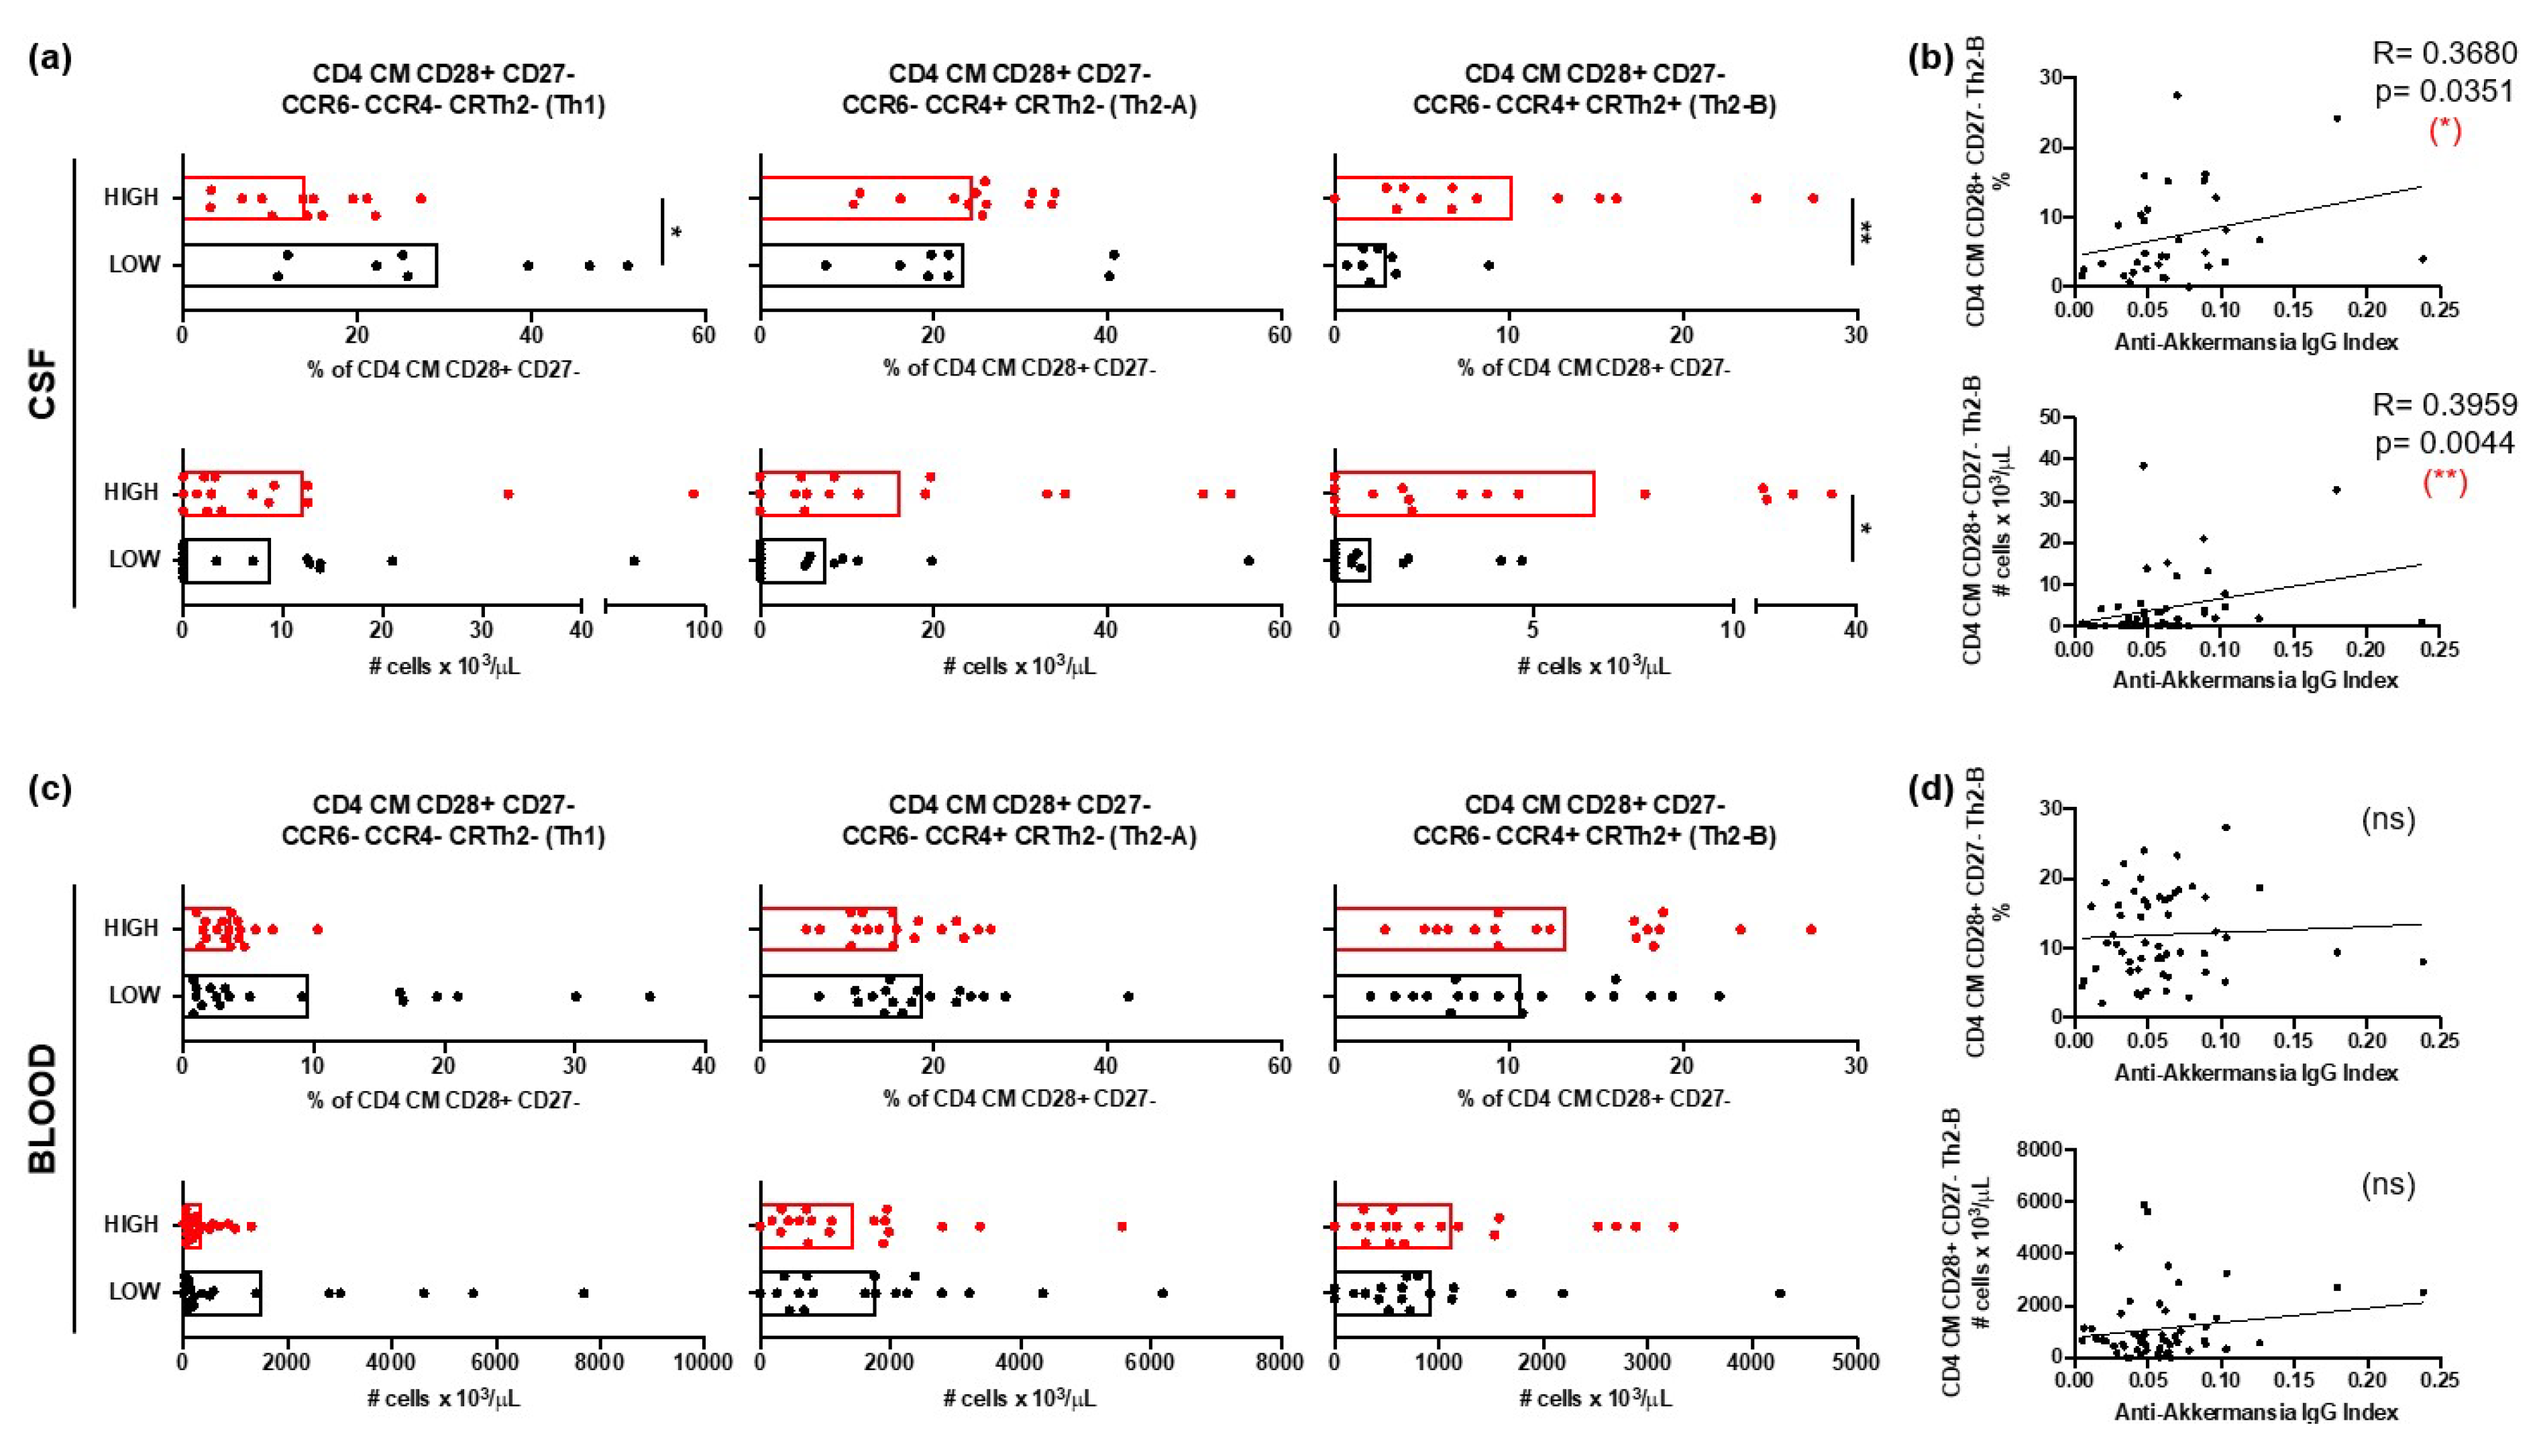
3.2.2. Th2 Cells in MS Patients with Different Anti-A. muciniphila IgG Index
The relative frequencies and the absolute numbers of CD4+ central memory (CM, CCR7+ CD45RA-) T cells expressing the coreceptor CD28 but not CD27, and with a Th2-B (CCR6- CCR4+ CRTh2+) functional phenotype were significantly higher in the CSF of patients with high anti-
A. muciniphila IgG index (
Figure 4a). Furthermore, both the relative frequencies and absolute numbers correlated with the anti-
A. muciniphila IgG indices (
Figure 4b). In contrast, the relative frequencies and absolute numbers of these cells in peripheral blood did not show differences between patients nor did they correlate with anti-
A. muciniphila IgG indices (
Figure 4c,d).
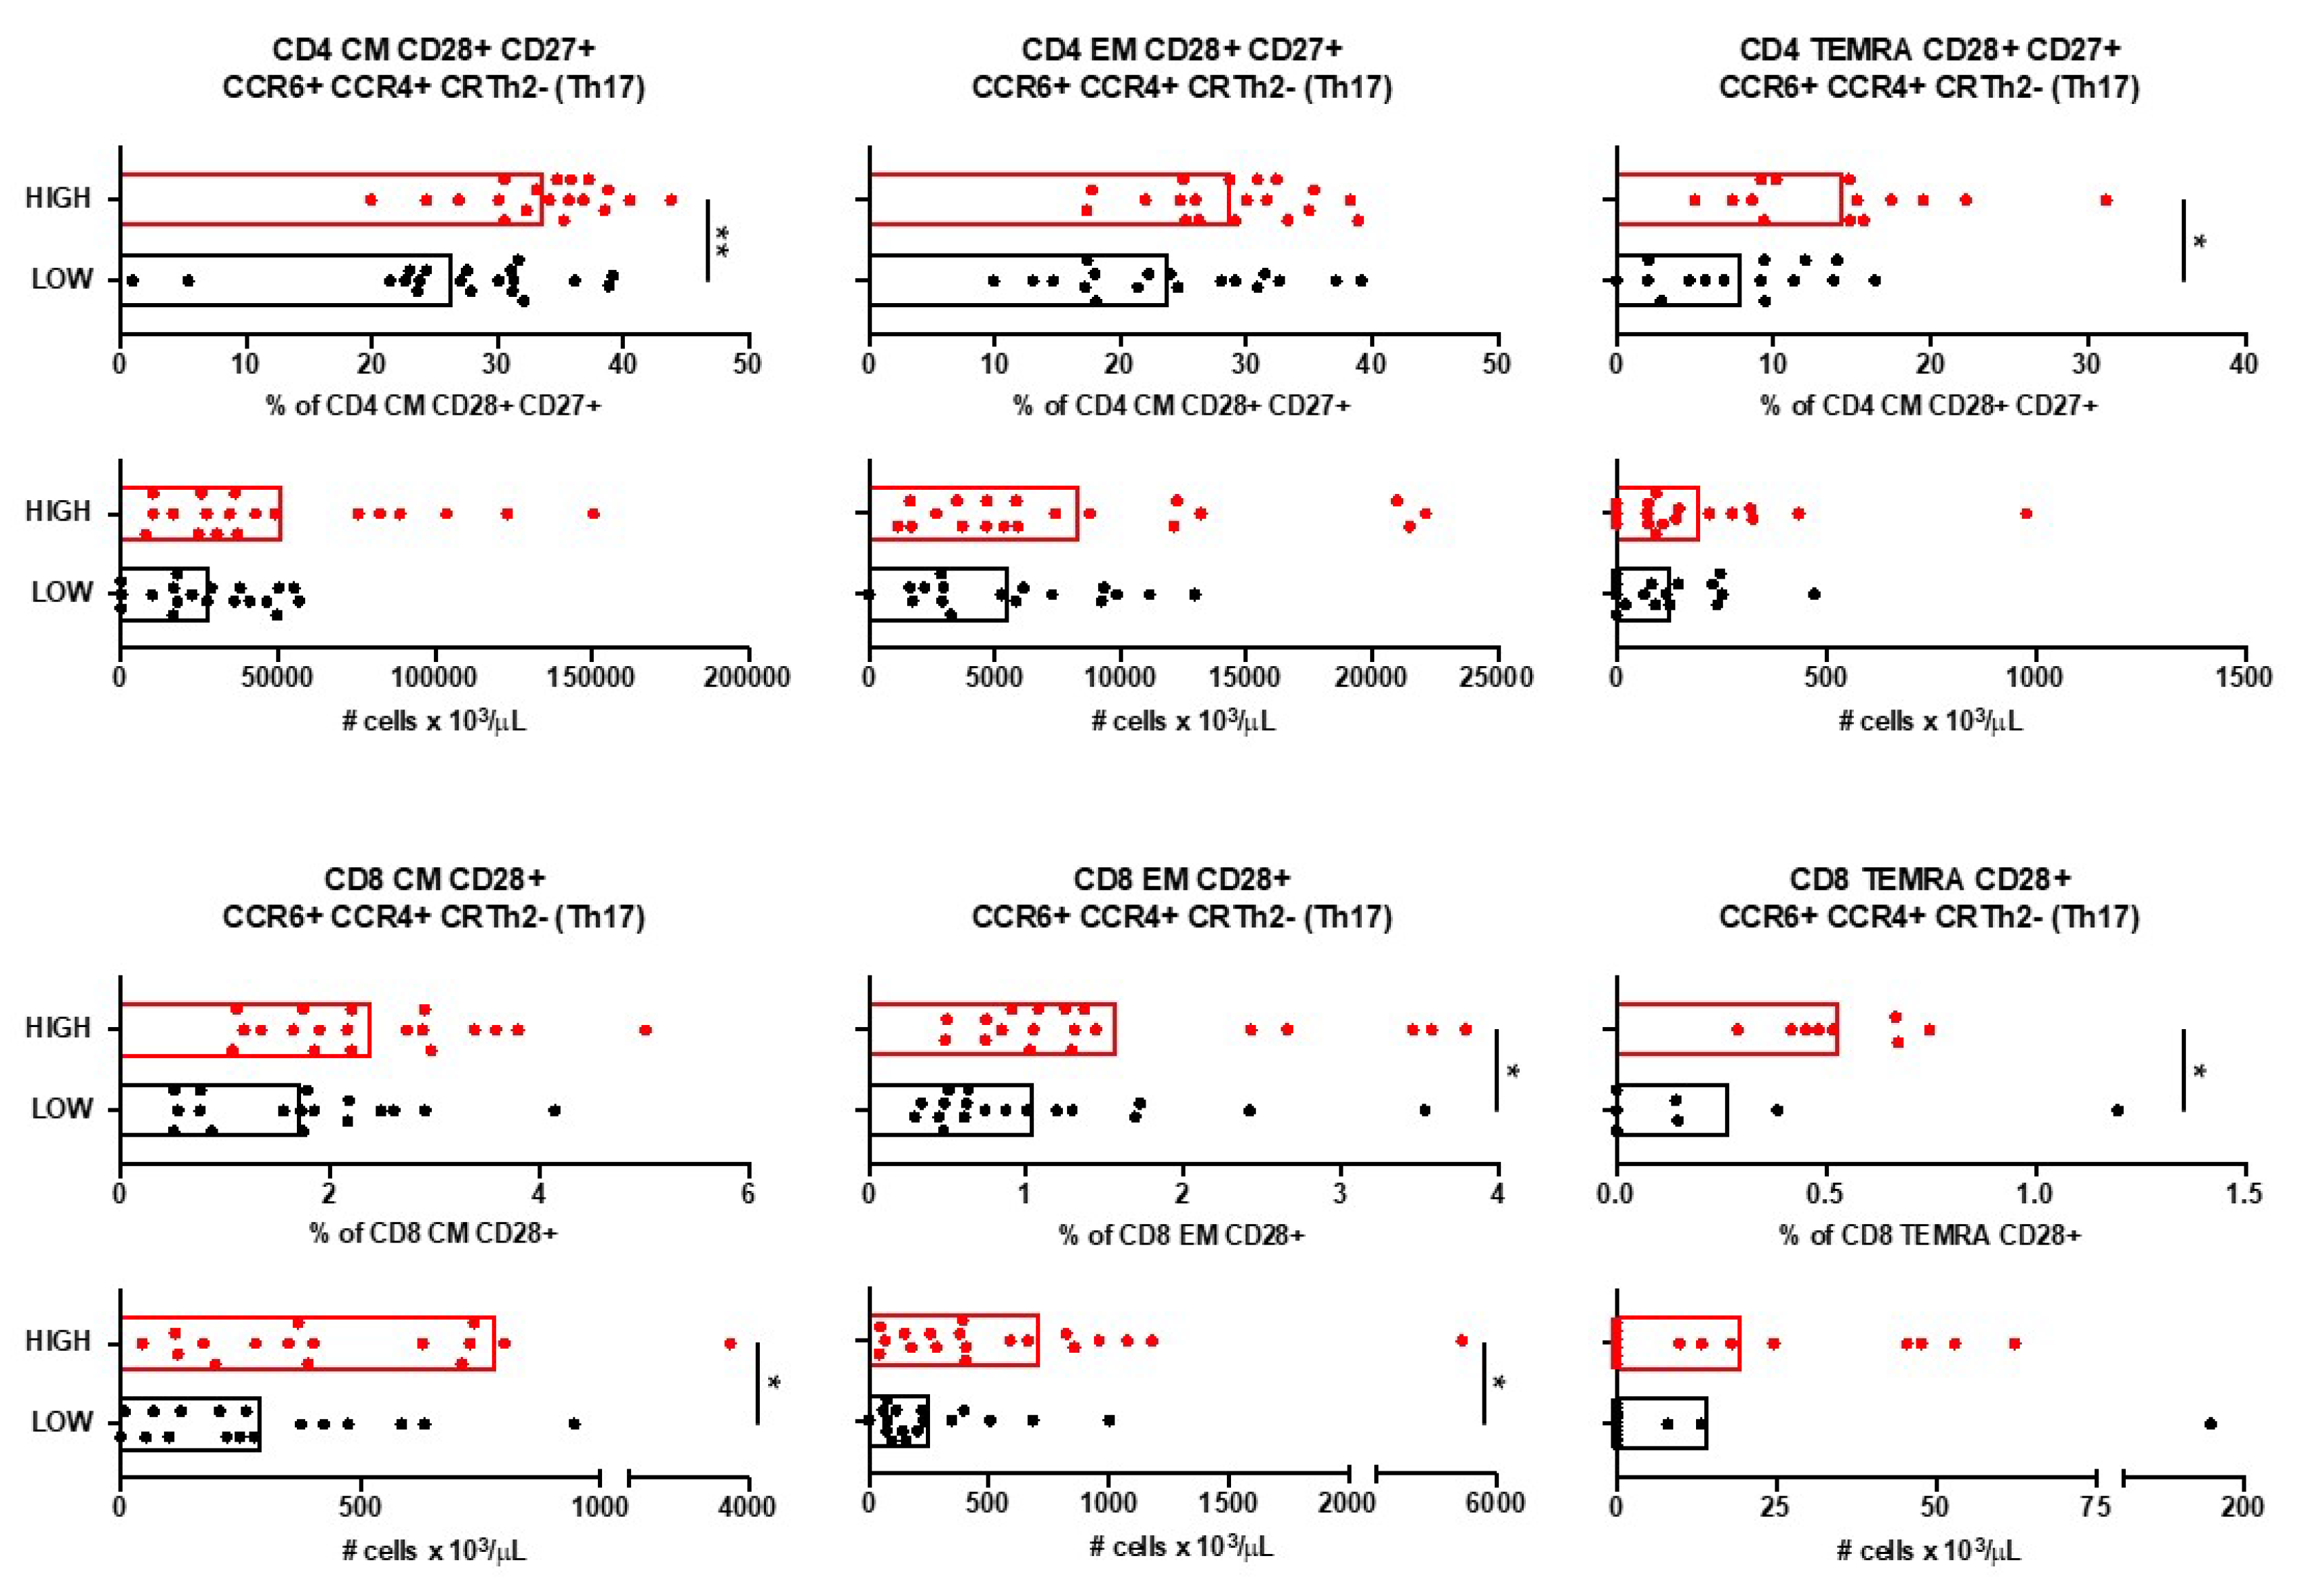
Immunophenotyping of blood samples revealed that only T cells with a Th17 (CCR6+ CCR4+ CRTh2-) functional phenotype were increased in patients with high anti-
A. muciniphila IgG indices (
Figure 5). Circulating CM and TEMRA CD4+ T expressing the co-stimulatory molecules CD28 and CD27 as well as EM and TEMRA CD8+ T cells expressing the co-stimulatory molecule CD28 and all with a Th17 functional phenotype were more frequent and/or more abundant in blood from patients with high anti-
A. muciniphila IgG indices (
Figure 5).
3.3. Characterization of Patients with Different Anti-A. muciniphila IgG Index
Demographic and clinical features did not differ between patients with low and high anti-
A. muciniphila IgG index (
Table 1).
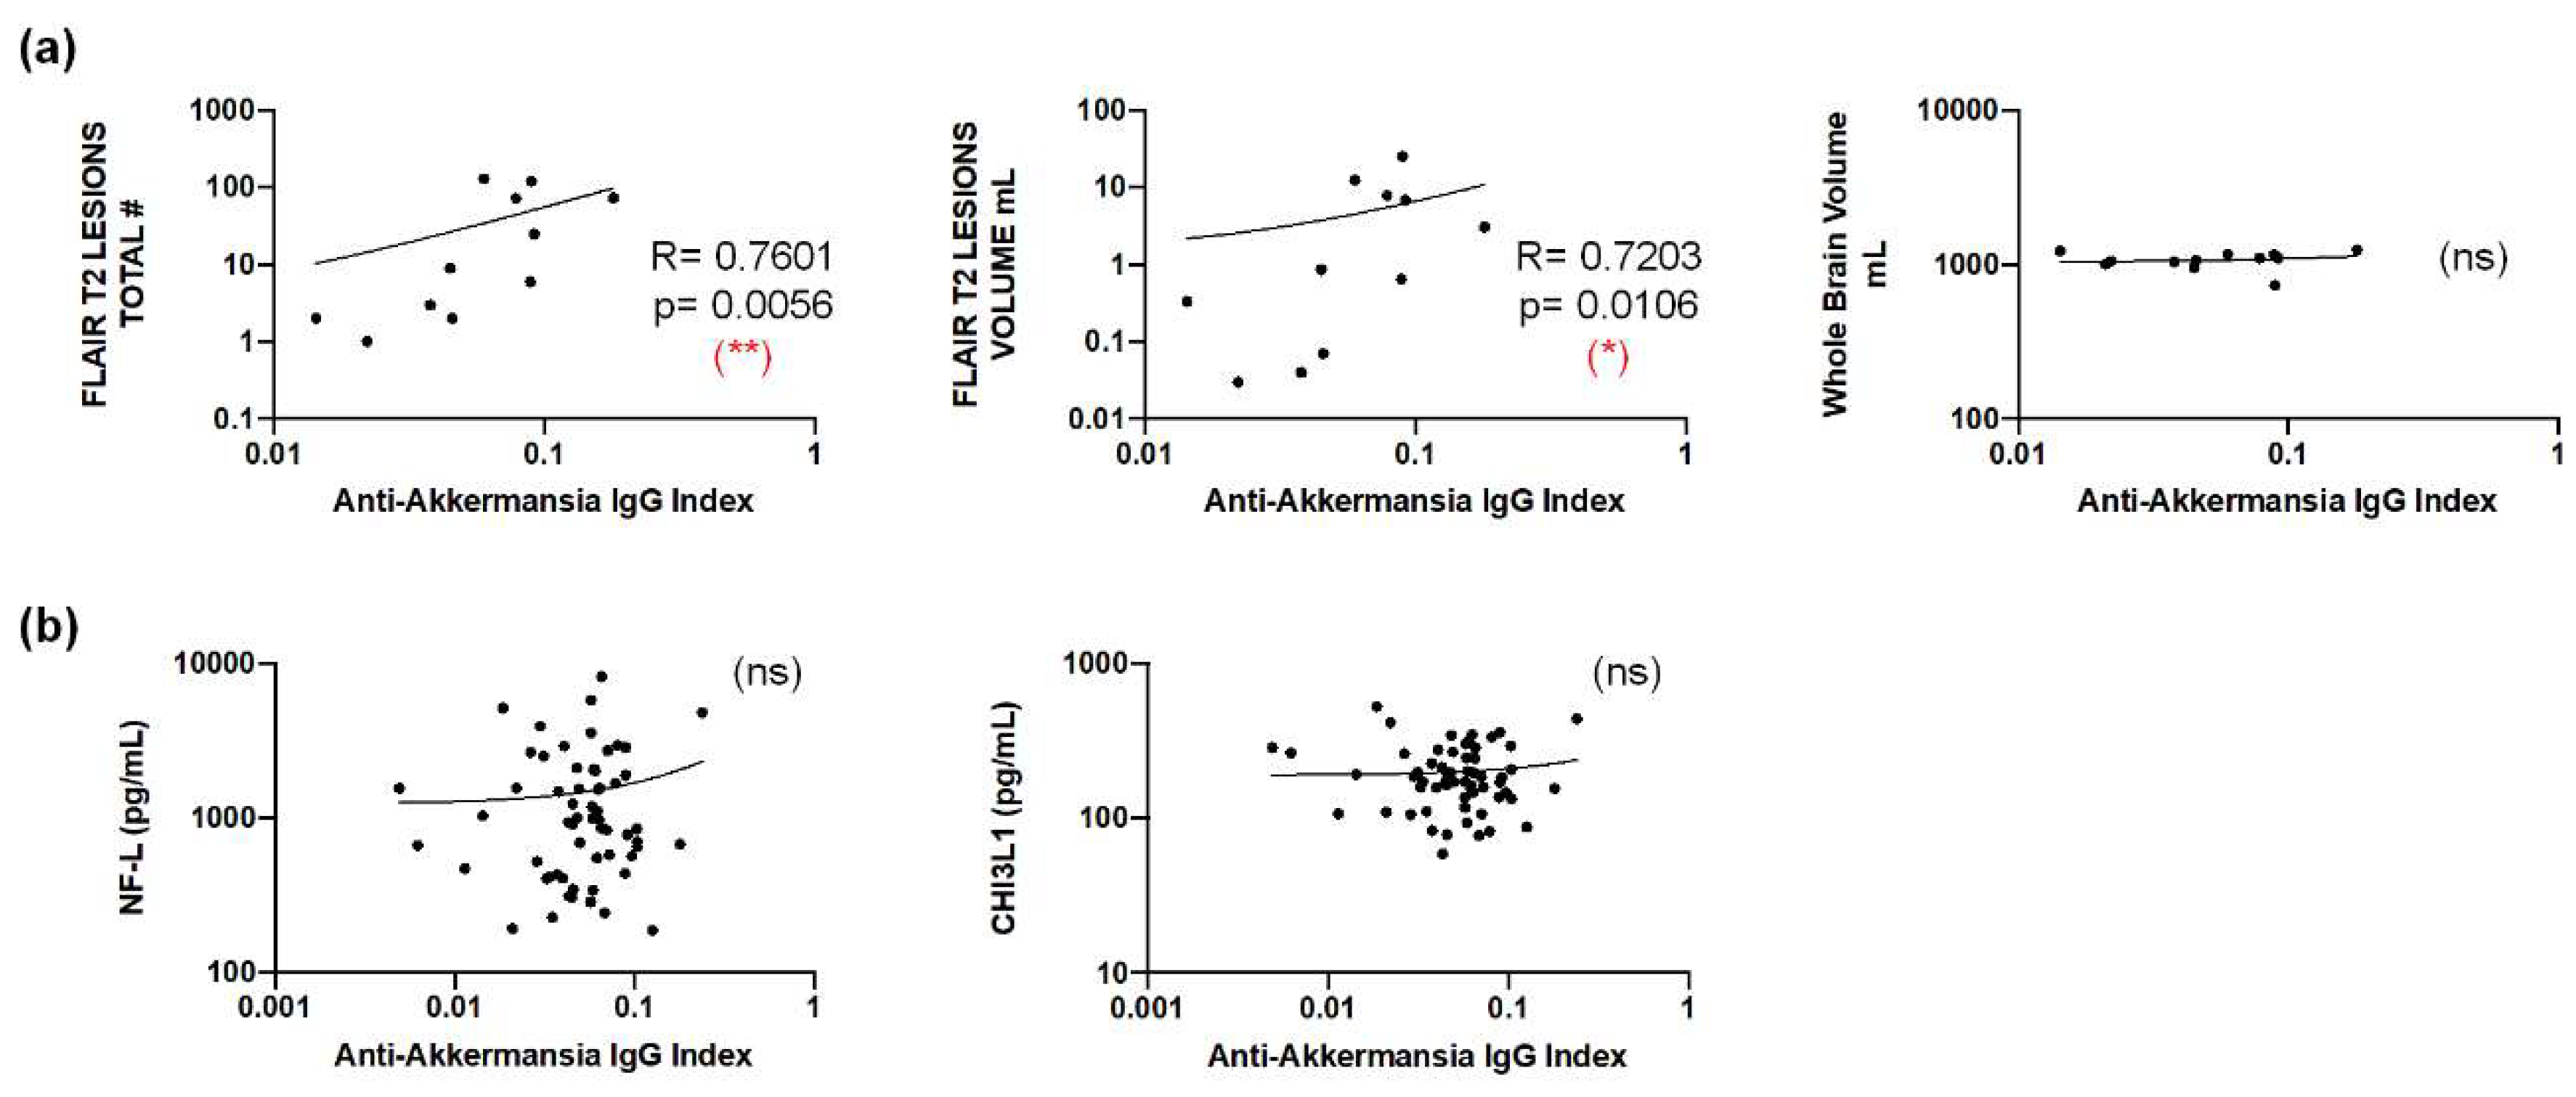
Although brain MRI scans that have been obtained at the time of lumbar puncture were only available from twelve patients, these showed a statistically significant correlation between anti-
A. muciniphila IgG indices and the total number and -volume of FLAIR T2 lesions, but not with the total brain volume (
Figure 6a). We also addressed CNS damage and inflammation by using neurofilament light chain (NF-L) [
28] and chitinase 3-like 1 (CHI3L1) [
29] as biomarkers. Neither intrathecal NF-L nor CHI3L1 correlated with anti-
A. muciniphila IgG indices (
Figure 6b).
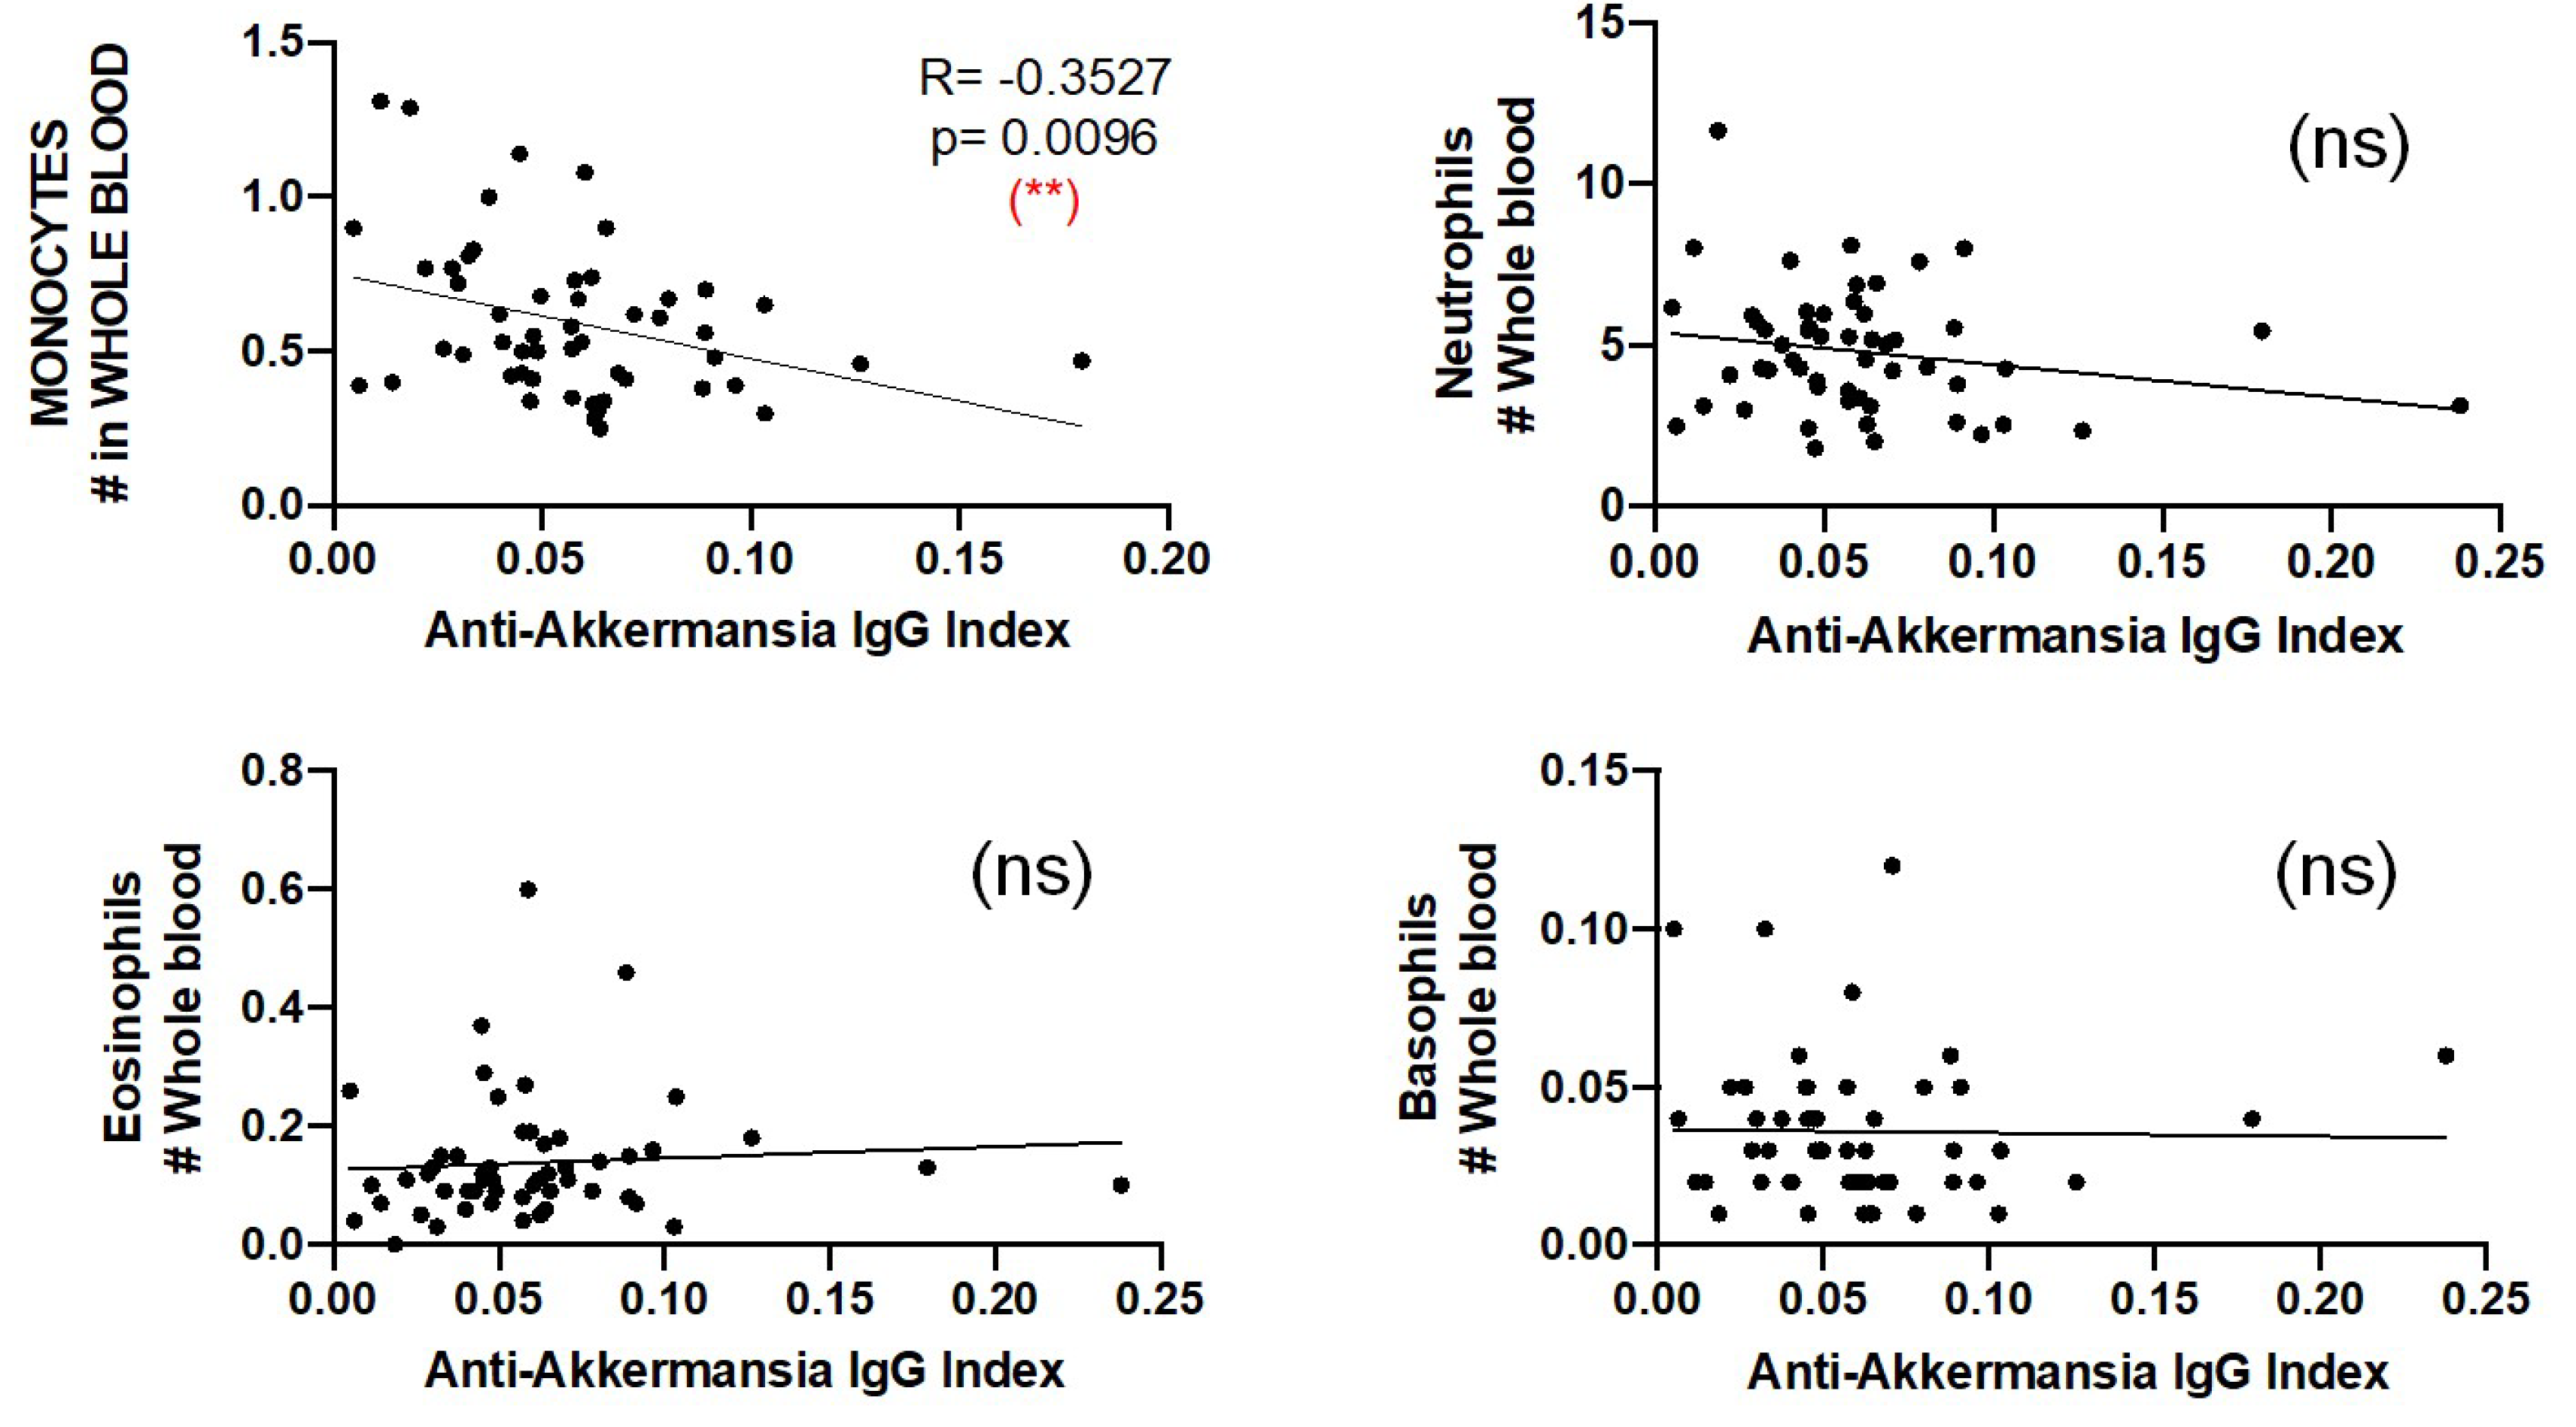
Finally, we compared the number of circulating neutrophils, eosinophils, basophils and monocytes and found a negative correlation between the number of circulating monocytes and the anti-
A. muciniphila IgG indices (
Figure 7).
4. Discussion
In this study, we aimed to find new evidence supporting a role of intrathecal anti- A. muciniphila IgG in MS pathogenesis and thoroughly characterized patients with different anti-A. muciniphila IgG index. The comparison of patients with low and high intrathecal IgG production against this gut bacterium identified significant differences regarding BBB permeability, CSF infiltrates, pro-inflammatory circulating immune cells as well as imaging features that indicate a role of these antibodies in MS pathogenesis.
MS patients with high anti-
A. muciniphila IgG index also produced higher intrathecal IgG against other gut bacteria such as
P. melaninogenica,
E. Coli and
B. fragilis, suggesting a leaky gut and a general translocation of gut commensal bacteria in these patients. However, intrathecal production of anti-
A. muciniphila IgG did not correlate with serum levels of IgG specific for gut bacteria, which may indicate a selective recruitment into the CNS compartment of B cells producing these antibodies. The intrathecal synthesis of anti-
A. muciniphila IgG is supported by higher intrathecal IgG and IgM synthesis in patients with high anti-
A. muciniphila IgG index and also by higher amounts of CSF-infiltrating cells, which may be involved in antibody production such as plasma blasts, B cells and CD4+ CM CD28+ CD27- Th2-B cells. Furthermore, both the relative frequencies and absolute numbers of these cells correlated with anti-
A. muciniphila IgG indices. CD4+ CM CD28+ CD27- Th2-B cells are probably relevant for providing B cell help since the downregulation of CD27 indicates repetitive stimulation with antigen [
30], and the expression of CCR4 [
31] and CRTh2 [
32] a Th2 phenotype. Unexpectedly, MS patients with high anti-
A. muciniphila IgG index had lower QAlb, suggesting that trafficking of albumin and cells through the BBB use different mechanisms.
Patients with high anti-
A. muciniphila IgG index also showed slightly higher pro-inflammatory Th17 cells. This is of interest since Th17 cells have been associated with many autoimmune diseases and are crucial in immune responses against bacterial infections [
33] and also against bacteria translocation [
34].
Finally, despite the low number of patients from whom brain MRI scans were available at the time of lumbar puncture, anti-
A. muciniphila IgG indices nicely correlated with the number and volume of FLAIR T2 lesions in the brain, suggesting a possible involvement of these antibodies in demyelination. The total brain volume and markers of CNS damage/inflammation such as NF-L [
28] and CHI3L1 [
29] did not correlate with anti-
A. muciniphila IgG indices, which renders an involvement of these antibodies in neurodegeneration unlikely.
5. Conclusions
Our results demonstrate an association between intrathecal anti-A. muciniphila IgG and CSF-infiltrating cells that are known to be involved in antibody production consistent with an intrathecal synthesis of anti-gut microbiota antibodies and a selective recruitment of specific immune cells into the CNS. The significant differences between patients with low and high anti-A. muciniphila IgG index regarding BBB permeability, MRI lesion load or peripheral inflammation, while preliminary, suggest an involvement of these antibodies in MS pathogenesis.
Author Contributions
Conceptualization, M.S. and L.B.; methodology, C.M., C.C.; validation, C.C., and C.M.; formal analysis, M.S., L.B.; investigation, X.X.; resources, X.X.; data curation, X.X.; writing—original draft preparation, M.S.; writing—review and editing, A.B.N., D.A.L., R.M., M.S. and L.B.; visualization, X.X.; supervision, X.X. D.A.L., R.M., M.S. and L.B.; project administration, X.X.; funding acquisition, R.M., D.A.L., M.S. and L.B. All authors have read and agreed to the published version of the manuscript.
Funding
This research was funded by European Research Council Advanced Grant (340733) (R.M.), Clinical Research Priority Programs (CRPPs) “Heterogeneity MS” and “Precision MS” of the University Zurich (R.M., M.S.), Clinical, Swiss National Science Foundation (Sinergia UnmetMS) (R.M., M.S.), the Swiss MS Society (R.M.), Region Pays de la Loire (L.B.), ANTARES (DA.L.), France Sclérose en Plaques (D.A.L. and L.B.) and Notre Sclérose (D.A.L. and L.B.).
Institutional Review Board Statement
The Cantonal Ethics Committee of Zurich approved the study procedures (EC-No. 2013-0001).
Informed Consent Statement
Informed consent was obtained from all subjects and their relatives involved in the study.
Data Availability Statement
Data are available upon reasonable requests.
Acknowledgments
This work has been carried out thanks to the support of the LabEx IGO project (n° ANR-11-LABX0016-01) funded by the «Investissements d’Avenir» French Government program, managed by the French National Research Agency (ANR).
Conflicts of Interest
The authors declare no conflict of interest. The funders had no role in the design of the study; in the collection, analyses, or interpretation of data; in the writing of the manuscript; or in the decision to publish the results.
References
- Sospedra, M.; Martin, R. Immunology of multiple sclerosis. Annu Rev Immunol 2005, 23, 683–747. [Google Scholar] [CrossRef] [PubMed]
- Sospedra, M. B cells in multiple sclerosis. Curr Opin Neurol 2018, 31, 256–62. [Google Scholar] [CrossRef] [PubMed]
- Ascherio, A.; Munger, K.L.; Lunemann, J.D. The initiation and prevention of multiple sclerosis. Nat Rev Neurol 2012, 8, 602–612. [Google Scholar] [CrossRef]
- Canto, E.; Oksenberg, J.R. Multiple sclerosis genetics. Mult Scler 2018, 24, 75–79. [Google Scholar] [CrossRef]
- Freedman, S.N.; Shahi, S.K.; Mangalam, A.K. The “Gut Feeling”: Breaking Down the Role of Gut Microbiome in Multiple Sclerosis. Neurotherapeutics 2018, 15, 109–125. [Google Scholar] [CrossRef]
- Cekanaviciute, E.; Yoo, B.B.; Runia, T.F.; Debelius, J.W.; Singh, S.; Nelson, C.A.; Kanner, R.; Bencosme, Y.; Lee, Y.K.; Hauser, S.L.; Crabtree-Hartman, E.; Sand, I.K.; Gacias, M.; Zhu, Y.; Casaccia, P.; Cree, B.A.C.; Knight, R.; Mazmanian, S.K.; Baranzini, S.E. Gut bacteria from multiple sclerosis patients modulate human T cells and exacerbate symptoms in mouse models. Proc Natl Acad Sci U S A 2017, 114, 10713–10718. [Google Scholar] [CrossRef]
- Berer, K.; Gerdes, L.A.; Cekanaviciute, E.; Jia, X.; Xiao, L.; Xia, Z.; Liu, C.; Klotz, L.; Stauffer, U.; Baranzini, S.E.; Kumpfel, T.; Holdfeld, R.; Krishnamoorthy, G.; Wekerle, H. Gut microbiota from multiple sclerosis patients enables spontaneous autoimmune encephalomyelitis in mice. Proc Natl Acad Sci U S A 2017, 114, 10719–10724. [Google Scholar] [CrossRef]
- Mu, Q.; Kirby, J.; Reilly, C.M.; Luo, X.M. Leaky Gut As a Danger Signal for Autoimmune Diseases. Front Immunol 2017, 8, 598. [Google Scholar] [CrossRef]
- Arpaia, N.; Campbell, C.; Fan, X.; Dikiy, S.; van der Veeken, J.; deRoos, P.; Liu, H.; Cross, J.R.; Pfeffer, K.; Coffer, P.J.; Rudensky, A.Y. Metabolites produced by commensal bacteria promote peripheral regulatory T-cell generation. Nature 2013, 504, 451–455. [Google Scholar] [CrossRef]
- Haghikia, A.; Jorg, S.; Duscha, A.; Berg, J.; Manzel, A.; Waschbisch, A.; Hammer, A.; Lee, D.H.; May, C.; Wilck, N.; Balogh, A.; Ostermann, A.I.; Schebb, N.H.; Akkad, D.A.; Grohme, D.A.; Kleinewietfeld, M.; Kempa, S.; Thöne, J.; Demir, S.; Müller, D.N.; Gold, R.; Linker, R.A. Dietary Fatty Acids Directly Impact Central Nervous System Autoimmunity via the Small Intestine. Immunity 2015, 43, 817–829. [Google Scholar] [CrossRef]
- Desai, M.S.; Seekatz, A.M.; Koropatkin, N.M.; Kamada, N.; Hickey, C.A.; Wolter, M.; Pudlo, N.A.; Kitamoto, S.; Terrapon, N.; Muller, A.; Young, V.B.; Henrissat, B.; Wlimes, P.; Stappenbeck, T.S.; Nunez, G.; Martens, E.C. A Dietary Fiber-Deprived Gut Microbiota Degrades the Colonic Mucus Barrier and Enhances Pathogen Susceptibility. Cell 2016, 167, 1339–1353.e21. [Google Scholar] [CrossRef] [PubMed]
- Brenchley, J.M.; Douek, D.C. Microbial translocation across the GI tract. Annu Rev Immunol 2012, 30, 149–173. [Google Scholar] [CrossRef] [PubMed]
- Varatharaj, A.; Galea, I. The blood-brain barrier in systemic inflammation. Brain Behav Immun 2017, 60, 1–12. [Google Scholar] [CrossRef] [PubMed]
- Erny, D.; Hrabe de Angelis, A.L.; Jaitin, D.; Wieghofer, P.; Staszewski, O.; David, E.; Keren-Shaul, H.; Mahlakoiv, T.; Jakobshagen, K.; Buch, T.; Schwierzeck, V.; Utermöhlen, O.; Chun, E.; Garrett, W.S.; McCoy, K.D.; Diefenbach, A.; Staeheli, P.; Stecher, B.; Amit, I.; Prinz, M. Host microbiota constantly control maturation and function of microglia in the CNS. Nat Neurosci 2015, 18, 965–977. [Google Scholar] [CrossRef]
- Rothhammer, V.; Mascanfroni, I.D.; Bunse, L.; Takenaka, M.C.; Kenison, J.E.; Mayo, L.; Chao, C.C.; Patel, B.; Yan, R.; Blain, M.; Alvarez, J.I.; Kébir, H.; Anandasabapathy, N.; Izquierdo, G.; Jung, S.; Obholzer, N.; Pochet, N.; Clish, C.B.; Prinz, M.; Prat, A.; Antel, J.; Quintana, F.J. Type I interferons and microbial metabolites of tryptophan modulate astrocyte activity and central nervous system inflammation via the aryl hydrocarbon receptor. Nat Med 2016, 22, 586–597. [Google Scholar] [CrossRef]
- Camara-Lemarroy, C.R.; Silva, C.; Greenfield, J.; Liu, W.Q.; Metz, L.M.; Yong, V.W. Biomarkers of intestinal barrier function in multiple sclerosis are associated with disease activity. Mult Scler 2020, 26, 1340–1350. [Google Scholar] [CrossRef]
- Buscarinu, M.C.; Fornasiero, A.; Romano, S.; Ferraldeschi, M.; Mechelli, R.; Renie, R.; Ferraldeschi, M.; Mechelli, R.; Reniè, R.; Morena, E.; Romano, C.; Pellicciari, G.; Landi, A.C.; Salvetti, M.; Ristori, G. The Contribution of Gut Barrier Changes to Multiple Sclerosis Pathophysiology. Front Immunol 2019, 10, 1916. [Google Scholar] [CrossRef]
- Teixeira, B.; Bittencourt, V.C.; Ferreira, T.B.; Kasahara, T.M.; Barros, P.O.; Alvarenga, R.; Hygino, J.; Andrade, R.M.; Andrade, A.F.; Bento, C.A. Low sensitivity to glucocorticoid inhibition of in vitro Th17-related cytokine production in multiple sclerosis patients is related to elevated plasma lipopolysaccharide levels. Clin Immunol 2013, 148, 209–218. [Google Scholar] [CrossRef]
- Jangi, S.; Gandhi, R.; Cox, L.M.; Li, N.; von Glehn, F.; Yan, R.; Patel, B.; Mazzola, M.A.; Liu, S.; Glank, B.L.; Cook, S.; Tankou, S.; Stuart, F.; Melo, K.; Nejad, P.; Smith, K.; Topçuolu, B.D.; Holden, J.; Kivisäkk, P.; Chitnis, T.; De Jager, P.L.; Quintana, F.J.; Gerber, G.K.; Bry, L.; Weiner, H.L. Alterations of the human gut microbiome in multiple sclerosis. Nat Commun 2016, 7, 12015. [Google Scholar] [CrossRef]
- Vallino, A.; Dos Santos, A.; Mathe, C.V.; Garcia, A.; Morille, J.; Dugast, E.; Shah, S.P.; Héry-Arnaud, G.; Guilloux, C.A.; Gleeson, P.J.; Monteiro, R.C.; Soulillou, J.P.; Harb, J.; Bigot-Corbel, E.; Michel, L.; Wiertlewski, S.; Nicot, A.B.; Laplaud, D.A.; Berthelot, L. Gut bacteria Akkermansia elicit a specific IgG response in CSF of patients with MS. Neurol Neuroimmunol Neuroinflamm 2020, 7, e688. [Google Scholar] [CrossRef]
- Planas, R.; Santos, R.; Tomas-Ojer, P.; Cruciani, C.; Lutterotti, A.; Faigle, W.; Schaeren6wiemers, N.; Espejo, C.; Eixarch, H.; Pinilla, C.; Martin, R.; Sospedra, M. GDP-l-fucose synthase is a CD4(+) T cell-specific autoantigen in DRB3*02:02 patients with multiple sclerosis. Sci Transl Med 2018, 10, eaat4301. [Google Scholar] [CrossRef] [PubMed]
- Wang, J.; Jelcic, I.; Muhlenbruch, L.; Haunerdinger, V.; Toussaint, N.C.; Zhao, Y.; et al. HLA-DR15 Molecules Jointly Shape an Autoreactive T Cell Repertoire in Multiple Sclerosis. Cell 2020, 183, 1264–1281. [Google Scholar] [CrossRef] [PubMed]
- Polman, C.H.; Reingold, S.C.; Banwell, B.; Clanet, M.; Cohen, J.A.; Filippi, M.; Fujihara, K.; Havrdova, E.; Hutchinson, M.; Kappos, L.; Lublin, F.D.; Montalban, X.; O’Connor, P.; Sandberg-Wolheim, M.; Thompson, A.J.; Waubant, E.; Winshenker, B.; Wollinsky, J.S. Diagnostic criteria for multiple sclerosis: 2010 revisions to the McDonald criteria. Ann Neurol 2011, 69, 292–302. [Google Scholar] [CrossRef]
- Puthenparampil, M.; Tomas-Ojer, P.; Hornemann, T.; Lutterotti, A.; Jelcic, I.; Ziegler, M.; Hulsmeier, A.J.; Cruciani, C.; Faigle, W.; Martin, R.; Sospedra, M. Altered CSF Albumin Quotient Links Peripheral Inflammation and Brain Damage in MS. Neurol Neuroimmunol Neuroinflamm 2021, 8, e951. [Google Scholar] [CrossRef] [PubMed]
- Brodie, T.; Rothaeusler, K.; Sospedra, M. OMIP-033: A comprehensive single step staining protocol for human T- and B-cell subsets. Cytometry A 2016, 89, 629–632. [Google Scholar] [CrossRef]
- Kruger, J.; Opfer, R.; Gessert, N.; Ostwaldt, A.C.; Manogaran, P.; Kitzler, H.H.; Schlaefer, A.; Schippling, S. Fully automated longitudinal segmentation of new or enlarged multiple sclerosis lesions using 3D convolutional neural networks. Neuroimage Clin 2020, 28, 102445. [Google Scholar] [CrossRef]
- Schippling, S.; Ostwaldt, A.C.; Suppa, P.; Spies, L.; Manogaran, P.; Gocke, C.; Huppertz, H.J.; Opfer, R. Global and regional annual brain volume loss rates in physiological aging. J Neurol 2017, 264, 520–528. [Google Scholar] [CrossRef]
- Bergman, J.; Dring, A.; Zetterberg, H.; Blennow, K.; Norgren, N.; Gilthorpe, J.; et al. Neurofilament light in CSF and serum is a sensitive marker for axonal white matter injury in MS. Neurol Neuroimmunol Neuroinflamm 2016, 3, e271. [Google Scholar] [CrossRef]
- Bonneh-Barkay, D.; Bissel, S.J.; Kofler, J.; Starkey, A.; Wang, G.; Wiley, C.A. Astrocyte and macrophage regulation of YKL-40 expression and cellular response in neuroinflammation. Brain Pathol 2012, 22, 530–546. [Google Scholar] [CrossRef]
- Watts, T.H. TNF/TNFR family members in costimulation of T cell responses. Annu Rev Immunol 2005, 23, 23–68. [Google Scholar] [CrossRef]
- Morgan, A.J.; Symon, F.A.; Berry, M.A.; Pavord, I.D.; Corrigan, C.J.; Wardlaw, A.J. IL-4-expressing bronchoalveolar T cells from asthmatic and healthy subjects preferentially express CCR 3 and CCR 4. J Allergy Clin Immunol 2005, 116, 594–600. [Google Scholar] [CrossRef] [PubMed]
- Cosmi, L.; Annunziato, F.; Galli, M.I.G.; Maggi, R.M.E.; Nagata, K.; Romagnani, S. CRTH2 is the most reliable marker for the detection of circulating human type 2 Th and type 2 T cytotoxic cells in health and disease. Eur J Immunol 2000, 30, 2972–2979. [Google Scholar] [CrossRef] [PubMed]
- Tesmer, L.A.; Lundy, S.K.; Sarkar, S.; Fox, D.A. Th17 cells in human disease. Immunol Rev 2008, 223, 87–113. [Google Scholar] [CrossRef] [PubMed]
- Akdis, C.A. Does the epithelial barrier hypothesis explain the increase in allergy, autoimmunity and other chronic conditions? Nat Rev Immunol 2021, 21, 739–751. [Google Scholar] [CrossRef]
Figure 1.
Gating strategy of T and B cells. Doublets were excluded, followed by identification of lymphocytes by size. Next, CD3- are identified and among them, plasma cells (CD19- CD138+), plasma blasts (CD19+ CD138+), B cells (CD19+ CD138-) and CD19- CD138- cells. Among B cells, naïve (IgD+ CD27-), unswitched memory (IgD+ CD27+), switched memory (IgD- CD27+) and doublé negative (IgD- CD27-) B cell subsets are also identified. In CD3+ T cells, CD3+ CD4+ and CD3+ CD8+ cells are first identified and then separated in CM (CCR7+ CD45RA-), EM (CCR7- CD45RA-), TEMRA (CCR7- CD45RA+) and naive (CCR7+ CD45RA+). CM, EM and TEMRA CD8+ T cells are then separated in CD28+ and CD28- while CM, EM and TEMRA CD4+ T cells in CD28+ CD27+, CD28+ CD27- and CD28-. Each one of these CD4+ and CD8+ T cells are separated first in CCR6- and CCR6+ and then in Th1 (CCR6- CCR4- CRTH2-), Th2-A (CCR6- CCR4+ CRTH2-), Th2-B (CCR6- CCR4+ CRTH2+), CCR6- CCR4- CRTH2+, Th1* (CCR6+ CCR4- CRTH2-), Th17 (CCR6- CCR4+ CRTH2-), CCR6+ CCR4+ CRTH2+ and CCR6+ CCR4- CRTH2+ cells.
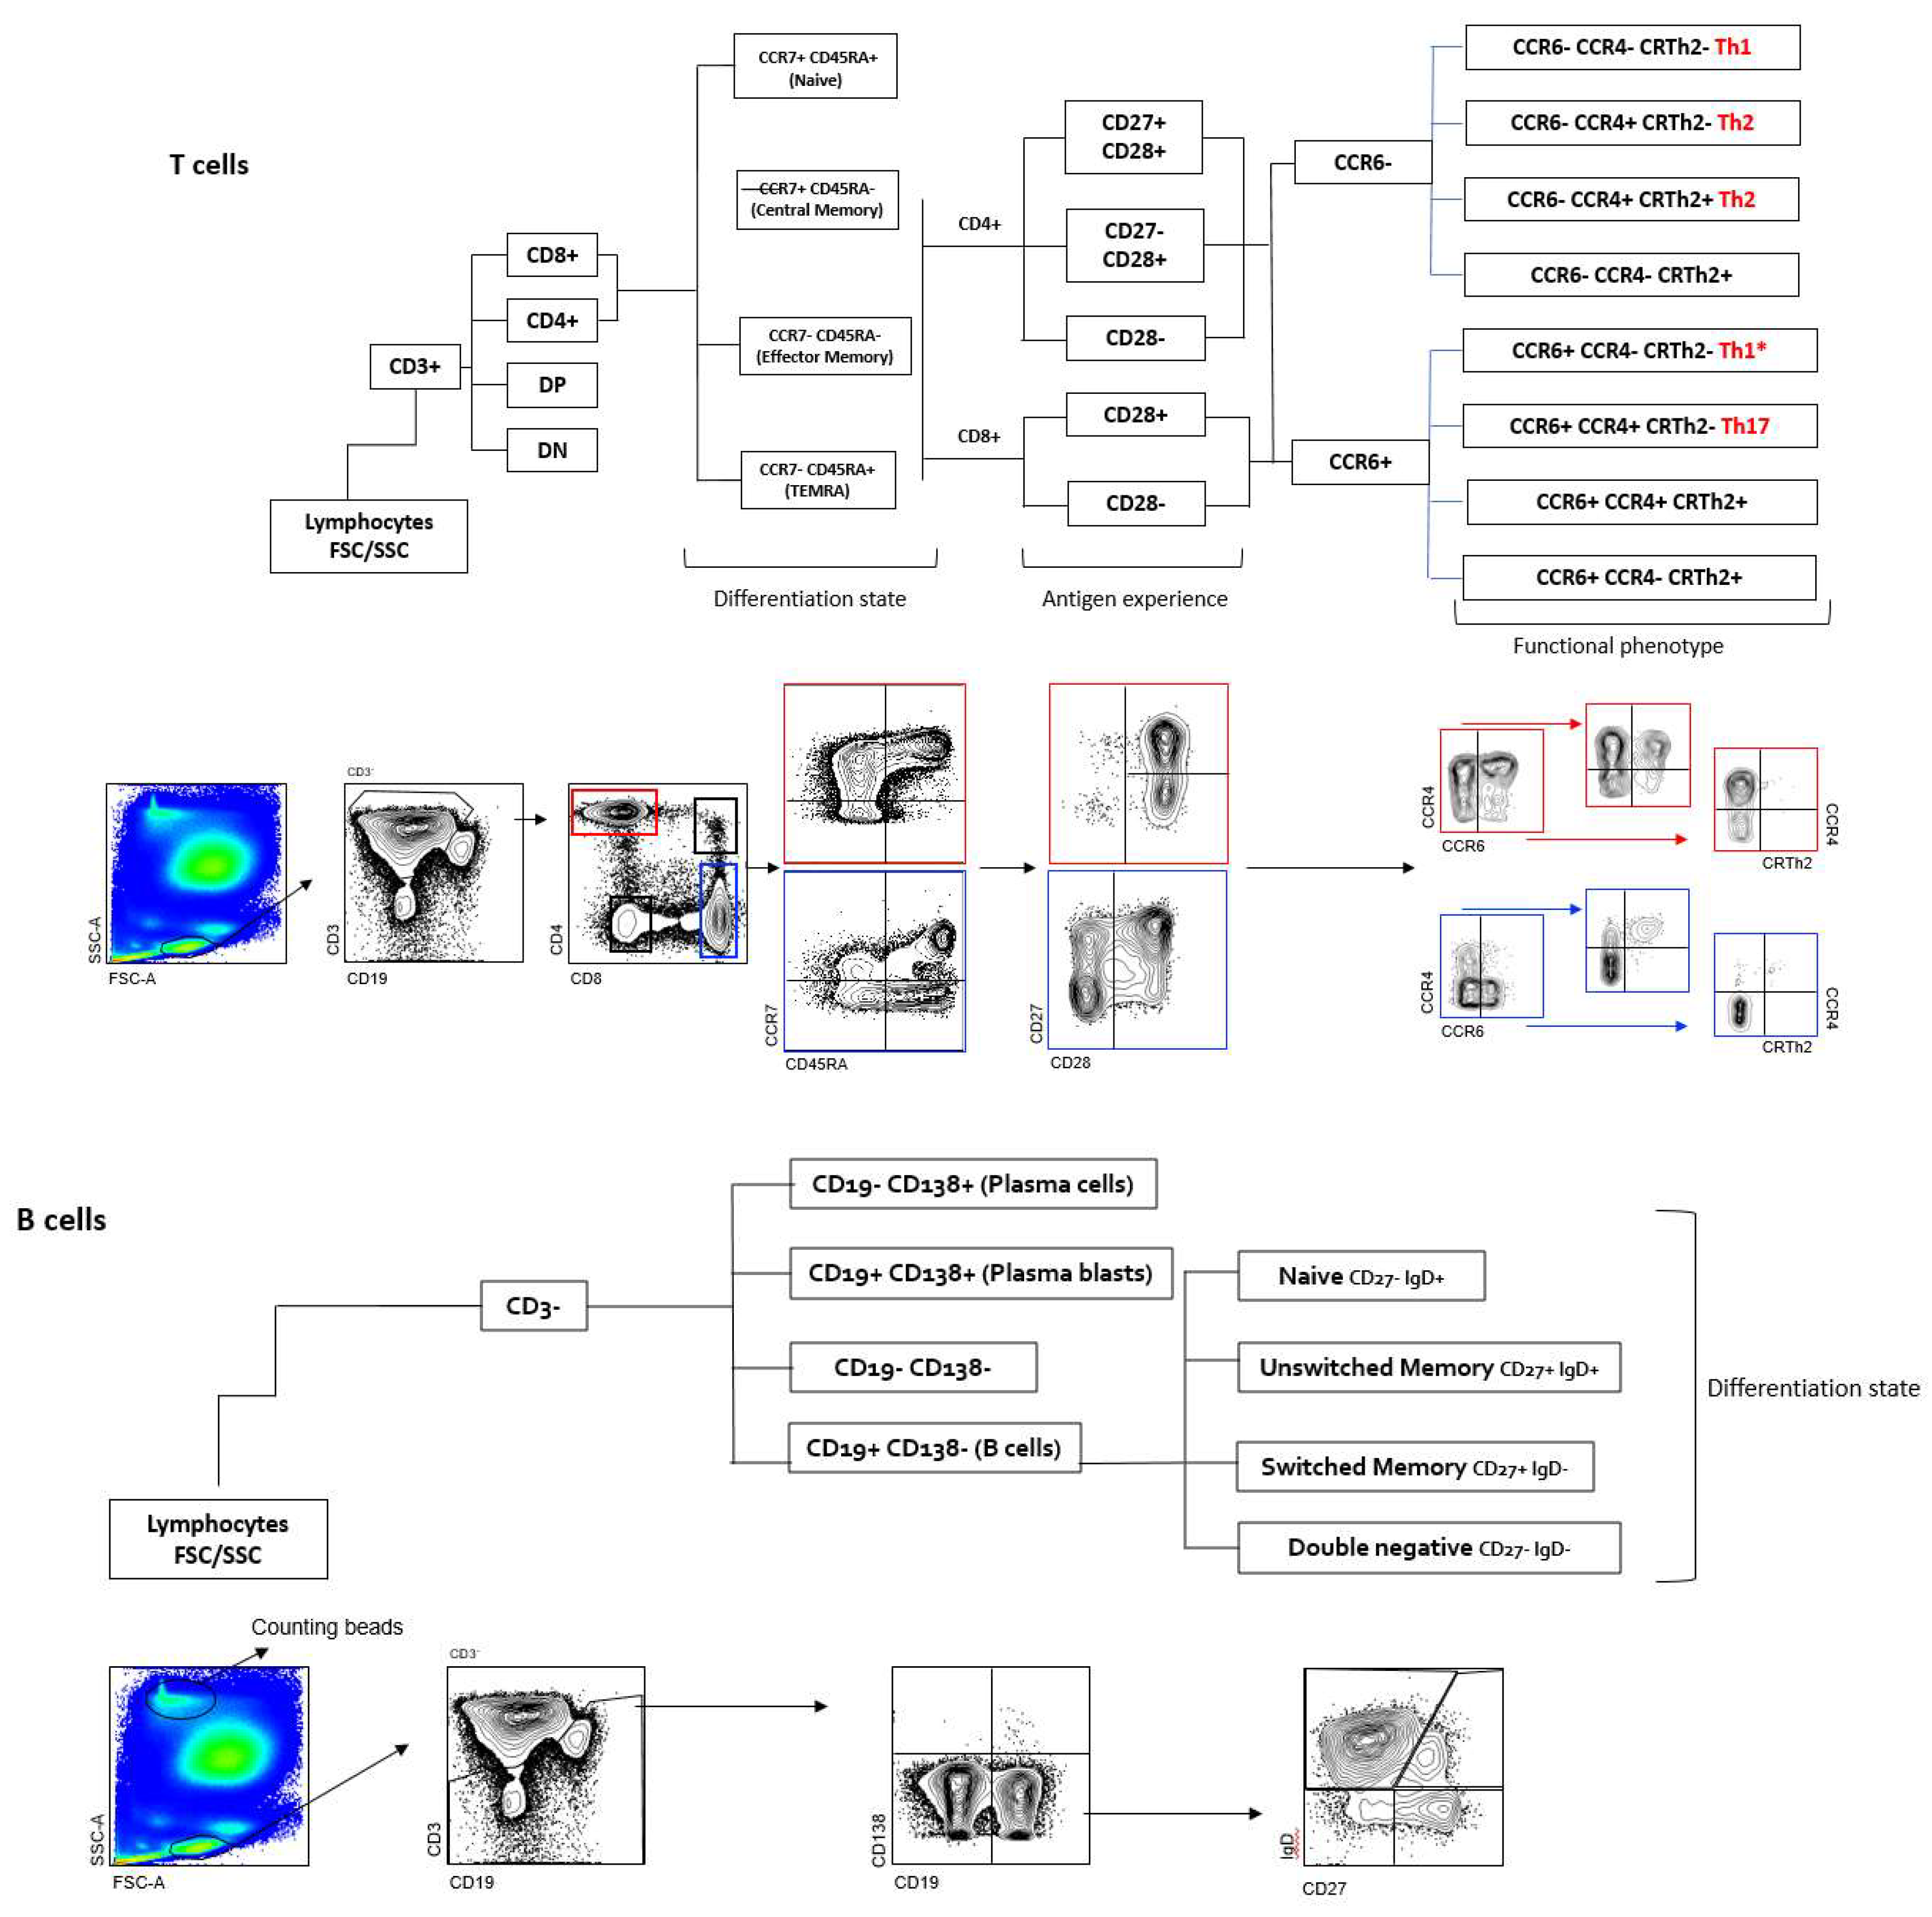
Figure 2.
IgG specific for A. muciniphila bacteria in MS and their association with CSF measures. (a), IgG index and serum levels of IgG specific for A. muciniphila in MS patients. (b) Anti- A. muciniphila IgG indices in MS patients never treated, previously treated with steroids and previously treated with glatiramer acetate (GA). (c) CSF measures in patients with high (red) and low (black) anti-A. muciniphila IgG indices. Each dot in the graphs corresponds to a single patient and the bars show the mean. Kruskal-Wallis test was used to compare more than two groups of patients and Mann-Whitney test to compared two groups. Linear correlation between variables was tested using Spearman r correlation. Statistical significance (** p<0.01, *** p<0.001 and **** p<0.0001) is shown.
Figure 3.
B cells and anti- A. muciniphila IgG indices. (a) Comparison between patients with high (red) and low (black) anti- A. muciniphila IgG indices of frequencies among CSF-infiltrating CD3- cells of plasma cells (CD138+ CD19-), plasma blasts (CD138+ CD19+), B cells (CD138- CD19+) and CD138- CD19- cells. Correlation between IgG indices (total- and anti-A. muciniphila) and frequencies of CSF-infiltrating plasmablasts and B cells. (b and c) Comparison between patients with high (red) and low (black) anti- A. muciniphila IgG indices of absolute numbers of CSF-infiltrating (b) and circulating (c) plasma blasts and B cells as well as correlations of these numbers with IgG indices (total- and anti- A. muciniphila) (b and c). Each dot in the graphs corresponds to a single patient and the bars show the mean. Mann-Whitney test was used to compare two groups of patients. Linear correlation between variables was tested using Spearman r correlation. Statistical significance (* p<0.05, ** p<0.01, *** p<0.001 and **** p<0.0001) is shown.
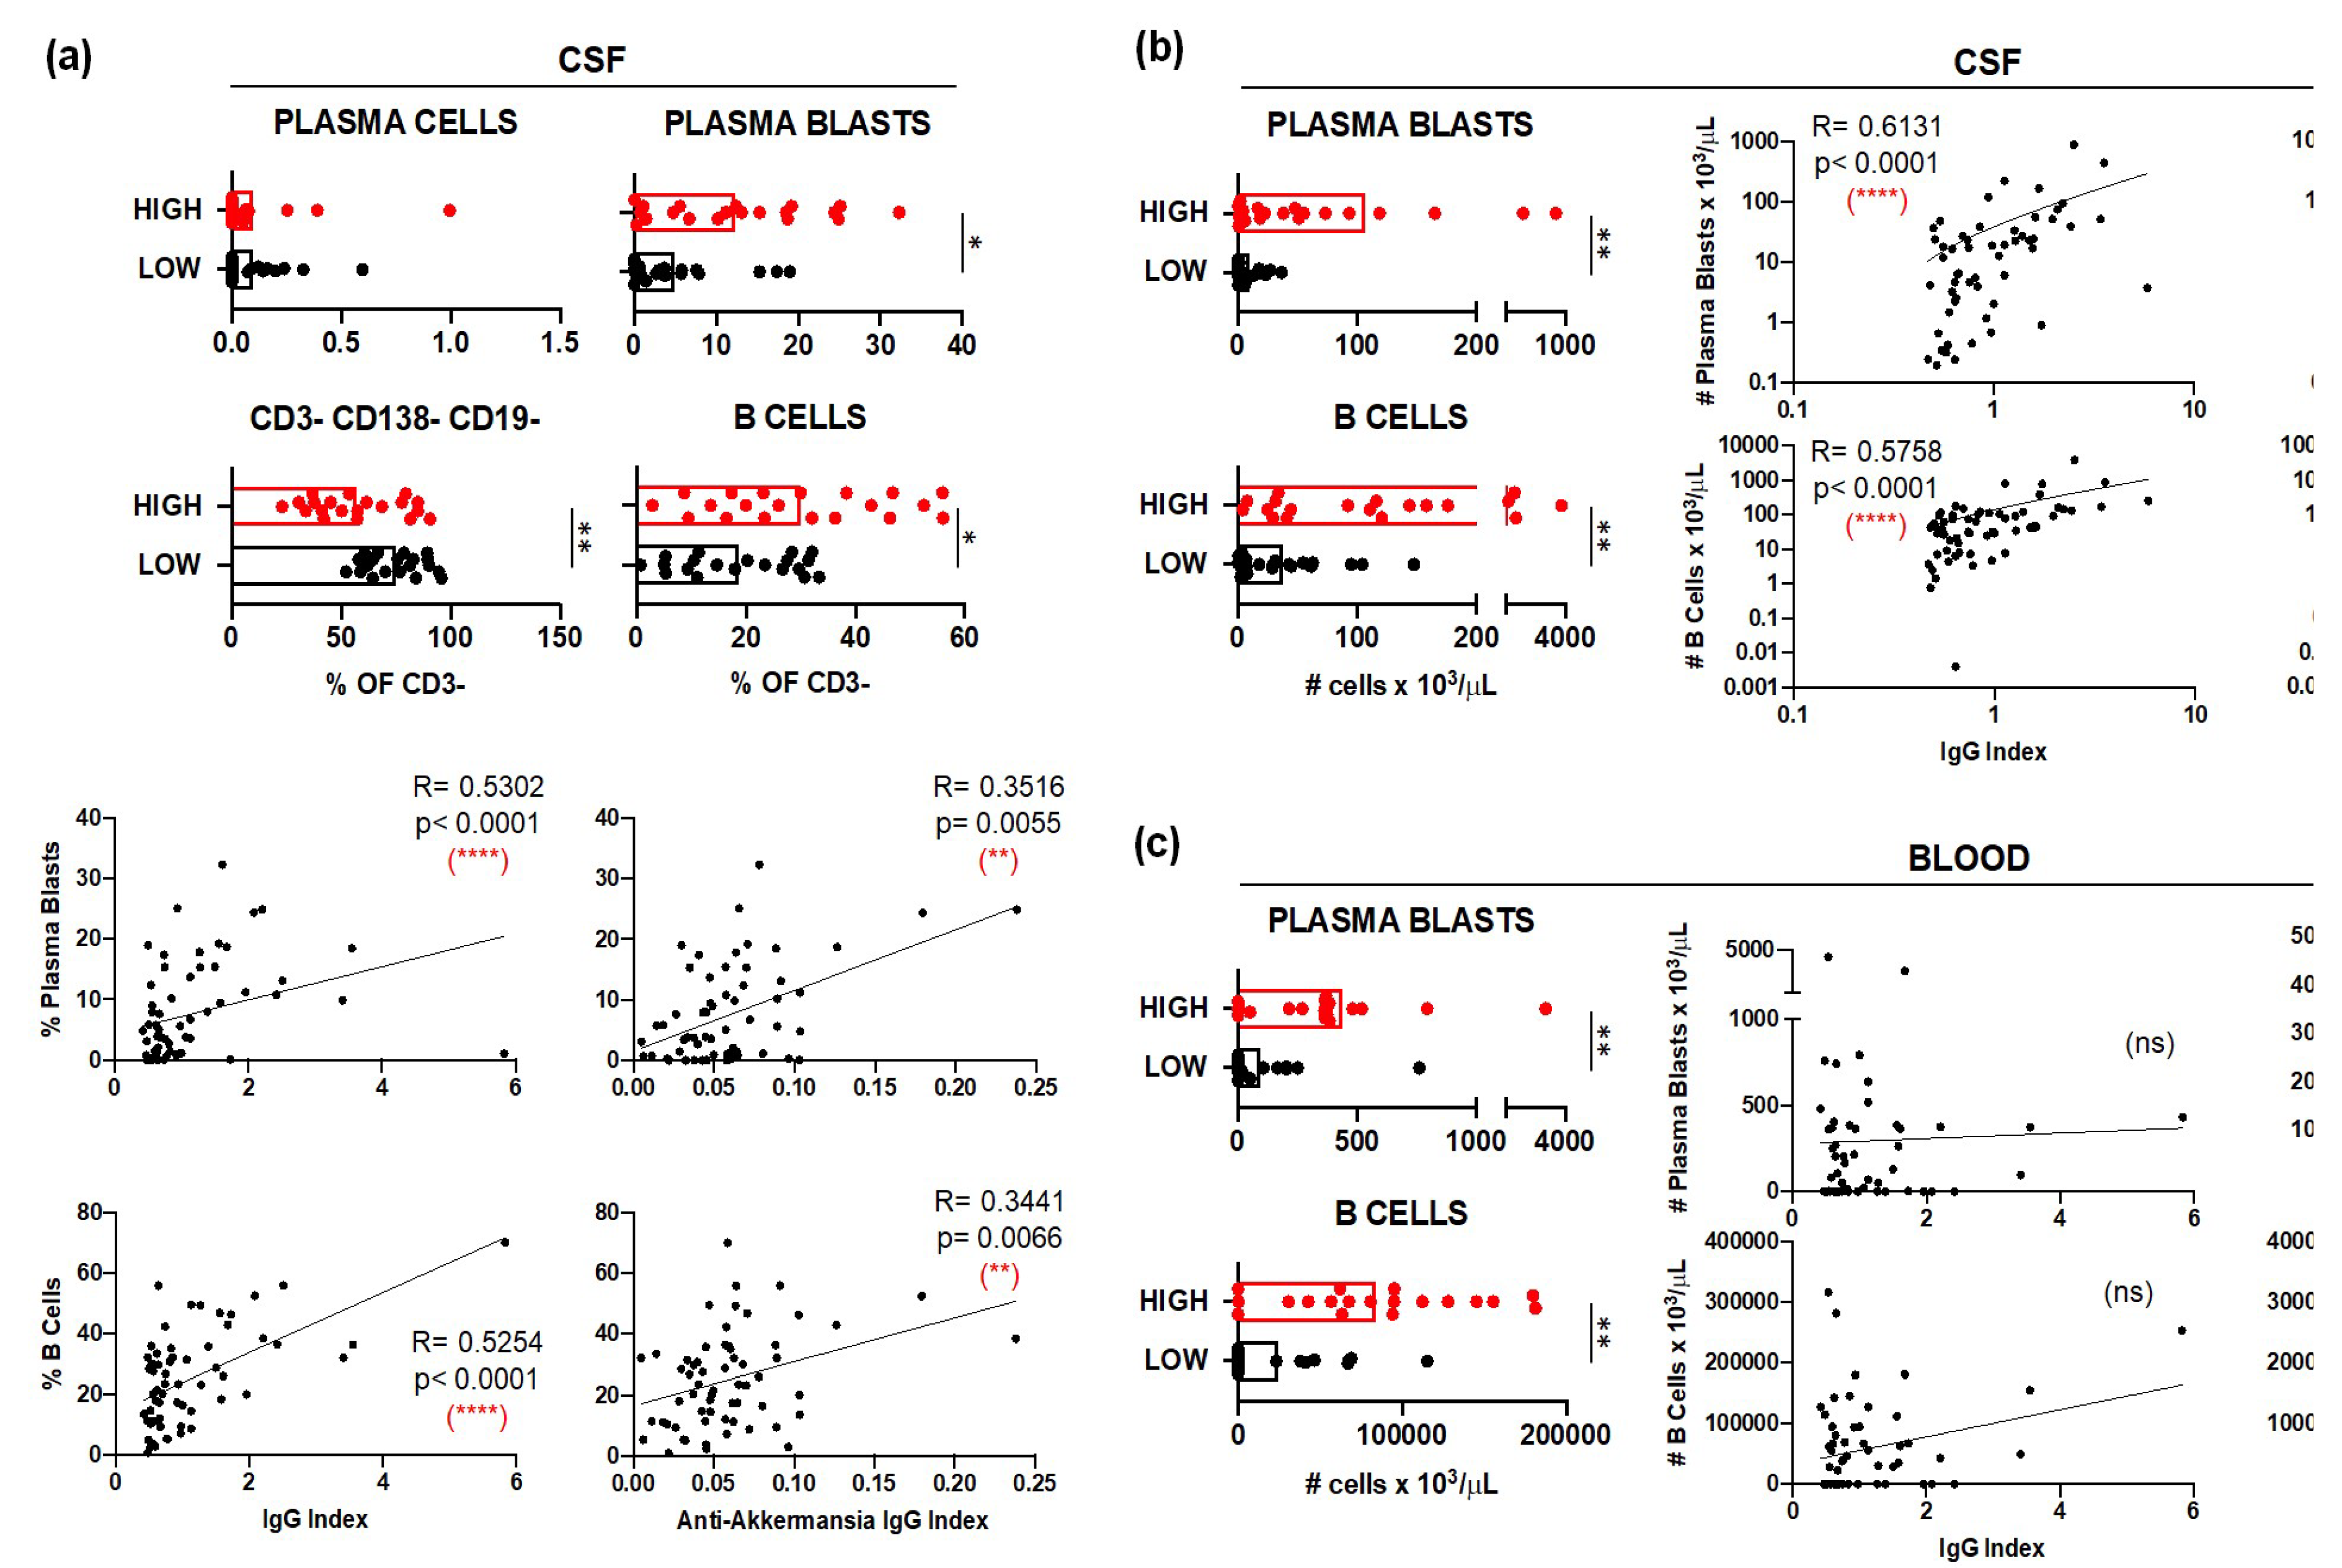
Figure 4.
CSF-infiltrating T cells and anti- A. muciniphila IgG indices. (a and c), Relative frequencies and absolute numbers of CSF infiltrating (a) and circulating (c) CD4 CM CD28+ CD27- T cells with the following functional phenotypes Th1 (CCR6- CCR4- CRTh2-), Th2-A (CCR6- CCR4+ CRTh2-) and Th2-B (CCR6- CCR4+ CRTh2+) in patients with high (red) and low (black) anti- A. muciniphila IgG indices. (b and d), Correlation between IgG indices (total- and anti- A. muciniphila) and relative frequencies and absolute numbers of CSF-infiltrating (b) and circulating (d) CD4 CM CD28+ CD27- Th2- cells. Each dot in the graphs correspond to a single patient and the bars show the mean. Mann-Whitney test was used to compared two groups of patients. Linear correlation between variables was tested using Spearman r correlation. Statistical significance (* p<0.05, ** p<0.01) is shown.
Figure 5.
Circulating T cells and anti- A. muciniphila IgG indices. Relative frequencies and absolute numbers of circulating CD4 CD28+ CD27- and CD8 CD28+ T cells that have CM, EM and TEMRA differentiation state and a Th17 (CCR6+ CCR4+ CRTh2-) functional phenotype in patients with high (red) and low (black) anti- A. muciniphila IgG indices. Each dot in the graphs corresponds to a single patient and the bars show the mean. Mann-Whitney test was used to compare two groups of patients. Statistical significance (* p<0.05, ** p<0.01) is shown.
Figure 6.
Association of anti-A. muciniphila IgG indices with MRI features. (a) Correlation between anti-A. muciniphila IgG indices and total number and volume of FLAIR T2 lesions and total brain volume. (b), Correlation between anti-A. muciniphila IgG indices and intrathecal NF-L, CHI3L1 and number of monocytes in whole blood. Each dot in the graphs correspond to a single patient and the bars show the mean. Linear correlation between variables was tested using Spearman r correlation. Statistical significance (* p<0.05, ** p<0.01) is shown.
Figure 7.
Correlation between anti-A. muciniphila IgG indices and number of neutrophils, eosinophils and basophils in whole blood. Each dot in the graphs corresponds to a single patient and the bars show the mean. Kruskal-Wallis test was used to compare more than two groups of patients and Mann-Whitney test to compared two groups. Linear correlation between variables was tested using Spearman r correlation.
Table 1.
Demographic and clinical features.
Table 1.
Demographic and clinical features.
| |
All |
Anti-A. mucniniphila IgG Index Low |
Anti-A. mucniniphila IgG Index High |
p1
|
| Number of patients |
61 |
20 |
20 |
|
| Female/male ratio |
2.05 |
1.2 |
3 |
0.32 |
| Age at CSF puncture (years) |
36.2 ± 10.1 |
36.9 ± 11.6 |
35.8 ± 9.3 |
0.89 |
| Age at disease onset (years) |
33.7 ± 9.2 |
35.0 ± 10.8 |
32.2 ± 9.4 |
0.54 |
| Disease duration (Months) |
31.9 ± 58.8 |
29.9 ± 60.1 |
42.4 ± 72.9 |
0.89 |
| RIS /CIS (%) |
19.6 |
30.0 |
10.0 |
0.23 |
| RRMS (%) |
73.7 |
60.0 |
85.0 |
0.15 |
| PMS (%) |
6.5 |
10.0 |
5.0 |
0.90 |
| CSF OCB Type II (%) |
81.9 |
70.0 |
100.0 |
0.02 * |
|
HLA DR15 (%) |
44.2 |
25.0 |
55.0 |
0.10 |
| QAlb-QNorm>0 (%) |
19.6 |
35.0 |
5.0 |
0.04 * |
|
Disclaimer/Publisher’s Note: The statements, opinions and data contained in all publications are solely those of the individual author(s) and contributor(s) and not of MDPI and/or the editor(s). MDPI and/or the editor(s) disclaim responsibility for any injury to people or property resulting from any ideas, methods, instructions or products referred to in the content. |
© 2025 by the authors. Licensee MDPI, Basel, Switzerland. This article is an open access article distributed under the terms and conditions of the Creative Commons Attribution (CC BY) license (http://creativecommons.org/licenses/by/4.0/).