
Submitted:
15 January 2025
Posted:
16 January 2025
You are already at the latest version
Abstract
The potential of Artificial Intelligence to transform banking practices has been extensively documented, yet restrained acceptance can hinder its envisioned practical success. The paper employs empirical investigation developing and examining the modelled representation of users’ intention and interaction with AI in the Greek systemic banking system. The study employs TAM and UTAUT-2 and data analysis through PLS-SEM. The findings confirmed the strong theoretical relevance of constructs like Performance Expectancy, Effort Expectancy and Hedonic Motivation, while Social Influence was deemed not significant, indicating a practical perspective towards AI. Different stakeholders’ attributes were evaluated via the Control Variables, highlighting that demographic variables of gender and age are not significant moderators, challenging presumed stereotypes for related divides. Interestingly, occupation and education were significant, suggesting differences of attitudes among professions and education levels. The paper reenforces previous research, adds data on emerging markets but also provides practical implementation path for banking institutions.
Keywords:
Artificial Intelligence
; Digital Banking
; UTAUT-2
; PLS-SEM
; TAM
; Control Variables
; Profession
; Education
1. Introduction
This article debates the imminent, if not already present, introduction and commoditisation of Artificial Intelligence (AI) in banking. The financial industry is witnessing a profound evolution in the 21st century, thanks in part to rapid advances in technological development. These technologies are offering an unprecedented opportunity to redesign banking operations and customer experiences (Batiz-Lazo et al., 2022), ultimately delivering a new paradigm, shifting from the traditional banking of the Relationship bank of the 13th century’ Banco di San Giorgio, the Industrial bank of the 18th century Barclays Bank in the UK or the Information Technology Bank of America of the 50s (Panzarino & Hatami, 2020; 7 in Papathomas & Konteos, 2023). The pressure to mirror digital giants like Google or Facebook’s interactive, seamless and flawless experience, is on for banking incumbents, who, now, need to renovate their back and front lines (Alnemer, 2022; Boustani, 2022). An opportunity to that end is given by AI-driven capabilities for natural, immediate customer interactions through conversational interfaces and advanced data analytics (Bilal et al., 2024). Financial institutions can exploit AI by introducing it in their everyday interactions with the public in customer support with chatbots, provision of financial advisors, fraud detection and prevention, recommendations of personalized banking products, automated investment management etc (Alnemer, 2022; Boustani, 2022; Fares et al., 2023). Such AI applications are having the potential to redefine customer interaction paradigms, setting new expectations for service delivery and information management (Omarini, 2018).
Yet, as many writers suggested e.g. Arjun R et al., (2021), Boustani N. M (2022), Alnemer, H. A., (2022), Ionașcu A. E. et al., (2023), the full-scale adoption of such advanced technology has not been realized universally, with a substantial number of institutions, mostly in non-digitally mature countries, lagging behind in the implementation. A factor that can influence that pace of digital transformation adoption and create a disparity between existing technological progress and the commercial use, is management hesitation over real attitudes of banking customers and other stakeholders (Liang et al., 2020). Such attitudes and respective behaviours, that, as per Mi Alnaser et al., (2023), can be far from conclusive, constitute the body of our study. Understanding public perception of this transformational element is crucial for the continued development and adoption of these innovations. This study seeks to contribute to the scholar knowledge of this critical area by examining the stakeholders’ perspective on AI in banking, focused on the semi-mature banking industry of Greece (Kitsios et al., 2021).
Greece offers a good playground for such a survey. Digital penetration is rather moderate within the incumbents of the Greek banking system, but the appetite and the potential are evident (Kitsios et al., 2021). The Hellenic Statistical Authority in its 2022 survey for employment skills registers over 40% of employees not having daily interaction with digital means. Yet, trends are fast changing with World Bank’s Digital Adoption Index ranking Greece 115th among 180 nations in 2014 but 129th in 2016. More recent evidence shows the turn of the society with 92% of Greek business executives already using ChatGPT (Kaspersky, 2023). Digital transformation is entering maturity and banks are picking up the pace of change. As per P. Milonas, CEO of NBG, a major Greek systemic bank, already 16% of bank’s products and services are offered via internet and mobile banking, with retail products reaching 80% digital coverage (2023).
Technology progress does not come in a vacuum though and its availability and the presence of technological capacity does not necessarily guarantee acceptance and adaptation by end users (Edo et al., 2023). This study aims to explore the behavioural barriers to the adoption of advanced technologies, such as the implementation of AI, among various and distinct audience groups, bank employees, technology professionals, students, other professions, by leveraging established statistical techniques and theoretical frameworks, providing a robust approach to understanding AI adoption in Greek banking, ultimately addressing gaps in the literature and offering actionable insights for practitioners (Alnemer, 2022; Rahi et al., 2019). The primary research questions the study aims to answer are:
Q1: What factors can affect positively or negatively the adoption of AI related technologies in Greek incumbent banks?
Q2: How strongly are these factors opposing or facilitating the adoption of the aforementioned technologies?
Q3: Are there differences in the acceptance of AI among different stakeholder groups?
2. THEORETICAL FRAMEWORK AND HYPOTHESIS
2.1. Theoretical Background
The study explores technology adoption intentions in finance, focusing on digital banking and AI, fields extensively studied by scholars (Dendrinos & Spais, 2023; Fares et al., 2023; Zhou et al., 2010). Foundational frameworks like the Technology Acceptance Model (TAM) by Davis (1986) and extensions, such as unified theory of acceptance and use of technology (UTAUT) and UTAUT-2 by Venkatesh et al., (2003, 2012), have been widely applied to understand technology acceptance behaviours. TAM underscores the importance of perceived ease of use and perceived usefulness, constructs that have consistently explained over 40% of the variance in user intentions (Legris et al., 2003). However, in contexts like AI in banking, where the environment is significantly different from conventional technology settings, researchers argue that traditional models may need refinement (Brown et al., 2002; Ahmad et al., 2020). UTAUT-2 incorporates constructs like hedonic motivation, price value, and habit, providing a more comprehensive framework for analysing AI's multilayered influences in banking (Gomber et al., 2017; Venkatesh et al., 2012). These models are particularly relevant in Greece, where digital transformation and AI adoption remain in early stages, as highlighted by Kitsios et al., (2021) and Saprikis et al., (2022).
To analyse the complex interrelationships among individual and institutional factors influencing AI adoption, the study employs Structural Equation Modelling (SEM), a robust methodology suitable for integrating latent and observed variables (Tarka, 2018; Yuan & Bentler, 2006). SEM allows for hypothesis testing in systems with intricate causal relationships and includes components of factor analysis and multiple regression (Blanthorne et al., 2006; Hair et al., 2018). The paper utilizes Partial Least Squares SEM (PLS-SEM), particularly effective in contexts like digital banking, where customer decision-making involves both conscious and subconscious factors (Bhatiasevi, 2016; Sharma et al., 2016). PLS-SEM aligns well with the TAM and UTAUT-2 frameworks, enabling the exploration of constructs such as performance expectancy, effort expectancy, social influence, and facilitating conditions while accommodating emotional and cognitive dimensions.
Hypothesis Formulation
In the research construction, some key factors influencing the adoption of AI in Greece were identified based on the TAM criteria, i.e. Perceived Ease of Use (PEOU) and Perceived Usefulness (PU), and Intention to Use (ItU), all analysed by many scholars (F. D. Davis, 1986; Hendrickson et al., 1993; Venkatesh & F. D. Davis, 2000). Other key factors that may be treated as inhibitors were the ones offered within the framework of UTAUT-2. Namely, Performance Expectancy (PE), Effort Expectancy (EE), Social Influence (SI) and Hedonic Motivation (HM) as well as Facilitating Conditions (FC). On the other hand, in the current landscape, where habitual use of AI technologies is still uncommon and where there are no defined fees or commissions associated with their use, the constructs of Price Value (PV) and Habit (H)—last introduced by UTAUT-2—were deemed inapplicable and so excluded from this study, agreeing with previous relevant research (Abed, 2021; Faqih & Jaradat, 2021). Demographic aspects such as gender, age, education level, occupation was employed as control variables in this study as per Faqih (2016) and Shiau et al., (2024).
2.2. Perceived Ease of Use (PEOU)
Interaction ease refers to the degree to which a person believes that using a system will be free of effort (Davis, 1986). Defined as the extent to which individuals perceive a technology or service to be easy to use, it reduces the complexity of the system, making it more likely that adoption decisions will be favourable (Bagozzi et al., 1999). This is a well-established factor, and one of the central ones in the setup of TAM framework. In AI banking, interaction easiness may relate to user interface design, simplifying customer interactions with complex financial services (Shaikh & Karjaluoto, 2015).
Key characteristics of new technology, such as the possibility of errors created unintentionally by the user, resources availability and instructions that help the user fulfil a task, time dedication, physical and mental effort required are key aspects in the perceived ease of use. Several scholars, in previously related studies have considered and evaluated positively the correlations, emphasising the importance of PEOU in evaluating user behaviour in digital and technological advancements, confirming the validity and reliability of these constructs in predicting user intention (Dhingra & Mudgal, 2019; Hendrickson et al., 1993; Workman, 2007). Consistent with the foundational works on technology acceptance models, ease of use is a fundamental determinant of behavioural intention (Venkatesh et al., 2012). Therefore:
Hypothesis 1 (H1): Perceived Ease of Use influences Intention to Use in AI banking services
2.3. Perceived Usefulness (PU)
F.D. Davis (1986) in his doctoral seminal paper defined perceived usefulness as "the degree to which a person believes that using a particular system would enhance their performance”. Perceived usefulness has, along with ease of use, being in the centre of the TAM Model deployment measuring, in essence, the degree to which an individual considers that the technology in question will contribute positively to his or her job or everyday tasks performance (Dhingra & Mudgal, 2019; Hendrickson et al., 1993; Riffai et al., 2012). Dhingra and Mudgal, in their work (2019), notice that individuals are more likely to adopt technologies they perceive as easy to use and applicable across various tasks that improve their performance, increase business profits, and promote long-term sustainability. Therefore, researchers assume that the use of technology is influenced by both PEOU and PU. AI adoption studies have reported PU as a significant factor in determining the adoption of new technology. Such were the findings of Rahman et al., (2023) on their study of Adoption of AI in banking services. Their results showed that attitude towards AI significantly mediates the relationship between perceived usefulness and intention to adopt AI in banking services. In similar exercises, Saprikis et al., (2022), Oliveira et al., (2016) and Aggarwal and Rahul (2017) have connected similar technological advancements such as online banking and mobile banking adoption behaviour with perceived benefits of usage for the consumer.
In the context of digital banking and AI technologies, PU refers to the extent to which consumers believe that an artificial intelligence solution enhances the value of their banking experience or results to a problem being solved (Bilal et al., 2024; Fares et al., 2023) or leads to better financial management (Shankar & Datta, 2018). This study will follow previous scholars’ work and proceed with the following hypothesis:
Hypothesis 2 (H2): The perceived usefulness influences Intention to Use in AI banking services
2.4. Performance Expectancy (PE)
Performance Expectancy (PE) is a term introduced by the UTAUT model and remains also in the advanced version. PE for banking technology is the belief that using a system will improve task performance (Venkatesh et al., 2012) and will help the user to attain gains in performing banking tasks (Martins et al., 2014). It includes performance improvements, efficiency gains, and overall effectiveness (Dwivedi et al., 2019). Actually, PE encompasses a broader range of performance-related expectations compared to PU, including expected performance improvements, efficiency gains, and overall effectiveness as opposed to PU, which is more narrowly focused on the perceived direct benefits of technology use (Dwivedi et al., 2019; Jaya Lakshmi et al., 2023). Studies like those of Martins et al., (2014), Rahi et al., (2019), emphasize that PE is a key determinant in the adoption of internet banking. Riffai et al., (2012), Rahi et al., (2019), Oliveira et al., (2016), Khalil et al., (2010), Martins et al., (2014) have confirmed that performance expectancy is the most influential factor in the adoption of internet banking. In the context of AI in banking, PE encompasses the perceived capacity of AI to improve decision-making and customer service (Bilal et al., 2024; Shen et al., 2019). PE is a well-researched and validated construct and is specifically designed to integrate elements from various existing models and its suitable for looking at a broader set of expectations regarding performance improvement due to technology use.
These findings resonate with the UTAUT-2 framework, which suggests that performance expectancy, alongside effort expectancy and social influence, can strongly correlate user engagement with technology (Venkatesh et al., 2012). Based on those inputs and on the results of previous related references, we will propose as hypothesis
Hypothesis 3 (H3): Expectation of the performance of AI in banking services influences Intention to Use in said technologies
2.5. Effort Expectancy (EE)
Effort Expectancy refers to the degree of ease associated with using a particular system or technology (Venkatesh et al., 2003). Measuring the perceived technological efficiency and effectiveness has been the interest of many, if not all, technology adoption studies from the early ones, such as Hendrickson et al., (1993), Workman (2007) to Liang et al., (2020), Edo et al., (2023), Kitsios et al., (2021), to name a few. In the context of AI adoption in banking, Effort Expectancy captures users’ perceptions of how simple and intuitive it is to interact with AI-driven platforms, such as virtual assistants or automated loan application systems (Oliveira et al., 2016). A user-friendly interface and seamless experience are critical factors for ensuring positive attitudes toward AI tools (Dwivedi et al., 2019). Previous studies, such as those by Venkatesh and Davis (2000), have established Effort Expectancy as a direct antecedent of behavioural intention to adopt new technologies. For AI systems in banking, minimizing perceived complexity can enhance acceptance, especially among less tech-savvy customers (Shankar & Datta, 2018). It is envisaged that, given that AI is a novice technology for the Greek public, there will be expectations about the input required vs the output that will be provided to the end users. Certain stakeholders may expect that a lot of effort will have to be placed in interacting with AI while others may consider it an easy task. This study, via SEM analysis, will explore the relationship between Effort Expectancy and technology adoption. Based on the above, the following hypothesis is proposed:
Hypothesis 4 (H4): Effort Expectancy influences Intention to Use in AI banking services.
2.6. Social Influence (SI)
The term "Social Influence" describes the deliberate and inadvertent attempts made by others to modify a person's feelings, ideas, or actions (Riva et al., 2022). Individuals tend to follow the norm or subdue to peer pressure, especially when faced with an acknowledged level of expertise, respect or social recognition. Individuals frequently want to be a part of informed groups, and this affiliation drive can influence their views and actions (Chaouali et al., 2016; Edo et al., 2023). According to Rajak and Shaw (2021), decisions and preferences can be significantly influenced by peer evaluations and the opinions of well-respected individuals, especially when those opinions coincide with perceived usefulness and simplicity of use.
It was UTAUT model that recognised the importance of SI inclusion as a key construct for the study of user acceptance (Al-Mamary et al., 2016). Ever since, SI has been extensively studied in the context of various technologies, where the perceptions and attitudes of peers and influential groups have been shown to play a pivotal role in shaping individuals' technology adoption behaviours (Alkawsi et al., 2021; Venkatesh & Davis, 2000). And, as expected, studies have demonstrated that in environments where new technology is introduced, the influence of peers and important social contacts significantly affects individuals' behavioural intentions to use the technology, exerting social pressure on individual to adopt new technology (Taylor & Todd, 1995; Zhou (2013). In the specific context of AI, this study aims at evaluating social influence by examining users’ beliefs about the significance of AI, as informed by the opinions of their influential social contacts. Prior research has consistently indicated a positive relationship between social influence and the acceptance of new technologies.
Building on these insights, the current study proposes a hypothesis that seeks to empirically investigate the extent to which social influence, as a construct within technology adoption models, specifically affects the willingness of users to integrate AI into their banking interaction routines. This leads to:
Hypothesis 5 (H5): Social Influence influences Intention to Use in AI banking services.
2.7. Facilitating Conditions (FC)
Facilitating factors are "objective factors that make an act easy to do, including the availability of resources and support" (Venkatesh et al., 2003). Facilitating conditions have been shown to directly influence technology use, especially in complex interactions by influencing users' intentions and usage behaviours directly (T. Zhou et al., 2010). The construct has been acknowledged as part of the UTAUT2 model framework and has been pivotal in it. Facilitating factors in AI banking could include the availability of user support, the reliability of AI systems, and the infrastructure supporting digital banking platforms, which are crucial for technology adoption (Shin, 2009). Thus, the hypothesis is
Hypothesis 6 (H6): Facilitating factors such as skills and system access influence Intention to Use in AI banking services.
2.8. Hedonic Motivation (HM)
Pleasure is an emotional state reflecting positive affect or the enjoyment derived from a particular situation (Russell, 1980). Earlier studies have often regarded hedonic motivation (also referred to as perceived enjoyment, perceived fun, or perceived playfulness) as an independent predictor ((F. D. Davis et al.,, 1992; Pikkarainen et al.,, 2004). As defined by Venkatesh et al., (2012), p. 161, hedonic motivation is “the fun or pleasure derived from using a technology”, without any specific extra benefit. It has been shown to significantly predict user intention (S. A. Brown & Venkatesh, 2005). While some studies suggest that incorporating fun attributes could reduce service effectiveness (Nikghadam Hojjati & Reza Rabi, 2013), others emphasize its positive influence on adoption (Salimon et al., 2017; Suryanarayana et al., 2024). The anticipatory emotions regarding AI interactions are believed to enhance user pleasure (Bagozzi et al., 1999).
More detailed studies have shown that HM, which refers to the pleasure or enjoyment from using technology, is a significant predictor of intention to use (Brown & Venkatesh, 2005). As such, the second, advanced model of UTAUT included this particular factor in its framework (Venkatesh et al.,, 2012). Salimon et al., (2017), mention that scholars may have overlooked its potential mediating role in the adoption of digital technologies in banking and acknowledge that the importance of hedonism has been particularly recognized in addressing the frustration that often accompanies online activities. Chemingui and Ben Lallouna (2013), and Pikkarainen et al., (2004), express similar views. Digital technologies such as e- banking platforms and, potentially, artificial intelligence applications, provide the scope for fun by incorporating music, animations and gamification that can create an interactive and emotionally challenging environment for the user (Ndubisi & Sinti, 2006). Several studies on online banking have confirmed the positive relationship between HM, otherwise known as perceived enjoyment or fun and adoption of online banking (Chiu et al., 2014; Salimon et al., 2017). In AI banking, emotional expectations might encompass the anticipated feelings of satisfaction or frustration that users expect from interacting with AI banking services (Ismatullaev & Kim, 2024; Laros & Steenkamp, 2005). However, other studies suggest that incorporating fun attributes may not always be beneficial and could potentially confuse users, reducing the effectiveness of such services (Nikghadam Hojjati & Reza Rabi, 2013; Ndubisi & Sinti, 2006). Given therefore the high interest of the subject and a certain ambiguity as to whether hedonic motivation influences AI adaptation technology in the Greek banking, the following hypothesis is proposed:
Hypothesis 7 (H7): Pleasure derived from using AI-enabled banking services influences Intention to Use in said services.
2.9. Intention to Use (ItU)
Studies have shown that intention is the main factor in committing any behaviour (Uzir et al., 2023). Behavioural intention is "an indication of an individual's readiness to perform a given behaviour, and it is considered to be an immediate antecedent of behaviour" (Ajzen, 1991). Behavioural intention of Use in AI banking reflects the likelihood that customers will use AI services, influenced by factors such as perceived usefulness, ease of use, and trust (Venkatesh & Davis, 2000). Intention to use a technology is intricately linked to the perceived value, which in turn is closely related to trust (Chiu et al., 2014) and actually mediates the relationship between trust and actual usage (Ahmad et al., 2020). On the other hand, the refusal to use may be associated with factors such as cognitive overload, information overload, or, as Alshurafat et al., (2023) places it, technostress, which can negatively impact an individual's willingness to accept a new technology. According to TAM structure, ItU is a factor that is based on the antecedents of perceived ease of use and usefulness, with the two representing two sets of anchoring and adjustment factors mediating ItU (Aggarwal & Rahul, 2017; Ahmad et al., 2020). As per UTAUT structure, performance expectancy, effort expectancy and social influence are key determinants set to influence behavioural intention to use a technology. User distrust in AI systems may follow different routes, based on several human factors (e.g. education, experience, perception) and properties of the AI system (e.g. transparency, complexity, controllability) as Asan et al., (2020), note. ItU acts as a mediating variable, linking the perceptions and experiences of users with their eventual decisions to adopt new technologies (Nordhoff et al., 2020; Uzir et al., 2023). Prior studies indicate that ItU's role as a mediator is essential for understanding how various psychological constructs collectively drive AI adoption (Chiu et al., 2014; Ahmad et al., 2020).
This study examines how AI adoption behaviour is influenced by the relationship between ItU and the other hypotheses, acting as a mediator that channels the impact of psychological and situational factors into adoption decisions.
Hypothesis 8 (H8): Customers' intentions to use AI in banking is influenced by all other hypotheses
2.10. AI Adoption Behaviour (AB)
ItU acts as a mediating variable, linking the perceptions and experiences of users with their eventual decisions to adopt new technologies i.e. Adoption Behaviour (AB), (Nordhoff et al., 2020; Uzir et al., 2023). In AI banking, ItU connects constructs such as perceived quality, trust, and performance with AI AB (Choung et al., 2022). Prior studies indicate that ItU's role as a mediator is essential for understanding how various psychological constructs collectively drive AI adoption behaviour (Chiu et al., 2014; Ahmad et al., 2020). This study examines also how the relationship between ItU and other constructs influences AI adoption: AI adoption behaviour is influenced by the relationship between ItU and the other hypotheses, acting as a mediator that channels the impact of psychological and situational factors into adoption decisions.
Hypothesis 9 (H9): Adoption of AI by all stakeholders is related to all other hypotheses
2.11. Control Variables (CVs)
As per Carlson and Wu (2012), in a research design, a variable can fulfil three functions, the two most prevalent of which are that of an independent variable (IV) and a dependent variable (DV). It is assumed that the factors represented by the IVs "depend on" or impact the values of DVs. (Carlson & Wu, 2012). Control Variables represent the third function. They are commonly used to capture factors that are broadly defined as extraneous to the desired effect—sometimes referred to as “nuisance” variance (Carlson & Wu, 2012). In organizational literature, there is a general consensus that CV estimates should be interpreted with caution because it can be challenging to provide meaningful significance to the marginal effects of biassed control variables (Hünermund & Louw, 2023; Shiau et al., 2024) For our paper, we have chosen occupation, education, age, and gender as CVs. We anticipated that these CVs may moderate the relationships suggested in the hypotheses between Independent and Dependent Variables, affecting the extent to which AI in banking is adopted and perceived.
All research hypotheses of the proposed conceptual framework are summarised on Table 1.
3. RESEARCH METHODOLOGY
3.1. Study design
Prior to engaging with the survey design, a focused literature review was conducted to determine the best possible vehicle for the study, indicatively, F. D. Davis (1986); Venkatesh and F. D. Davis (2000), Venkatesh et al.,, (2003, 2012, 2016), Al-Mamary et al.,, (2016), Alnemer (2022), Bhatiasevi (2016), Brown and Venkatesh (2005), Brown et al.,, (2002); Zhou et al.,, (2010), Fares et al.,, (2023) and Marangunić and Granić (2015). The instrument selected was the cross -sectional survey-based approach. Such an approach is consistent with the work done on digital transformation related subjects from previous scholars, indicatively, Alkawsi et al., (2021), Azman Ong et al., (2023), Alnemer (2022), Edo et al., (2023), and Mi Alnaser et al., (2023). This study considered major established theories like TAM and UTUAT 1 and 2. The study follows a quantitative approach, employing an elaborate questionnaire for its purpose. The chosen methodology for analysing nine co-dependant latent variables and four CVs was SEM, all depicted in Figure 1:
3.2. Questionnaire design
The questionnaire was designed under a concept of nine sections (pages in the format of the questionnaire), each including between two to four questions, elaborating the construct that was under review on each specific section (Table 2). The last section consisted of some key demographics, the Control Variables. For the design and the choice of wording, a draft sample was prepared and discussed in informal reviews with expected key representatives of the major sample universes. All questions were referring to a generic concept of artificial intelligence in the publics’ interaction with everyday banking transactions, without setting too specific examples of them. The questionnaire structure and interface were designed on surveymonkey.com, with a customised interface and an introduction explaining in high level the reasoning of the questionnaire and its academic ordinance. The responses have a range of a 5-point Likert scale, with the answers ranging from disagree completely (1) to agree completely (5). All measured items/questions are presented in Table 2.
3.3. Population targeted and sample
The targeted population was split conceptually in four major categories i.e. a) bank institution employees, b) fintech IT and related consulting agencies, c) general public consisting of students, d) other professions and other options. To make it as specific, accurate and manageable as possible, the choice of the channels for acquisition of respondents were judgmental, based on the authors’ own experience, targeting specific spaces e.g. LinkedIn audience of an annual banking forum in Greece, employees of major systemic banks i.e. Eurobank, National Bank of Greece, generic online audiences employing also in the process selected controllers as facilitators. The approach allowed for better targeting and appropriate recourse allocation (Rajak & Shaw, 2021). It was all conducted online for the period between September and November 2023. Some questionnaires were delivered in hard copy and then transferred online. All respondents were aware that this is an academic exercise, and their information would remain fully anonymous. The split was made based on self-selection i.e. declaration via the survey.
3.4. Data collected
The survey was online, and design was such that it would be user-friendly for both PC and mobile. Eventually, some hard copies had to be also distributed and then transferred online collecting a total of 297 responses. Incomplete responses were not permitted, and they were not being accepted by the survey structure. The rate of abandonment was not recorded and measured. There were no prerequisites that would exclude somebody from the questionnaire in advance, other than the necessity to answer to all questions. The only physical constraint was the fact that the questionnaire was made in Greek language, and it was referring to a Greek banking environment. Survey data are available on DOI: 10.17632/mmgn63469r.1 (XXXXX, 2024).
Some notable points from the results and the respondence information (Table 3) are the predominance of male respondents by above 60%, concentration of ages at the focus point of 40 years old and a high concentration of university and postgraduates, while the occupation had a good split of approximately 24% for bank employees 25% for digital experts and 36% of general occupation. None of the results are away from the expected norms for the targeted population.
4. RESULTS
The results section gives an overview of the outcomes from using the SEM framework to test the proposed relationships between variables. This section covers the creation and testing of the measurement part of the model, followed by an evaluation of the structural model.
4.1. Data Analysis
As discussed, SEM was chosen as the optimum research analysis tool that is suitable for evaluating latent constructs i.e. variables that cannot be directly observed (Blanthorne et al., 2006). Models like TAM and UATAU-2 were developed to assess the determinants of intention, in other words, the independent variables (IV) but also the dependent variables (DV). Information about latent constructs is obtained indirectly by observing several indicators or variables affected by the latent construct. To place it differently, many constructs have direct effects on intention but affect behaviour/use only indirectly, through intention, (Blanthorne et al., 2006). Underlying attitude is believed to affect responses to certain questions regarding attitude rather than the responses shaping attitudes. Both of these suggest a mediating relationship between predictors and an outcome, and, SEM, a variance-based analysis is a potentially appropriate method of analysis for that (Azman Ong et al., 2023). PLS-SEM, that has been identified as the best method for measuring simultaneously external and internal(structural) models successively (Edo et al., 2023). PLS-ESM is also considered to be effective for smaller sample sizes of questionnaires and more complicated (Alkawsi et al., 2021; Edo et al., 2023).
4.2. Measurement model evaluation
The Measurement Model is a fundamental aspect of SEM that evaluates the relationship between latent variables and their observable indicators, ensuring the constructs’ reliability and validity before structural model analysis. In this study, the evaluation followed the rigorous standards outlined by Hair et al., (2021) and Henseler et al., (2009), which emphasize the importance of minimizing measurement errors to enhance the robustness of conclusions.
Prior to that though, a goodness-of-fit exercise was executed (Table 4). Model goodness-of-fit (GoF) is a critical component in evaluating the validity of SEM, ensuring that the hypothesized model aligns with observed data It provides a global assessment that complements construct-specific metrics like reliability and validity (Hair et al., 2021). Commonly used indices include absolute fit metrics (e.g., Chi-square statistic, RMSEA, SRMR), incremental fit indices (e.g., CFI, TLI, NFI), and parsimonious fit measures (e.g., χ²/df), each with recommended thresholds for interpretation (Yuan & Bentler, 2006). In this study, the χ²/df ratios of 1.461 (measurement model) and 1.408 (structural model), along with RMSEA values below 0.05 and high CFI/TLI values (above 0.90), indicate excellent fit and align with prior studies (Hair et al., 2021; Martins et al., 2014). These indices confirm that the constructs and relationships are well-represented, supporting the study’s theoretical framework based on TAM and UTAUT (Davis, 1986; Venkatesh et al., 2003). The strong GoF metrics validate the hypothesized relationships and reinforce the robustness of findings related to AI adoption in banking, providing a reliable basis for actionable insights.
Following that, the study proceeded with measurement model evaluation (Table 5). Key metrics included factor Loadings, Composite Reliability (CR), and Average Variance Extracted (AVE).
All constructs exceeded the recommended thresholds, with factor loadings above 0.60 (Gefen et al., 2003; Hair et al., 2018), CR values above 0.70 (Hair et al., 2021; Henseler et al., 2015), and AVE values over 0.50, demonstrating strong internal consistency and convergent validity.CR provides a nuanced assessment of internal consistency, surpassing Cronbach’s Alpha by accounting for varying factor loadings among indicators (Hair et al., 2021). All constructs in this study exceeded the CR threshold of 0.70, with Facilitating Conditions (CR = 0.925) and Adoption Behaviour (CR = 0.942) exhibiting exceptional reliability, aligning with studies by Venkatesh et al., (2012) and Sarstedt et al., (2021). AVE, measuring convergent validity, confirmed that most constructs adequately explained the variance in their indicators, surpassing the 0.50 threshold (Fornell & Larcker, 1981). Adoption Behaviour achieved the highest AVE (0.845), indicating strong explanatory power, supported by high factor loadings such as AB2 (loading = 0.941). Facilitating Conditions also demonstrated robust validity (AVE = 0.756, FC4 loading = 0.895), emphasizing resource availability as a key adoption driver (Shin, 2009; Venkatesh et al., 2003). Constructs like Hedonic Motivation (CR = 0.773, AVE = 0.631) showed moderate performance, consistent with findings by Salimon et al., (2017) on the subjective nature of enjoyment constructs. All constructs achieved satisfactory CA values, with Facilitating Conditions reaching the highest value of 0.926, reflecting exceptional internal consistency (Henseler et al., 2015). Finally, Skewness and kurtosis assessments confirmed acceptable data distribution, with values falling between -1 and +1, who are generally considered acceptable for normality in SEM (Hair et al., 2021). Most indicators in this study fell within this range, with minor deviations that are typical in survey data, especially for Likert scales (Kline, 2018). Overall, the evaluation aligns with best practices in SEM (Hair et al., 2021; Henseler et al., 2015), offering a reliable foundation for analysing AI adoption behaviour in banking and underscoring the importance of refining constructs like Hedonic Motivation for greater consistency.
The Fornell-Larcker criterion confirmed the discriminant validity of all constructs in this study (Table 6), reinforcing the reliability of the measurement model evaluation (Henseler et al., 2015). The square root of the AVE for each construct exceeded its correlations with other constructs, demonstrating sufficient distinctiveness. Overall, the discriminant validity analysis confirmed the robustness and empirical distinctiveness of the constructs, minimizing multicollinearity and enhancing the accuracy of the structural model. These results validate the measurement model’s reliability and provide a solid foundation for understanding the factors influencing AI adoption in banking, aligning also with best practices in SEM (Fornell & Larcker, 1981; Hair et al., 2021).
In detail, FC exemplify this differentiation of constructs well, with a diagonal value of 0.869 significantly surpassing its highest correlation with EE at 0.400. This aligns with prior findings by Shin (2009) and Venkatesh et al., (2003), which emphasize the critical role of resource availability and system reliability in technology adoption. AB, with the highest diagonal value (0.919) and low correlations with constructs like ItU (0.143), underscores its empirical robustness and theoretical clarity as an outcome variable, consistent with studies like Martins et al., (2014). Similarly, PU demonstrates strong validity, with its diagonal value (0.879) exceeding correlations with PE (0.644), preserving their theoretical distinctions (Davis, 1986; Venkatesh et al., 2012). HM, while meeting the criterion, shows moderate correlations with PE (0.666) and EE (0.616), suggesting minor conceptual overlap typical of subjective constructs (Brown & Venkatesh, 2005).
4.3. Structural model evaluation and hypothesis testing
Structural model evaluation is a critical phase in SEM, focusing on the relationships among constructs and assessing the model's explanatory and predictive capabilities. Unlike the measurement model, which ensures the reliability and validity of individual constructs, the structural model examines how these constructs interact to test theoretical hypotheses. Our study confirmed several significant relationships between constructs, consistent with established technology adoption models like UTAUT2 (Table 7). PE and EE exhibited the strongest path coefficients to ItU, underscoring their pivotal roles in shaping behavioural intentions. All other Constructs also confirmed their significance, with the notable exception of SI, who proved to be non-significant. Likewise, occupation and, to a lesser extent, education, were also deemed significant variables. These findings align with the UTAUT model (Venkatesh et al., 2003) and echo Martins et al., (2014), emphasizing that both the utility (PE) and usability (EE) of AI systems are crucial for adoption.
In particular, it was observed that H1, PEOU positively influences ItU (β path coefficient =0.138, p<0.05), aligning with research by Dwivedi et al., (2019) and Rahman et al., (2023), emphasizing simplicity in AI systems as a key factor in adoption, reinforcing also Davis’s (1986) TAM findings, where system simplicity and intuitive design support adoption, though more as a complementary driver. H2: Similarly, PU also impacts ItU (β=0.102, p<0.05), supporting studies by Kapoor et al., (2021) and Venkatesh et al., (2012), highlighting the perceived benefits of AI on job performance, improving convenience and decision-making. However, its moderate effect relative to PE and EE suggests that usefulness may gain greater influence post-adoption, as observed in Oliveira et al., (2016). H3: PE has the strongest influence on ItU (β=0.259, p<0.001), underscoring the importance of productivity improvements, as noted by Shiau et al., (2024). Likewise, H4: EE significantly predicts ItU (β=0.259, p<0.001), suggesting that ease of learning AI systems encourages adoption, resonating with findings by Hoque and Sorwar (2017). In contrast, H5: SI was not a significant predictor, indicating that Greek stakeholders rely more on personal assessments rather than peer influence, diverging from studies like Zhou (2013). H6: FC positively affect ItU (β=0.131, p<0.05), consistent with Venkatesh et al., (2016), highlighting the role of infrastructure and support systems in adoption. This supports the critical importance of infrastructure, support mechanisms, and system reliability in ensuring successful adoption. These findings align with Venkatesh et al., (2003) and Rahman et al., (2023), emphasizing the role of resources, knowledge, and support in bridging intention and actual usage. H7: HM also significantly influences ItU (β=0.234, p<0.01), aligning with K. Gupta and Arora (2020), indicating that enjoyment can drive adoption, especially among younger users, underscoring the role of enjoyment and satisfaction in adoption behaviour. These results also align with Brown and Venkatesh (2005), highlighting the growing importance of hedonic factors, particularly in enhancing user engagement and satisfaction. Lastly, H8: ItU significantly predicts AB (β=0.132, p<0.05), reaffirming the UTAUT2 premise that intention precedes actual adoption behaviour (Venkatesh et al., 2016). The model confirms ItU as a critical mediator, significantly predicting Adoption Behaviour (path coefficient = 0.132, p < 0.05). This centrality reflects its role in translating user perceptions into actionable outcomes, consistent with Chiu et al., (2014).
The control variables offer nuanced insights (Shiau et al., 2024). Occupation (OCC) significantly influences both Intention to Use (path coefficient = 0.084, p < 0.05) and Adoption Behaviour (path coefficient = 0.126, p < 0.05), indicating the role of professional context in shaping perceptions and adoption (Batiz-Lazo et al., 2022). Education (EDU) also significantly impacts Adoption Behaviour (path coefficient = 0.139, p < 0.05), with higher educational attainment linked to greater adoption. These findings align with Carlson and Wu (2012), reinforcing the importance of education in technology adoption. Conversely, demographic variables like Gender (GEN) and Age (AGE) show no significant effects, suggesting relatively uniform perceptions across these groups contrary e.g. to Faqih (2016) who found some relevance on Gender.
A visual representation of the Structural Model is depicted below, Figure 2
5. DISCUSSION AND LIMITATIONS
Although AI adoption in banking has become a strategic priority, it remains far from having widespread implementation (Kaushik & Sharma, 2023). Successful adoption depends on users' willingness to embrace the technology, as highlighted in the foundational work of Davis (1986) and further expanded by Davis and Venkatesh (1996). This study investigates behavioural impediments to AI adoption among stakeholders of Greek incumbent banks, including bank employees, the general public, and digital professionals. It addresses three key research questions: Which factors influence AI adoption positively or negatively? How strong are these influences, and are there moderating variables? Are there differences in AI acceptance among stakeholder groups? Drawing from TAM and UTAUT-2 models, the study tested nine hypotheses. Eight were confirmed as significant predictors of adoption intentions. PE, EE and HM emerged as strong predictors of adoption intention, while PEOU, PU and FC significantly influenced ItU, which itself predicted AI AB. SI, however, was non-significant, indicating that AI adoption decisions are increasingly seen as personal rather than socially influenced, aligning with findings by Morosan and DeFranco (2016).
The findings revealed that while facilitating conditions, such as access to hardware, were sufficient, gaps in knowledge and skills underscored the importance of usability and intuitive design for fostering adoption (Fares et al., 2023; Gefen et al., 2003). Adoption intentions were consistently high across societal and occupational groups, reflecting a shared anticipation of AI integration. However, some differences emerged among occupational and educational groups, with fintech professionals and postgraduate respondents showing higher likelihoods of adoption, consistent with Hair et al., (2021) and Dwivedi et al., (2019). Demographic variables such as gender and age were not significant moderators, challenging prior research by Faqih (2016) that suggested gender-related differences. Interestingly, no substantial generational divides were observed, as younger respondents and those over 45 demonstrated similar acceptance levels. This supports Shiau et al., (2024), who found that familiarity and professional exposure to AI, rather than age, drive adoption behaviours. These findings emphasize the importance of professional roles and education while challenging traditional assumptions about the demographic influences on technology adoption.
5.1. Theoretical Implications
The study's theoretical contribution is multifaceted. It provides new insights into AI adoption within Greece, a context that remains under-researched, while confirming key interactions between variables. The contribution of the exercise lies on the fact that it explores an area of great interest but even more so, having used control variables on population samples that match key stakeholders of the new technology to be introduced. The framework is adaptable for future research across sectors such as retail or public Institutions and enables the exploration of additional factors influencing behavioural intention.
The findings underscore a positive perception of AI in banking, with participants associating it with convenience, speed, and efficiency, echoing previous research on AI's transformative impact (Chauhan et al., 2022; Janssen et al., 2020). Drawing on TAM and UTAUT-2 frameworks, the study validates constructs such as PE (Dwivedi et al., 2019; Martins et al., 2014), EE (Oliveira et al., 2016; Shankar & Datta, 2018), and HM (Brown & Venkatesh, 2005) as significant for Intention to Use AI. FC, as per previous findings, (Alnemer, 2022; Shin, 2009; Venkatesh et al., 2016) were also found pivotal in shaping stakeholders' ItU and AB, while SI showed no effect, challenging findings of scholars like Zhou (2011). The study further identifies OCC and EDU as significant variables for ItU and AB. The findings may signify conservative attitudes among bank employees, reflecting anxiety about job security and a preference for human interaction, contrasting with the enthusiasm of fintech professionals (Bessen, 2019), thereby offering nuanced insights into stakeholder differences.
5.2. Managerial and Practical Implications
The practical objective is to guide Greek systemic banking institutions in integrating AI into their operations and to support technology designers in enhancing the adoption rates among consumers by providing some useful insides some positive implications and some clear caveats. As Edo et al., (2023), note in their similar study on healthcare, Technology does not exist in isolation, and its mere availability does not guarantee adoption. Instead, it relies on the acceptance and collaboration of key users or process owners, such as clients, employees, and professionals, to realize its full potential
The study provides a positive outlook on AI adoption in everyday banking across demographics, highlighting practical benefits such as improved performance and reduced effort, while setting aside older perceptions shaped by social stereotypes. Greek bank users generally view AI favourably, recognizing its benefits and usefulness. However, the introduction of AI may face scepticism from both staff and the general public, emphasizing the need for effective change management and transparent communication to address concerns and ensure a smooth transition to these innovative technologies. These findings underscore the importance of tailored strategies to address the diverse needs and perceptions of various demographic and professional groups. By focusing on usability, transparency, and emotional engagement, Greek banks can establish a strong foundation for AI integration, aligning with global digital transformation trends (Ismatullaev & Kim, 2024; Turilli & Floridi, 2009). Addressing these specific needs will encourage broader and more sustainable adoption of AI technologies, fostering a successful transition to advanced banking solutions.
5.3. Research limitations and Scope for Future research
The work done here has the limitations of contemporary frameworks. The findings of the paper are only applicable within the current time context. As AI technology matures further, along with each market that it introduced to, both as a public sphere item and in its practical implementation in banking, perceptions and attitudes will be altering. Further work should be done to confirm or challenge research outcomes. There is a number of questions that were provoked by the exercise, and we believe that extension of research to these areas, would help advance the relevant knowledge field:
- Is the survey design adequate or fit for the purpose? Would a different methodology and approach (e.g., focus groups or interviews) reveal a different outcome?
- Would different control variables such as e.g., income, geographical location, bank branch frequency of visits, banking work transaction type, mix of human and AI, result to a different outcome?
- Are the findings applicable to different audiences? What is the perception and viewpoint of other key stakeholders such as regulators, shareholders and bank executives in moving up the pace of transition from current state to fuller adaption? Is there an impediment, are there conflicting interests perceived?
Furthermore, it should be mentioned that the questionnaire exercise itself had limitations and eventually included only the respondents who were willing to respond fully to the questionnaire.
6. Data Storage
XXXXXXXXXXX (2024), “Influencing factors on introducing Artificial Intelligence in Banking: A PLS-SEM Analysis using TAM and UTAUT -2 framework”, Mendeley Data, V1, Doi: 10.17632/mmgn63469r.1
References
- Abed, S.S. Examining augmented reality adoption by consumers with highlights on gender and educational-level differences. Review of International Business and Strategy 2021, 31, 397–415. [Google Scholar] [CrossRef]
- Aggarwal, A.; Rahul, M. Impact of perceived usability and perceived information quality on Indian consumer purchase intentions in online shopping: implication of TAM and S-O-R theory. International Journal of Technology Transfer and Commercialisation 2017, 15, 160. [Google Scholar] [CrossRef]
- Ahmad, S. , Bhatti, S. H., & Hwang, Y. E-service quality and actual use of e-banking: Explanation through the Technology Acceptance Model. Information Development 2020, 36, 503–519. [Google Scholar] [CrossRef]
- Ajzen, I. The theory of planned behaviour. Organizational Behavior and Human Decision Processes 1991, 50, 179–211. [Google Scholar] [CrossRef]
- Alalwan, A.A.; Dwivedi, Y.K.; Rana, N.P. Factors influencing adoption of mobile banking by Jordanian bank customers: Extending UTAUT2 with trust. International Journal of Information Management 2018, 37, 99–110. [Google Scholar] [CrossRef]
- Alkawsi, G.A.; Ali, N.; Mustafa, A.S.; Baashar, Y.; Alhussian, H.; Alkahtani, A.; Tiong, S.K.; Ekanayake, J. A hybrid SEM-neural network method for identifying acceptance factors of the smart meters in Malaysia: Challenges perspective. Alexandria Engineering Journal 2021, 60, 227–240. [Google Scholar] [CrossRef]
- Al-Mamary, Y.H.; Al-Nashmi, M.; Hassan YA, G.; Shamsuddin, A. A critical review of models and theories in the field of individual acceptance of technology. International Journal of Hybrid Information Technology 2016, 9, 143–158. [Google Scholar] [CrossRef]
- Alnemer, H.A. Determinants of digital banking adoption in the Kingdom of Saudi Arabia: A technology acceptance model approach. Digital Business 2022, 2, 100037. [Google Scholar] [CrossRef]
- Alshurafat, H.; Al-Mawali, H.; Al Shbail, M.O. The influence of technostress on the intention to use blockchain technology: the perspectives of Jordanian auditors. Development and Learning in Organizations: An International Journal 2023, 37, 24–27. [Google Scholar] [CrossRef]
- Arjun, R. , Kuanr, A. , & Suprabha, K. R. (). Developing banking intelligence in emerging markets: Systematic review and agenda, International Journal of Information Management Data Insights 2021, 1, 100026. [Google Scholar] [CrossRef]
- Asan, O.; Bayrak, A.E.; Choudhury, A. Artificial Intelligence and Human Trust in Healthcare: Focus on Clinicians. Journal of Medical Internet Research 2020, 22, e15154. [Google Scholar] [CrossRef] [PubMed]
- Azman Ong, M. H. , Yusri, M. Y., & Ibrahim, N. S. Use and behavioural intention using digital payment systems among rural residents: Extending the UTAUT-2 model. Technology in Society, 0230. [Google Scholar] [CrossRef]
- Bagozzi, R.P.; Gopinath, M.; Nyer, P.U. The role of emotions in marketing. Journal of the Academy of Marketing Science 1999, 27, 184–206. [Google Scholar] [CrossRef]
- Batiz-Lazo, B.; Efthymiou, L.; Davies, K. The Spread of Artificial Intelligence and Its Impact on Employment: Evidence from the Banking and Accounting Sectors. Palgrave Studies in Cross-disciplinary Business Research, In Association with EuroMed Academy of Business. [CrossRef]
- Belanche, D. , Casaló, L. V., & Flavián, C. Artificial Intelligence in FinTech: understanding robo-advisors adoption among customers. Industrial Management & Data Systems 2019, 119, 1411–1430. [Google Scholar] [CrossRef]
- Bessen, J. E. AI and Jobs: The Role of Demand. NBER Working Paper No. 24235. 2019. [CrossRef]
- Bhatiasevi, V. An extended UTAUT model to explain the adoption of mobile banking. Information Development 2016, 32, 799–814. [Google Scholar] [CrossRef]
- Bilal, M.; Zhang, Y.; Cai, S.; Akram, U.; Halibas, A. Artificial intelligence is the magic wand making customer-centric a reality! An investigation into the relationship between consumer purchase intention and consumer engagement through affective attachment. Journal of Retailing and Consumer Services 2024, 77, 103674. [Google Scholar] [CrossRef]
- Blanthorne, C.; Allison Jones-Farmer, L.; Dreike Almer, E. Why you should consider SEM: A guide to getting started. In Advances in Accounting Behavioral Research (Advances in Accounting Behavioural Research, Vol. 9); Arnold, V., Clinton, B.D., Luckett, P., Roberts, R., Wolfe, C., Wright, S., Eds.; Emerald Group Publishing Limited: Leeds, 2006; pp. 179–207. [Google Scholar] [CrossRef]
- Boustani, N. M. (). Artificial intelligence impact on banks clients and employees in an Asian developing country, Journal of Asia Business Studies 2022, 16, 267 278. [Google Scholar] [CrossRef]
- Brown, S.A.; Venkatesh, V. Model of Adoption of Technology in Households: A Baseline Model Test and Extension Incorporating Household Life Cycle. MIS Quarterly 2005, 29, 399. [Google Scholar] [CrossRef]
- Brown, S.A.; Massey, A.P.; Montoya-weiss, M.M.; Burkman, J.R. Do I really have to? User acceptance of mandated technology. European Journal of Information Systems 2002, 11, 283–295. [Google Scholar] [CrossRef]
- Carlson, K.D.; Wu, J. The Illusion of Statistical Control: Control Variable Practice in Management Research. Organizational Research Methods 2012, 15, 413–435. [Google Scholar] [CrossRef]
- Chaouali, W.; Ben Yahia, I.; Souiden, N. The interplay of counter-conformity motivation, social influence, and trust in customers' intention to adopt Internet banking services: The case of an emerging country. Journal of Retailing and Consumer Services 2016, 28, 209–218. [Google Scholar] [CrossRef]
- Chauhan, S. , Akhtar, A., & Gupta, A. (). Customer experience in digital banking: a review and future research directions, International Journal of Quality and Service Sciences 2022, 14, 311-348. [CrossRef]
- Chemingui, H.; Ben Lallouna, H. Resistance, motivations, trust and intention to use mobile financial services. International Journal of Bank Marketing 2013, 31, 574–592. [Google Scholar] [CrossRef]
- Chiu, C.-M.; Wang ET, G.; Fang, Y.-H.; Huang, H.-Y. Understanding customers' repeat purchase intentions in B2C e-commerce: the roles of utilitarian value, hedonic value and perceived risk. Information Systems Journal 2014, 24, 85–114. [Google Scholar] [CrossRef]
- Choung, H.; David, P.; Ross, A. Trust in AI and Its Role in the Acceptance of AI Technologies. International Journal of Human–Computer Interaction 2022, 39, 1727–1739. [Google Scholar] [CrossRef]
- Davis, F. D. (1986). A Technology Acceptance Model for Empirically Testing New End-User Information Systems: Theory and Results. Sloan School of Management, Massachusetts Institute of Technology. http://hdl.handle.net/1721. 1519. [Google Scholar]
- Davis, F.D.; Venkatesh, V. A critical assessment of potential measurement biases in the technology acceptance model: three experiments. International Journal of Human-Computer Studies 1996, 45, 19–45. [Google Scholar] [CrossRef]
- Davis, F.D.; Bagozzi, R.P.; Warshaw, P.R. Extrinsic and Intrinsic Motivation to Use Computers in the Workplace. Journal of Applied Social Psychology 1992, 22, 1111–1132. [Google Scholar] [CrossRef]
- Dendrinos, K.; Spais, G. An investigation of selected UTAUT constructs and consumption values of Gen Z and Gen X for mobile banking services and behavioral intentions to facilitate the adoption of mobile apps. Journal of Marketing Analytics 2023. [CrossRef]
- Dhingra, M.; Mudgal, R.K. Applications of Perceived Usefulness and Perceived Ease of Use: A Review. 2019 8th International Conference System Modeling and Advancement in Research Trends (SMART) 2019, 293–298. [Google Scholar] [CrossRef]
- Dwivedi, Y.K.; Rana, N.P.; Jeyaraj, A.; Clement, M.; Williams, M.D. Re-examining the Unified Theory of Acceptance and Use of Technology (UTAUT): Towards a Revised Theoretical Model. Information Systems Frontiers 2019, 21, 719–734. [Google Scholar] [CrossRef]
- Edo, O.C.; Ang, D.; Etu, E.-E.; Tenebe, I.; Edo, S.; Diekola, O.A. Why do healthcare workers adopt digital health technologies - A cross-sectional study integrating the TAM and UTAUT model in a developing economy. International Journal of Information Management Data Insights 2023, 3, 100186. [Google Scholar] [CrossRef]
- Faqih KM, S. An empirical analysis of factors predicting the behavioural intention to adopt Internet shopping technology among non-shoppers in a developing country context: Does gender matter? Journal of Retailing and Consumer Services 2016, 30, 140–164. [Google Scholar] [CrossRef]
- Faqih KM, S.; Jaradat M-IR, M. p: TTF and UTAUT2 theories to investigate the adoption of augmented reality technology in education, 2021; 67. [CrossRef]
- Fares, O.H.; Butt, I.; Lee SH, M. Utilization of artificial intelligence in the banking sector: a systematic literature review. Journal of Financial Services Marketing 2023, 28, 835–852. [Google Scholar] [CrossRef]
- Fornell, C.; Larcker, D.F. Evaluating structural equation models with unobservable variables and measurement error. Journal of Marketing Research 1981, 18, 39–50. [Google Scholar] [CrossRef]
- Gefen, D.; Karahanna, E.; Straub, D.W. Trust and TAM in online shopping: An integrated model. MIS Quarterly 2003, 27, 51–90. [Google Scholar] [CrossRef]
- Gomber, P.; Koch, J.-A.; Siering, M. Digital Finance and FinTech: current research and future research directions. Journal of Business Economics 2017, 87, 537–580. [Google Scholar] [CrossRef]
- Gupta, K.; Arora, N. Investigating consumer intention to accept mobile payment systems through unified theory of acceptance model. South Asian Journal of Business Studies 2020, 9, 88–114. [Google Scholar] [CrossRef]
- Hair, J.F.; Hult GT, M.; Ringle, C.M.; Sarstedt, M.; Danks, N.P.; Ray, S. Partial Least Squares Structural Equation Modeling (PLS-SEM) Using R. Classroom Companion: Business. [CrossRef]
- Hair, J.F.; Risher, J.J.; Sarstedt, M.; Ringle, C.M.; Svensson, G. When to use and how to report the results of PLS-SEM. European Business Review 2018, 00–00. [Google Scholar] [CrossRef]
- Hendrickson, A.R.; Massey, P.D.; Cronan, T.P. On the Test-Retest Reliability of Perceived Usefulness and Perceived Ease of Use Scales. MIS Quarterly 1993, 17, 227. [Google Scholar] [CrossRef]
- Henseler, J.; Ringle, C.M.; Sarstedt, M. A new criterion for assessing discriminant validity in variance-based structural equation modelling. Journal of the Academy of Marketing Science 2015, 43, 115–135. [Google Scholar] [CrossRef]
- Henseler, J.; Ringle, C.M.; Sinkovics, R.R. The use of partial least squares path modeling in international marketing. Advances in International Marketing 2009, 277–319. [Google Scholar] [CrossRef]
- Hoque, M.; Sorwar, G. Understanding factors influencing the adoption of mHealth by the elderly: An extension of the UTAUT model. International Journal of Medical Informatics 2017, 101. [Google Scholar] [CrossRef] [PubMed]
- Hünermund, P.; Louw, B. On the Nuisance of Control Variables in Causal Regression Analysis. Organizational Research Methods 2023, 0(0). [CrossRef]
- Ionașcu, A. E. , Gheorghiu, G., Spătariu, E. C., Munteanu, I., Grigorescu, A., & Dănilă, A. Unravelling Digital Transformation in Banking: Evidence from Romania. Systems 2023, 11, 534. [Google Scholar] [CrossRef]
- Ismatullaev UV, U.; Kim, S.-H. Review of the Factors Affecting Acceptance of AI-Infused Systems. Human Factors: The Journal of the Human Factors and Ergonomics Society 2024, 66, 126–144. [Google Scholar] [CrossRef] [PubMed]
- Janssen, M. , Wimmer, M. A., & Deljoo, A. (Eds.). Policy Practice and Digital Science: Integrating Complex Systems, Social Simulation and Public Administration in Policy Research. Springer: 2020. [CrossRef]
- Jaya Lakshmi, A.; Kumar, A.; Kumar, M.S.; Patel, S.I.; Naik SK, L.; Ramesh JV, N. Artificial intelligence in steering the digital transformation of collaborative technical education. The Journal of High Technology Management Research 2023, 34, 100467. [Google Scholar] [CrossRef]
- Kapoor, A.; Hayes, A.; Patel, J.; Patel, H.; Andrade, A.; Mazor, K.; Possidente, C.; Nolen, K.; Hegeman-Dingle, R.; McManus, D. Usability and Perceived Usefulness of the AFib 2gether Mobile App in a Clinical Setting: Single-Arm Intervention Study. JMIR Cardio 2021, 5, e27016. [Google Scholar] [CrossRef]
- Kaspersky. (2023). European Survey, 16 December, Euro2day.gr https://www.euro2day.gr/news/economy/article/2222311/poso-dieisdyse-h-tehnhth-nohmosynh-stis-ellhnikes.
- Kaushik, M.; Sharma, M. A study on artificial intelligence (AI) in banking services. International Journal of Financial Management Research 2023, 5, November–December. [Google Scholar] [CrossRef]
- Kelly, S.; Kaye, S.A.; Oviedo-Trespalacios, O. What factors contribute to the acceptance of Artificial Intelligence? A systematic review. Telematics and Informatics 2023, 77, 101925. [Google Scholar] [CrossRef]
- Khalil, N.M.; Sutanonpaiboon, J.; Hamimah Mastor, N. Malay, Chinese, and internet banking. Chinese Management Studies 2010, 4, 141–153. [Google Scholar] [CrossRef]
- Kitsios, F.; Giatsidis, I.; Kamariotou, M. Digital Transformation and Strategy in the Banking Sector: Evaluating the Acceptance Rate of E-Services. Journal of Open Innovation: Technology, Market, and Complexity 2021, 7, 204. [Google Scholar] [CrossRef]
- Kline, R.B. Response to Leslie Hayduk's Review of Principles and Practice of Structural Equation Modeling, 4th Edition. Canadian Studies in Population 2018, 45, 188. [Google Scholar] [CrossRef]
- Laros FJ, M.; Steenkamp J-BE, M. Emotions in consumer behavior: a hierarchical approach. Journal of Business Research 2005, 58, 1437–1445. [Google Scholar] [CrossRef]
- Legris, P.; Ingham, J.; Collerette, P. Why do people use information technology? A critical review of the technology acceptance model. Information & Management 2003, 40, 191–204. [Google Scholar] [CrossRef]
- Liang, Y.; Lee, S.-H.; Workman, J.E. Implementation of Artificial Intelligence in Fashion: Are Consumers Ready? Clothing and Textiles Research Journal 2020, 38, 3–18. [Google Scholar] [CrossRef]
- Marangunić, N. , & Granić, A. Technology acceptance model: a literature review from 1986 to 2013. Univ Access Inf Soc 2015, 14, 81–95. [Google Scholar] [CrossRef]
- Martins, C. , Oliveira, T., & Popovič, A. Understanding the Internet banking adoption: A unified theory of acceptance and use of technology and perceived risk application. International Journal of Information Management 2014, 34, 1–13. [Google Scholar] [CrossRef]
- Mi Alnaser, F.; Rahi, S.; Alghizzawi, M.; Ngah, A.H. Does artificial intelligence (AI) boost digital banking user satisfaction? Integration of expectation confirmation model and antecedents of artificial intelligence-enabled digital banking. Heliyon 2023, 9, e18930. [Google Scholar] [CrossRef]
- Milonas, P. (2023). interview at capital.gr, Aggeletou V, https://www.capital. 3755. [Google Scholar]
- Morosan, C.; DeFranco, A. It's about time: Revisiting UTAUT2 to examine consumers' intentions to use NFC mobile payments in hotels. International Journal of Hospitality Management 2016, 53, 17–29. [Google Scholar] [CrossRef]
- Ndubisi, N.O.; Sinti, Q. Consumer attitudes, system's characteristics and internet banking adoption in Malaysia. Management Research News 2006, 29, 16–27. [Google Scholar] [CrossRef]
- Nikghadam Hojjati, S.; Reza Rabi, A. Effects of Iranian online behavior on the acceptance of internet banking. Journal of Asia Business Studies 2013, 7, 123–139. [Google Scholar] [CrossRef]
- Nordhoff, S.; Louw, T.; Innamaa, S.; Lehtonen, E.; Beuster, A.; Torrao, G.; Bjorvatn, A.; Kessel, T.; Malin, F.; Happee, R.; Merat, N. Using the UTAUT2 model to explain public acceptance of conditionally automated (L3) cars: A questionnaire study among 9,118 car drivers from eight European countries. Transportation Research Part F: Traffic Psychology and Behaviour 2020, 74, 280–297. [Google Scholar] [CrossRef]
- Oliveira, T.; Thomas, M.; Baptista, G.; Campos, F. Mobile payment: Understanding the determinants of customer adoption and intention to recommend the technology. Computers in Human Behavior 2016, 61, 404–414. [Google Scholar] [CrossRef]
- Omarini, A.E. Banks and Fintechs: How to Develop a Digital Open Banking Approach for the Bank's Future. International Business Research 2018, 11, 23. [Google Scholar] [CrossRef]
- Panzarino, H. , & Hatami, A. Reinventing banking and finance: frameworks to navigate global fintech innovation, 9: Publishers: 2020. EAN, 2020. [Google Scholar]
- Papathomas, A.; Konteos, G. Financial institutions digital transformation: the stages of the journey and business metrics to follow. Journal of Financial Services Marketing 2023. [CrossRef]
- Pikkarainen, T.; Pikkarainen, K.; Karjaluoto, H.; Pahnila, S. Consumer acceptance of online banking: an extension of the technology acceptance model. Internet Research 2004, 14, 224–235. [Google Scholar] [CrossRef]
- Rahi, S.; Othman Mansour, M.M.; Alghizzawi, M.; Alnaser, F.M. Integration of UTAUT model in internet banking adoption context: The mediating role of performance expectancy and effort expectancy. Journal of Research in Interactive Marketing 2019, 13, 411–435. [Google Scholar] [CrossRef]
- Rahman, M. , Ming, T. H., Baigh, T. A., & Sarker, M. (). Adoption of artificial intelligence in banking services: an empirical analysis, International Journal of Emerging Markets 2023, 18, 4270–4300. [Google Scholar] [CrossRef]
- Rajak, M.; Shaw, K. An extension of technology acceptance model for mHealth user adoption. Technology in Society 2021, 67, 101800. [Google Scholar] [CrossRef]
- Rezvani, M. Q. , Choudhary, N., Mangal, U., Kamranullah, Chandel, J. K., & Vashisht, S. Application of artificial intelligence: Organizational commitment and productivity in Indian banking sector. Multidisciplinary Science Journal 2024, 6, 2024ss0413. [Google Scholar] [CrossRef]
- Riffai MM, A.; Grant, K.; Edgar, D. Big TAM in Oman: Exploring the promise of on-line banking, its adoption by customers and the challenges of banking in Oman. International Journal of Information Management 2012, 32, 239–250. [Google Scholar] [CrossRef]
- Riva, P.; Aureli, N.; Silvestrini, F. Social influences in the digital era: When do people conform more to a human being or an artificial intelligence? Acta Psychologica 2022, 229, Article 103681. [Google Scholar] [CrossRef]
- Roca, J.C.; García, J.J.; de la Vega, J.J. The importance of perceived trust, security and privacy in online trading systems. Information Management and Computer Security 2009, 17, 96–113. [Google Scholar] [CrossRef]
- Rosen, L.D.; Sears, D.C.; Weil, M.M. Computerphobia. Behavior Research Methods, Instruments, and Computers 1987, 19, 167–179. [Google Scholar] [CrossRef]
- Russell, J.A. A circumplex model of affect. Journal of Personality and Social Psychology 1980, 39, 1161–1178. [Google Scholar] [CrossRef]
- Salimon, M.G.; Yusoff RZ, B.; Mohd Mokhtar, S.S. The mediating role of hedonic motivation on the relationship between adoption of e-banking and its determinants, International Journal of Bank Marketing 2017, 35, 558-582. [CrossRef]
- Saprikis, V.; Avlogiaris, G.; Katarachia, A. A Comparative Study of Users versus Non-Users’ Behavioural Intention towards M-Banking Apps’ Adoption. Information 2022, 13, 30. [Google Scholar] [CrossRef]
- Sarstedt, M.; Ringle, C.M.; Hair, J.F. Partial Least Squares Structural Equation Modelling. In Handbook of Market Research; Springer: 2021; pp. 587-632. [CrossRef]
- Shaikh, A.A.; Karjaluoto, H. Mobile banking adoption: A literature review. Telematics and Informatics 2015, 32, 129–142. [Google Scholar] [CrossRef]
- Shankar, A.; Datta, B. Factors affecting mobile payment adoption intention: An Indian perspective. Global Business Review 2018, 19, S72–S89. [Google Scholar] [CrossRef]
- Sharma, S.K.; Al-Badi, A.H.; Govindaluri, S.M.; Al-Kharusi, M.H. Predicting motivators of cloud computing adoption: A developing country perspective. Computers in Human Behavior 2016, 62, 61–69. [Google Scholar] [CrossRef]
- Shen, J.; Zhang CJ, P.; Jiang, B.; Chen, J.; Song, J.; Liu, Z.; He, Z.; Wong, S.Y.; Fang, P.-H.; Ming, W.-K. Artificial Intelligence Versus Clinicians in Disease Diagnosis: Systematic Review. JMIR Medical Informatics 2019, 7, e10010. [Google Scholar] [CrossRef]
- Shiau, W.-L.; Chau PY, K.; Thatcher, J.B.; Teng, C.-I.; Dwivedi, Y.K. Have we controlled properly? Problems with and recommendations for the use of control variables in information systems research. International Journal of Information Management 2024, 74, 102702. [Google Scholar] [CrossRef]
- Shin, D.-H. Towards an understanding of the consumer acceptance of mobile wallet. Computers in Human Behavior 2009, 25, 1343–1354. [Google Scholar] [CrossRef]
- Suryanarayana, K.S.; Kandi VS, P.; Pavani, G.; Rao, A.S.; Rout, S.; Krishna TS, R. Artificial intelligence enhanced digital learning for the sustainability of education management system. The Journal of High Technology Management Research 2024, 35, 100495. [Google Scholar] [CrossRef]
- Tarka, P. An overview of structural equation modelling: its beginnings, historical development, usefulness and controversies in the social sciences. Quality & Quantity 2018, 52, 313–354. [Google Scholar] [CrossRef]
- Taylor, S.; Todd, P.A. Understanding Information Technology Usage: A Test of Competing Models. Information Systems Research 1995, 6, 144–176. [Google Scholar] [CrossRef]
- Turilli, M.; Floridi, L. The ethics of information transparency. Ethics and Information Technology 2009, 11, 105–112. [Google Scholar] [CrossRef]
- Uzir MU, H.; Bukari, Z.; Al Halbusi, H.; Lim, R.; Wahab, S.N.; Rasul, T.; Thurasamy, R.; Jerin, I.; Chowdhury MR, K.; Tarofder, A.K.; Yaakop, A.Y.; Hamid AB, A.; Haque, A.; Rauf, A.; Eneizan, B. Applied artificial intelligence: Acceptance-intention-purchase and satisfaction on smartwatch usage in a Ghanaian context. Heliyon 2023, 9, e18666. [Google Scholar] [CrossRef]
- Venkatesh, V.; Davis, F.D. A Theoretical Extension of the Technology Acceptance Model: Four Longitudinal Field Studies. Management Science 2000, 46, 186–204. [Google Scholar] [CrossRef]
- Venkatesh, V.; Morris, M.G.; Davis, G.B.; Davis, F.D. User Acceptance of Information Technology: Toward a Unified View. MIS Quarterly 2003, 27, 425–478. [Google Scholar] [CrossRef]
- Venkatesh, V.; Thong JY, L.; Xu, X. Consumer Acceptance and Use of Information Technology: Extending the Unified Theory of Acceptance and Use of Technology. MIS Quarterly 2012, 36, 157. [Google Scholar] [CrossRef]
- Venkatesh, V.; Thong JY, L.; Xu, X. Unified theory of acceptance and use of technology: A synthesis and the road ahead. Journal of the Association for Information Systems 2016, 17, 328–376. [Google Scholar] [CrossRef]
- Workman, M. Advancements in technology: New opportunities to investigate factors contributing to differential technology and information use. International Journal of Management and Decision Making 2007, 8, 318–342. [Google Scholar] [CrossRef]
- Yuan, K.-H.; Bentler, P.M. Structural equation modeling. In Handbook of Statistics; C. R. Rao & S. Sinharay (Eds.), ; Elsevier: 2006; Vol. 26, pp. 297-358. [CrossRef]
- Zhou, T. Understanding online community user participation: a social influence perspective. Internet Research 2011, 21, 67–81. [Google Scholar] [CrossRef]
- Zhou, T. An empirical examination of continuance intention of mobile payment services. Decision Support Systems 2013, 54, 1085–1091. [Google Scholar] [CrossRef]
- Zhou, T.; Lu, Y.; Wang, B. Integrating TTF and UTAUT to explain mobile banking user adoption. Computers in Human Behavior 2010, 26, 760–767. [Google Scholar] [CrossRef]
Figure 1.
Research Model.
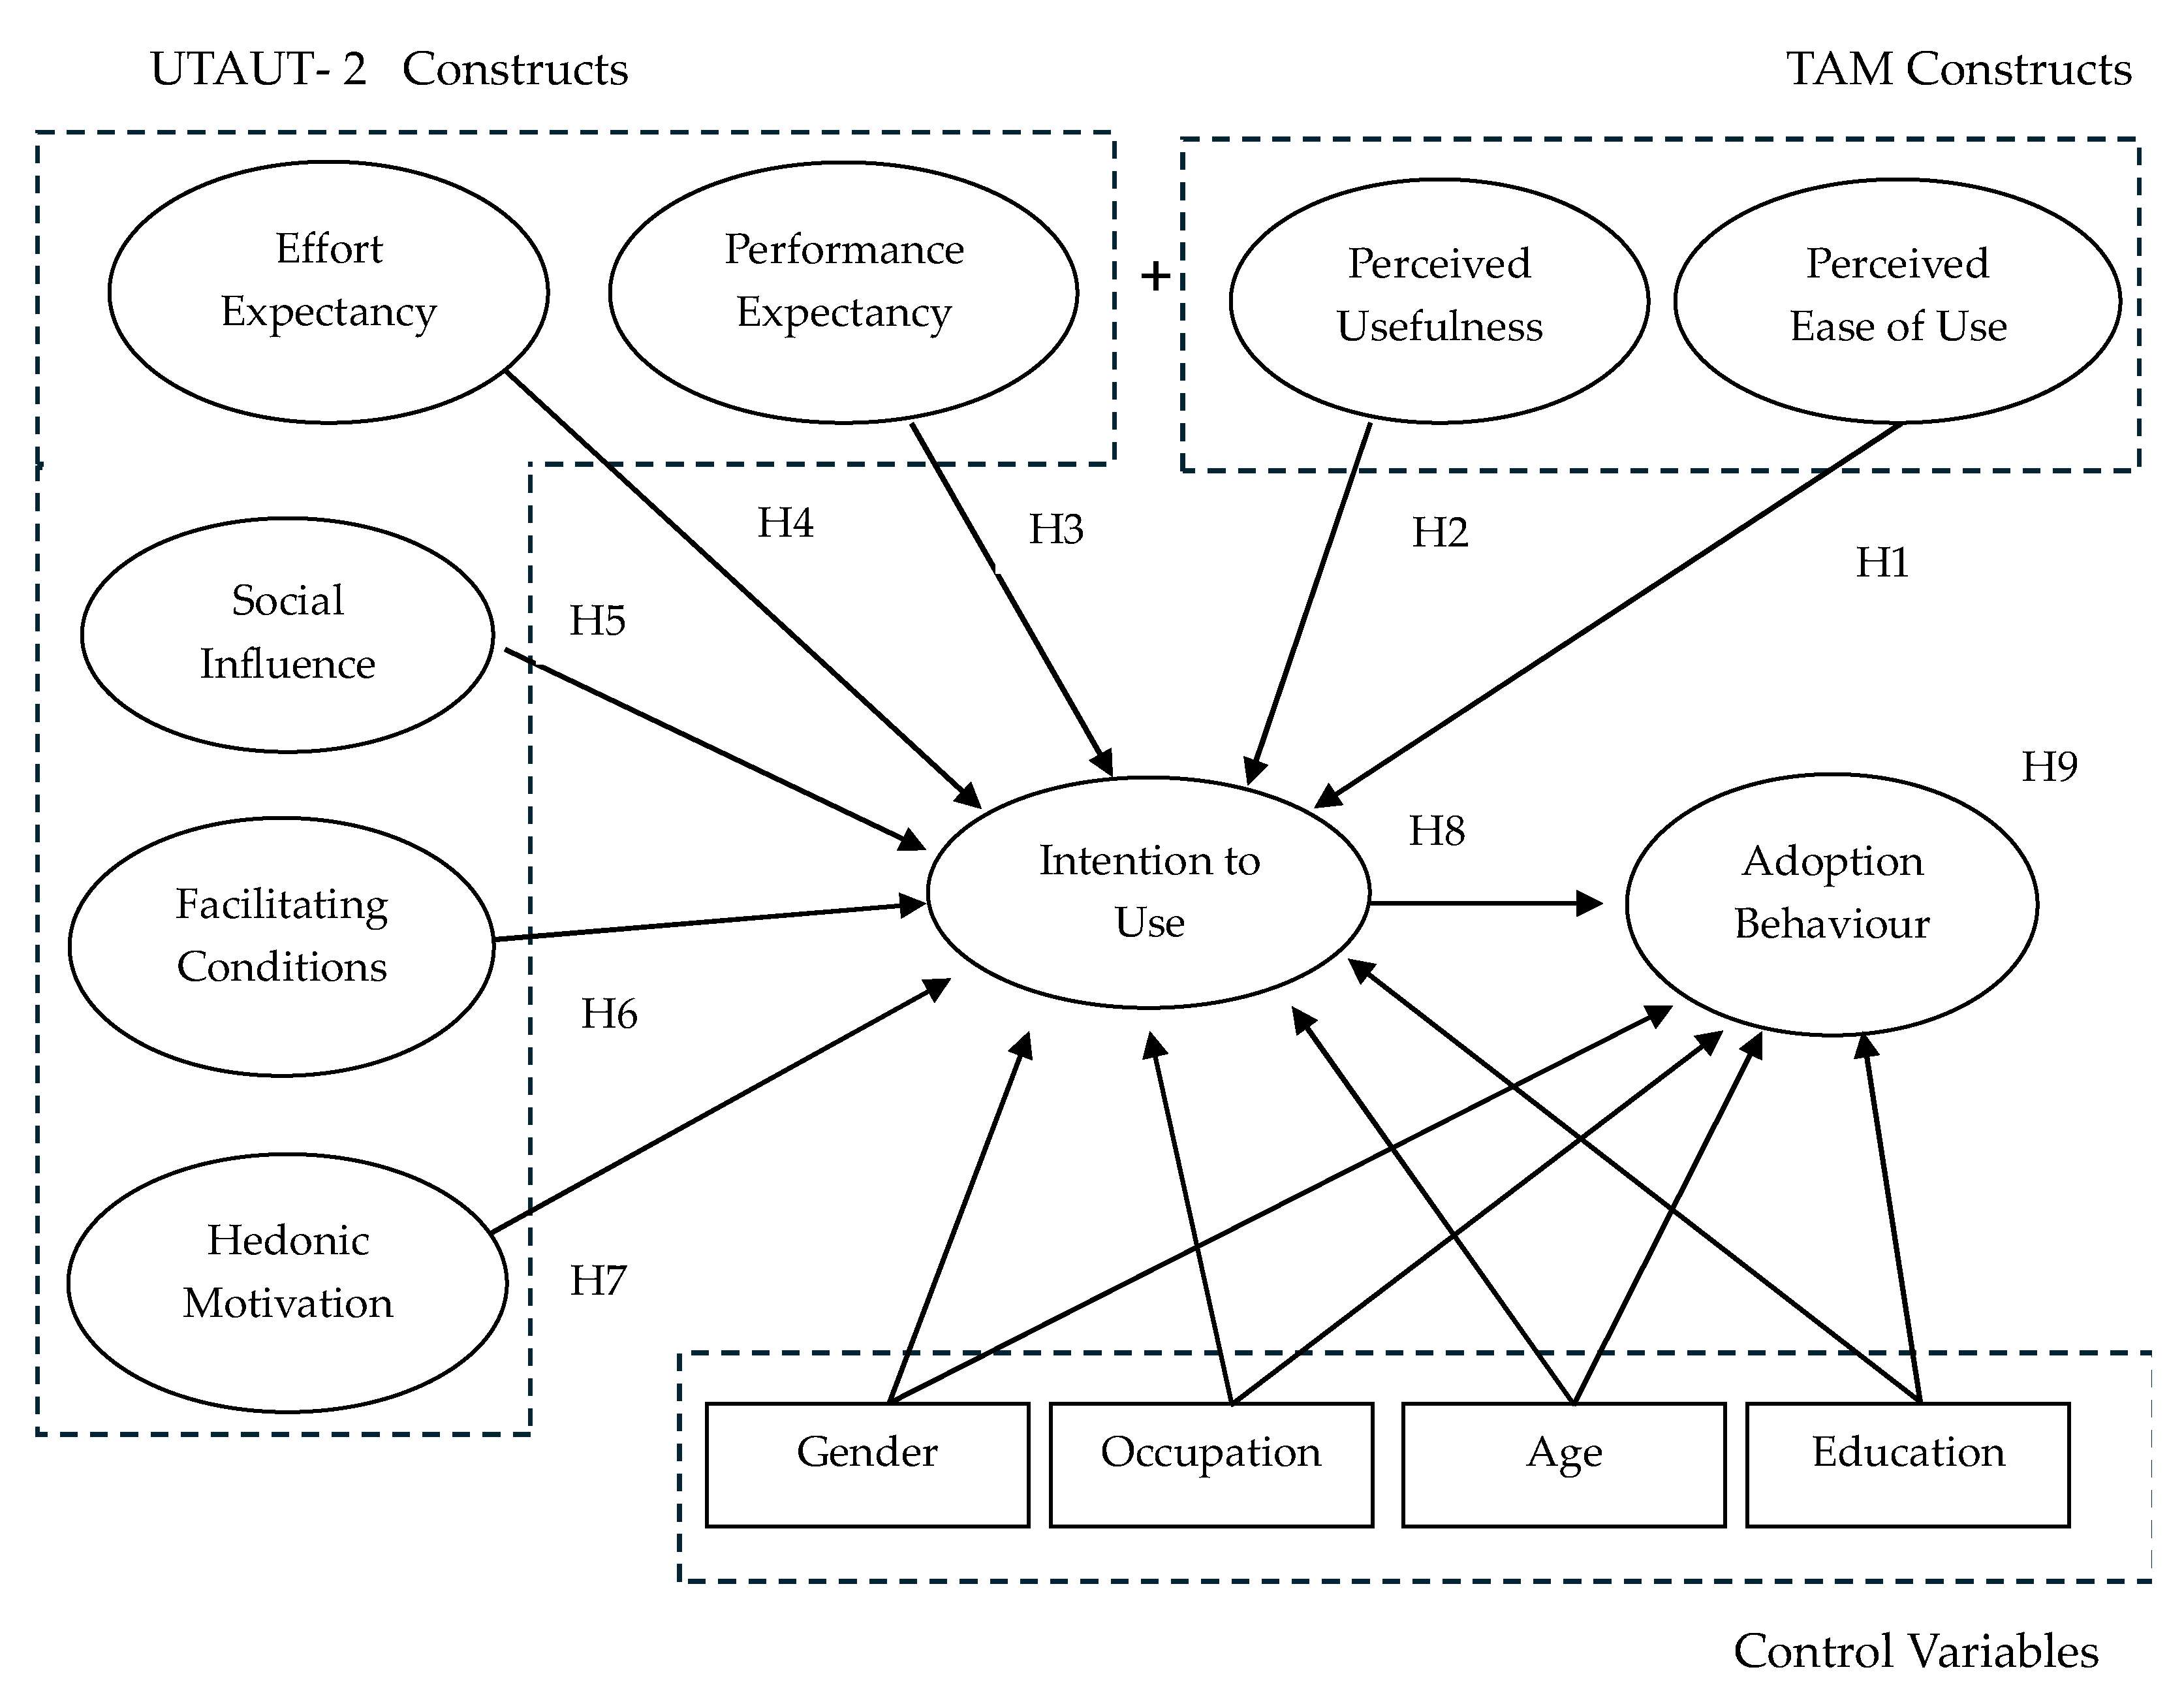
Figure 2.
PLS-SEM Structural Analysis Output.
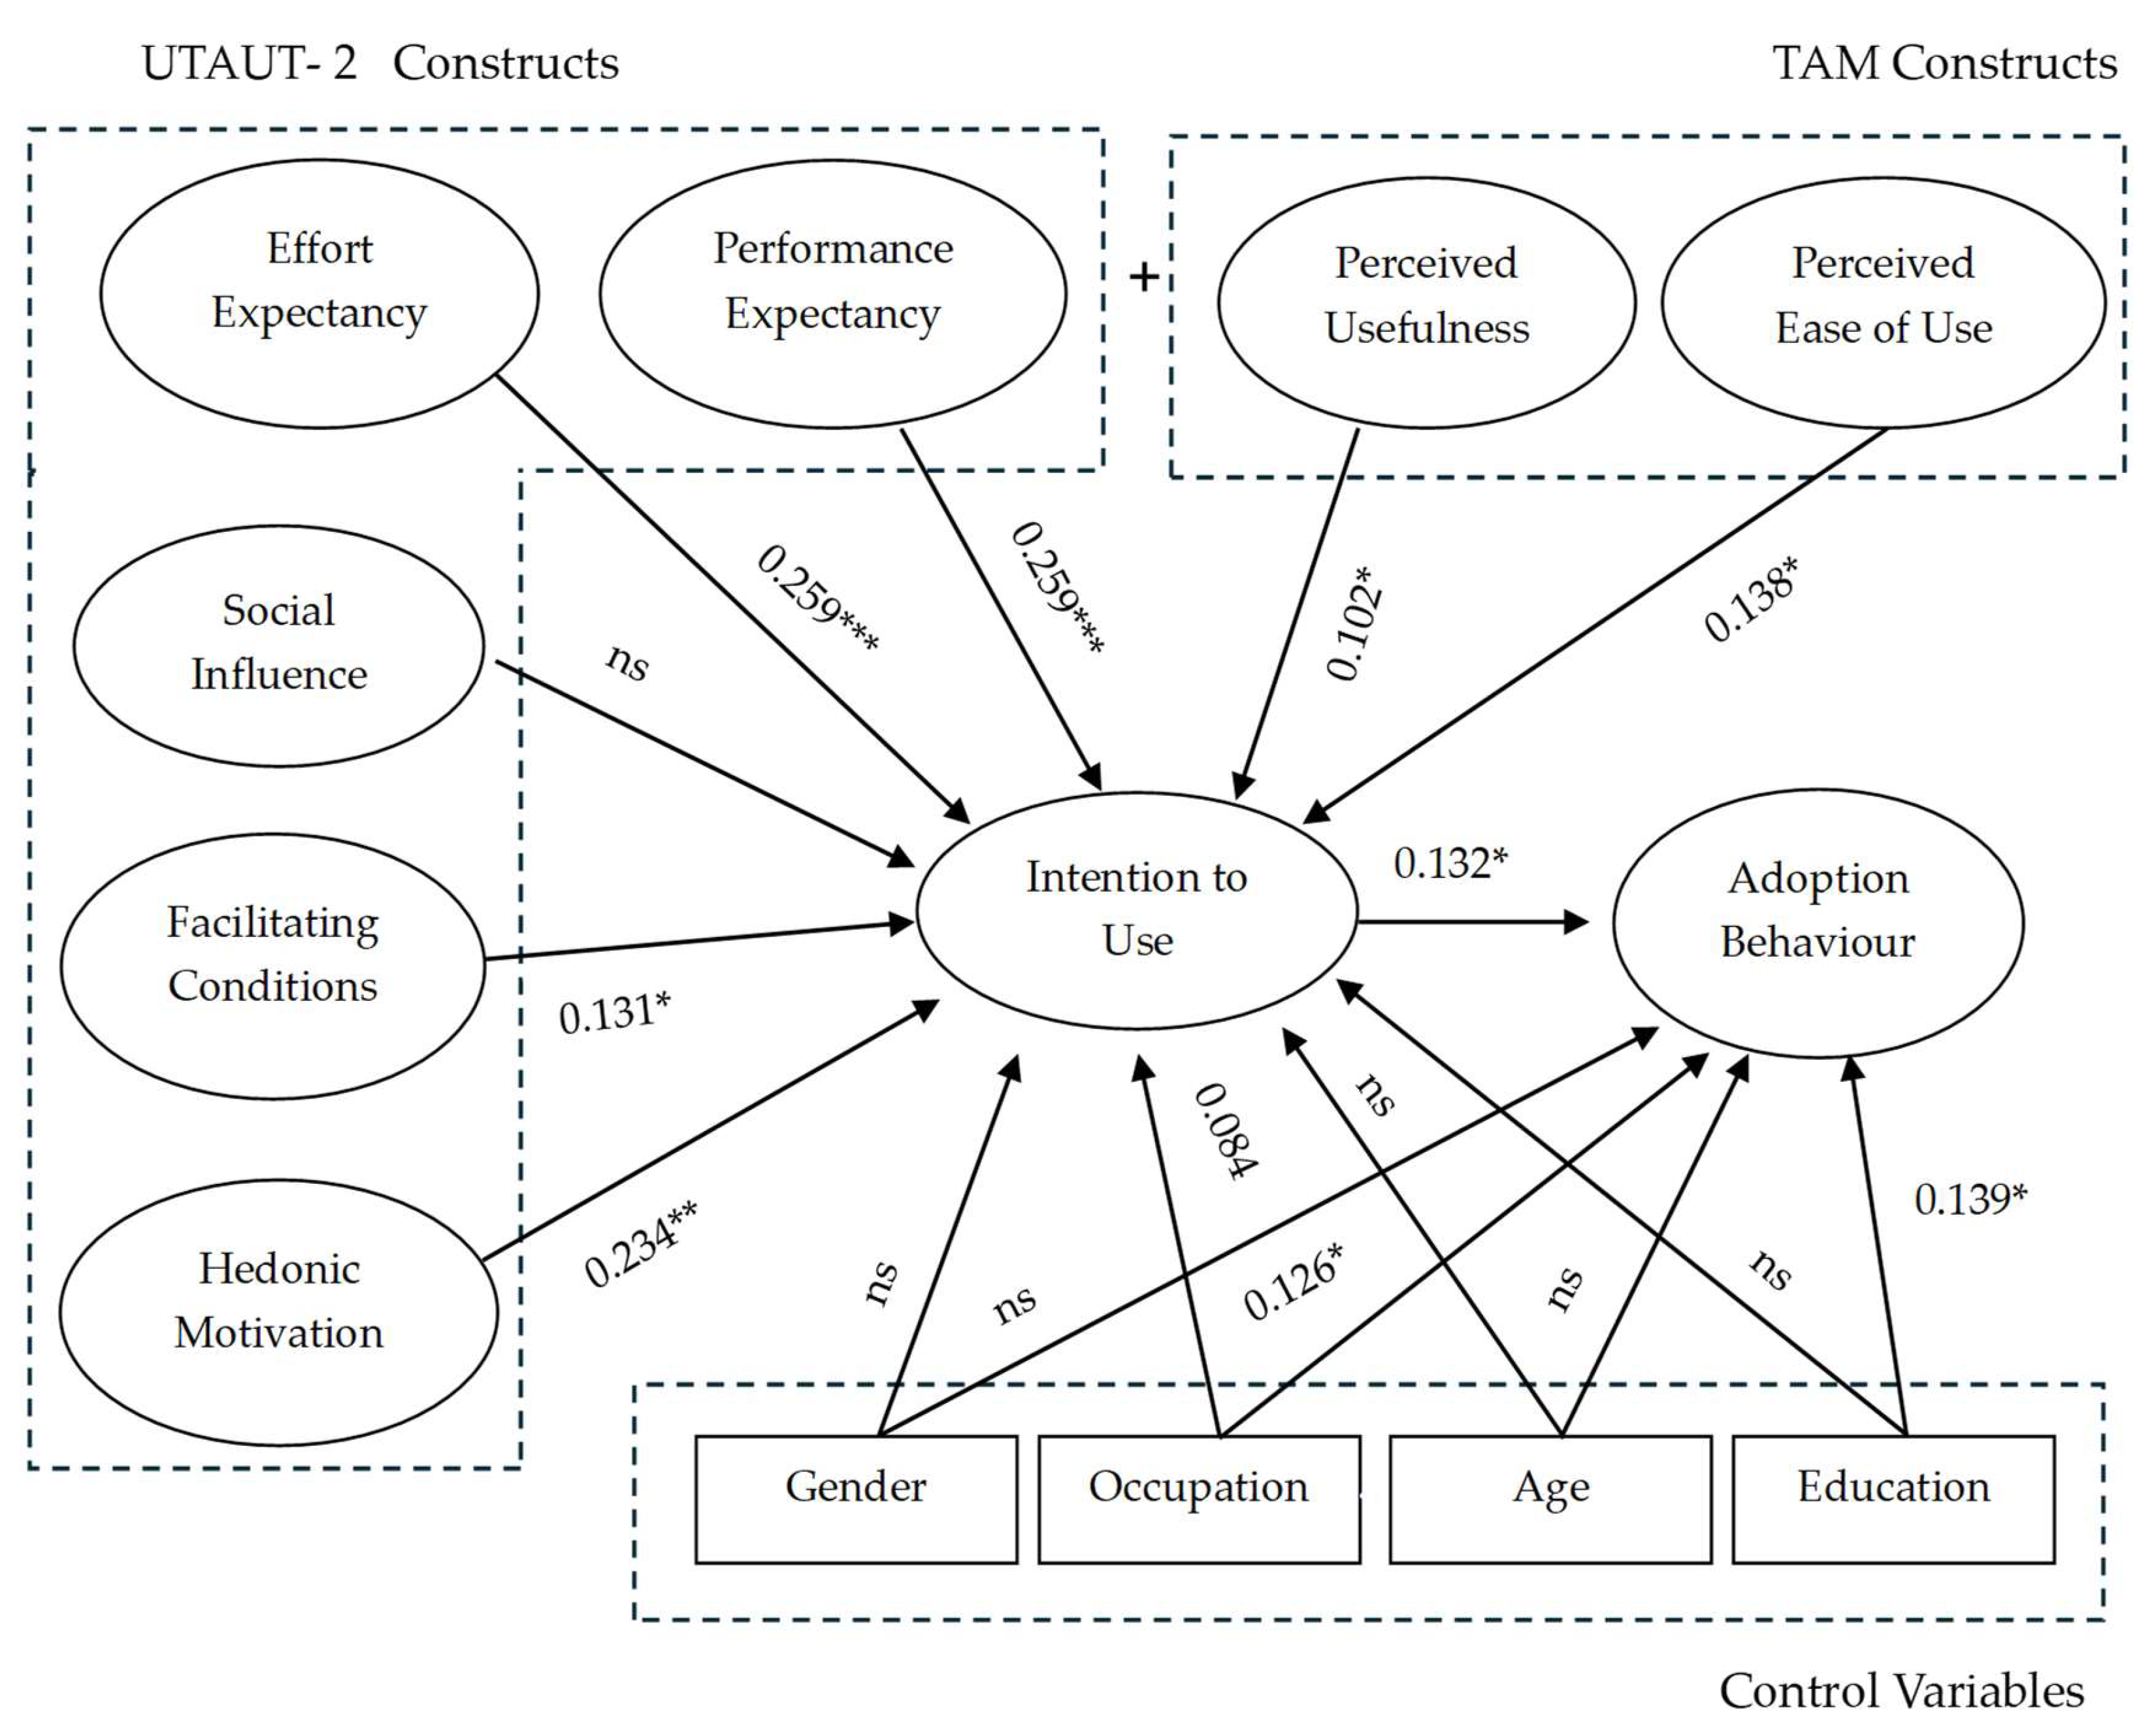

Table 1.
Research Hypotheses.
| Hypothesis | Description | Path |
|---|---|---|
| H1 | Perceived Ease of Use influences Intention to Use in AI banking services | PEOU > ItU |
| H2 | Perceived usefulness influences Intention to Use in AI banking services | PU > ItU |
| H3 | Expectation of the performance of AI in banking services influences Intention to Use in said technologies | PE > ItU |
| H4 | Effort Expectancy influences Intention to Use in AI banking services | EE > ItU |
| H5 | Social Influence influences Intention to Use in AI banking services | SI > ItU |
| H6 | Facilitating factors such as skills and system access influence Intention to Use in AI banking services | FC > ItU |
| H7 | Pleasure derived from using AI-enabled banking services influences Intention to Use in said services | HM > ItU |
| H8 | Customers' intentions to Adopt AI in banking is influenced by Intention to Use | ItU > AB |
Table 2.
Constructs, Measuring Items and References.
| Research Variables | Measurement Items | Reference |
|---|---|---|
| Perceived Ease of Use (PEOU) H1 | ||
| PEOU1 | "I believe that I will be able to interact with Artificial Intelligence better than with human contact." | Belanche et al., (2019), T. Zhou et al., (2010) |
| PEOU2 | "I believe that I will be able to interact with Artificial Intelligence only if it is supported by human contact." | Venkatesh et al., (2012), Gefen et al., (2003) |
| PEOU3 | "I believe that I will be able to interact with Artificial Intelligence at any place and time." | Venkatesh et al., (2012), Chiu et al., (2014) |
| Perceived Usefulness (PU) H2 | ||
| PU Q1 | "I believe that Artificial Intelligence will understand the questions I pose." | Davis (1986), Venkatesh et al., (2003), Rezvani et al., (2024) |
| PU Q2 | "I believe that Artificial Intelligence will be able to give me useful answers." | Davis (1986), Roca et al., (2009), Belanche et al., (2019) |
| Performance Expectancy (PE) H3 | ||
| PE Q1 | "I believe that using Artificial Intelligence will help me complete my work/banking matters." | Venkatesh et al., (2003), Gefen et al., (2003); Rezvani et al., (2024) |
| PE Q2 | "By using Artificial Intelligence, I will have a greater chance of finding solutions to issues that are important to me." | Venkatesh et al., (2003), Bagozzi et al., (1999) |
| PE Q3 | "By using Artificial Intelligence, I will be more efficient." | Venkatesh et al., (2003), Davis (1986) |
| Effort Expectancy (EE) H4 | ||
| EE Q1 | "I believe that the information provided to me by Artificial Intelligence will be comprehensible." | Alalwan et al., (2018), Venkatesh et al., (2003) |
| EE Q2 | "I believe that the information provided to me by Artificial Intelligence will be sufficient." | Alalwan et al., (2018), Davis (1986) |
| EE Q3 | "I believe that the Artificial Intelligence providing me information will be accurate." | Alalwan et al., (2018), Roca et al., (2009) |
| Social Influence (SI) H5 | ||
| SI Q1 | "I believe that people who influence my behaviour think that I should accept the use of Artificial Intelligence in Banks." | Alalwan et al., (2018), Taylor and Todd (1995) |
| SI Q2 | "I believe that people who are important to me think that I should use Artificial Intelligence in Banks." | Venkatesh et al., (2012), Chaouali et al., (2016) |
| SI Q3 | "I believe that people whose opinions I value think that I should use Artificial Intelligence in Banks." | Venkatesh et al., (2012), Ajzen (1991) |
| Facilitating Conditions (FC) H6 | ||
| FC Q1 | "I believe that I have the necessary knowledge to interact with Artificial Intelligence." | Venkatesh et al., (2012), Alalwan et al., (2018) |
| FC Q2 | "I believe that I have the necessary technological infrastructure to interact with Artificial Intelligence." | Venkatesh et al., (2012), Bagozzi et al., (1999) |
| FC Q3 | "I believe that using Artificial Intelligence will be simple and understandable." | Venkatesh et al., (2012), Davis (1986) |
| FC Q4 | "I believe that the skills required for using Artificial Intelligence can be easily acquired." | Venkatesh et al., (2012), Batiz-Lazo et al., (2022) |
| Hedonic Motivation (HM) H7 | ||
| HM Q1 | "I believe that I will be very interested in using Artificial Intelligence." | Venkatesh et al., (2012), Alalwan et al., (2018) |
| HM Q2 | "I believe that using Artificial Intelligence will be annoying." | Venkatesh et al., (2012), Taylor and Todd (1995) |
| Intention to Use (ItU) H8 | ||
| ItU Q1 | "I intend to use Artificial Intelligence in the future." | Venkatesh et al., (2003), Ajzen (1991) |
| ItU Q2 | "It's likely that I will use Artificial Intelligence in the future." | Venkatesh et al., (2003), Taylor and Todd (1995) |
| ItU Q3 | "I will use Artificial Intelligence very frequently in the future." | Venkatesh et al., (2003), Ajzen (1991) |
| Adoption Behaviour (AB) H9 | ||
| AB Q1 | "I use Artificial Intelligence frequently in my banking relations” | Venkatesh et al., (2012), Rosen et al., (1987), Belanche et al., (2019), |
| AB Q2 | " I depend on Artificial Intelligence for specific banking transactions." | Venkatesh et al., (2012), Kelly et al., (2023), Belanche et al., (2019), |
| AB Q3 | " I recommend Artificial Intelligence services to others." | Venkatesh et al., (2012), Roca et al., (2009), Belanche et al., (2019), |
Table 3.
Respondent demographics.
| Measure | Item | Frequency | % |
|---|---|---|---|
| Gender | Male | 186 | 62.62 |
| Female | 111 | 37.38 | |
| Total | 297 | 100 | |
| Age (years) | Less than 25 | 40 | 13.47 |
| 26–40 | 118 | 39.73 | |
| 41–55 | 106 | 35.69 | |
| Above 55 | 33 | 11.11 | |
| Total | 297 | 100 | |
| Education | Primary Education | 2 | 0.67 |
| Secondary Education | 56 | 18.86 | |
| College/ University/ Other Faculty | 158 | 53.2 | |
| Postgraduate / Doctoral | 81 | 27.27 | |
| Total | 297 | 100 | |
| Occupation | Bank Employee | 70 | 23.57 |
| Fintechs/Tech Startup/Consulting Firm | 76 | 25.59 | |
| Student | 108 | 36.36 | |
| Other | 43 | 14.48 | |
| Total | 297 | 100 |
Table 4.
Evaluation of Model goodness-of-fit.
| Measures | Recommended value | Measurement Model | Structural Model |
|---|---|---|---|
| x2/df | ≤5,00 | 1.461 | 1.408 |
| GFI | ≤0,90 | 0.886 | 0.892 |
| AGFI | ≤0,90 | 0.914 | 0.914 |
| CFI | ≤0,90 | 0.977 | 0.978 |
| NFI | ≤0,90 | 0.932 | 0.93 |
| IFI | ≤0,90 | 0.977 | 0.979 |
| TLI | ≤0,90 | 0.972 | 0.975 |
| RMSEA | ≤0,05 | 0.039 | 0.037 |
| [90% CI] | [0,031, 0,048] | [0,028, 0,045] |
Table 5.
Standardized factor loadings and individual item reliability.
| Variable | Indicator | Skewness | Kurtosis | Loading | AVE | CR | CA |
|---|---|---|---|---|---|---|---|
| Perceived Ease of Use | PEOU1 | -0.382 | -0.698 | 0.87 | 0.72 | 0.884 | 0.875 |
| PEOU2 | -0.942 | 0.309 | 0.815 | ||||
| PEOU3 | -0.744 | -0.142 | 0.859 | ||||
| Perceived Usefulness | PU1 | -0.581 | -0.323 | 0.911 | 0.773 | 0.872 | 0.784 |
| PU2 | -0.924 | 0.983 | 0.846 | ||||
| Performance Expectancy | PE1 | -0.469 | 0.158 | 0.784 | 0.642 | 0.843 | 0.87 |
| PE2 | -0.167 | -0.343 | 0.844 | ||||
| PE3 | -0.028 | -0.073 | 0.774 | ||||
| Effort Expectancy | EE1 | -0.469 | 0.158 | 0.825 | 0.688 | 0.869 | 0.924 |
| EE2 | -0.167 | -0.343 | 0.83 | ||||
| EE3 | -0.028 | -0.073 | 0.834 | ||||
| Social influence | SI1 | -0.497 | -0.115 | 0.832 | 0.673 | 0.86 | 0.778 |
| SI2 | -0.284 | -0.543 | 0.876 | ||||
| SI3 | -0.273 | -0.295 | 0.748 | ||||
| Facilitating Conditions | FC1 | -0.838 | 0.701 | 0.837 | 0.756 | 0.925 | 0.926 |
| FC2 | -0.846 | 0.649 | 0.875 | ||||
| FC3 | -0.817 | 0.872 | 0.868 | ||||
| FC4 | -0.789 | 0.533 | 0.895 | ||||
| Hedonic Motivation | HM1 | -0.231 | 0.103 | 0.803 | 0.631 | 0.773 | 0.833 |
| HM2 | -0.168 | 0.348 | 0.785 | ||||
| Intention to Use | ItU1 | -0.539 | 0.013 | 0.79 | 0.643 | 0.844 | 0.931 |
| ItU2 | -0.652 | 0.22 | 0.825 | ||||
| ItU3 | -0.858 | 0.967 | 0.79 | ||||
| Adoption Behaviour | AB1 | -0.209 | -0.769 | 0.92 | 0.845 | 0.942 | 0.912 |
| AB2 | 0.114 | -0.735 | 0.941 | ||||
| AB3 | -0.239 | -0.394 | 0.896 |
Table 6.
Discriminant Validity.
| Variable | PEOU | PU | PE | EE | SI | FC | HM | ItU | AB |
| PEOU | 0.849 | ||||||||
| PU | 0.007 | 0.879 | |||||||
| PE | 0.27 | 0.644 | 0.801 | ||||||
| EE | 0.328 | 0.073 | 0.644 | 0.829 | |||||
| SI | 0.045 | 0.442 | 0.047 | 0.055 | 0.82 | ||||
| FC | 0.494 | 0.026 | 0.194 | 0.4 | 0.045 | 0.869 | |||
| HM | 0.294 | -0.48 | 0.666 | 0.616 | -0.007 | 0.335 | 0.794 | ||
| ItU | 0.409 | 0.115 | 0.632 | 0.666 | 0.038 | 0.41 | 0.634 | 0.802 | |
| AB | 0.096 | -0.026 | 0.137 | 0.117 | 0.019 | 0.057 | 0.152 | 0.143 | 0.919 |
Table 7.
Path coefficients (standardized regression coefficients).
| Hypothesis | Path | p-value | Decision |
|---|---|---|---|
| H1 | PEOU → ItU | 0,138* | Significant |
| H2 | PU → ItU | 0,102* | Significant |
| H3 | PE→ ItU | 0,259*** | Significant |
| H4 | EE → ItU | 0,259*** | Significant |
| H5 | SI → ItU | NS | Non-Significant |
| H6 | FC → ItU | 0,131* | Significant |
| H7 | HM →ItU | 0,234** | Significant |
| H8 | ItU → AB | 0,132* | Significant |
| Control | GEN → ItU | NS | Non-Significant |
| GEN → AB | NS | Non-Significant | |
| OCC → ItU | 0,084* | Significant | |
| OCC → AB | 0,126* | Significant | |
| AGE→ ItU | NS | Non-Significant | |
| AGE → AB | NS | Non-Significant | |
| EDU → ItU | NS | Non-Significant | |
| EDU → AB | 0,139* | Significant |
Disclaimer/Publisher’s Note: The statements, opinions and data contained in all publications are solely those of the individual author(s) and contributor(s) and not of MDPI and/or the editor(s). MDPI and/or the editor(s) disclaim responsibility for any injury to people or property resulting from any ideas, methods, instructions or products referred to in the content. |
© 2025 by the authors. Licensee MDPI, Basel, Switzerland. This article is an open access article distributed under the terms and conditions of the Creative Commons Attribution (CC BY) license (http://creativecommons.org/licenses/by/4.0/).
Copyright: This open access article is published under a Creative Commons CC BY 4.0 license, which permit the free download, distribution, and reuse, provided that the author and preprint are cited in any reuse.


