1. Introduction
Early dental caries (EDC) is a critical stage of tooth decay where mineral loss occurs without structural breakdown. During this stage, remineralization can restore the tooth to its normal state, making it a golden opportunity for intervention [
1]. Once EDC progresses to structural collapse and cavity formation, restoration becomes impossible, highlighting the importance of early management and treatment. For this, diverse and in-depth foundational studies on EDC are essential.
The gold standard for in vitro evaluation of mineral loss and lesion depth in EDC is transverse microradiography (TMR) [
2,
3]. TMR allows for precise analysis of lesion depth and integrated mineral loss (ΔZ, volume % mineral × µm) in transverse sections of EDC. However, TMR is expensive and complex, limiting its widespread use globally. As an alternative, micro-computed tomography (µCT) has been proposed. Previous study has demonstrated significant correlations between TMR and µCT in assessing enamel caries lesions, suggesting that µCT can serve as a viable substitute [
4]. Nevertheless, µCT remains a costly tool that is not readily accessible to individual researchers.
For non-invasive clinical detection, diagnosis, severity assessment, and progression analysis of EDC, several tools have been developed [
5,
6,
7]. Among them, quantitative light-induced fluorescence (QLF, Inspektor Research Systems BV, Amsterdam, Netherlands) has been widely validated for its diagnostic reliability in EDC [
8,
9,
10]. EDC involves mineral loss in the tooth structure, which increases porosity and light scattering, leading to reduced fluorescence intensity compared to sound enamel [
11]. QLF analysis quantifies this reduction in fluorescence using the delta F (ΔF) value. Numerous studies have demonstrated strong correlations between ΔF and the degree of mineral loss in EDC [
8,
9,
10,
11]. QLF has been adopted by dental schools, clinics, and research institutions worldwide, with studies on QLF steadily increasing in PubMed listings [
12].
While the clinical validity of QLF has been well established, this study aims to evaluate the analytical validity of QLF in experimental research settings. Specifically, we hypothesize that QLF can replace costly methods like TMR or µCT for analyzing transverse sections of EDC. To test this hypothesis, we analyzed artificially created EDC lesions on transverse sections using QLF and µCT, comparing the results to validate the reliability of QLF as an analytical tool.
2. Materials and Methods
2.1. Preparation and Fabrication of Specimens
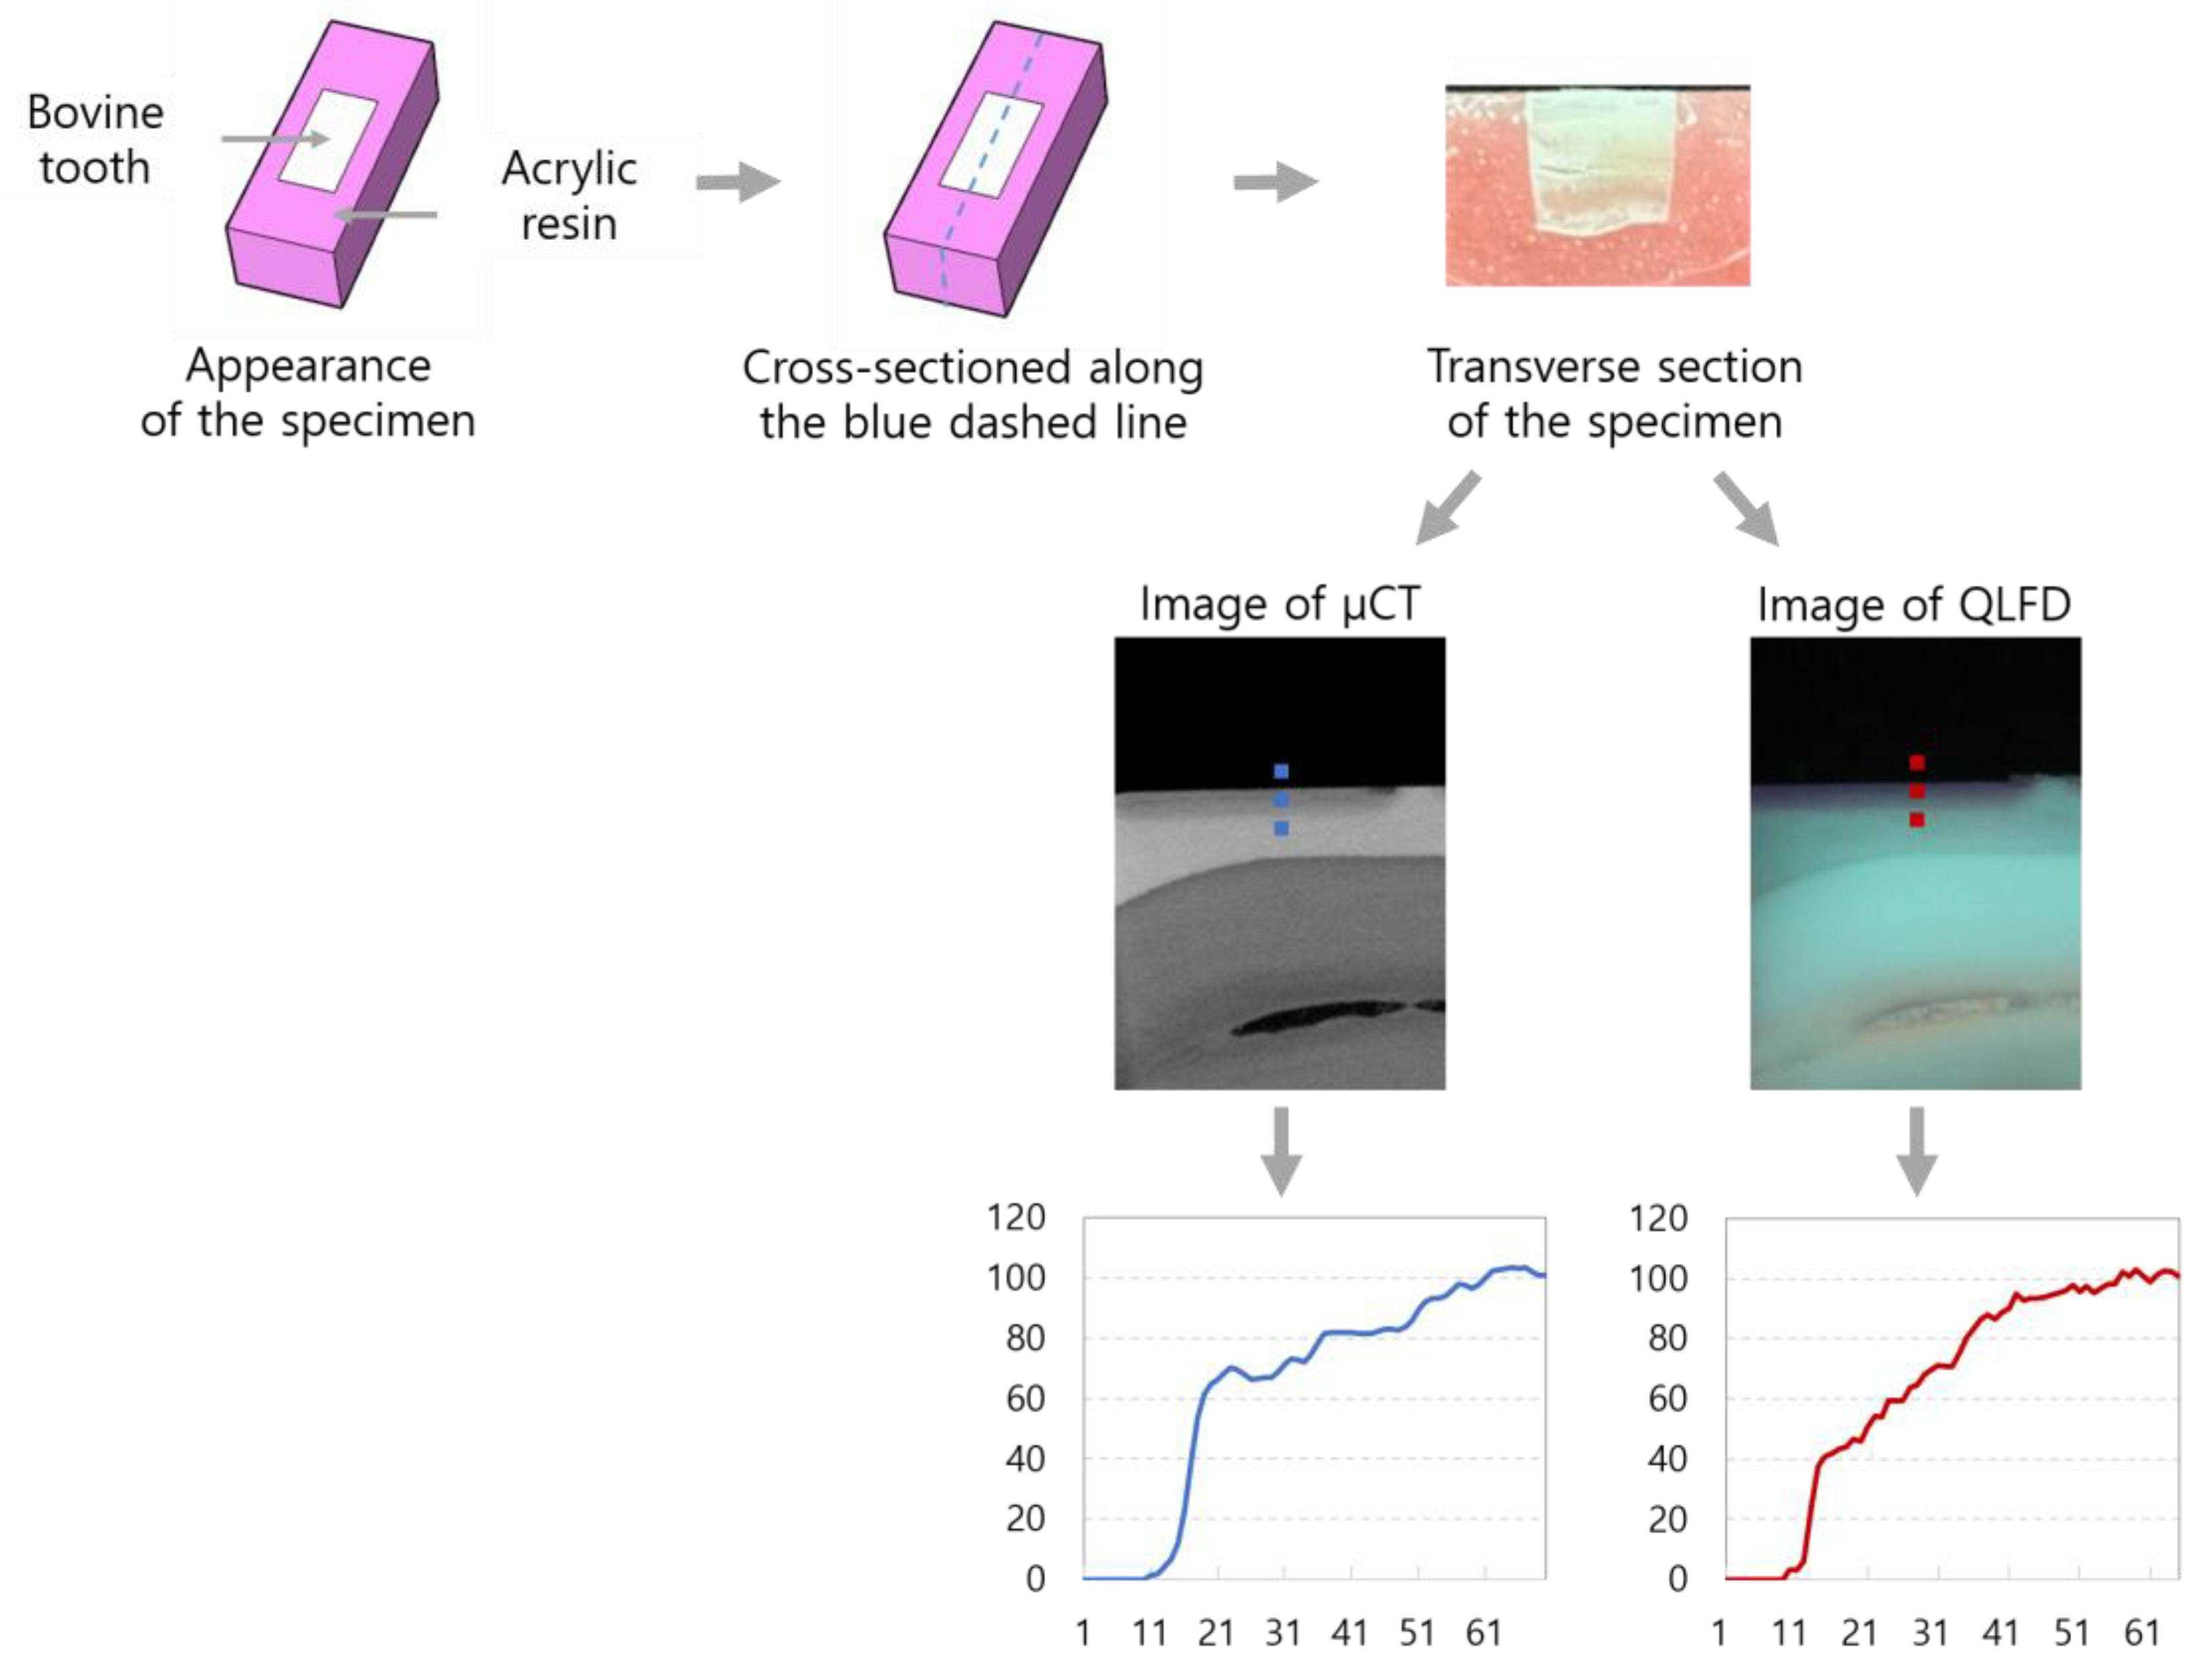
Sound bovine permanent anterior teeth without any signs of demineralization or cracks were sectioned into 5 mm × 3 mm specimens using a diamond disc bur (NTI-Kahla GmbH, Germany). The sectioned teeth were embedded in acrylic resin (Curing acrylic denture repair material; Vertex, Soesterberg) molds, with the enamel surface exposed. The specimens were sequentially ground and polished using silicon carbide paper (400p to 2400p; Allied High Tech Products Inc., Rancho Dominguez, CA, USA) mounted on a polishing machine (RB 209 Minipol, R&B Inc., Korea). Transparent nail varnish was applied to a 1 mm × 3 mm area on one side of the specimen.
The artificial caries solution was prepared by adding tribasic calcium phosphate to 1M lactic acid to create a saturated solution. Subsequently, 2% Carbopol (Carbopol ETD 2050 polymer; The Lubrizol Corporation, Wickliffe, OH, USA) was added, and the final pH was adjusted to 4.8 [
13]. Fourteen specimens were assigned to each group. Seven specimens were placed in a 50-ml demineralization solution and incubated at 37˚C. Demineralization was performed for 10, 20, 30, 40, 50, 60, and 70 days, with the solution being replaced every 20 days. Using a low-speed saw (Minitome, Struers, Denmark), the specimens were sectioned perpendicular to the enamel surface. To prevent fracturing of the enamel surface, which was expected to be weakened due to mineral loss, the sectioning was performed at 200 rpm.
Figure 1 presents the scheme of this study, illustrating the experimental workflow and analysis process.
2.2. Micro-Computed Tomography (µCT) Analysis
The µCT images (SkyScan1273, Bruker, Germany) were acquired using X-rays generated at 100 kV and 80 µA. A 1 mm aluminum filter and a 0.038 mm copper filter were applied with 80% beam hardening correction. To minimize artifacts and noise and enhance data accuracy, ring artifact correction, flat field correction, frame averaging, and random movement were applied. Each tooth specimen was scanned within a rotation range of 206.25°, and the total scan time was 4 minutes and 46 seconds. The distance from the X-ray source to the sample was 53.545 mm, while the distance from the sample to the detector (camera) was 500.742 mm. The data were saved as 1375 TIFF files, with each file having a resolution of 3072 × 1944 pixels. The reconstructed 3D images had an isotropic voxel size of 7.999 µm. Cross-sectional surface images of the tooth specimens were obtained using dedicated software (3D.SUITE, Bruker, Germany).
2.3. Quantitative Light-Induced Fluorescence Digital (QLFD) Analysis
The cross-sectional surfaces were imaged under QLF-digital (QLFD, 2+Biluminator™; Inspektor Research Systems BV, Amsterdam, the Netherlands) with all external light blocked and against a black background. The imaging conditions for blue light were set to ISO 1600, a shutter speed of 1/20 s, and an aperture value of 8.0.
2.4. Generation of a Standardized Grayscale Intensity Profile
Image analysis was performed using ImageJ software (version 1.54k, National Institutes of Health, MD, USA). Grayscale intensity profiles across the enamel region were obtained as plot profiles, starting from the black background above the enamel surface, passing through the enamel surface and EDC regions, and extending to areas considered sound enamel. The same regions of interest were selected and analyzed on both µCT and QLFD images. To standardize the profiles, the grayscale intensity in the black background was set to 0, and the maximum brightness in the sound enamel region was set to 100. These values were used to reconstruct standardized profiles, with the grayscale intensity plotted on the vertical axis and enamel depth plotted on the horizontal axis, using the tooth surface as the baseline. As a result, the enamel depths corresponding to specific grayscale intensity thresholds of 90% and 95% were measured on both µCT and QLFD images.
2.5. Statistical Analysis
A paired t-test was conducted to compare the mean enamel depths (ED) corresponding to 90% grayscale intensity values obtained from µCT (90% EDµCT) and QLFD (90% EDQLFD). Differences in the mean values of 90% EDµCT and 90% EDQLFD across demineralization periods were analyzed using one-way ANOVA followed by Tukey's post hoc test. The same analyses were performed for the enamel depths corresponding to 95% grayscale intensity values obtained from µCT (95% EDµCT) and QLFD (95% EDQLFD). The correlations among 90% EDµCT, 90% EDQLFD, 95% EDµCT, and 95% EDQLFD were evaluated using Pearson correlation analysis. Simple linear regression analyses were performed with EDQLFD as the independent variable and EDµCT as the dependent variable. All statistical analyses were conducted using IBM SPSS Statistics version 29.0 (IBM Corp., Armonk, NY, USA), and a p-value of less than 0.05 was considered statistically significant.
3. Results
3.1. Comparison of Enamel Depth at 90% Grayscale Intensity
As the demineralization period increased from 10 to 70 days, both 90% ED
QLFD and 90% ED
µCT showed a significant increase (p<0.001). Across all demineralization periods, 90% ED
QLFD consistently demonstrated greater values than 90% ED
µCT. After 10 days of demineralization, 90% ED
QLFD was 0.249 ± 0.054 mm, while 90% ED
µCT was 0.181 ± 0.054 mm. After 70 days, 90% ED
QLFD increased to 0.443 ± 0.087 mm, and 90% ED
µCT increased to 0.339 ± 0.069 mm (
Table 1).
3.2. Comparison of Enamel Depth at 95% Grayscale Intensity
Both 95% ED
QLFD and 95% ED
µCT significantly increased as the demineralization period lengthened (p<0.001). Across all demineralization periods, 95% ED
QLFD consistently showed higher values than 95% ED
µCT. For instance, after 10 days of demineralization, 95% ED
QLFD was 0.284 ± 0.062 mm, while 95% ED
µCT was 0.208 ± 0.054 mm. After 70 days, 95% ED
QLFD increased to 0.473 ± 0.086 mm, and 95% ED
µCT increased to 0.382 ± 0.074 mm (
Table 2).
3.3. Correlation Between EDµCT and EDQLFD
Strong positive correlations were observed between ED
µCT and ED
QLFD at both 90% and 95% grayscale intensity values (r=0.836–0.962, p<0.001). The correlation was slightly higher between 90% ED
µCT and 90% ED
QLFD (r=0.903) compared to 95% ED
µCT and 95% ED
QLFD (r=0.849,
Table 3).
3.4. Linear Regression Analysis
At the 90% grayscale intensity threshold, the regression model showed an R² value of 0.797, indicating that 90% ED
QLFD had a strong influence on 90% ED
µCT. The regression equation was Y = 0.782X - 0.007 (where Y represents 90% ED
µCT and X represents 90% ED
QLFD). The Durbin-Watson value was 1.900, indicating no autocorrelation and independence of residuals. The model's goodness of fit was significant, with an F-value of 761.098 and a p-value < 0.001, demonstrating that the regression equation was statistically significant. Similar results were observed at the 95% grayscale intensity threshold. The R² value was 0.720, and the regression equation was calculated as Y = 0.741X + 0.015. Both models yielded statistically significant results (p<0.001). The Durbin-Watson value was 1.826, and the model's goodness of fit was significant, with an F-value of 499.361 and a p-value < 0.001, confirming the statistical significance of the regression equation (
Table 4).
4. Discussion
This study aimed to evaluate mineral loss in transverse sections of EDC using QLFD and to validate the analytical reliability of QLFD by comparing it with µCT. The analytical approach used in this study is distinct from previous research, as it focuses on transverse sections of teeth.
To assess the maximum depth of EDC, artificially formed on the enamel and extending to areas considered sound enamel, 90% and 95% thresholds were established, as referenced in previous studies [
14,
15]. Significant correlations were observed between QLFD and µCT at both thresholds (r = 0.836–0.962, p<0.001). Furthermore, a significant regression equation was identified between 90% ED
QLFD and 90% ED
µCT, indicating that for every unit increase in 90% ED
QLFD, 90% ED
µCT decreased by 0.782. Similarly, for 95% ED
QLFD, a unit increase corresponded to a decrease of 0.741 in 95% ED
µCT. In both cases, the standardized beta coefficients were 0.903 and 0.849, respectively, indicating a strong influence of the independent variable, QLFD, on µCT measurements. These findings validate the effectiveness of QLFD in assessing mineral loss in transverse sections of EDC.
Most previous studies on QLFD have focused on validating its utility as a clinical research tool for surface-level analysis of EDC [
5,
8,
9,
10,
11]. In earlier research utilizing QLF, the mineral loss in early caries lesions was assessed, and both artificial and natural lesions were reported to exhibit a linear relationship between fluorescence loss and mineral loss [
11]. The slope of this relationship indicated that a 10% fluorescence loss corresponded to a mineral loss of 0.15 kg·m⁻² [
11]. Other studies evaluated the sensitivity and specificity of QLFD for caries detection, demonstrating that fluorescence loss data accurately reflect lesion depth and mineral status [
10]. Additionally, numerous studies have reported that QLFD analysis of the tooth surface reflects the depth of EDC [
9,
16,
17,
18]. Although prior QLFD studies primarily focused on surface-level analysis, the linear relationship identified in this study between mineral loss measured by µCT and ED
QLFD values in transverse sections is consistent with previous findings.
µCT is a high-resolution imaging tool capable of precisely evaluating the depth of early caries lesions in three dimensions and is considered a viable alternative to TMR. However, its high cost and time-intensive analysis process limit its practical applicability in clinical settings. In contrast, QLF-D offers simplicity and cost-effectiveness. This study aimed to validate the quantitative assessment of lesion progression and depth in transverse sections of EDC. The strong correlation observed between EDQLFD and EDµCT underscores the potential of QLFD as a practical tool for quantitative evaluation of EDC lesions in experimental environments.
This study was conducted on artificially induced EDC lesions. Therefore, future research should assess the validity of QLF for naturally occurring EDC lesions in extracted human teeth, encompassing various tooth types and lesion locations.
5. Conclusions
This study demonstrated that QLFD is a suitable and practical alternative to µCT for assessing EDC in laboratory settings, providing a reliable method for quantitative evaluation of lesion depth and progression.
Data Availability Statement
Acknowledgments
This work was supported by the National Research Foundation of Korea (NRF) grant funded by the Korean government (MSIT) (Grant Number: 2022R1G1A1002888).
Conflicts of Interest
The author declares no conflicts of interest.
Abbreviations
The following abbreviations are used in this manuscript:
| EDC |
Early dental caries |
| TMR |
Transverse microradiography |
| QLF |
Quantitative light-induced fluorescence |
| QLFD |
Quantitative light-induced fluorescence-digital |
| µCT |
Micro-computed tomography |
| ED |
Enamel depth |
| 90% EDµCT |
Enamel depth at 90% grayscale intensity values obtained from µCT |
| 90% EDQLFD |
Enamel depth at 90% grayscale intensity values obtained from QLFD |
| 95% EDµCT |
Enamel depth at 95% grayscale intensity values obtained from µCT |
| 95% EDQLFD |
Enamel depth at 95% grayscale intensity values obtained from QLFD |
References
- Silverstone, L.M. Remineralization phenomena. Caries Res. 1977, 11, 59–84. [Google Scholar] [CrossRef] [PubMed]
- Lippert, F.; Lynch, R.J.M. Comparison of knoop and vickers surface microhardness and transverse microradiography for the study of early caries lesion formation in human and bovine enamel. Arch. Oral Biol. 2014, 59, 704–710. [Google Scholar] [CrossRef] [PubMed]
- Braga, A.S.; Meißner, T.; Schulz-Kornas, E.; Haak, R.; Magalhães, A.C.; Esteves-Oliveira, M. Enamel caries lesion depth obtained by optical coherence tomography and transverse microradiography: A comparative study. Caries Res. 2024, 58, 502–510. [Google Scholar] [CrossRef] [PubMed]
- Hamba, H.; Nikaido, T.; Sadr, A.; Nakashima, S.; Tagami, J. Enamel lesion parameter correlations between polychromatic micro-CT and TMR. J. Dent. Res. 2012, 91, 586–591. [Google Scholar] [CrossRef] [PubMed]
- Abdelaziz, M. Detection, diagnosis, and monitoring of early caries: The future of individualized dental care. Diagnostics 2023, 13, 3649. [Google Scholar] [CrossRef] [PubMed]
- Gomez, J. Detection and diagnosis of the early caries lesion. BMC Oral Health 2015, 15 Suppl 1, S3. [Google Scholar] [CrossRef]
- Min, J.H. Assessment of early dental caries by using optical coherence tomography. J. Dent. Hyg. Sci. 2016, 16, 257–262. [Google Scholar] [CrossRef]
- Amaechi, B.T.; Higham, S.M. Quantitative light-induced fluorescence: A potential tool for general dental assessment. J. Biomed. Opt. 2002, 7, 7–13. [Google Scholar] [CrossRef] [PubMed]
- Ando, M.; Ferreira-Zandoná, A.G.; Eckert, G.J.; Zero, D.T.; Stookey, G.K. Pilot clinical study to assess caries lesion activity using quantitative light-induced fluorescence during dehydration. J. Biomed. Opt. 2017, 22, 35005. [Google Scholar] [CrossRef] [PubMed]
- Oh, S.H.; Lee, S.R.; Choi, J.Y.; et al. Detection of dental caries and cracks with quantitative light-induced fluorescence in comparison to radiographic and visual examination: A retrospective case study. Sensors 2021, 21, 1741. [Google Scholar] [CrossRef] [PubMed]
- Angmar-Månsson, B.; Ten Bosch, J.J. Quantitative light-induced fluorescence (QLF): A method for assessment of incipient caries lesions. Dentomaxillofac. Radiol. 2001, 30, 298–307. [Google Scholar] [CrossRef] [PubMed]
- PubMed. Available online: https://pubmed.ncbi.nlm.nih.gov/?term=Quantitative+Light-+induced+Fluorescence (accessed on January 10, 2025).
- White, D.J. Use of synthetic polymer gels for artificial carious lesion preparation. Caries Res. 1987, 21, 228–242. [Google Scholar] [CrossRef] [PubMed]
- Nakata, K.; Nikaido, T.; Nakashima, S.; Nango, N.; Tagami, J. An approach to normalizing micro-CT depth profiles of mineral density for monitoring enamel remineralization progress. Dent. Mater. J. 2012, 31, 533–540. [Google Scholar] [CrossRef] [PubMed]
- Kielbassa, A.M.; Wrbas, K.T.; Schulte-Mönting, J.; Hellwig, E. Correlation of transversal microradiography and microhardness on in situ-induced demineralization in irradiated and nonirradiated human dental enamel. Arch. Oral Biol. 1999, 44, 243–251. [Google Scholar] [CrossRef] [PubMed]
- Kim, M.; Lee, S.; Lee, N. Diagnosis of early dental caries with dye-enhancing quantitative light-induced fluorescence (QLF). J. Korean Acad. Pediatr. Dent. 2015, 42, 218–225. [Google Scholar] [CrossRef]
- Kim, Y.S. Evaluation of detection ability of a quantitative light-induced fluorescence digital device for initial secondary caries lesion. J. Dent. Hyg. Sci. 2017, 17, 116–122. [Google Scholar] [CrossRef]
- Cho, K.H.; Kang, C.; Jung, H.; Lee, T.Y.; Song, J.S. Assessment of the caries detection ability of quantitative light-induced fluorescence (QLF) in primary teeth in vitro. J. Korean Acad. Pediatr. Dent. 2022, 49, 65–75. [Google Scholar] [CrossRef]
|
Disclaimer/Publisher’s Note: The statements, opinions and data contained in all publications are solely those of the individual author(s) and contributor(s) and not of MDPI and/or the editor(s). MDPI and/or the editor(s) disclaim responsibility for any injury to people or property resulting from any ideas, methods, instructions or products referred to in the content. |
© 2025 by the authors. Licensee MDPI, Basel, Switzerland. This article is an open access article distributed under the terms and conditions of the Creative Commons Attribution (CC BY) license (http://creativecommons.org/licenses/by/4.0/).