Submitted:
14 January 2025
Posted:
15 January 2025
You are already at the latest version
Abstract
Accurately predicting tree growth is crucial for sustainable forest management and addressing climate-related impacts on ecosystems. This study explores the use of Long Short-Term Memory (LSTM) neural networks to forecast the Diameter at Breast Height (DIA) for white oak and red oak trees in Missouri, USA, which is a key indicator of tree health, growth, and timber value. Using historical data from 1999 to 2020 for training and 2021 data for validation, the model demonstrated its capability to capture growth patterns effectively. Results revealed that the LSTM model achieved higher predictive accuracy for white oak, attributed to its more consistent growth trends, whereas red oak predictions were influenced by greater sensitivity to environmental variability. These findings emphasize the potential of LSTM models in forestry analytics providing detailed insights into species-specific growth dynamics and supporting enhanced forest resource monitoring and management. The study contributes to advancing machine learning applications in forestry by showcasing how LSTM networks can address challenges in predicting tree growth across diverse species and environmental conditions. This research highlights the transformative role of data-driven models in fostering sustainable forest management practices and improving decision-making processes in the face of ecological and climate uncertainties.
Keywords:
LSTM Neural Network
; Diameter at Breast Height (DIA)
; White Oak
; Red Oak
; DIA Forecast
1. Introduction
Forests play a critical role in the global ecosystem by regulating the climate, storing carbon and providing habitats for the countless wildlife [1]. Oak forests contribute significantly to the environment by preventing soil erosion, sustaining biodiversity and offering a renewable source of timber [2,3]. White Oak and Red Oak trees are especially important because of their widespread use in industries like construction and furniture making.
However, oak forests face growing challenges from both natural and human-made threats. Diseases like oak wilt and changing climate conditions are major concerns [4]. Climate change has led to more severe droughts, which increase tree mortality, especially in areas already under environmental stress [5,6]. Studies indicate that drought-induced mortality in oak forests is becoming more frequent, impacting the health and stability of these ecosystems [7,8].
A significant issue is oak decline which has become a pressing concern in regions like the Ozark Highlands, where tree mortality rates have risen sharply [9]. Red oaks are particularly vulnerable as they are more susceptible to pests and environmental stressors, often leading to sudden tree deaths. On the other hand, white oak exhibits stable growth patterns, which make them easier for predictive modeling. In addition, to pests and climate factors, the soil characteristics play a significant role in oak decline [10]. Soil texture and water availability can directly affect the health and stand density of oak trees. The soil related stressors combined with biotic pressures such as pests and pathogens can further intensify oak decline particularly in dense forest stands [11,12].
Forest management practices such as prescribed burning have been implemented to promote oak regeneration, but their effectiveness varies depending on species and regional conditions [13,14]. While fire and other silvicultural practices can help maintain forest health, more research is needed to optimize these approaches [15].
Machine learning, especially Long Short-Term Memory (LSTM) networks, has emerged as a promising tool for predicting forest dynamics and growth patterns [16,17]. Traditional statistical models like linear regression struggle to capture non-linear relationships in environmental data). LSTMs, on the other hand, excel at handling time-series data with long-term dependencies [18,19].
One key metric in forest management is the diameter at breast height (DIA) of trees. It refers to the diameter of a tree’s trunk which is typically measured at 1.3 meters (4.5 feet) above ground level, which provides insights into tree growth, health, and timber value [20]. Accurate DIA predictions enable forest managers to make informed decisions about conservation efforts, timber harvesting, and land management. This study aims to improve the accuracy of DIA forecasts for white and red oaks by applying LSTM models to annual growth data.
The DIA of oak trees varies across regions due to differences in environmental conditions, competition, and forest disturbances [21]. Red oak trees tend to have more variable growth patterns compared to white oak, making it harder to model their development accurately [22]. By Incorporating environmental variables such as soil type, rainfall, and temperature, the predictive power of the models can be enhanced.
LSTM models offer a significant advantage over traditional models by retaining information over time, which is especially useful in forecasting forest growth [23]. The ability to capture temporal dependencies enables LSTM networks to uncover complex relationships in historical data that might otherwise remain hidden. This study focuses on using LSTM models to predict the DIA of white and red oaks in Missouri. By doing so, it aims to provide valuable insights for forest managers, helping them maintain healthy oak populations and improve forest management practices for the future.
1.1. Overview of Neural Networks
Neural networks draw inspiration from the structure and functioning of the brain. They consist of layers of nodes, known as neurons, that process input data to produce an output. Each connection between neurons is given a weight that signifies its significance in making predictions. During training, these weights are adjusted by the network to reduce the error between predicted and actual results. Various kinds of networks are tailored for specific data types and tasks. Feedforward neural networks, the basic type, process data in a linear manner from input to output. However, they are less effective for tasks where the order of data points matters like in time series forecasting.
Recurrent Neural Networks (RNNs) are designed to handle data where the sequence of data points is crucial. Unlike feedforward networks RNNs incorporate loops that enable them to remember inputs making them well suited for tasks such as natural language processing and time series forecasting. Long Short-Term Memory (LSTM) networks represent a form of RNNs created to address issues faced by traditional RNNs like the vanishing gradient problem that impedes learning long term dependencies. LSTMs achieve this by incorporating a memory system that can retain data across extended sequences, which proves highly efficient for activities such as forecasting the growth of trees, where historical data plays a crucial role, in determining growth patterns.
1.2. Objective
This study focuses on the growth patterns of white and red oak trees across various counties in Missouri, which is a state chosen for its extensive oak population and diverse climatic conditions. The primary objective of this study is to analyze the growth patterns of white and red oak trees across various counties in Missouri and develop a predictive framework for estimating the Diameter at Breast Height (DIA) of these species. The study aims to leverage advanced machine learning techniques to improve the accuracy of growth predictions and explore the impact of incorporating environmental factors such as soil type, rainfall, and temperature on predictive performance.
This research hypothesizes that Long Short-Term Memory (LSTM) neural networks will outperform traditional statistical models, such as linear regression and ARIMA, in predicting DIA due to their ability to capture complex temporal and nonlinear dependencies in growth patterns. Furthermore, it is hypothesized that including environmental variables alongside historical growth data will significantly enhance the accuracy and reliability of the predictions, demonstrating the importance of ecological factors in tree growth modeling.
2. Materials and Methods
2.1. Study Area
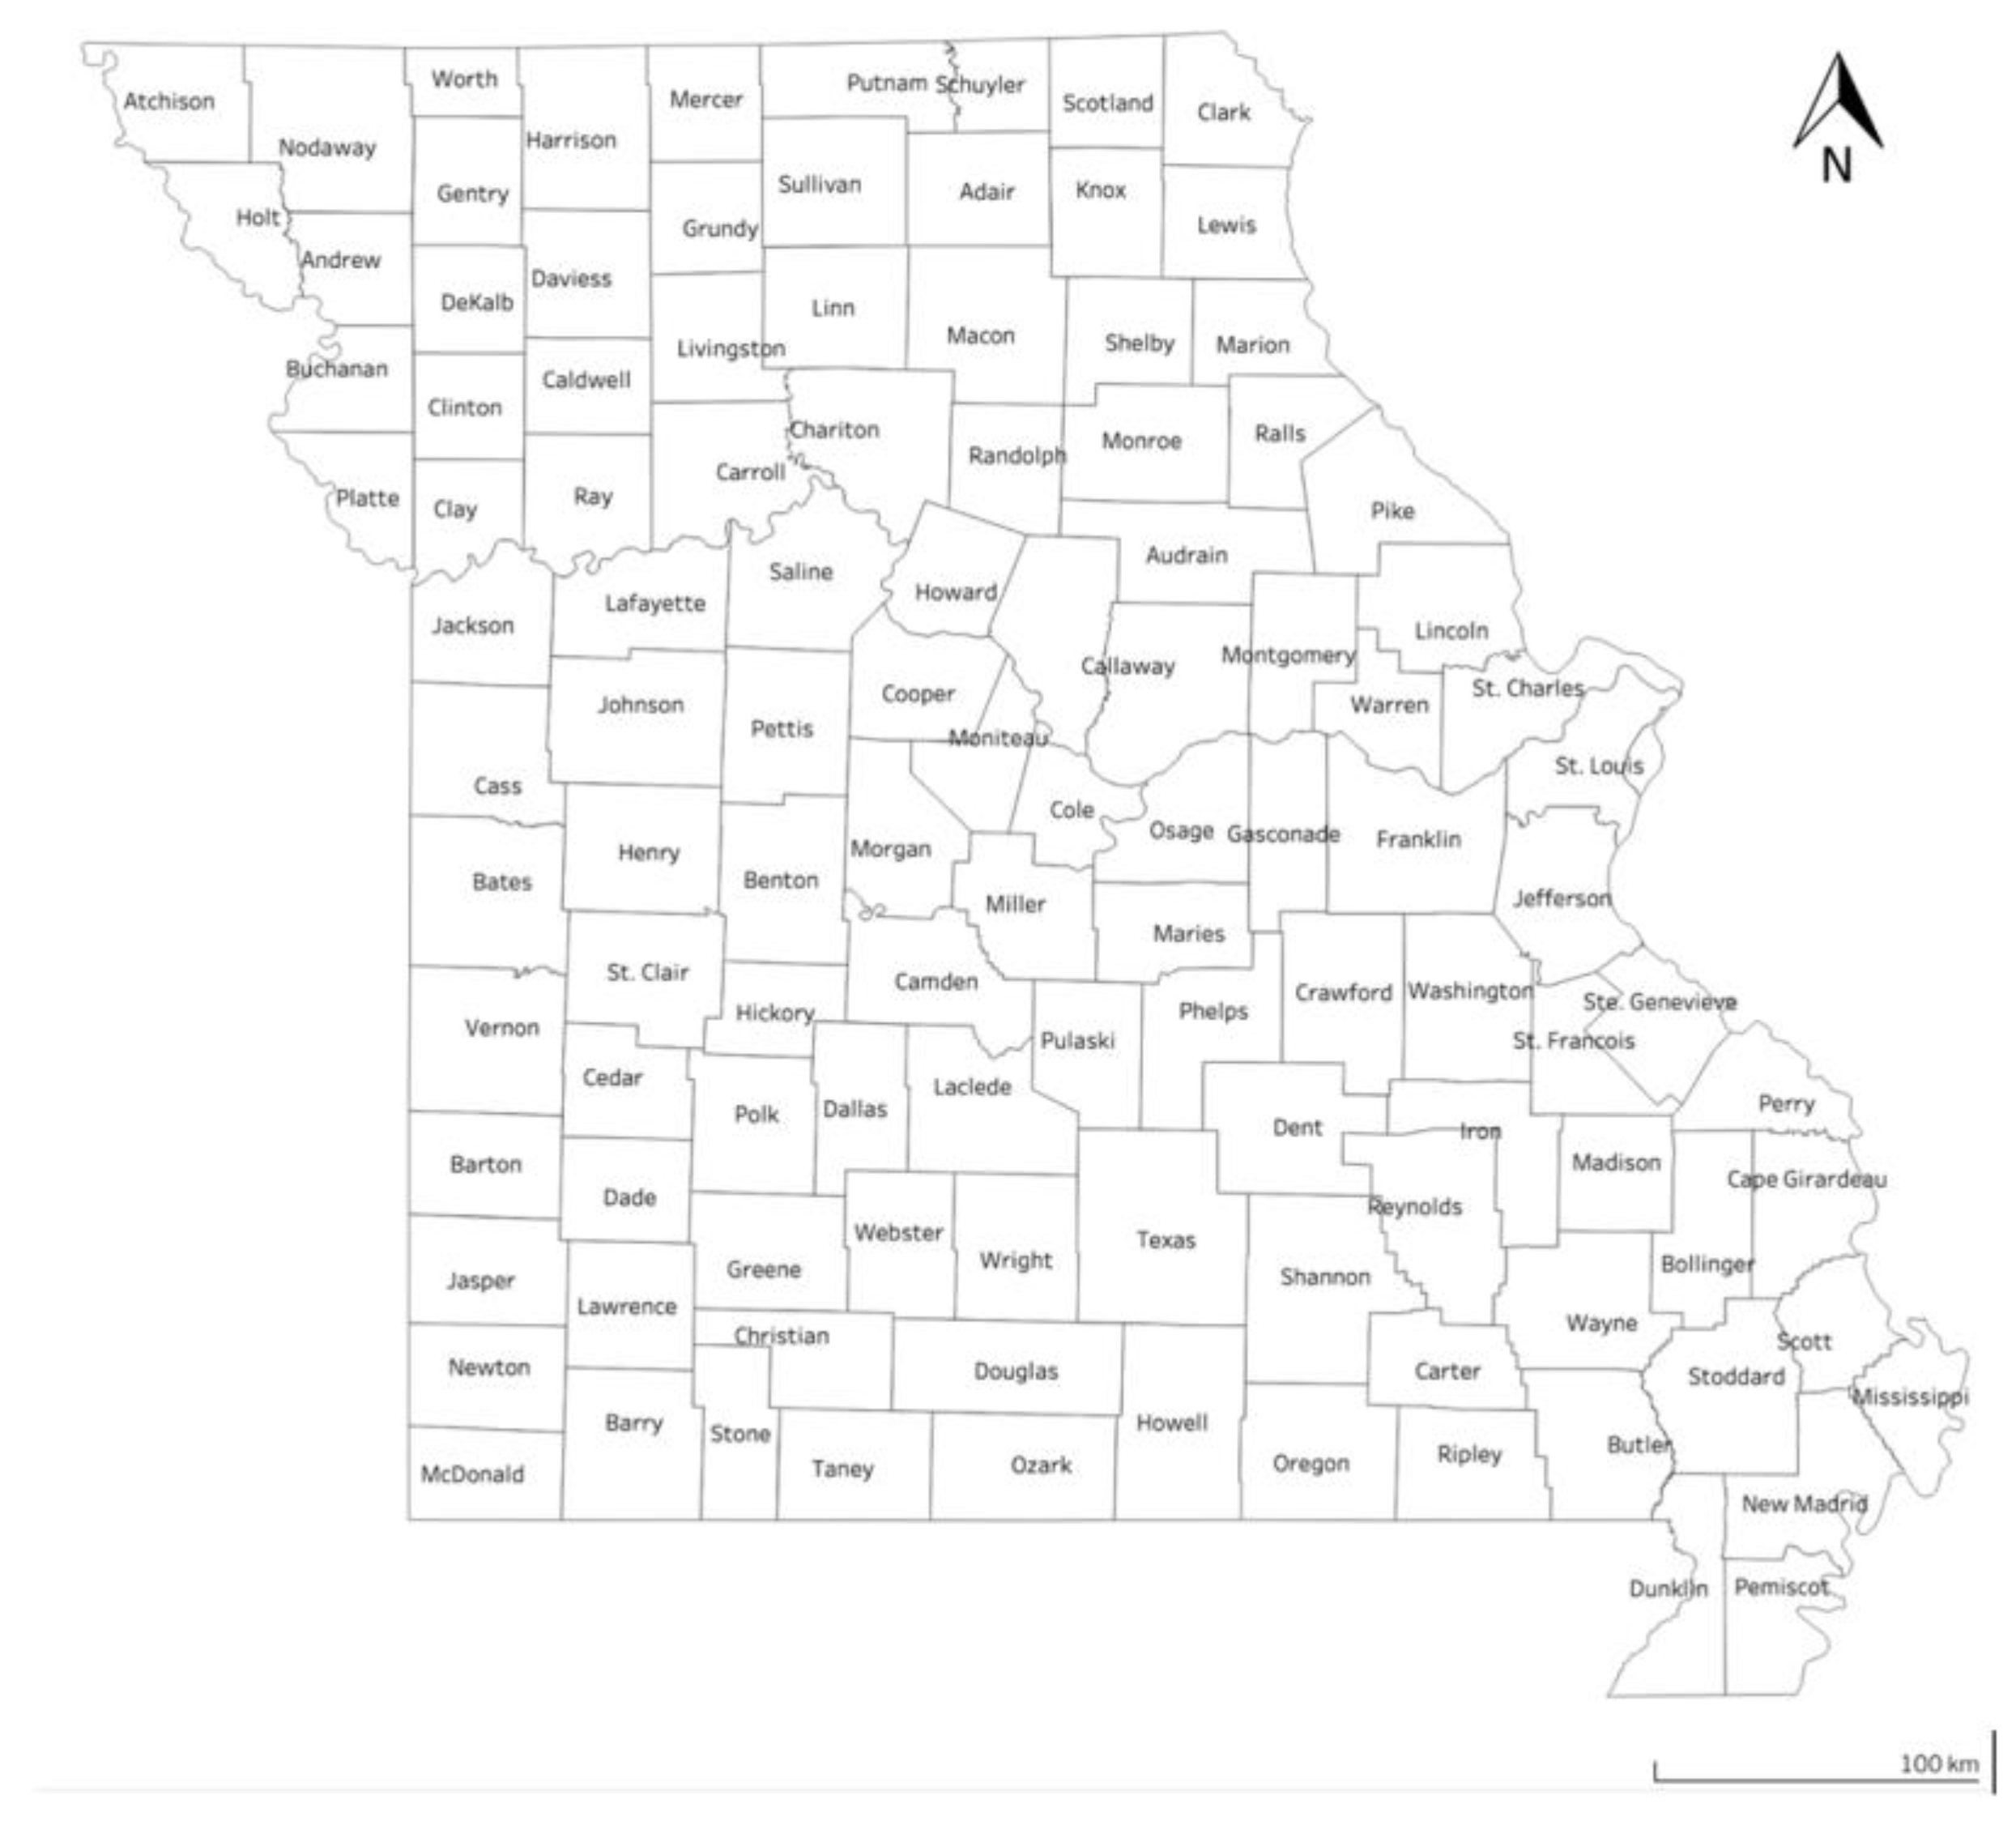
Our study area consists of Missouri state, which is in the mid-west region of USA. We chose this study area because Missouri is an ideal location for analyzing oak species due to its representative environmental conditions, which include variations in soil types, precipitation levels and temperatures across the state. The range of climate and geographic conditions in Missouri supports a mix of white and red oak forests, each with unique growth characteristics that vary by local environmental factors. By selecting Missouri as the study area this research captures a comprehensive dataset that accurately reflects how these trees respond to environmental variability across different regions of the state.
We selected white and red oaks because they are both ecologically and economically significant, but their growth dynamics differ due to physiological and environmental sensitivities. White oak trees (Quercus alba) are recognized for their adaptability and stable growth patterns, thriving in a variety of soils and environmental settings [24]. This adaptability makes white oaks resilient to moderate drought and climate fluctuations, thus providing reliable forest cover, reducing soil erosion, and supporting local wildlife [25]. Conversely, red oak species, including northern red oak (Quercus rubra) and black oak (Quercus velutina) exhibit a higher sensitivity to environmental stressors such as drought, pest infestations and disease outbreaks [26]. This susceptibility affects red oak populations and growth consistency, especially in regions with variable water availability and pest pressure.
The distinct responses of these oak species to environmental changes highlight the need for species-specific predictive models that can account for these differences in growth dynamics. Missouri’s diverse oak population with its varied responses to environmental factors provides an ideal case study for predictive modeling. By focusing on Missouri's unique oak ecosystem, this research aims to enhance understanding of species-specific growth patterns in relation to climate variability. The insights gained from this study can contribute to forest management strategies that anticipate the impacts of environmental change on forest dynamics, ensuring the preservation of these valuable oak populations and the ecological and economic benefits they provide.
Figure 1.
Missouri state outline map with counties.
2.2. Data Acquisition and Processing
The dataset for this study was acquired from the Forest Inventory and Analysis data compiled by USDA Forest Service providing DIA measurements for white oak and red oak trees from 1999 to 2021 [27,28]. This dataset includes comprehensive forest attributes supplemented with environmental variables such as soil type, rainfall, and temperature data, which are critical for understanding growth patterns in these tree species [29,30]. The data was collected across various Missouri counties. This dataset reflects the state’s diverse environmental conditions offering a rich base for model training and validation that captures both geographic locations and temporal variability. However, the locations of white and red oak trees within the plot system are recorded within one mile of its actual positions to protect the privacy of landowners [31].
The dataset contains various forest attributes, current diameter (DIA), species code (SPCD) and survey years across various counties. The data was filtered to include white oak trees (SPCD 802) and red oak trees (SPCD 812, 813, and 833) species code. We used the aggregate DIA by county and year from 1999 to 2020 [32]. Data Analysis was conducted using Python employing TensorFlow and scikit-learn libraries for model training and evaluation.
The data focuses on identifying tree species such as white oak and red oak using the species code (SPCD). DIA serves as the target variable for the prediction. It includes year and county which enables tracking of DIA overtime. Also, Environmental variables like soil type, annual precipitation, average temperature and other conditions to better understand the influence of these variables on tree growth.
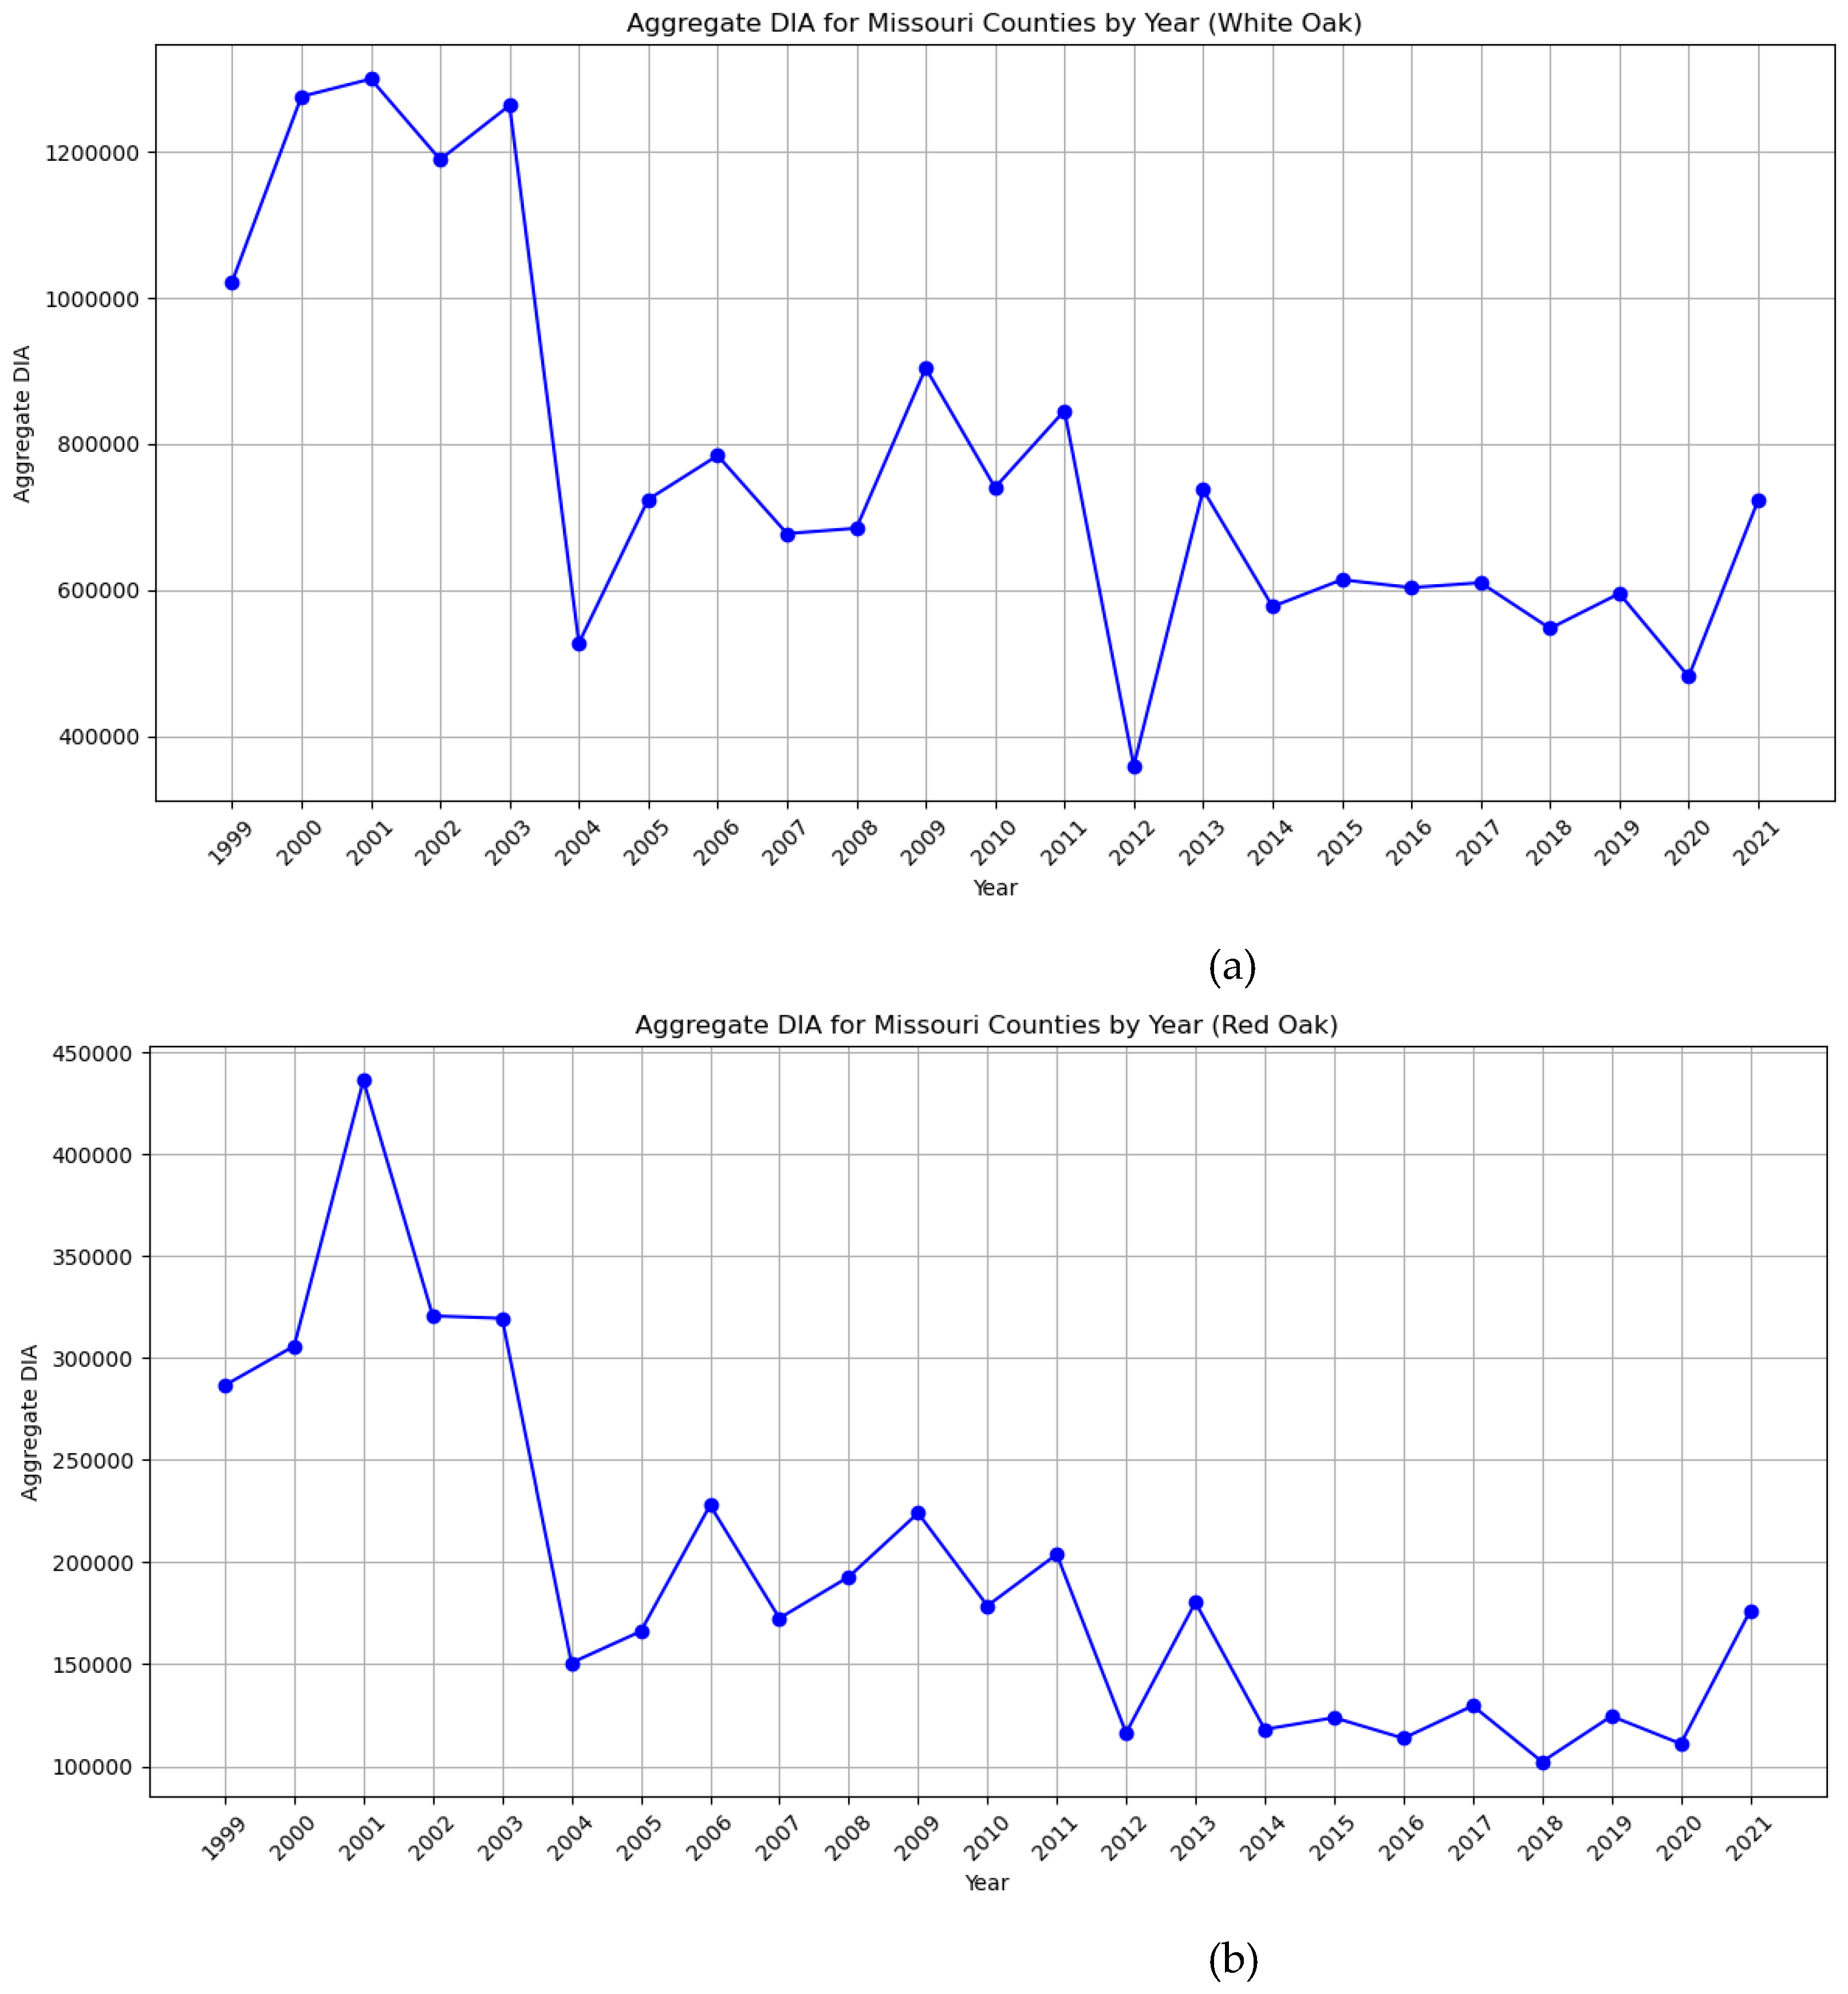
Figure 2.
This figure depicts the Aggregated DIA for White Oak and Red Oak from 1999 to 2021: (a) It depicts the total aggregate DIA (in cm) for white oak from the year 1999 to 2021. X-axis represents the Year & Y-axis represents the Aggregated DIA (in cm); (b) It depicts the total aggregate DIA (in cm) for red oak from the year 1999 to 2021. X-axis represents the Year & Y-axis represents the Aggregated DIA (in cm).
2.3. Model Implementation
2.3.1. Model Architecture
The LSTM neural network architecture developed for predicting the DIA of oak trees is tailored to handle time-series data, which is crucial for accurately capturing growth patterns in DIA over time. To perform data analysis and model training, Python was utilized, specifically leveraging essential libraries such as NumPy for numerical computations, Pandas for data manipulation, TensorFlow and Keras for building and training the LSTM model, Scikit-learn for data preprocessing and calculating performance metrics and Matplotlib for visualizing model performance and growth patterns.
The architecture begins with an input layer that processes lagged DIA values. These lagged values represent historical measurements, enabling the model to capture temporal dependencies and learn trends over the years effectively. The core of the model is composed of two Long Short-Term Memory (LSTM) layers, each with 128 hidden units. These LSTM layers allow the model to retain long-term dependencies, which is particularly important for tree growth prediction, as past data significantly impacts future growth. To prevent the model from overfitting the training data, a dropout layer with a 20% dropout rate is applied after the LSTM layers. This layer randomly deactivates neurons during training, which helps the model generalize better by preventing excessive reliance on specific patterns within the training data.
After the LSTM layers, the output is fed into a fully connected (dense) layer with 64 units, using a rectified linear activation function (ReLU). This dense layer introduces non-linearity, allowing the model to capture complex relationships within the data. A final dense layer with a single unit produces the DIA prediction, completing the architecture and delivering a single output that represents the forecasted diameter increment for a given year. This prediction is then compared to actual DIA values during training to guide the learning process through error minimization. Data standardization was performed based on the training set to ensure consistency and prevent data leakage. The model incorporates lagged DIA values as input features, where, for instance, a lag-1 feature reflects the DIA value of the previous year. This approach helps the model identify and learn from annual growth trends.
To optimize the model, the Adam optimizer was selected for its dynamic adjustment of learning rates, improving convergence efficiency and stability. The Mean Squared Error (MSE) was chosen as the loss function to measure the variance between predicted and actual DIA values, guiding the model’s parameter updates. Early stopping was also employed to monitor performance, halting training when no improvement was observed over a set patience threshold. This measure prevents overfitting and unnecessary computations, ensuring a balance between accuracy and generalizability.
The model was trained for up to 500 epochs with a batch size of 32, processing multiple training samples before each parameter update. To assess the model's accuracy, the 2021 test data was evaluated using MSE and R² metrics.
3. Results
3.1. Model Performance for White Oak
The LSTM model was trained on data from 1999 to 2020 and tested on data from 2021 to predict the DIA of white oak trees. The model's performance was evaluated using Mean Squared Error (MSE) and R-squared (R²) metrics, which are standard measures for assessing the accuracy and explanatory power of predictive models.
The model obtained an MSE of 9,659,823.0 on the white oak test dataset. The R-squared value of the model was 0.85 indicating that around 85% of the variation in DIA for white oak trees can be understood by the model. The residual unexplained variance implies that there are influences, such as environmental or biological factors affecting DIA, that are not considered by the model. Higher R² values signify model performance so this outcome indicates that while the model is effective there is still room for enhancement.
Figure 3 illustrates how well the model performed by comparing the DIA values with the actual DIA values for White Oak in 2021. The scatter plot shows that although the predictions align with the data there are clear deviations. At times, the model underestimates growth while in instances it overestimates it. This variability in accuracy could be attributed to factors such as changes or unique conditions specific to individual trees not fully accounted for by the model.
3.2. Model Performance for Red Oak
The LSTM model was also applied to predict the DIA of red oak trees using the same training and testing periods. However, the performance metrics indicate that the model was less successful in predicting DIA for red oaks compared to white oaks.
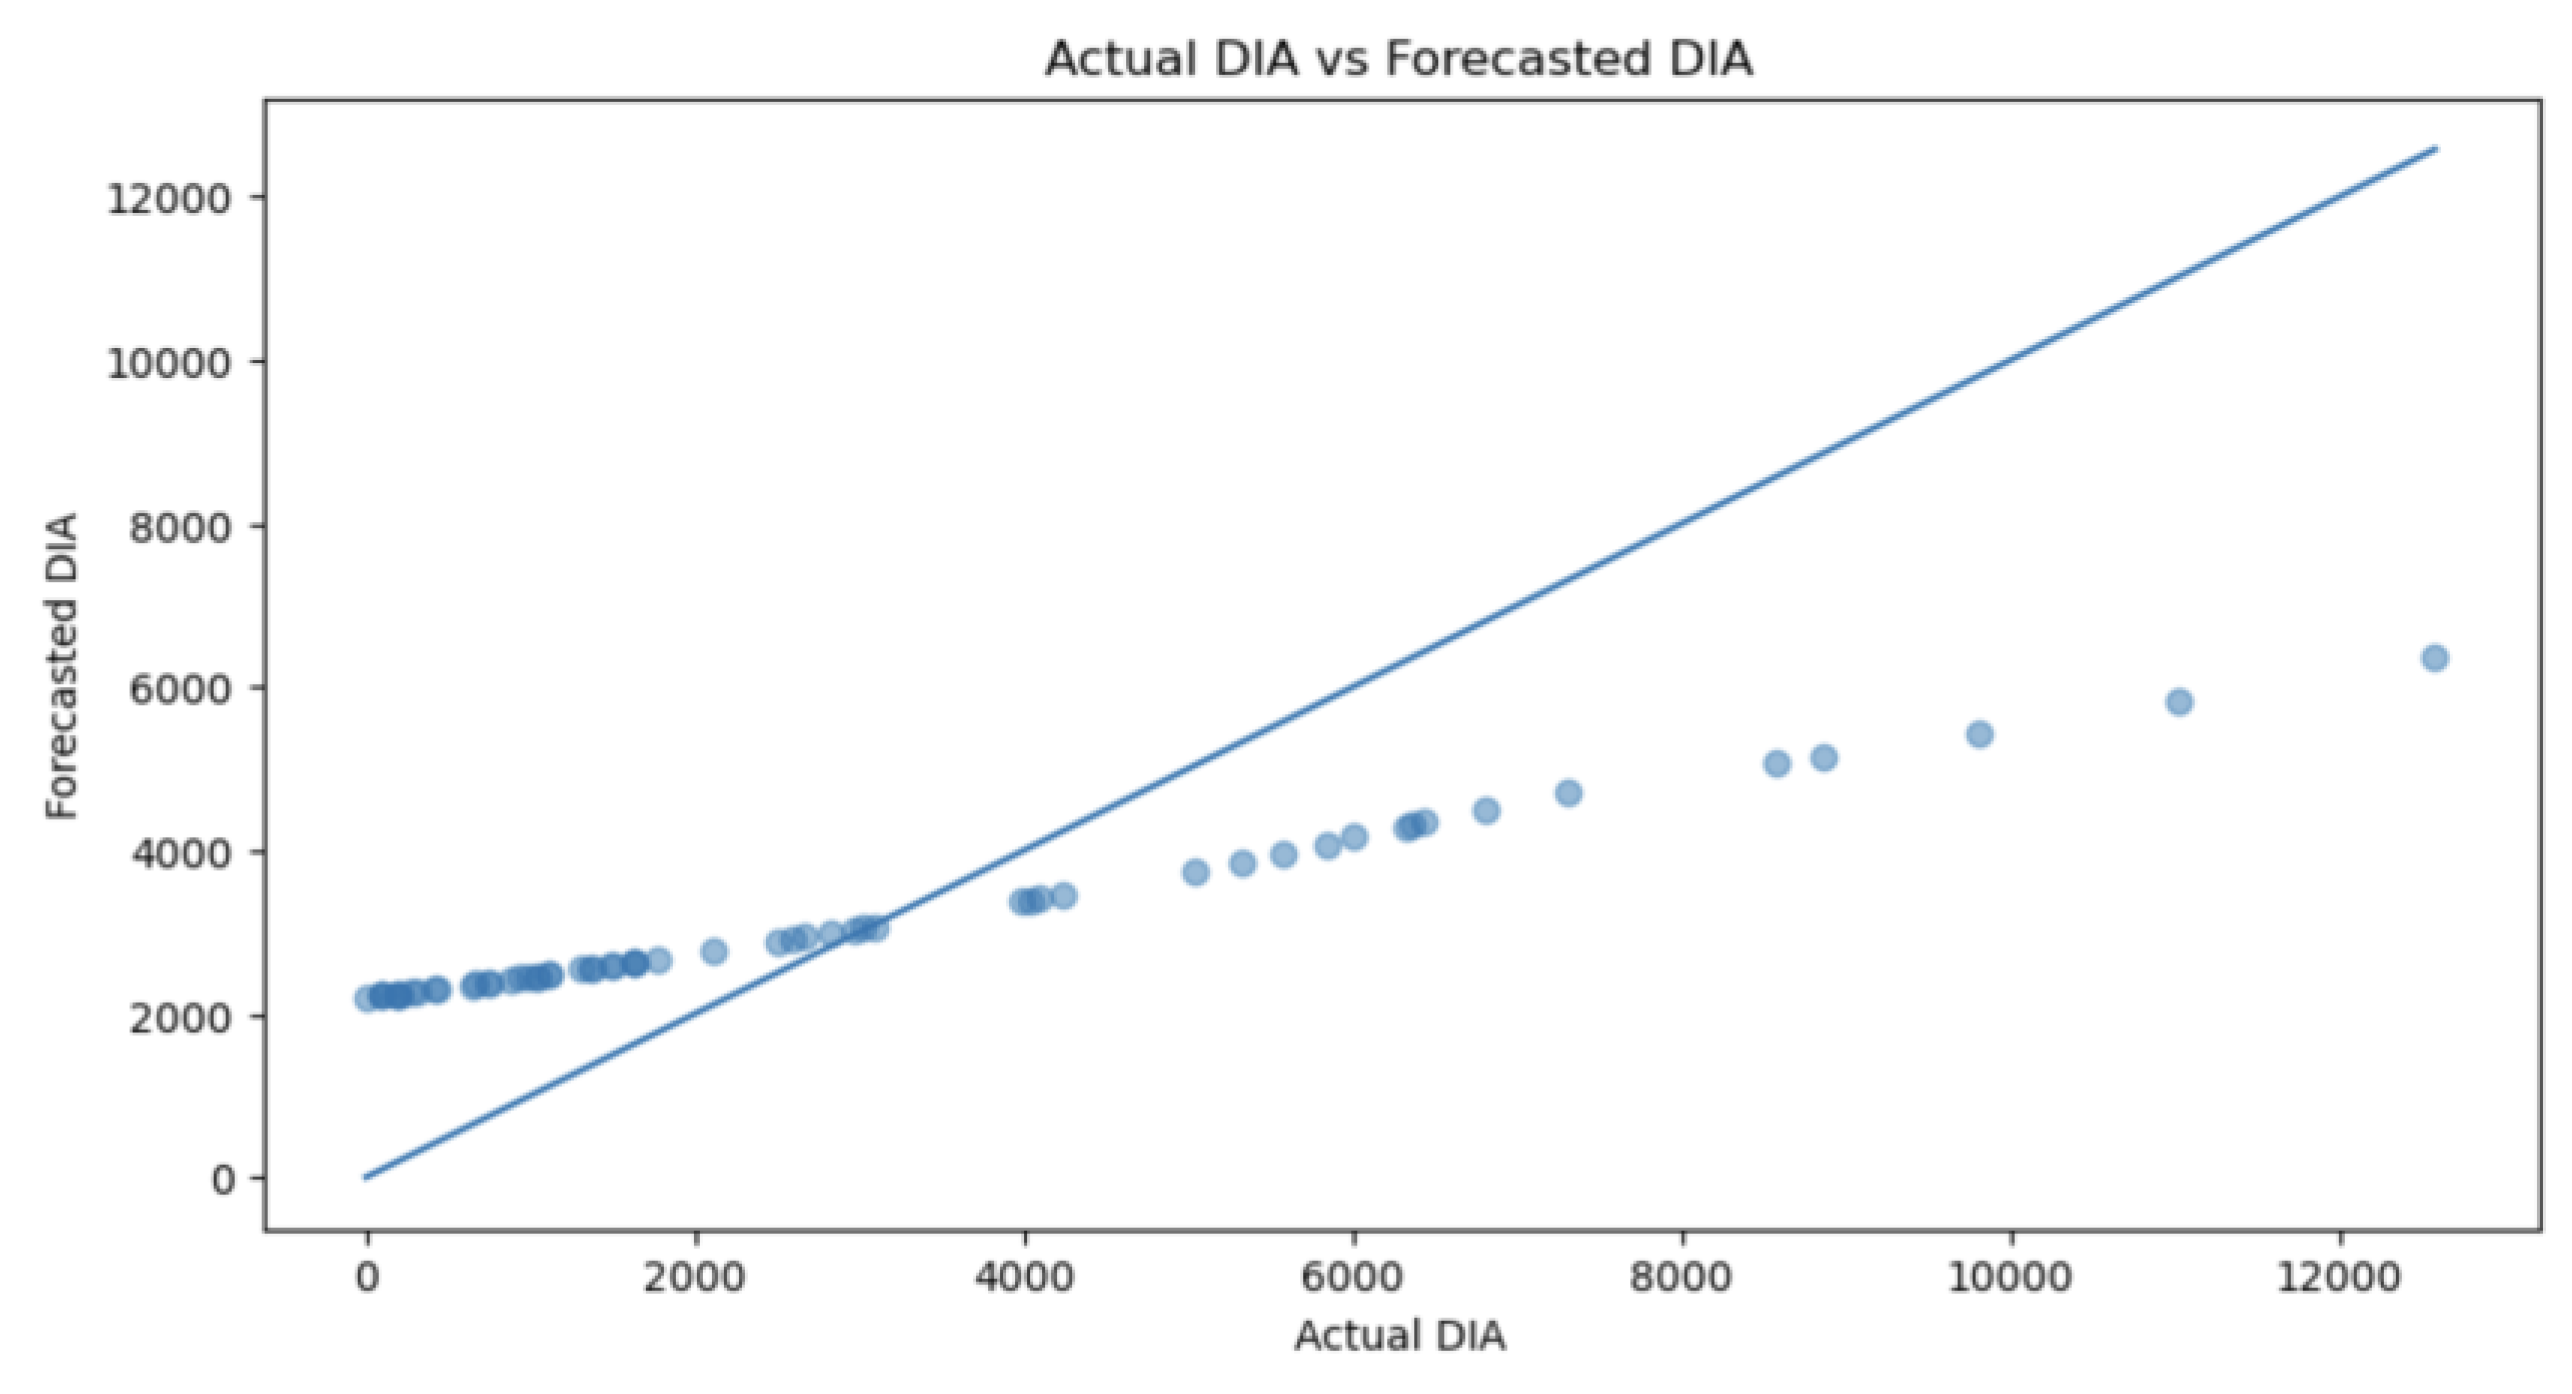
The model achieved an MSE of 4,018,403.0 for the red oak test data. While this MSE is lower than that for white oak, it should be noted that MSE values are not directly comparable across datasets with different scales and variances. The lower MSE here could be due to the overall smaller variance in the DIA of red oak trees in the dataset rather than better model performance. The model may be capturing the general growth trends but like white oak there is still significant error due to factors the model did not account for. The R² value for red oak was significantly moderate at 0.55. This suggests that the model explains 55% of the variance in DIA for red oak trees leaving 45% of the variance unexplained. This moderate R² value indicates that the model is not capturing the key drivers of growth for red oak trees as effectively as it does for white oaks. This could be due to differences in growth patterns between the two species or the influence of external factors that were not adequately captured by the model.
Figure 4 shows the comparison between the expected and observed DIA for Red oak trees in the year 2021. The scatter plot displays a spread of data points compared to the plot for white oaks suggesting that there is less agreement between the predicted values and the actual measurements. This variation in data points implies that the models forecast for oak trees are more erratic and less dependable, due to the intricate and unpredictable growth patterns specific to red oaks that were not accurately captured by the model.
3.3. Comparison with Actual Data for White Oak and Red Oak
To assess how useful the model is in practice we compared the LSTM model forecasts for 2021 with the DIA data collected during that year. This analysis helps us understand how accurately the model predicts real world outcomes.
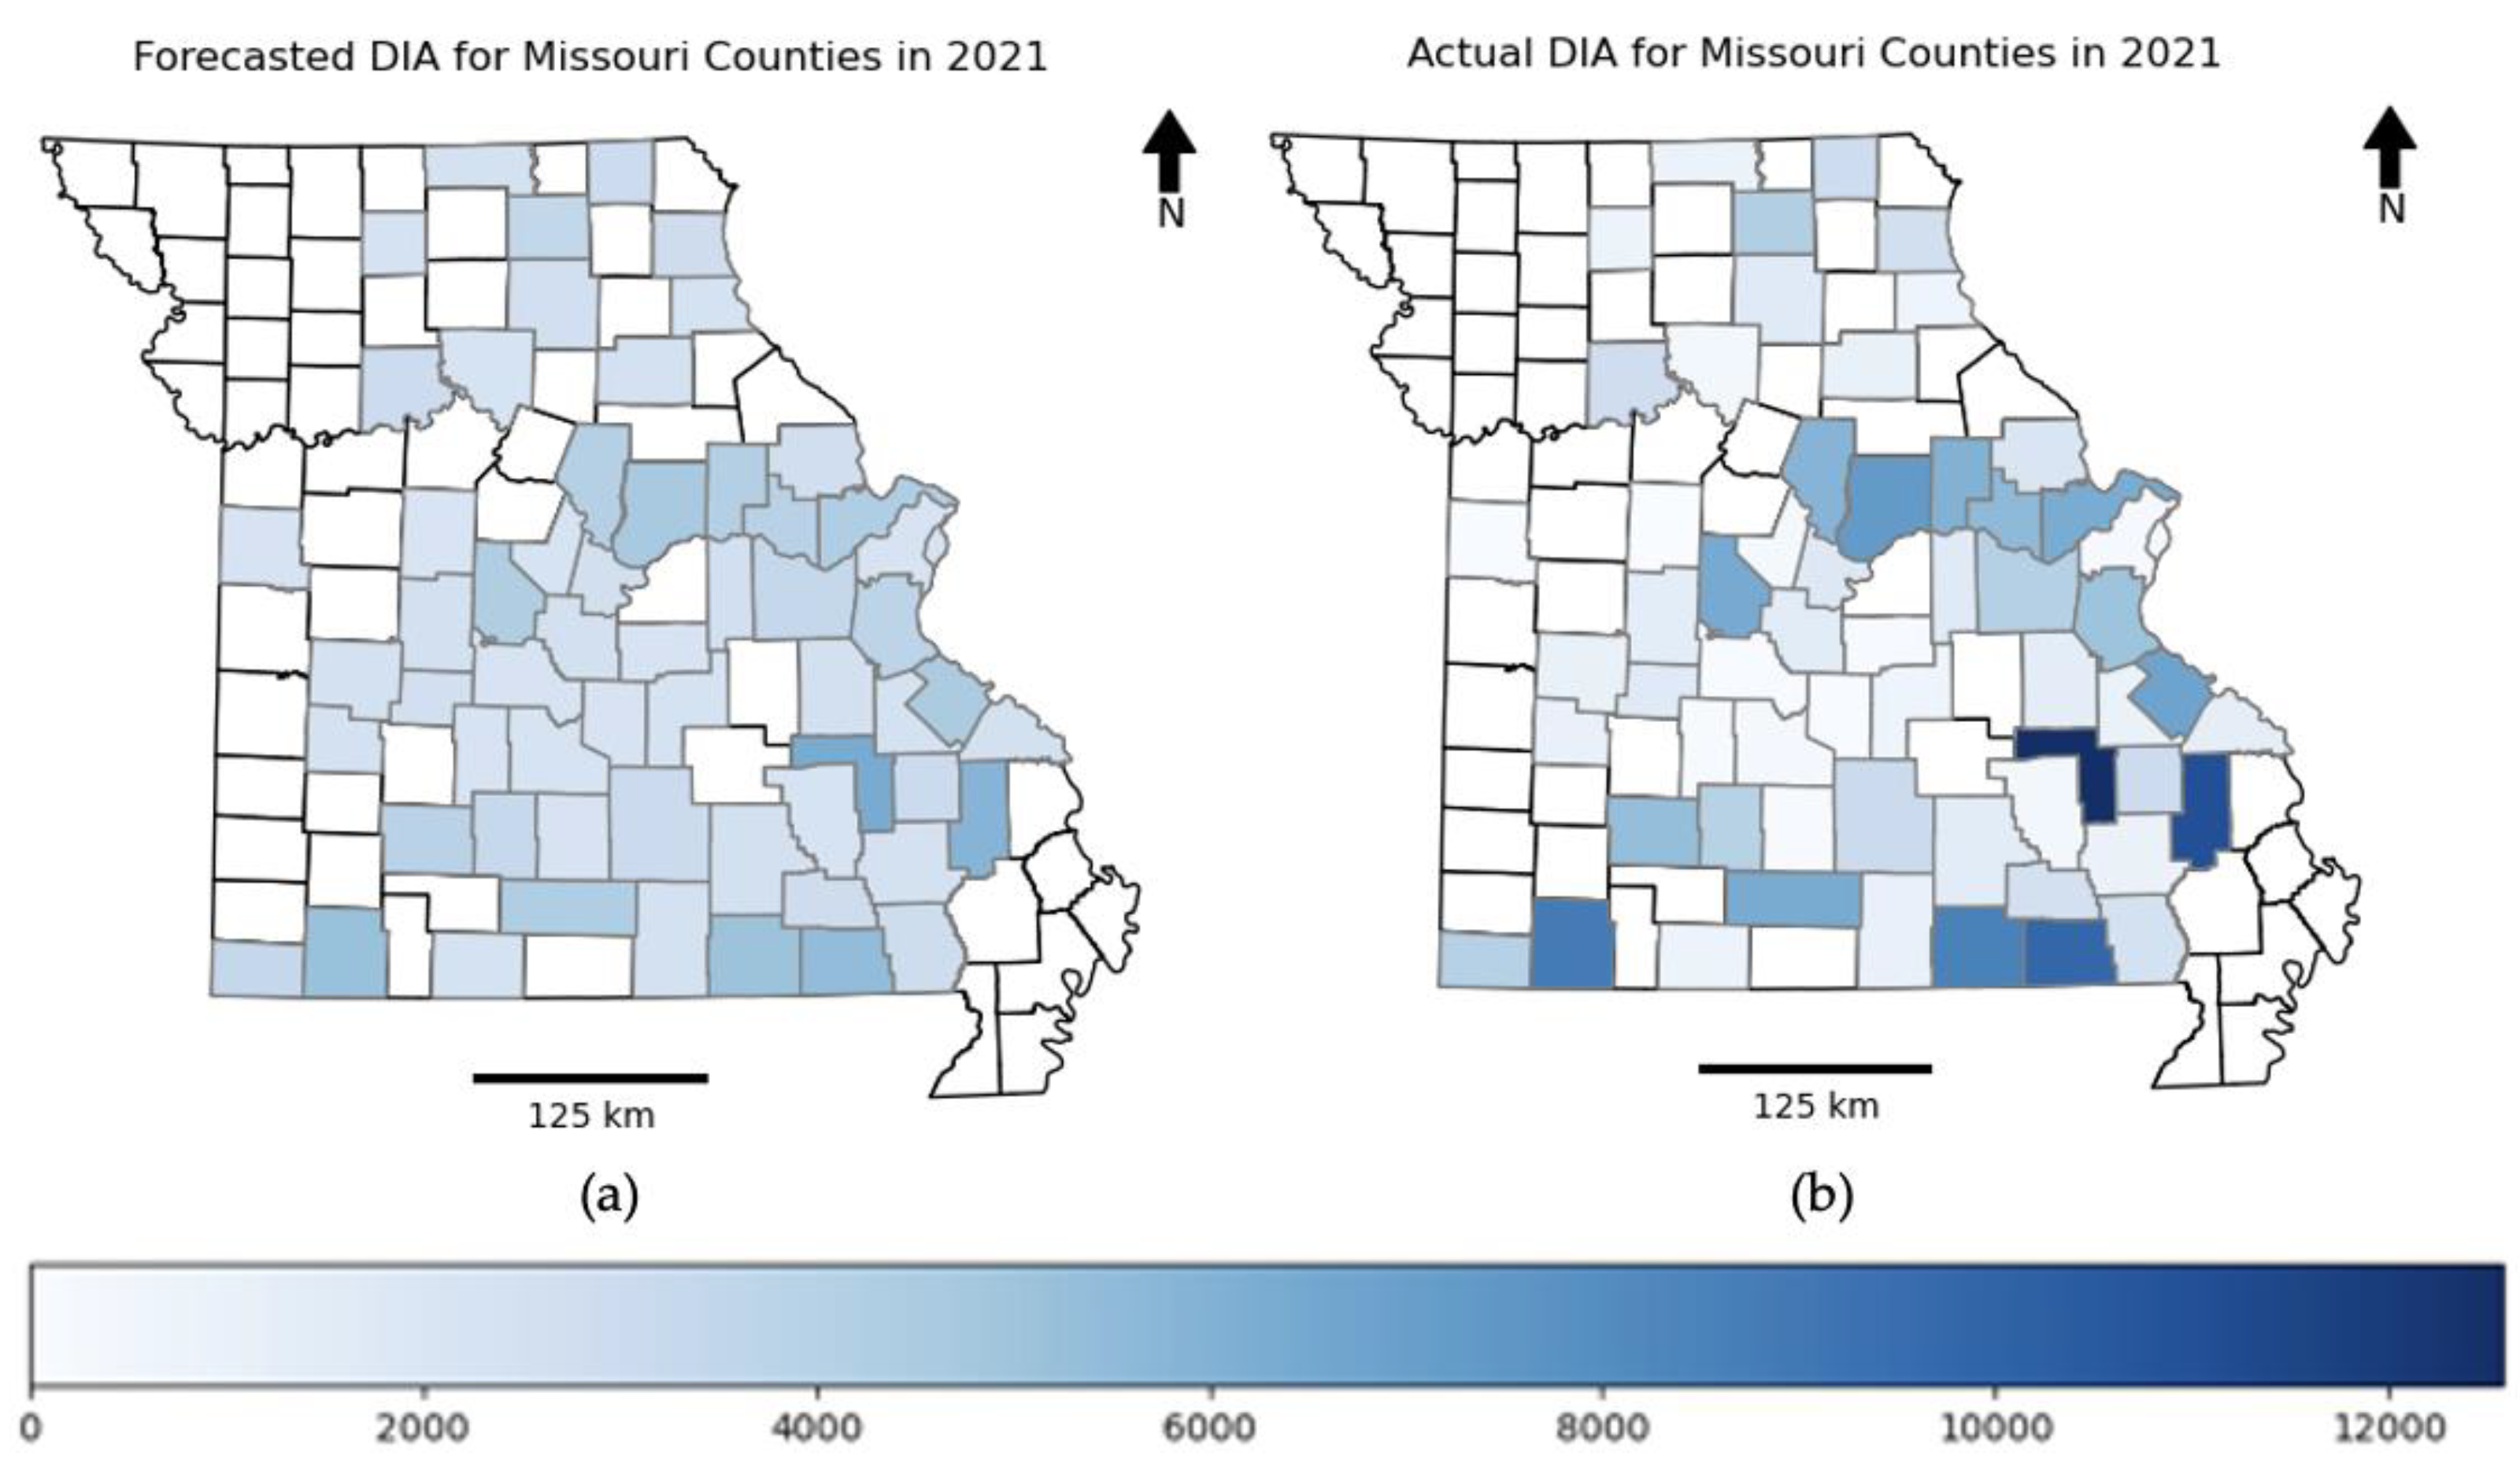
When looking at white oak we found that while the LSTM model captured the trend of DIA growth effectively there were discrepancies between the predicted values and the actual data in various counties. In some instances, the model overestimated growth while in others it underestimated DIA levels. On the hand for red oak there was a more noticeable difference between predicted and actual DIA values. The model tended to underestimate DIA levels in areas due to its limited ability to account for the complex growth patterns of red oak trees. This indicates that improving the model by including variables or enhancing feature engineering could help it better capture red oak growth nuances.
Figure 5.
The above plots depict the Forecasted DIA (in cm) and Actual DIA (in cm) for white oak across the Missouri counties in the year 2021: (a) Forecasted DIA for white oaks across the Missouri counties in the year 2021; (b) Actual DIA for white oaks across the Missouri counties in the year 2021.
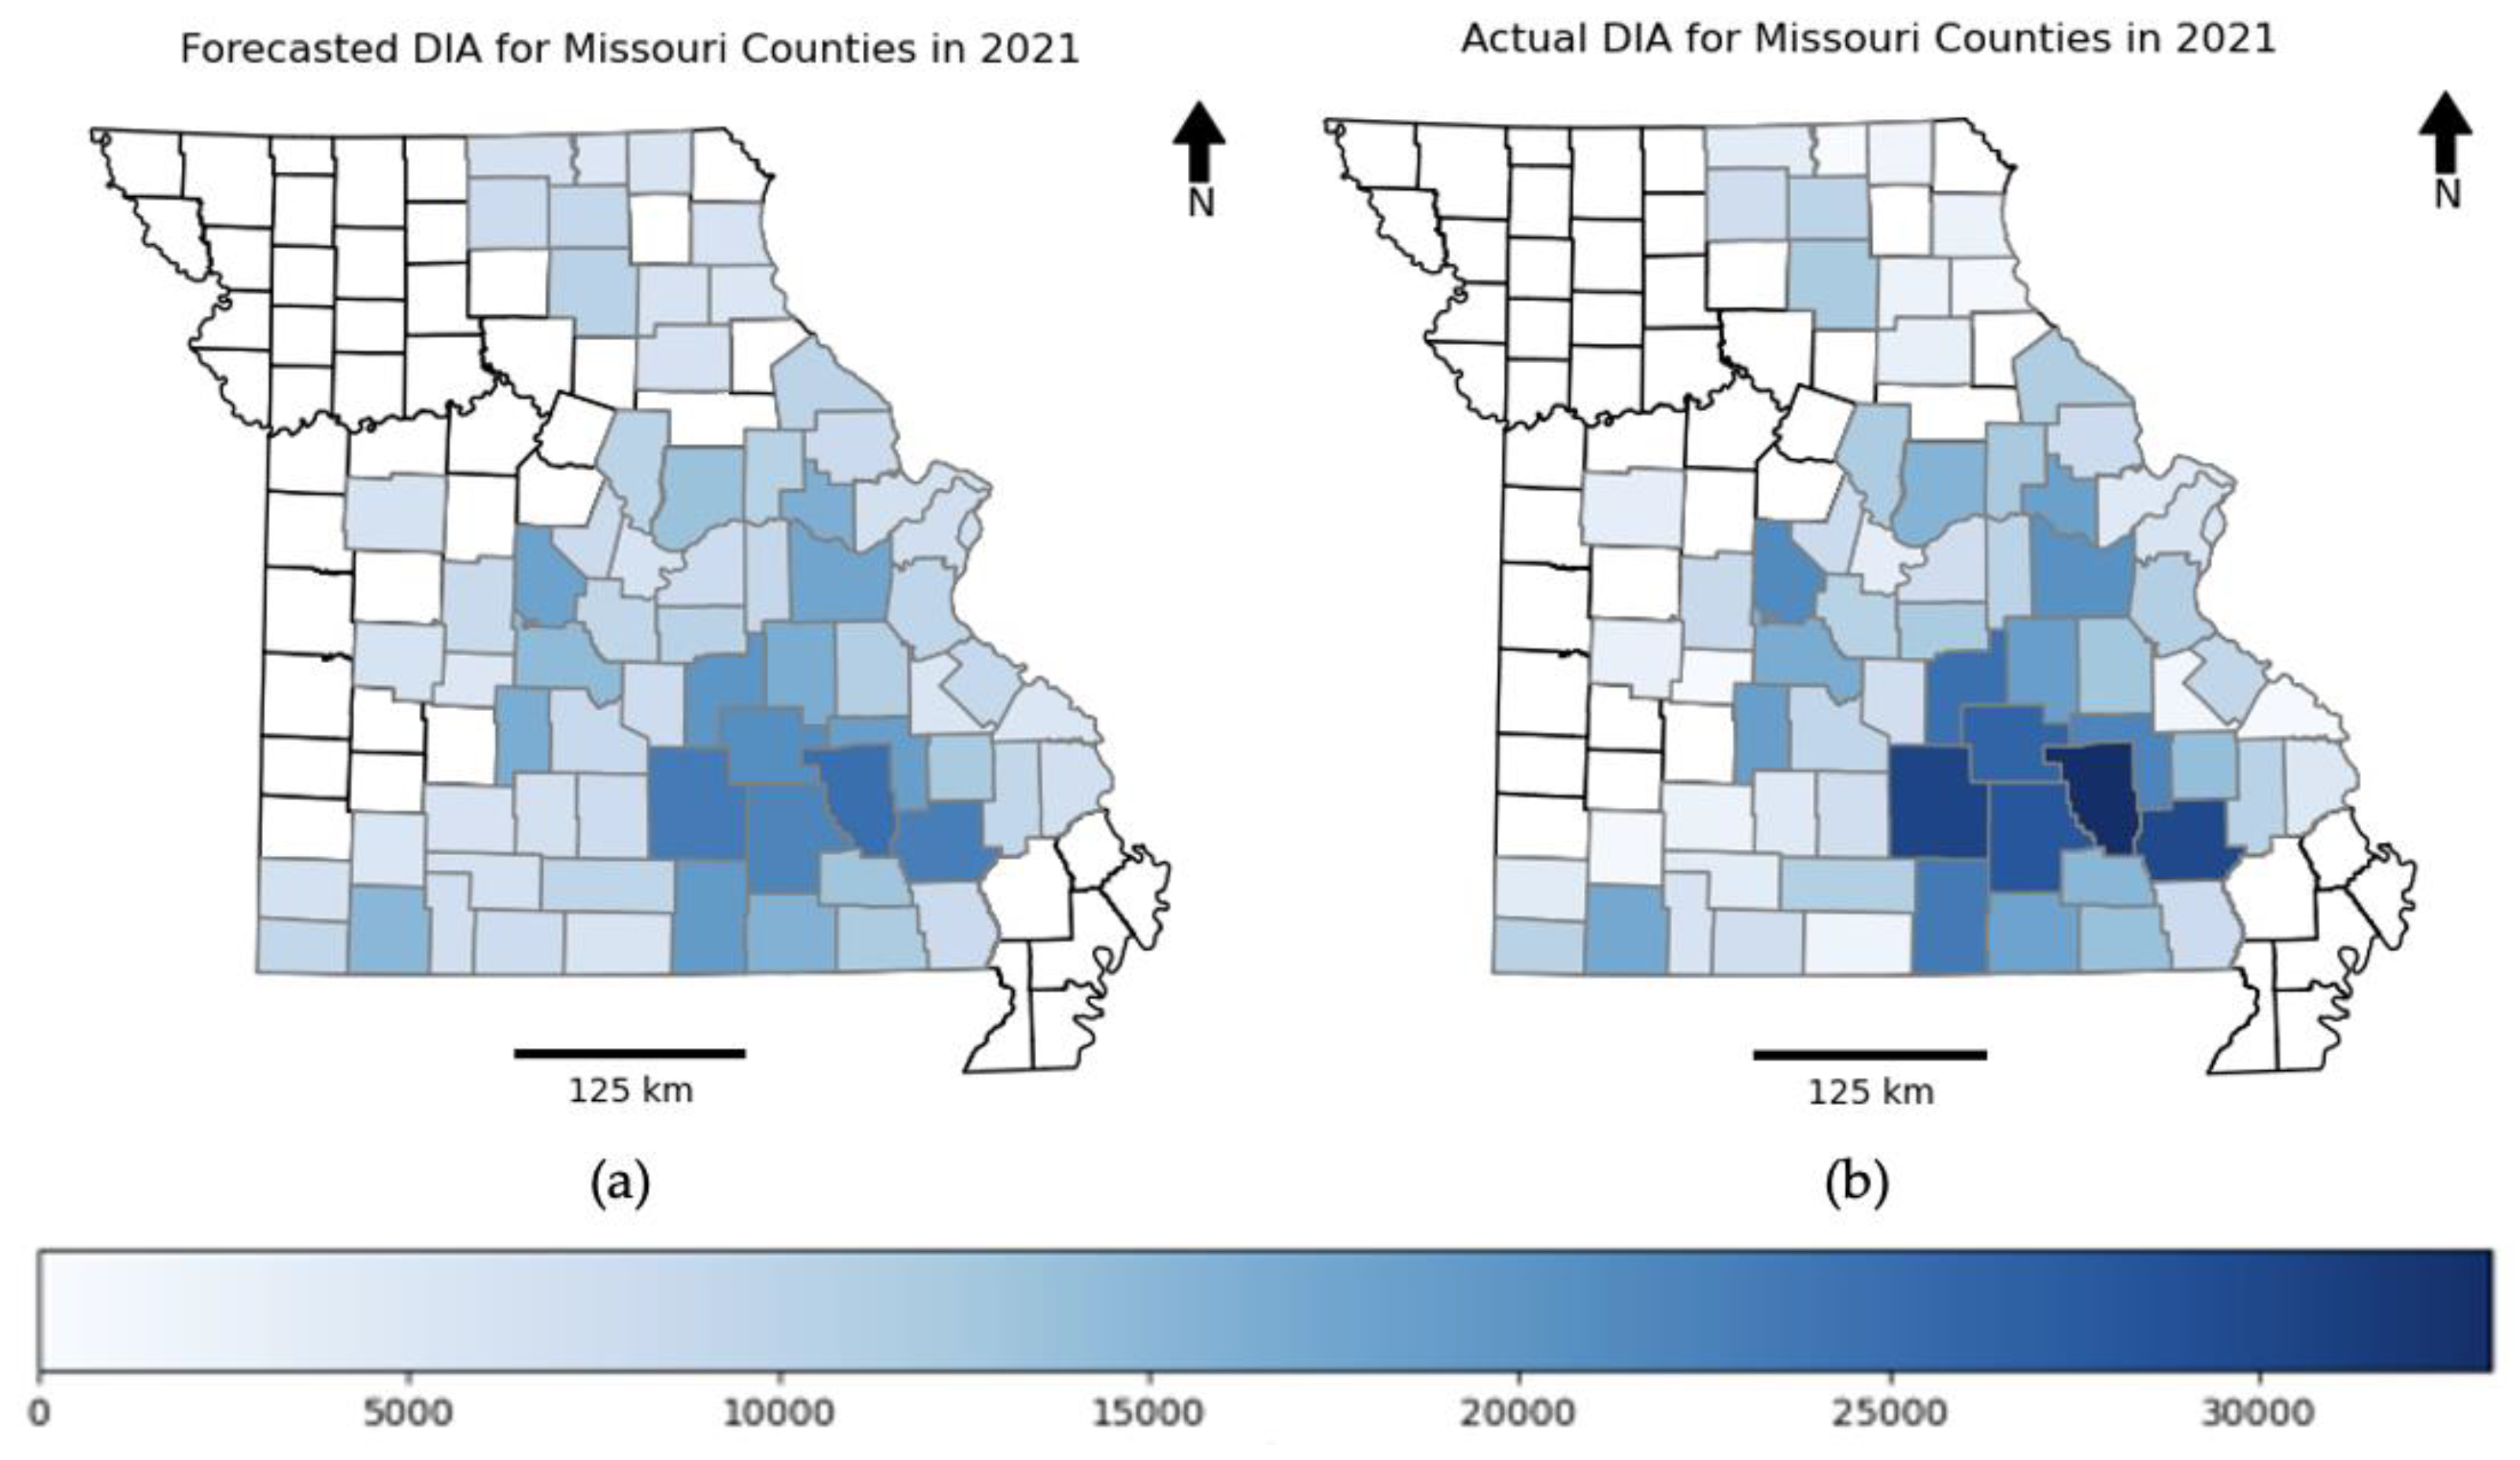
Figure 6.
The above plots depict the Forecasted DIA (in cm) and Actual DIA (in cm) for Red oak across the Missouri counties in the year 2021: (a) Forecasted DIA for Red oak across the Missouri counties in the year 2021; (b) Actual DIA for Red oak across the Missouri counties in the year 2021.
Figure 6.
The above plots depict the Forecasted DIA (in cm) and Actual DIA (in cm) for Red oak across the Missouri counties in the year 2021: (a) Forecasted DIA for Red oak across the Missouri counties in the year 2021; (b) Actual DIA for Red oak across the Missouri counties in the year 2021.
4. Discussion
4.1. Effectiveness of LSTM Networks in Predicting DIA
The findings of this study indicate that LSTM networks are effective for predicting the DIA of white oak with moderate accuracy, while struggling to forecast red oak growth accurately. These results align with prior research suggesting that white oaks exhibit more stable growth patterns compared to red oaks, making them easier to predict. Similar studies in the Ozark Highlands have shown that white oaks tend to be less susceptible to rapid environmental changes, which enhances the predictability of their growth [33].
In contrast, the low predictive accuracy for red oak aligns with evidence from other research highlighting the vulnerability of oak to environmental stressors such as drought and pest outbreaks [34]. Studies on oak mortality have consistently found that red oak species are more prone to sudden mortality during dry periods, making it difficult for predictive models to accurately forecast growth trends [35,36,37]. This variability is also evident in past works that used simpler regression models, which showed similar difficulties in predicting red oak growth patterns.
Remote sensing data, combined with LSTM models, has proven beneficial in similar research. These studies found that integrating satellite imagery and ground-based data enhanced predictive accuracy by capturing dynamic environmental factors like soil moisture and vegetation health. While our model did not incorporate remote sensing data, doing so in future research could improve predictions, particularly for red oaks, by providing additional insights into changing environmental conditions.
This study’s findings align with our research that suggests hybrid models combining machine learning algorithms, such as LSTM and Random Forest, perform better than single models alone. Incorporating ensemble methods may improve DIA predictions for Oak trees by leveraging different algorithms, strengths, particularly in handling non-linear environmental interactions.
The findings regarding DIA predictions for white oak also reflect trends observed in other studies, which suggest that deeper root systems and greater drought tolerance contribute to the stable growth of white oak species [38]. These characteristics allow white oaks to maintain growth even during periods of environmental stress which may explain the higher prediction accuracy observed in this study [39,40,41].
Studies have also employed spatial analyses using Ripley’s K function to identify mortality patterns, reinforcing our findings that incorporating spatial tools enhances forest management strategies. These tools are particularly useful for identifying high-risk areas, allowing predictive models to focus on regions where oak mortality is more likely to occur [42].
However, this study differs from some earlier research by adopting an LSTM-based approach rather than traditional statistical models such as regression trees. Past studies have found that regression-based models perform well for white oaks but struggle with red oaks due to their erratic growth responses. Our findings confirm that LSTM networks offer a significant advantage over traditional models in capturing time-dependent patterns, though challenges remain for red oak predictions.
The inclusion of environmental variables, such as soil type and precipitation, is crucial for improving the model’s performance, aligning with findings from previous works [43]. While our model incorporated some environmental data, future research could benefit from using real-time data sources, such as satellite-based monitoring systems, to further enhance prediction accuracy [44].
4.2. Research Limitations
Despite the promising results, several limitations were identified in this study that may have influenced the accuracy of the predictions. While LSTM networks are powerful tools for time-series forecasting, they are sensitive to hyperparameter selection, which can affect model performance. The reliance on annual DIA data limits the model’s ability to capture intra-annual growth variations which may be significant for red oaks. Future studies could explore using more frequent data points such as monthly or seasonal measurements to improve prediction accuracy [45].
The data used in this study was acquired from the United States Forest Service (USFS) which conducts annual surveys. While the USFS provides valuable data but inconsistencies in data collection methods across counties may introduce bias into the model [46]. Additionally, some counties had fewer than 10 years of data which limits the amount of historical information available for model training.
This study relied on historical data which may not fully capture current environmental changes. Integrating real-time data sources such as satellite imagery could significantly improve the model’s ability to forecast DIA accurately [47,48].
The study focused on oak forests in Missouri which may limit the generalizability of the findings to other regions. While Missouri’s climate provides diverse conditions but oak forests in other parts of the U.S. may experience different environmental challenges that are not captured by the model.
The varying growth patterns of white and red oaks present unique challenges for predictive modeling. The model’s moderate performance for white oak may not translate to other species which require tailored models to account for their specific growth dynamics [49,50].
Although early stopping was implemented to prevent overfitting there is still a risk that the model may have learned patterns specific to the training data reducing its generalizability.
5. Conclusions
This research emphasizes the effectiveness of Long Short-Term Memory (LSTM) networks in forecasting the DIA of oak trees, an essential metric for assessing forest well-being and timber asset management. By examining data spanning from 1999 to 2020 the LSTM model highlighted its capability to provide precise forecasts for 2021. This accomplishment holds importance due to the intricate nature of tree growth impacted by a multitude of environmental variables and past trends.
One notable aspect of this study is its focus on using machine learning techniques, such as LSTMs in a field that has typically relied on simpler statistical methods. The findings indicated that although the LSTM model performed admirably particularly when compared to approaches like linear regression and Random Forest there is still room for improvement. The elevated Mean Squared Error (MSE), and moderate R-squared values imply that while the model captures some of the underlying growth patterns it fails to encompass all the inherent variability found in nature.
Furthermore, this study highlights the significance of model advancement. With the advancements in machine learning methods there are chances to boost our forecasting abilities. Delving into blended models that merge the advantages of LSTMs with machine learning techniques could present an avenue for enhancing predictions and offering more understandable outcomes. Likewise exploring deep learning structures such as transformers may uncover ways to grasp the essential long-term relationships crucial more effectively in time series prediction.
In summary, highlighting the effectiveness of LSTM models, this research has broader implications for the management of oak forests in Missouri. Accurate predictions of DIA support informed decision-making in forest conservation, timber harvesting and biodiversity preservation ensuring the long-term health of these ecosystems. Future research should explore integrating more environmental variables such as soil moisture, temperature etc., while expanding the model to other regions and species. These tools can better support sustainable forestry practices and Key stakeholders including forest managers, landowners and policy makers will benefit from these tools to guide sustainable forestry practices and policy development.
Author Contributions
Conceptualization, S.C., and S.B.; methodology, S.C., and S.T.G; validation, S.C., and S.T.G.; writing—original draft preparation, S.C., and S.T.G.; writing—review and editing, S.C., S.B., S.T.G., and S.K.; supervision, S.B.; project administration, S.C., and S.B.; funding acquisition, S.B. All authors have read and agreed to the published version of the manuscript.
Funding
United States Department of Agriculture/National Institute of Food and Agriculture 1890 Capacity Building Grant, Award number 2021-38821-34704.
Data Availability Statement
The original contributions presented in the study are included in the article, further inquiries can be directed to the corresponding author.
Acknowledgments
We acknowledge the University of Missouri College of Arts and Science for its facilities and support.
Conflicts of Interest
The authors declare no conflict of interest.
References
- Yang, S.; Spetich, M.A.; Fan, Z. Spatiotemporal dynamics and risk factors of oak decline and Mortality in the Missouri Ozarks of the United States based on repeatedly measured FIA data. For. Ecol. Manag. 2021, 502, 119745. [Google Scholar] [CrossRef]
- Fan, Z.; Kabrick, J.M.; Spetich, M.A.; Shifley, S.R.; Jensen, R.G. Oak mortality associated with crown dieback and oak borer attack in the Ozark Highlands. For. Ecol. Manag. 2008, 255, 2297–2305. [Google Scholar] [CrossRef]
- Haavik, L.J.; Jones, J.S.; Galligan, L.D.; Guldin, J.M.; Stephen, F.M. Oak decline and red oak borer outbreak: impact in upland oak-hickory forests of Arkansas, USA. For. Int. J. For. Res. 2012, 85, 341–352. [Google Scholar] [CrossRef]
- Martínez-Vilalta, J.; Lloret, F.; Breshears, D.D. Drought-induced forest decline: causes, scope and implications. Biol. Lett. 2011, 8, 689–691. [Google Scholar] [CrossRef] [PubMed]
- Allen, C.D.; Macalady, A.K.; Chenchouni, H.; Bachelet, D.; McDowell, N.; Vennetier, M.; Kitzberger, T.; Rigling, A.; Breshears, D.D.; Hogg, E.H.; et al. A global overview of drought and heat-induced tree mortality reveals emerging climate change risks for forests. For. Ecol. Manag. 2010, 259, 660–684. [Google Scholar] [CrossRef]
- Dai, A. Drought under global warming: a review. WIREs Clim. Chang. 2011, 2, 45–65. [Google Scholar] [CrossRef]
- Clark, J.S.; Iverson, L.; Woodall, C.W.; Allen, C.D.; Bell, D.M.; Bragg, D.C.; D'Amato, A.W.; Davis, F.W.; Hersh, M.H.; Ibanez, I.; et al. The impacts of increasing drought on forest dynamics, structure, and biodiversity in the United States. Glob. Chang. Biol. 2016, 22, 2329–2352. [Google Scholar] [CrossRef]
- Nagle, A.M.; Long, R.P.; Madden, L.V.; Bonello, P. Association of Phytophthora cinnamomi with White Oak Decline in Southern Ohio. Plant Dis. 2010, 94, 1026–1034. [Google Scholar] [CrossRef] [PubMed]
- Wood, J.D.; O Knapp, B.; Muzika, R.-M.; Stambaugh, M.C.; Gu, L. The importance of drought–pathogen interactions in driving oak mortality events in the Ozark Border Region. Environ. Res. Lett. 2018, 13, 015004. [Google Scholar] [CrossRef]
- LeBlanc, D.C.; Terrell, M.A. Comparison of growth–climate relationships between northern red oak and white oak across eastern North America. Can. J. For. Res. 2011, 41, 1936–1947. [Google Scholar] [CrossRef]
- Bendixsen, D.P.; Hallgren, S.W.; Frazier, A.E. Stress factors associated with forest decline in xeric oak forests of south-central United States. For. Ecol. Manag. 2015, 347, 40–48. [Google Scholar] [CrossRef]
- Khadka, S.; Bardhan, S. Examining the Relationship between Stand Density of Declining White Oaks (Quercus alba L.) and Soil Properties across the broader scale of the Eastern United States. Preprints. 2024. [Google Scholar] [CrossRef]
- Abella, S.R.; A Sprow, L.; A Schetter, T. Delayed Tree Mortality After Prescribed Fires in Mixed Oak Forests in Northwestern Ohio. For. Sci. 2021, 67, 412–418. [Google Scholar] [CrossRef]
- Dey, D. C.; Fan, Z. A Review of Fire and Oak Regeneration and Overstory Recruitment. 3rd Fire in Eastern Oak Forests Conference, 2009.
- Clark, S.L.; Schweitzer, C.J. Stand dynamics of an oak woodland forest and effects of a restoration treatment on forest health. For. Ecol. Manag. 2016, 381, 258–267. [Google Scholar] [CrossRef]
- Bruhn, J.N.; Wetteroff, J.J.; Mihail, J.D.; Kabrick, J.M.; Pickens, J.B. Distribution of Armillaria species in upland Ozark Mountain forests with respect to site, overstory species composition and oak decline. For. Pathol. 2000, 30, 43–60. [Google Scholar] [CrossRef]
- Young, D.J.N.; Stevens, J.T.; Earles, J.M.; Moore, J.; Ellis, A.; Jirka, A.L.; Latimer, A.M. Long-term climate and competition explain forest mortality patterns under extreme drought. Ecol. Lett. 2016, 20, 78–86. [Google Scholar] [CrossRef] [PubMed]
- Brasier, C. Phytophthora cinnamomi and oak decline in southern Europe. Environmental constraints including climate change. Ann. For. Sci. 1996, 53, 347–358. [Google Scholar] [CrossRef]
- Wang, C.; He, H.S.; Kabrick, J.M. A Remote Sensing-Assisted Risk Rating Study to Predict Oak Decline and Recovery in the Missouri Ozark Highlands, USA. GIScience Remote. Sens. 2008, 45, 406–425. [Google Scholar] [CrossRef]
- Verbesselt, J.; Hyndman, R.; Newnham, G.; Culvenor, D. Detecting trend and seasonal changes in satellite image time series. Remote Sens. Environ. 2010, 114, 106–115. [Google Scholar] [CrossRef]
- Fan, Z.; Kabrick, J.M.; Shifley, S.R. Classification and regression tree based survival analysis in oak-dominated forests of Missouri's Ozark highlands. Can. J. For. Res. 2006, 36, 1740–1748. [Google Scholar] [CrossRef]
- Fan, Z.; Fan, X.; Crosby, M.K.; Moser, W.K.; He, H.; Spetich, M.A.; Shifley, S.R. Spatio-Temporal Trends of Oak Decline and Mortality under Periodic Regional Drought in the Ozark Highlands of Arkansas and Missouri. Forests 2012, 3, 614–631. [Google Scholar] [CrossRef]
- Fan, Z.; Fan, X.; Spetich, M.A.; Shifley, S.R.; Moser, W.K.; Jensen, R.G.; Kabrick, J.M. Developing a Stand Hazard Index for Oak Decline in Upland Oak Forests of the Ozark Highlands, Missouri. North. J. Appl. For. 2011, 28, 19–26. [Google Scholar] [CrossRef]
- Pedersen, B.S. The Role of Stress in the Mortality of Midwestern Oaks as Indicated by Growth prior to Death. Ecology 1998, 79, 79. [Google Scholar] [CrossRef]
- Reed, S.E.; English, J.T.; Muzika, R.-M. Phytophthora Species Detected in Two Ozark Forests with Unusual Patterns of White Oak Mortality. Plant Dis. 2019, 103, 102–109. [Google Scholar] [CrossRef]
- Berdanier, A. B.; Clark, J. S. Multiyear drought-induced morbidity preceding tree death in southeastern U. S. forests. Ecological Applications 2016, 26. [Google Scholar] [CrossRef] [PubMed]
- Gould, P.J.; Marshall, D.D.; Harrington, C.A. Prediction of Growth and Mortality of Oregon White Oak in the Pacific Northwest. West. J. Appl. For. 2008, 23, 26–33. [Google Scholar] [CrossRef]
- Gray, A.; Brandeis, T.; Shaw, J.; McWilliams, W.; Miles, P. Forest Inventory and Analysis Database of the United States of America (FIA). Biodivers. Ecol. 2012, 4, 225–231. [Google Scholar] [CrossRef]
- Kromroy, K.W.; Juzwik, J.; Castillo, P.; Hansen, M.H. Using Forest Service Forest Inventory and Analysis Data to Estimate Regional Oak Decline and Oak Mortality. North. J. Appl. For. 2008, 25, 17–24. [Google Scholar] [CrossRef]
- Khadka, S.; He, H.S.; Bardhan, S. Investigating the Spatial Pattern of White Oak (Quercus alba L.) Mortality Using Ripley’s K Function Across the Ten States of the Eastern US. Forests 2024, 15, 1809. [Google Scholar] [CrossRef]
- Khadka, S.; Gyawali, B.R.; Shrestha, T.B.; Cristan, R.; Banerjee, S. “.; Antonious, G.; Poudel, H.P. Exploring relationships among landownership, landscape diversity, and ecological productivity in Kentucky. Land Use Policy 2021, 111, 105723. [Google Scholar] [CrossRef]
- McNellis, B.E.; Smith, A.M.S.; Hudak, A.T.; Strand, E.K. Tree mortality in western U.S. forests forecasted using forest inventory and Random Forest classification. Ecosphere 2021, 12, e03419. [Google Scholar] [CrossRef]
- Kabrick, J.M.; Dey, D.C.; Jensen, R.G.; Wallendorf, M. The role of environmental factors in oak decline and mortality in the Ozark Highlands. For. Ecol. Manag. 2008, 255, 1409–1417. [Google Scholar] [CrossRef]
- Huesca, M.; Ustin, S.L.; Shapiro, K.D.; Boynton, R.; Thorne, J.H. Detection of drought-induced blue oak mortality in the Sierra Nevada Mountains, California. Ecosphere 2021, 12, e03558. [Google Scholar] [CrossRef]
- Anderegg, W.R.L.; Flint, A.; Huang, C.-Y.; Flint, L.; Berry, J.A.; Davis, F.W.; Sperry, J.S.; Field, C.B. Tree mortality predicted from drought-induced vascular damage. Nat. Geosci. 2015, 8, 367–371. [Google Scholar] [CrossRef]
- Fei, S.; Kong, N.; Steiner, K.C.; Moser, W.K.; Steiner, E.B. Change in oak abundance in the eastern United States from 1980 to 2008. For. Ecol. Manag. 2011, 262, 1370–1377. [Google Scholar] [CrossRef]
- Jenkins, M.A.; Pallardy, S.G. The influence of drought on red oak group species growth and mortality in the Missouri Ozarks. Can. J. For. Res. 1995, 25, 1119–1127. [Google Scholar] [CrossRef]
- Greenberg, C.H.; Keyser, T.L.; Speer, J.H. Temporal Patterns of Oak Mortality in a Southern Appalachian Forest (1991–2006). Nat. Areas J. 2011, 31, 131–137. [Google Scholar] [CrossRef]
- Neumann, M.; Mues, V.; Moreno, A.; Hasenauer, H.; Seidl, R. Climate variability drives recent tree mortality in Europe. Glob. Chang. Biol. 2017, 23, 4788–4797. [Google Scholar] [CrossRef] [PubMed]
- McConnell, M.E.; Balci, Y. Phytophthora cinnamomi as a Contributor to White Oak Decline in Mid-Atlantic United States Forests. Plant Dis. 2014, 98, 319–327. [Google Scholar] [CrossRef] [PubMed]
- Pedersen, B.S. The Role of Stress in the Mortality of Midwestern Oaks as Indicated by Growth prior to Death. Ecology 1998, 79, 79. [Google Scholar] [CrossRef]
- Sánchez-Cuesta, R.; Ruiz-Gómez, F.J.; Duque-Lazo, J.; González-Moreno, P.; Navarro-Cerrillo, R.M. The environmental drivers influencing spatio-temporal dynamics of oak defoliation and mortality in dehesas of Southern Spain. For. Ecol. Manag. 2021, 485, 118946. [Google Scholar] [CrossRef]
- Bréda, N.; Huc, R.; Granier, A.; Dreyer, E. Temperate forest trees and stands under severe drought: a review of ecophysiological responses, adaptation processes and long-term consequences. Ann. For. Sci. 2006, 63, 625–644. [Google Scholar] [CrossRef]
- Cohen, W.B.; Yang, Z.; Stehman, S.V.; Schroeder, T.A.; Bell, D.M.; Masek, J.G.; Huang, C.; Meigs, G.W. Forest disturbance across the conterminous United States from 1985–2012: The emerging dominance of forest decline. For. Ecol. Manag. 2016, 360, 242–252. [Google Scholar] [CrossRef]
- Van Mantgem, P.J.; Stephenson, N.L. Apparent climatically induced increase of tree mortality rates in a temperate forest. Ecol. Lett. 2007, 10, 909–916. [Google Scholar] [CrossRef] [PubMed]
- Faber-Langendoen, D.; Tester, J.R. Oak Mortality in Sand Savannas Following Drought in East-Central Minnesota. Bull. Torrey Bot. Club 1993, 120, 248. [Google Scholar] [CrossRef]
- Heitzman, E.; Guldin, J. M. Impacts of Oak Decline on Forest Structure in Arkansas and Oklahoma : Preliminary Results. Methods. 2004.
- Verbesselt, J.; Robinson, A.; Stone, C.; Culvenor, D. Forecasting tree mortality using change metrics derived from MODIS satellite data. For. Ecol. Manag. 2009, 258, 1166–1173. [Google Scholar] [CrossRef]
- Stephenson, N.L.; van Mantgem, P.J.; Bunn, A.G.; Bruner, H.; Harmon, M.E.; O'Connell, K.B.; Urban, D.L.; Franklin, J.F. Causes and implications of the correlation between forest productivity and tree mortality rates. Ecol. Monogr. 2011, 81, 527–555. [Google Scholar] [CrossRef]
- Shifley, S.R.; Fan, Z.; Kabrick, J.M.; Jensen, R.G. Oak mortality risk factors and mortality estimation. For. Ecol. Manag. 2006, 229, 16–26. [Google Scholar] [CrossRef]
Figure 3.
Actual vs Predicted values (Dotted line) for White Oak in the year 2021. X-axis represents the Actual DIA (in cm) and Y-axis represents the Forecasted DIA (in cm).
Figure 3.
Actual vs Predicted values (Dotted line) for White Oak in the year 2021. X-axis represents the Actual DIA (in cm) and Y-axis represents the Forecasted DIA (in cm).
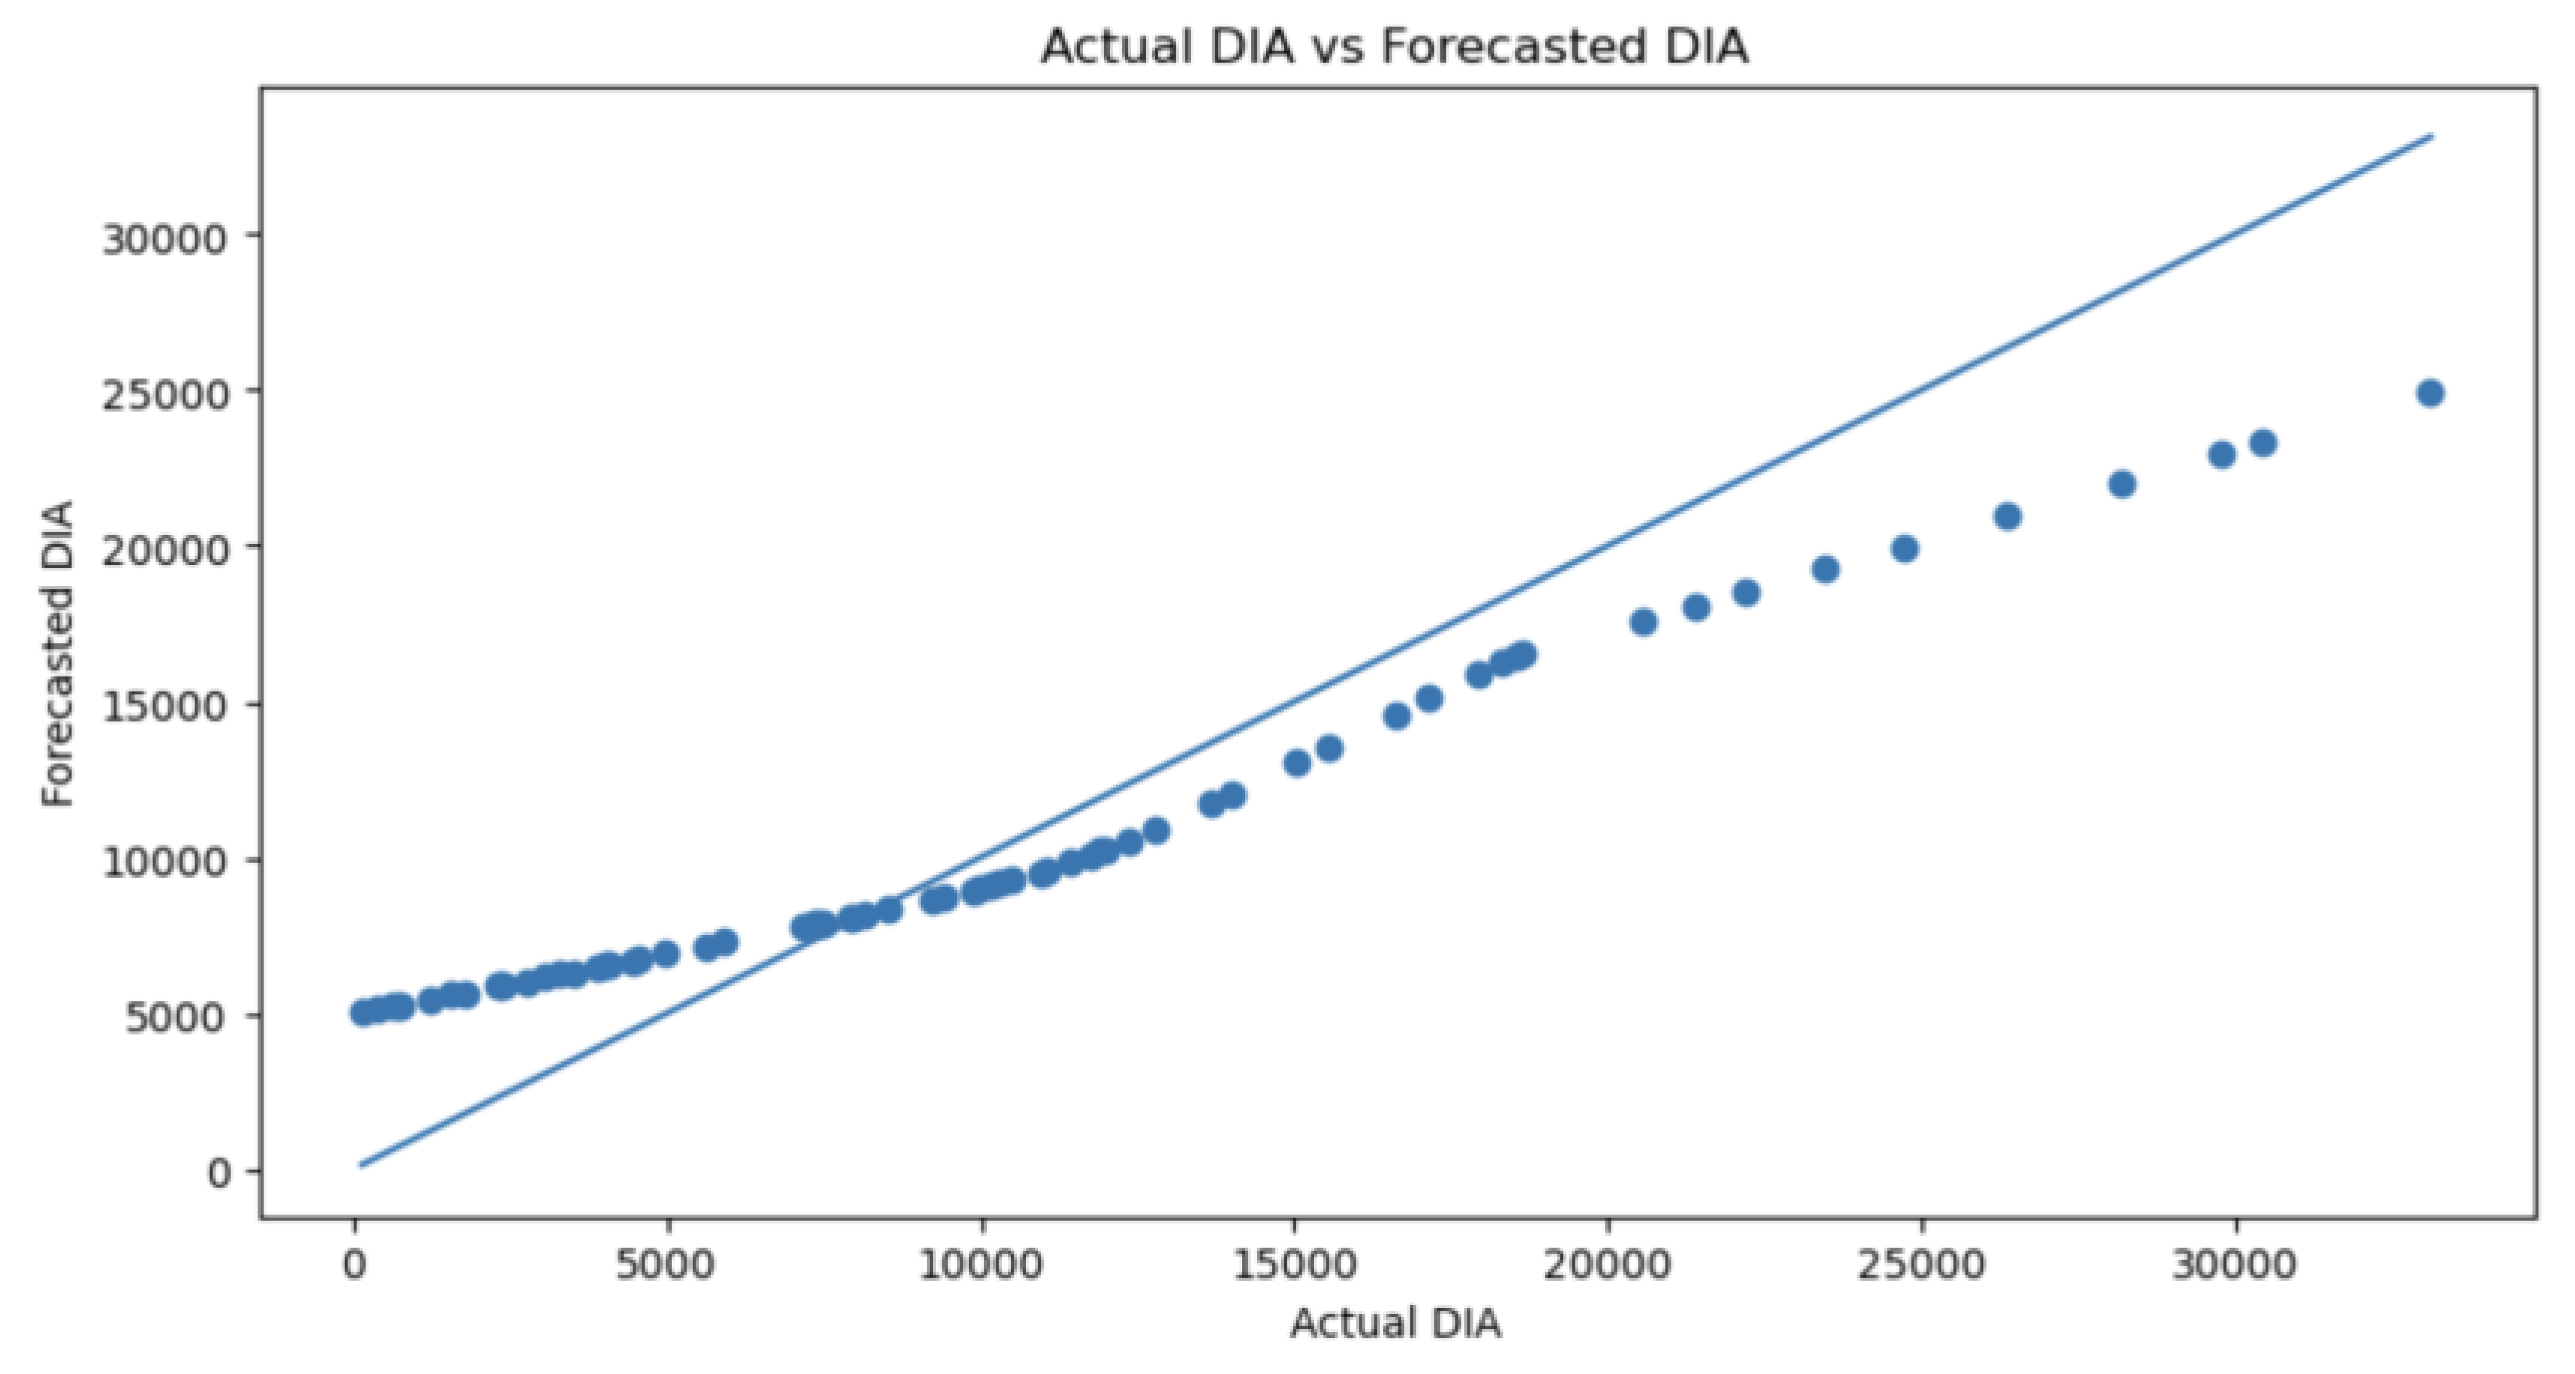
Figure 4.
Actual vs Predicted values (Dotted line) for Red Oak in year 2021. X-axis represents the Actual DIA (in cm) and Y-axis represents the Forecasted DIA (in cm).
Figure 4.
Actual vs Predicted values (Dotted line) for Red Oak in year 2021. X-axis represents the Actual DIA (in cm) and Y-axis represents the Forecasted DIA (in cm).
Disclaimer/Publisher’s Note: The statements, opinions and data contained in all publications are solely those of the individual author(s) and contributor(s) and not of MDPI and/or the editor(s). MDPI and/or the editor(s) disclaim responsibility for any injury to people or property resulting from any ideas, methods, instructions or products referred to in the content. |
© 2025 by the authors. Licensee MDPI, Basel, Switzerland. This article is an open access article distributed under the terms and conditions of the Creative Commons Attribution (CC BY) license (http://creativecommons.org/licenses/by/4.0/).
Copyright: This open access article is published under a Creative Commons CC BY 4.0 license, which permit the free download, distribution, and reuse, provided that the author and preprint are cited in any reuse.


