Submitted:
14 January 2025
Posted:
15 January 2025
You are already at the latest version
Abstract
Hydropower plays a crucial role towards the transition to renewable and sustainable energy. In Kenya, this transition is spearheaded by the adoption of hydro energy for electricity generation purposes. This study proposes the use of micro hydro plants toward the rural electrification of river Rutui region. In particular, it proposes performing the feasibility study for the establishment of a micro hydro power plant on the river Rutui, as part of the rural electrification of Kenya. We describe the overall layout of the proposed plant including technical and economic aspects, that include use the flow duration curve based on the rainfall and flow data, turbine type selection, economic analysis detailing the capital cost, engineering cost, and project maintenance cost, annual energy output and revenue estimations using the maximum potential power and average energy yield of the analyzed system (kWh/year). We also carry out some sensitivity analysis. The results show the viability/promise of hydropower generation in the region.
Keywords:
Micro-hydropower
; rural electrification
; techno-economic analysis
1. Introduction
Renewable energy in Kenya accounts for 73% of her installed power generation capacity [1]. 90% of the electricity in use is from clean sources dominated by geothermal and hydroelectricity as the two main sources of renewable energy. Kenya’s current grid connected capacity is 2651 MW with a peak demand of 1912 MW which is predominantly sourced from hydroelectricity. The demand for electricity rises approximately by 3.6% every year [2]. As of 2024, Kenya has made significant progress in advancing access to clean and reliable energy. Over 75% of Kenyans are now connected to the national grid as compared to 30% in 2013. This is among one of the highest national grid connectivity rates in sub-Saharan Africa with renewable energy. Even though Kenya has made great progress in grid connectivity there still lies a problem in the rural and remote regions of Kenya. These areas are characterized by low load demand while the supply from the national grid is characterized by high transmission and distribution costs. Kenya under the ministry of energy (MoE) and Rural Electrification and Renewable Energy Corporation (REREC) aims to increase access to modern energy services to underserved counties in order to meet its objectives of universal electrification by 2022 and economic growth under vision 2030 [3]. Micro hydroelectricity serves a great renewable energy option to serve this objective. In this work, we will conduct a feasibility study of micro hydropower potential of river Rutui as part of rural Kenya electrification.
2. Materials and Methods
2.1. Background and Proposed Idea
To address rural Kenya electrification, the government of Kenya has capitalized on the potential of renewable energy resources in Kenya. It projects that by the year 2037 renewable energy sources will provide 60% of the installed capacity of the country. This will be achieved through the expansion of renewable energy generation and overall power plans [4].
In the hydro sector the government intends to increase the installed capacity from the current 805 MW to 1782 MW by the year 2037. The hydro power potential ranges from 3 to 6 GW with the underdeveloped hydropower with significant economic impact being 1.6 GW. Hydropower in Kenya dates back to the early 1920s, with the 72MW Kindaruma Hydroelectric Power Station being the first large-scale hydropower scheme in Kenya [5]. Under the Ministry of Energy Kenya hydropower is classified as shown in Table 1.
In this study, we propose to look at the potential of the Rutui river, and study economic feasibility. For this purpose, the study completes the following objectives:
System design: This will include a detailed description of the crucial aspects of the project such as the turbine design, generator selection, plant size and power.
System cost estimations: This estimates the system’s overall financial breakdown. The capital cost, civil cost, electromechanical cost, grid cost, engineering and project cost are presented.
The annual energy and revenue estimations: This gives the estimates on the annual yield of the power plant in order to help generate the annual revenue of the system.
We believe our study is the first comprehensive one for hydropower potential of the Rutui river. In terms of related literature, Ref [6] looks at the average investment cost, annual Operation and Maintenance cost, cost of electricity generated and hydropower with storage. The addition of a reservoir to a hydropower plant contributed to stability and flexibility of the electrical system. Ref [7] describes a Pico hydro plant using Pelton turbine coupled to an induction generator to produce 1.1 kW of 1- phase AC, providing 65 households within a 550m radius of the turbine house located in Kithamba, Kirinyaga, Kenya with lighting and light radio use. Excess electricity from the plant is fed to a 2KW ballast load. Ref [8] describes a Pico hydro plant implemented using a pump as a turbine coupled to an induction generator with an output power of 2.2KW, feeding 160 households within an ~1km radius of the turbine house. A preliminary version of this paper was presented in Ref [9]. This article expands upon it by including more details of the design, including sensitivity analyses, all taken from Ref [10].
2.2. Hydropower Basics and Economics
In this subsection, we collect together a few definitions/ideas about hydropower that influence our selections and design and analysis in the sections that follow.
2.2.1. Technical Design Considerations
The general power and energy output of a hydropower system is given by:
where η is the turbine efficiency (normally 0.8 -0.9), ρ is the density of water = 1000Kg/m3, g is the gravitational constant = 9.8 m/s2, Q is the flow rate (m3/s), and H is the head (m).
P = 𝜂𝜌gQH
Turbine Types: The turbine is an important part of the system design. There are two major categories of turbines used in the design of a hydro plant: (a) impulse turbines, and (b) reaction turbines. The selection of the turbine used in any particular hydro site depends on the available head and flow rate. Other considerations include the turbine efficiency, turbine placement location and the cost [11]. Turbine selection is very important in the design of a hydroelectric plant and the turbine selection chart makes it easy to do so. The choice of turbine to be used for any particular hydro plant depends on various factors including the available head, the flow rate, output power, cost of the turbine, type of installation and civil work requirements among others. It therefore forms a critical part in the design process of a plant [12].
Figure 1 below shows the turbine section chart that indicates ranges of turbines suitable for different ranges of head, flow rate and the output power requirement.
Generator Types: The turbine is an important part of the system design. The generator is one of the key components of a hydropower system. The generator is responsible for converting the kinetic energy from the turbine to electrical energy. The generator also ensures the balance between the input and the output power of the hydropower. Generators are normally rated to deliver net kVA at rated voltage, speed, frequency and power factor. Specified operation conditions such as the temperature of the coolant, allowable temperature rise of the generator components are also taken into consideration as specified by the industry standards.
The synchronous and the induction generator are the two most commonly used types of generators for hydropower applications depending on the system’s design and requirements. More details can be found in [10].
2.2.2. The Cost of HydroPower
The long feasibility, planning, design and civil work required to set up a hydropower station makes it a very capital-intensive task. The civil works involved in hydropower plant construction and the cost of electromechanical equipment are the two major high-cost driving factors.
Capital costs: The total capital cost for a typical large hydropower ranges from $1000 – 3500 per KW. It is however possible to find project costs outside of this range. The occurrence of large hydropower projects established on an existing dam previously built for other purposes costing as low as $500 per KW is well-documented. On the other extreme, projects in remote sites without adequate local infrastructure such as roads and existing transmission networks, can cost more than $3500 per KW. The availability of resources, site specification, economic and political environment also determines the cost of hydropower from country to country, see Figure 3 below.
O&M costs: Hydropower plants are known to have very low operation and maintenance cost with the costs being slightly higher for small hydropower as compared to large hydropower. The annual operation and maintenance (O&M) cost are often expressed as a percentage of the capital cost per KW per Year. According to the International Energy Agency (IEA), the O&M ranges from 1-4% with large hydropower assumed to be 2.2% and small hydropower assumed to be 2.2 - 3%. The global average O&M is around 2.5% (IEA 2010c). O&M costs average about $45/KW/year for large hydropower and $52/KW/year for small hydropower. Figure 5 below shows the O&M costs for small hydro in developing countries.
Grid Interconnection & Tariff cost: In Kenya, through the Rural Electrification program and the Ministry of Energy, the grid interconnection cost is set at $150 per household for households within the range of 600 meters from the transformer. The interconnection cost for all other new customers is $350 for a single phase and $500 for three-phase all tax inclusive. Other charges include the cost of material used in the connection such as wooden poles and wires. The cost of a single wooden pole is $120 and the electric cable retails at $0.40 per meter. The cost of buying electricity from the grid per KWh is $ 0.2187 (as of April 2022). The cost of selling to the grid is at $ 0.12 per KWh. Kenya Power and Lighting Company does not charge for demand rate for domestic and residential use. The tariff structure (residential, commercial etc) and surcharges incurred on the cost per kWh for domestic use are tabulated in Ref [13].
2.2.3. Economic Evaluation
Economic evaluation's main purpose is to investigate whether a hydropower project is economically feasible or not. In the study the commonly used methods for economic evaluation include investigating the Net Present Cost (NPC), Return on Investment (ROI), Internal Rate of Return and Payback period.
Net Present Cost: Net Present Cost is used to evaluate the total cost of a project over its lifetime to the total cost today(present) by taking into account the time value of money. This helps in analyzing the value of investment put in a project. It can be simply defined as the difference between revenue and expenses discounted with a fixed periodic interest rate. The computed NPC with negative value is usually discarded because the discounted benefits over the lifetime of the project cannot cover the value of the initial cost of the project. In a group of proposed projects, the one with the highest computed positive value of NPC is the one chosen. NPC is highly sensitive to the discount rates, which in turn depend on the rate of inflation. Slight changes in the discount rate may change the profitability of a project drastically. The discount rate of hydropower projects is usually between 5-12%. The NPC of a given project is given by:
where Co is the investment cost, C1, C2… CT is the cash flow, r is the discount rate, and T is the project period/time
Simple Payback Period (SPBP): This refers to the amount of time needed to recover the money spent in an investment or reach a break-even point and is given by
where Icc is the Initial capital cost of the system, and Annual savings = Annual cost of proposed system - Annual cost of the base system. In engineering projects, 5 years is an acceptable simple payback period. The SPBP is a useful tool in the quick assessment of the viability of a project or system even though it does not take into account the time value of money.
3. Results
3.1. System Design
System design is done using the HOMER software. It requires several bits of information, important amongst which are summarized below:
Flow rate: The discharge rate of the Rutui river was obtained from the conversion from daily water records using rating curve, and is shown in Figure 6 (from Ref [14]). The minimum 10- day discharge of the river is 3.68 m3 in the month of February while the maximum discharge is 12.84 m3 in the month of May.
Base Load Data: The load profile of Rutui village is predicted according to Ref [15]. The average daily KWh used per household is estimated as 3.96 which falls within the actual real life estimates of daily household Electricity usage in Kenya. The load profile has been scaled to 474 KWh/day made up of 120 households with a peak load of 74.05KW and a load factor of 0.27. The load profile is shown in Figure 7.
Turbine output power and Energy: The head and the flow rate are the two crucial factors for hydroelectric generation. The power generated in the turbine can be computed by equation (1) Output power of 50Kw is desired for the proposed micro hydro project. Turbine selection criteria depends on the turbine selection chart and the capital cost of the entire project [10]. From Fig 1, both Crossflow and Kaplan Turbine are suitable for the desired output power. Using capital cost vs head computations for different turbine types (but rated for 50kW), the winning turbine is the crossflow turbine with the head of 18 m and a total capital cost of $123,994. The choice of the cross-flow turbine parameters are discussed in detail in [10], and summarized below. Generator selection is also outlined in [10], but omitted here.
3.2. Feasibility Analysis
Homer Pro software is utilized to do the economic evaluations and ranking of the systems based on the least cost system. Our starting point is the nominal values used in the design, tabulated in Table 3 and Table 4 below.
Economic parameters of interest can then be varied using the “Economics” parameter section of Homer-Pro.
Revenue and Simple Payback Period: The revenue of the proposed system calculated from the difference between the energy purchases from energy sales. The values used are: Load Consumption = 173010 KWh/year, Grid buying = $0.20/KWh, Grid selling = $0.12/KWh
Grid + hydro: Grid Sales = (267174*0.12) = 32060.88, Grid purchases = (1654*0.20) = 330.80, O&M costs = 3720, Revenue (Grid + hydro) = Grid sales – (Grid purchases + O&M) =$28010.08
Grid only: Grid purchases = (173010*0.20) =34602, Grid sales = 0, Revenue (Grid only) = $-34602.
Total revenue = Revenue (Grid + hydro) - Revenue (Grid only) = $62612.08.
Icc = Capital of Hydro + capital of Grid = 123994 + 70373 = $194,367.
SPBP = Icc/ Total revenue = 194367/62612.08 = 3.1 Years
Cost and revenue calculations are carried out in detail in [10], with some details mentioned here: the total capital cost of the project is $ 123,994 (divided into civil work construction of the plant and electromechanical equipment costs), the operation and maintenance (O&M) cost of the project is set at 3% of the capital cost, which is $3720/year.
Cash flow: Calculation of the cash flow of the proposed system needs the capital cost, the annual revenue, O&M cost, the lifetime of the component and replacement cost, the total lifetime of the project and salvage value of the project to be taken into account.
In our work, the component lifetime is 25 years with 50% replacement cost on the turbine capital cost of 123,994. The total lifetime of the project is 40 years and a salvage value of the system is calculated (details in [10]) to be $ 24798.80. The cumulative cashflow of the project is shown below in Fig. 8, and discussed in more detail in the next section.
We also discuss other measures such as Net Present Cost (NPC), calculated as $412,745 for this project, and and Internal Rate of Return (IRR) of 32.2%, with details in [10].
4. Discussion
This work presents a techno-economic analysis of micro-hydropower potential of the Rutui river region for rural electrification, using publicly available data from the region.
4.1. Nominal case
For the nominal values we used in the previous section, the main results are summarized below:
- a.
- The electrical load of Rutui village of 173010KWh/yr is met by the proposed grid connected micro hydropower plant. The hydro plant has a nominal capacity of 55.6KW with a maximum output of 50.1KW and 90% capacity factor.
- b.
- The energy production of the hydro plant meets 99.6% of the load requirement and the rest supplemented by the grid. This makes 99.6% of the proposed project renewable.
- c.
- The Rutui village AC primary load accounts for 39.3% of the total energy consumption from the hydro plant with 60.7% of the excess energy sold to the grid. 1654 KWh/y is purchased from the grid during peak hours when hydropower alone cannot meet the load demands.
- d.
- The proposed system has a capital cost of $194367 with the cost/KW value of $2475 which falls under the normal investment cost in hydropower of $2000-$4000 per KW. The simple payback period of the plant is 3.10 years which falls under the 8-year period recommended for a viable hydropower project.
- e.
- The system has a net present cost of $ 412745 which is $ 74370 more than the base system net present cost of $338375. A positive NPC show a viable and acceptable project.
- f.
- The internal rate of return of the proposed system is 32.2% with a return of investment of 29.2%. The larger the IRR percentage the more suitable a project is deemed.
- g.
- The cash flow bar chart represent how money is distributed through the 40-year lifetime of the project. Year 0-1 shows a negative cash flow attributed to by the $194367 investment cost of the project. Year 1-40 represent the annual operational cost required to run the proposed system.
- h.
- In year 25 in addition to the operation cost there is a negative cash flow attributed to by the replacement cost of the turbine and its components.
- i.
- In year 40 in addition to the operation cost there is and additional revenue attributed to by the salvage value of the project.
Clearly, the above results indicate the feasibility of using micro-hydropower for rural electrification, with all economic parameters (revenue, cash flow) being positive. A natural question to ask is what happens if the underlying assumptions were to change. This is discussed in the next subsection.
4.2. Sensitivity Analysis
Sensitivity analysis is done using the HOMER-Pro software. The software helps answer questions like what if the real discount rate changes? What if the amount invested changes? Will the project still be viable? In our model the target variable to be analyzed are the simple payback period, discounted payback period, cost/KWh, net present value and the internal rate of return. The input variables are investment cost, discount rate, inflation rate, and annual load growth. We present 2 cases:
- a.
- Hybrid hydro + grid
- b.
- Standalone hydro system, and
4.2.1. Hybrid hydro + grid system
For the above configuration, we perform various types of sensitivity analyses.
A: Sensitivity to investment cost: The NPV, simple payback period, discounted payback period, cost/KWh and IRR are all highly sensitive to the investment cost. As tabulated below in Table 5, for investment costs chnaging over the range $2000/KW – $ 4000/KW, the lower the investment cost the better returns on investment and the shorter the payback period.
B: Sensitivity to discount rates: The NPV, simple payback period, discounted payback period, cost/KWh and IRR are also highly sensitive to the discount rate. As tabulated in Table 6, the lower the value of the discount rate the better the value of money in the future and the shorter the discounted payback period.
4.2.2. Standalone hydro system
For the above configuration, software a maximum annual capacity shortage of 5% is added under the design constraint. This enables the system to simulate with or without meeting the load demands. The sensitivity analyses results, similar to that in the previous subsection, are tabulated below, in Table 7 and Table 8.
Before we present our conclusions in the next section, we answer the natural question that one might ask, “which is better, a standalone system or the hybrid one?”. The investment cost, the net present value, the internal rate of return and the simple payback period comparison are compared as shown in Figure 9, Figure 10 and Figure 11 below.
It can be seen from the above comparison that the microgrid hydro is the most economical with higher net present value, higher internal rate of return and lower payback period.
5. Conclusions
This study showed the techno-economic feasibility of micro-hydropower for rural electrification in Kenya, particularly in the River Rutui region. When this work was presented at the PECI 2023 conference [9], the authors were asked about the social/political will to participate in renewable energy projects in Kenya. While that is outside the scope of our techno-economic study, we feel that Ref [16] discusses the “clean energy transition” in Kenya in quite some detail, and the concluding portions of that study have been paraphrased below for brevity/conciseness, and validate the relevance of our present work:
“Due to Kenya’s fast-growing population (~2% per year) and rapid economic expansion, power consumption levels are increasing rapidly and are predicted to rise further in the coming decades. Kenya’s mission to become a middle-income country and regional economic leader by the end of this decade means it is set to become one of the most energy-intensive countries in Sub-Saharan Africa. Therefore, Kenya must be prepared to satisfy an ever-increasing power demand in the long term. An alternative scenario to increasing fossil fuel production would be the implementation of a clean energy transition (CET), a solution where the power sector is formed of ~100% renewable energy generation and energy-efficiency (EE) technologies are effectively employed to reduce energy production levels needed to meet increased demand, lowering overall system costs by 2030. This provides Kenya with an opportunity to transform its power sector, fulfilling the Vision 2030 goal of reaching middle-income economic status, and become a regional and international leader in renewable energy production. The introduction of a CET would allow Kenya to harness its wealth of renewable resource potential and solidify its position in the Sub-Saharan region by spearheading a wave of energy transitions.
Despite capital costs decreasing rapidly, renewable energy systems remain cost-intensive procedures, and financing constraints could limit the development of such technologies within Kenya. The high initial investment costs needed to pursue large-scale renewable projects, due to the lack of readily available RE equipment and the absence of long-term loans, may discourage prospective investors in Kenya. Therefore, it may be that small-scale, off-grid and mini-grid community projects at a local scale are instead prioritised as alternative and more-accessible power sources for future development within Kenya”.
Author Contributions
Conceptualization, methodology, software, formal analysis, investigation, and writing—original draft preparation, John Edwards Limo; writing—review and editing, project administration and funding acquisition, Sridhar Seshagiri. All authors have read and agreed to the published version of the manuscript.
Funding
This work was supported financially in part by the SDSU University Grants Program.
Data Availability Statement
All of the data used in this study are cited in the References section. The results were generated both using Homer Pro software, and Matlab, with the matlab code included in the Appendix.
Conflicts of Interest
The authors declare no conflicts of interest.
Appendix
AppendixA: Matlab Code: Capital Cost Comparison
P=50.0388; %Power
H=[4,5,6,7,8,9,10,11,12,13,14,15,16,17,18]; %Head
%Civil cost
C1=186.216*P^(-0.2368)*H.^(-0.0597);
C2=1389.19*P^(-0.2351)*H.^(-0.0585);
Cc=C1+C2;
%Turbine cost
Ckaplan=39398*P^(-0.58338)*H.^(-0.113901);
Ccross=10486.65*P^(-0.3644725)*H.^(-0.281735);
%Generator auxiliary and transformer
Cgen=1179.86*P^(-0.1855)*H.^(-0.2083);
Caux=612.87*P^(-0.1892)*H.^(-0.2118);
Ctrans=281*P^(-0.1803)*H.^(-0.2075);
%Total cost
%Kaplan
Total_cost_per_Kw_Kaplan=1.13*(Cc+Ckaplan+Cgen+Caux+Ctrans);
Capital_cost_Kaplan=Total_cost_per_Kw_Kaplan*P;
Total_cost_per_Kw_cross=1.13*(Cc+Ccross+Cgen+Caux+Ctrans);
Capital_cost_cross=Total_cost_per_Kw_cross*P;
x=H;
y=Capital_cost_Kaplan;
x1=H;
y1=Capital_cost_cross;
figure
plot(x,y,'-*',x1,y1,'-o')
title('Capital Cost VS Head for 50KW Hydro')
xlabel('Head(m)')
ylabel('Capital cost(USD)')
legend('Kaplan Turbine','Crossflow turbine')
grid on
Appendix B: Matlab Code: Hydroplant Specifications
H=18;
rho=1000;
g=9.8;
efficiency=0.7;
Power=50038.8;
P=Power/1000;
Q=Power/(rho*H*g*efficiency);
n= 0.012; %concrete manning factor n
%kirinyaga county slope is 10 degrees, therefore Length of penstock (Lp)is
Lp=H/(sind(10));% in meters
%Crossflow Turbine design
%Specific speed Ns range 40-200
Ns_max=650*H^(-0.5);
Ns=513.55/(H^(0.505));
%Turbine rotary speed
f=50;
Poles=4; %design
N=(Ns*H^(5/4))/(P^(0.5));
N_design=120*f/Poles;
Gear_ratio=N_design/N;
%Runner diameter and breath
ku1=0.46;
Kc=0.98;
V1=Kc*((2*g*H)^(0.5));
U1=V1*ku1;
D1=60*U1/(pi*N);
D2=(2/3)*D1;
So=0.17*D1;
L=Q/(So*V1);
L1=1.1*L;
lower_lim=0.16;
upper_lim=21.24/(H^(0.85));
L1_D1=L1/D1;
%Blade Curvature
R1=D1/2;
R2=D1/3;
r=0.16*D1;
Ro=((R2^(2))+(r^(2)))^(0.5);
Z=26;% number of blades
P1_P2=(2*pi*Ro)/Z;
ds=150*((P/N)^(1/3)); %Shaft diameter
dp=2.69*(n^(2)*Q^(2)*Lp/H)^(0.1875); %Penstock diameter and thickness
Appendix C: Matlab Code: Economic Analysis
%Civil Cost
C1=186.216*P^(-0.2368)*H^(-0.0597);
C2=1389.19*P^(-0.2351)*H^(-0.0585);
Cc=C1+C2;
%Turbine cost
Ccross=10486.65*P^(-0.3644725)*H^(-0.281735);
Cgen=1179.86*P^(-0.1855)*H^(-0.2083);
Caux=612.87*P^(-0.1892)*H^(-0.2118);
Ctrans=281*P^(-0.1803)*H^(-0.2075);
Total_cost_per_Kw_cross=1.13*(Cc+Ccross+Cgen+Caux+Ctrans);
Capital_cost_cross=vpa(Total_cost_per_Kw_cross*P)
Replacement_cost=vpa(0.5*Capital_cost_cross)
O_M=vpa(0.03*Capital_cost_cross)
%grid inteconnection cost
D_grid=20000;% Distance from grid in meters
W_pole_spacing=91; %meters
W_Pole_price=120;
Wire_price=0.4;
Households=120;
threephase_fee=500;
onephase_fee=350;
W_poles=vpa((D_grid/W_pole_spacing),2)
threephase_grid_cost=((Households/3)*threephase_fee)+(Wire_price*3*D_grid)+(W_poles*W_Pole_price)
onephase_grid_cost=((Households)*onephase_fee)+(Wire_price*2*D_grid)+(W_poles*W_Pole_price)
References
- C. Oludhe, “Renewable Energy Resources in Kenya,” Developments in Earth Surface Processes, Jan. 2013, Vol. 16, pp. 115–122. [CrossRef]
- J. K. Kiplagat; R. Z. Wang; and T. X. Li, “Renewable energy in Kenya: Resource potential and status of exploitation,” Renewable and Sustainable Energy Reviews, 2011, Vol. 15, pp. 2960–2973. [CrossRef]
- “Kenya Vision 2030 | Kenya Vision 2030.” https://vision2030.go.ke/ (accessed Nov. 24, 2022).
- “Renewable energy law and regulation in Kenya | CMS Expert Guides.” https://cms.law/en/int/expert-guides/cms-expert-guide-to-renewable-energy/kenya (accessed Nov. 24, 2022).
- S. H. Development; and E. R. Ngure, “Kenya Country Report 2018 Seminar on Water Resource’s Management & Small Hydropower Development for countries along the Belt and Road”.
- Renewable Energy Agency, “RENEWABLE ENERGY TECHNOLOGIES: COST ANALYSIS SERIES,” 2012. [Online]. Available: www.irena.org/Publications.
- P. Maher, “Community Pico Hydro in Sub-Saharan Africa/ Case Study One/ Kathamba, Kirinyaga District, Kenya Community Pico Hydro in Sub-Saharan Africa: Case Study 1 Site: Kathamba, Kirinyaga District, Kenya.
- P. Maher, “Community Pico Hydro in Sub-Saharan Africa/ Case Study Two/Thima, Kirinyaga District, Kenya Community Pico Hydro in Sub-Saharan Africa: Case Study 2 Site: Thima, Kirinyaga District, Kenya.
- John E. Limo; S. Seshagiri, “Feasibility Study of MicroHydropower Potential of River Rutui as part of Rural Electrification in Kenya”, In Proceedings of the IEEE Power and Energy Conference (PECI), Illinois, USA, 2023.
- John, E. Limo, “Feasibility Study of MicroHydropower Potential of River Rutui as part of Rural Electrification in Kenya”, Masters Project, San Diego State University, Spring 2023.
- “Types of Hydropower Turbines | Department of Energy.” https://www.energy.gov/eere/water/types-hydropower-turbines (accessed Nov. 25, 2022).
- “Turbine selection chart.” https://www.pumpfundamentals.com/turbine%20selection%20chart.htm (accessed Nov. 25, 2022).
- “Electricity cost in Kenya.” https://www.stimatracker.com/ (accessed Nov. 24, 2022).
- JIKA, “Feasibility Study on the Mwea Irrigation Development Project,” 1988. [Online]. Available: https://openjicareport.jica.go.jp/pdf/10416436.
- J. Namaganda-Kiyimba, J. Mutale, B. Azzopardi, B. Domenech, and A. García-Villoria, “Improving the Load Estimation Process in the Design of Rural Electrification Systems,” Energies 2021, Sep. 2021, Vol. 14, pp. 5505-5512. [CrossRef]
- Fields, N.; Ryves, D.; Yeganyan, R.; Cannone, C.; Tan, N.; Howells, M. Evidence-Based Policymaking: Insights and Recommendations for the Implementation of Clean Energy Transition Pathways for Kenya’s Power Sector. Energies 2023, 16, 7904. [Google Scholar] [CrossRef]
Figure 1.
Turbine Selection Chart [12].
Figure 1.
Turbine Selection Chart [12].
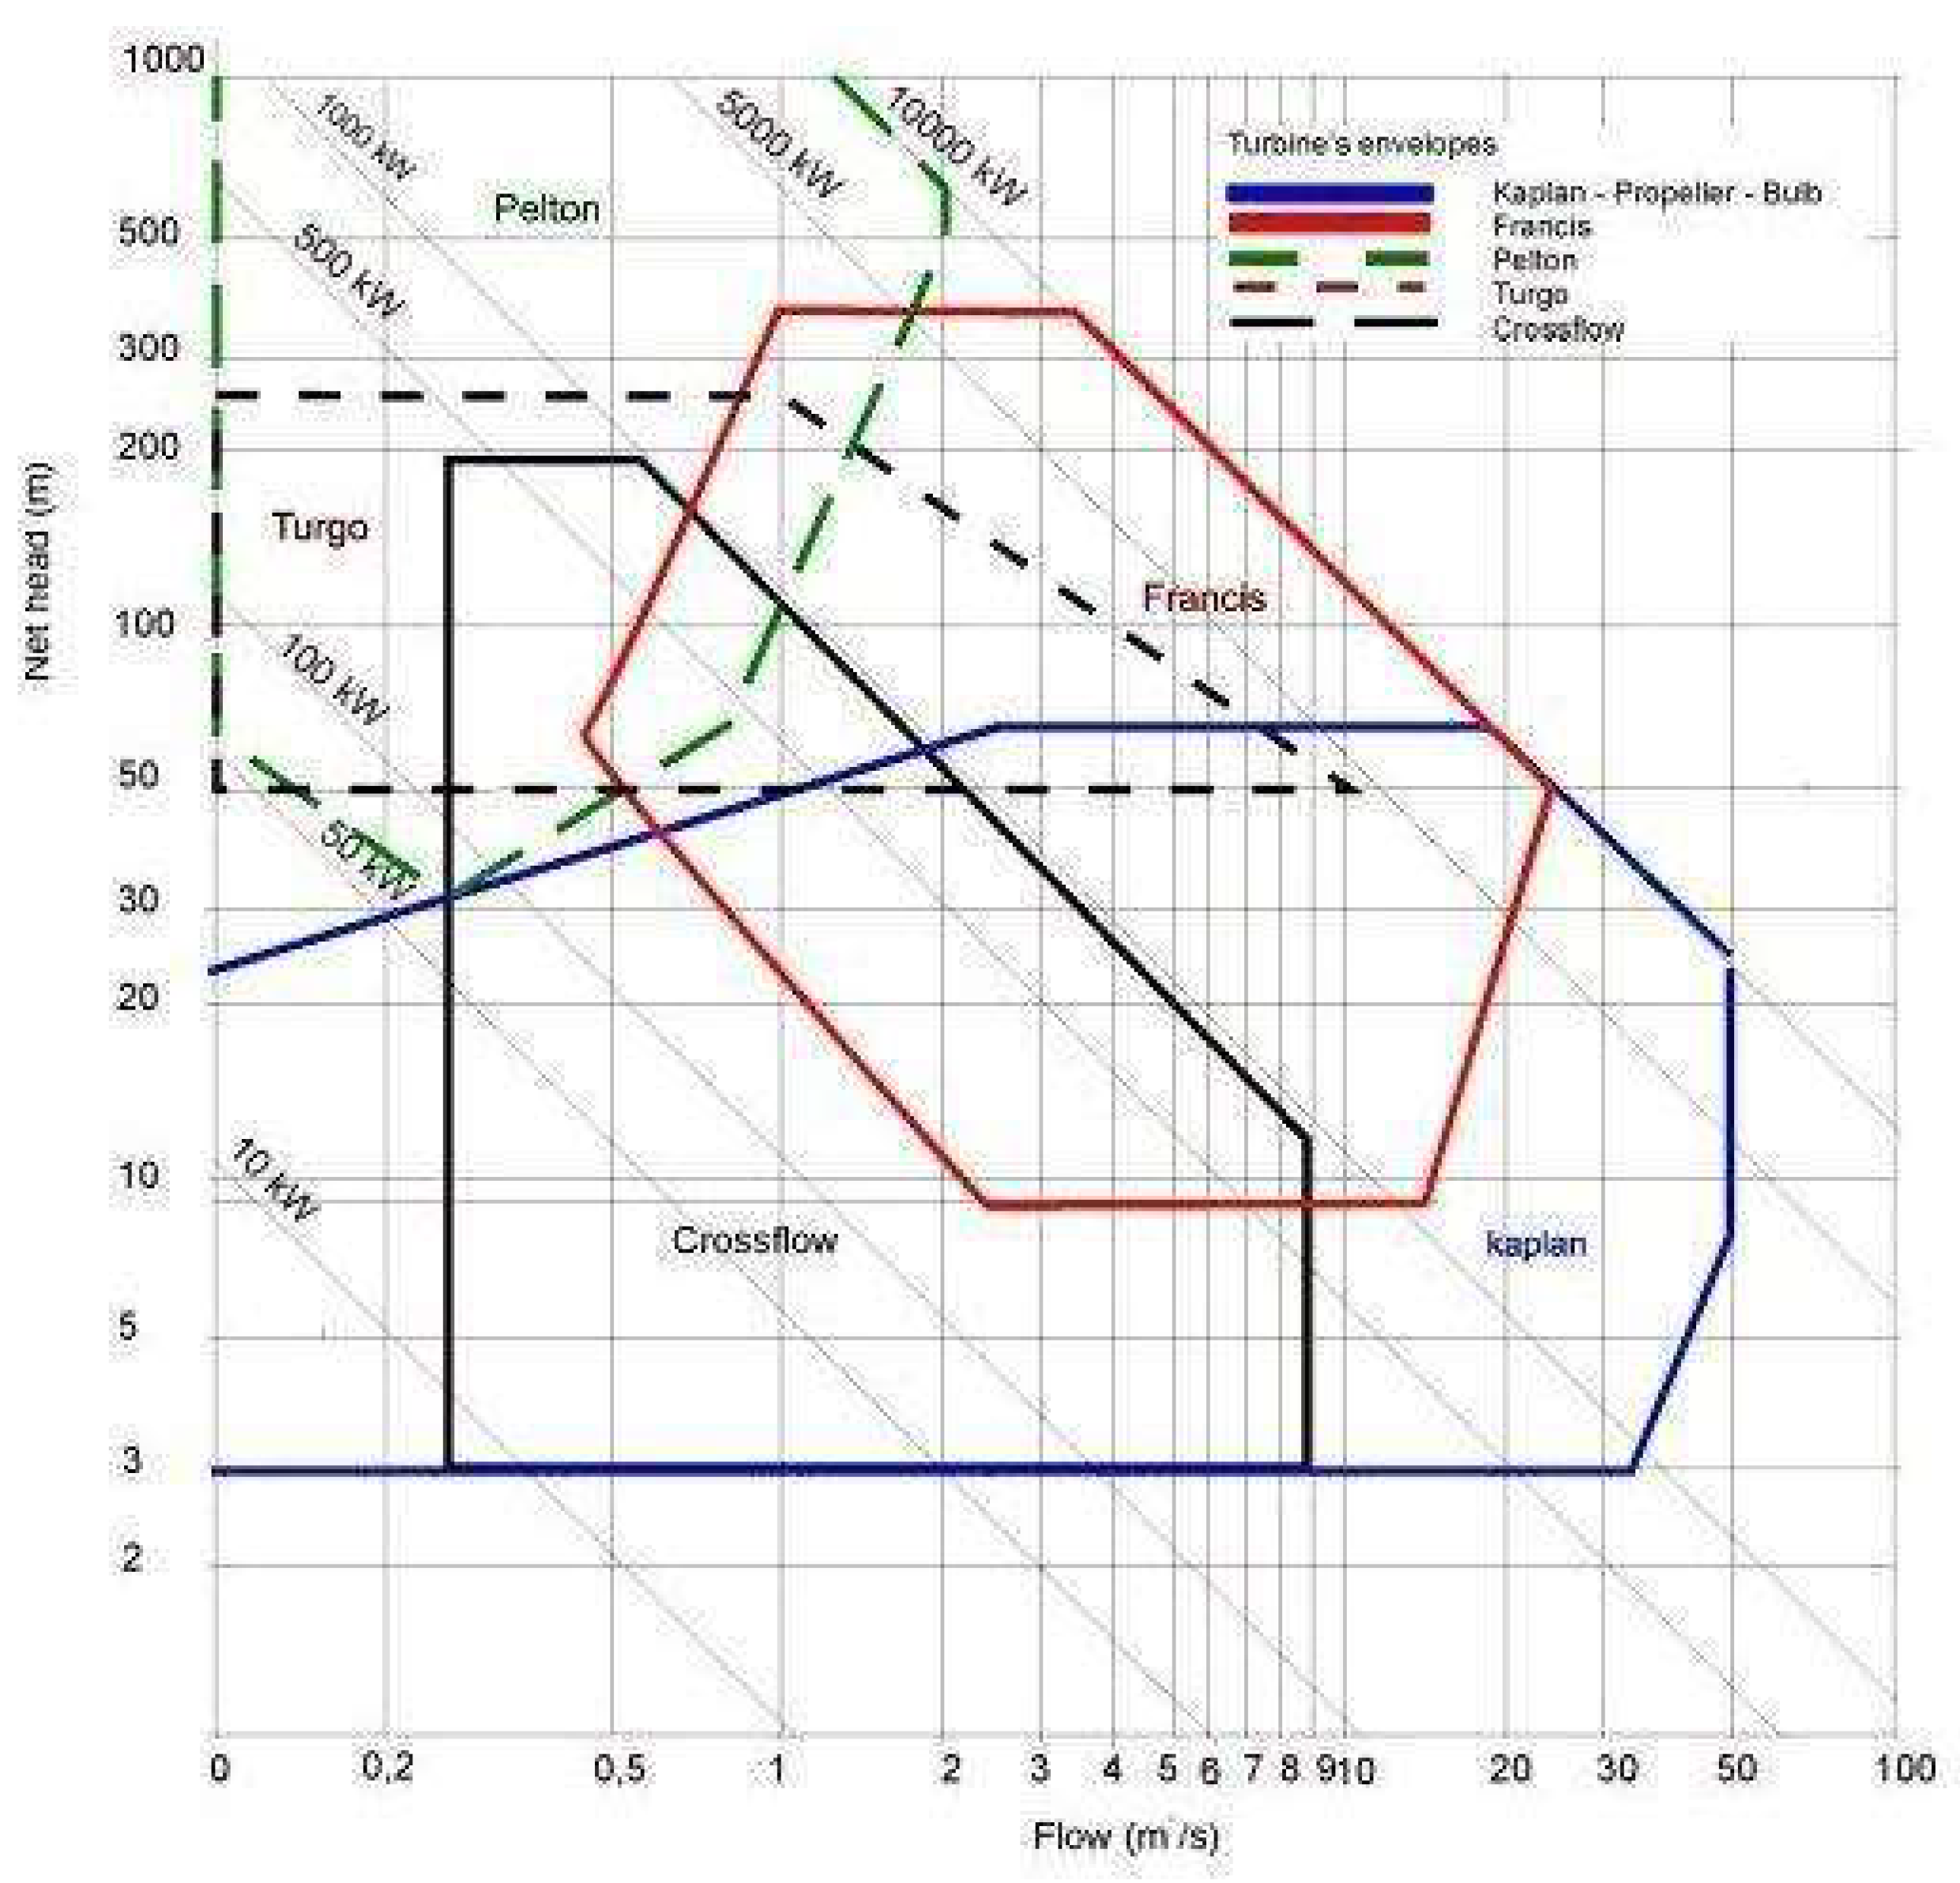
Figure 3.
Total Installed Hydropower Cost Ranges by Country (Ref [6]).
Figure 3.
Total Installed Hydropower Cost Ranges by Country (Ref [6]).
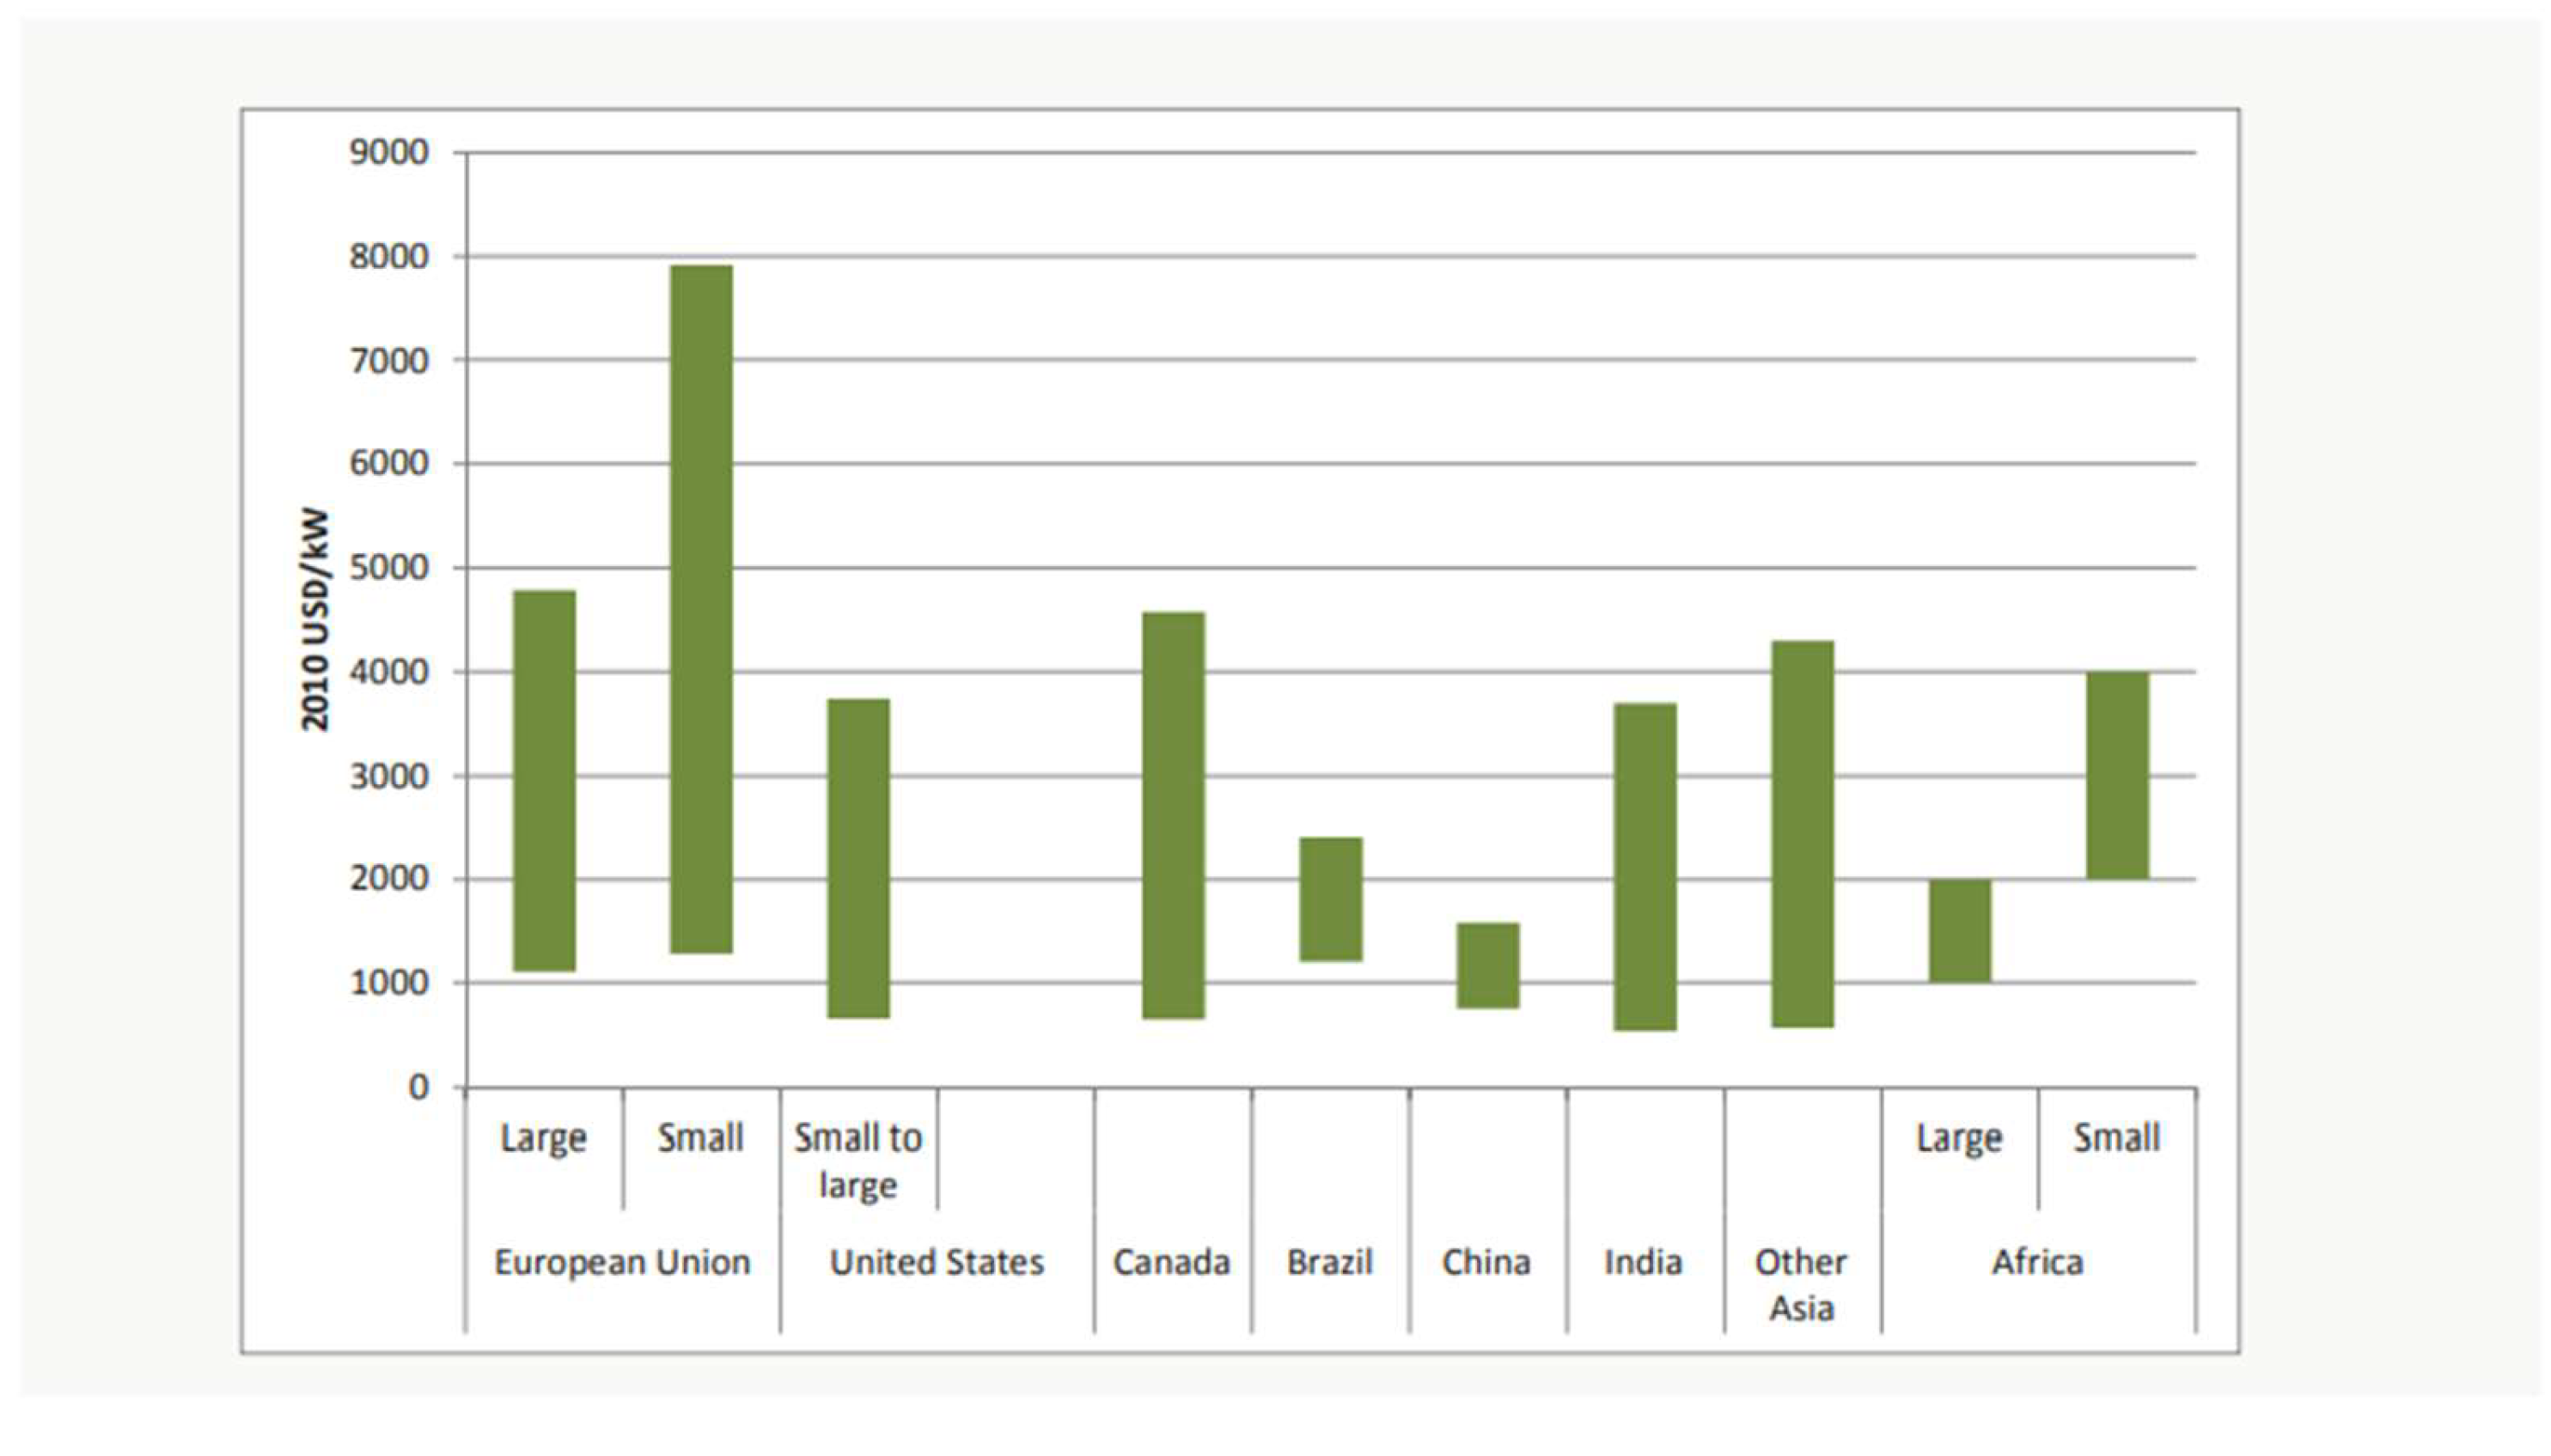
Figure 4.
Investment Cost as a Function of Installed Capacity and Turbine Head (Ref [6]).
Figure 4.
Investment Cost as a Function of Installed Capacity and Turbine Head (Ref [6]).
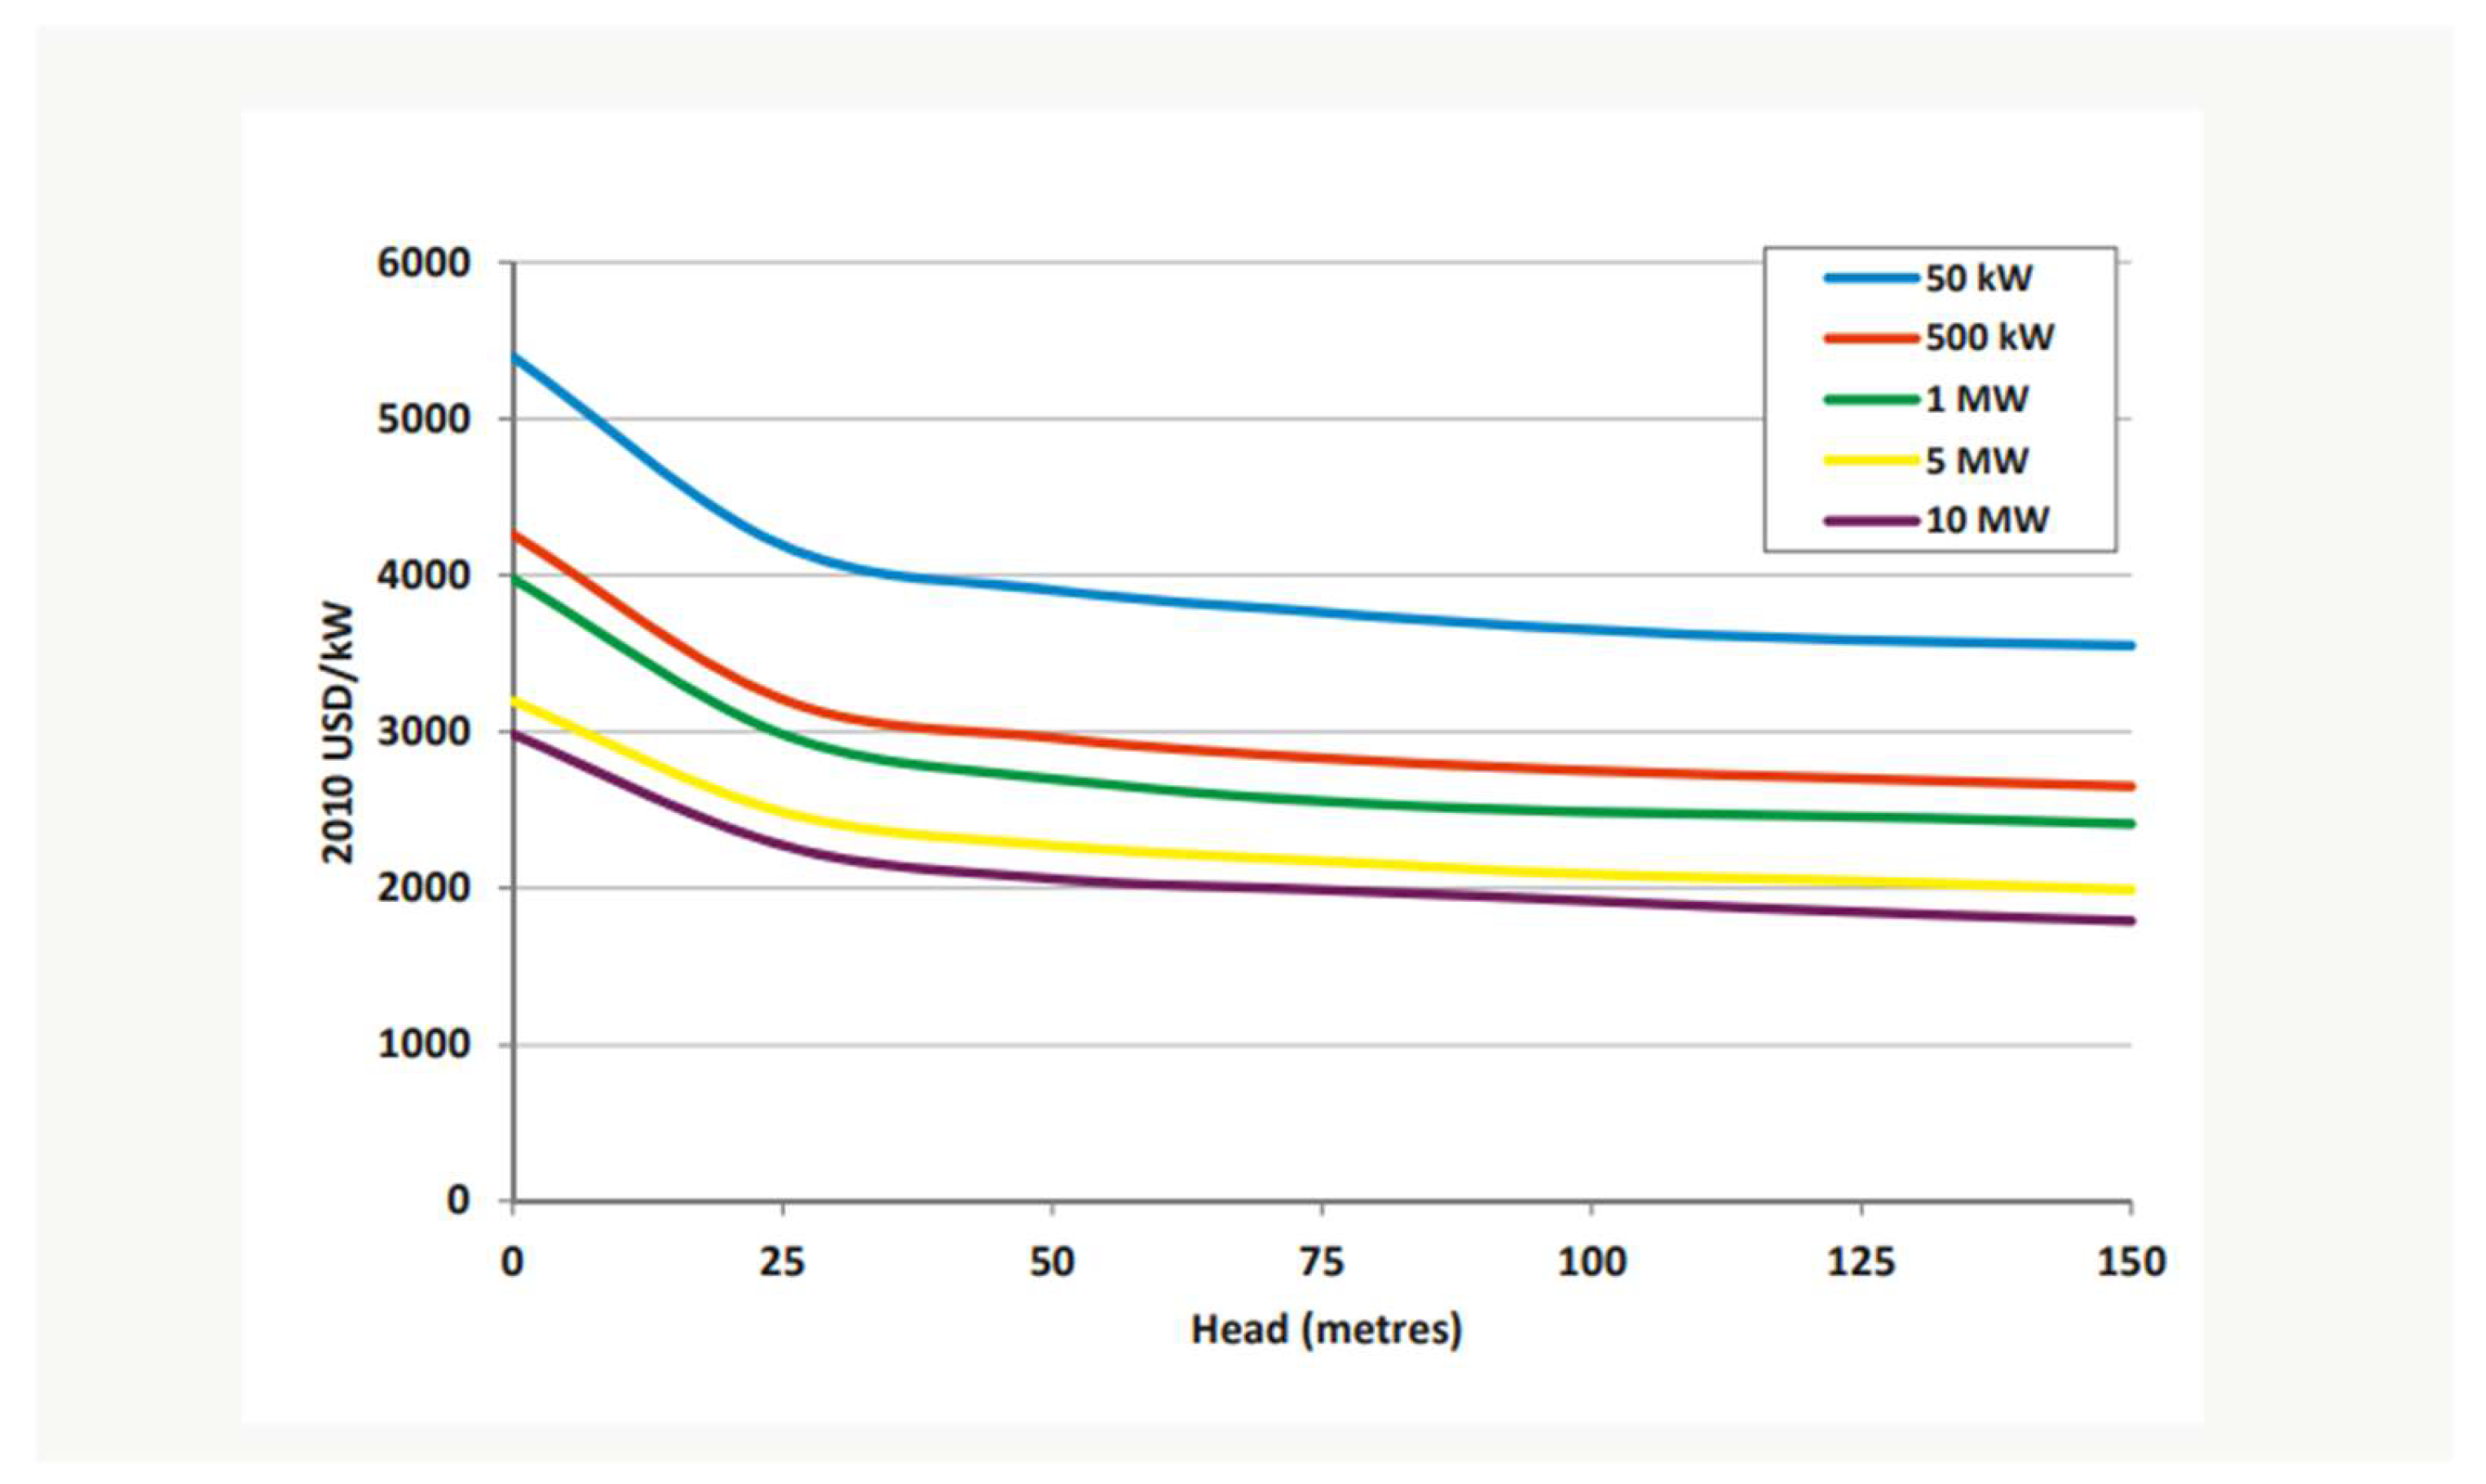
Figure 5.
O&M Cost for Small Hydro in Developing Countries (Ref [6]).
Figure 5.
O&M Cost for Small Hydro in Developing Countries (Ref [6]).
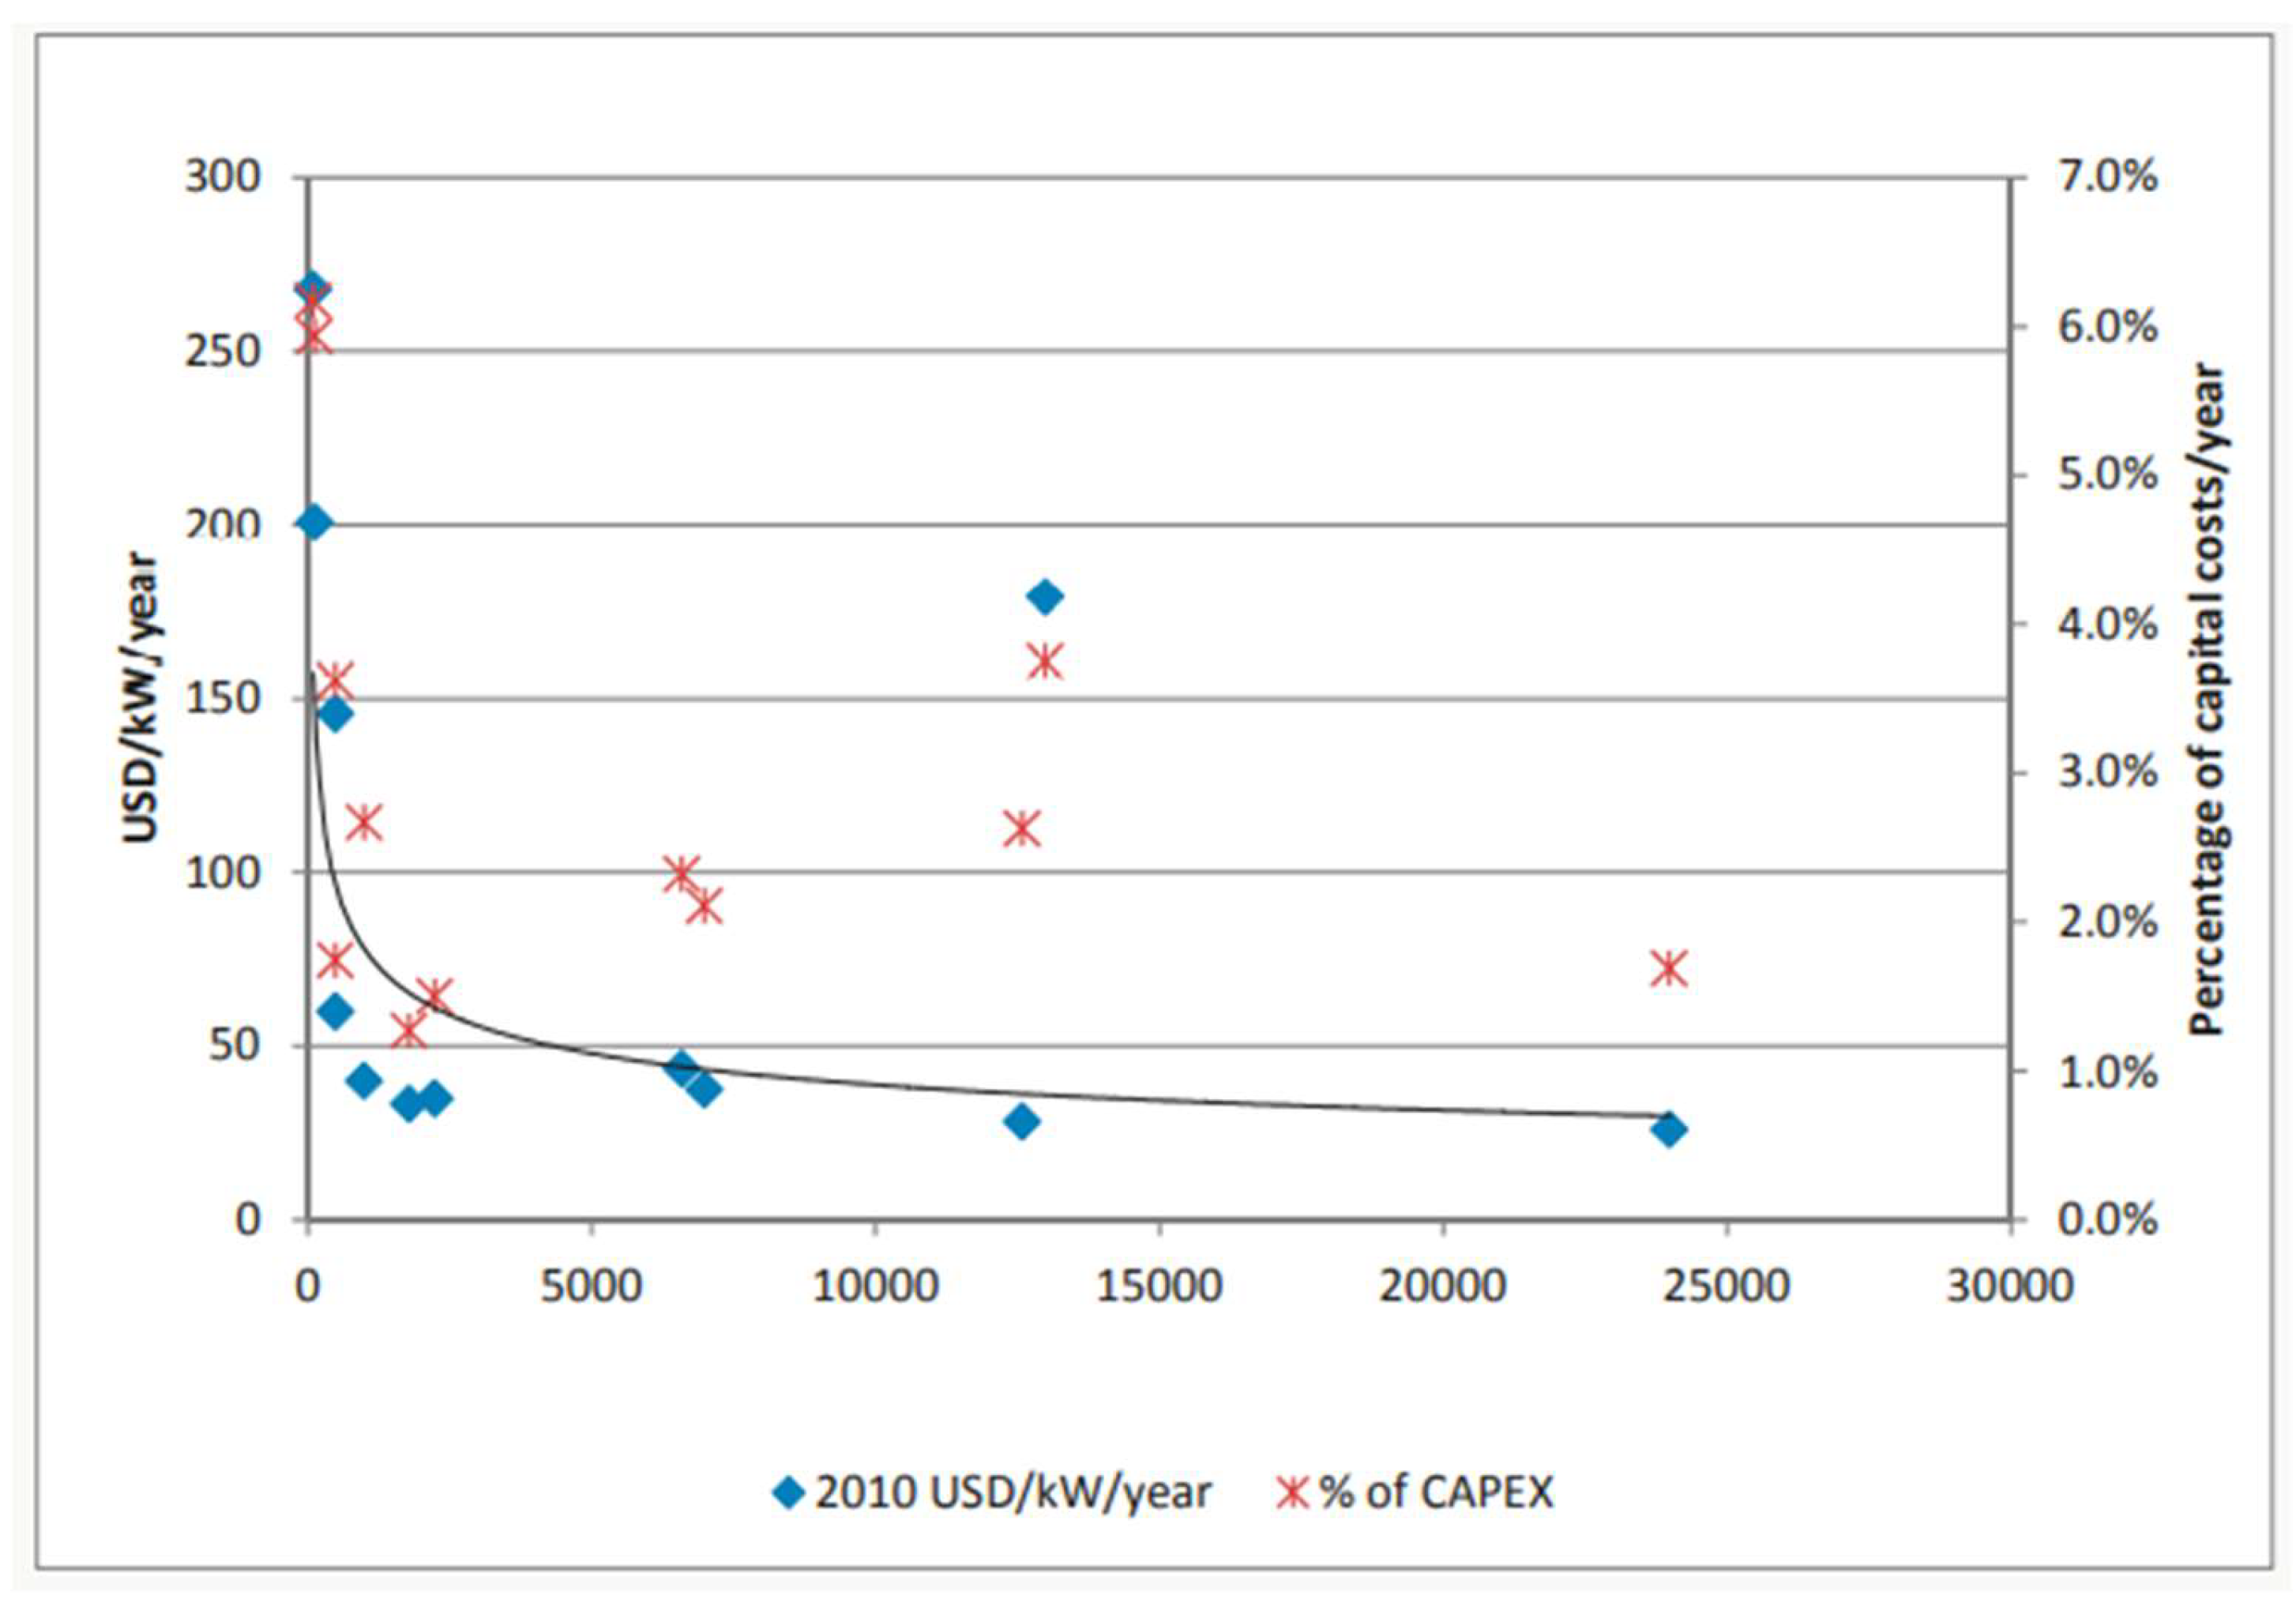
Figure 6.
River Rutui Flow Rate (Ref [14]).
Figure 6.
River Rutui Flow Rate (Ref [14]).
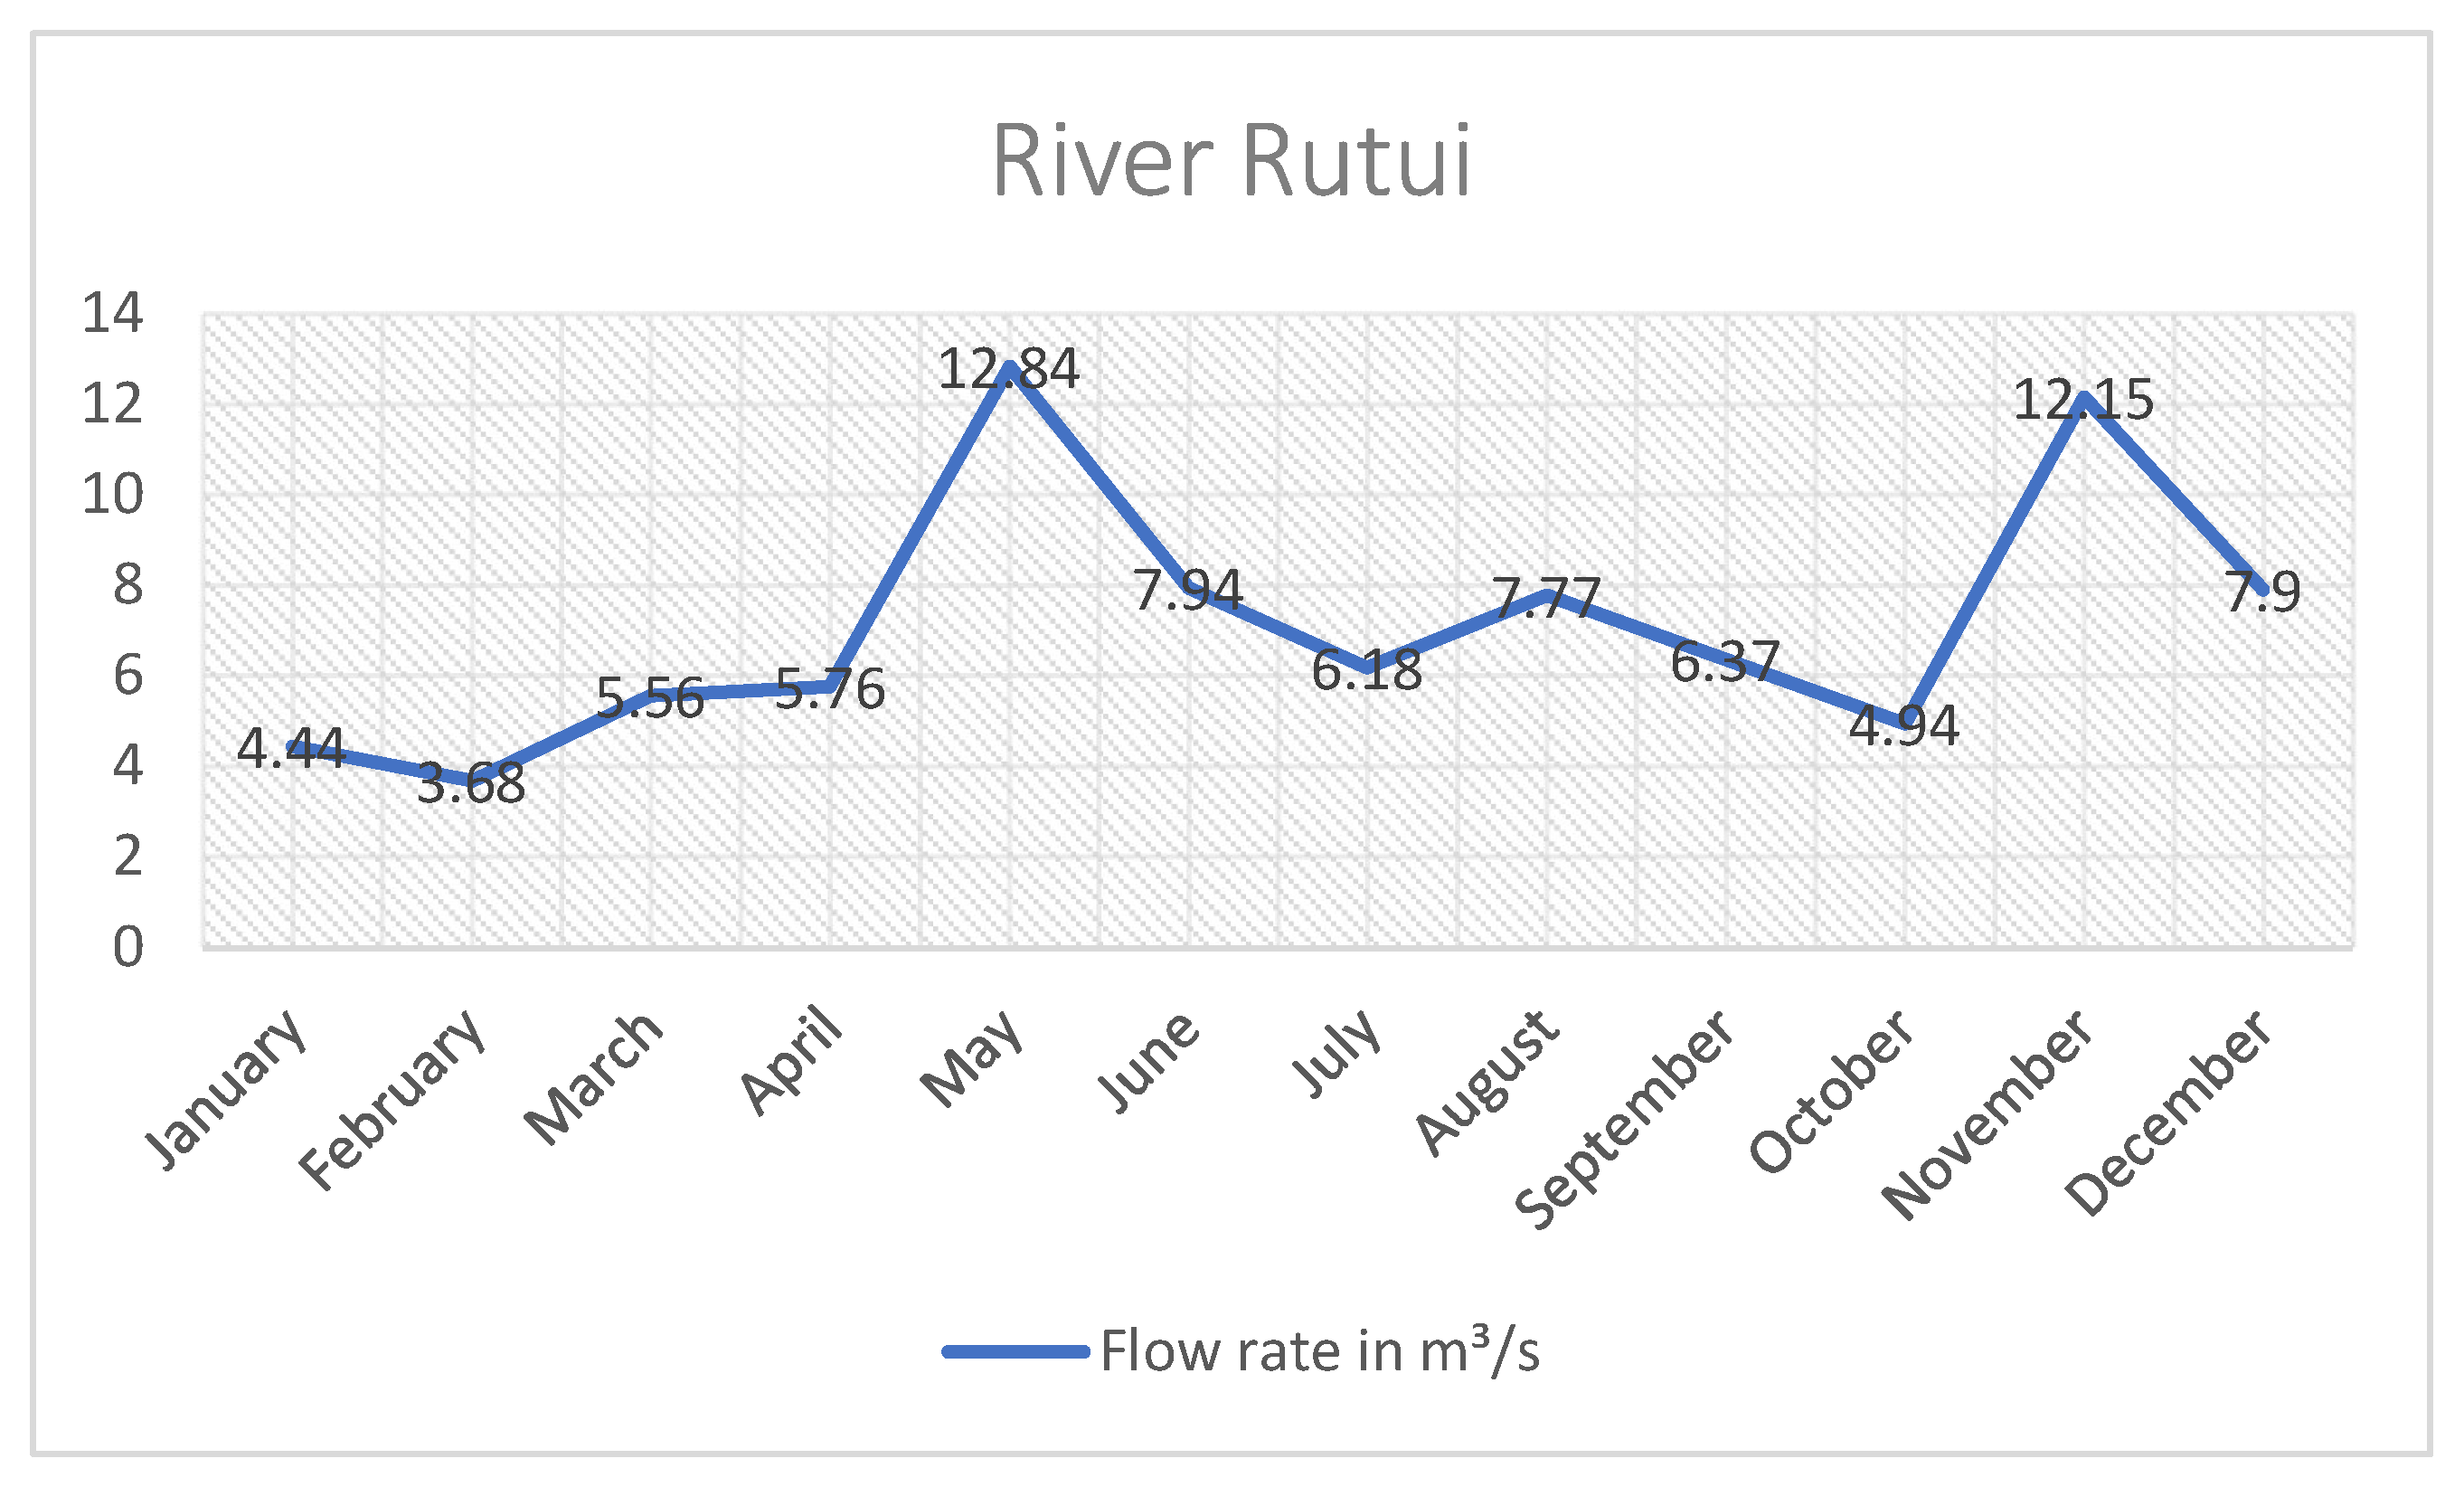
Figure 7.
Rutui Village Load Profile (Ref [15]).
Figure 7.
Rutui Village Load Profile (Ref [15]).
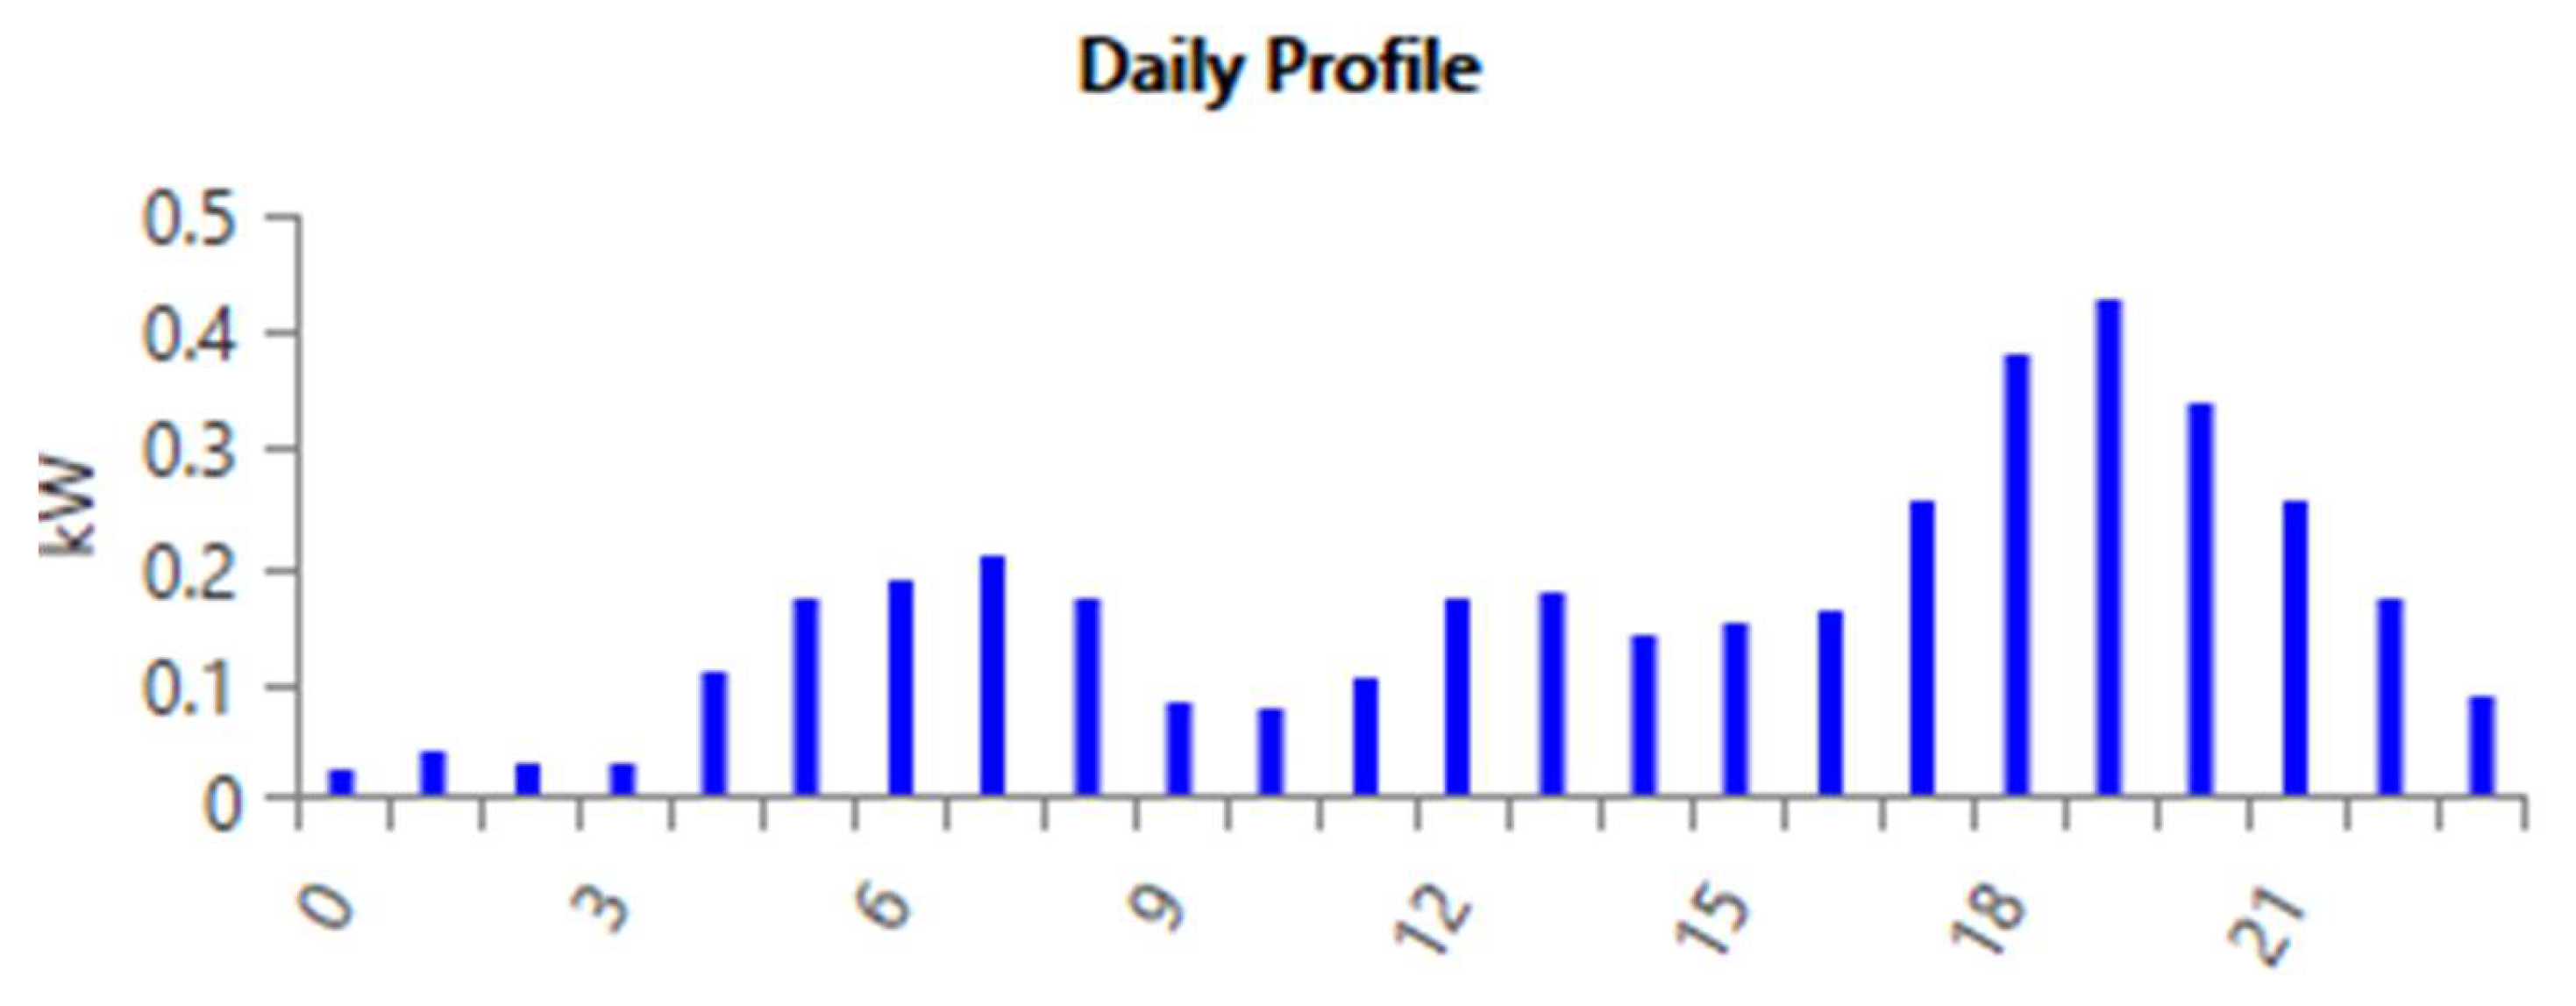
Figure 8.
Cumulative Cash flow of the proposed project.
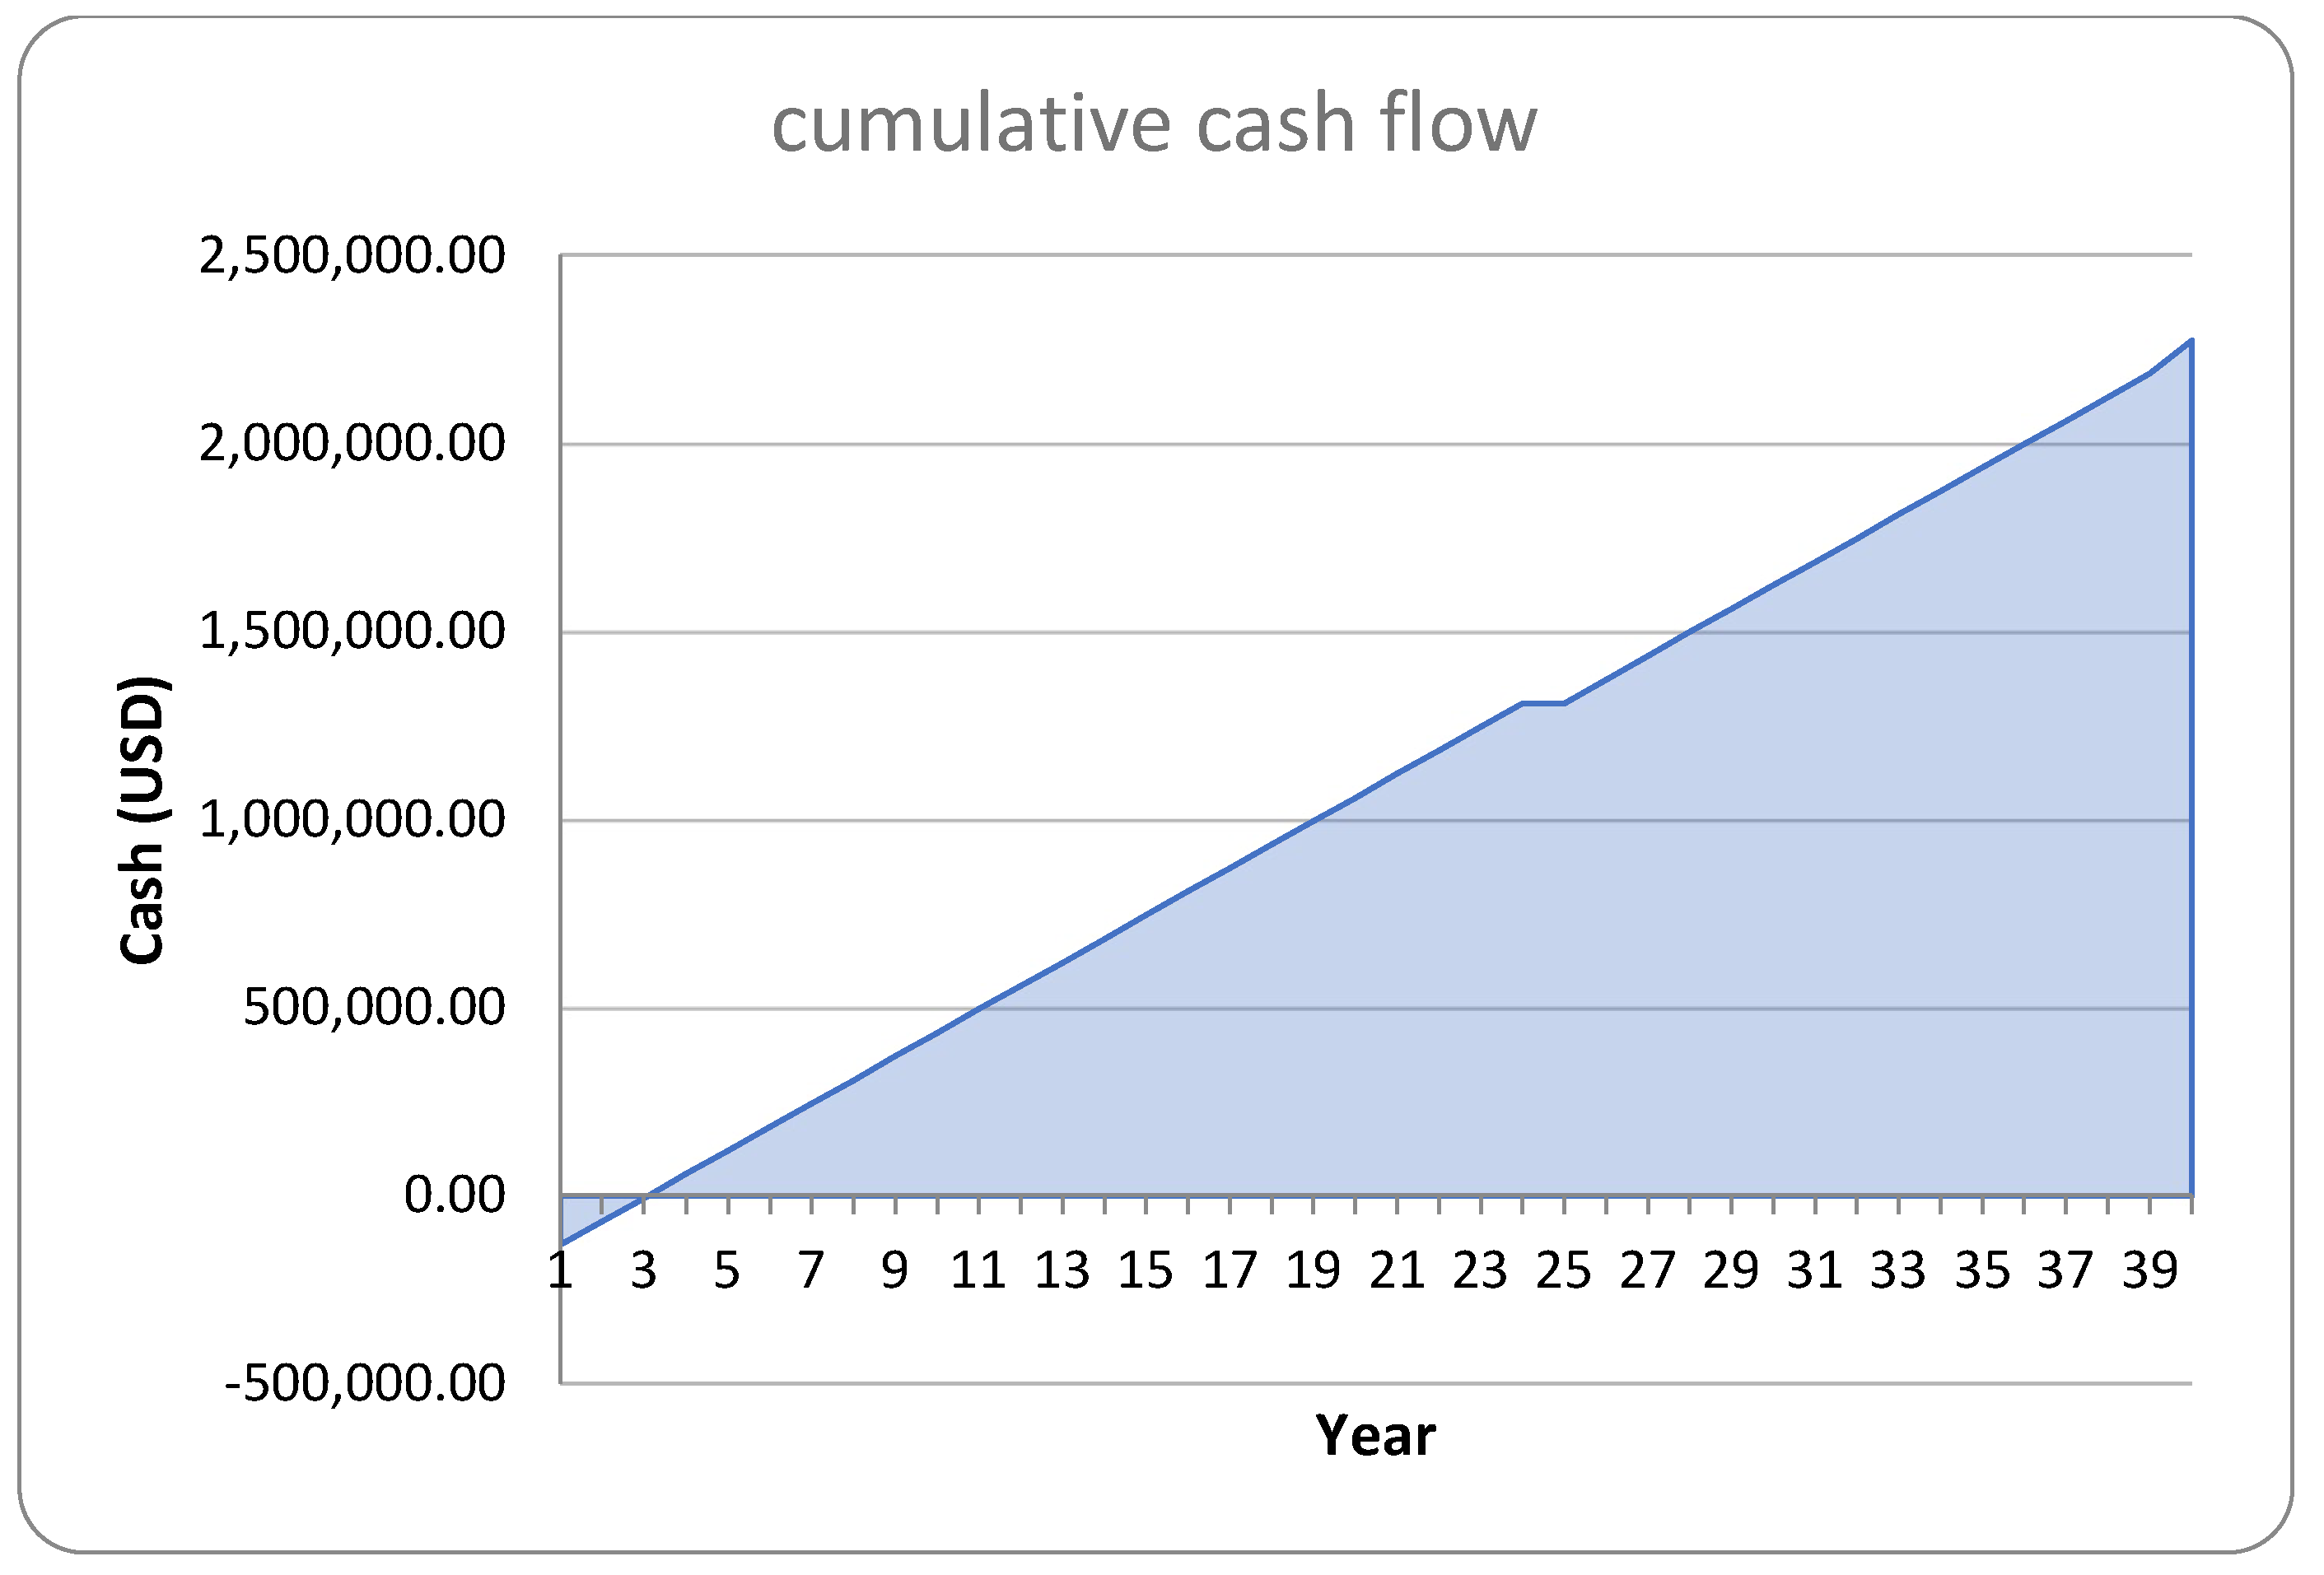
Figure 9.
Investment cost and NPV comparison for the standalone and hybrid configurations.
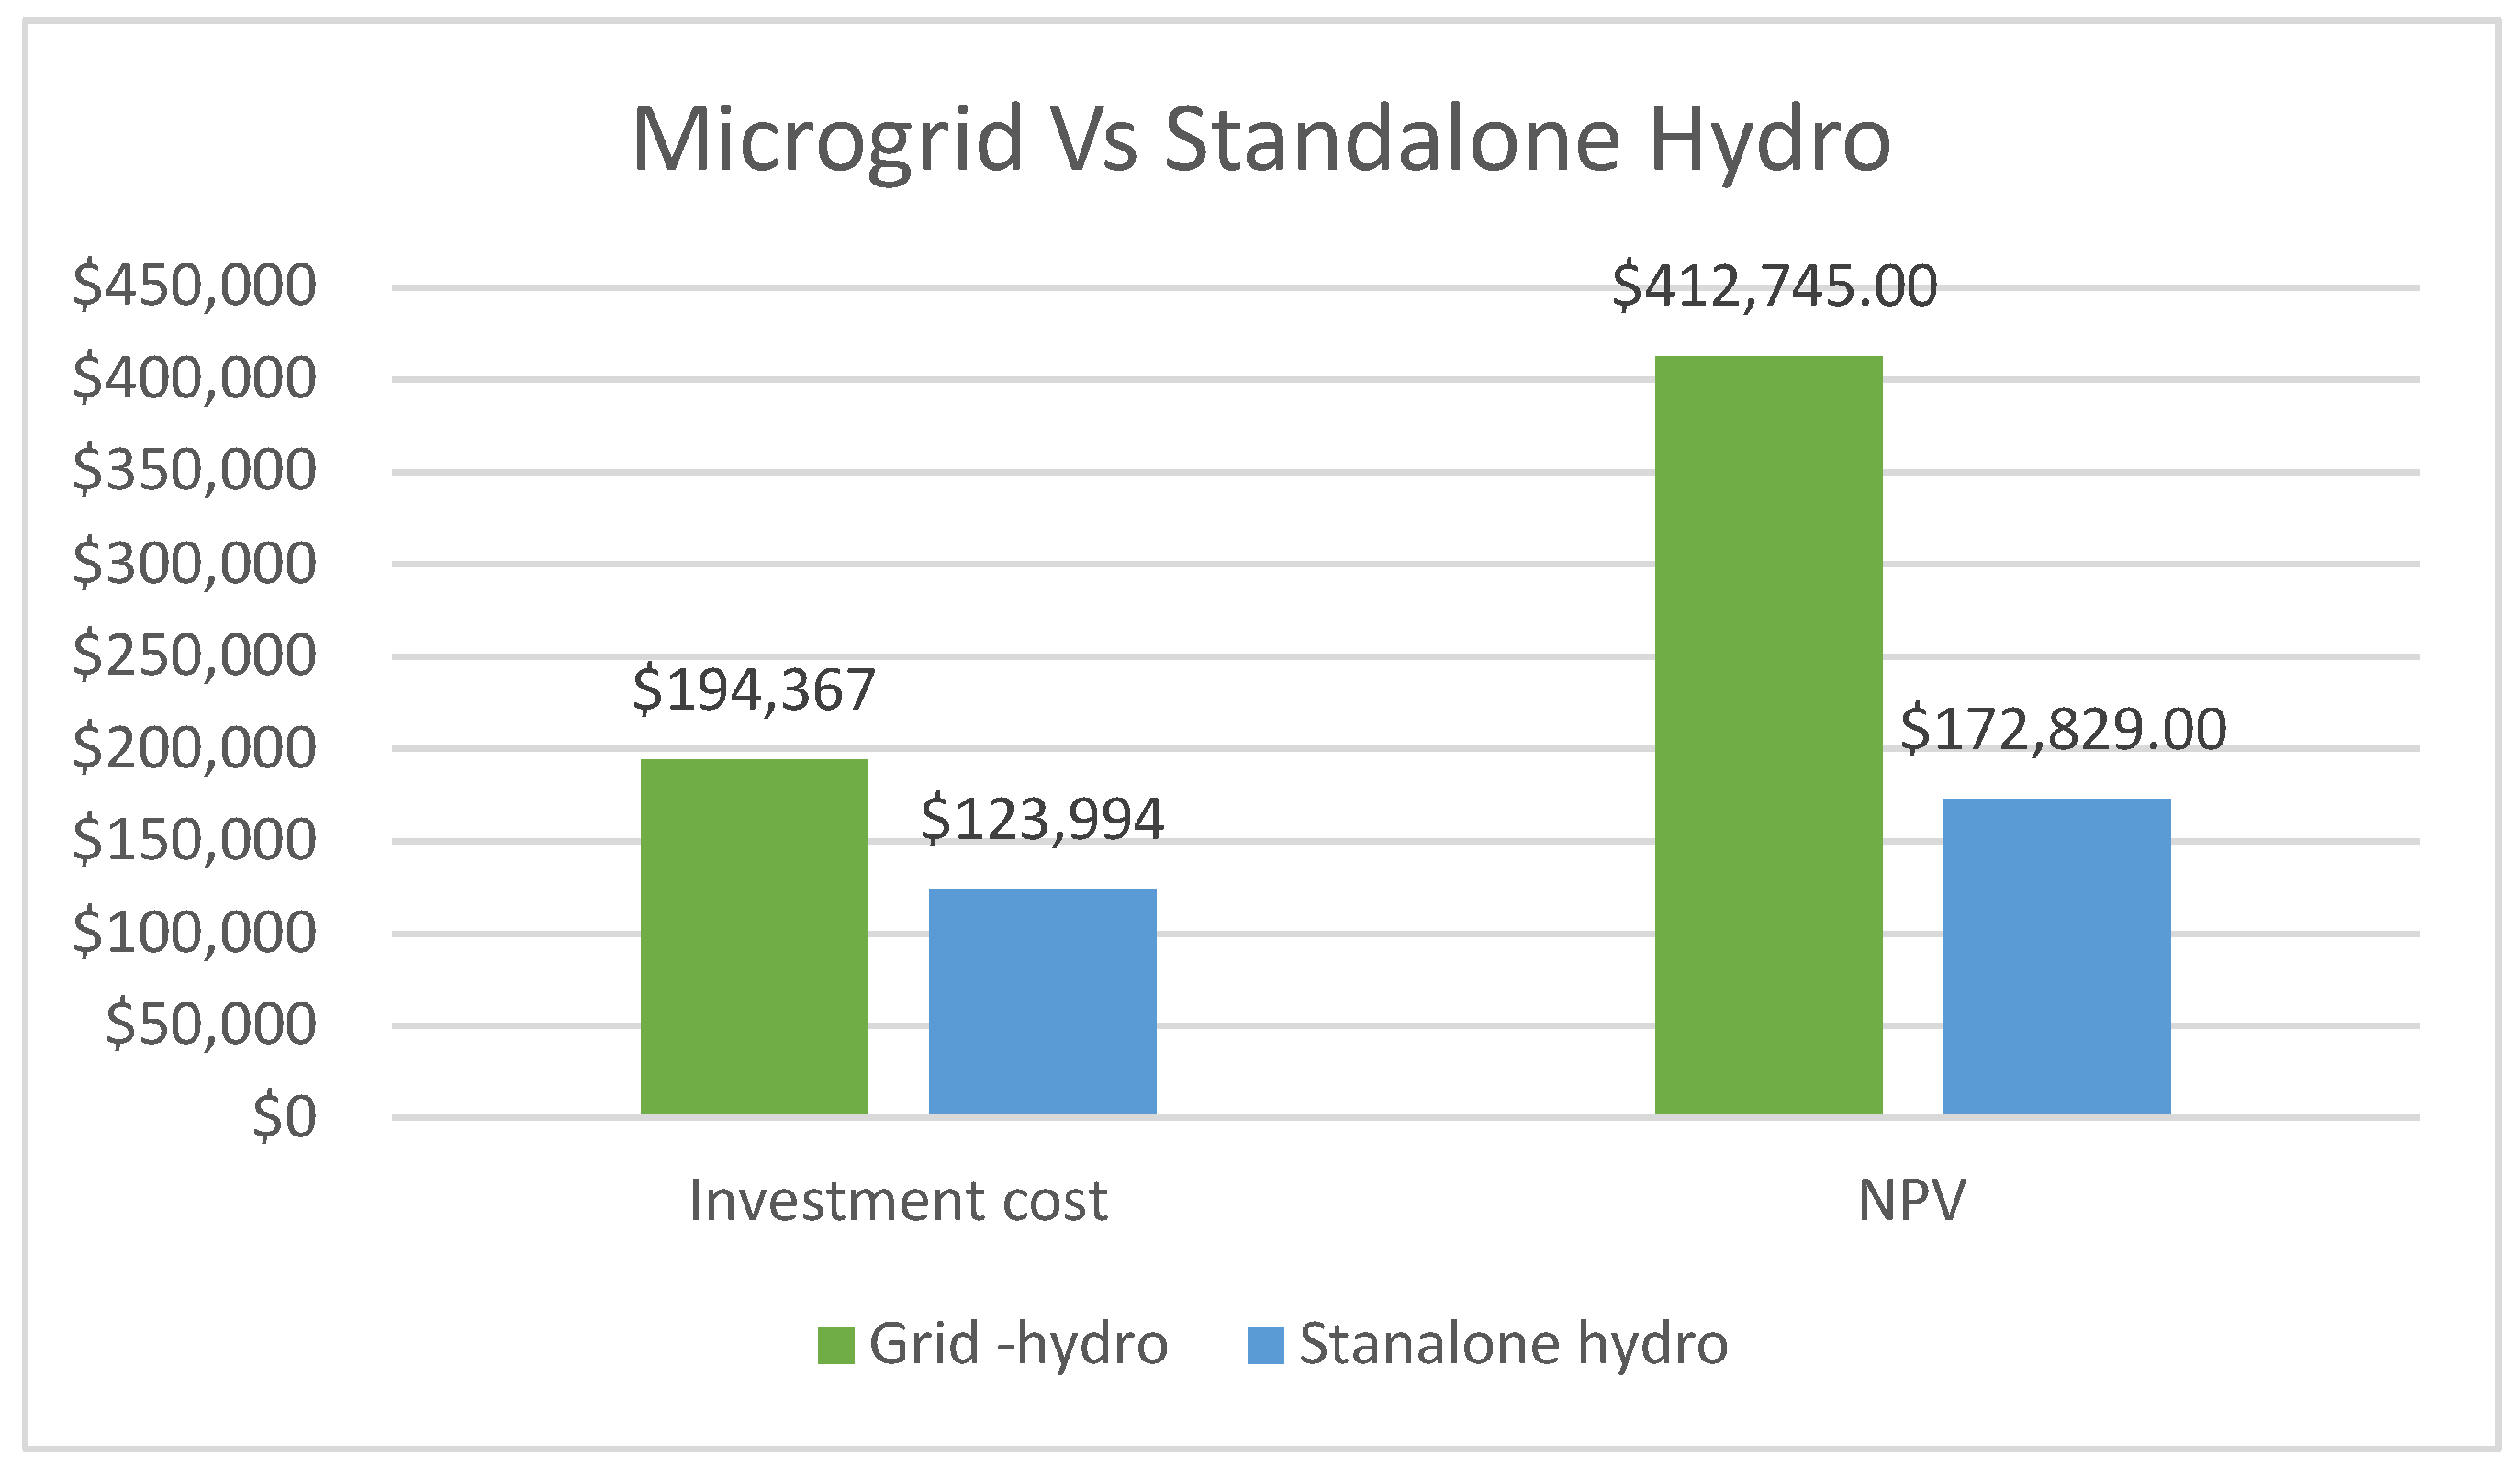
Figure 10.
Simple and Discounted Payback Period comparison.
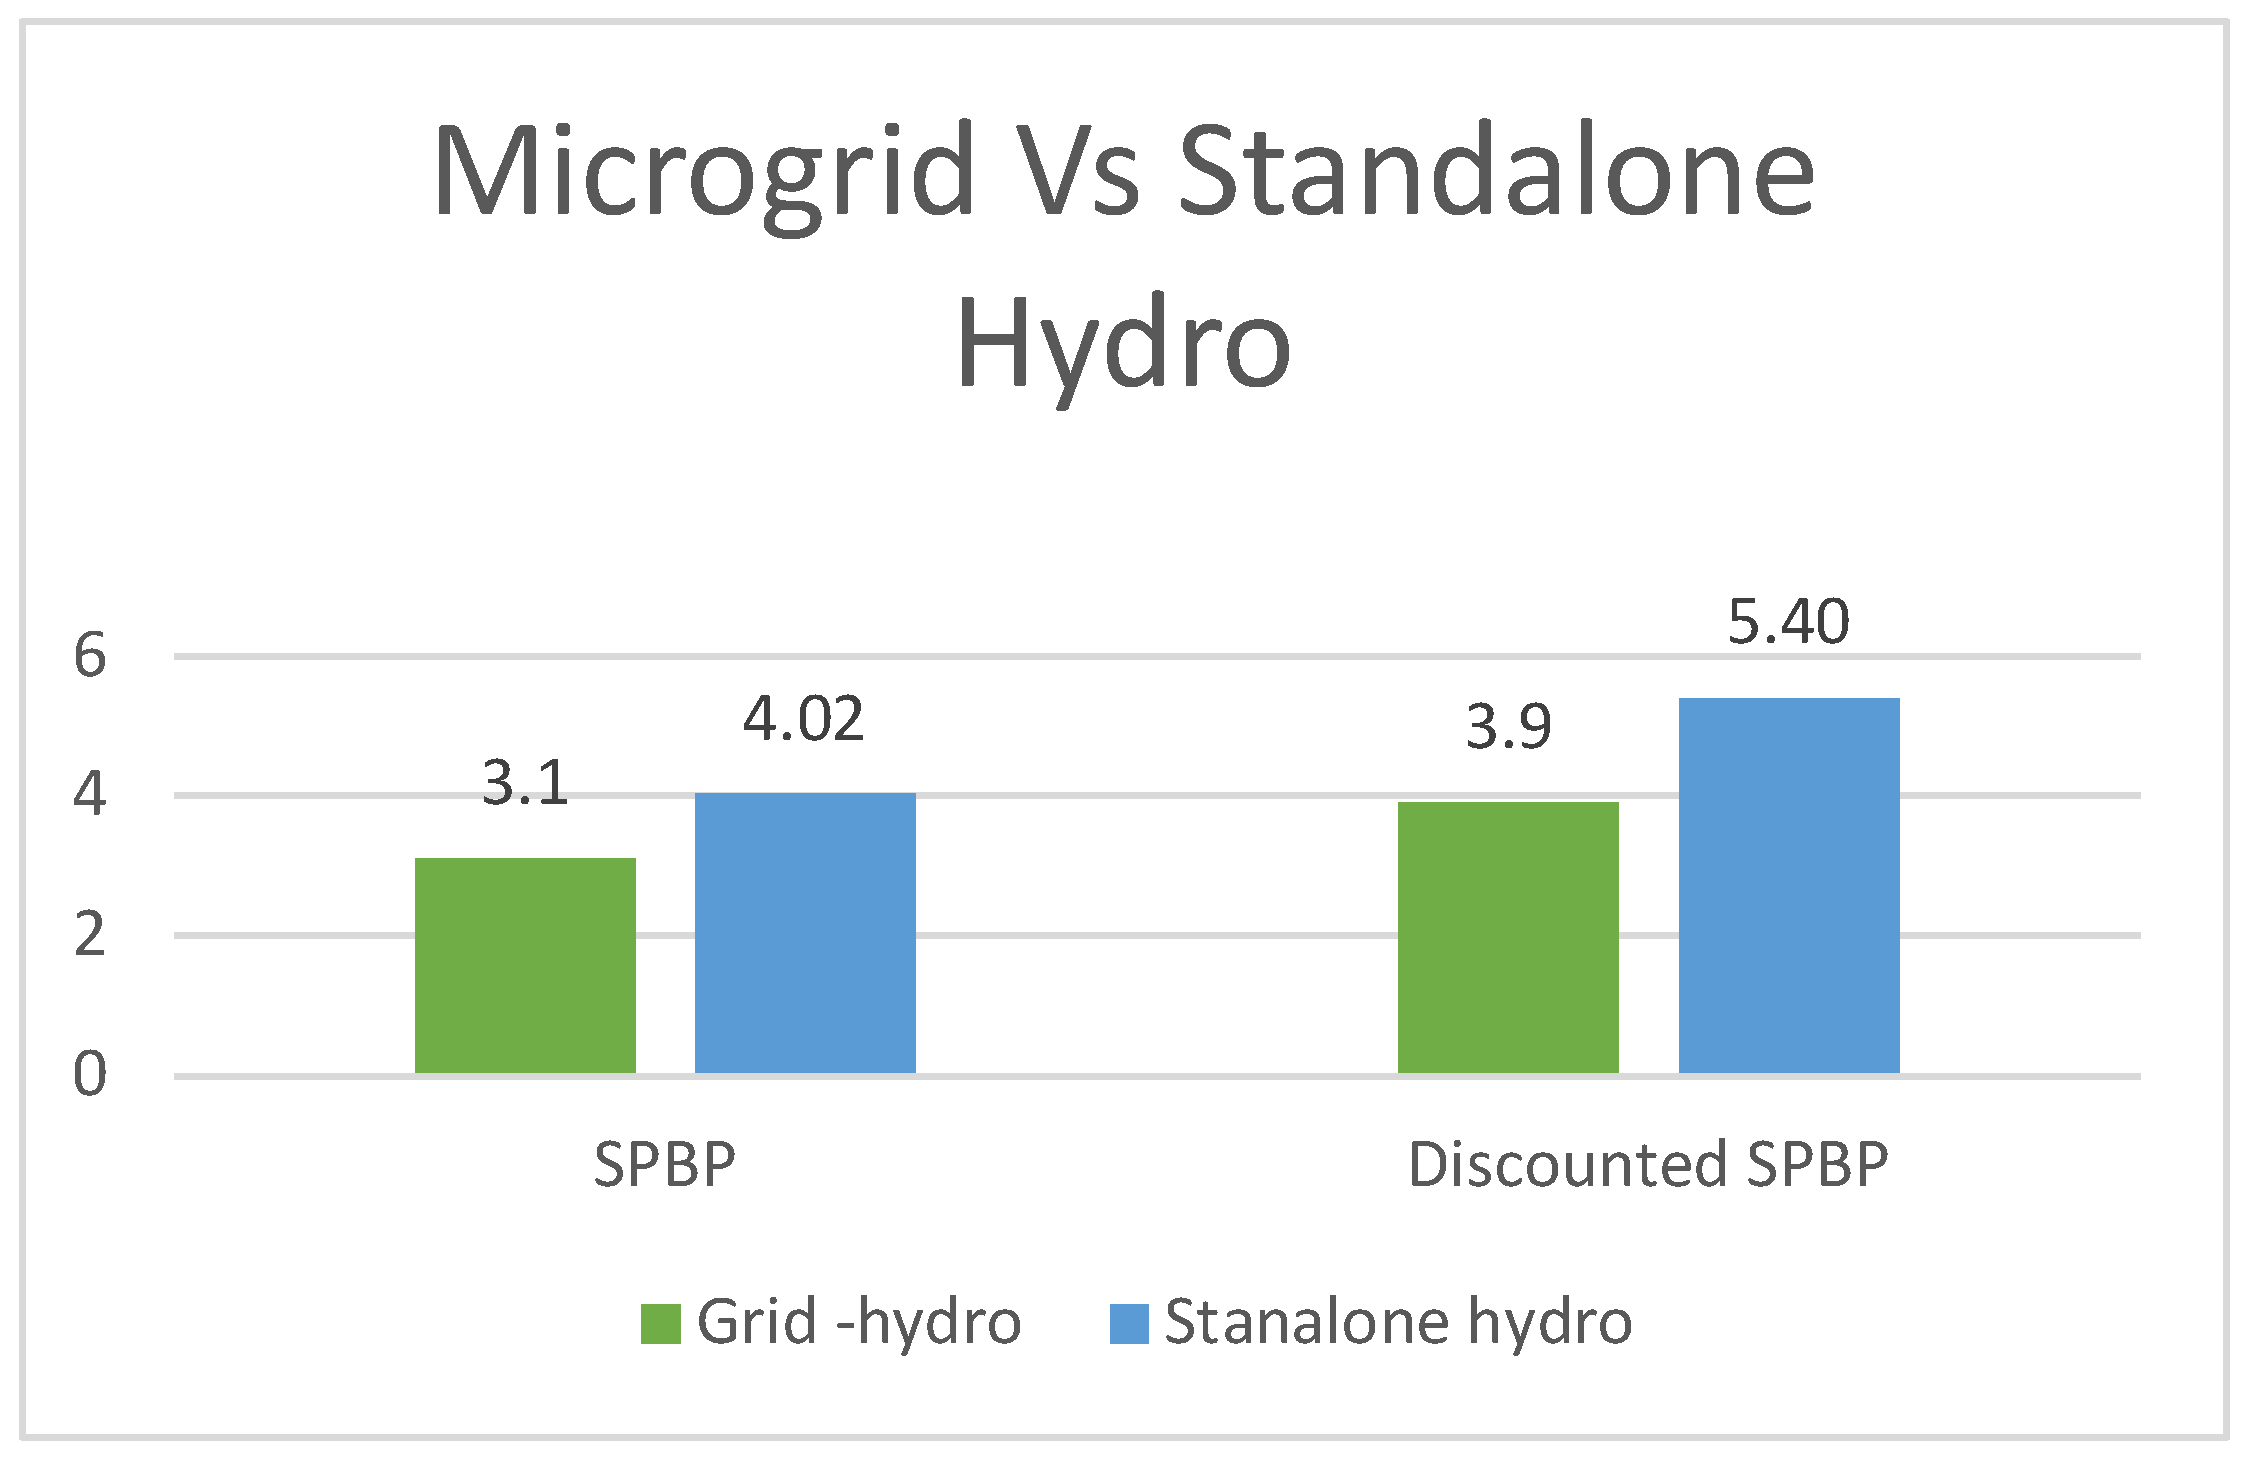
Figure 11.
Internal rate of return (IRR) comparison.
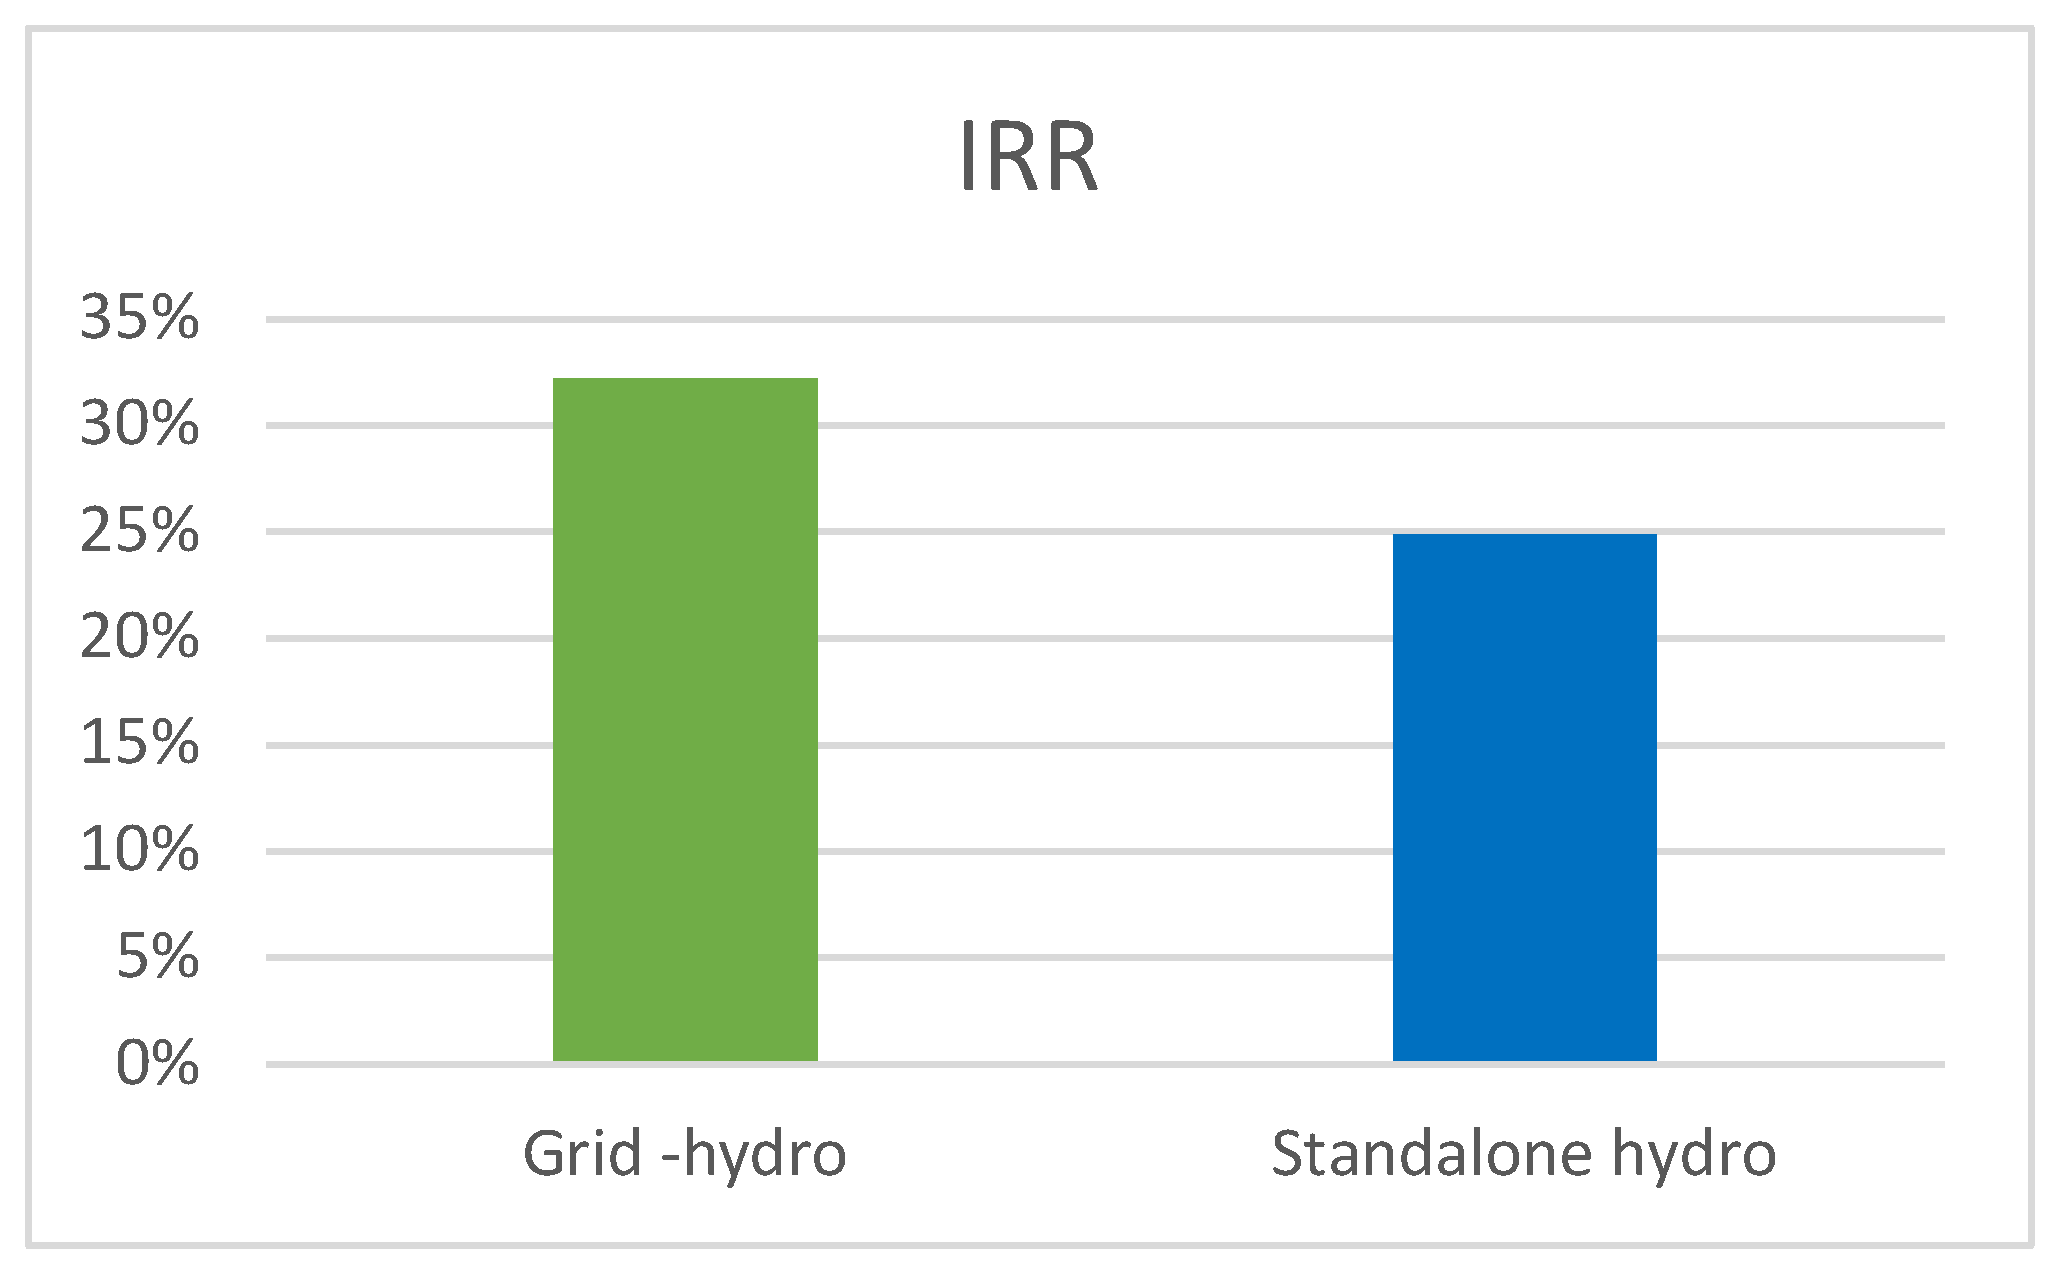

Table 1.
Hydropower classification in Kenya [5].
Table 1.
Hydropower classification in Kenya [5].
| Category | Pico | Micro | Mini | Small | Medium | Large |
| Power | <5 kW | 5-100 kW | 0.1-1 MW | 1– 3 MW | 3– 30 MW | >30 MW |
Table 2.
Crossflow turbine Specifications.
| Power P | 50 Kw | Blade Pitch P1p2 | 0.0231m |
| Runner Diameter D1 | 0.2586m | Number of Blades Z | 26 |
| Runner Breath L1 | 0.5508m | Shaft Diameter Ds | 64.64mm |
| Runner Internal Diameter D2 | 0.1724m | Penstock Diameter Dp | 0.506m |
| Blade Shaped Arc Radius R | 0.0414m | Penstock Length Lp | 103.7m |
| Center Pitch Circle Radius Ro | 0.0956m | Turbine Speed N | 625 Rpm |
Table 3.
Hydro specifications - nominal.
| Economics | Capital cost ($) | 123,944.00 |
| Replacement cost ($) | 61,997.00 | |
| O&M cost ($/yr) | 3,720.00 | |
| Lifetime(years) | 25 | |
| Electrical Bus | ac | |
| Intake Pipe | Pipe head loss (%) | 10 |
| Turbine | Available Head (m) | 20 |
| Design flow rate (L/s) | 405 | |
| Minimum flow ratio (%) | 50 | |
| Maximum flow ratio (%) | 100 | |
| Efficiency (%) | 70 | |
| System to consider | Simulate with or without hydro turbine | Yes |
Table 4.
Grid specifications - nominal.
| Parameters | Sales Capacity (KW) | 2,651,000 |
| Interconnection Charge ($) | 70,373.00 | |
| Standby charge ($/yr) | 0 | |
| Rate Definition | Price ($/KWh) | 0.20 |
| Sellback ($/KWh) | 0.12 | |
| Period | All Week | |
| Emissions | Carbon Dioxide (g/KWh) | 116 |
| Sulphur Dioxide (g/KWh) | 2.74 | |
| Nitrogen Oxides (g/KWh) | 1.34 | |
| Advanced Grid | Scheduled Rates | |
Table 5.
Hybrid hydro + grid: Sensitivity to investment cost.
| Investment Cost | $ 170,573 | $ 194,367 | $ 270,773 |
| Simple Payback Period | 2.69 | 3.10 | 4.49 |
| Discounted Payback Period | 3.30 | 3.90 | 6.26 |
| Cost/Kw | $ 2000 | $ 2475 | $ 4000 |
| Net Present Value | $444,514 | $412,745 | $310,737 |
| Internal Rate Of Return | 37.1 | 32.2 | 22.2 |
Table 6.
Hybid hydro + grid: Sensitivity to discount rates.
| Discount Rate | 5% | 8% | 10% | 12% |
| Simple Payback Period | 3.10 | 3.10 | 3.10 | 3.10 |
| Discounted Payback Period | 3.50 | 3.70 | 3.90 | 4.10 |
| Net Present Value | $865,212 | $544,346 | $412,745 | $318,412 |
| Internal Rate Of Return | 32.2 | 32.2 | 32.2 | 32.2 |
Table 7.
Standalone hydro: Sensitivity to investment cost.
| Investment Cost | $ 100,200 | $ 123,994 | $ 200,400 |
| Simple Payback Period | 3.17 | 4.02 | 7.01 |
| Discounted Payback Period | 4.00 | 5.40 | 12.68 |
| Cost/Kw | $ 2000 | $ 2475 | $ 4000 |
| Net Present Value | $ 204,598 | $ 172,829 | $ 70,821 |
| Internal Rate Of Return | 31.5 | 24.9 | 13.9 |
Table 8.
Standalone hydro: Sensitivity to discount rates.
| Discount Rate | 5% | 8% | 10% | 12% |
| Simple Payback Period | 4.02 | 4.02 | 4.02 | 4.02 |
| Discounted Payback Period | 4.60 | 5.04 | 5.40 | 5.81 |
| Net Present Value | $ 391,128 | $ 236,351 | $ 172,829 | $ 127,210 |
| Internal Rate Of Return | 24.9 | 24.9 | 24.9 | 24.9 |
Disclaimer/Publisher’s Note: The statements, opinions and data contained in all publications are solely those of the individual author(s) and contributor(s) and not of MDPI and/or the editor(s). MDPI and/or the editor(s) disclaim responsibility for any injury to people or property resulting from any ideas, methods, instructions or products referred to in the content. |
© 2025 by the authors. Licensee MDPI, Basel, Switzerland. This article is an open access article distributed under the terms and conditions of the Creative Commons Attribution (CC BY) license (http://creativecommons.org/licenses/by/4.0/).
Copyright: This open access article is published under a Creative Commons CC BY 4.0 license, which permit the free download, distribution, and reuse, provided that the author and preprint are cited in any reuse.


