Submitted:
11 January 2025
Posted:
13 January 2025
You are already at the latest version
Abstract
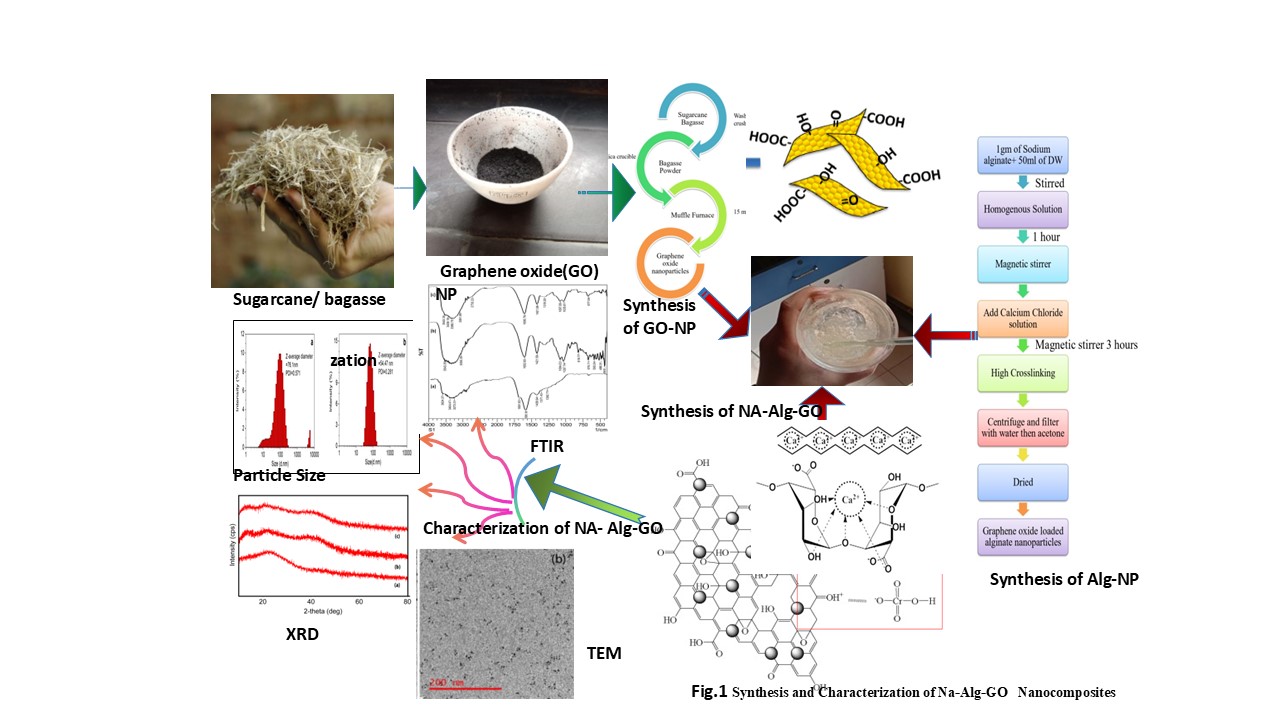
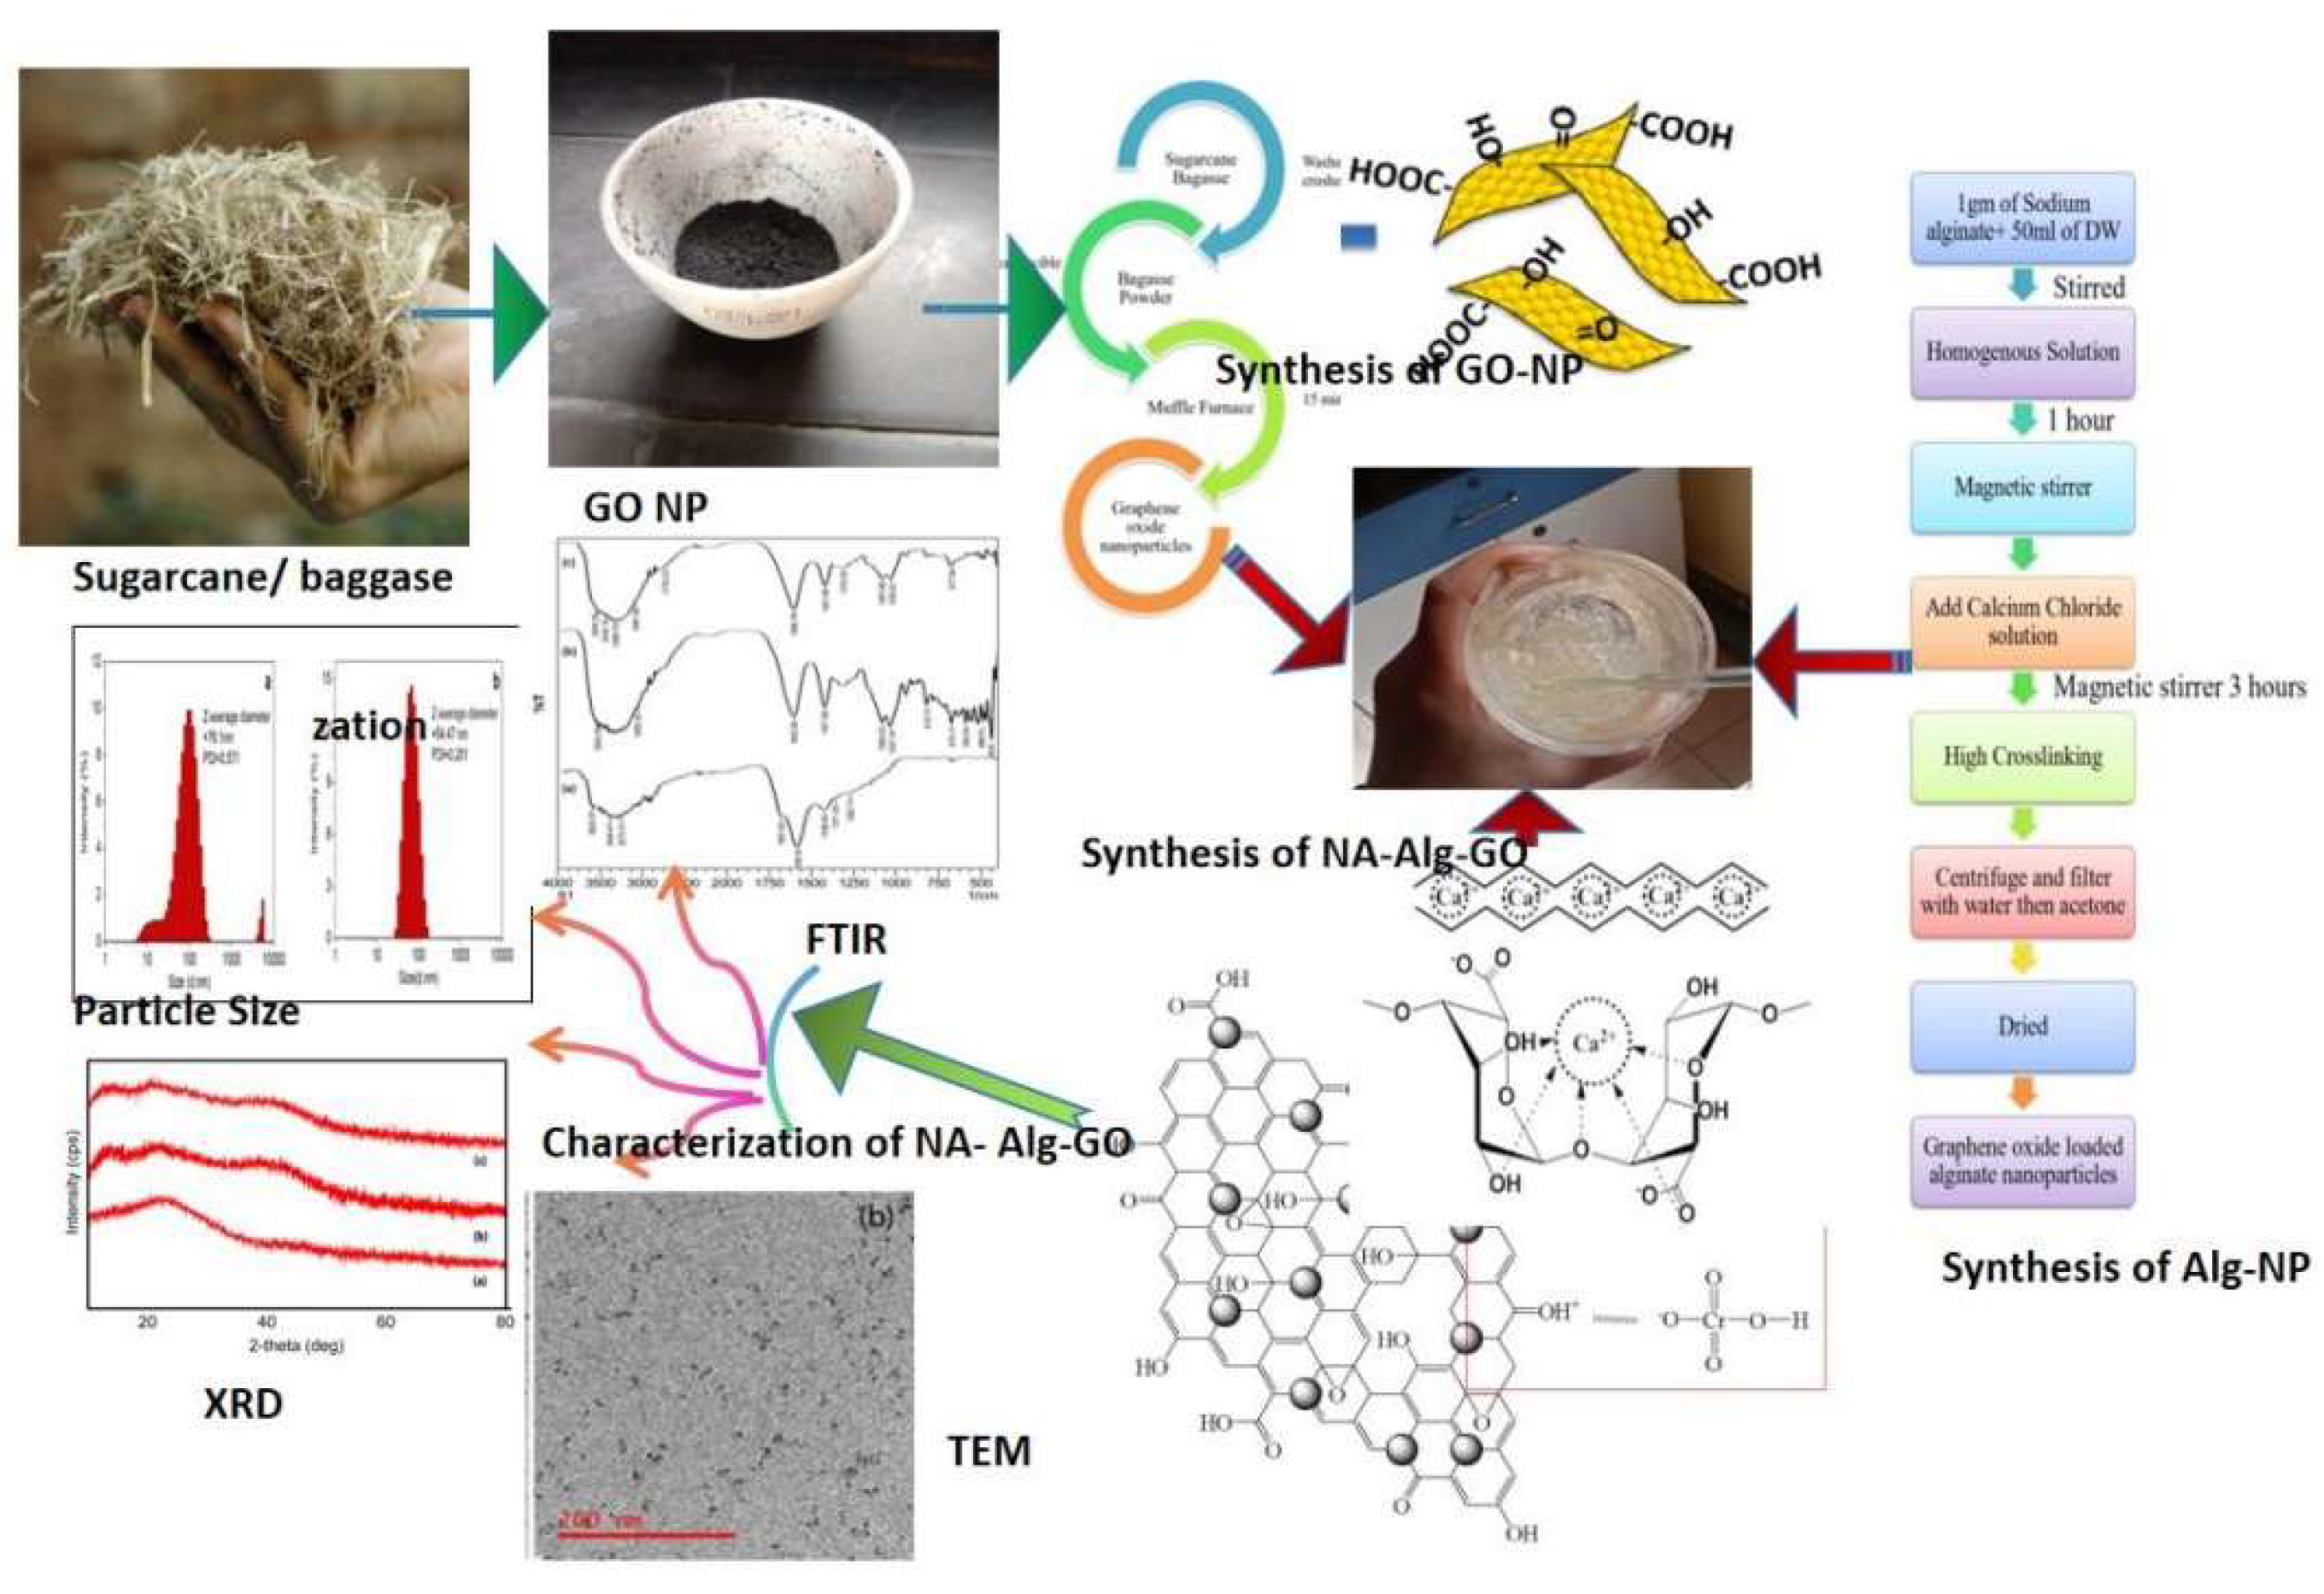
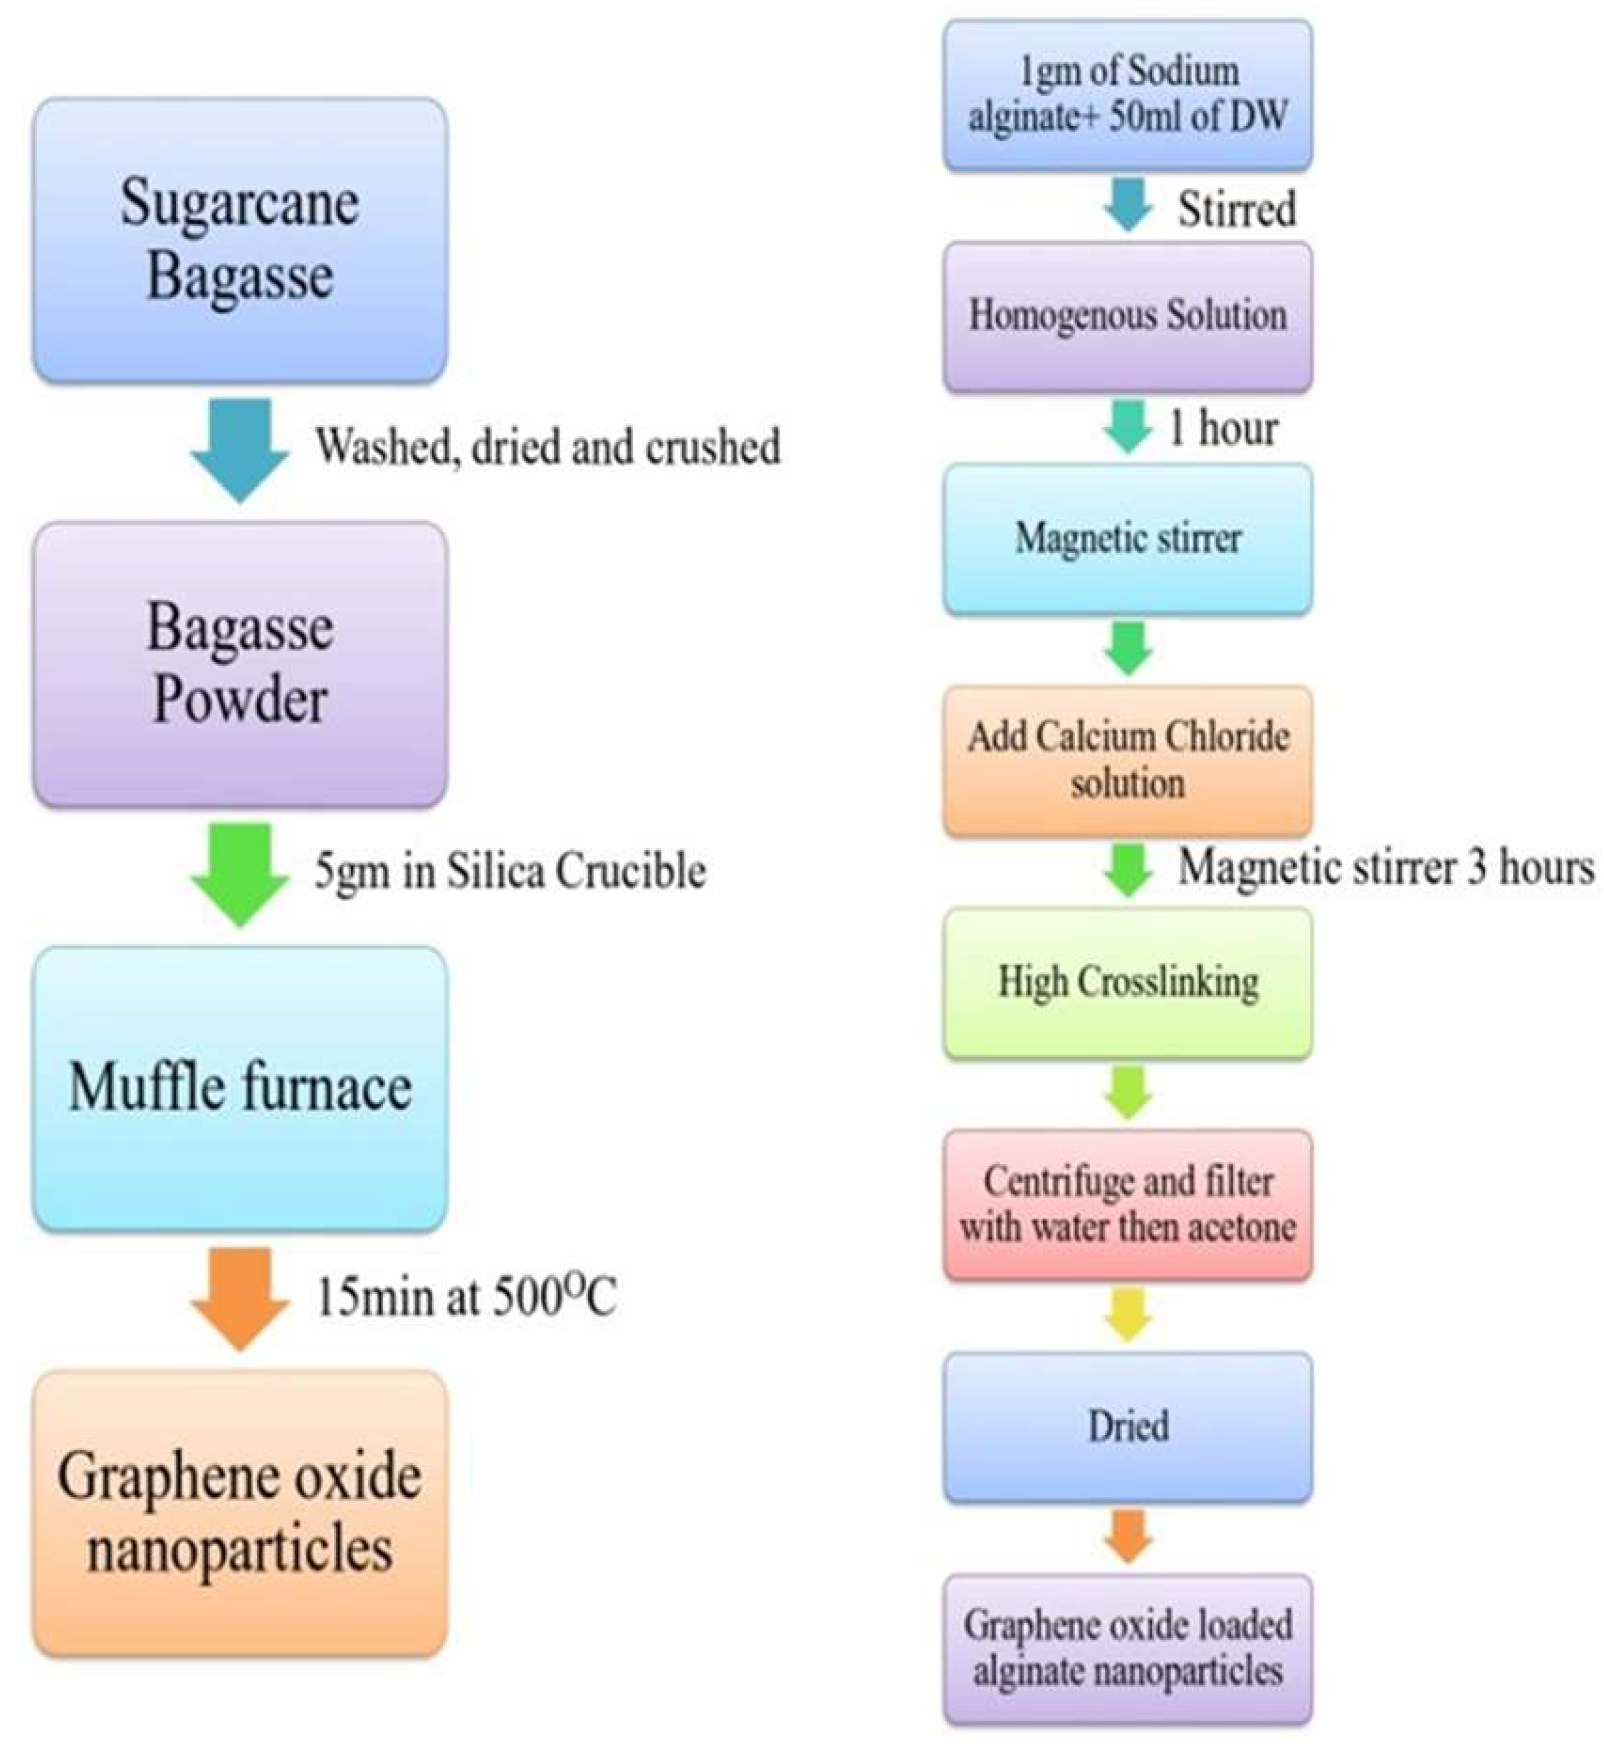
In the present study, graphene oxide based sodium alginate nanocomposites have been used as an efficient low cast adsorbent to remove the concentration of toxic Cr(VI) ions from coal effluent. graphene oxide is prepared from sugarcane -bagasse and reacted with sodium- alginate and calcium-chloride to form the Na-Alg-Go composite. The developed composite was characterized by FTIR, XRD , TEM , particle size and zeta potential measurements. The adsorption experiments were carried out by batch contact method and the effect of the significant process parameter such as initial pH of solution, adsorbent dose, contact time and the initial Cr(VI) concentration were investigated on the metal ion removal capacity. The optimum adsorption of Cr(VI) on the Na-Alg-Go nanoparticles was observed at an initial pH value of 2.4±0.4. The maximum sorption capacity of Cr(VI) in coal effluent was found to be in between 100- 110 mg/g in comparison with std initial chromiunm(VI) solution in the range of 40-200 ppm at room temperature. The equilibrium sorption data fit satisfactorily to the Langmuir adsorption and Freundlich adsorption isotherm. The results suggest that adsorption is due to electrostatic attraction between chromate ions (HCrO4- ) and protonated surface of Na-Alg-Go composite and these has been efficaciously ecofriendly and economically applied for the removal of metal ion Cr( VI) and pollution from coal field effluent(Fig.1).
Keywords:
1. Introduction :
2. Experimental
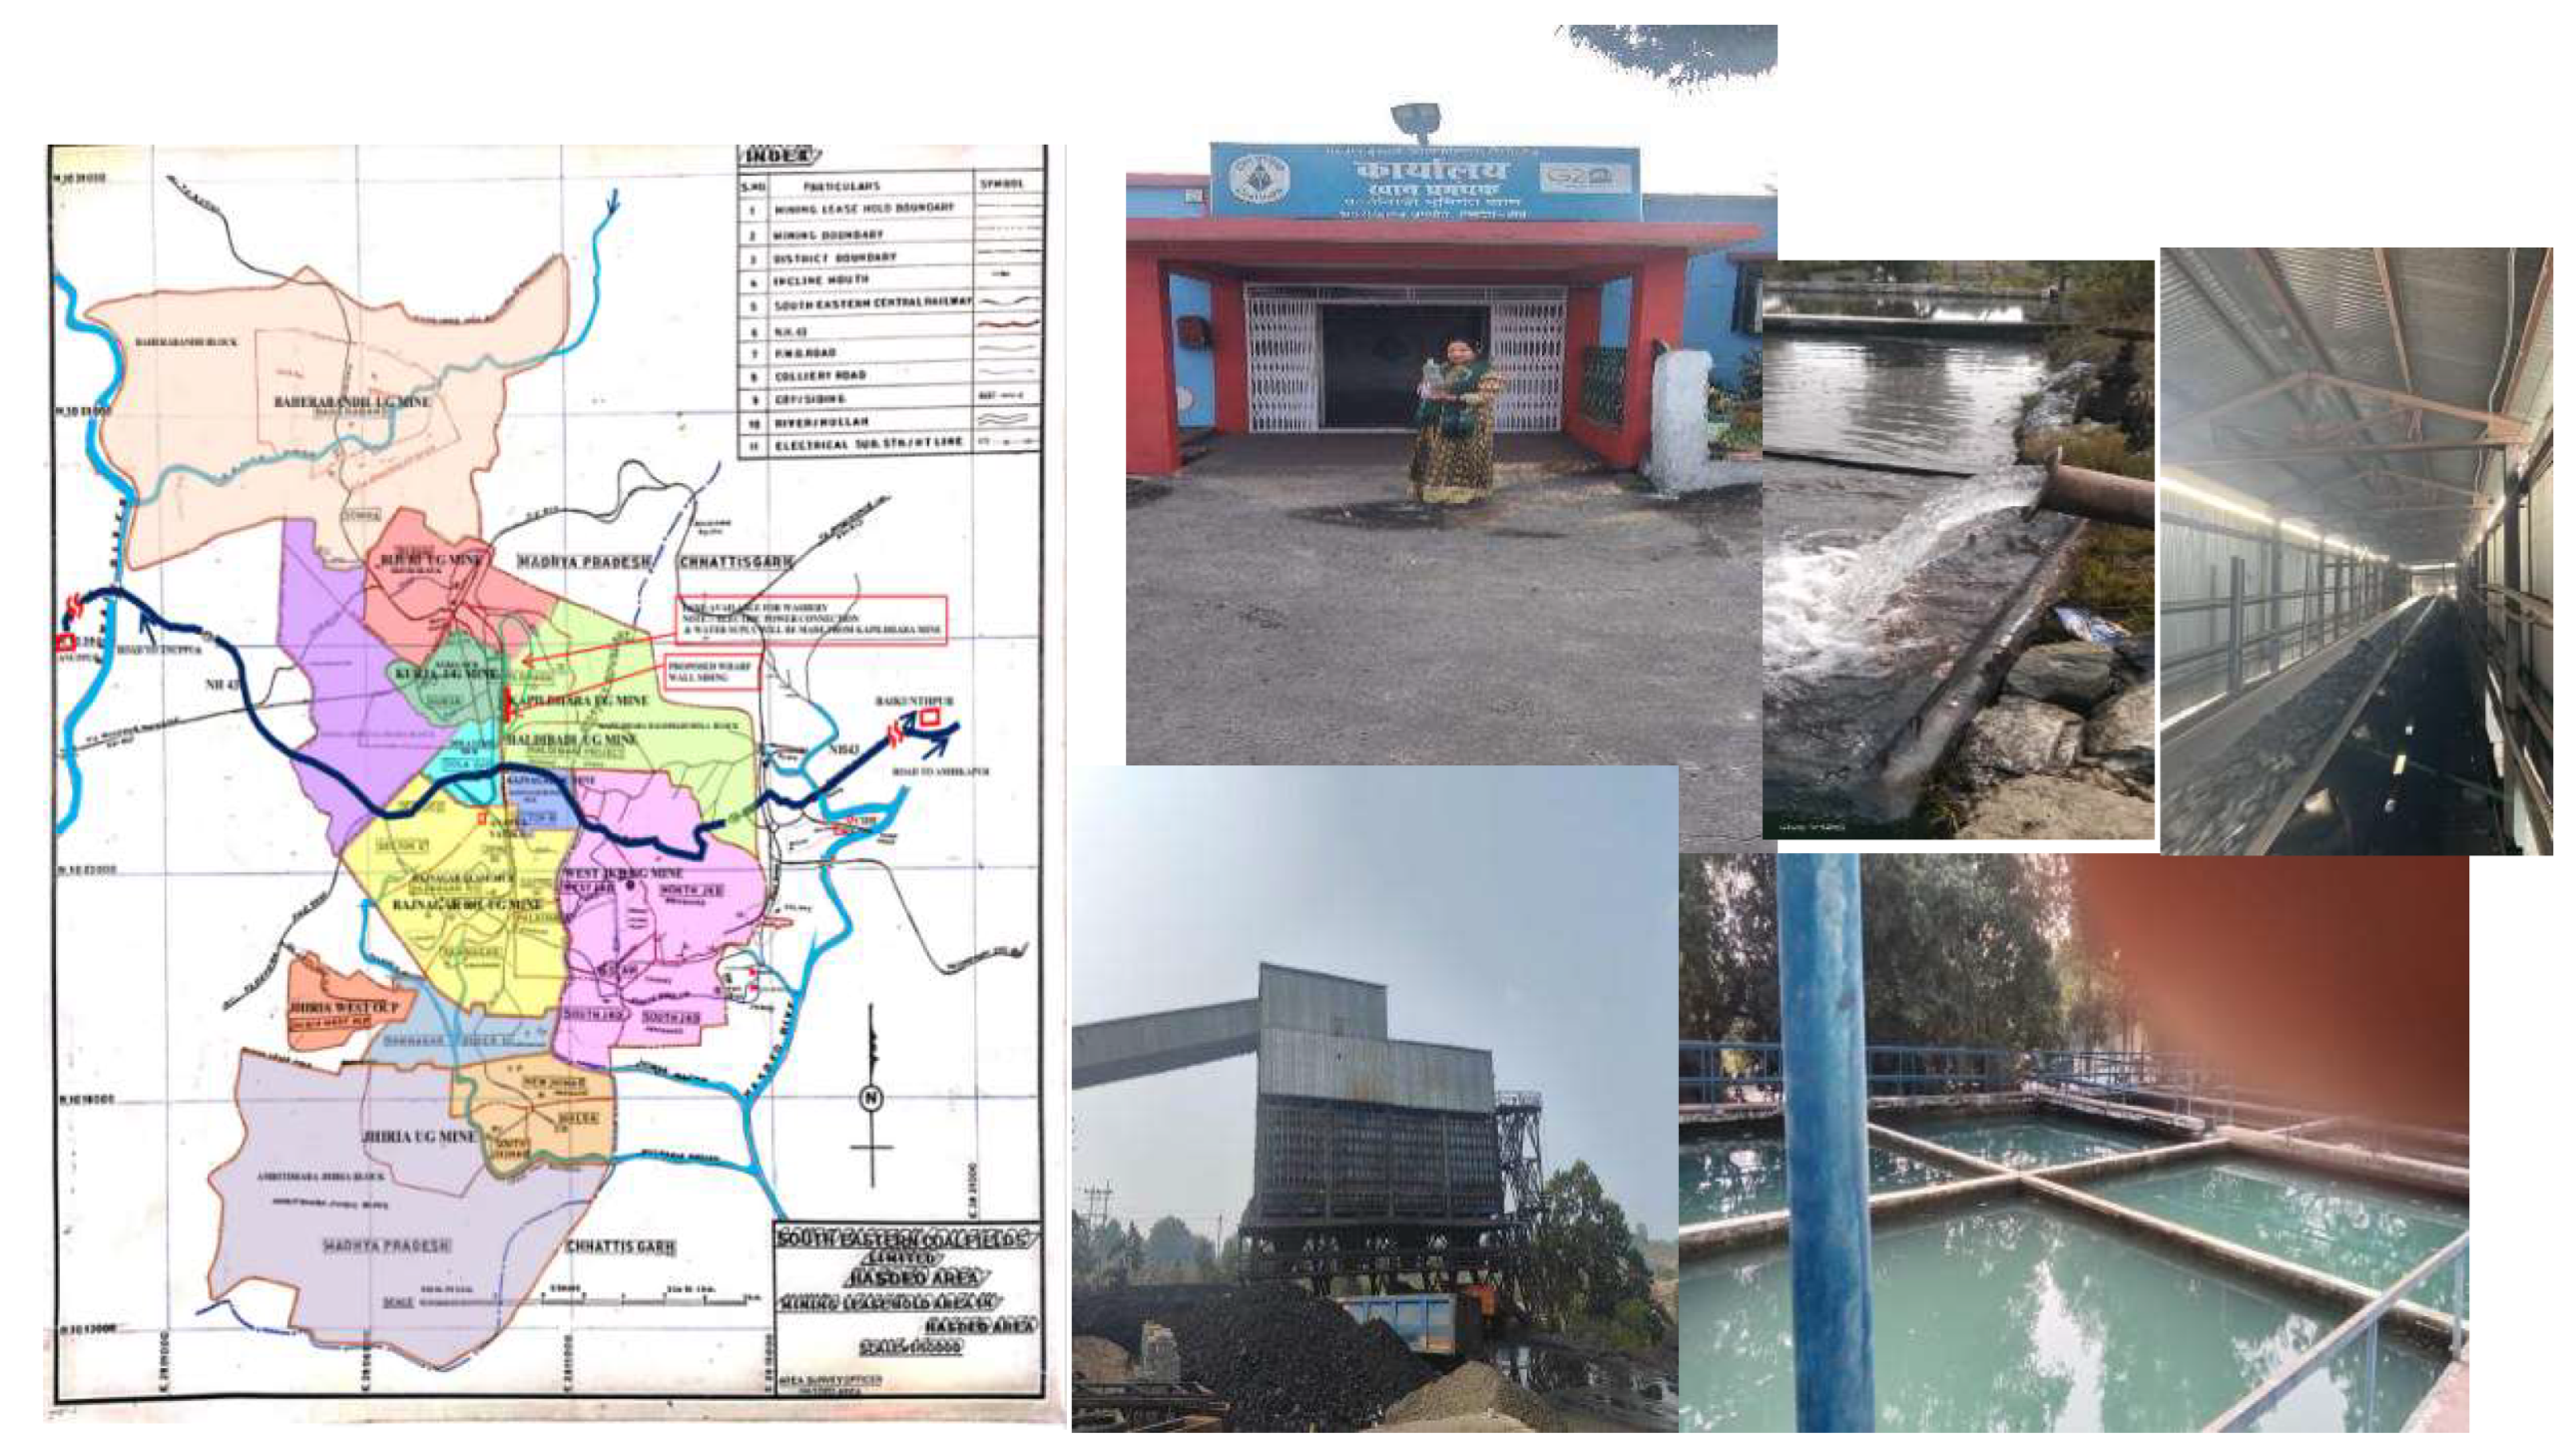
2.1. Study Area / collection of coalfield effluents and preparation of synthetic adsorbate solution :
2.2. Materials
2.3. Methods
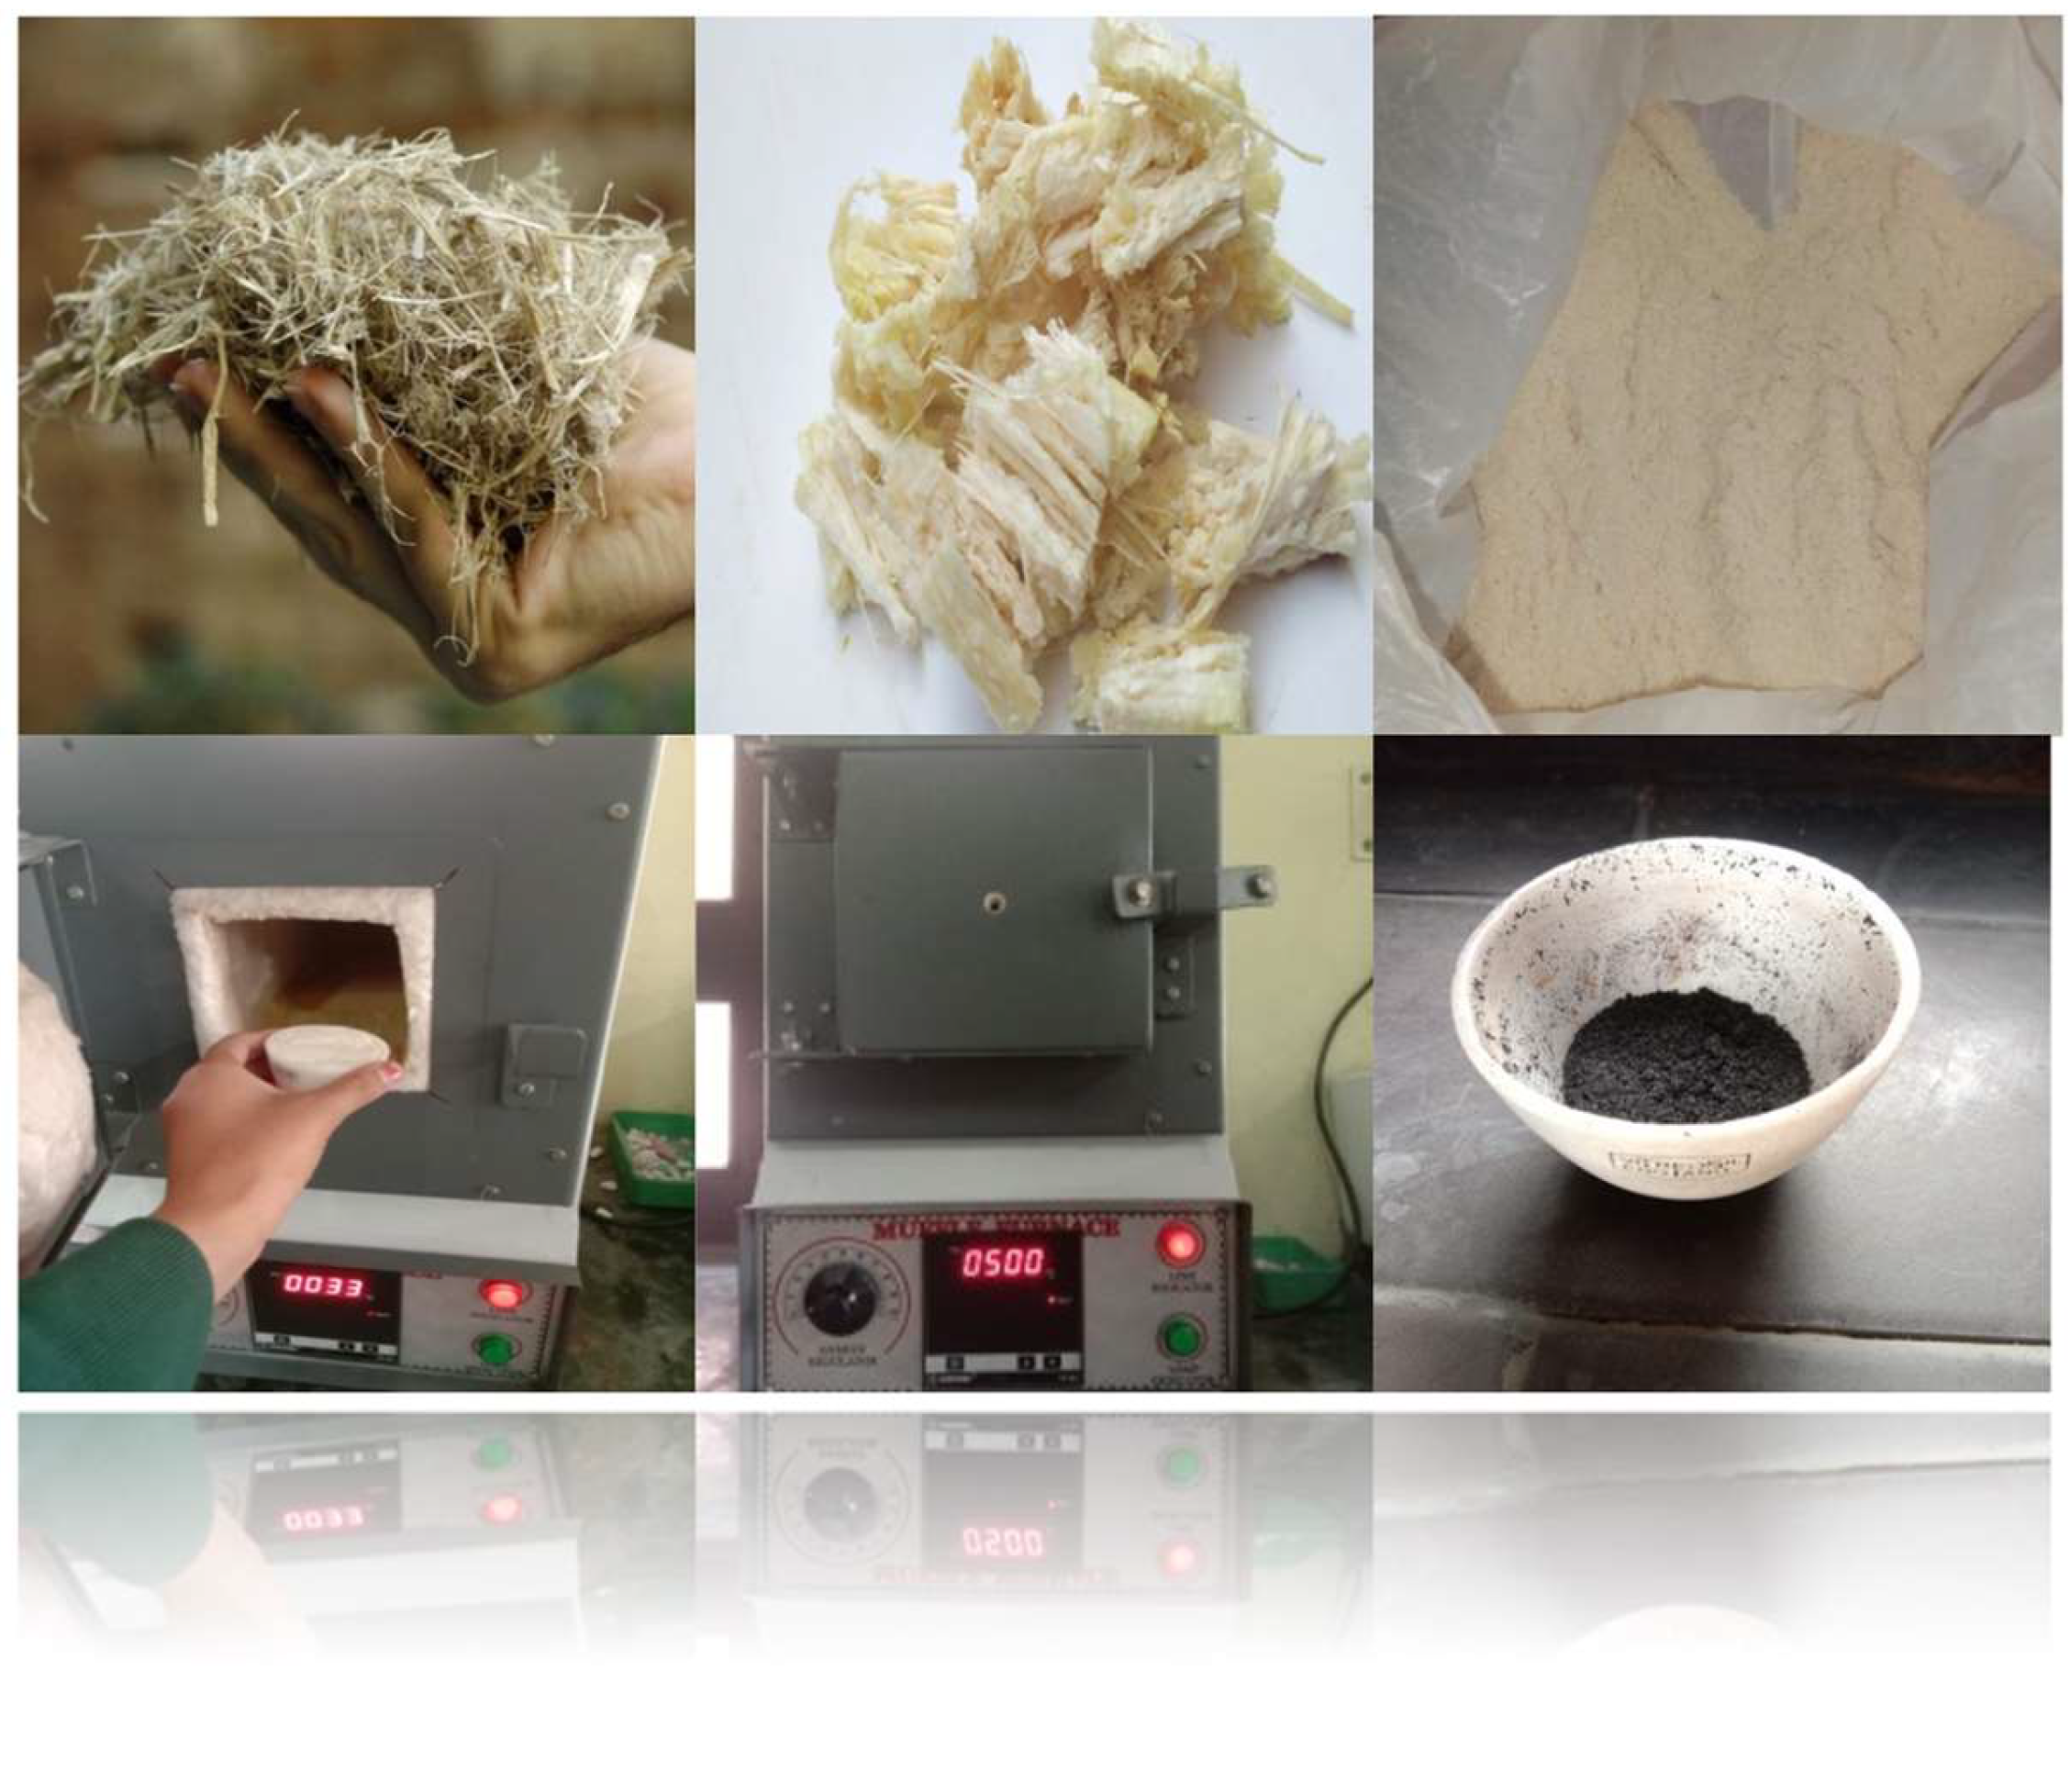
2.3.1. Synthesis of Adsorbent Graphene Oxide Nanoparticles
2.3.2. Synthesis of Graphene oxides loaded alginate nanocomposites .
2.3.3. Adsorption experiments
3. Characterization of Prepared Adsorbent
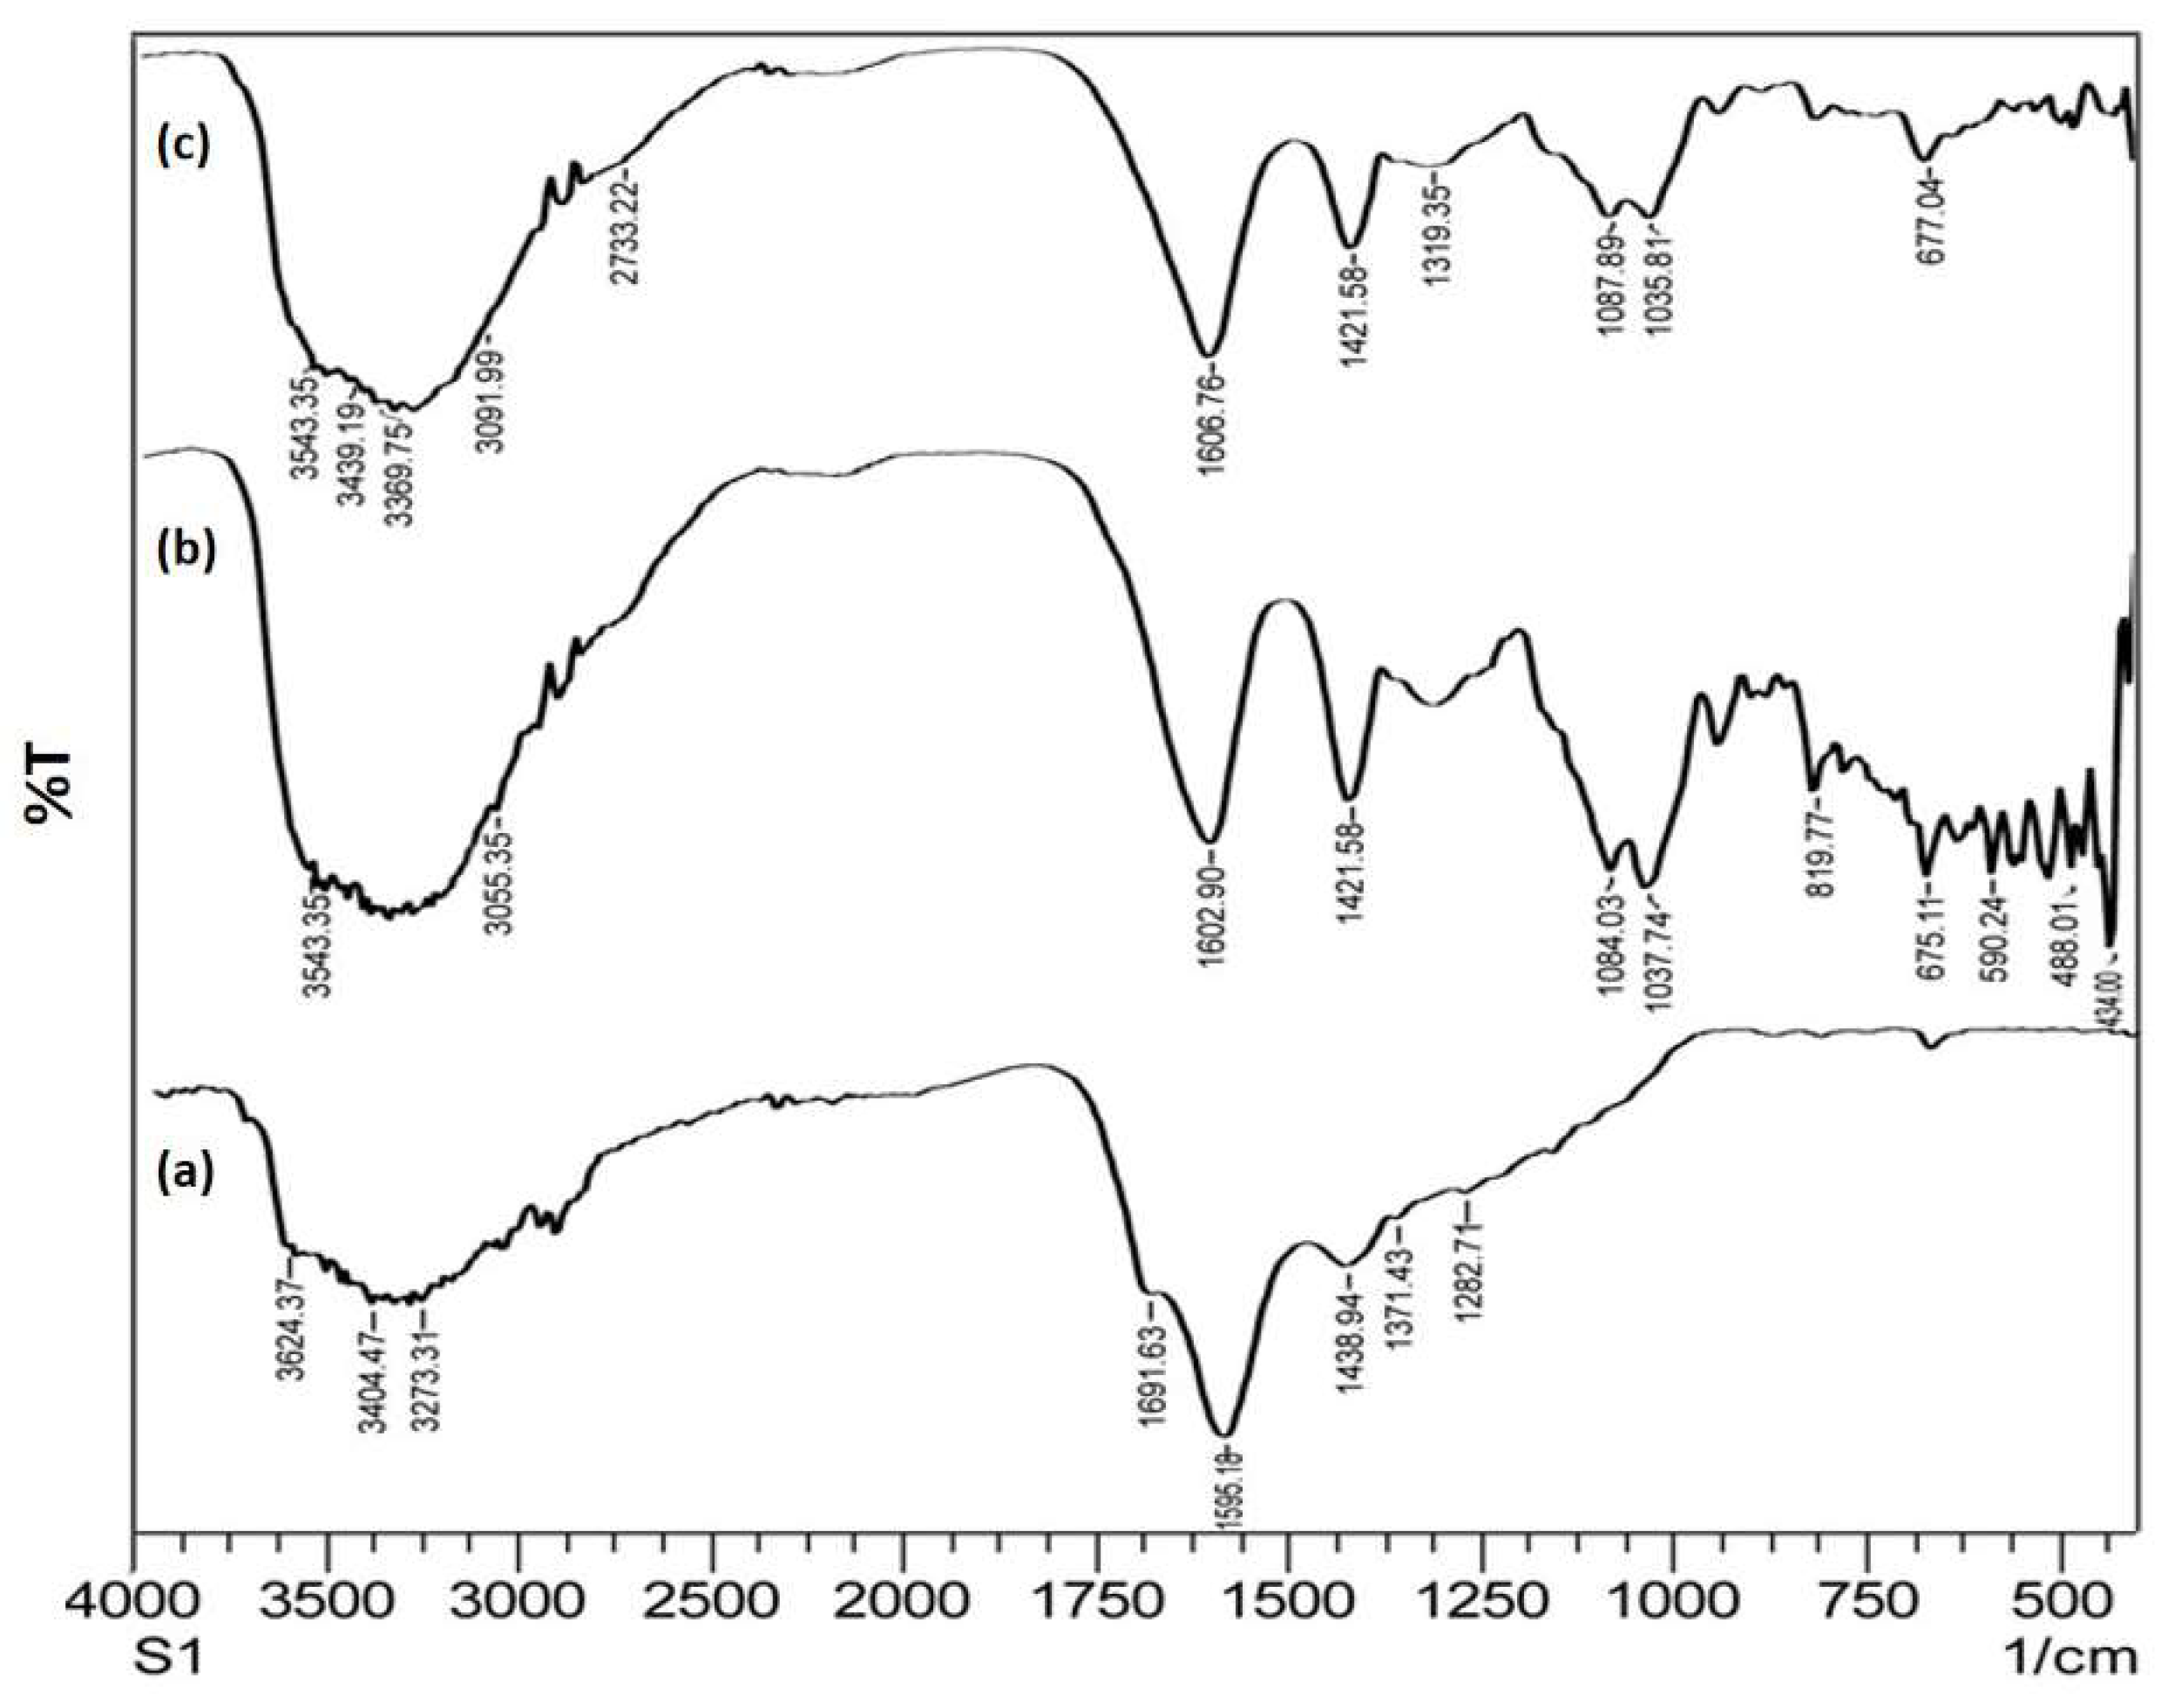
3.1. Interpretation by FTIR :
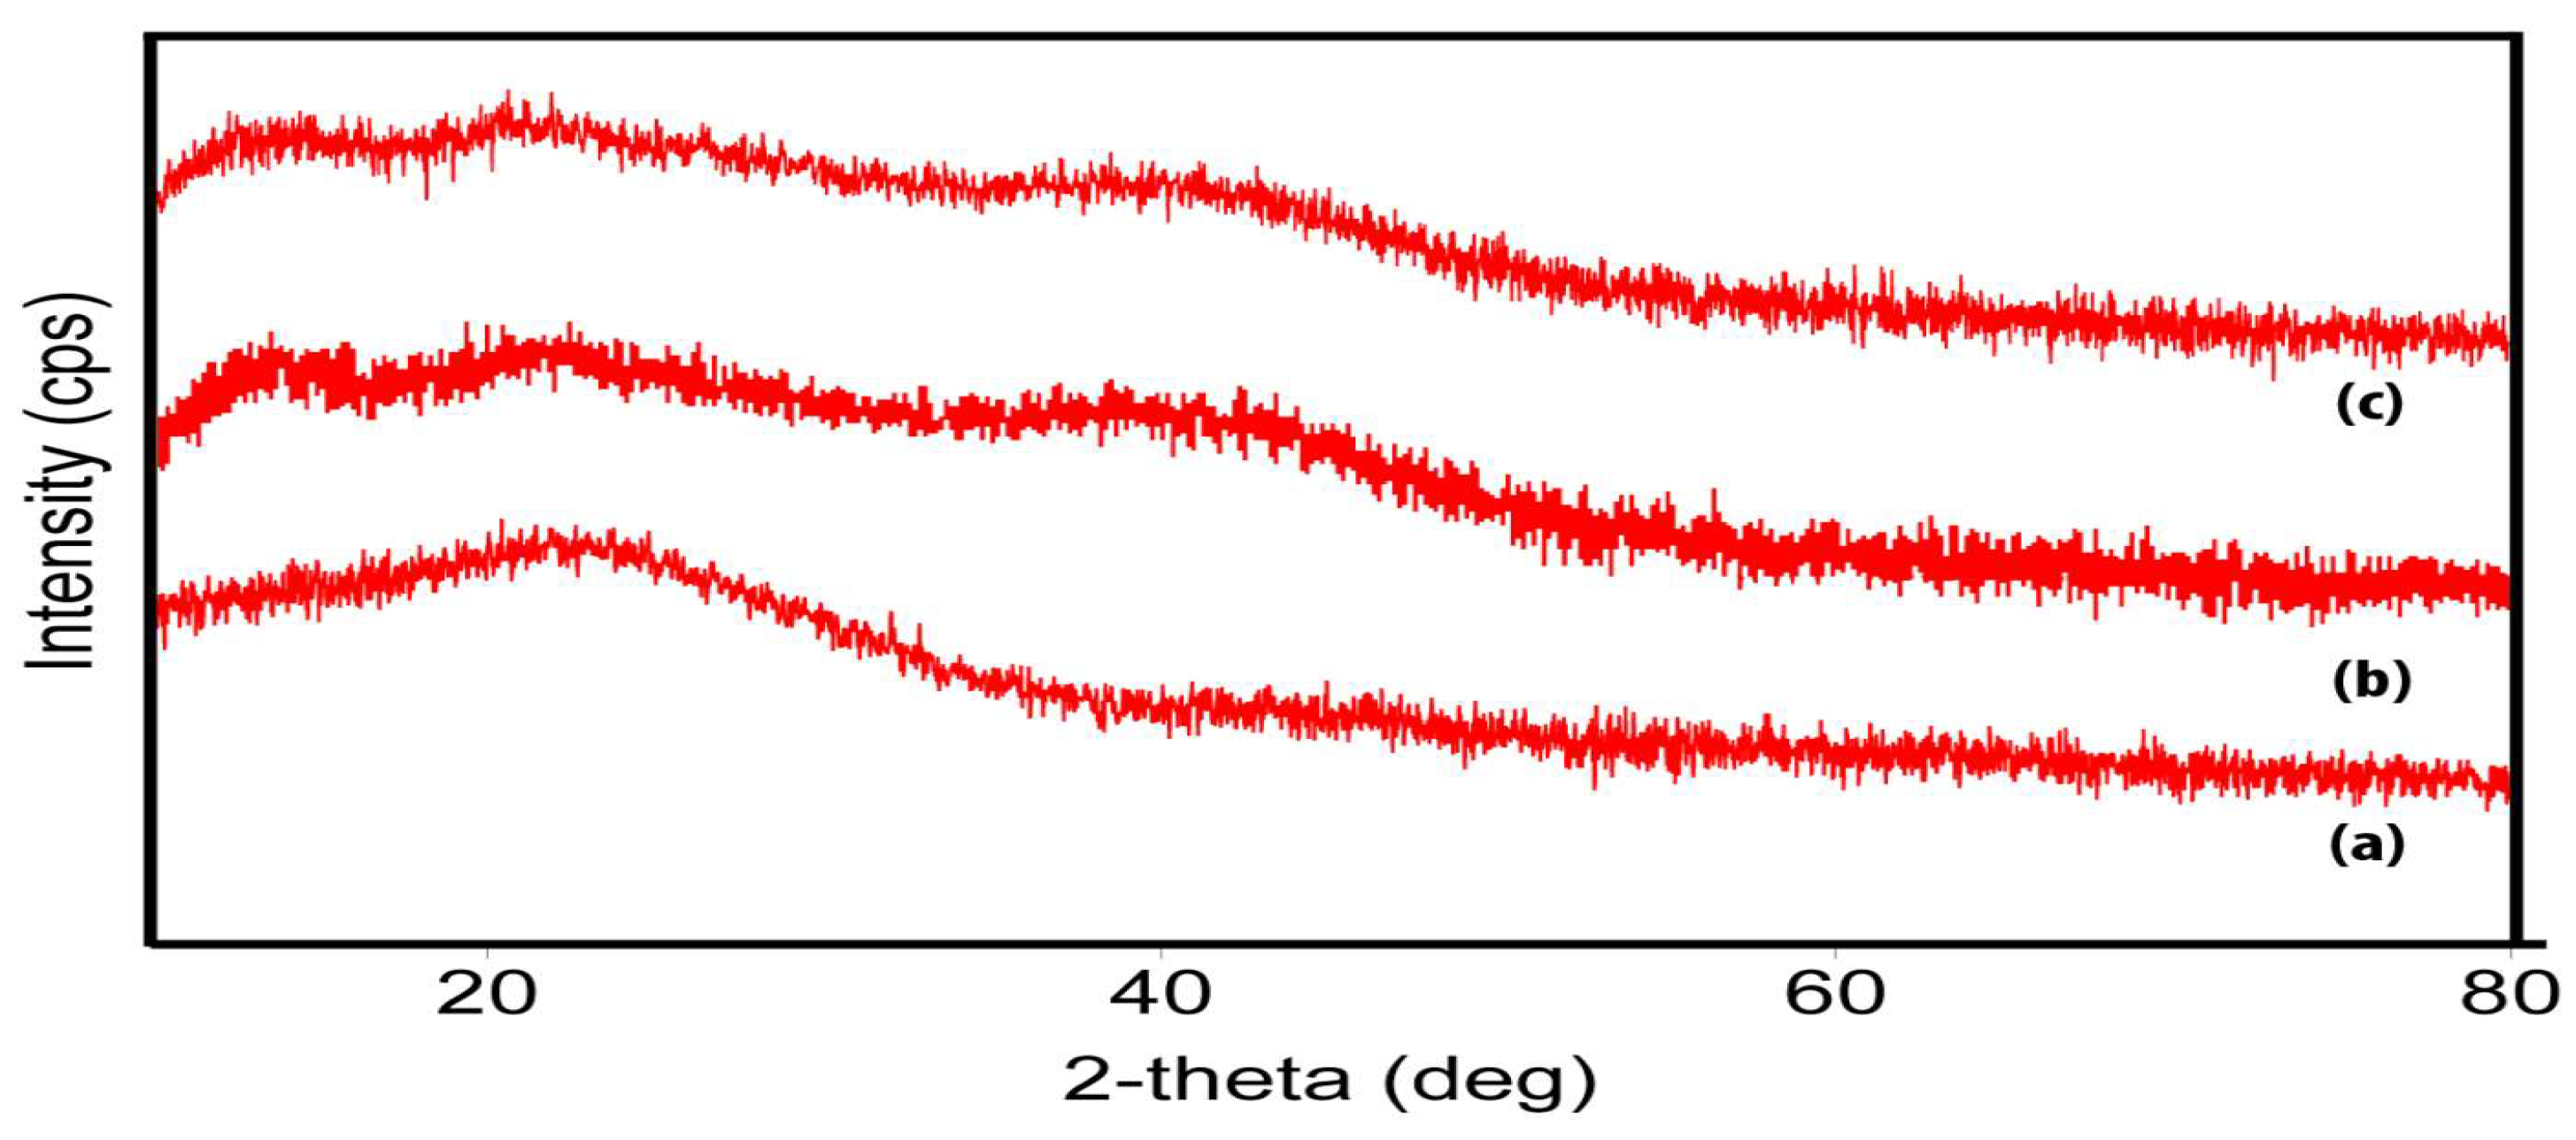
3.2. Interpretation by X-Ray Diffraction :
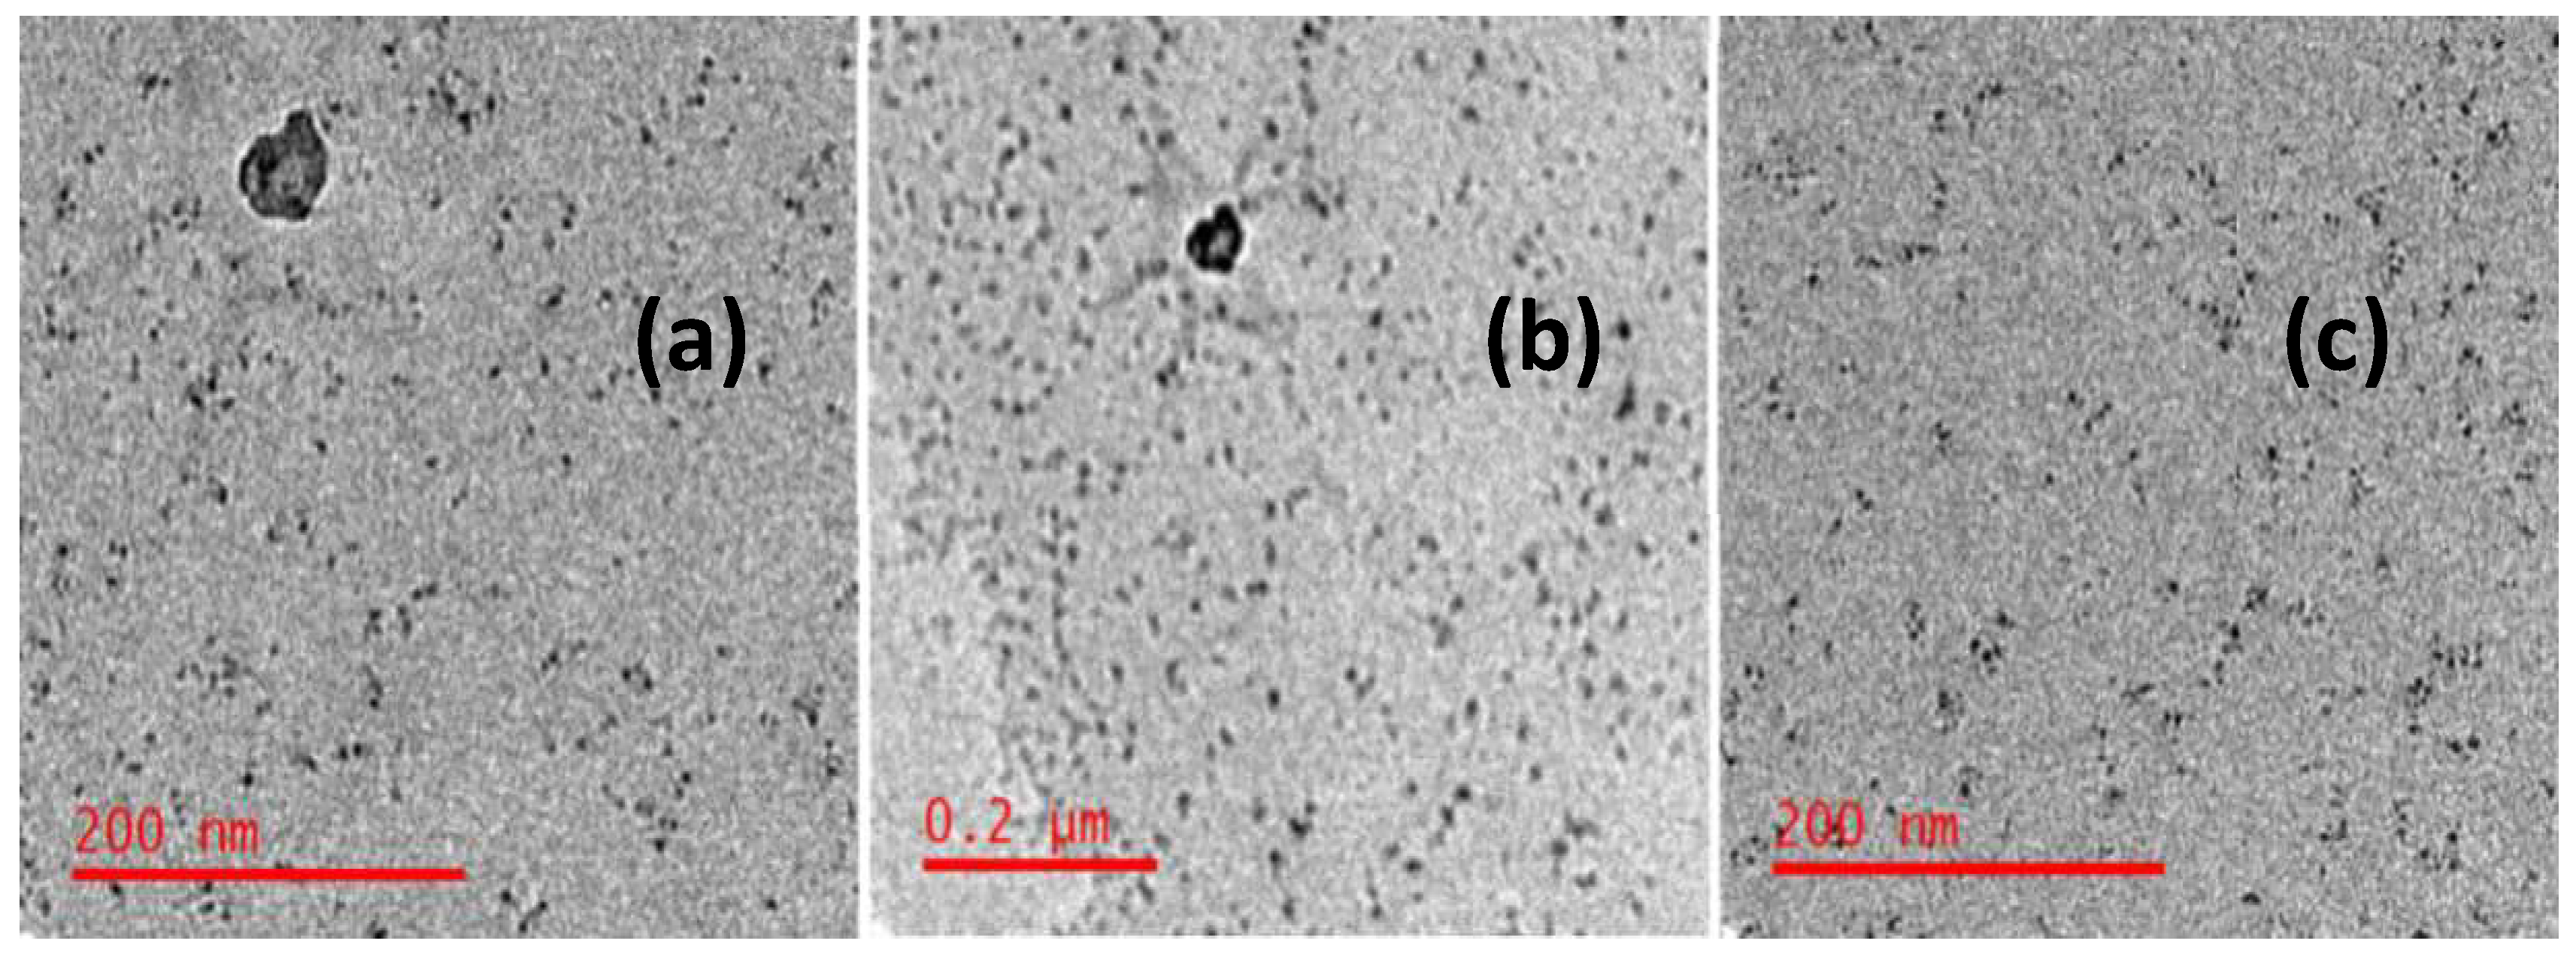
3.3. TEM Analysis
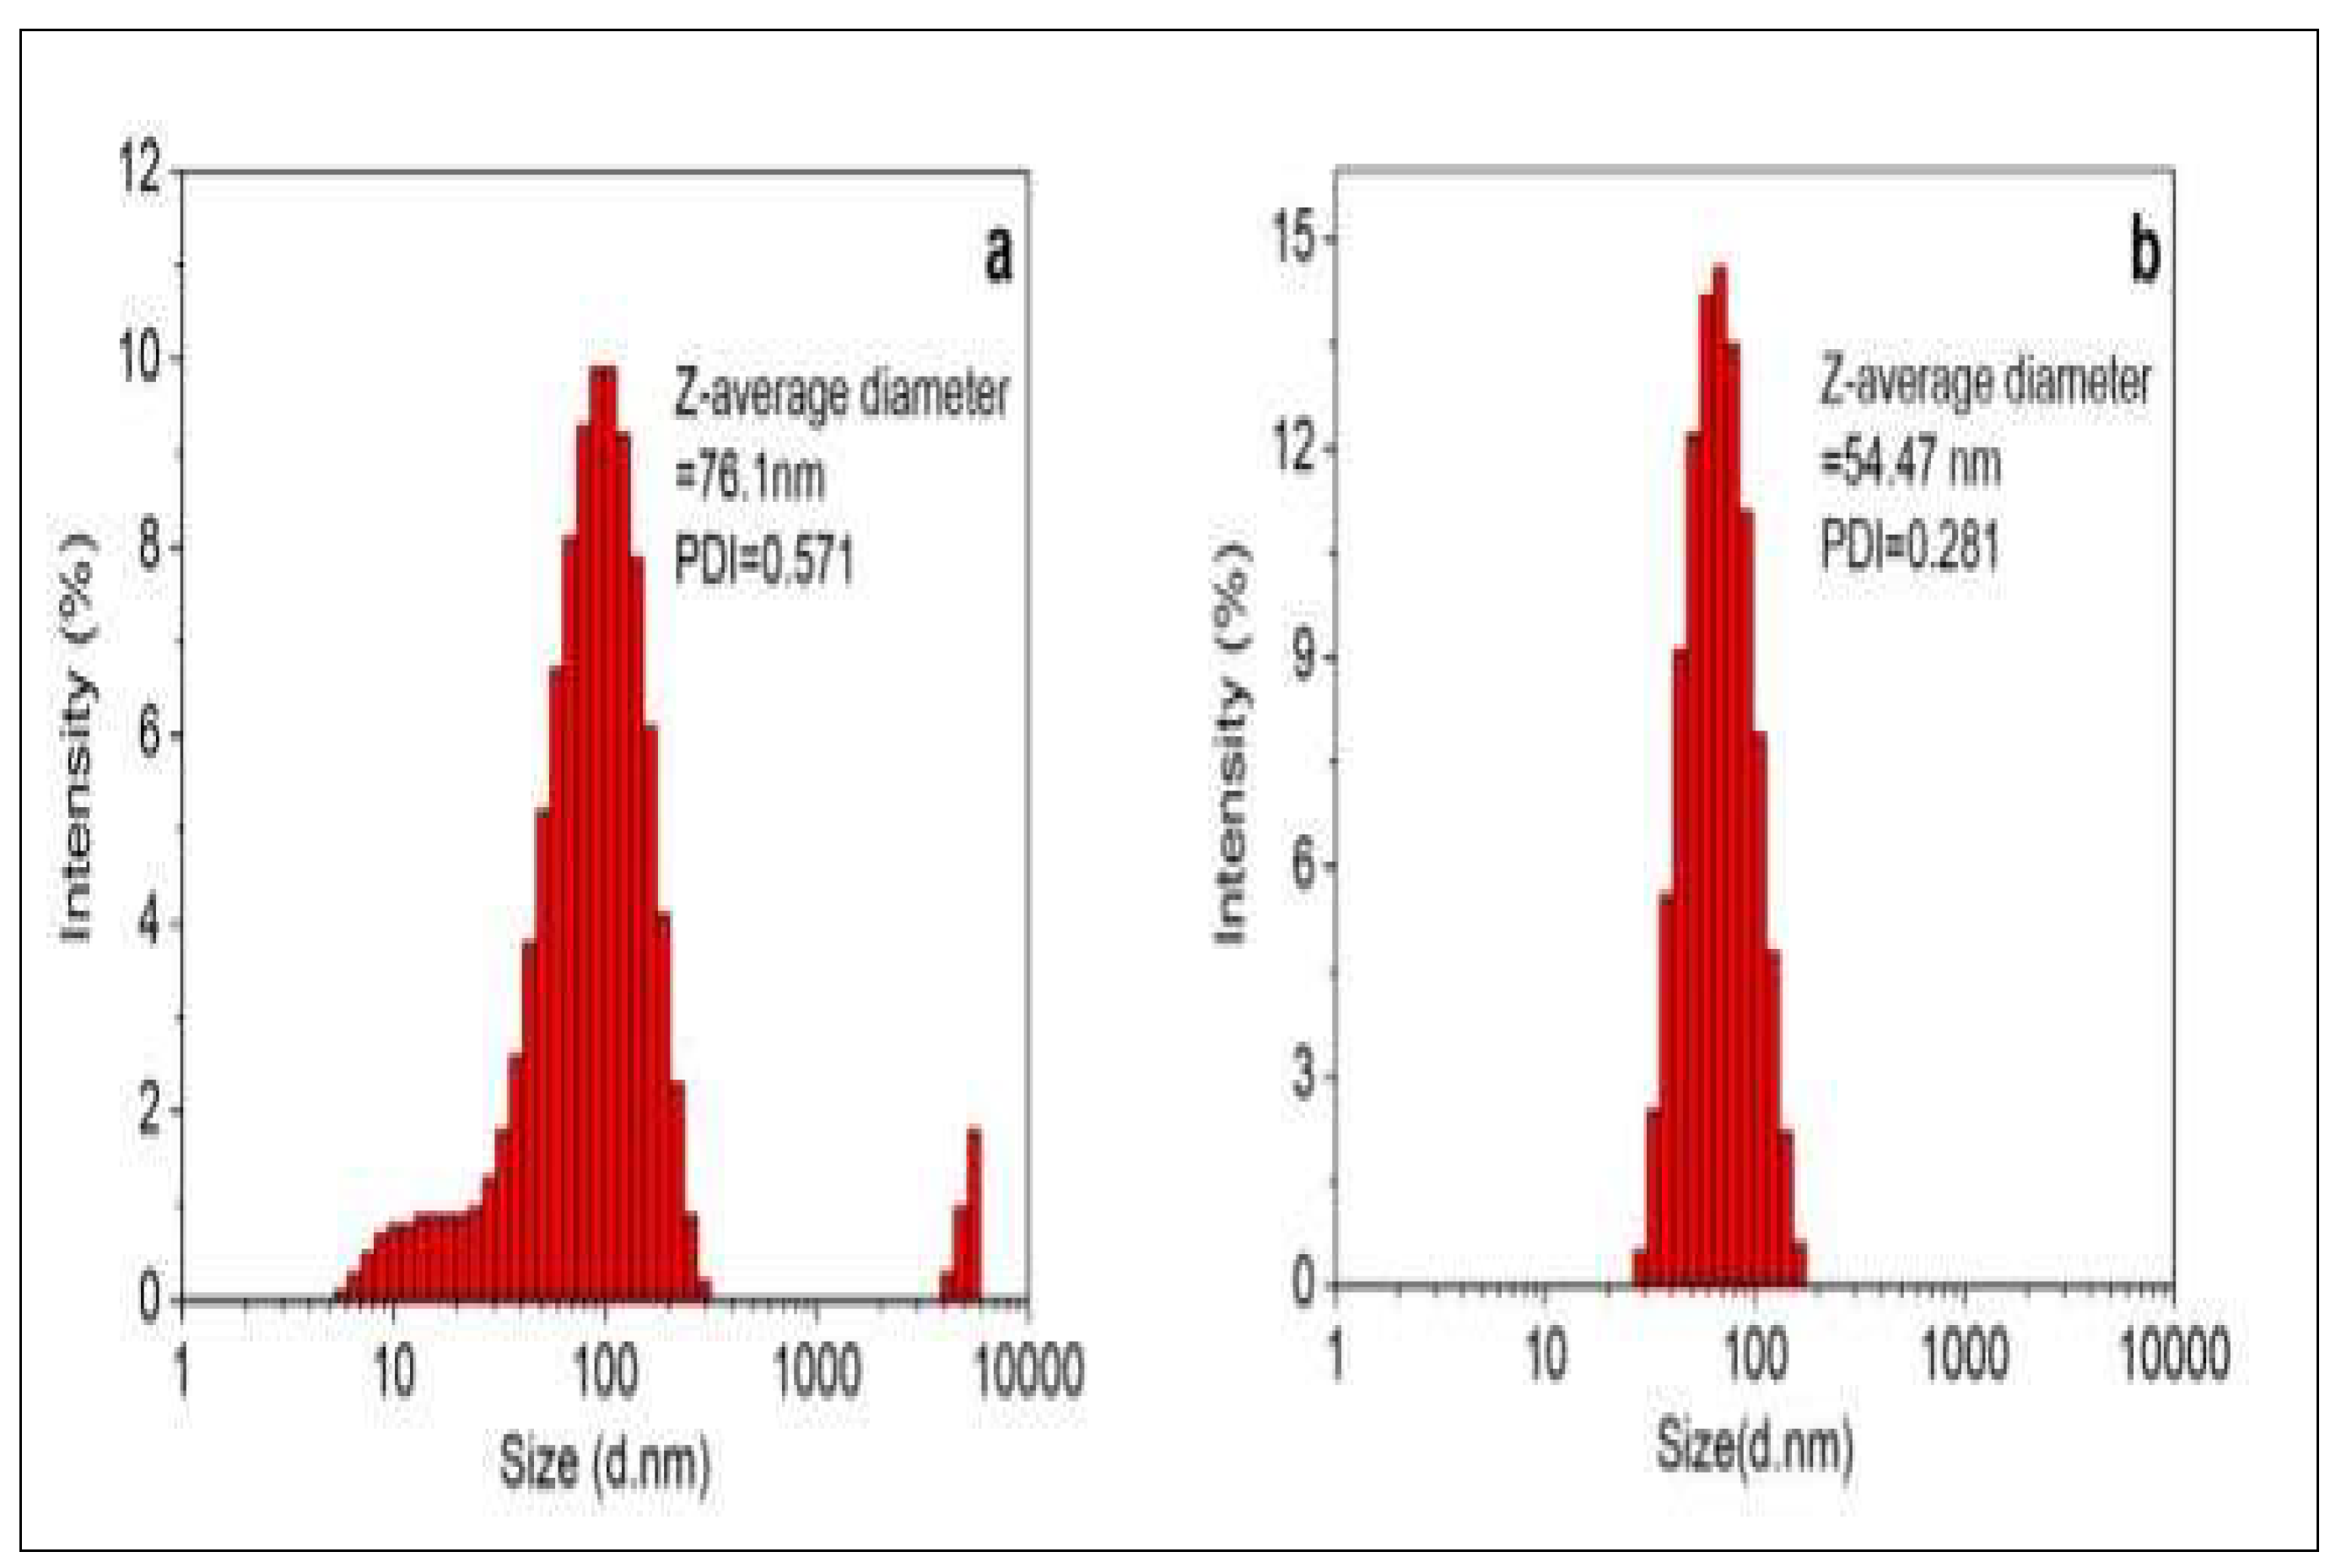
3.4. Particle Size Distribution and Zeta Potential Measurements
4. Results and Discussion :
4.1. FTIR Spectra Analysis of Graphene Oxide Nanoparticles
4.2. FTIR Spectrum of Alginate Nanoparticles
4.3. FTIR Spectrum of Graphene Oxide loaded Alginate Nanocomposites
4.4. X-Ray Diffraction Analysis
4.5. TEM (Transmission Electron Microscopy) Analysis
4.6. Particle Size Distribution and Zeta Potential Measurements
5.4. Results and Discussion
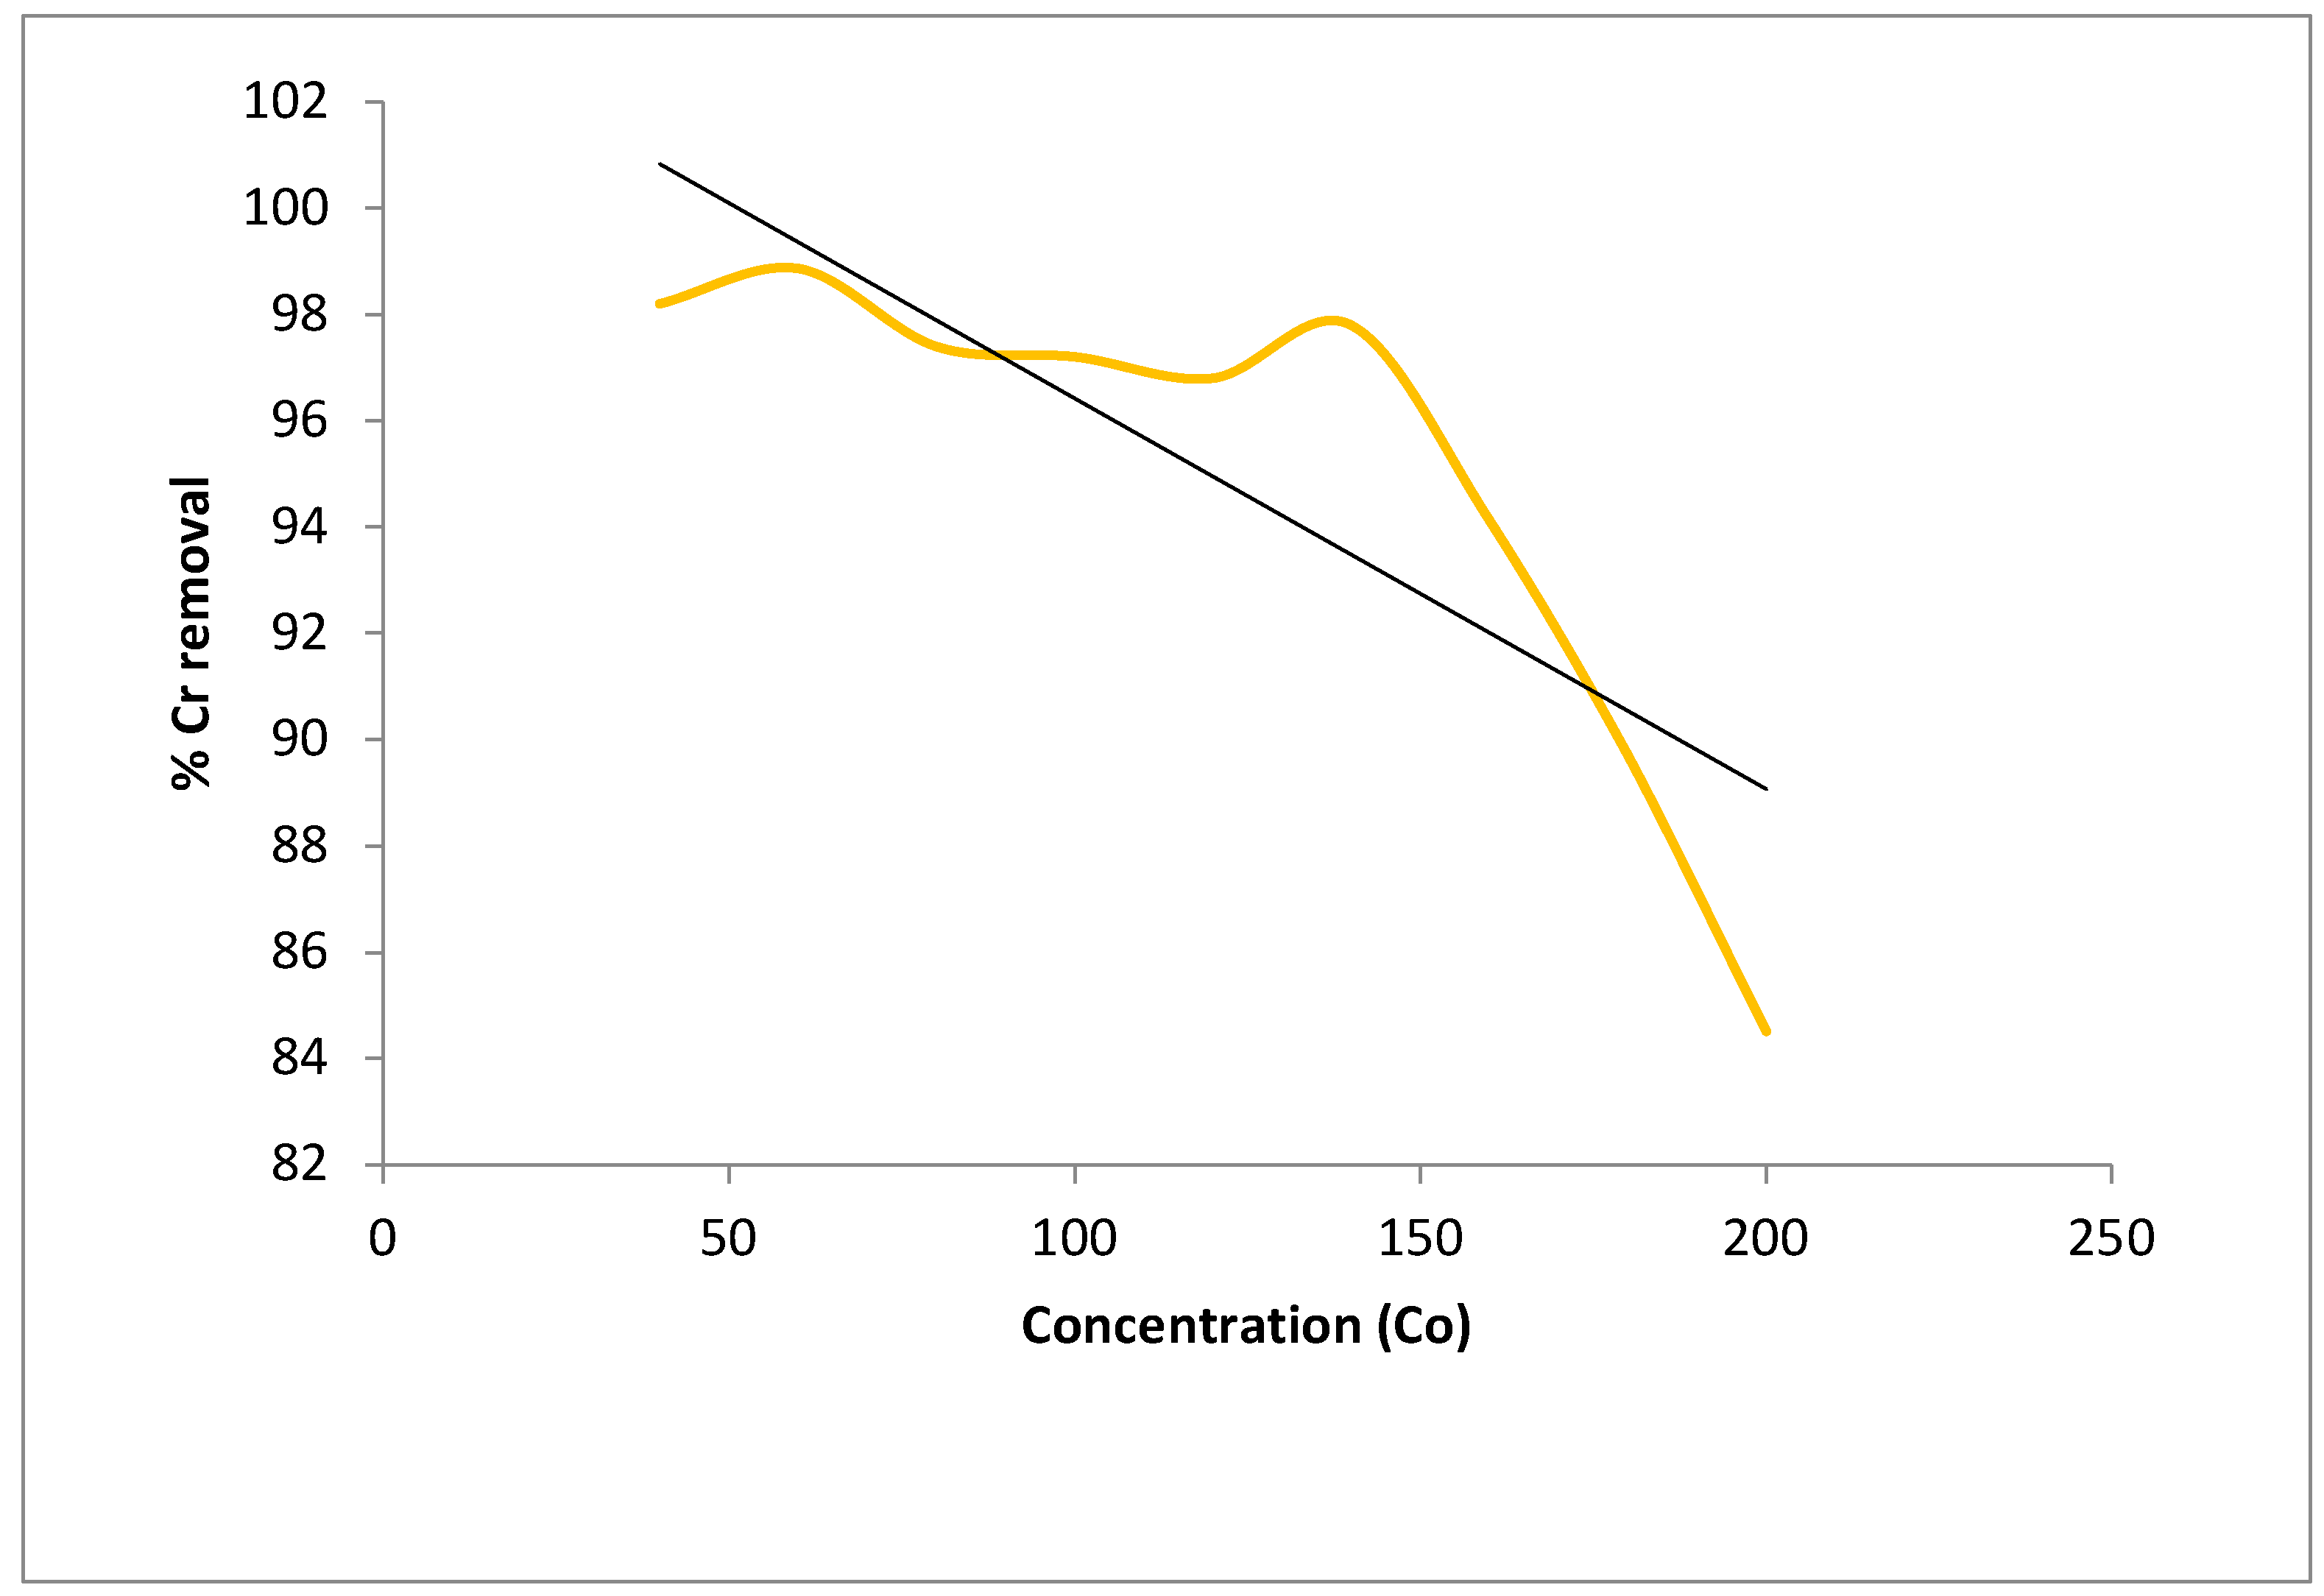
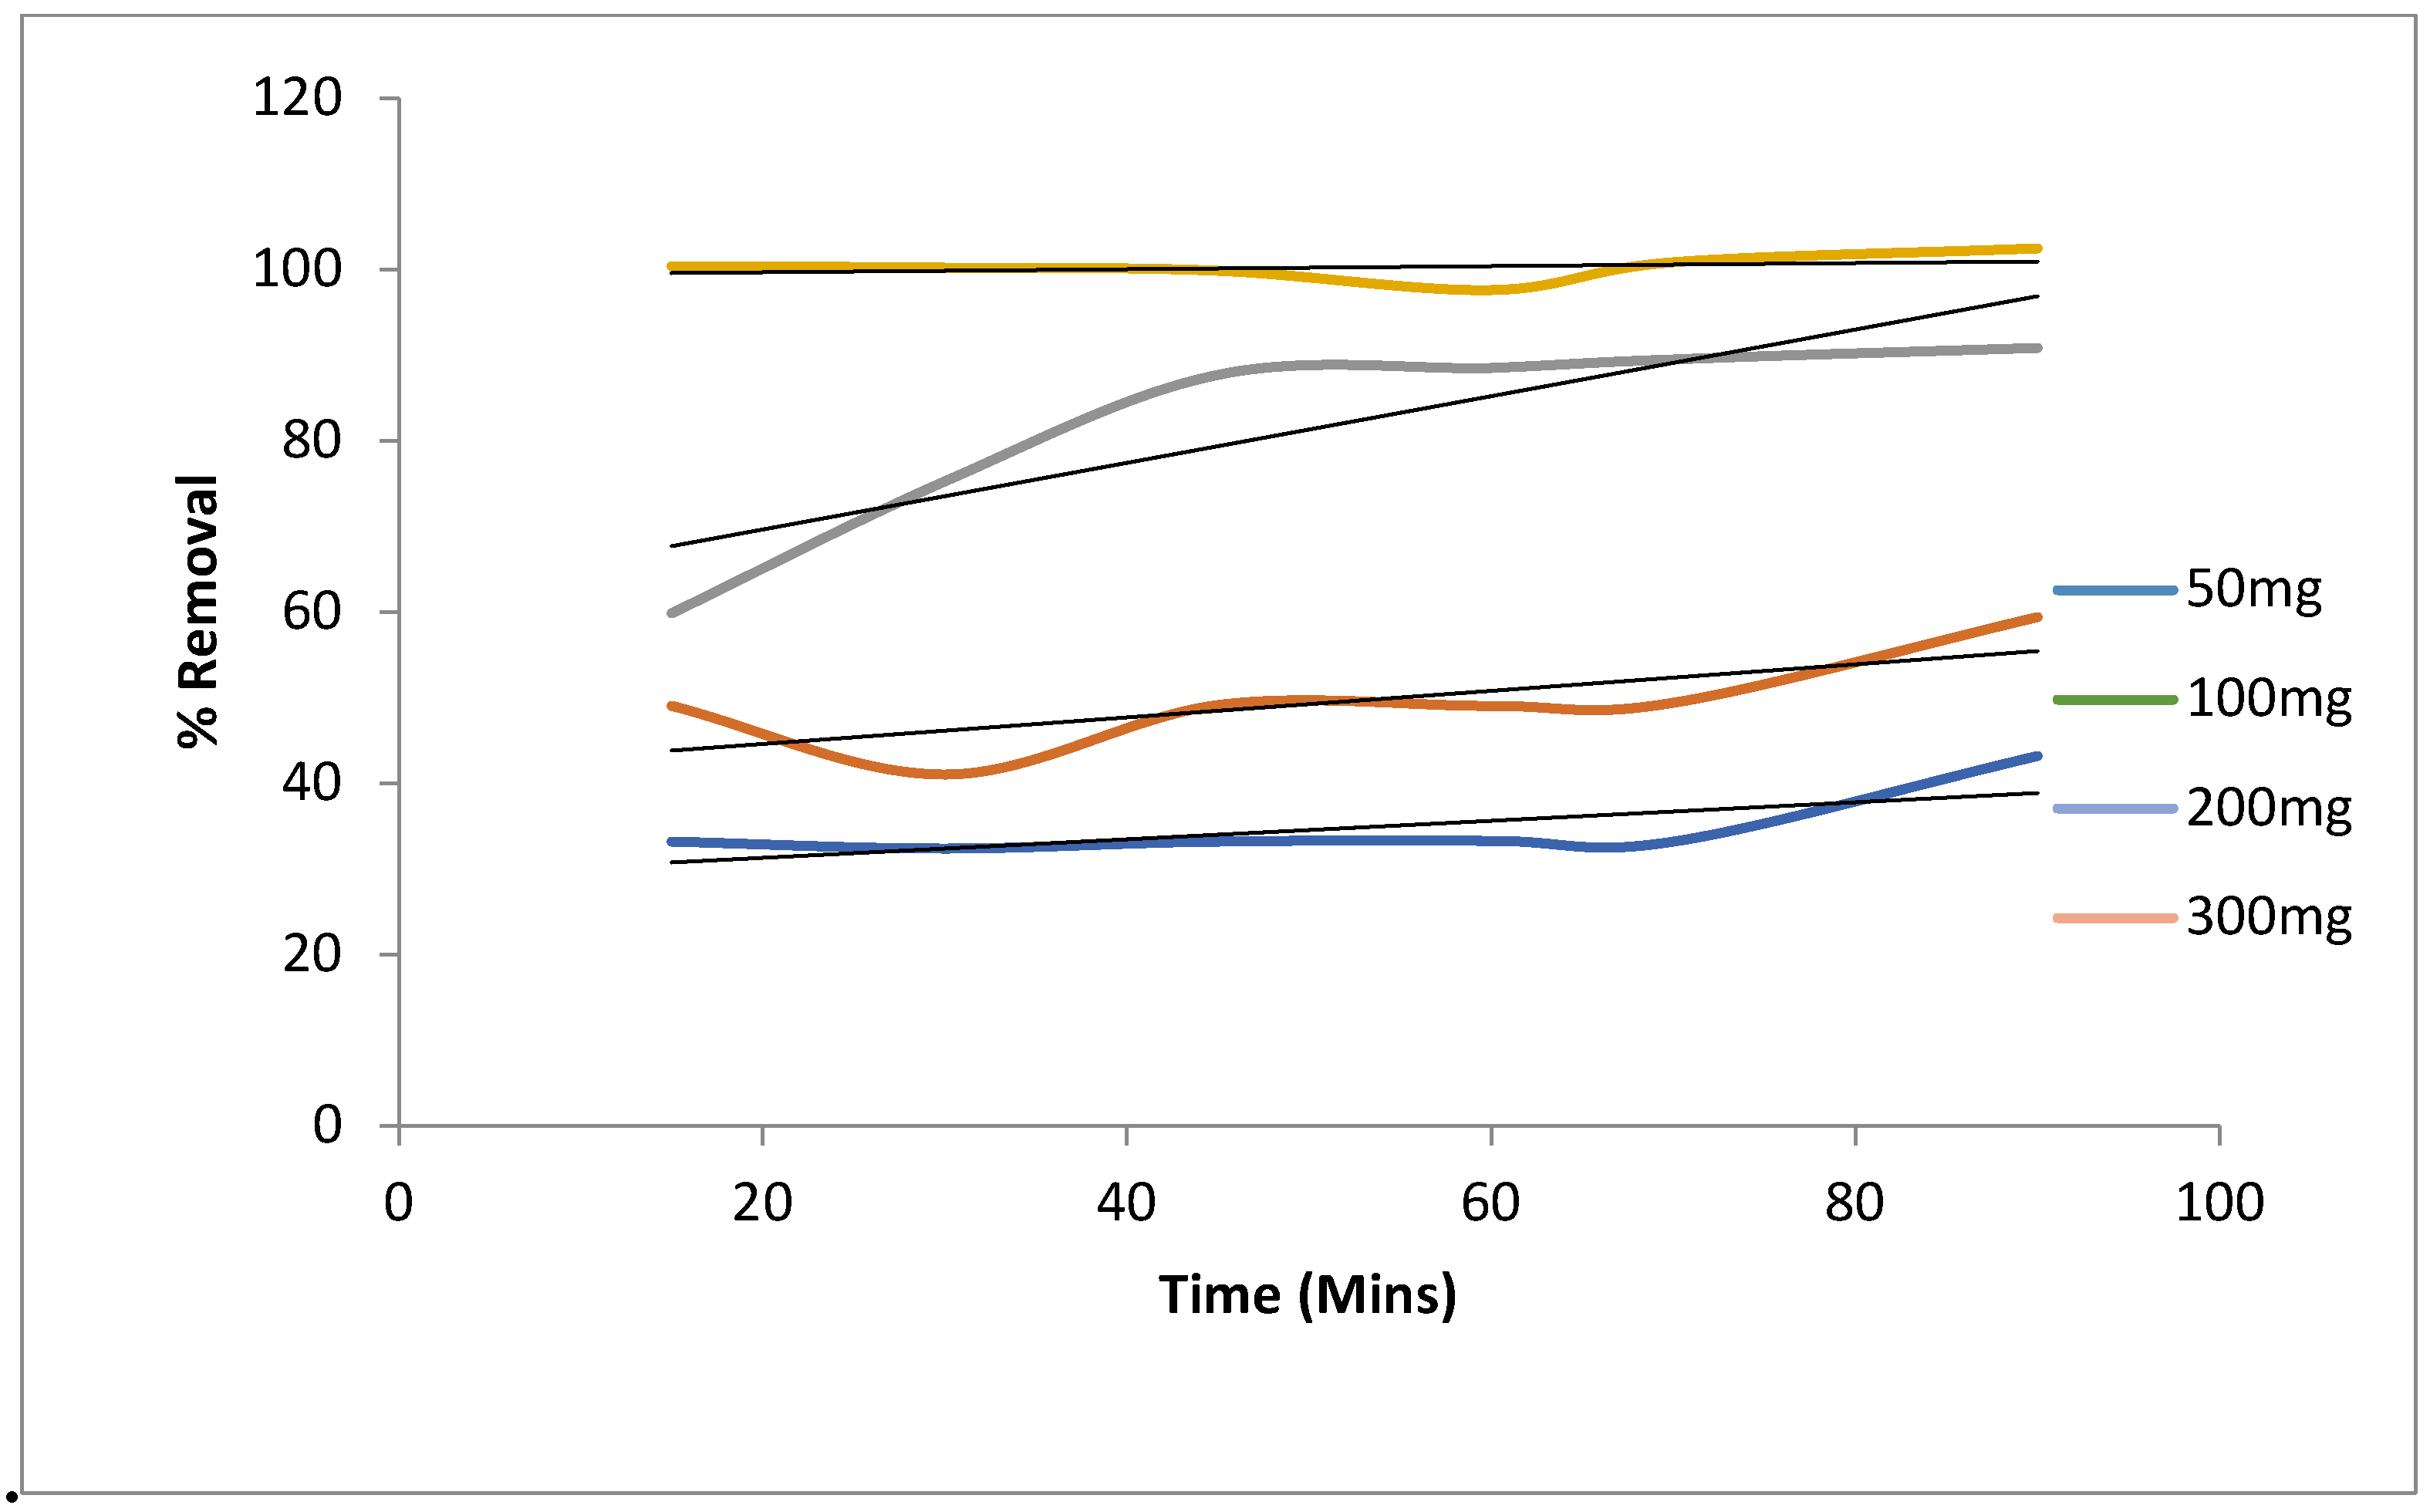
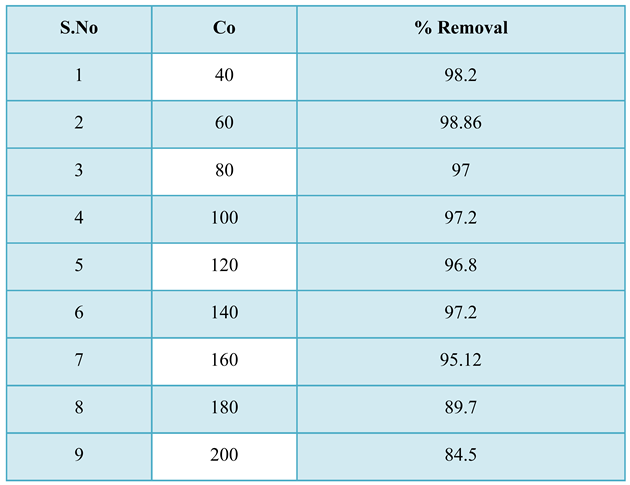
5.4.1. Batch Studies: (Effect of Agitation Time and Initial Metal Ion Concentration)
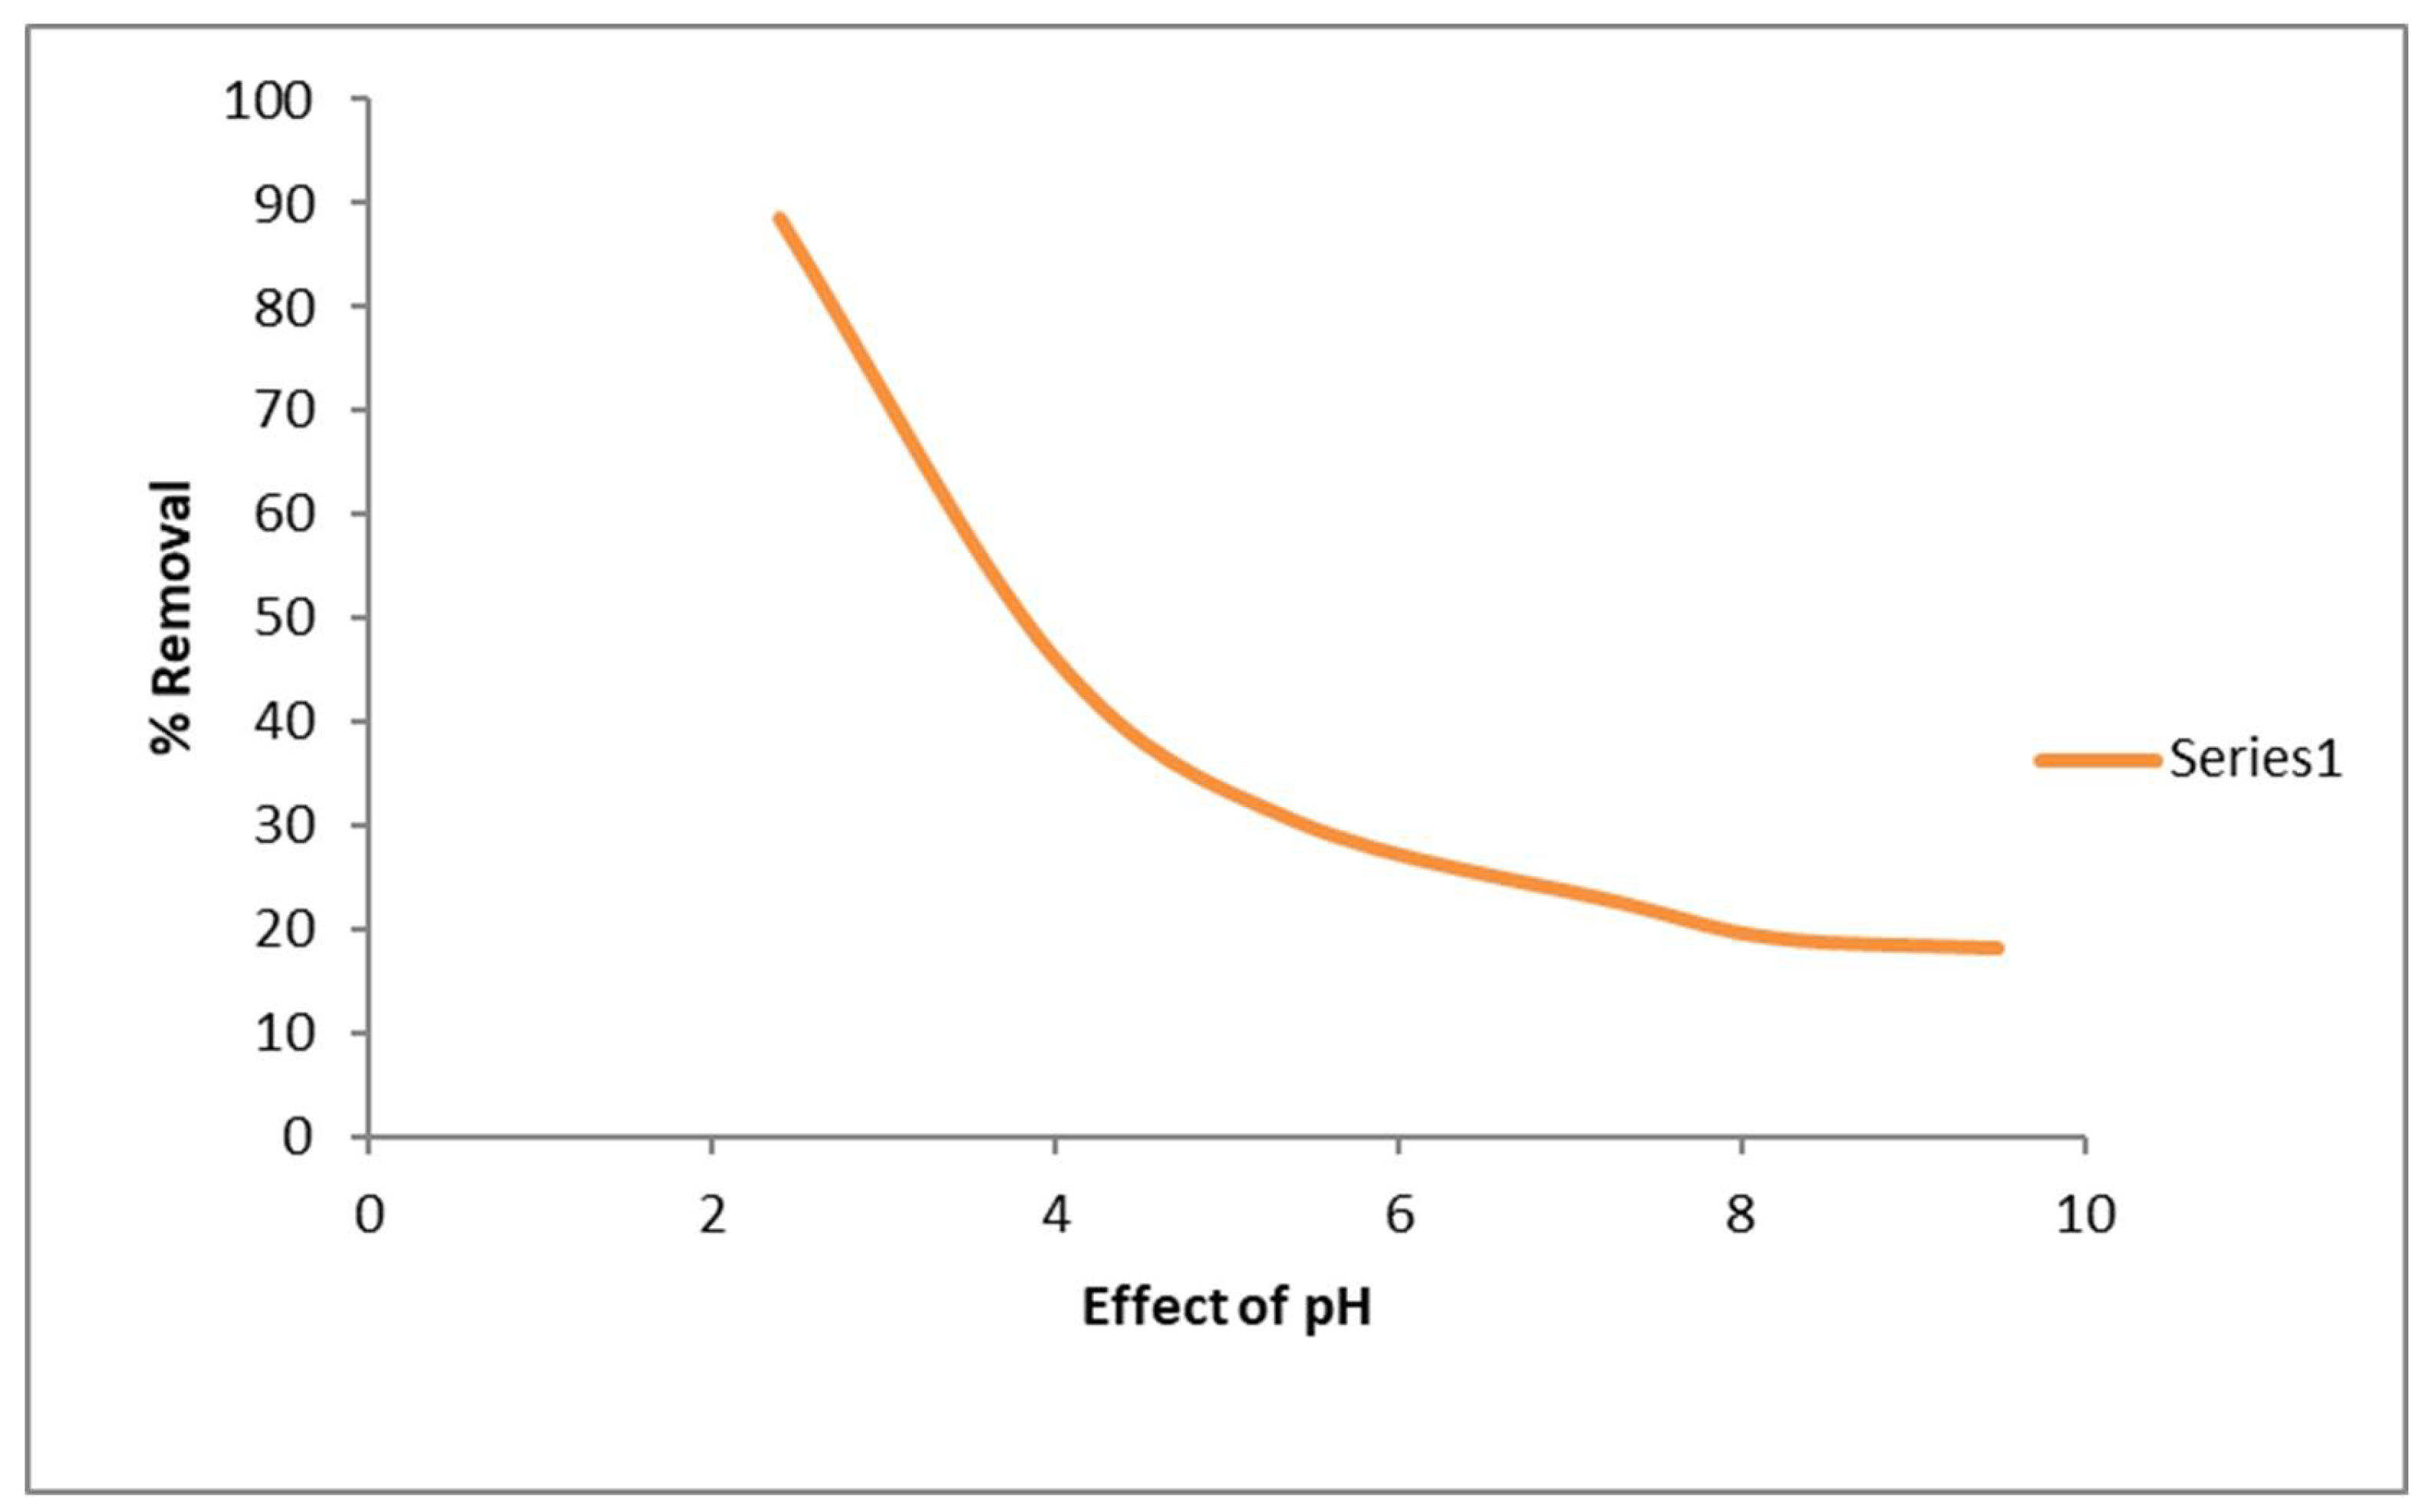
3.3.1. Effect of Initial pH
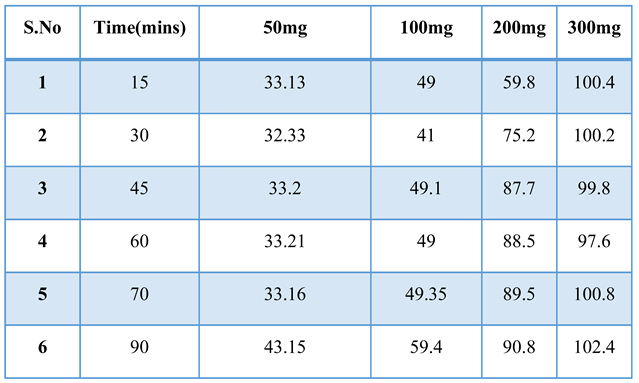
3.3.2. Effect of Adsorbent Dose
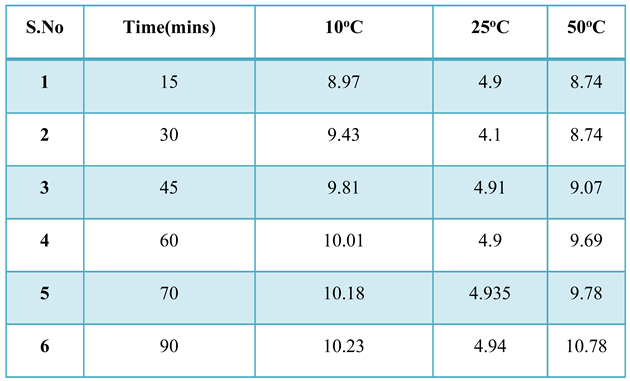
5.4.1.3. Effect of Temperature
4. Conclusions
Acknowledgments
Disclosure statement
References
- J. E. Fergusson, Oxford: Pergamon Press, 1990.
- J. H. Duffus, Chemistry International -- Newsmagazine for IUPAC, 2001, 23, 163–167.
- H. Bradl, London: Academic Press; 200.
- Z. L. He, X. E. Yang and P. J. Stoffella, Journal of Trace Elements in Medicine and Biology, 2005, 19, 125–140.
- G. Ra., Casarett and Doull’s toxicology.
- S. Shallari, C. Schwartz, A. Hasko and J. L. Morel, Science of The Total Environment, 1998, 209, 133–142.
- J. O. Nriagu, Nature 1989 338:6210, 1989, 338, 47–49.
- A. Arruti, I. Fernández-Olmo and Á. Irabien, Journal of Environmental Monitoring, 2010, 12, 1451–1458.
- E. Sträter, A. Westbeld and O. Klemm, Environmental Science and Pollution Research, 2010, 17, 1563–1573.
- J. M. Pacyna, Toxicology Metals, 2023, 9–28.
- Bhattacharya, A.K., T.K. Naiya, S.N. Mandal, and S.K. Das. Chemical Engineering Journal, 2008,137: 529–41.
- P. Thamilarasu, P. Sivakumar and K. Karunakaran.
- D. C. Sharma and C. F. Forster, Bioresour Technol, 1995, 52, 261–267.
- A.Bansiwal, P. Pillewan, R.B. Biniwale, andS.SRayalu,Microporous Mesoporous Mater,2010, 129, 54-61.
- M. V. Subbaiah, Y. Vijaya, N. S. Kumar, A. S. Reddy and A. Krishnaiah, Colloids Surf B Biointerfaces, 2009, 74, 260–265.
- S. Meenakshi, Studies on defluoridation of water with a few adsorbents and development of an indigenous defluoridation unit for domestic use, Ph.D. Thesis, Gandhigram, Tamilnadu, India, 1992.
- N. Viswanathan and S. Meenakshi, J Colloid Interface Sci, 2008, 322, 375–383.
- D. Mohan, K. P. Singh and V. K. Singh, J Hazard Mater, 2008, 152, 1045–1053.
- S. Meenakshi, C. S. Sundaram and R. Sukumar, J Hazard Mater, 2008, 153, 164–172.
- W. H. Kang, E. I. Kim and J. Y. Park, Desalination, 2007, 202, 38–44.
- C. Sairam Sundaram, N. Viswanathan and S. Meenakshi, Bioresour Technol, 2008, 99, 8226–8230.
- H. Wang, J. Chen, Y. Cai, J. Ji, L. Liu and H. H. Teng, Appl Clay Sci, 2007, 35, 59–66.
- Agarwal, M. Quest for black diamond: pollution from mines, power plants is choking chhattisgarh’s coal hub.https://scroll.in/article/901278/quest-for-black-diamond-pollution-from-mines-power-plants-is-choking-chhattisgarhscoal-hub.
- S. Kumar, G. Bhanjana, A. Sharma, M. C. Sidhu and N. Dilbaghi, CarbohydrPolym, 2014, 101, 1061–1067.
- C. Namasivayam and R. T. Yamuna, Chemosphere, 1995, 30, 561–578.
- Kreuter, J.; Pharm Acta Helv, 1983, 58, 196.
- P. K. Pandey, S. K. Sharma and S. S. Sambi, International Journal of Environmental Science and Technology, 2010, 7, 395–404.
- Hua, S., H. Ma, X., Li, H. Yang, and A. Wang. International Journal of Biological Macromolecules 2010. 46: 517–23.
- Liu Z, Suenaga K, Harris PJF, Iijima S. Open and closed edges of graphene layers. Phys Rev Lett 2009;102(1):015501.
- P Mukherjee, M Roy, B P Mandal, G K Dey,P K Mukherjee, J Ghatak, A K Tyagi and S P Kale, Nanotechnology (2008) 19: 075103.
- Kim, T. Y., Chung, J. H., Choi, S.Y., Cho, S. Y., and Kim, S. J. (2008) Proceedings of the World Congress on Engineering and Computer Science, October 22 - 24, 2008, San Francisco, USA.


Disclaimer/Publisher’s Note: The statements, opinions and data contained in all publications are solely those of the individual author(s) and contributor(s) and not of MDPI and/or the editor(s). MDPI and/or the editor(s) disclaim responsibility for any injury to people or property resulting from any ideas, methods, instructions or products referred to in the content. |
© 2025 by the authors. Licensee MDPI, Basel, Switzerland. This article is an open access article distributed under the terms and conditions of the Creative Commons Attribution (CC BY) license (http://creativecommons.org/licenses/by/4.0/).


