
Submitted:
13 January 2025
Posted:
14 January 2025
You are already at the latest version
Abstract
This study investigated the relative contributions of natural and anthropogenic factors to the nutrient status of 33 representative lakes and reservoirs in the Yangtze River Basin. Using national water quality monitoring data, remote sensing imagery, GIS, the InVEST model, and RDA, we analyzed the Spatiotemporal differences of total nitrogen (TN), total phosphorus (TP), the ratio of TN to TP (TN/TP), trophic level index (TLI), and habitat quality (HQ). Results revealed significant spatial heterogeneity in lake nutrient status, with upstream reservoirs exhibiting better water quality than their midstream and downstream counterparts. Over time, there is a decreasing trend in nutrient loads in lakes and reservoirs, yet the risk of eutrophication remains high. The middle and lower reaches of lakes and reservoirs face more severe eutrophication pressure. The contribution rates of natural factors and human activities to TN and TP in lakes and reservoirs are 19.1% and 35.0%, respectively. The main driving factors are livestock and poultry breeding volume, habitat quality, and urbanization, with contribution rates of 13.0%, 9.8%, and 0.2%, respectively. The contribution rates of natural factors and human activities to TN/TP and TLI of lakes and reservoirs are 19.8% and 15.5%, respectively. Actual Evapotranspiration (7.8%), habitat quality (7.3%), and hydraulic retention time (3.1%) were key drivers for the shifts of TN/TP and TLI. Management strategies should therefore control agricultural nitrogen fertilizer inputs upstream, industrial and agricultural non-point source pollution in the midstream, and enhanced wastewater treatment alongside population density and economic development control in the downstream areas. This research provides a crucial scientific basis for the ecological environment protection and sustainable utilization of water resources in the Yangtze River Basin.
Keywords:
Yangtze River Basin
; nutrient salts
; driving factors
; contributions rate
; lakes and reservoirs
1. Introduction
With the Yangtze River Basin's rapid socioeconomic development, the basin faces increasing challenges regarding its water ecological environment quality[1,2]. Among these, the eutrophication of lakes and reservoirs is a global environmental concern that has drawn widespread attention. According to a statistic, approximately 45.5% of lakes and reservoirs in the Yangtze River Basin are experiencing eutrophication[3]. Excessive input of nutrients such as nitrogen and phosphorus is a significant trigger for lake and reservoir algal blooms. With rapid economic development, the discharge of industrial wastewater, domestic sewage, and aquaculture wastewater[4], along with the application of agricultural fertilizers[5], results in the influx of large amounts of nitrogen and phosphorus into lakes and reservoirs, thereby escalating the risk of algal blooms. It is estimated that the anthropogenic nitrogen load in the Yangtze River Basin increased by 13% from 2000 to 2017 [1], reaching 1.84×10⁷ t/a, with an average annual increase of 1.3×10⁵ t/a. Furthermore, climatic factors such as rising temperatures[4]、and extreme precipitation[6] further exacerbate the frequency of lake and reservoir eutrophication occurrences. Consequently, lake and reservoir eutrophication results from the combined effects of multiple natural factors and human activities. Effectively distinguishing and identifying the contributions of these factors to lake and reservoir eutrophication is crucial for the management and control of this problem.
In recent years, many studies[7,8] have delved into the effects of both internal and external nitrogen and phosphorus nutrient inputs on lake and reservoir eutrophication, and they have simultaneously proposed corresponding control measures. Some studies have found that natural factors, such as lake depth (DEP) and hydraulic retention time (HRT), significantly influence the nutritional status of lakes[9,10]. Concurrently, climate change, changes in land use, agricultural fertilization, and other factors also contribute to the nutritional status of lakes[4,11]. The ratio of total nitrogen to total phosphorus (TN/TP) is a vital indicator for assessing the nutrient limitation status in lakes and reservoirs[12]. The variation of TN/TP is influenced by both natural factors[13] and human activities[14], and its changing trend is closely related to the nutritional status of lakes and reservoirs. Studies have revealed that TN/TP in shallow lakes in the middle and lower reaches of the Yangtze River is negatively correlated with TP concentration, and during the growing season, a decrease in TN concentration is an important reason for a decline in TN/TP[15]. Research by Zeng et al[16]. discovered that the correlation between TN/TP and TN is higher than that of TP in lakes and reservoirs in the middle and lower reaches of the Yangtze River, which demonstrates that TN is the key factor in seasonal changes in TN/TP. Existing research focuses primarily on the analysis of the impacts of human activities on nitrogen and phosphorus concentrations and changes in TN/TP, seeking out key anthropogenic driving factors, but these studies seldom consider the effects of natural factors and land-use changes on nutrient loads and trophic states of lakes and reservoirs.
Therefore, this study uses water quality monitoring data from the national control sections of key lakes and reservoirs in the Yangtze River Basin, as well as remote sensing data, combined with GIS technology, InVEST, and RDA models, to quantitatively assess the impacts of several natural factors (temperature - TEP, precipitation - PPT, DEP, and water temperature - WT) and human activity factors (livestock unit - LSU, aquaculture production - AQCP, nitrogen deposition - NDEP, nitrogen fertilizer application - NF, phosphorus fertilizer application - PF, habitat quality - HQ, and HRT, etc.) on the trophic state of typical lakes and reservoirs in the Yangtze River. By employing canonical analysis, variance partitioning, and hierarchical partitioning, we elucidate the influencing mechanisms of different driving factors on nutrient concentrations in lakes and reservoirs, quantify the contributions of natural and human factors to changes in nitrogen and phosphorus loads of lakes and reservoirs, identify the key natural and anthropogenic driving factors for the management of lake and reservoir eutrophication, and provide a scientific basis for the ecological environmental protection and sustainable use of water resources in key lakes and reservoirs of the Yangtze River Basin and for preventing and controlling algal bloom events.
2. Materials and Methods
2.1. Study Sites
The Yangtze River Basin encompasses an area of 1.8 × 10⁶ km², originating from the Tanggula Mountains on the Qinghai-Tibetan Plateau. The basin exhibits an annual average runoff of 8574 × 10⁸ cubic meters, with a sediment load of approximately 480 × 10⁶ tons. It has an annual average precipitation of around 1045 mm [17]. By 2020, the cultivated land area reached 246,000 square kilometers and terrain sloping from west to east[2]. Based on river channel characteristics and topography, the Yangtze River Basin is divided into three sub-basins (Figure 1): the upper reaches (Yibin to Yichang), the middle reaches (Yichang to Hukou), and the lower reaches (Hukou to the estuary). Land use is predominantly forest (41.0%), with cultivated land mainly concentrated in the Sichuan Basin and the middle and lower reaches of the Yangtze Plain (26.7%). This study selected 33 lakes and reservoirs within the Yangtze River Basin as the research area, covering the upper, middle, and lower reaches, with lakes chosen based on their diverse geographical and climatic characteristics, along with different human activities impacts. For instance, the Taihu Lake basin in the lower reaches represents an economically developed and densely populated area; the Dongting Lake basin in the middle reaches demonstrates intensive agricultural activity; the Poyang Lake basin in the lower reaches exhibits significant seasonal hydrological fluctuations; while the Dianchi Lake in the upper reaches, has higher level of urbanization.
2.2. Data Collection and Processing
the watershed boundaries of 33 lakes and reservoirs were delineated using HydroBASINS level 7 data. Basic lake and reservoir attributes were sourced from the HydroSHEDS database. Data on lake TN, TP, and the Trophic Level Index (TLI) were obtained from the China National Environmental Monitoring Center. Basin precipitation and other natural factors were sourced from the National Tibetan Plateau Scientific Data Center and the National Ecosystem Science Data Center; wind speed data were from the National Tibetan Plateau Scientific Data Center and the Spatio-temporal Three-level Environmental Big Data Platform. Human activity data (HRT, NF, PF, NDEP, land use, etc.) were acquired from HydroSHED, the National Bureau of Statistics, the National Ecosystem Science Data Center, and Esri. LSU data were derived from a 1-km resolution livestock dataset calculated using the MAPS model[18]. Detailed data sources and data formats are presented in Table 1.
2.3. Model Description
2.3.1. Habitat Quality Index
This study comprehensively considers the relationship between land use types and habitat quality threat factors, particularly considering the sensitivity of different land use types to threat factors, the intensity of the threat, and key factors such as the maximum threat distance. To simulate, evaluate, and analyze habitat quality and its changes in the study area, the Habitat Quality module within the InVEST model was utilized. This module calculates a habitat quality index, reflecting the abundance of survival resources and the degree to which these resources are influenced by threat factors; A higher index indicates greater abundance of survival resources and lower impact from threat sources. When selecting threat factors, this study fully considered the actual conditions of the study area, related research[19,20], and recommendations from the InVEST model user manual[21]. This led to identifying cultivated land, forest land, grassland, water bodies, built-up areas, and unutilized land as major threat factors. The InVEST model, as an established tool for evaluating ecosystem services and trade-offs, has been widely adopted in habitat quality assessments. In the model's application, detailed parameters such as threat factor weights, the maximum influence distances from threat sources to ecological land, and the sensitivity of ecological land to stressors were explicitly defined (specific parameters are listed in Table 2 and Table 3), ensuring accuracy and reliability of assessment outcomes.
Where HQ represents habitat quality;
represents the habitat suitability of the -th land use type, indicating the suitability of that land type for target species. denotes the degree of habitat degradation, which is determined by the overall impact of threat factors on habitat. is the half-saturation constant, which is taken as 50% of the maximum value of . is a normalization constant, and is assigned a value of 2.5. In these formulas, is the number of threat factors; represents the weight of threat factor and is used to indicate the importance of the threat factors; represents the number of grids of the threat factor ; represents the intensity of the threat factors in the grid ; represents the threat degree of the threat factor in grid to grid , which is related to distance. Gamma represents the degree of interference resistance of grid and is used to indicate the resistance of different land use types to threat factors; represents the sensitivity of different land use types to threat factor . represents the distance between grid and . represents the maximum distance of influence of the threat factor .
2.3.2. TLI Index
The is calculated based on multiple indicators in lakes and reservoirs, including chlorophyll-a (Chla), total phosphorus (TP), total nitrogen (TN), transparency (SD), and chemical oxygen demand (CODMn), etc. The calculation formula for is as follows:
Where represents the comprehensive trophic state index of lakes and reservoirs; represents the number of indicators. represents the weight of the indicator , which can be calculated through correlation analysis, and AHP or other weight allocation methods may also be used, andrepresents the single trophic index of the indicator.
2.3.3. Method for Quantitatively Assessing Contributions of Driving Factors
This study employed a quantitative approach combining Redundancy Analysis (RDA) and variance partitioning to assess the influence of various natural and human factors on lake and reservoir nutrient status. Natural factors considered in the analysis included: Depth (DEP), Actual Evapotranspiration (AET), Hydraulic Retention Time (HRT), Latitude, Longitude, Elevation, Precipitation (PPT), and Wind Speed (WS). Human disturbance factors included: Habitat Quality (HQ), Hydraulic Retention Time (HRT), Livestock Units (LSU), Phosphorus Fertilizer (PF), Urbanization (Urb), and Nitrogen Deposition (NDEP). Initially, RDA, performed using the ‘vegan’ package[5], was utilized to identify the significant drivers affecting the lake’s nutritional status. Subsequently, variance partitioning using the data.hp package[22] quantified both the individual and combined contributions of natural and human-driven factors to variations in TN, TP, TN/TP ratio, and Trophic Level Index (TLI) values. This allowed quantification, via a statistical analysis of the specific percentage contribution, that identified the role of individual drivers, or multiple environmental drivers simultaneously to changes in TN, TP, TN/TP, and TLI ratios. This comprehensive assessment evaluates both the natural and anthropogenic effects on parameters linked to lake and reservoir nutritional characteristics.
2.3.4. Data Analysis and Processing
Data for this research were initially analyzed with Excel 2020 and Statistics 17 for basic statistical parameters. Time-series data visualization for nitrogen and phosphorus concentrations was performed using Origin PRO. Statistical analysis of these drivers was completed using R-4.4.2 (The R Project for Statistical Computing, https://cran.r-project.org/) and specifically using the "vegan" and rdacca.hp packages for statistical testing and visualization. R Studio was employed for visualizing trophic state indicators, conducting RDA, and visualizing Upset plots. ArcGIS 10.8 was used to generate the overview map of the study region and map of habitat quality throughout the study site.
3. Results
3.1. Spatio-temporal Variations in Nutrient Status of Typical Lakes and Reservoirs
3.1.1. Spatial Analysis of Nutrient Status in Typical Lakes and Reservoirs
The total nitrogen (TN) concentrations in the lakes and reservoirs of the Yangtze River Basin ranged from 0.1 to 3.4 mg/L (P>0.05). The concentration ranges for the upstream, midstream, and downstream lakes and reservoirs were 0.1–3.4, 0.7–1.9, and 0.5–1.7 mg/L, respectively (Figure 2a). The peak TN concentrations were observed in Dongfeng Reservoir (3.4 mg/L), Baihua Lake (1.9 mg/L), and Chaohu Lake (1.7 mg/L). According to Table 4, in the upstream lakes and reservoirs, 20.0% achieved water quality standards of Class I and II, 60.0% achieved standards of Class III and IV, and 20.0% were within Class V water quality. In midstream lakes and reservoirs, the TN concentrations were mainly concentrated in the Class III and IV water quality, accounting for 46.2% and 38.5% respectively, and some lakes were found to be in Class V. Downstream lakes and reservoirs TN concentrations were mainly concentrated in the Class II and III water quality standards, with the percentages of 30.0% and 60.0%, respectively. As shown in Figure 2a, the TN concentration in upstream lakes and reservoirs varied significantly, ranging from a minimum of 0.7 mg/L in Lugu Lake to a maximum of 3.4 mg/L in Dongfeng Reservoir. Notably, 60.0% of the lakes had TN concentrations higher than Class III standards for surface water, which indicates that upstream lakes and reservoirs of the Yangtze River Basin are experiencing considerable nitrogen pollution and this may be closely associated with the higher nitrogen discharge standards of upstream industrial wastewater compared to the surface water standard as well as the extensive application of agricultural fertilizers[23]. The midstream lakes and reservoirs are in a densely populated area with well-developed industrial and agricultural activities; considerable amounts of nitrogen are discharged into the lakes through agricultural runoff, domestic sewage, and industrial wastewater[10], leading to an average TN concentration exceeding Class III standards, as shown in Table 5. 38.5% of downstream lakes and reservoirs exceeded Class III water quality standards and the proportion of lakes exceeding TN concentration decreased. However, although human activities are more intensive in the downstream lakes and reservoirs of the Yangtze River, the higher water mobility has caused some nitrogen and phosphorus to be diluted or removed[24], thus leading to TN concentrations slightly lower than in the midstream lakes (Table 5).
The total phosphorus (TP) concentration of lakes and reservoirs in the Yangtze River Basin showed significant spatial variation (P<0.05). The TP concentrations varied from 0.0 to 0.1 mg/L within the basin. Specifically, the TP concentration ranges in upstream, midstream, and downstream lakes and reservoirs were 0.0–0.1, 0.0–0.1, and 0.0–0.1 mg/L, respectively (Figure 2b). The peak TP concentrations were observed at Dianchi Lake (0.1 mg/L), Gehu Lake (0.1 mg/L), and Fushui Reservoir (0.1 mg/L). According to the Environmental Quality Standards for Surface Water (Table 4), among upstream lakes and reservoirs, 50.0% met the Class I water quality standard, 40.0% were in Class II, and 10.0% in Class III. All of the lakes and reservoirs in the midstream region exceeded the Class II water quality standard. Of them, 38.4% met the Class III, 38.5% in Class IV, and 23.1% were below Class V standards. Among the downstream lakes and reservoirs, 30.0% were in Class II, 60.0% were in Class III, and 10.0% were below Class V standards. The midstream and downstream regions had the highest TP concentrations. Most lakes and reservoirs there exceeded Class II standards. The downstream lakes had TP content slightly higher than those in the midstream area. This demonstrates that the middle and lower reaches of the Yangtze River Basin, where economic development is advanced, experience greater human activity and higher input of anthropogenic phosphorus. The TP concentrations in upstream lakes and reservoirs were the lowest, which is related to lower human disturbance in these regions. In the midstream lake regions, high levels of anthropogenic activity resulted in greater emissions of nutrients, such as phosphorus, thus TP concentrations were higher there.
The TN/TP ratio is an important indicator for determining the nutrient limitation status of lakes and reservoirs. When TN/TP > 23, the lake is under phosphorus limitation; when TN/TP < 10, the lake is under nitrogen limitation; when ≤10 TN/TP ≤ 23, the lake is under a state of co-limitation of nitrogen and phosphorus [24]. The TN/TP ratio of lakes and reservoirs in the Yangtze River Basin also exhibits a significant spatial heterogeneity (P < 0.05). In the basin, the TN/TP range in upstream, midstream, and downstream of lakes and reservoirs were 16.1-216.3, 8.8-139.6, and 8.2-109.0, respectively (Figure 2c). The peaks of TN/TP in each lake were at Dongfeng Reservoir (216.3), Zhanghe Reservoir (139.6), and Taihu Lake (109.0), respectively. Based on the variations in TN/TP ratio, 90.0% of lakes and reservoirs in the upper reaches, 84.6% in the middle reaches, and 90.0% in the lower reaches were under phosphorus-limited conditions. The ratios showed N and P combined limitations for 10.0% of lakes and reservoirs in the upstream reaches, 7.7% in the midstream, and 10.0% of the downstream lakes where only a very few number of waterbodies from the mid-section or 7.7% is attributed to N limitations. Therefore, lakes and reservoirs in the Yangtze River Basin as a whole are under phosphorus limitation, suggesting the management of lake phosphorus is important to effectively manage the eutrophication within this large area. Lakes in the upstream section of the river had shown TN/TP fluctuations which may be an indication that this is likely influenced by lesser intensity human activity; these locations were then characterized as having the ratio’s response attributed to natural characteristics and geological backgrounds of such a basin system. Lakes and reservoir systems downstream have an average value of TN/TP that was relatively uniform when compared to systems at midstream and was greatly affected by direct influence from anthropogenic activities including sewage and industrial effluent releases, the heavy use of chemical fertilizers and pesticide application [25].
The TLI of the lakes and reservoirs in the Yangtze River Basin also exhibited significant spatial heterogeneity (P<0.05). The TLI index is a comprehensive evaluation indicator for the eutrophication of lakes and reservoirs. The higher the TLI value, the worse the nutrient status is considered. Based on the TLI value, lakes and reservoirs are characterized to be at the oligotrophic stage ( TLI< 30), mesotrophic ( 30≤TLI ≤ 50 ), and eutrophic(TLI> 50) Furthermore, the condition is sub-classified as slight eutrophication (50<TLI≤60), moderate eutrophication(60<TLI≤70), and heavy eutrophication (TLI> 70). The ranges in the TLI values for the different reservoirs for all reaches were determined as between 14.1 to 65.4 where the values range of upper, middle, and lower basin areas were between 14.1 to 65.4, 25.2 to 59.4, and 28.6 to 62.6 (Figure 2d), respectively. The TLI peaks for each lake occurred at Dianchi (65.4), Ge Lake (59.4), and Fushui Reservoir (62.6). In the upstream area of the study sites, 10% were oligotrophic, while 90% were in mesotrophic status and hence it's considered as overall having good water quality. At mid-stream sections, it is observed that there were 15.4% at oligotrophic level, 53.8% at mesotrophic, 15.4% with mild levels of eutrophic status, 15.4% under moderate levels, as being indicative of various kinds of nutritional status and heterogeneity. While the downstream reach had 5.9% at the oligotrophic stage, 29.4% at the mesotrophic, 52.9% were at low eutrophication, 5.9% for moderately eutrophic, and 5.9% were at high levels of eutrophication. As there were high degrees of anthropogenic and industrial activity levels in midstream as well as downstream sections the amount of nutrient salt such as phosphorus, that discharged into the bodies was very high[25,26] consequently the levels of TLI high leading to the overall eutrophic status.
The trophic status of lakes and reservoirs in the Yangtze River Basin exhibits clear spatial heterogeneity. From a geographical perspective, in the upstream regions where higher elevation results in swift water flows with low intensity and densities for both industries as well as in terms of anthropogenic actions from human habitation. This in turn the systems benefit by having overall better water quality from high dilution effects and effective transfer from source zones albeit higher industrial activities and chemical applications from fertilizer input can indirectly influence the bodies of water [27,28]. The situation in midstream areas of the basins which had several constructed reservoirs[29] disrupted original systems and hydrology through a decrease of water exchange from original regions and zones resulting in nutrient build-ups or accumulations from its catchment; the impact from high-intensity anthropogenic pressure and industrial and agriculture [30,31]with heavy water withdrawals for the application at large areas, were responsible for inputs of the huge amount of contaminated water via industrial effluents, agricultural run-offs in additions to the impact caused by the discharge of effluent from the urban sprawls from municipal discharges. These all led to increased degrees of stress or levels of eutrophication across many water bodies in the midstream section. The geographical set up of lower regions which are known by low elevations, the region is also crisscrossed by numerous rivers resulting in a less forceful flow regime in addition to having more shallow gradients, as these lakes and water bodies had a lower ability to reduce nutrient concentrations through diffusion effect where farming activities using water as the means for their livelihood contributes to enhanced and greater nutrients loadings from those regions; very high concentration and very dense population concentrations which drive economic developments in such down streams leads to heavy discharges of municipal as well as from the industries to such basins, all this directly has a direct negative impact to this important ecosystem leading to high degrees of impact especially the urban sprawl’s impact on a nutrient level due to sewage and other diffuse urban based waste[31] release into water sources
3.1.2. Temporal Analysis of Nutrient Status in Representative Lakes and Reservoirs
In terms of temporal changes, representative lakes of the Yangtze River Basin, including Poyang Lake, Taihu Lake, and Dongting Lake, were selected, and the trends in TN, TP, TLI, and TN/TP were analyzed for a total of 11 years from 2011 to 2021 (Figure 8). The TN concentrations of all three lakes showed an overall decreasing trend (Figure 8a). The TN concentration in Poyang Lake decreased rapidly from 2011 to 2013, with subsequent fluctuations and a slight rebound in 2021. The TN concentration in Taihu Lake showed a continuously decreasing trend, from 2.256 mg/L in 2011 to 1.176 mg/L in 2021. The TN concentration in Dongting Lake fluctuated significantly, reaching a peak of 2.055 mg/L in 2013, then gradually decreasing before a rebound in 2019. The TP concentrations in all three lakes also showed a fluctuating decreasing trend (Figure 8b). TP concentrations in both Poyang Lake and Taihu Lake reached their peak levels around 2017-2018 before declining. The TP concentration in Dongting Lake decreased around 2016 but experienced relatively minor fluctuations, remaining within the range of 0.059-0.087 mg/L. The TLI value for Taihu Lake was slightly higher than the other two lakes from 2011 to 2021. Although the TN and TP concentrations showed a decreasing trend, eutrophication problems still exist in these three lakes. The TN/TP ratios of Poyang Lake, Dongting Lake, and Taihu Lake all exhibited relatively significant fluctuations (Figure 8d). The TN/TP ratio of Taihu Lake showed a downward trend, with a notable decline after 2012. Despite the overall decrease in TN and TP concentrations, the larger decrease in TP concentration led to a reduction in the TN/TP ratio. Throughout the decade of 2011-2021, both TN and TP concentrations showed downward trends. When lake TN/TP is <9, it is classified as a nitrogen-limited state; if 9 ≤ TN/TP < 22.6, the state is jointly limited by nitrogen and phosphorus, while if TN/TP ≥ 22.6, the state is phosphorus-limited. Algal growth shows an obvious increase with an increased concentration of nitrogen, which may result in cyanobacterial blooms[12,32].
3.2. Analysis of Habitat Condition Disparities among Typical Lakes and Reservoirs
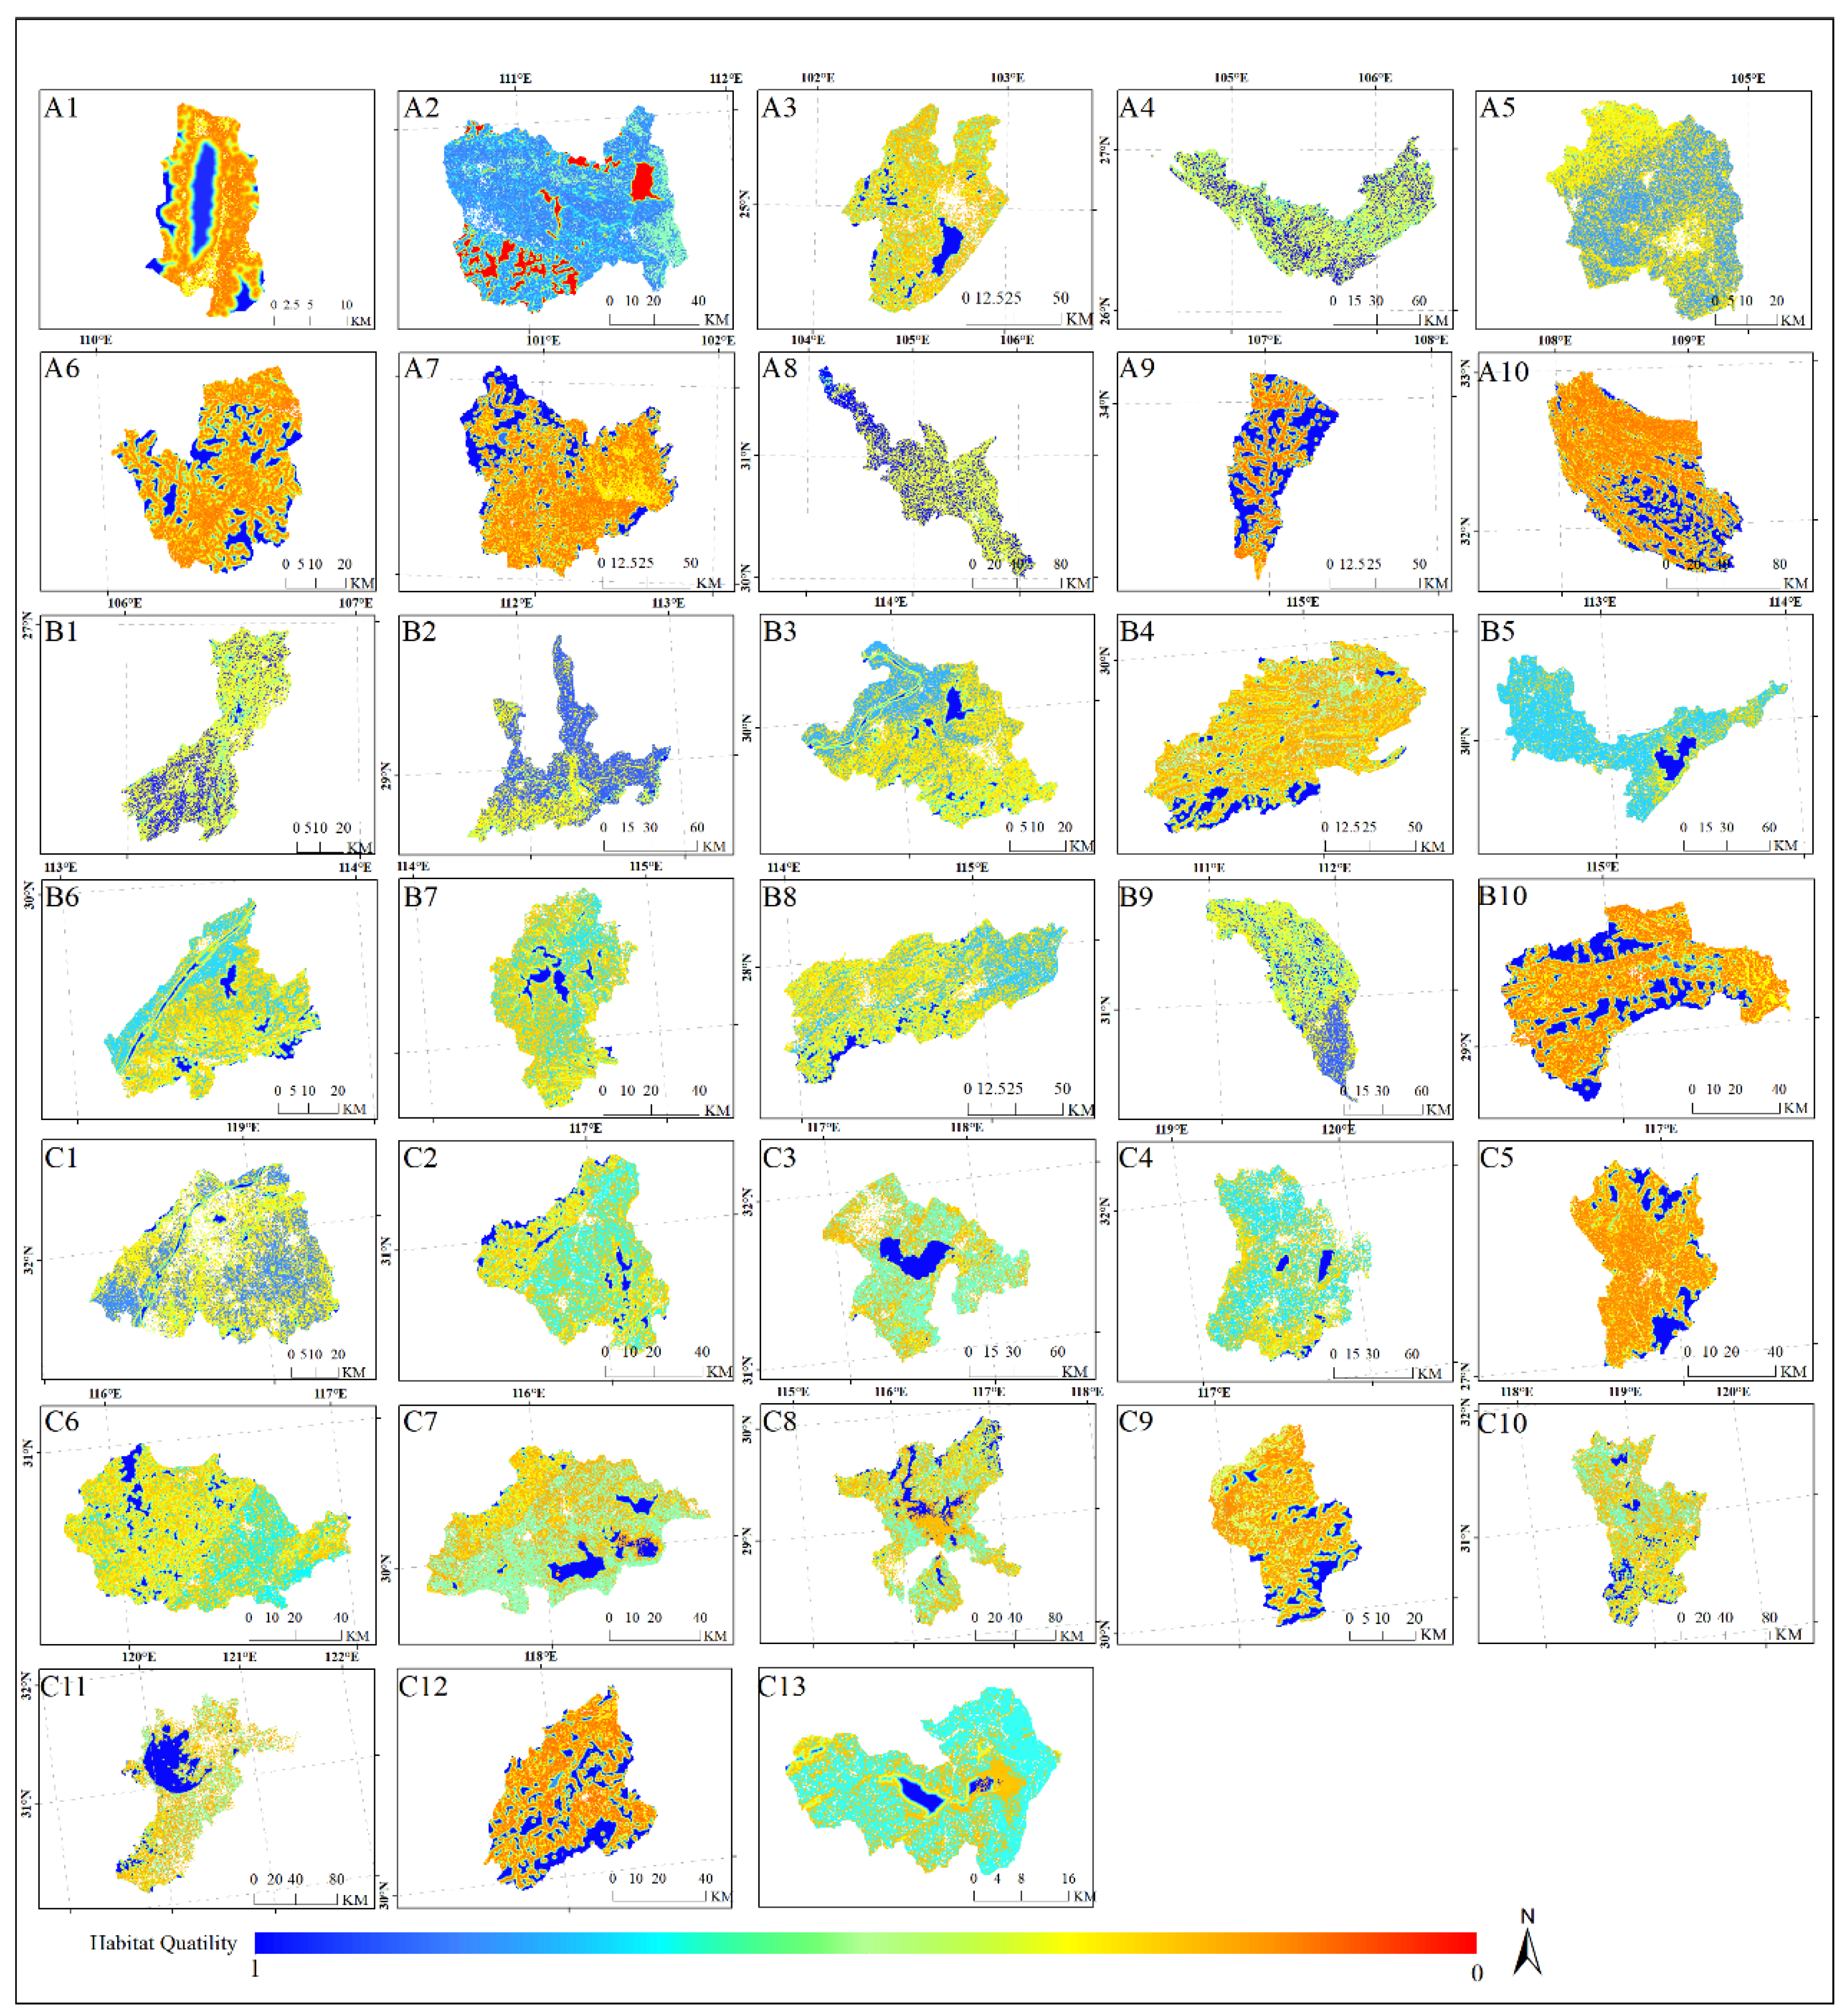
The HQ of upstream lakes and reservoirs exhibited a polarized distribution (as shown in Figure 3). Specifically, some lakes had good HQ with values ranging from 0.3 to 0.5, such as Shimen Reservoir (Figure 3A9, HQ=0.5), Lugu Lake (Figure 3A7, HQ=0.3), and Yinghu Lake (Figure 3A10, HQ=0.3), while other lakes had HQ<0.25, including Dongfeng Reservoir (Figure 3A4, HQ=0.1), Dianchi Lake (Figure 3A3, HQ=0.2), and Luban Reservoir (Figure 3A8, HQ=0.2), which faced relatively higher environmental pressures. Shimen Reservoir, with a high HQ value, had a water quality category of Class II, and its HQ value was the highest. This is likely associated with its low urbanization level (Urb = 0%) and low agricultural activity intensity (Crop = 3%, Irri = 2%). The Huanglongtan Reservoir (Figure 3A6, HQ=0.3) also had relatively high HQ values, and this is likely related to its low urbanization level and agricultural activity intensity (Urb=2%, Crop=16%, Irri=5%). Dianchi Lake (Figure 3A3, HQ = 0.2), with its relatively low HQ, is located in a shallow area near the city. The water quality category was IV, The Dianchi Lake basin is subject to intense agricultural activity and urban development with obvious impacts (Urb=29%, Crop=34%, Irri=31%). Studies show that fertilizers, pesticides, and other pollutants generated by agricultural activities hurt the water quality of lakes and reservoirs[33], and urbanization leads to a large discharge of domestic and industrial wastewater into the lakes, thus causing water pollution[34].
The HQ values of midstream lakes and reservoirs were generally poor with some lakes having very low HQ values. The HQ value of Zhalin Lake (Figure 3B10, HQ = 0.3), was relatively higher, with water quality of Class II, and had the highest HQ value among lakes. This may be associated with its higher forest coverage rate (23%) and low agricultural intensity (Crop=7%, Irri = 6%). Forests can effectively intercept and absorb pollutants, reducing the pollutant loads into the lakes[35]. Although the HQ value of Honghu Lake (Figure 3B5, HQ=0.2) was not high, it was second highest in the midstream lakes and reservoirs, which may be associated with its higher forest coverage (38%). Although Baihua Lake (Figure 3B1, HQ=0.1) met the III class of water quality standards, its HQ value is relatively lower which may be associated with a relatively high agricultural activity intensity(Crop=70%, Irri=17%)and the level of urbanization (Urb=16%) in this region. Dongting Lake (Figure 3B2, HQ=0.2), which is the second largest freshwater lake in China, experienced a significant deterioration in lake contamination and eutrophication issues and its HQ values were reduced by the influences of agricultural activities (Crop=25%, Irri=7%) and the urbanization level(Urb=6%, Crop=12%, Irri=5%)[35].
The HQ of the downstream lakes and reservoirs showed similar distributions and patterns. The HQ values of Taiping Lake (Figure 3C12, HQ=0.4) and Taihu Lake (Figure 3C11, HQ=0.2) with relatively higher HQ in the downstream lakes were possibly associated with the implemented water pollution treatment measures within these basins[35,36,37]. Beishan Reservoir (Figure 3C1, HQ=0.1) has a poor HQ value and is at Class III of water quality. This may be attributed to its relatively high intensity of agriculture(Crop=62%, Irri=27%). The low value of the habitat quality of Caizi Lake (Figure 3C2, HQ=0.2) might be also correlated with the relatively high intensity of urbanization level (Urb = 16%) and low forest cover (Forest = 10%) of the area.
Figure 4.
Status of habitat quality for the typical lakes and reservoirs in the upper, middle, and lower reaches of the Yangtze River Basin. Note: A, B, and C represent the upper, middle, and lower reaches of the Yangtze River Basin, respectively; the HQ range of the lakes and reservoirs within the Yangtze River Basin was 0.125–0.468, with the HQ ranges of 0.125–0.468, 0.138–0.320, and 0.135–0.360 for upstream, midstream, and downstream lakes and reservoirs, respectively. Peak HQ values were observed in Shimen Reservoir (Figure A9, 0.468), Zhalin Lake (Figure B10, 0.320), and Taiping Lake (Figure C12, 0.360). Chenghai Lake (Figure A1), Danjiangkou Reservoir (Figure A2), Dianchi Lake (Figure A3), Dongfeng Reservoir (Figure A4), Hongmen Reservoir (Figure A5), Huangge Lake (Figure A6), Liangzi Lake (Figure A7), Lugu Lake (Figure A8), Shijiu Lake (Figure A9), Yinghu Lake (Figure A10); Baihua Lake (Figure B1), Dongting Lake (Figure B2), Fulu Lake (Figure B3), Fushui Reservoir (Figure B4), Hong Lake (Figure B5), Huangge Lake (Figure B6), Liangzi Lake (Figure B7), Xiannv Lake (Figure B8), Zhanghe Reservoir (Figure B9), Zhalin Lake (Figure B10); Beishan Reservoir (Figure C1), Caizi Lake (Figure C2), Chaohu Lake (Figure C3), Ge Lake (Figure C4), Hongmen Reservoir (Figure C5), Huating Lake (Figure C6), Bohu Lake (Figure C7), Poyang Lake (Figure C8), Shengjin Lake (Figure C9), Shijiu Lake (Figure C10), Taihu Lake (Figure C11), Taiping Lake (Figure C12), Wuchang Lake (Figure C13).
3.3. Quantitative Assessment of Contributions from Natural and Anthropogenic Factors
3.3.1. Unveiling the Drivers of Variability in TN and TP Concentrations
The RDA model explained 62.3% of the variance in TN and TP, with the first axis explaining 36.8% of the variance and the second axis explaining an additional 25.5% (Figure 4). According to the canonical coefficient analysis, the first RDA axis primarily influenced TP concentrations and is closely correlated with several human impact factors such as NDEP (0.126), HQ (1.181), and AET (1.357). The second RDA axis mainly influences TN concentration and is closely correlated with AET (0.963), and HQ (0.805).
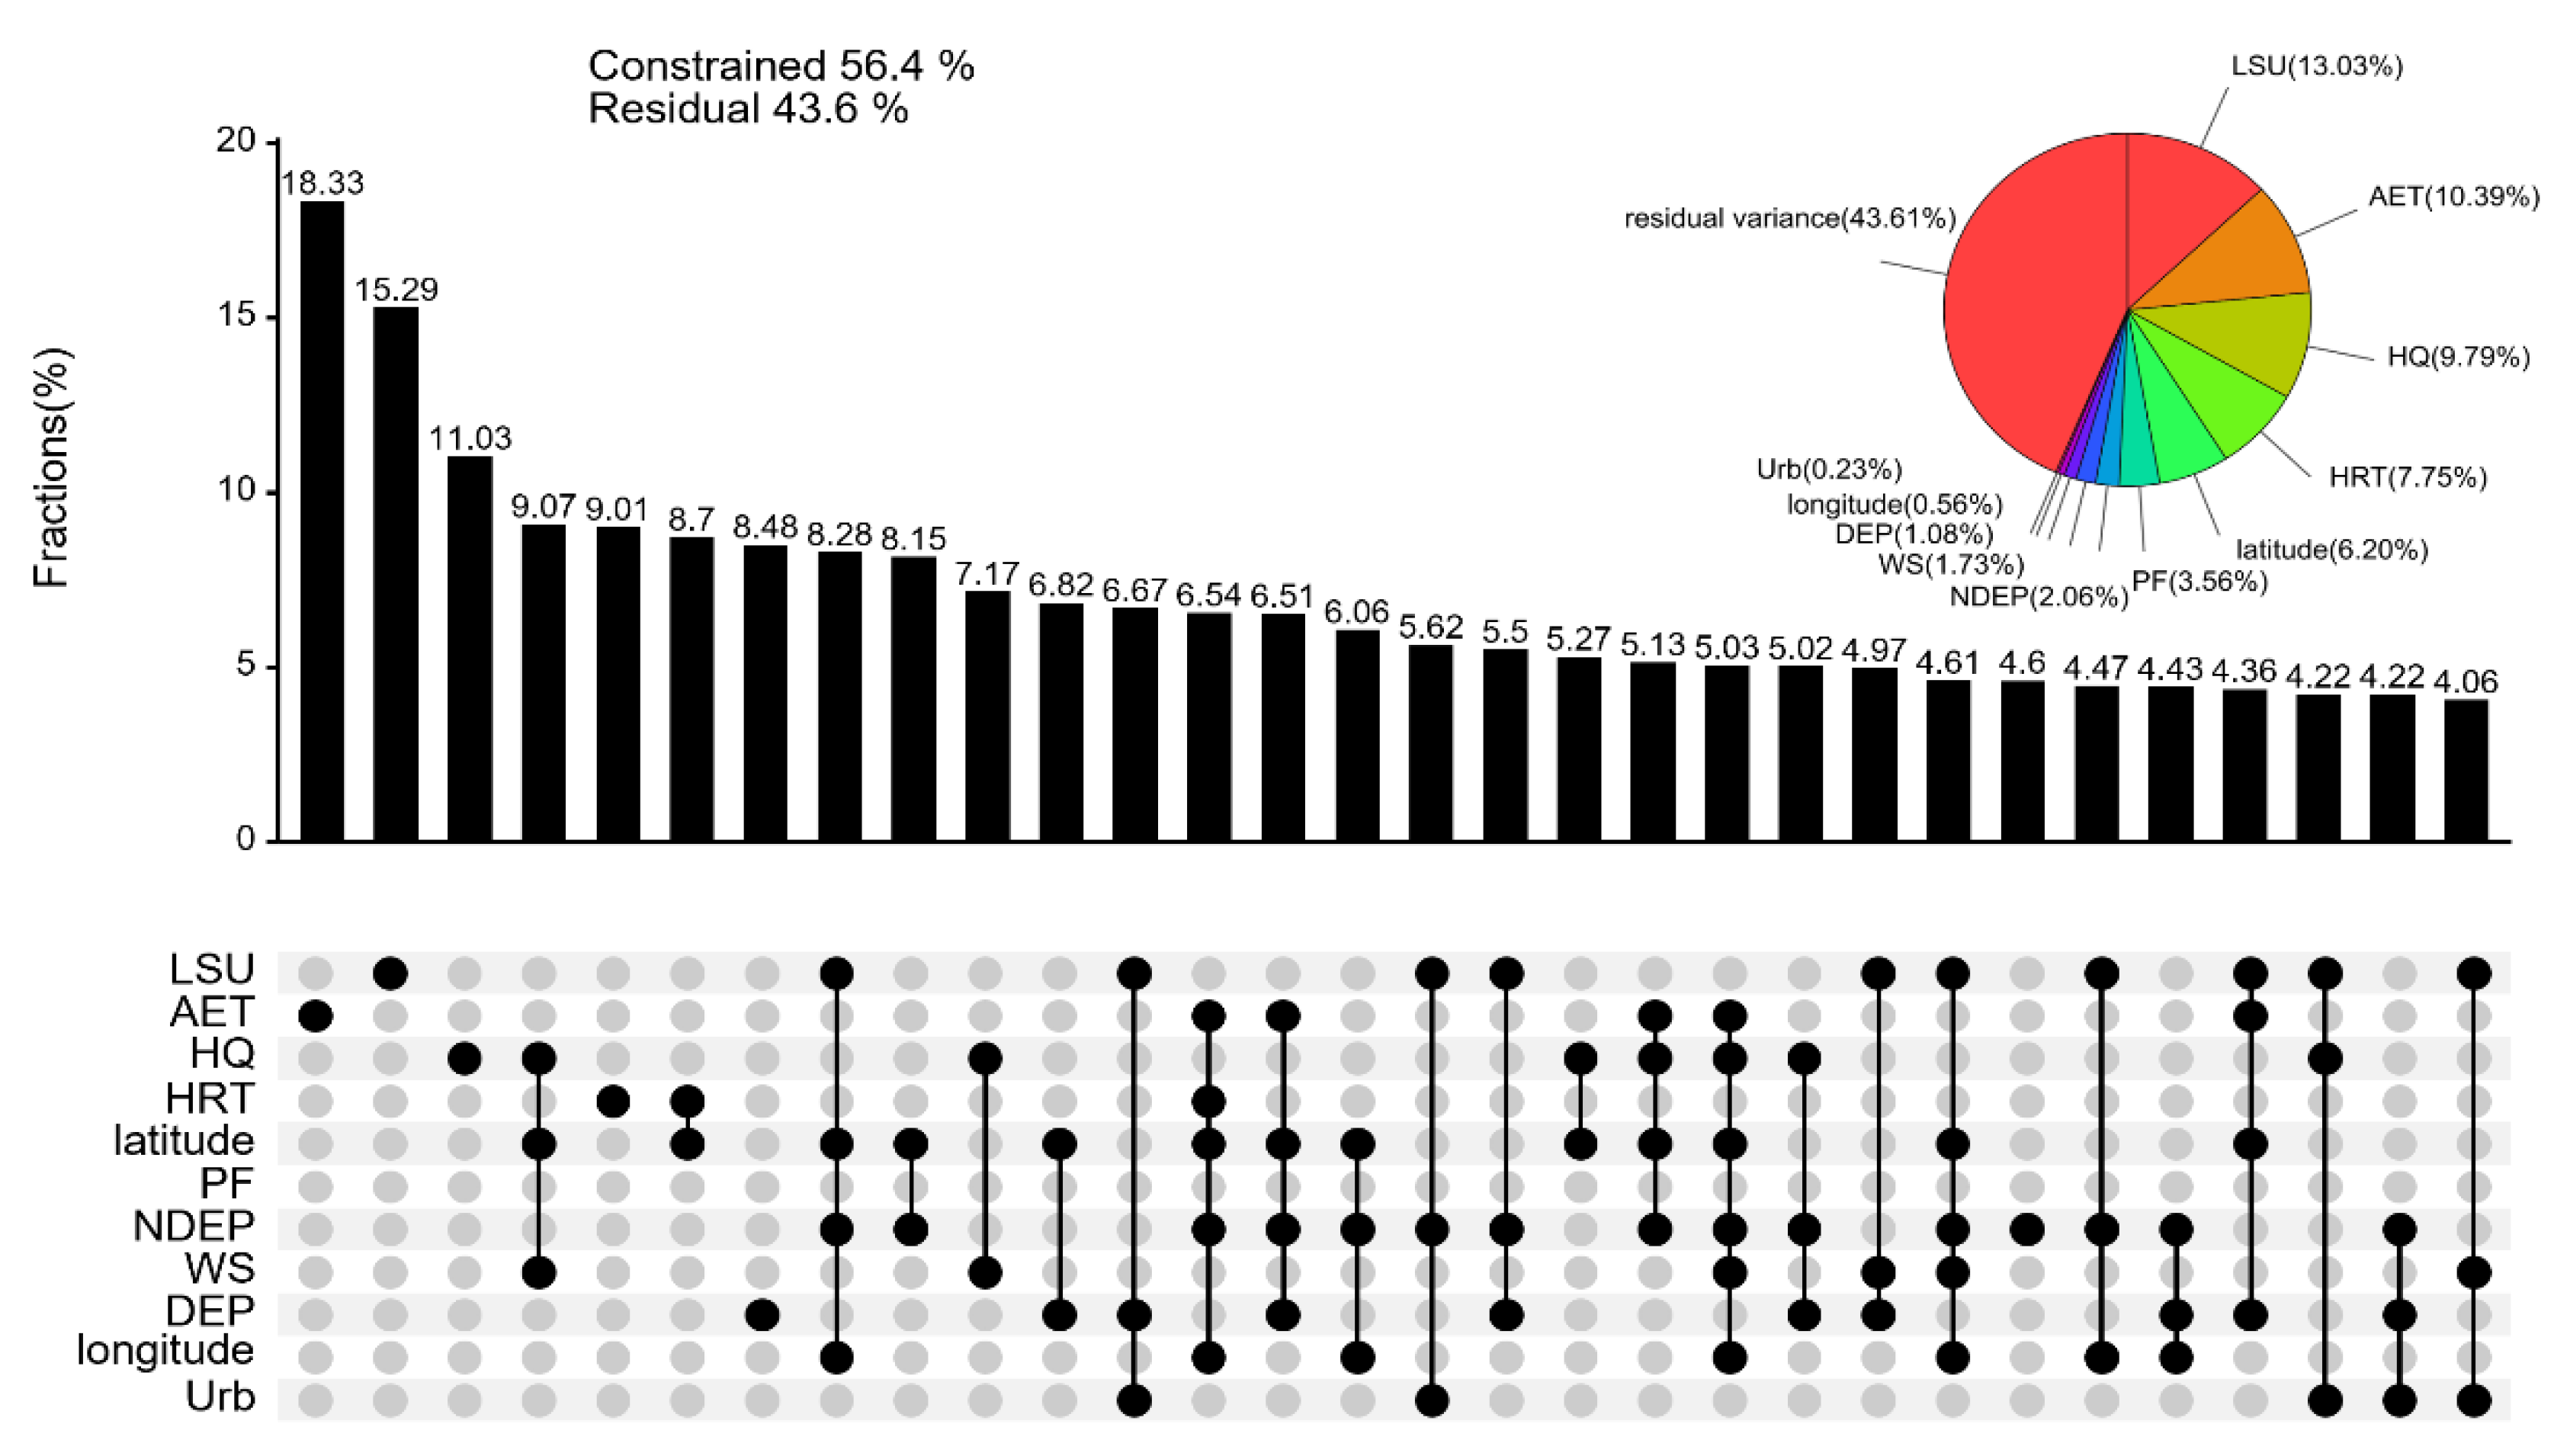
The results of the variance partitioning (Figure 5) indicated that LSU, AET, HQ, HRT, and Latitude were the major driving factors explaining the variance of 13.0%, 10.4%, 9.8%, 7.8%, and 6.2% on the nitrogen and phosphorus load changes. PF, NDEP, WS, DEP, Longitude, and Urb showed lower effects with 1.1%, 0.6%, 3.6%, 2.1%, 1.7%, and 0.2 % on changes in nitrogen and phosphorus loads, respectively. The results of the current study were consistent with the study by Yu et al.[38] that found that LSU is a key source of nitrogen and phosphorus in water bodies. When the human activity factors (LSU, HQ, HRT, PF, NDEP, and Urb) were grouped and analyzed, these factors were able to explain 35.01% of the variation in the total nitrogen and phosphorus nutrients in the Yangtze River Basin. In contrast, the natural factors (AET, HRT, Latitude, WS, DEP, and Longitude) explain 19.14%. An Upset plot demonstrates the extent of the independent effects of each factor and interactive effects on the variation in total nitrogen and phosphorus nutrients (Figure 5). The findings reveal that LSU, HQ, and Urb have stronger interactive effects, jointly accounting for 4.2%, and that these three impact factors exert significant primary effects with explanations of the variance in nitrogen and phosphorus of 13.0%, 9.8%, and 0.2%, respectively. The TN concentrations in upstream lakes and reservoirs differed significantly. Some upstream lakes and reservoirs had relatively high TN concentrations, potentially correlated to LSU and PF with a TP concentration that was relatively lower, with data concentrated close to the DEP arrow. The distribution of the midstream lakes and reservoirs was more scattered, showing greater variations in TN and TP concentrations. This suggested that the lakes are likely affected by many environmental factors. Meanwhile, lakes located close to the Urb arrow tend to be influenced by anthropogenic activities more significantly. Downstream lakes and reservoirs were primarily located in the positive direction of the first axis which means higher TP concentrations may be linked with strong human impacts in downstream regions and showed an impact of HQ and HRT[39]. Land use can indirectly influence the nutrient levels in lakes. For instance, Fatemeh et al.[40] found that the increased cultivated area results in a greater output of nitrogen and phosphorus; in contrast, changes in the forest area have the opposite effect in that an increased forest area tends to reduce the amount of nitrogen and phosphorus exported. Extensive continuous patches of farmland can result in more nitrogen and phosphorus, while patches of dispersed forests reduce the transfer of nitrogen and phosphorus into the water bodies.
Figure 5.
RDA analysis of TN and TP content changes. Figure note: Red arrows represent the response variables TN and TP; blue arrows represent anthropogenic factors; green arrows represent natural factors; and blue, orange, and purple dots correspond to upstream, midstream, and downstream lakes and reservoirs, respectively.
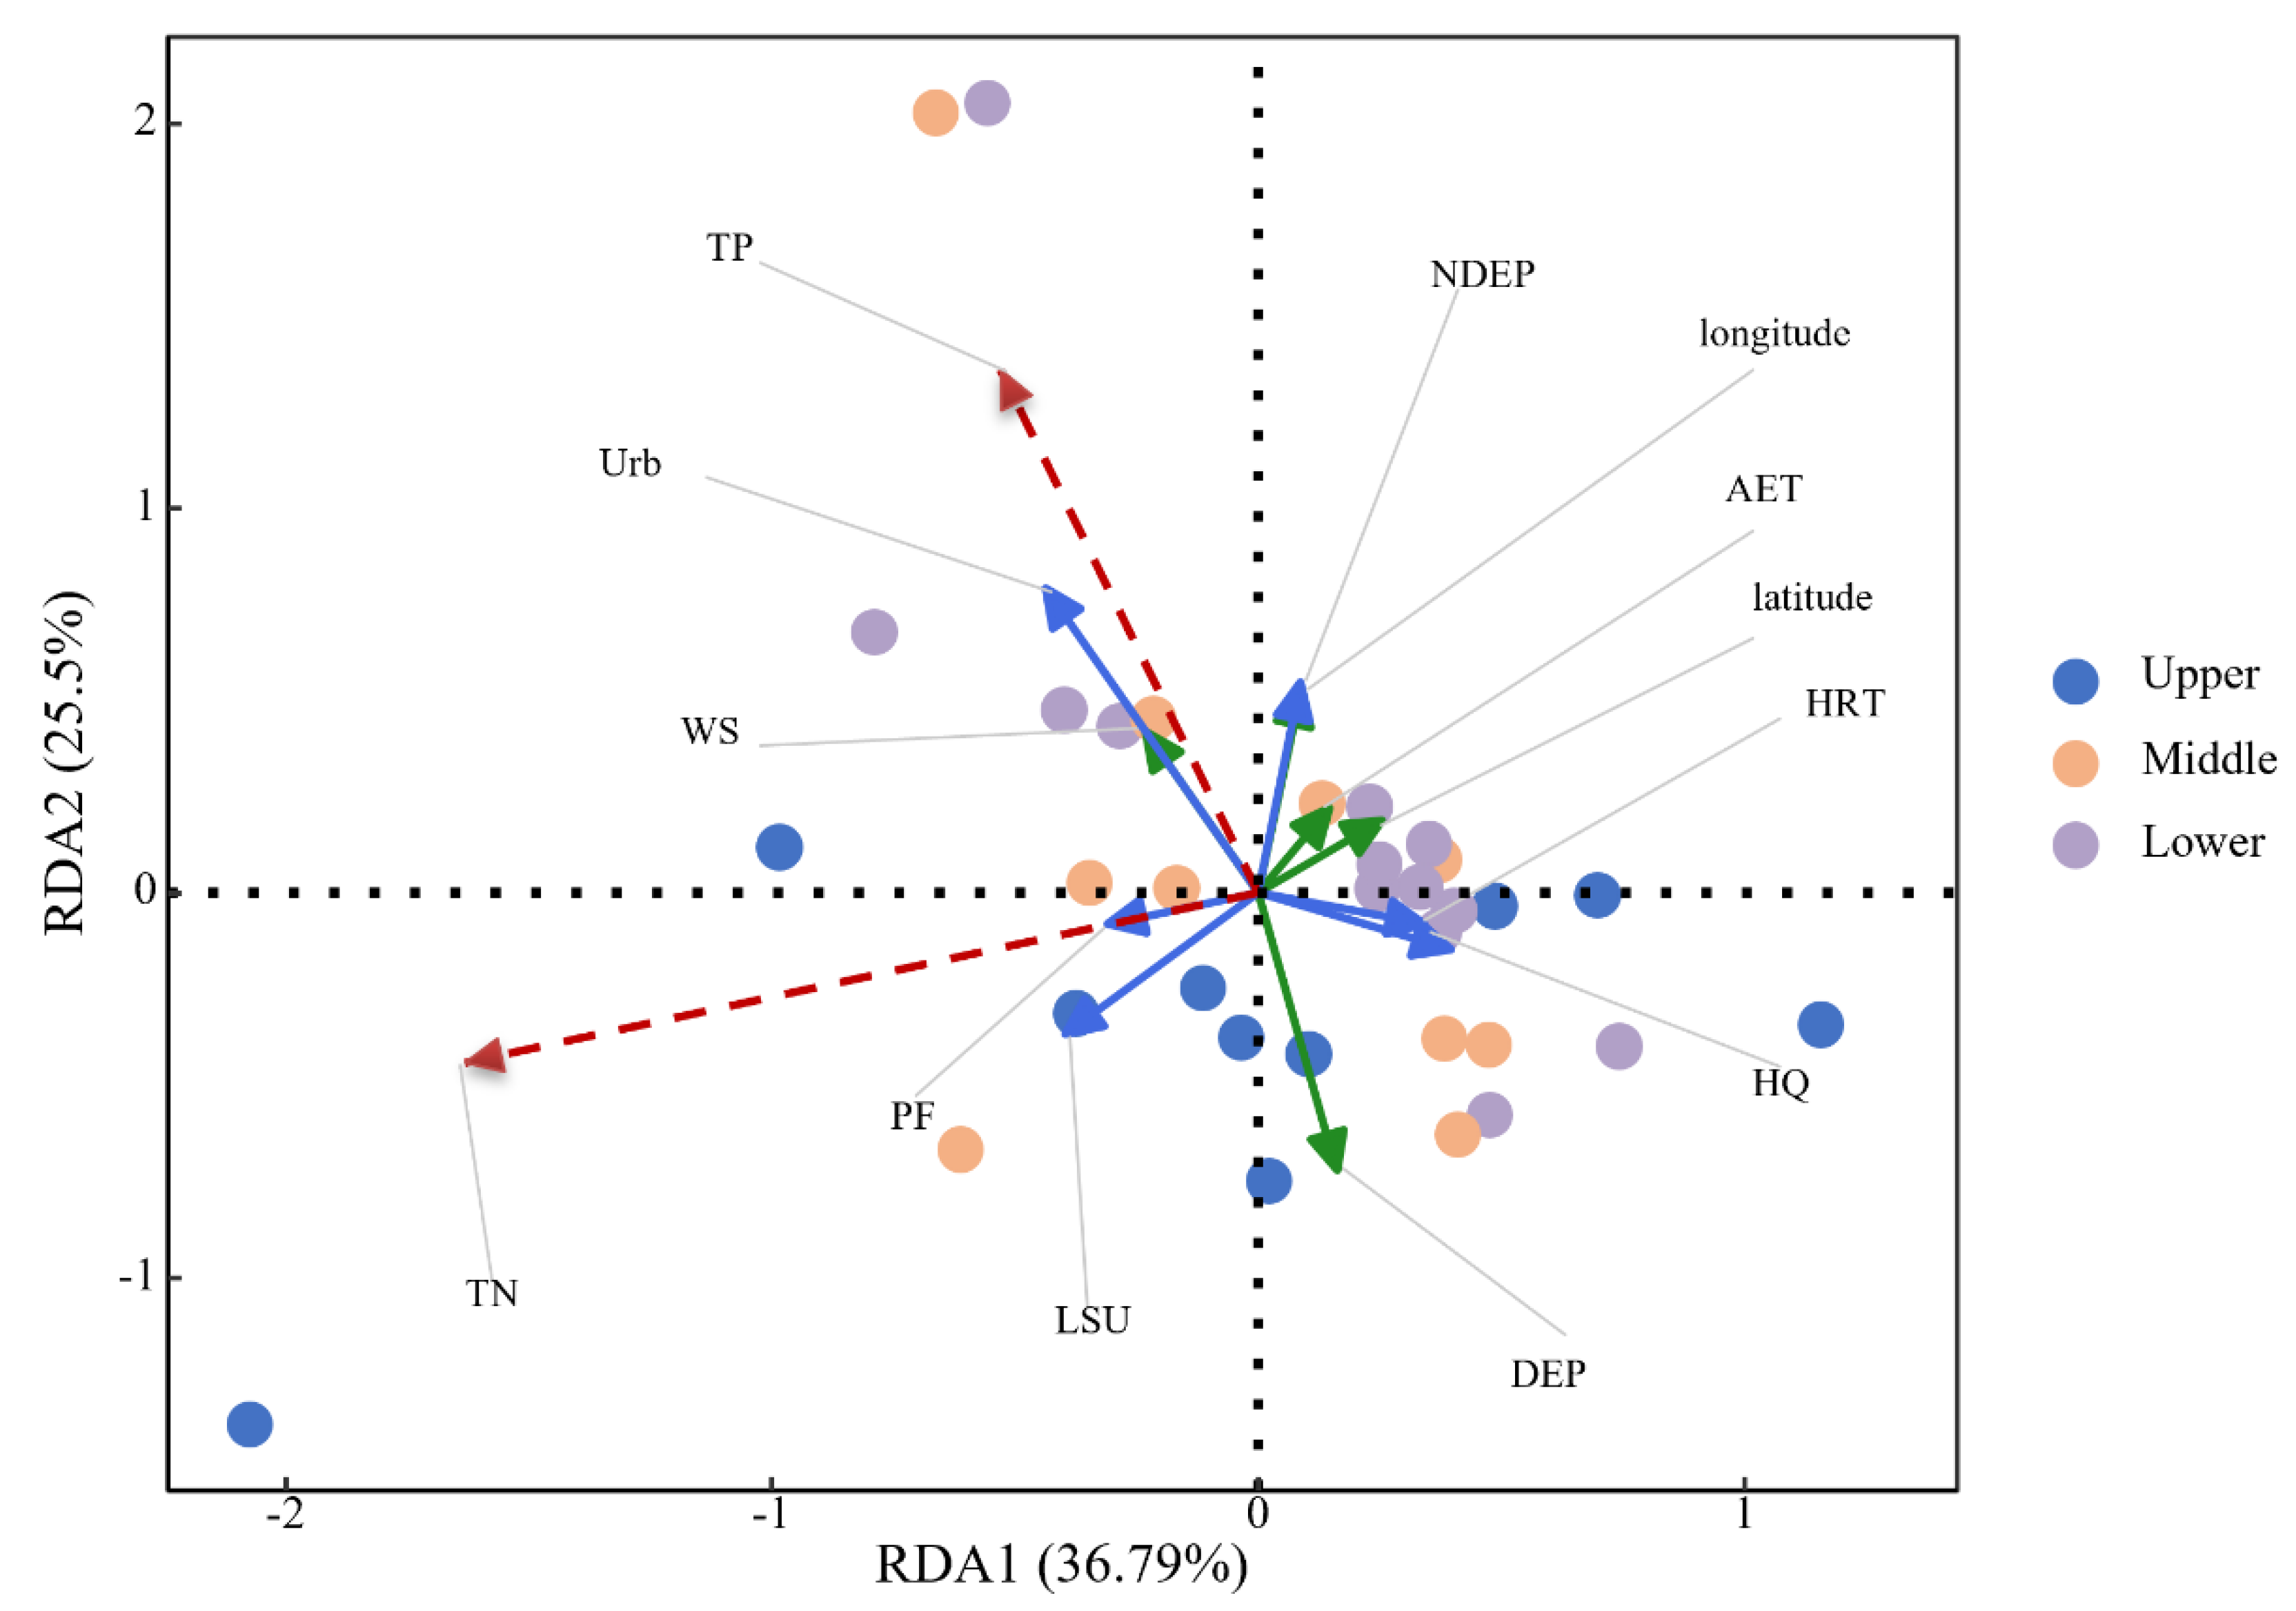
Figure 6.
Analysis of variance among TN, TP and natural factors, human activities.
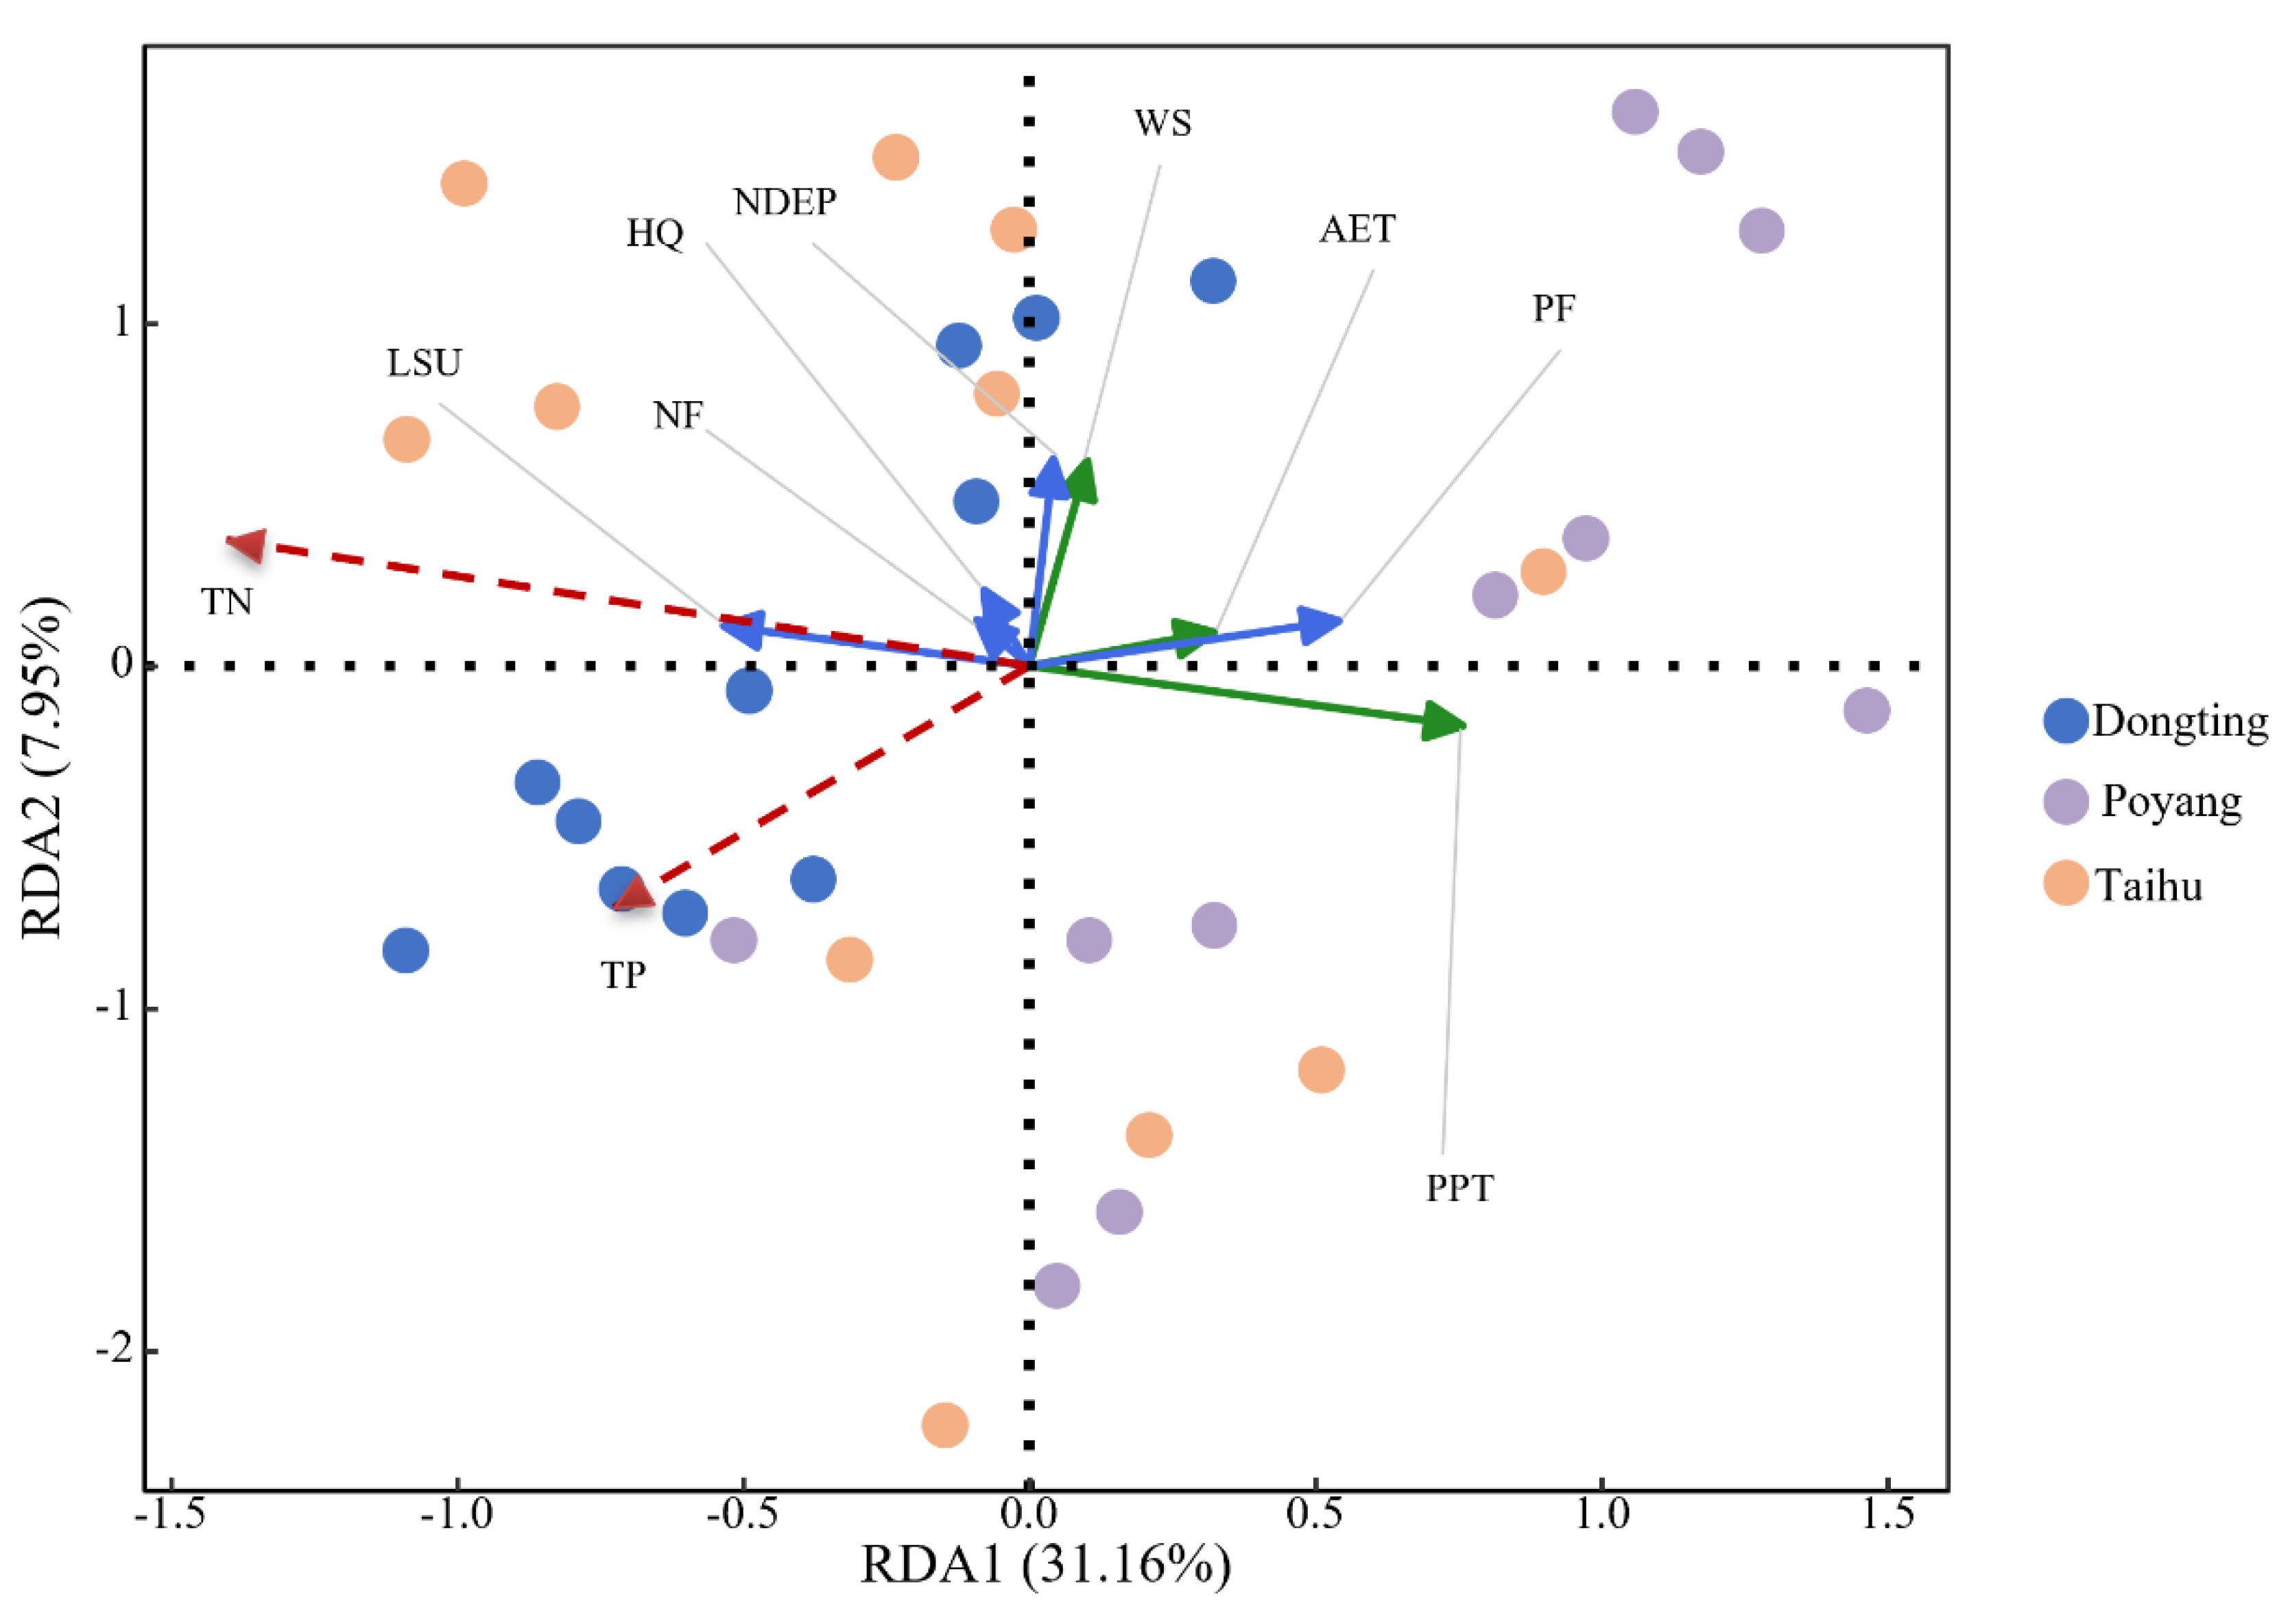
RDA analysis of TN, TP, and the potential environmental drivers in Poyang, Taihu, and Dongting Lakes from 2011 to 2021 revealed that the RDA model explained 39.11% of the variance in TN and TP changes, with the first axis accounting for 31.16% of the variance and the second axis explaining an additional 7.95% (Figure 9). Changes in nitrogen and phosphorus nutrient loads over the past decade were primarily driven by PPT, LSU, PF, NDEP, and AET. The higher the precipitation, the greater the amount of nutrients washed into the lakes and reservoirs. Sinha & Michalak’s study revealed that precipitation was a primary driver for the interannual variation in river nitrogen loading[41]. AET mainly affects lake nutrient concentrations by altering regional hydrological conditions and causing more frequent occurrences of blue-green algal blooms in water[42]. LSU increases nutrient loads into water bodies via animal feed and manure[43,44], PF tends to cause accumulation of phosphorus in soils, where the phosphorus is then evaporated into the atmosphere or leached from soils through groundwater or surface runoff, ultimately significantly affecting its contents in adjacent streams and rivers[45]. Regarding PPT, one of the selected key driving factors, strengthening soil and water conservation, and constructing lakeside buffer zones will help in reducing nutrient discharge caused by storm surges. With regards to AET, the key driving factor identified in the study, actions such as ecological water replenishment and control of water resource consumption need to be taken to mitigate the impact of evapotranspiration. For the identified critical drivers of LSU, manure from animal production should be treated using techniques of controlling animal stocking and promoting utilization of their manure. For identified critical driver PF, we encourage the substitution of organic fertilizer for the use of phosphorus fertilizers to limit the loss or excessive usage of these materials in the region.
Figure 7.
RDA analysis of interannual variations of TN and TP.
3.3.2. Unveiling the Driving Forces of Variability in TN/TP and TLI
The RDA model explained 62.3% of the variation in nutrient composition. Among these variations, 44.4% and 17.9% were explained by the first and second axes, respectively. The first axis was primarily associated with key factors related to the intensity of human activities, such as AET, HQ, and land use. The second axis was primarily related to key natural factors represented by lake depth (DEP) and AET (Figure 6).
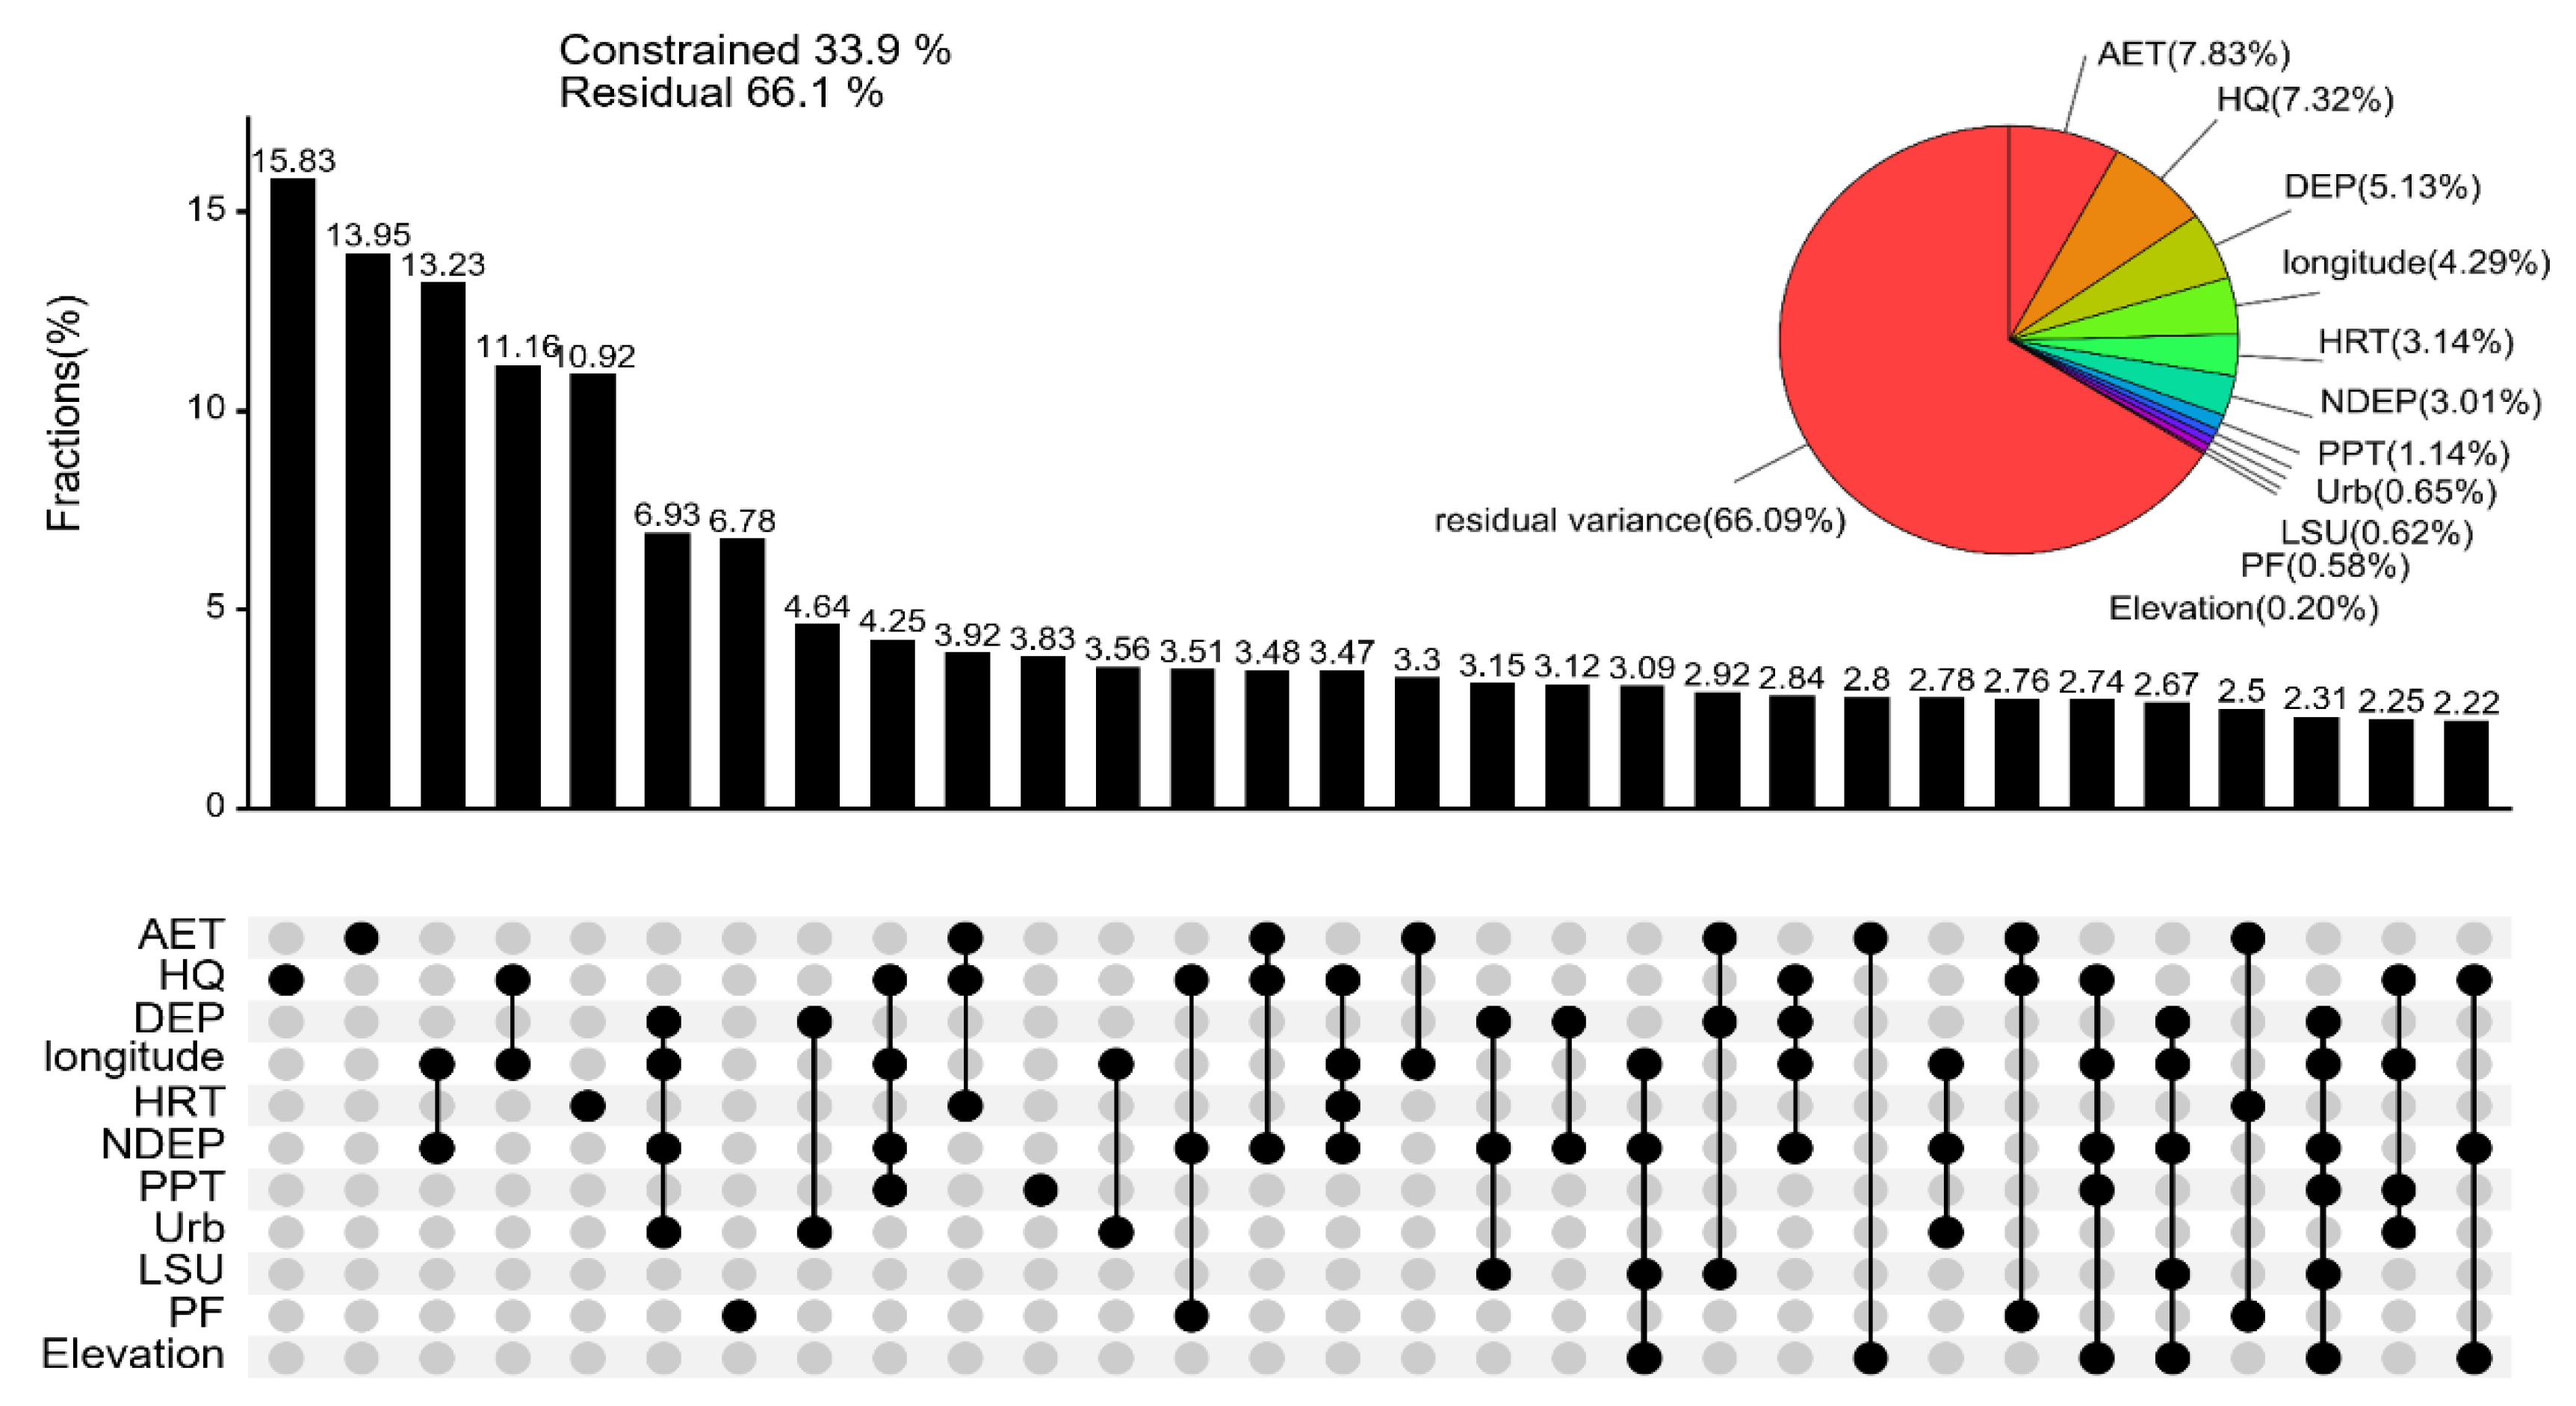
By applying the variance decomposition for further analyzing the impact extent of different factors. Results of variance partitioning analysis (Figure 7) show that AET, HQ, DEP, and Longitude are the main driving factors and explain variance for TN/TP and TLI as 7.8%, 7.3%, 5.1%, and 4.3%, respectively. HRT, NDEP, PPT, Urb, LSU, PF, and Elevation had lower explanations for both parameters, with percentages of 3.1%, 3.0%, 1.1%, 0.7%, 0.6%, 0.6%, and 0.2%, respectively. This study also found a significant negative correlation between DEP and both TLI and TN/TP in the studied lakes and reservoirs, consistent with the findings of Qin et al.[29]. The study found DEP is an important determinant of the nitrogen and phosphorus interplay where relatively deep lakes can facilitate the deposition of phosphorus reducing its concentrations, and contributing to alleviating eutrophication in those regions[10]. Grouping the factors into the human activity and natural impact factor categories indicates that human factors (HQ, HRT, NDEP, Urb, LSU, and PF) explained 15.5% of the variability in TN/TP and TLI in the Yangtze River Basin, whereas the natural factors (AET, DEP, Longitude, PPT, and Elevation) explained 19.8%. Upset plots were generated for each influential factor and interactive effects and contribution for TN/TP and TLI(Figure 7). Results show a strong interaction of AET, HQ, and HRT with a joint explanation of 3.9%. In addition, the primary contributions to explaining the change in both TLI and TN/TP are mainly AET, HQ, and HRT with proportions of 7.8%, 7.3%, and 3.1%, respectively (Figure 7). Figure 6 shows that the upstream lakes and reservoirs were mainly distributed along the negative direction of the first axis, indicating relatively lower TN/TP and TLI, thereby indicating that the overall trophic state was better compared to lakes downstream of the Yangtze River basin.
Figure 8.
RDA analysis of TN/TP and TLI changes. Figure note: Red arrows indicate the response variables TLI and TN/TP; blue arrows indicate anthropogenic factors; green arrows indicate natural factors; and blue, orange, and purple dots represent upstream, midstream, and downstream lakes and reservoirs respectively.
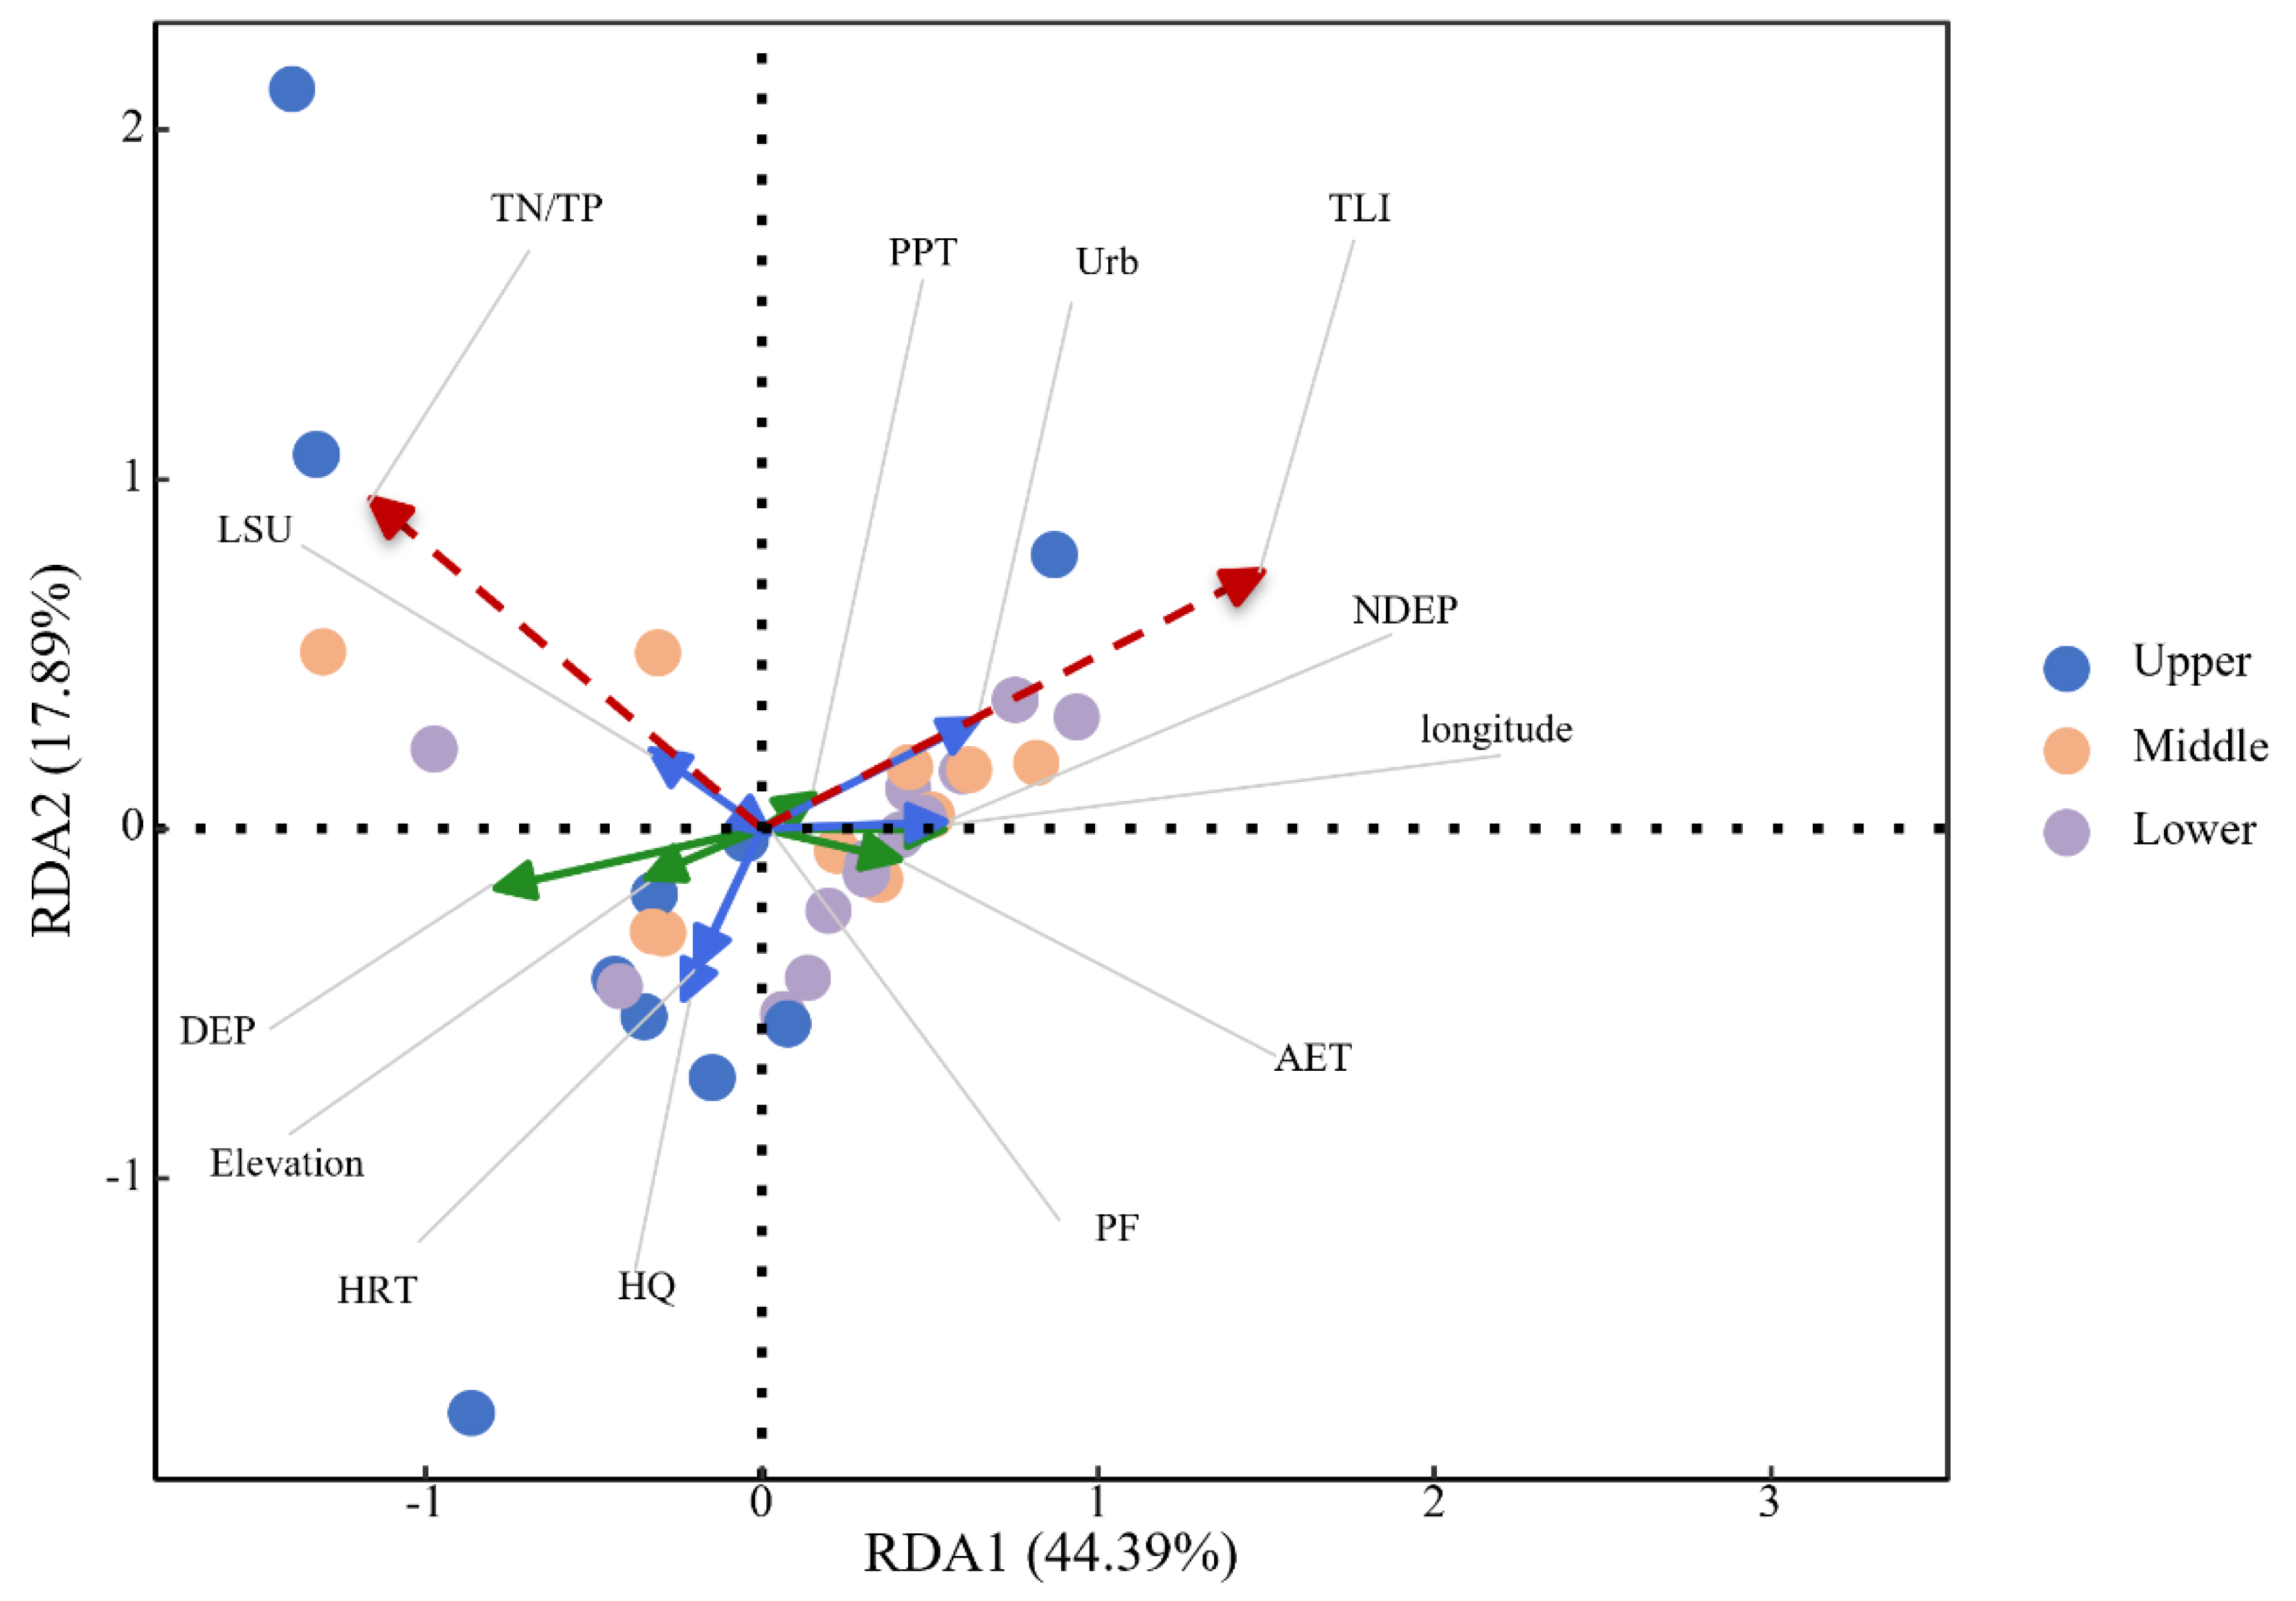
Figure 9.
ANOVA of TN/TP, TLI, natural factors, and human activities.
RDA analysis of TLI, TN/TP, and their potential environmental driving factors in Poyang, Taihu, and Dongting Lakes from 2011 to 2021 revealed that the RDA model could explain 64.98% of the variance in TLI and TN/TP, with the first axis explaining 50.25% and the second axis explaining the remaining 14.73% (Figure 10). Combined with changes in TLI and TN/TP over the past decade, these are mainly driven by HQ, LSU, PPT, PF, and NF. Changes in vegetation cover, and types of land use[46,47] have a considerable influence on the export and cycle of nitrogen and phosphorus. The decrease of HQ has led to eutrophication as greater quantities of nutrients were flushed to the water bodies, therefore altering TN/TP. Nitrogen and phosphorus in livestock manure[48,49] are released into the water through surface runoff, and seepage and can increase nutrient loads which cause changes in nutrient conditions. The greater the amount of rainfall, the greater the amount of nutrients being flushed into the water leading to a higher TLI value. Sinha & Michalak[41] found that precipitation was the main driver for annual variations of the nitrogen load in rivers. Excessive fertilization [4,29] can result in water eutrophication where fertilizers that enter the water bodies by leaching from surface water, or seepage cause an increase in both phosphorus and nitrogen and subsequently raise TLI values as well. The application of PF reduced TN/TP and, NF application increased TN/TP. Regarding HQ, as an important factor revealed by the current study, agricultural land and construction land [48] lead to an increase in nutrient loading, but forest and grassland [45] have a purification effect and improve habitat quality with optimization in land use type by enhancing ecosystem restoration; With regards to the influence of NF, using fertilizer to promote crop yield where Nitrogen in the soil as well as in the atmosphere is washed or seeped into the nearby water bodies which are found to contribute the significant rise in concentration levels[49]. The utilization of organic fertilizer over chemical fertilizer reduces loading pressure for nitrogen and phosphorus into the aquatic systems.
3.5. Strategic Directions for Nitrogen and Phosphorus Control in Key Lakes and Reservoirs in the Yangtze River Basin
The above results provide significant insights into nitrogen and phosphorus control measures in key lakes and reservoirs of the Yangtze River Basin. Differences in trophic states were significantly distinct among different regions(Figure 4 and Figure 6). Therefore, it is necessary to adapt control measures to local conditions and develop differentiated management strategies based on different types of lakes and sources of contamination. TN concentrations in the upper reaches were higher, and the control of the source of TN should be made a priority. Reducing the application of nitrogen and phosphorus fertilizers in farmland, promoting resource utilization of livestock excrement, and strengthening control over the discharge of wastewater are the major control measures to apply in these regions. In the midstream reaches, TN and TP concentrations were high with evidence of P-limited conditions, and control over P-loading is a priority, as demonstrated in research [50], by constructing ecological restoration zones, restoring farmland to grass and forest lands, raising phosphorus utilization efficiency of the soils, and the efficiency in which nitrogen and phosphorus is reduced in the discharge of domestic wastewater treatment plants and further reduction in the concentration of lake and reservoir inner release [51] which is ultimately reducing the load. In the downstream area where the phosphorus concentration in these bodies of water was relatively higher, a policy of P control should also be the prime directive. Actions that need to be considered in these areas would require limiting wastewater generated due to urban expansion or discharge from industries, and agricultural sources from the animal husbandries that directly release phosphorus which directly reduces P influx into the lakes.
It is therefore imperative that N and P control measures in lakes and reservoirs of the middle and lower reaches of the Yangtze River must be locally adopted while accounting for regional differences as well as characteristics of these aquatic ecosystems. For example, the implementation of strategies in the Dianchi Lake area upstream of the Yangtze River basin would require the key focus of measures for the upgrading of wastewater processing technology of existing plants as well as protection of the ecology in the buffer zone along with controls for diffuse source pollution in farms as well as from lake itself. Measures in mid-stream lakes of Poyang and Dongting Lakes in these areas should optimize the use and land type conversion in this catchment, to focus the management and conservation in watersheds through enhancing controls for linkages between the basin, the lakes with efforts to control polluted flow in tributary rivers that directly discharge into these important lake ecosystems. In contrast, policy actions taken for lakes such as Taihu Lake downstream will require priorities to be given for implementation in industries and discharge from urban domestic areas, as a focus. Further implementation of the enhancement in wastewater processing efficiency for nitrogen and phosphorus would help in better treatment. Furthermore, this will support regional integration efforts in tackling nonpoint source problems. Actions focused on the source and land type management should take place upstream of the catchments where controls in diffused sources from farming areas and within water bodies are taken into consideration in an integrated holistic fashion. Mid-stream management policies should further integrate the upstream activities and management practices which then needs a co-ordinate manner of management of linkages between tributary rivers as a systemic process while considering downstream impacts with controls implemented specifically at the sources of pollution both in cities and industries with inter and intra regional integration strategies and implementations to bring continual improvement to the overall health of water quality for lakes and reservoirs of the Yangtze River basin.
This study, which used InVEST and RDA modeling framework, quantitatively examined at a multi-scale level natural and anthropogenic factors driving influence and contributions to nutrients in lakes and reservoirs. Overall results in the current study largely matched those reported by a variety of authors albeit with some discrepancies [1]. Several reports consider N-inputs to the lake ecosystems as a main driving influence leading to eutrophication to downstream water bodies [52,53]. In contrast, findings from the current study consider P-limitation for many lakes and rivers as the main source of controls for preventing eutrophication of these ecosystems. The identified discrepancies are likely to be the result of different analytical procedures and sources of data that were acquired. Furthermore, to ensure the protection of Yangtze ecosystems, policy measures are needed to improve water quality, which requires better water quality monitoring systems for controlling eutrophication by implementation and formulation of targeted watershed management actions.
4. Conclusions
(1)The nutrient salt loads and trophic states of lakes and reservoirs in the upper, middle, and lower reaches of the Yangtze River Basin exhibit significant spatial heterogeneity. In the upstream region, lakes, and reservoirs generally have better water quality, lower concentrations of TN and TP, and higher TN/TP ratios, and most are either in mesotrophic or oligotrophic conditions; in the midstream area, the concentrations of TN and TP are significantly higher than that in the upstream reaches with a relatively low TN/TP, as well as greater occurrence of eutrophic states primarily with phosphorus or N and P combined limitation. In the downstream, both the TN and TP concentration values were between the upstream and mid-stream while being classified more as light eutrophic level which is characterized by mainly phosphorus limitation.
(2)There were significant regional variations for the lakes and reservoirs in HQ across the basin. The quality was intimately related to the types of land use patterns, and levels of human activities including social, and economic development. In general HQ values for water bodies in the upper reaches were generally high, with some reservoirs showing HQ values over 0.25. Water bodies in the middle of the Yangtze basin, overall showed relatively low HQ values but high variations were also seen. Downstream reservoirs in the area had homogenous levels of HQ and generally, these lakes varied in values of 0.15–0.35 albeit with high HQ values in some water bodies. This finding highlighted how the levels in the type of land use, degree of urbanization, and intensity of agriculture activity correlated directly with differences in HQ within each of the three segments.
(3)The findings show, regarding TN and TP that natural and anthropogenic factors conjointly influence their presence with a natural contribution rate to be 19.1%, and 35% attributed to human activities in these Yangtze regions. Intensities from farming of livestock animals, quality of habitats, and urbanization were all key influential components and had influence rates of 13.0%, 9.8%, and 0.2%, respectively; while the contribution of both natural factors (19.8%) and human activity influence rate (15.5%) was identified to be responsible in affecting the dynamics in TN/TP and TLI ratios, the key factors involved where determined to be, actual evaporation rates, habitat and hydrologic retention rate for an average explanation rates of 7.8%, 7.3% and 3.1%, respectively.
References
- Cui, M.; Guo, Q.; Wei, R.; Chen, T. Temporal-Spatial Dynamics of Anthropogenic Nitrogen Inputs and Hotspots in a Large River Basin. Chemosphere 2021, 269, 129411. [Google Scholar] [CrossRef] [PubMed]
- Wu, Y.; Eglinton, T.I.; Zhang, J.; Montlucon, D.B. Spatiotemporal Variation of the Quality, Origin, and Age of Particulate Organic Matter Transported by the Yangtze River (Changjiang). JGR Biogeosciences 2018, 123, 2908–2921. [Google Scholar] [CrossRef]
- Ministry of Ecology and Environment of the People's Republic of China. National Suface Surface Water Quality Report,. https://www.mee.gov.cn/hjzl/shj/dbsszyb/.
- Tao, S.; Fang, J.; Ma, S.; Cai, Q.; Xiong, X.; Tian, D.; Zhao, X.; Fang, L.; Zhang, H.; Zhu, J.; et al. Changes in China’s Lakes: Climate and Human Impacts. National Science Review 2020, 7, 132–140. [Google Scholar] [CrossRef] [PubMed]
- Collins, S.M.; Oliver, S.K.; Lapierre, J.; Stanley, E.H.; Jones, J.R.; Wagner, T.; Soranno, P.A. Lake Nutrient Stoichiometry Is Less Predictable than Nutrient Concentrations at Regional and Sub-continental Scales. Ecological Applications 2017, 27, 1529–1540. [Google Scholar] [CrossRef] [PubMed]
- Li, J.; Zheng, Z.; Liu, G.; Chen, N.; Lei, S.; Du, C.; Xu, J.; Li, Y.; Zhang, R.; Huang, C. Estimating Effects of Natural and Anthropogenic Activities on Trophic Level of Inland Water: Analysis of Poyang Lake Basin, China, with Landsat-8 Observations. Remote Sensing 2023, 15, 1618. [Google Scholar] [CrossRef]
- Xu, H.; McCarthy, M.J.; Paerl, H.W.; Brookes, J.D.; Zhu, G.; Hall, N.S.; Qin, B.; Zhang, Y.; Zhu, M.; Hampel, J.J.; et al. Contributions of External Nutrient Loading and Internal Cycling to Cyanobacterial Bloom Dynamics in Lake Taihu, China: Implications for Nutrient Management. Limnology & Oceanography 2021, 66, 1492–1509. [Google Scholar] [CrossRef]
- Ji, N.; Zou, R.; Jiang, Q.; Liang, Z.; Hu, M.; Liu, Y.; Yu, Y.; Wang, Z.; Wang, H. Internal Positive Feedback Promotes Water Quality Improvement for a Recovering Hyper-Eutrophic Lake: A Three-Dimensional Nutrient Flux Tracking Model. Science of The Total Environment 2021, 772, 145505. [Google Scholar] [CrossRef] [PubMed]
- McCrackin, M.L.; Jones, H.P.; Jones, P.C.; Moreno-Mateos, D. Recovery of Lakes and Coastal Marine Ecosystems from Eutrophication: A Global Meta-analysis. Limnology & Oceanography 2017, 62, 507–518. [Google Scholar] [CrossRef]
- Qin, B.; Zhou, J.; Elser, J.J.; Gardner, W.S.; Deng, J.; Brookes, J.D. Water Depth Underpins the Relative Roles and Fates of Nitrogen and Phosphorus in Lakes. Environ. Sci. Technol. 2020, 54, 3191–3198. [Google Scholar] [CrossRef] [PubMed]
- Ai, X.; Zheng, X.; Zhang, Y.; Liu, Y.; Ou, X.; Xia, C.; Liu, L. Climate and Land Use Changes Impact the Trajectories of Ecosystem Service Bundles in an Urban Agglomeration: Intricate Interaction Trends and Driver Identification under SSP-RCP Scenarios. Science of The Total Environment 2024, 944, 173828. [Google Scholar] [CrossRef]
- Guildford, S.J.; Hecky, R.E. Total Nitrogen, Total Phosphorus, and Nutrient Limitation in Lakes and Oceans: Is There a Common Relationship? Limnology & Oceanography 2000, 45, 1213–1223. [Google Scholar] [CrossRef]
- Dolman, A.M.; Mischke, U.; Wiedner, C. Lake-type-specific Seasonal Patterns of Nutrient Limitation in German Lakes, with Target Nitrogen and Phosphorus Concentrations for Good Ecological Status. Freshwater Biology 2016, 61, 444–456. [Google Scholar] [CrossRef]
- Widespread Global Increase in Intense Lake Phytoplankton Blooms since the 1980s | Nature. Available online: https://www.nature.com/articles/s41586-019-1648-7 (accessed on 18 September 2024).
- Cheng, G.W.; Chen, Y.; Gao, W. Source apportionment of nitrogen and phosphorus in the lakes and reservoirs of Yangtze River Watershed from 2016 to 2019. Acta Scientiae Circumstantiae 2022, 42, 207–217. [Google Scholar]
- Zeng, H.-a.; Wu, J.-l. Characteristics and mechanismes of water environmental changes in the lakes along the middle and lower reaches of Yangtze River. Advances in Water Science 2007, 18, 834–841. [Google Scholar]
- Chen, J.; Wu, X.; Finlayson, B.L.; Webber, M.; Wei, T.; Li, M.; Chen, Z. Variability and Trend in the Hydrology of the Yangtze River, China: Annual Precipitation and Runoff. Journal of Hydrology 2014, 513, 403–412. [Google Scholar] [CrossRef]
- Cheng, M.; Quan, J.; Yin, J.; Liu, X.; Yuan, Z.; Ma, L. High-Resolution Maps of Intensive and Extensive Livestock Production in China. Resources, Environment and Sustainability 2023, 12, 100104. [Google Scholar] [CrossRef]
- Zhang, X.; Zhou, J.; Li, M. Analysis on spatial and temporal changes of regional habitat quality based on the spatial pattern reconstruction of land use. Acta Geographica Sinica 2020, 75, 160–178. [Google Scholar]
- Xie, Y.C.; Gong, J.; Zhang, S.X.; Ma, X.; Hu, B. Spatiotemporal Change of Landscape Biodiversity Based on InVEST Model and Remote Sensing Technology in the Bailong River Watershed. SCIENTIA GEOGRAPHICA SINICA 2018, 38, 979–986. [Google Scholar]
- Sharp, R.; Chaplin-Kramer, R.; Wood, S.; Guerry, A.; Tallis, H.; Ricketts, T.; Nelson, E.; Ennaanay, D.; Wolny, S.; Olwero, N.; et al. InVEST User’s Guide; The Natural Capital Project, Stanford University, University of Minnesota, The Nature Conservancy, and World Wildlife Fund., 2018.
- Lai, J.; Zou, Y.; Zhang, J.; Peres-Neto, P.R. Generalizing Hierarchical and Variation Partitioning in Multiple Regression and Canonical Analyses Using the Rdacca.Hp R Package. Methods Ecol Evol 2022, 13, 782–788. [Google Scholar] [CrossRef]
- Intensification of Phosphorus Cycling in China since the 1600s | PNAS. Available online: https://libyw.ucas.ac.cn/https/5Jy11EWbH4LLHFFILXUiUAcBuhdVMmcsDK/doi/abs/10.1073/pnas.1519554113 (accessed on 21 August 2024).
- Dai, Z.; Du, J.; Zhang, X.; Su, N.; Li, J. Variation of Riverine Material Loads and Environmental Consequences on the Changjiang (Yangtze) Estuary in Recent Decades (1955−2008). Environ. Sci. Technol. 2011, 45, 223–227. [Google Scholar] [CrossRef] [PubMed]
- JI Peng-fei, XU Hai, ZHAN Xu, ZHU Guang-wei, ZOU Wei, ZHU Meng-yuan, KANG Li-juan. Spatial-temporal Variations and Driving of Nitrogen and Phosphorus Ratios in Lakes in the Middle and Lower Reaches of Yangtze River. Environmental Science 2020, 41, 4030–4041. [Google Scholar]
- Rong, W.; Ke, Z.; Jianbao, L.; Xuhui, D.; Xiangdong, Y. Nanjing Institute of Geography and Limnology, Chinese Academy of Sciences, Nanjing 210008, P.R. China; University of Chinese Academy of Sciences, Beijing 101408, P.R. China The Importance of Lake Ecosystem Evolution for Anthropocene Research. Journal of Lake Sciences 2024, 36, 333–338. [Google Scholar] [CrossRef]
- Le, C.; Zha, Y.; Li, Y.; Sun, D.; Lu, H.; Yin, B. Eutrophication of Lake Waters in China: Cost, Causes, and Control. Environmental Management 2010, 45, 662–668. [Google Scholar] [CrossRef] [PubMed]
- Gao, D.-d.; Zhang, H.; Ren, X.-n.; Tian, X.-g.; Guo, M.-k.; Zhang, W.-p.; Yang, C.-j. Evaluation of Eutrophication and Analysis of Pollution Factors in Eutrophication and Pollution Factors in Typical Seasonal Rivers of Upper Yangtze River. Resources And Environment In The Yangtze Basin 2024, 33, 584–595. [Google Scholar]
- Qin, B.; Gao, G.; Zhu, G.; Zhang, Y.; Song, Y.; Tang, X.; Xu, H.; Deng, J. Lake Eutrophication and Its Ecosystem Response. Chin. Sci. Bull. 2013, 58, 961–970. [Google Scholar] [CrossRef]
- Wang, R.; Doncaster, C.P.; Zheng, W.; Xu, M.; Yang, H.; Li, Y.; Cai, Y.; Zhao, Y.; Zhang, E.; Yang, X.; et al. High Phytoplankton Diversity in Eutrophic States Impedes Lake Recovery. Journal of Biogeography 2023, 50, 1914–1925. [Google Scholar] [CrossRef]
- Zhu, G.W.; Xu, H.; Zhu, M.Y.; Zou, W.; Guo, C.; Ji, P.; Da, W.; Zhou, Y.; Zhang, Y.; Qin, B. Changing characteristics and driving factors of trophic state of lakes in the middle and lower reaches of Yangtze River in the past 30 years. J. Lake Sci. 2019, 31, 1510–1524. [Google Scholar] [CrossRef]
- Song, Y.; Qin, B.; Gao, G. Effect of nutrient on periphytic aglae and phytoplankton. J. Lake Sci. 2007, 19, 125–130. [Google Scholar]
- Song, Y.; Qin, B.; Gao, G. Effect of nutrient on periphytic aglae and phytoplankton. J. Lake Sci. 2007, 19, 125–130. [Google Scholar]
- Hao, L.; Sun, G. Impacts of urbanization on watershed ecohydrological processes: progresses and perspectives. Acta Ecologica Sinica 2021, 41, 13–26. [Google Scholar]
- Zhang, S.; Li, G. The effects of different components of the forest ecosystem on water quality in the Huoditang forest region, Qinling Mountain Range. Acta Ecologica Sinica 2007, 1838–1844. [Google Scholar]
- Yuan, B.; Fu, L.; Zou, Y.; Zhang, S.; Chen, X.; Li, F.; Deng, Z.; Xie, Y. Spatiotemporal Change Detection of Ecological Quality and the Associated Affecting Factors in Dongting Lake Basin, Based on RSEI. Journal of Cleaner Production 2021, 302, 126995. [Google Scholar] [CrossRef]
- Pu, J.; Shen, A.; Liu, C.; Wen, B. Impacts of Ecological Land Fragmentation on Habitat Quality in the Taihu Lake Basin in Jiangsu Province, China. Ecological Indicators 2024, 158, 111611. [Google Scholar] [CrossRef]
- Yu, C.; Huang, X.; Chen, H.; Godfray, H.C.J.; Wright, J.S.; Hall, J.W.; Gong, P.; Ni, S.; Qiao, S.; Huang, G.; et al. Managing Nitrogen to Restore Water Quality in China. Nature 2019, 567, 516–520. [Google Scholar] [CrossRef]
- Hu, M.; Liu, Y.; Zhang, Y.; Shen, H.; Yao, M.; Dahlgren, R.A.; Chen, D. Long-Term (1980–2015) Changes in Net Anthropogenic Phosphorus Inputs and Riverine Phosphorus Export in the Yangtze River Basin. Water Research 2020, 177, 115779. [Google Scholar] [CrossRef] [PubMed]
- Hashemi, F.; Olesen, J.E.; Dalgaard, T.; Børgesen, C.D. Review of Scenario Analyses to Reduce Agricultural Nitrogen and Phosphorus Loading to the Aquatic Environment. Science of The Total Environment 2016, 573, 608–626. [Google Scholar] [CrossRef] [PubMed]
- Sinha, E.; Michalak, A.M. Precipitation Dominates Interannual Variability of Riverine Nitrogen Loading across the Continental United States. Environ. Sci. Technol. 2016, 50, 12874–12884. [Google Scholar] [CrossRef] [PubMed]
- DU Jing, QIAN Yu-ting, XU Yueding, ZHANG Jian-ying, CHANG Zhi-zhou. RELATIONSHIP BETWEEN WATER QUALITY OF SURFACE WATER AND BIOCHEMICAL CHARACTERS OF CYANOBACTERIAL BIOMASS IN THE TAIHU LAKE AND THE DIANCHI LAKE. RESOURCES AND ENVIRONMENT IN THE YANGTZE BASIN 2013, 22, 212–218. [Google Scholar]
- Liang, X.; Zhang, X.; Liu, J.; et al. Estimation of permissible pollution bearing capacity and aquaculture pollution load of Changhu Lake. Water Resources Protection 2015, 31, 78–83. [Google Scholar]
- Yang, S.H.; Peng, Z.H.; Jiao, H.Z.; Xu, J.; Wang, Y.G. External pollution source load and contribution of urban eutrophic lakes—Taking Lake Houguanhu of Wuhan as an example. J. Lake Sci. 2020, 32, 941–951. [Google Scholar]
- Deng, C.; Liu, L.; Li, H.; Peng, D.; Wu, Y.; Xia, H.; Zhang, Z.; Zhu, Q. A Data-Driven Framework for Spatiotemporal Characteristics, Complexity Dynamics, and Environmental Risk Evaluation of River Water Quality. Science of The Total Environment 2021, 785, 147134. [Google Scholar] [CrossRef] [PubMed]
- Yin yuanyuan; Peng shuangyun; Lin zhiqiang; LI dingpu; LI ting; ZHU yilin; HUANG bangmei. Spatiotemporal Changes and Multi-scale Driving Mechanism Analysis of Nitrogen and Phosphorus Export in Yunnan Province from 2000 to 2020. Environmental Science 1–15. [CrossRef]
- Huang, Y.P.; Wang, P.; Xu, Q.Y.; Shu, W.; Ding, M.J.; Zhang, H.; Zeng, T. Influence of Land Use on Carbon, Nitrogen and Phosphorus in Water of Yuan River Basin. Research of Environmental Sciences 2021, 34, 2132–2142. [Google Scholar]
- Li, Z.; Peng, L.; Wu, F. The Impacts of Impervious Surface on Water Quality in the Urban Agglomerations of Middle and Lower Reaches of the Yangtze River Economic Belt From Remotely Sensed Data. IEEE Journal of Selected Topics in Applied Earth Observations and Remote Sensing 2021, 14, 8398–8406. [Google Scholar] [CrossRef]
- Li, Z.; Ma, J.; Guo, J.; Paerl, H.W.; Brookes, J.D.; Xiao, Y.; Fang, F.; Ouyang, W.; Lunhui, L. Water Quality Trends in the Three Gorges Reservoir Region before and after Impoundment (1992–2016). Ecohydrology & Hydrobiology 2019, 19, 317–327. [Google Scholar] [CrossRef]
- GAO yongxia; ZHU guangwei; HE ranarn; WANG fang.Variation of Water Quality and Trophic State of Lake Tianma,Chian. Environmental Science 2009, 30, 673–679. https://doi.org/10.13227/j.hjkx.2009.03.049. GAO yongxia; ZHU guangwei; HE ranarn; WANG fang.Variation of Water Quality and Trophic State of Lake Tianma,Chian. Environmental Science, 2009, 30, 673–679.
- Qin, B. Shallow lake limnology and control of eutrophication in Lake Taihu. J. Lake Sci. 2020, 32, 1229–1243. [Google Scholar]
- Tong, Y.; Bu, X.; Chen, J.; Zhou, F.; Chen, L.; Liu, M.; Tan, X.; Yu, T.; Zhang, W.; Mi, Z.; et al. Estimation of Nutrient Discharge from the Yangtze River to the East China Sea and the Identification of Nutrient Sources. Journal of Hazardous Materials 2017, 321, 728–736. [Google Scholar] [CrossRef] [PubMed]
- Chen, X.; Wang, M.; Kroeze, C.; Chen, X.; Ma, L.; Chen, X.; Shi, X.; Strokal, M. Nitrogen in the Yangtze River Basin: Pollution Reduction through Coupling Crop and Livestock Production. Environ. Sci. Technol. 2022, 56, 17591–17603. [Google Scholar] [CrossRef] [PubMed]
Figure 1.
Distribution and overview of 33 representative lakes and reservoirs.
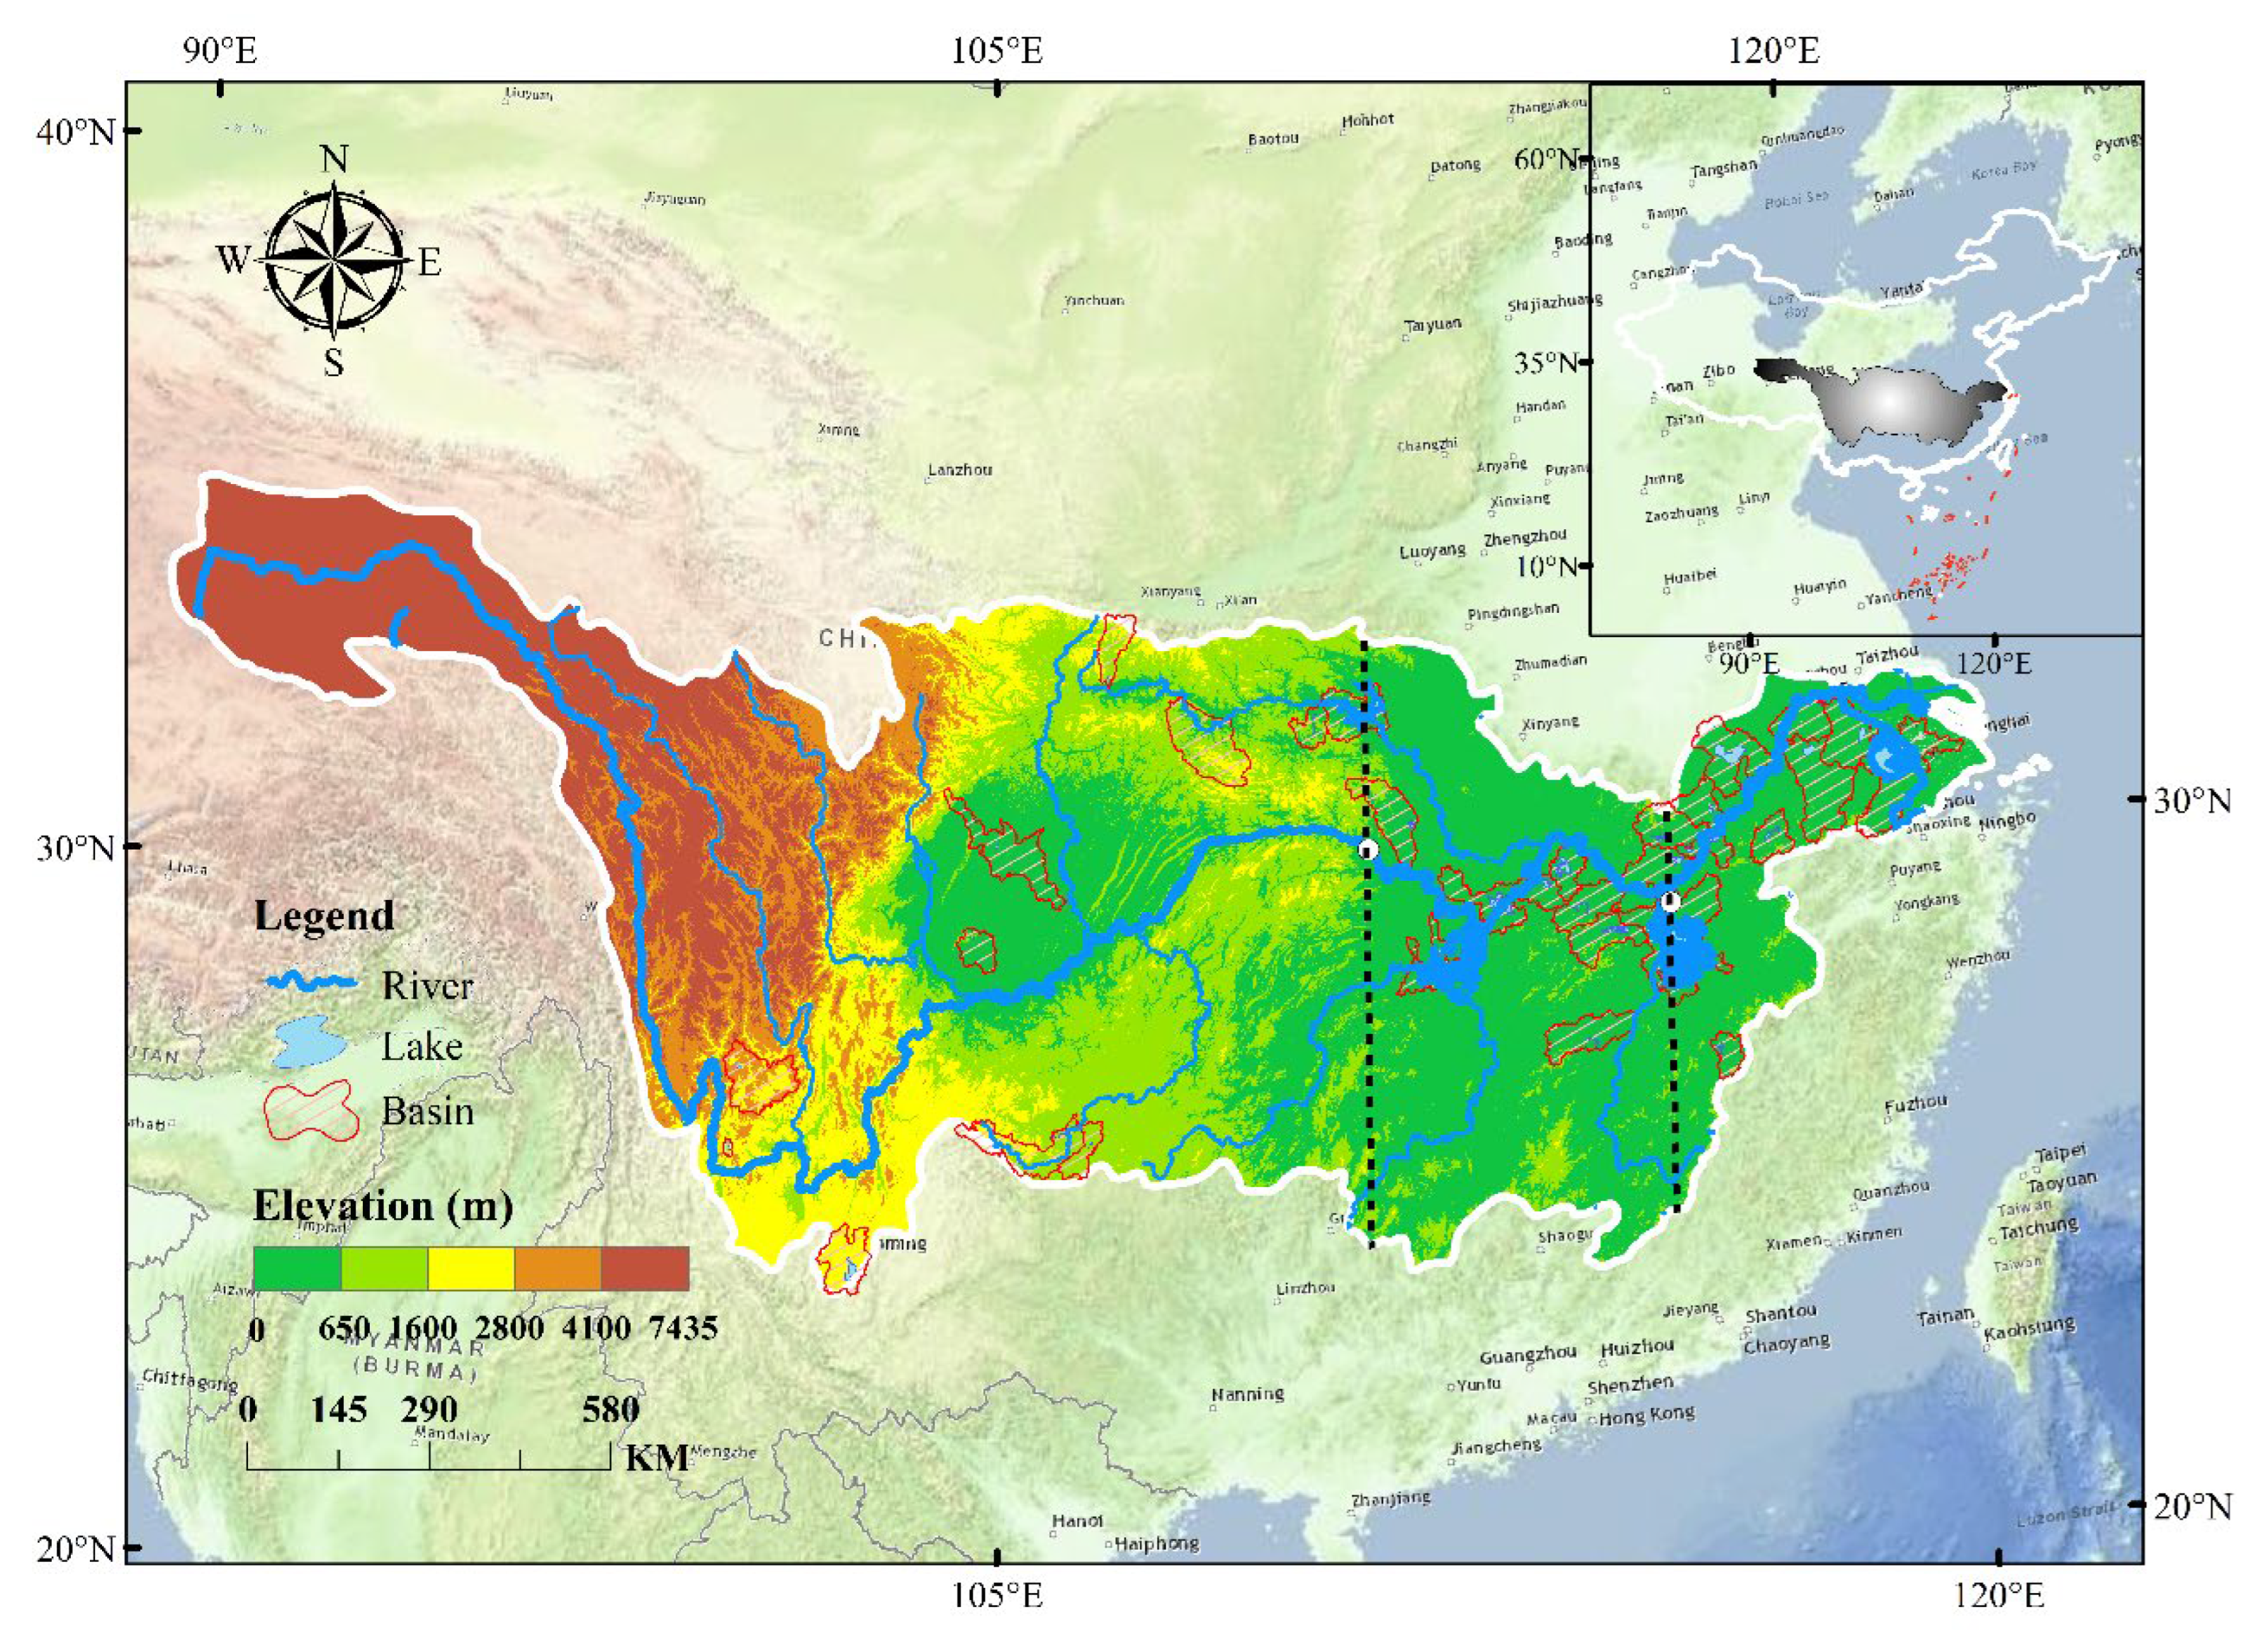
Figure 2.
Nutritional status of lakes and reservoirs in different regions of the Yangtze River Basin in 2021.
Figure 2.
Nutritional status of lakes and reservoirs in different regions of the Yangtze River Basin in 2021.
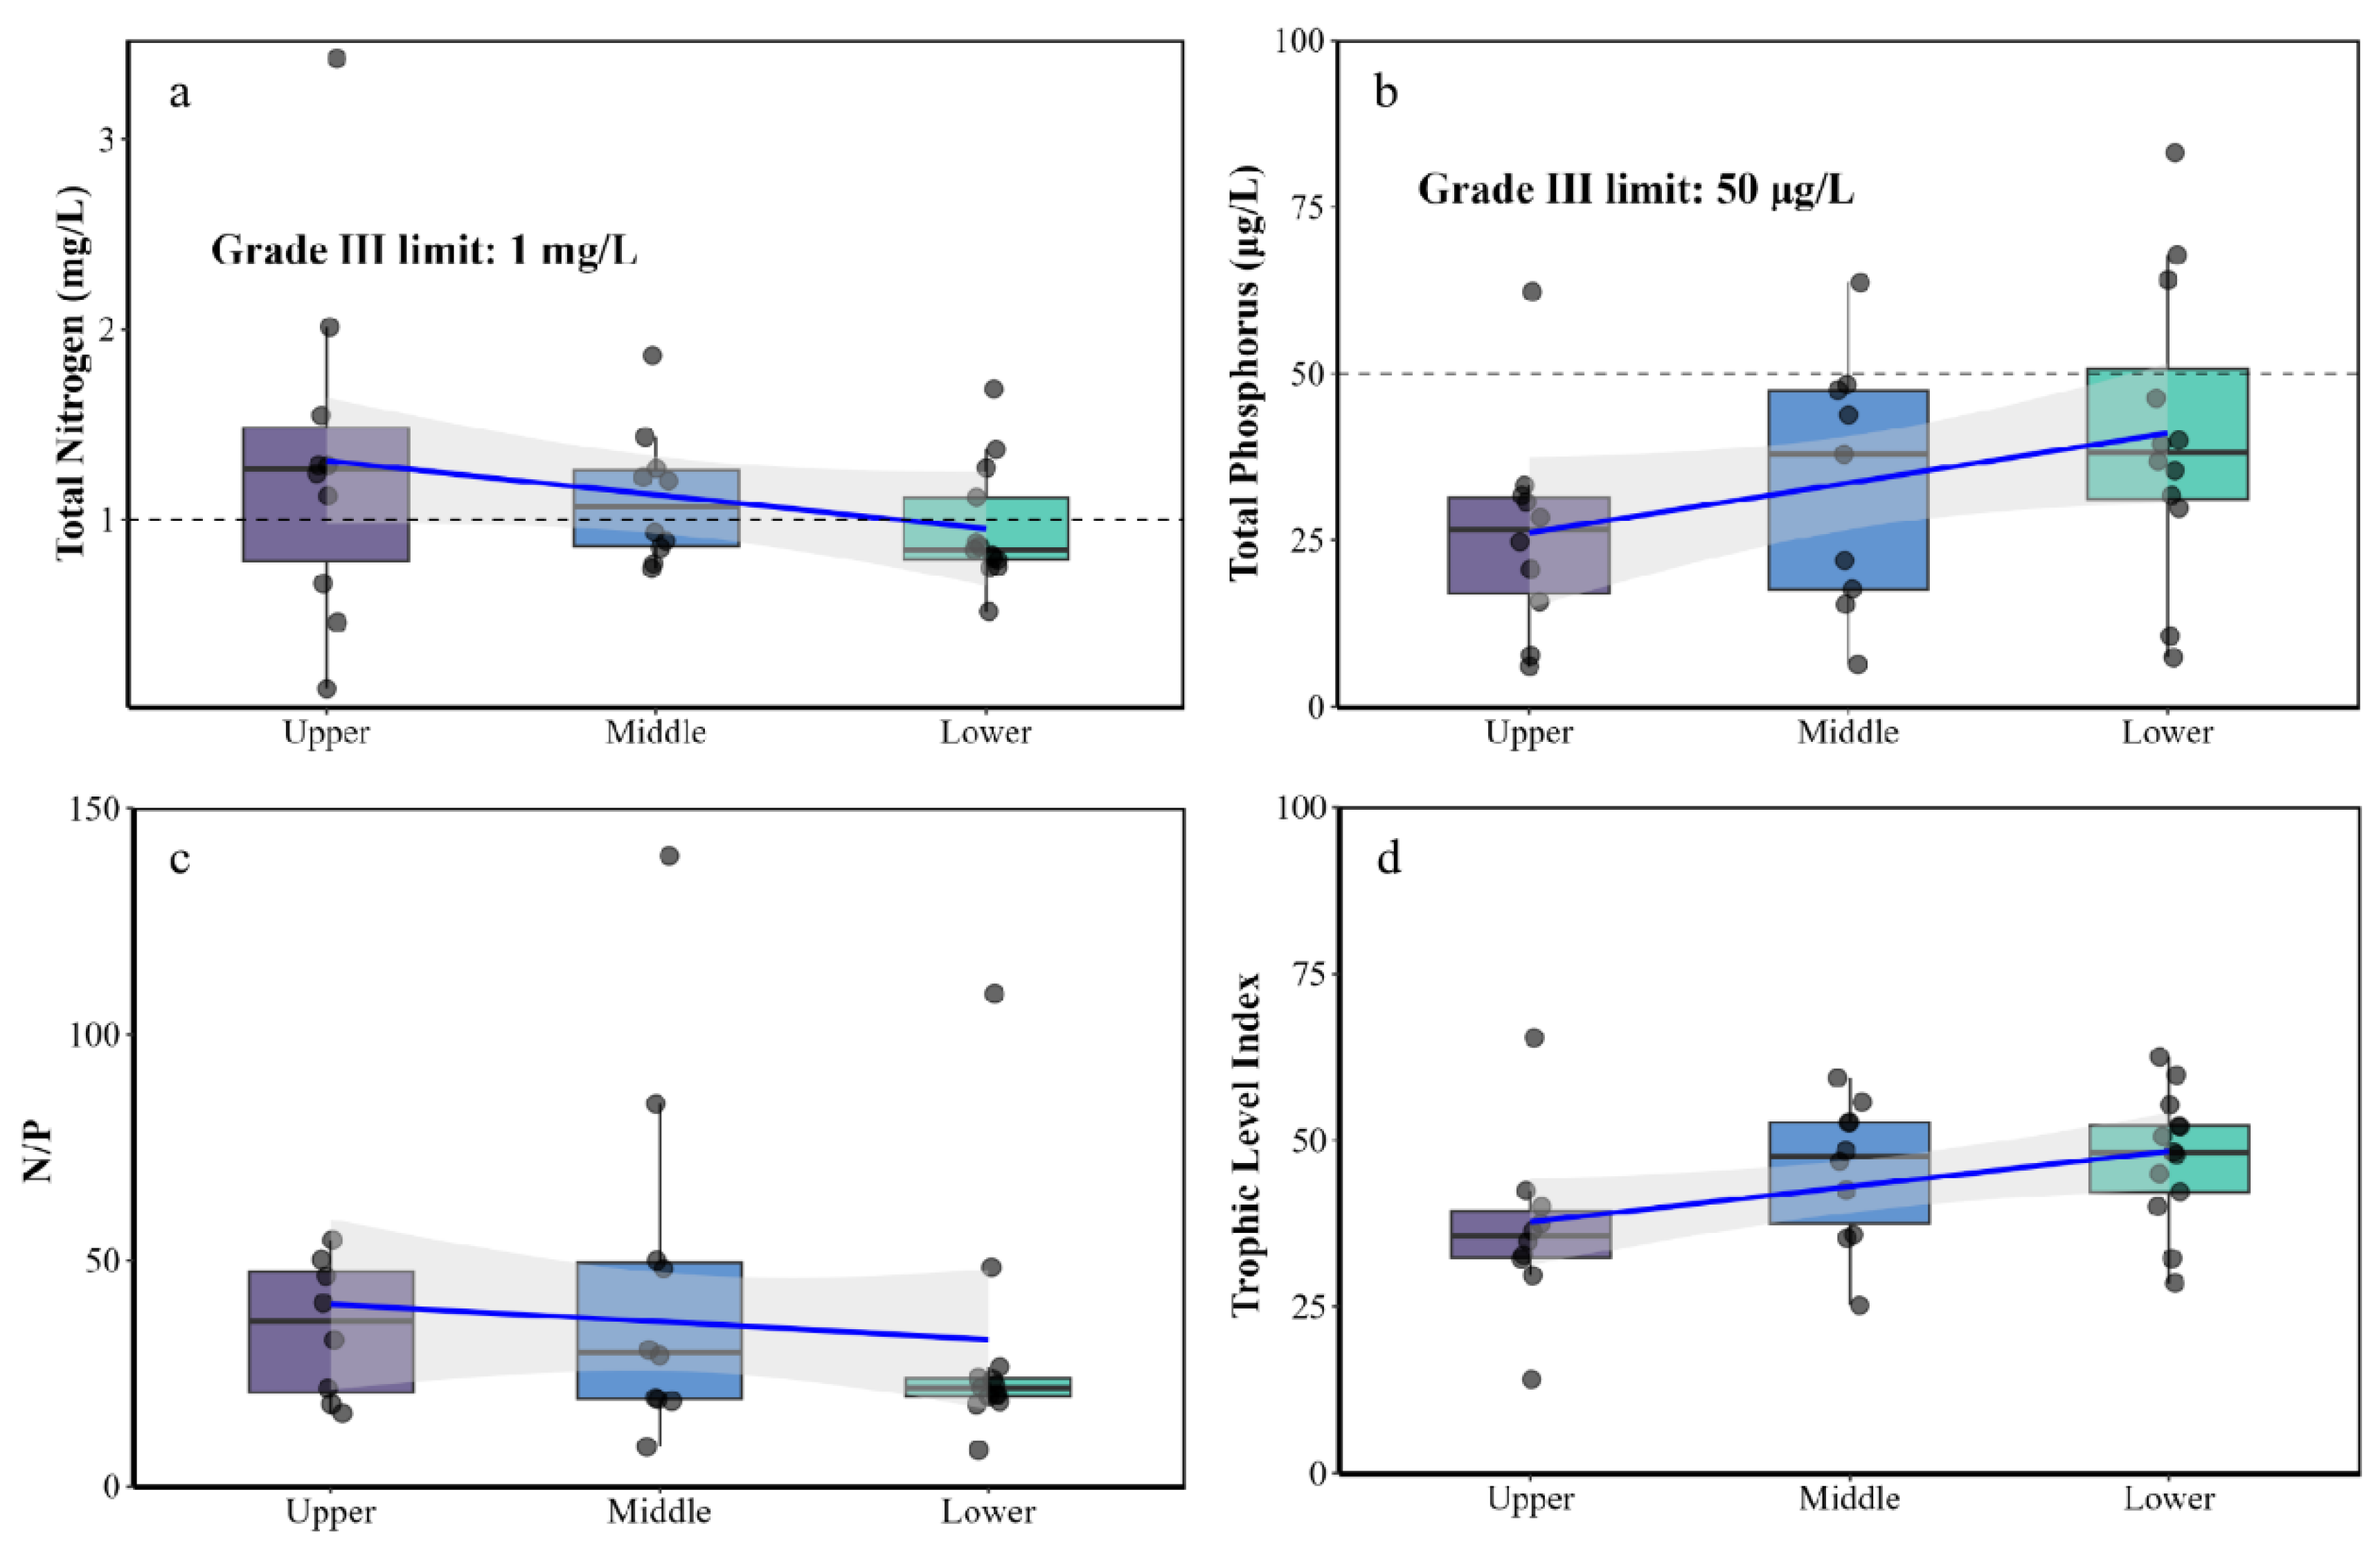
Figure 3.
TN, TP, TLI, and TN/TP interannual variations.
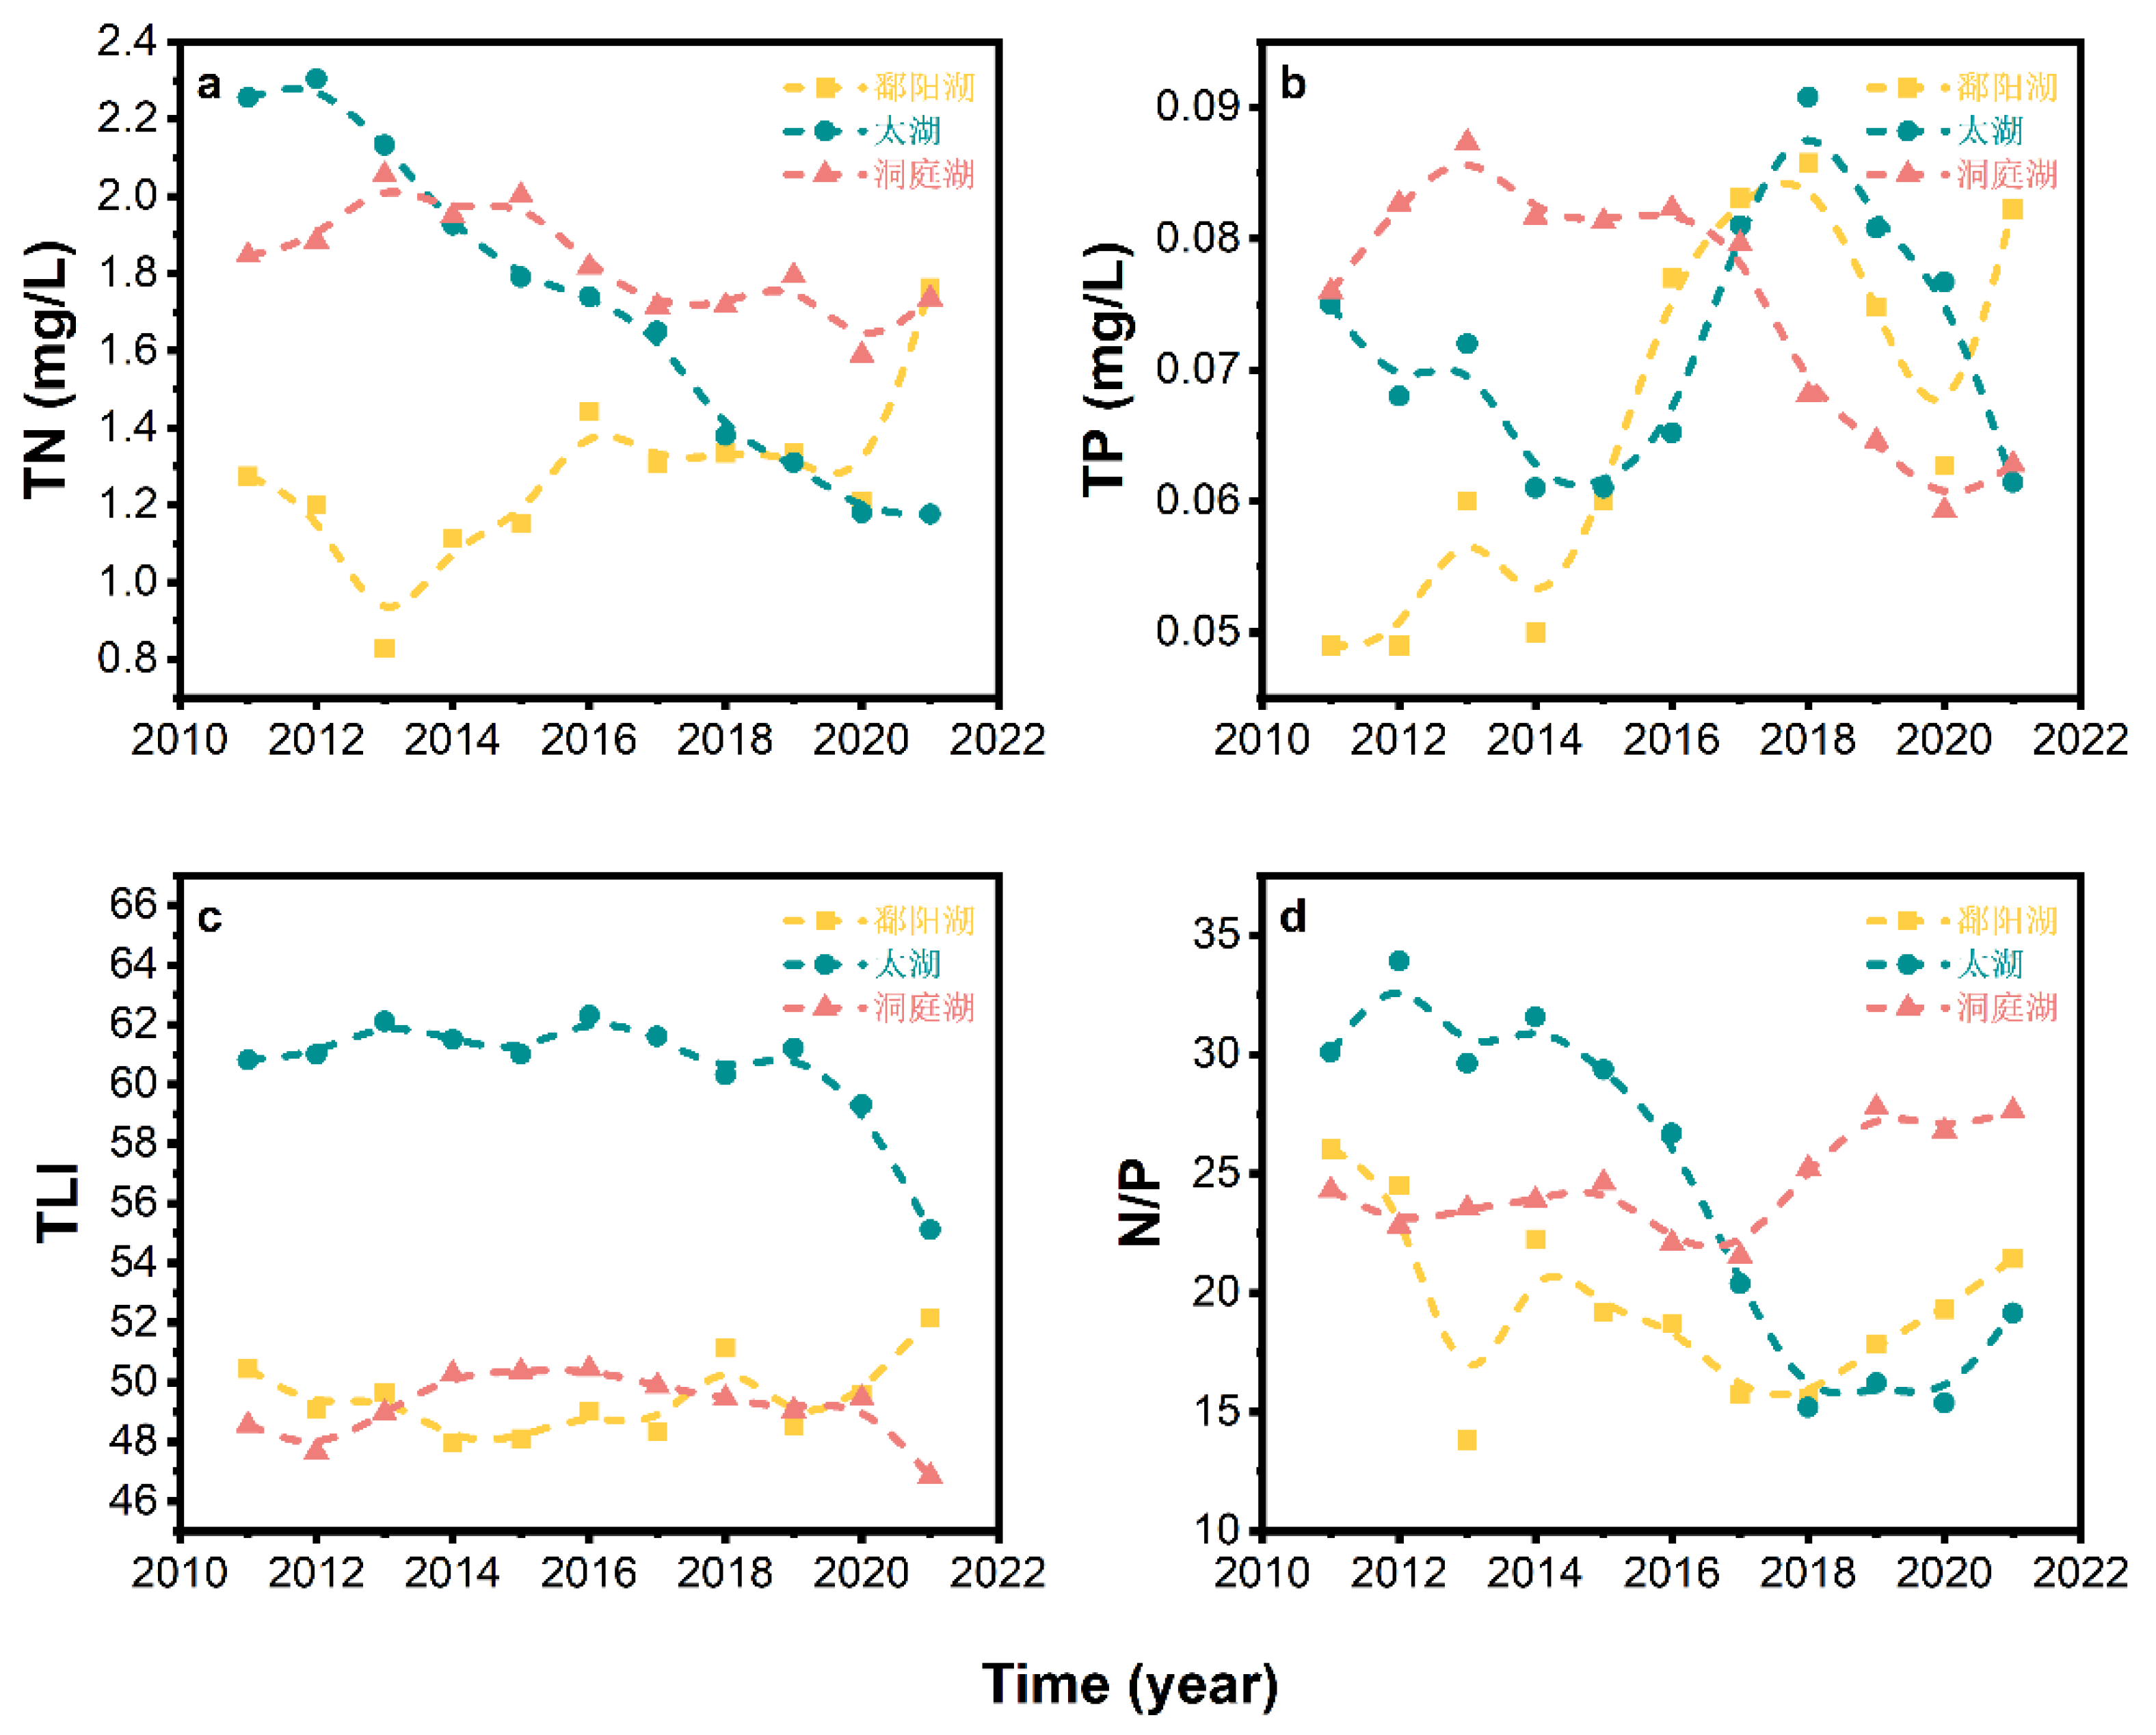
Figure 10.
RDA analysis of interannual variability of TN/TP and TLI.
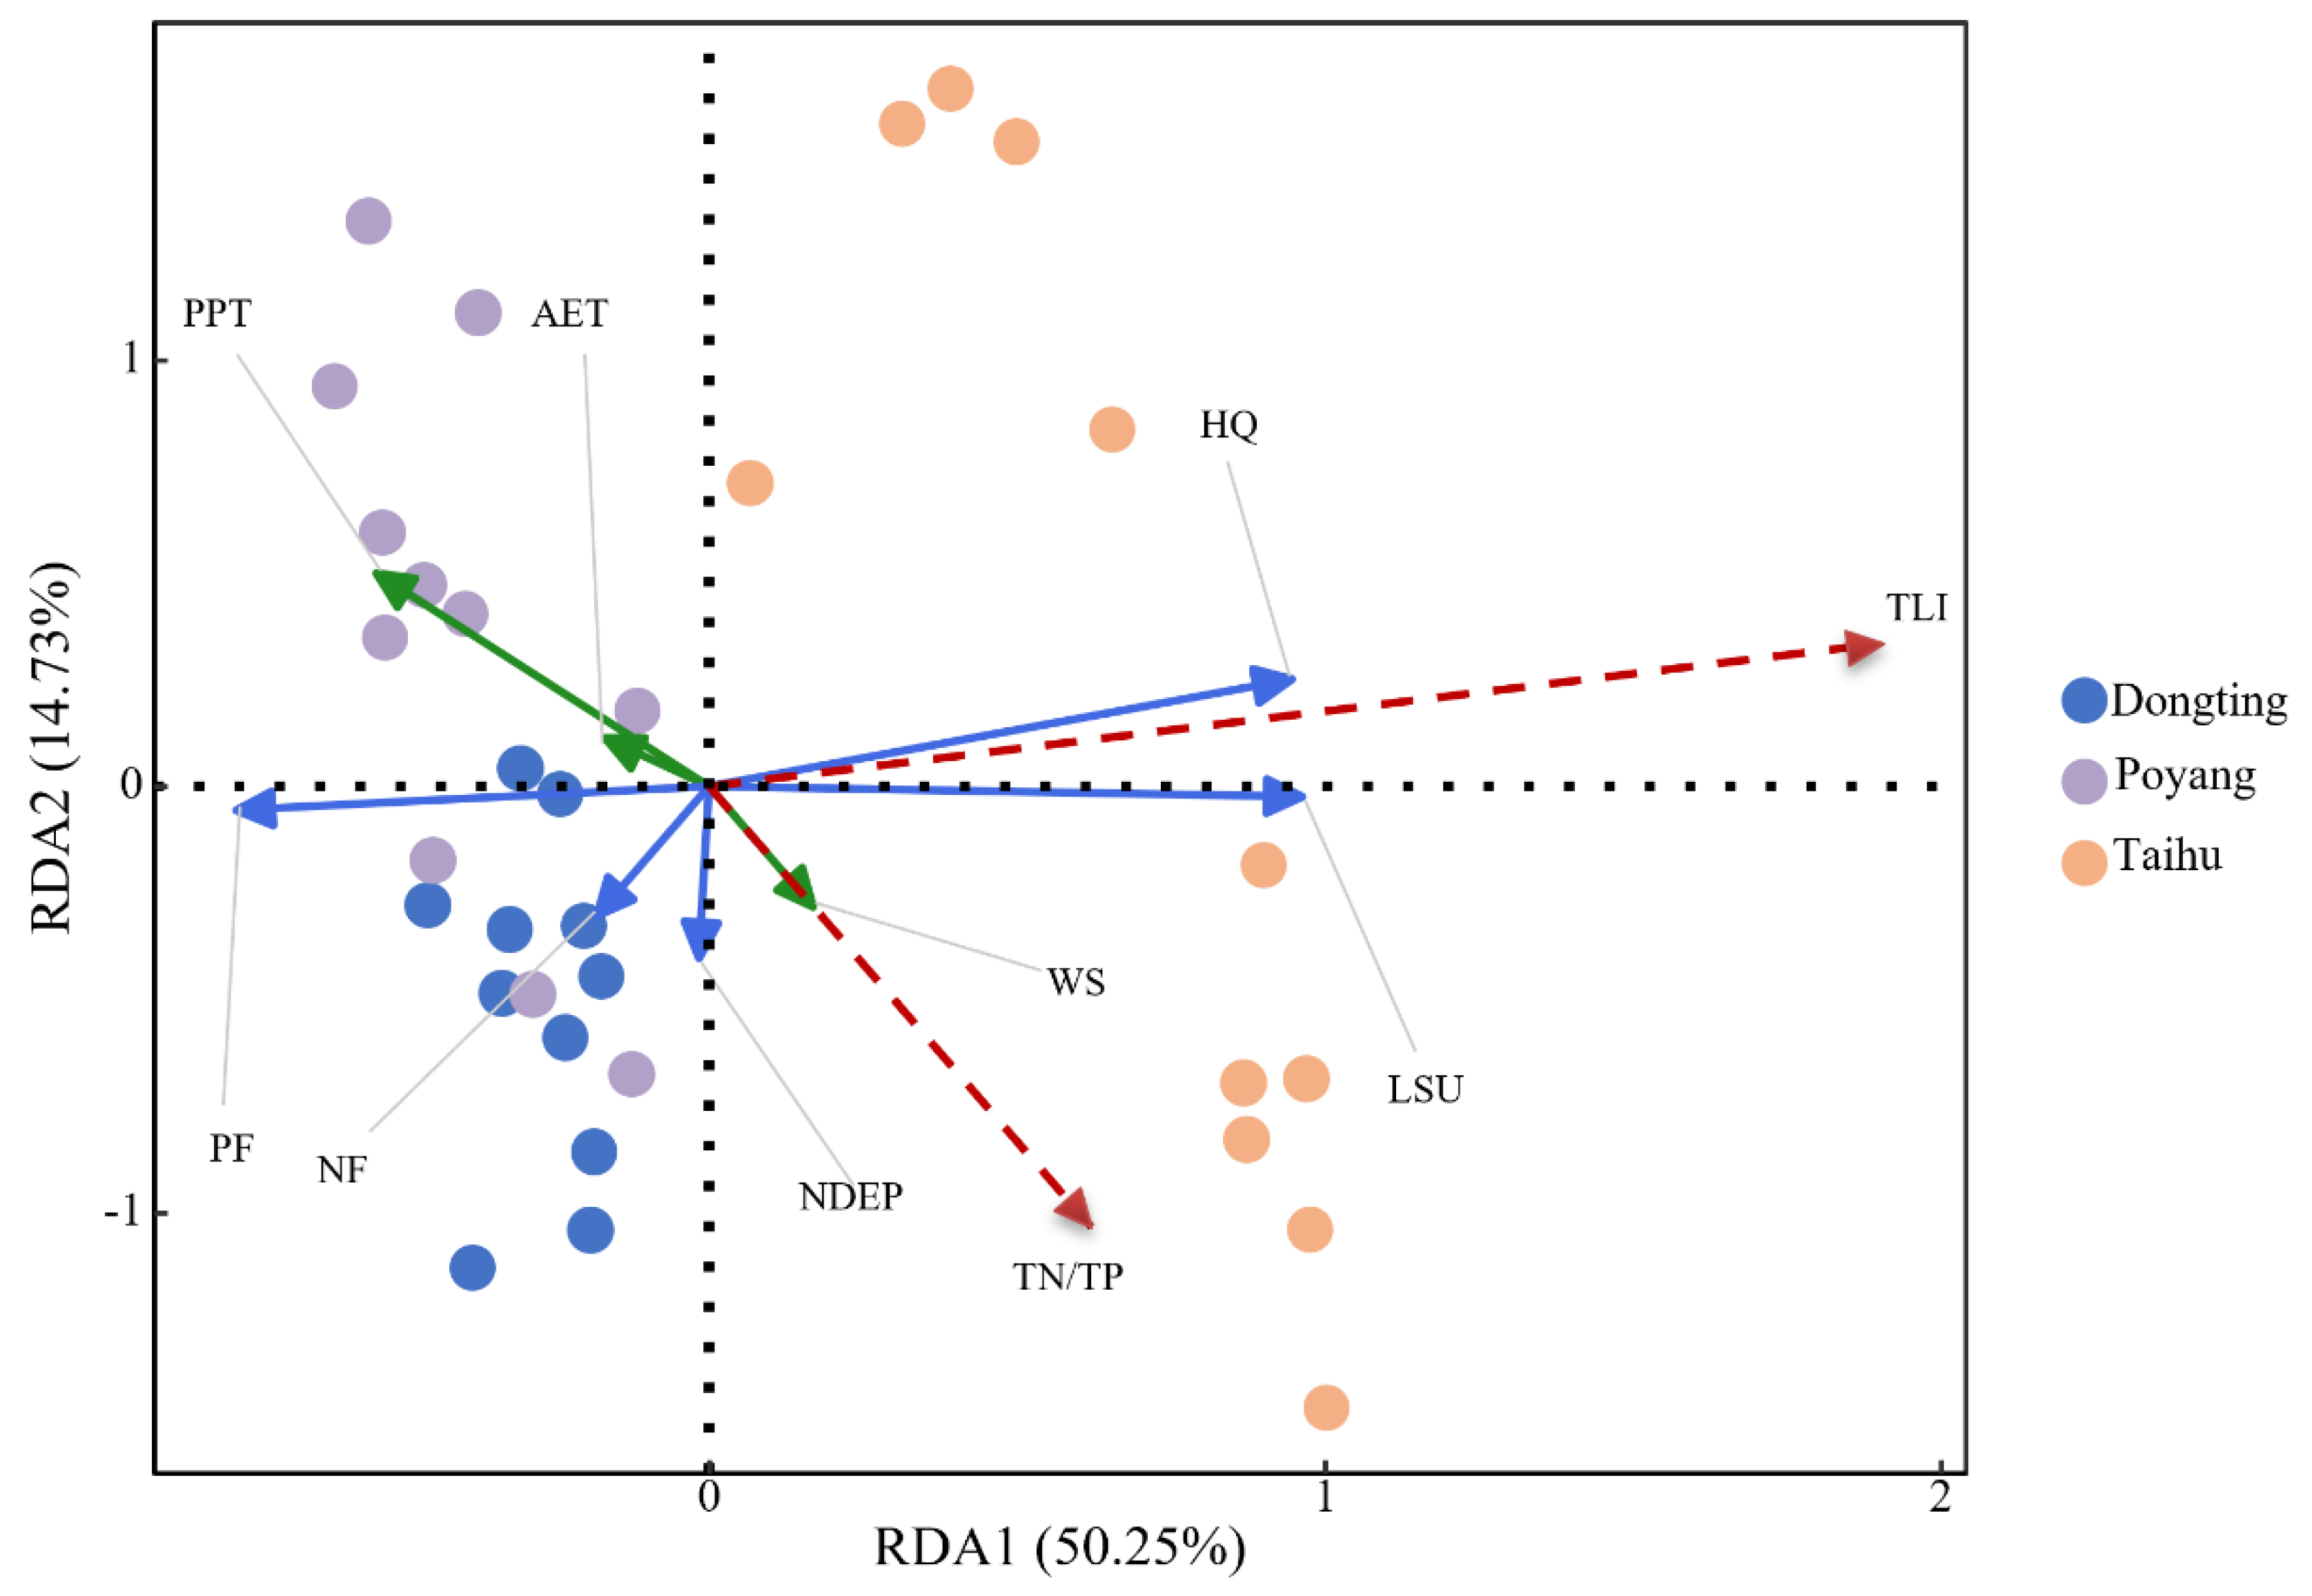

Table 1.
Data source and content.
| Data Type | Year | Data Format | Notes |
|---|---|---|---|
| Basin, lake, actual evapotranspiration, depth, hydraulic retention time, and longitude/latitude data | - | HydroATLAS | HydroSHEDS (https://www.hydrosheds.org/) |
| Temperature | 2021 | Raster | Resolution: 1 km Unit: degrees Celsius (°C) (https://data.tpdc.ac.cn/) |
| Precipitation | 2021 | Raster | Resolution: 1 km Unit: m (http://www.nesdc.org.cn/) |
| Habitat Quality | 2021 | Raster | Resolution: 10 m × 10 m Value range: 0 to 1 |
| Wind Speed | 2020 | Raster | Resolution: 1 km Unit: m/s (https://data.tpdc.ac.cn/) |
| Livestock | 2017 | Raster | Resolution: 1 km Values represent the stock population for beef cattle, dairy cattle, sheep, and poultry (units: heads) and the slaughter population for pigs (units: number slaughtered). Livestock Units (LSU) are calculated as: 1 LSU = 500 kg dairy cow = 0.5 beef cattle = 0.35 pigs = 0.1 sheep/goats = 0.129 poultry., data processed via MAPS model |
| Aquaculture Production | 2021 | CSV | China Statistical Yearbook (https://www.stats.gov.cn/) |
| Nitrogen Fertilizer | 2021 | CSV | China Statistical Yearbook (https://www.stats.gov.cn/) |
| Land Use Data | 2021 | Raster | Resolution: 10 m × 10 m (https://livingatlas.arcgis.com/) |
| Water Quality and Nutrient Data | 2021 | CSV | China National Environmental Monitoring Centre (https://www.cnemc.cn/) |
| Lake Trophic Level Index | 2021 | Constant | National Surface Water Quality Report (https://www.mee.gov.cn/hjzl/shj/dbsszyb/) |
Note: Natural Factors: PPT (Precipitation): measures rainfall totals (m); NDEP (Nutrient Deposition): atmospheric nitrogen deposited through wet deposition (e.g., rain, snow) and dry deposition (e.g., gases and particulate matter) onto the land surface or water bodies (mg N·m⁻²·yr⁻¹); AET (Actual Evapotranspiration): the amount of water lost through evaporation and plant transpiration (mm); HQ (Habitat Quality): habitat quality, ranging from 0 to 1, where higher values indicate better habitat quality; DEP (Depth): water depth (m); Elevation: altitude (m); WS (Wind Speed): wind speed (m/s); Latitude: angular distance of a point on Earth's surface from the equator (°); Longitude: angular distance of a point on Earth's surface from the Prime Meridian (°).Human Factors: HRT (Hydraulic Retention Time): the average time water resides in a given water body (year); LSU (Livestock Units): a metric that measures livestock quantities, defined using different mass standards [18]; PF (Phosphorus Fertilizer): phosphorus fertilizer primarily applied to provide phosphorus to crops (10 kt).
Table 2.
Threat factor parameters.
| Land Use Type | Maximum Influence Distance (km) | Weight | Spatial Decay Type |
|---|---|---|---|
| Cultivated Land | 1.50 | 0.60 | Linear |
| Forest Land | 1.50 | 0.60 | Linear |
| Grassland | 1.50 | 0.60 | Linear |
| Water Body | 1.50 | 0.60 | Linear |
| Built-Up Area | 6.00 | 1.00 | Exponential |
| Unutilized Land | 2.00 | 0.40 | Linear |
Table 3.
Habitat quality suitability and relative sensitivity to threat factors of various land use types.
Table 3.
Habitat quality suitability and relative sensitivity to threat factors of various land use types.
| Land Use Type | Habitat Suitability | Relative Sensitivity to Threat Factors | |||||
|---|---|---|---|---|---|---|---|
| Cultivated Land | Forest Land | Grassland | Water Body | Built-Up Area | Unutilized Land | ||
| Cultivated Land | 0.40 | 0.25 | 0.8 | 0.7 | 0.65 | 0.25 | 0.5 |
| Forest Land | 1.00 | 0.80 | 1 | 0.9 | 0.85 | 0.8 | 1 |
| Grassland | 0.80 | 0.70 | 0.9 | 1 | 0.85 | 0.7 | 0.8 |
| Water Body | 0.70 | 0.65 | 0.85 | 0.8 | 1 | 0.65 | 0.75 |
| Built-Up Area | 0.00 | 0.00 | 0.1 | 0.1 | 0.1 | 0 | 0 |
| Unutilized Land | 0.10 | 0.10 | 0.2 | 0.2 | 0.2 | 0.1 | 0.3 |
Table 4.
Environmental quality standards for surface water (GB3838-2002) Unit:mg/L.
| Parameter | Class I | Class II | Class III | Class IV | Class V |
|---|---|---|---|---|---|
| Total Nitrogen (≤) | 0.2 | 0.5 | 1.0 | 1.5 | 2.0 |
| Total Phosphorus (≤) | 0.01 | 0.025 | 0.05 | 0. 1 | 0.2 |
Table 5.
Water quality and habitat quality status in the Yangtze River Basin and its upper, middle, and lower reaches.
Table 5.
Water quality and habitat quality status in the Yangtze River Basin and its upper, middle, and lower reaches.
| Region | Parameter | Total Nitrogen (mg/L) | Total Phosphorus (µg/L) | TN/TP | TLI | HQ |
|---|---|---|---|---|---|---|
| Entire Basin | Range | 0.1–3.4 | 6.1–139.3 | 8.1–216.3 | 14.1–65.4 | 0–0.5 |
| Mean | 1.3 | 40.4 | 45.2 | 43.5 | 0.2 | |
| Standard Deviation | 0.9 | 31.8 | 47.3 | 11.7 | 0.1 | |
| Water Quality Range | Class I–V | Class I–V | ||||
| Upper | Range | 0.1–3.4 | 6.1–62.2 | 16.1–216.3 | 14.1–65.4 | 0.1–0.5 |
| Mean | 1.3 | 26.1 | 66.2 | 43.5 | 0.2 | |
| Standard Deviation | 0.9 | 16.0 | 68.2 | 11.7 | 0.1 | |
| Water Quality Range | Class I–V | Class I–III | ||||
| Middle | Range | 0.7–1.9 | 6.4–139.3 | 8.8–139.6 | 25.2–59.4 | 0.0–0.3 |
| Mean | 1.1 | 44.2 | 44.8 | 36.6 | 0.2 | |
| Standard Deviation | 0.3 | 37.9 | 39.9 | 12.8 | 0.1 | |
| Water Quality Range | Class III–V | Class I–V | ||||
| Lower | Range | 0.5–1.7 | 6.4–139.3 | 8.1–109.0 | 28.6–62.6 | 0.1–0.4 |
| Mean | 1.0 | 48.6 | 29.3 | 47.4 | 0.2 | |
| Standard Deviation | 0.3 | 34.3 | 25.5 | 9.9 | 0.1 | |
| Water Quality Range | Class II–III | Class I–V | ||||
| Range | 0.5–1.7 | 77.5–138.6 | 8.1–29.3 | 28.6–63.6 | 0.1–0.4 |
Disclaimer/Publisher’s Note: The statements, opinions and data contained in all publications are solely those of the individual author(s) and contributor(s) and not of MDPI and/or the editor(s). MDPI and/or the editor(s) disclaim responsibility for any injury to people or property resulting from any ideas, methods, instructions or products referred to in the content. |
© 2025 by the authors. Licensee MDPI, Basel, Switzerland. This article is an open access article distributed under the terms and conditions of the Creative Commons Attribution (CC BY) license (http://creativecommons.org/licenses/by/4.0/).
Copyright: This open access article is published under a Creative Commons CC BY 4.0 license, which permit the free download, distribution, and reuse, provided that the author and preprint are cited in any reuse.


