
Submitted:
12 January 2025
Posted:
13 January 2025
You are already at the latest version
Abstract
On media, television commercials (TVCs) play a significant role in shaping societal perceptions of gender roles. This study examines gender depictions in Indian TVCs, focusing on key dimensions such as gender ratio in primary characters, voiceovers, settings (home, outdoor, workplace), and product categories. A content analysis of 120 TVCs from Indian brands (2011–2020) was conducted, with coding performed by the researcher. Findings reveal that men were primary characters in 54.6% of the advertisements, while women featured in 45.4%. Male voiceovers dominated at 70.1%, compared to 29.9% for females. Women were portrayed in home settings in 66.7% of TVCs, while men appeared in 33.3%. Outdoor settings showed no significant gender difference, contrary to expectations. In workplace settings, men exclusively appeared (100%), with no representation of women. Product categories linked women predominantly to household and healthcare products, while men dominated categories like banking, technology, and transportation. This study bridges gaps in research on gender representation in media within the diverse cultural context of India. Findings are contextualized using Social Learning Theory and highlighting the potential societal impacts of stereotypical gender portrayals in advertisements.
Keywords:
Indian TVCs
; YouTube content analysis
; gender and TVCs
; quantitative content analysis
; gender portrayal
1. Introduction
When it comes to mass media, television commercials or TVCs considered powerful tools. TVCs influence buying behaviors, produce messages, entertain people, convey information, and market and publicize a product. Over the years, one of the biggest concerns among communication scholars is how TVCs represent genders (Furnham & Mak, 1999; Kim & Lowry, 2005; Silverstein & Silverstein, 1974; Milner & Higgs, 2004) and thus play a vital role in reinforcing gender stereotypes, perpetuating traditional roles, and presenting unrealistic and cliché images of femininity and masculinity (Milner & Higgs, 2004; Valls-Fernández & Martínez-Vicente, 2007), which are even harmful in many aspects. Advertisements plays a vital role on the perceptions men deem valid regarding their gender identities. Although they may take their references from various sources, including family, peers, sports, and other media, men persist in reaffirming the messages disseminated by markets (Zayer, et al., 2019).
India being the second largest populated country in the world, with a population of more than 1.4 billion (Nationsonline.org, 2022), a hub of cultural richness and diversity, which also contains 22 officially recognized languages and 398 dialects, the impact of television and its content on the audience has a vast impact on Indian society. Between 2011 and 2020, India witnessed a substantial change in advertisements' substance and message quality. Over the past ten years, the material quality in many TV commercials has improved significantly, and the trend is ongoing (Gupta & Siri, 2021). Nevertheless, how much of that change is reflected in gender portrayals? This study explores how the Indian TVC industry has depicted differences in gender representations from 2011 to 2020.
The root of the differences in gender portrayals in Indian TVCs is planted in societal norms and expectations. For instance, by applying content analysis, Matthes et al. (2016) found that a country's culture significantly impacts how gender roles are portrayed in media. Due to cultural and historical factors, India's patriarchal society plays a significant role in portraying gender in the media (Roy, 1998). TVCs are a powerful medium of communication. They reflect and strengthen these societal norms, forming the audience’s understanding of gender roles. For example, after the qualitative content analysis of 210 Indian TV commercials, Prasad (1994) found that most advertisements showed women as housewives, mothers, or sisters instead of individuals. On the other hand, in Indian TVCs men are shown in more vital positions, such as decision-makers in Indian TV commercials (Sarkar, 2015). Promoting gender differences is a barrier to overcoming gender stereotypes in the media.
By analyzing television advertisements from 2011-2020, this study explores how gender representations between males and females are differentiated in Indian TVCs. Since this study was conducted in 2023, and by this time, most of the TVCs from the sample are not currently circulated on the TV channels anymore, TVCs were collected from YouTube. Combining this analysis with the application of previously known variables from the past, this study tries to minimize the gap in the less-researched topic of gender representations in developing and underdeveloped nations. This global viewpoint is crucial because it offers a more comprehensive picture of the field, which is still dominated mainly by research from the Western and more developed nations (Prieler & Centeno, 2013). This research does not claim to measure the effects of how TVCs influence the spread of gender stereotypes. However, given the quantitative content analysis method this study will use, those findings can serve as a helpful starting point for research into one of the many social effects that media can have.
2. Historical Background
It was the resurgence of the women’s movement in the 1960s that raised a voice on the portrayal of women in the mass media (Rakow, 1986). This was when the feminists successfully called attention to the differences between social and biological aspects between men and women. Advertisements came under the scrutiny of the feminists because of the stereotypical and unrealistic depiction of women as sex objects, happy homemakers, dependent on their husbands, incompetent, and in ornamental roles (Courtney & Whipple, 1983; Ferguson et al., 1990, Lee, 2004; Milner & Higgs, 2004). Women were seen to be restricted to duties related to their "place" in the home, such as wife, mother, sex object, and housekeeper, whereas men were discovered to be free to go everywhere else (Welter, 1966). However, it was not until 1970s that large number of studies were systematically conducted to explore the link between portraying males and females in media and promoting gender stereotypes (Courtney & Whipple, 1983). According to Ahlstrand (2007), one of the pioneering studies of gender representation in television advertisements was conducted by McArthur and Resko (1975). The scholars analyzed 199 randomly selected American TVCs quantitatively (Ahlstrand, 2007). They developed a coding scheme to analyze seven variables: sex, product user, product authority, role, setting, product category, and scientific/non-scientific roles. This coding scheme was the most used worldwide in similar studies applying the same or revised coding scheme, particularly when the researchers wanted to see the comparisons within and between different countries and the prominent advertising trends (Ahlstrand, 2007). Subsequent studies in the backdrop of relatively modern times also showed similar findings. As Grau and Zotos (2016) showed in their meta-analysis of scholarships related to gender stereotypes, women are often portrayed as weak and second-class citizens in advertisements (Ahlstrand, 2007). Women are represented in the media as submissive, inferior, intellectually, and physically dependent on men as wives, or in the roles of mothers, and as objects of male sexual fulfillment (Chant & Mcilwaine, 1995); motionless, aesthetic models whose roles are many a times ornamental (Lee, 2004). Alternatively, men are shown as being dominant and making decisions (Lee, 2004), experts in the workplace, the narrator of decisions about the home, economy, and family (Sarkar,2015). Also, men are mostly portrayed as authoritative, independent, more persuasive than women (Van Hellemont & Van den Bulck, 2012), and found in occupational settings more than women (Furnham & Voli, 1989). This study will apply Social Learning Theory to understand the portrayal of gender in Indian TVCs from 2011 to 2020.
Social Learning Theory
Three essential aspects of Albert Bandura’s (1977) Social Learning Theory (SLT) are observation, behavioral modeling, and reinforcement. In this study’s context, if the concept of Observation is considered, which says people learn by observing and imitating others, in that sense, when people are projected to gender stereotypical narratives among the advertisers, they start mimicking those behaviors in their real lives. Marketers rely on and reproduce the stereotypes that exist in society via TVCs to reach their target audience (Iember, 2019). Consumers are exposed to different kinds of advertisements on different media, and certain thinking patterns emerge among them (Iember, 2019). Eisend (2010) showed that even though TVCS s portray societal reality, how they portray gender can still have the power to reinforce gender stereotypes in society. Thus, constant exposure to TVCs over time can result in the internalization of such stereotypical gender roles and societal expectations. The ideal image of each gender promotes stereotypes and sexism in society because those representations lead to certain expectations that are reflected on the TV screen in the form of TVCs.
Secondly, SLT’s behavioral modeling concept states that people imitate behaviors if those who model behaviors in media are credible or prominent figures. This is highly relatable to this study because it is common for TVCs to hire reputed people or celebrities to promote the products. When lay audiences see attractive, established, or prominent people depicting gender stereotypical behaviors, they will adopt those behaviors, considering them as expected and even desirable. Consumers watch, listen, observe, and want to consume what celebrities endorse because of attractiveness, trustworthiness, and expertise (Sertoglu et al., 2013).
Thirdly, Reinforcement happens when these kinds of TVCs gain popularity, sales increase, or creators/modesl receive positive feedback. Then, the gender differences that the advertisements promote remain unnoticed and unchallenged and blend with naturally ingrained stereotypes; thus, the circle continues, a process shown by Signorielli & Bacue (1999). Consumers subconsciously take part in reiteration of the sex-roles created by the TVCs (Zayer et al., 2019).
Considering all the above-mentioned aspects, numbers establish numerical differences and systems of worth that rank people or organizations according to better or worse/more or less (Mau, 2019). According to Hofstede’s Masculinity Index (2013), India’s score is 56, the fourth Asian masculine country, preceded by Japan, China, and the Philippines. Media consumers observe this numerical superiority of males over females daily through the TVCs. In that case, chances are high that the advertisers, who are also a part of the same population, will emphasize portraying the male predominance on screen more than the females as the primary characters. Research has found that male characters comprise most of the primary characters in TVCs (Eisend, 2010; Furnham & Paltzer, 2010; Ganahl et al., 2003; Santoniccolo et al., 2023). Based on these findings, the first hypothesis is:
H1:
More males than females will appear in Indian TVCs as primary characters.
One of the most used variables in studying gender representation in TVCs is voice-overs (Matthes et al., 2016). A robust finding in the research is the prevalence of male voiceovers, which are frequently regarded as the "voice of authority" (Silverstein & Silverstein, 1974; Van Hellemont & Van den Bulck, 2012). Studies often find the predominance of male voiceovers over female voiceovers in TVCs (Furnham & Paltzar, 2010; Furnham & Voli, 1989; Matthes et al., 2016; Prieler & Ceteno, 2013; Valls-Fernández & Martínez-Vicente, 2007). Furnham and Mak (1999) found this aspect more evident in Asia than elsewhere. Hence, the second hypothesis is:
H2:
There are more male voiceovers than females in Indian TVCs.
Including the precise form and type of the portrayals may disclose the society's respect or lack thereof for a particular social group because numerical representation alone does not indicate the quality of the representations (Signorielli & Bacue, 1999). In India, although more women are working than ever before, the patriarchal family structure and societal values remain essentially unchanged (Roy, 1998). Eisend (2010) showed in his meta-analysis of television and radio advertisements that the chances of women being depicted at home are 3.5 times higher than men being shown at home. Men are most depicted in the public realm of employment, while women are restricted to a life of domesticity and family, a home setting (Das, 2010; Knoll et al., 2011; Prieler & Centeno, 2013; Roy, 1998). Regarding the occupation of the primary characters, several studies have revealed highly stereotypical findings showing women as homemakers (Lee, 2004; Santoniccolo et al., 2023) and men as working characters (Arima, 2003; Santoniccolo et al., 2023). Sarkar (2015) argues that the Indian TVCs for a wide range of products, from bathing soap to cuisine spices, portray women as homemakers who show their skills in household chores. Also, the Hindu religion, the ancient code of Manu, and the ancient ideology of “Pativrata” (i.e., a woman who is sincerely obedient to her husband) in the Hindu religion have invoked women to be dependent from the cradle to the grave. Hence, the following are hypothesized-
H3a:
More females than males will be depicted in home settings in Indian TVCs.
H3b:
More males than females will be depicted in outdoor and workplace settings in Indian TVCs.
There are few consistent findings and gender portrayals which could be because different research frequently uses different product categories (Prieler & Centeno, 2013). Most studies showed a strong connection between women and home and household products such as toiletries, cosmetics, household, and cleaning products (Furnham & Paltzer, 2010; Arima, 2003), and cooking products such as rice, oil, or cuisine spices (Sarkar, 2015). On the other hand, men are portrayed in television advertisements for telecommunication, electronics, computers, technology, cars (Das, 2010; Furnham et al., 2000; Ganahl et al., 2003; Matthes et al., 2016), agricultural, industrial goods, bikes (Sarkar, 2015), medical, and financial services (Rubio, 2018; Sarkar, 2015). Thus, the following hypotheses are offered-
H4a:
More females than males will be depicted in Indian TVCs for home and household products.
H4b:
More males than females will be associated with the TVCs of banking and technology, development, healthcare, and transportation in Indian television advertisements.
3. Method
The current study aims to identify the gender representations employed in TVCs in India between 2011 and 2020 and applies the content analysis method as a research approach. The lead author used a purposive sampling strategy based on specific inclusion and exclusion criteria during the fall of 2023. A total of 120 TVCs were analyzed based on their prominence in the commercial sector. This study chooses a sample size of 120, keeping the exclusion criteria in mind. The sample size is enough to have statistical power to identify the trends in a decade and makes it manageable to analyze each advertisement thoroughly.
There was no fixed number of advertisements for any category. Coding instruments were developed to gather data to answer the hypotheses posed. After that, the lead author beta-tested a sample frame to ensure that the coding sheet met the criteria of the variables that were being analyzed. These details are provided in the Coding & Analysis section of the Method chapter.
3.1. Sampling Strategy
Since the time frame for this study is 2011-2020, and this study is being conducted in 2023, these TV commercials are not being circulated on Indian television channels anymore. For the subject of analysis and categorical evaluations, there is no secondary or third party. As a result, no inter-coder evaluation and reliability measures are reported.
Multiple contextual factors contributed to the decision of choosing this time frame of 10 years instead of limiting it to 2011-2015 or 2016-2020. It is understood that changes in societal conventions, technical improvements, and consumer tastes can all substantially impact how TVCs change in ten years. For example, Indian TVCs from 2011 to 2015 focused on showcasing creative storytelling, delivering socially responsible messages, content diversity, etc. Television is still the primary and the most popular platform for delivering entertainment, information, and advertisements (Bhavsar, 2018). Whereas the latter half of the timeframe of this study, 2016-2020, witnessed characteristics such as digital transformation, digital analytics, user-generated content, etc. (Bhavsar, 2018) in Indian television advertisements. It is in July 2015, when the Government of India (GOI) launched Digital India as a campaign to ensure that the Indian citizens can avail government services electronically by improved online infrastructure, increasing internet connectivity or by making the country digitally empowered in the field of technology (Singh, 2019). Hence, it is easily assumable, more than the time frame 2011-2015, marketers and consumers will have increased access to and use of video sharing platforms such as YouTube, Dailymotion, or social networking sites in the timeframe of 2016-2020 and the usage have only increased with each passing year. Selecting a decade will result in a more diverse sample. The lead author collected the Indian TV commercial advertisements from YouTube. To ensure accuracy and ease of access to commercial advertisements via digital platforms such as YouTube, the coding sheet included the YouTube link for each advertisement.
3.2. Video Characteristics
Apart from the variables such as primary character, voice-overs, setting, and product category as the units of analysis of this study, additional sample characteristics were coded, that include: serial number of videos, brand name, product category, channel/uploader’s name, channel/uploader type (product’s official YouTube channel, or ad-making agency who made that particular advertisement, or a person), number of channel subscribers, year of release, number of views, and number of likes. TVCs were uploaded from both organizational and individual YouTube account holders. To ensure the accuracy of the TVC release year, each channel was studied individually to check if they have uploaded advertisements consistently (with an interval of 6-12 months) since their YouTube channel was opened. If it was found that uploads were consistent and the channel is up to date, the upload year was taken as the advertisement’s actual release year. The advertising agencies most usually upload advertisements with primary information such as product name, release year, length of the advertisement, etc., either at the very beginning or in the description box. For the official YouTube channels of the product, the upload date was taken as the TVC’s release date. For the individual persons as the uploaders, usually, if the uploader is somebody directly involved with that TV commercial advertisement as a model or composer/singer of the jingle, they mention the timeline the same way the advertising agencies do, as described above. If not, the timing of their upload was cross-matched with the product’s official launch date from their website, and that information was mentioned in the “comment” column with the available link. If any advertisement’s release time was not possible to verify in either of these manners, the TVC was excluded from the sample.
3.3. Coding & Analysis
The gathered data was quantitatively analyzed using descriptive and inferential tests such as chi-square. Data collection took place over a four-week period during July 2023. The coding sheet was developed based on the previous studies conducted by Nassif and Gunter (2008) and Prieler and Centeno (2013). The units of analysis in this study are primary character, voice-over, settings of the primary character, and product categories.
3.4. Primary Character
A primary character is characterized as someone that is at 18 years old and appears on camera for at least three seconds while speaking or being prominently featured (Prieler & Centeno, 2013). When multiple characters receive the same importance, the primary character is, according to the method offered by Nassif and Gunter (2008), determined by who (1) was central to the story, (2) appeared in close-ups for the longest time, (3) appeared for the longest time, (4) provided substantial information about the advertised good or service, (5) used or held the good, and (6) had the more extensive speaking part.
3.5. Voice-Overs
Voice-overs add value to the TVCs by supporting storytelling, narratives, etc. Voice-overs included the voices of people who are not seen (Prieler & Centeno, 2013). Voice-overs exclude jingles, children’s voices, and primary characters’ dialogues.
3.6. Character Settings
Character settings of the primary characters were coded as: workplace, home, other indoors (restaurant, gym, car, bus, super shop, etc.), outdoors (parks, streets, open market, stadium, beach, mountain, etc.), and others (artificial set) (Prieler & Centeno, 2013).
3.7. Product Categories
Six categories of products were analyzed that included: Home/household products (e.g., toiletries and cosmetics, cleaning products, and cooking products); Banking and technology products (e.g., banks, financial institutions, insurance companies, technology products such as gadgets, electronics products, etc.); Development (e.g., industrial products, construction materials, and real estate); Healthcare (e.g., healthcare products, hospitals, health technologies); Transportation (e.g., vehicle, airline, travel/tourism); and finally, Others which categorizes products that did not fall under any of the above categories.
3.8. Exclusion Criteria
TVCs featuring political campaigns, public services, announcements, commercial advertisements featuring children or cartoon figures as the primary characters, and advertisements lacking a human presence were excluded from this study. More than one TVC from the same brand is also excluded. This study also excluded non-Hindi TVCs because Hindi is the largest official language in India, which is spoken by 528 million people (Kanwal, 2020), and because of the lead author’s expertise in Hindi Language. Table 1 summarizes the variables, names codes, and definitions of the terms.
3.9. Quantitative Methodological Analysis of Data
To answer the hypotheses presented about the differences in the prominence of a specific gender across different variables such as primary characters, voice-overs, settings, and product categories, quantitative statistics were used. The findings of this study used chi-square tests of the advertisements collected because most variables are categorically and nominally structured.
4. Results
The results of this study were based on chi-square analysis and descriptive statistics that were performed on a total of 120 unduplicated Indian television advertisements as samples. Samples were collected from video-sharing platform YouTube. Collected samples consist of 40% home/household (n=48), 24% banking and technology (n=29), 13% finance (n=16), 10% development (n=12), 6% healthcare (n=8), and 0.05% other (n= 7) category of products. Approximately 33% of these commercials were uploaded by the advertisement agencies who were directly involved in the production of those advertisements (n=40), 59% were uploaded by the products’ official YouTube channels (n=71), 8% were uploaded by the individuals who were either costume designer or model of the TVC, or random individual uploaders, who mentioned the advertisement circulation date in the headline, or in the description, or their upload date is matched with the product’s official launch date (n= 8%).
The TVCs in this study averaged M= 1483425 views M= 3165.1 likes, with the YouTube Channels average M= 175094 of subscribers.
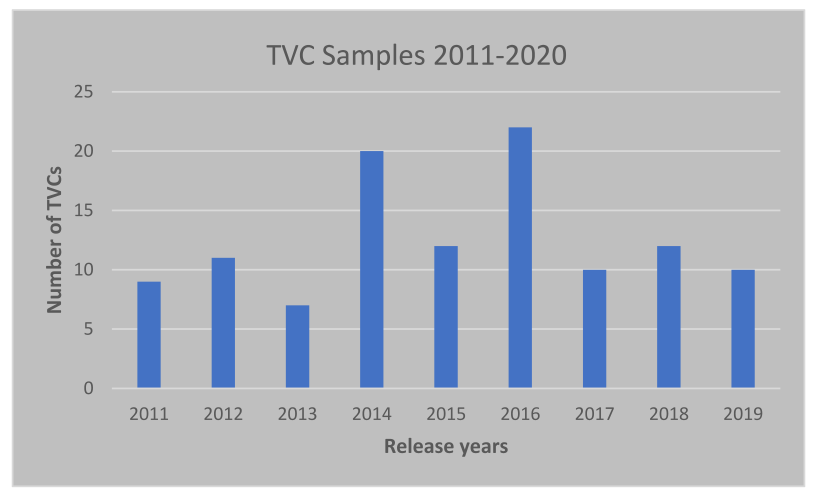
The samples contain 7 TVCs from 2011 (5.8%), 9 TVCs from 2012 (7.5%), 11 TVCs from 2013 (9.1%), 7 TVCs from 2014 (5.8%), 20 TVCs from 2015 (16%), 12 TVCs from 2016 (10%), 22 TVCs from 2017 (19%), 10 TVCs from 2018 (8.3%), 12 TVCs from 2019 (10%), and 10 TVCs from 2020 (8.3%). The chart below presents an at-a-glance picture of the number of TVCs collected for this study that were released between 2011-2020-
H1 hypothesized that more males than females will appear in Indian television advertisements as primary characters. To test this hypothesis, descriptive statistics were computed. In the total sample of n=120, advertisements with a primary character were n=108. Males scored higher (N= 59, 54.6%) than females (N=49, 45.4%) as primary characters in Indian television advertisements. The findings from this test support H1.
To test H2, which hypothesized there will be more male voiceovers than female voiceovers in Indian television advertisements, a chi-square analysis was conducted. The result found significant differences χ2 (1, N = 89) = 32.20, p <.001 (See Table IV-2 for crosstabulation) between male and female voiceovers. Male voiceovers were significantly higher (69.7%) than female voiceovers (30.3%). This finding supports H2.
H3a hypothesized that more females than males are depicted in home settings in Indian television advertisements, a chi-square analysis was performed. The result found significant differences χ2 (1, N = 108) = 12.57, p < .001 (See Table IV-3 for crosstabulation) between male and female portrayal in home settings. Females were shown in home settings significantly higher (66.7%) than males (33.3%). Thus, H3a is supported.
To test H3b, which stated that more males than females will be depicted in outdoor and workplace settings in Indian television advertisements, a chi-square analysis was performed. The result found significant differences χ2 (1, N = 108) = 13.36, p <.001 (See Table IV-5 for crosstabulation) between male and female portrayal in workplace settings. Males were shown in workplace settings significantly higher (100%) than females (0%). This finding supports H3b. However, the second half of the hypothesis was not supported. No significant differences χ2 (1, N = 14) = .286a, p >.001 were found between males and females in outdoor settings. The male-female ratio was 60% and 40%, respectively, in outdoor settings.
To test H4a, which stated that more females than males will be depicted in Indian television advertisements for home and household products, a chi-square analysis was performed. The result found significant differences χ2 (1, N = 108) =37.32, p <.001 (See Table IV-6 for crosstabulation) between male and female portrayal in workplace settings. Females were shown in advertisements for home and household products significantly higher (80%) than males (20%). This finding supports H4a.
To test H4b that more males than females will be associated with the advertisements of banking and technology, development, healthcare, and transportation in Indian television advertisements, a chi-square analysis was performed for each category. The result found significant differences χ2 (1, N = 108) = 19.84, p <.001 (See Table IV-6 for crosstabulation) in banking and technology category; χ2 (1, N = 108) = 10.17, p <.001 in development category; and χ2 (1, N = 108) = 10.52, p <.001 in transportation category between male and female portrayal. In banking and technology, development, and transportation categories, males (95.70%, 100%, and 93.30%, respectively) were depicted as significantly higher than females (4.30%, 0%, and 6.70%, respectively). However, the hypothesis was not supported in the health category. No significant differences χ2 (1, N = 108) = 3.06, p >.001 were found between males and females in this category of advertisement, which leads H4b to be partially supported.
5. Discussion
Empirical evidence and studies suggest that the stereotypical portrayals of gender are widespread in television advertisements (Eisend, 2010; Furnham & Mak, 1999; Ganahl et al., 2003; Matthes et al.,2016). Gender stereotyping is ubiquitous in Indian television advertisements as well, and a byproduct of such stereotyping is the increasing cultural pressure on women to represent themselves and behave in a certain way in real life (Sarkar, 2015). Advertisements perpetuate patriarchal ideologies through verbal and non-verbal cues and symbols to sustain a consensual ideology that is accepted by the majority members of that society (Roy, 1998), as SLT posits. In the context of India, most of the studies that are conducted in the field of Indian television advertisements have focused on either women’s portrayal, or they are qualitative in nature. Given such, this study is novel, because it gives a glimpse of how the TVC field is portraying gender in disproportionate way and with quantitative analysis.
Numerical representation and product categories will be discussed together because the former leads to the latter. There is a connection between Hofstede’s Masculinity Score and numerical representation of male character’s predominance over female characters (Millner & Collins, 2000). These findings support prior studies. There was a significant difference between male and female representation in Indian television commercials and each genders’ association with certain product categories. Traditional gender norms and assumptions that portray males as the main breadwinners and decision-makers and women in caregiving roles (Das, 2010) have long shaped Indian society. Due to these prejudices, male protagonists who exude prosperity, authority, or leadership are frequently preferred in TVCs. Additionally, family values and relationships are highly valued in Indian culture (Das, 2010). As per Hofstede’s Cultural Dimension (2001), India is a high-power distance country with a score of 72. Such power distance is reflected in frequencies of gender representations in the TVCs. A big reason behind the males outnumbering females as the primary characters could be, as Neale et al. (2015) argued, both male and female customers equally accept products and brands associated or endorsed by males. But males have a rejection tendency towards feminine products or brands which target females. For example, a car that targets the female base (Neale et al., 2015). This could be a reason behind advertisers recruiting male models as the primary characters more
The predominance of male characters in Indian TVCs leads to the next part of the discussion, which is product categories. This study reveals significant differences in the portrayal of gender across product categories. Women are heavily featured in the advertisements of home/household product categories such as toiletries, cleaning, cooking products, etc. The rest of the categories, such as banking, technology, transportation, and development, were heavily dominated by men, and women are notably underrepresented. Even though in health categories, women outnumbered men as primary characters, they are mainly shown as either moms who are concerned about the health of their family members or as housewives who get body aches due to doing chores all the time, instead of showing them in high-status roles such as medical professionals. According to Gender bias & inclusion in advertising in India (2021), women only represent 11% of workers in healthcare. Hence, the number of women outnumbering men in the health category of advertisements was unexpected.
The reason behind such stereotypical representations in product categories could be, as Wolf (2009) suggested, that the expression of modern feminism works differently in India. Indian women view equality as something family-centered instead of individual-centered, and still, they prioritize family and value their roles at home. That is why it is believed that household products will draw more consumers if females market them in television commercials as primary characters. By doing so, these advertisements uphold traditional gender roles for women in society. Product categories such as banking and technology, development, and transportation categories of products overall showed significant differences between male and female representation because these industries have historically been male dominated. The quote, "Home and childcare taste sweeter to women while business and profession taste sweeter to men," has long enjoyed unquestioning social acceptance in Indian society (Sivakumar & Manimekalai, 2021). In India, men are socially grown in such ways, that prepare them for management and leadership roles characterized by competitiveness, aggression, and risk-taking behaviors (Sivakumar & Manimekalai, 2021).
Categories such as health and development were not found to be used by previous studies conducted in a similar method; hence, a comparison was not possible to make. However, this speaks of the novel value of the present findings.
Regarding voiceovers, as Paek et al. (2010) showed, there is a connection between a higher masculinity rate and a higher number of male voiceovers, and that trend is more prevalent in Asia and Africa (Furnham & Mak, 1999; Grau & Zotos, 2016). Also, in this study, it is noticed that there is a close association between the gender of the primary characters of the TVCs and voiceovers, Eisend, 2010; Paek et al., 2010). The number of male primary characters is higher almost in each product category, apart from the home and household, and health products, that is the reason the number of male voiceovers is significantly higher than the female voiceovers. One reason behind this could be, male voice is often associated with authority (McArthur & Resko, 1975; Silverstein & Silverstein, 1974).
When it came to character settings, prior works have found women in home settings (Furnham & Paltzer, 2010, Das, 2011) and men in workplace settings (Prieler & Centeno, 2013), and some studies found men in outdoor settings more than women (Prieler & Centeno, 2013; Furnham & Voli, 1989; Milner & Riggs, 2004; Valls-Fernández & Martínez-Vicente, 2007). The cultural norms in India dictate that women should be modest and reserved. As discussed in this study several times, Indian society is mostly traditional. Hence, advertisements portray women in a home setting to create a benchmark for the ideal Indian woman who is devoted to her family and the homemaker role.
Like many other patriarchal societies, there is still a disparity in the labor force (Gender bias & inclusion in advertising in India, 2021), working environment, and pay rate between men and women (Dutta, 2017;). Historically, too, there have been limited opportunities for women. However, this study did not find significant differences between men and women in outdoor settings, probably because technological and generational change is occurring so are the consumers’ tastes and lifestyles.
Albert Bandura's Social Learning Theory (1977) emphasizes the role of imitation and observational learning in forming behavior and beliefs. Advertisers frequently create their content with a particular audience in mind. For instance, since men are more likely to be involved in car buying decisions than women, advertisers who are marketing cars may choose to include a male primary character in their advertisement. This is how the advertisers and marketers trust the established gender stereotypes to create relatability with the audience (Santoniccolo et al., 2023). They observe these stereotypes, reproduce them on screen and reinforces the same. By the repetition of the same pattern in narratives, the TVCs have the potential to make the audience model those behaviors in their real lives and reproducing the social learning. One of such production and reproduction of learning could be demeaning or neglecting women’s financial contribution which is reflected in this study’s finding. According to this study’s finding, 100% of the men were associated with workplace setting, where women’s ratio was 0% in the same.
The results of this investigation do not yield empirical support for a direct causal link between the depiction of gender stereotypes in commercials and the consequences of social learning. This study only proposes that these preconceptions may significantly impact the audience’s perception or belief system and the formation of social learning processes. Although the research does not provide evidence of a statistically significant effect on perception or social learning, it presents a theoretical framework proposing that gender stereotypes in advertisements may influence individuals' perception and social learning experiences. However, additional empirical research is necessary to establish definitive causal relationships between media consumers and self-concepts.
6. Limitations
Like any other study, this study also had several limitations. Firstly, it did not have intercoder reliability. Also, considering India’s cultural richness, only the study of Hindi advertisements might not give us the whole picture. Despite Hindi being the most prominent official language in India, there are 21 others officially recognized languages there. Thirdly, the strategy to select not more than one advertisement from each brand filtered out a vast number of advertisements since the sourcing platform was YouTube. For the sake of generalizability, 120 advertisements are not enough to study for a period of 10 years. A bigger sample size would have given us a more reliable picture. Another limitation was that the number of advertisements in each category and each year was not equal. Hence, every category might not have reflected the real scenario of India.
7. Future Research and Conclusions
This study reveals the presence of gender stereotypes in Indian television advertisements. The results found from this study confirm most of what the earlier studies have shown. Asian traditional countries demonstrate more gender stereotypes in comparison to their Western counterparts. Women are more likely to be shown in a home setting and are associated with the home and household products more than their male counterparts. Also, women are not considered to be dependable for voice-overs, which require specific characteristics such as authority and expertise. On the other hand, men are more likely to be featured in other categories of products such as finances, technology, automotive, etc., and they would also be depicted in workplace settings more than women and considered to be more reliable for voiceovers than their female counterparts.
Considering India’s vastness, such kinds of quantitative studies are surprisingly few. Hence, it can be a good steppingstone to explore further aspects of this topic. As Media Framing Theory holds, mass media may use different frames to show negative issues in a positive light and influences viewers’ perceptions of reality on different issues. For this study specifically, the media uses a gender frame, and to ensure a positive reception of their products among the consumers, they cash on the prevailing stereotypes. Repeated exposure to such stereotypes makes them a ready reference for the audience and strengthens their existing beliefs.
On the other hand, Social Learning Theory shows how the audience acquires gender stereotypical behaviors by observing and modeling them. Finally, those behaviors get reinforced by the audience’s acceptance of them. Specific to this study’s context, with the same process, gender stereotypical perceptions and attitudes become internalized in society.
Considering that Indian culture is highly diverse and vast, this country offers immense potential for conducting studies related to communication. In the future, other forms of media can also be added to this one, such as newspapers, magazines, social media, and so on. The quantitative findings from this study can be supplemented with qualitative elements such as interviews with the advertisers and consumers to know what motivates them to consume and produce gender-stereotypical content. Future research can also investigate the influence of such stereotypes on Indian children and adolescents. Furthermore, it is essential to measure the efficacy of various strategies aimed at challenging and mitigating gender stereotypes in Indian television advertisements. In the future, a longitudinal study can be conducted to analyze gender portrayal in India over time.
Funding
This research was conducted independently solely based on content analysis on YouTube. No financial backing was required or received.
Conflicts of Interest
I have reviewed the relevant policies and considered all potential factors. I can confirm that I have no conflicts of interest related to this matter. If circumstances change or any potential conflict of interests arise in the future, I will promptly disclose them in accordance with the required procedures.
References
- Ahlstrand, M. (2007). Gender stereotyping in television advertisements: A case of Austrian state. Retrieved from https://www.divaportal.org/smash/get/diva2:1018680/FULLTEXT01.pdf.
- Ambwani, V., M. (2022 Jun 24). Indian TV ad market to be fifth-largest by 2026; cinema to surge 38.3%. The Hindu Businessline. https://www.thehindubusinessline.com/companies/indian-tv-ad-market-to-be-fifth-largest-by-2026-cinema-to-surge-383-pwc/article65556739.ece.
- Annual Status of Education Report (ASER). (2020). Annual Status of Education Report (Rural) 2020. Retrieved from https://img.asercentre.org/docs/ASER%202020/ASER%202020%20REPORT/aser2020fullreport.pdf.
- Arima, A. N. (2003). Gender stereotypes in Japanese television advertisements. Sex Roles, 49(1/2), 81–90. [CrossRef]
- Bandura, A. (1977). Social learning theory. Prentice-Hall.
- Bhavsar, R. (2018). The burgeoning digital media consumption: A challenge for traditional television and advertising industries -An analysis. Amity Journal of Media & Communication Studies, 8(1).
- Chant, S. H., & Mcilwaine, C. (1995). Women of a lesser cost: female labor, foreign exchange, and Philippine development. Pluto Press.
- Courtney, A. E., & Whipple, T. W. (1983). Sex stereotyping in advertising. Lexington Books.
- Das, M. (2010). Gender role portrayals in Indian television ads. Sex Roles, 64(3-4), 208–222. [CrossRef]
- Desai, N., & Patel, V. (1985). Indian Women. Sangam Books.
- Dutta, S. (2017). Indian women in the workplace: Problems and challenges. 3(3), 152-159. International Journal for Innovative Research in Multidisciplinary Field. Retrieved from https://www.ijirmf.com/wp-content/uploads/2017/04/201703051.pdf.
- Eisend, M. (2010). A meta-analysis of gender roles in advertising. Journal of the Academy of Marketing Science, 38(4), 418–440. [CrossRef]
- Sertoglu, E. A., Catlı, O., & Korkmaz, S. (2013). Examining the effect of endorser credibility on the consumers’ buying intentions: An empirical study in Turkey. International Review of Management and Marketing, 4(1), 66–77. Retrieved on June 03, 2023 from https://www.econjournals.com/index.php/irmm/article/view/666.
- Ferguson, J. H., Kreshel, P. J., & Tinkham, S. F. (1990). In the pages of Ms.: Sex role portrayals of women in advertising. Journal of Advertising, 19(1), 40–51. [CrossRef]
- Furnham, A., & Mak, T. (1999). Sex-role stereotyping in television commercials: A review and comparison of fourteen studies done on five continents over 25 years. Sex Roles, 41(5/6), 413–437. [CrossRef]
- Furnham, A., Mak, T., & Tanidjojo, L. (2000). An Asian perspective on the portrayal of men and women in television advertisements: Studies from Hong Kong and Indonesian television. Journal of Applied Social Psychology, 30(11), 2341–2364. [CrossRef]
- Furnham, A., & Paltzer, S. (2010). The portrayal of men and women in television advertisements: An updated review of 30 studies published since 2000. Scandinavian Journal of Psychology, 51(3), 216–236. [CrossRef]
- Furnham, A., & Voli, V. (1989). Gender stereotypes in Italian television advertisements. Journal of Broadcasting & Electronic Media, 33(2), 175–185. [CrossRef]
- Geena Davis Institute on Gender in Media and UNICEF. (April 2021). Gender Bias and Inclusion in Advertising in India. Delhi. Retrieved from https://www.unicef.org/rosa/media/13816/file/Full%20Report%20-%20Gender%20Bias%20&%20Inclusion%20in%20Advertising%20in%20India%20-%20April%202021.pdf.
- Ganahl, D. J., Prinsen, T. J., & Netzley, S. B. (2003). A content analysis of primetime commercials: A contextual framework of gender representation. Sex Roles, 49(9/10), 545–551. [CrossRef]
- Grau, S. L., & Zotos, Y. C. (2016). Gender stereotypes in advertising: A review of current research. International Journal of Advertising, 35(5), 761–770. [CrossRef]
- Gupta, S. K., & Siri, V. S. (2021). Indian television commercials in transition: A study of new emerging practices. Journal of Mass Communication & Journalism, 11(3), 1-5. Retrieved from https://www.hilarispublisher.com/open-access/indian-television-commercials-in-transition-a-study-ofnew-emerging-practices.pdf.
- Hofstede, G. (2001). Cultures and Organizations: Comparing Values, Behaviors, Institutions, and Organizations across Nations (2nd ed.). Sage Publications.
- Hofstede, G. (2013). National cultural dimensions. Retrieved from http://www.geert-hofstede.com/.
- G. Iember (2019). Gender roles representation in television advertisements: Implications for the Nigerian girl-child and role modelling. Athens Journal of Mass Media and Communications, 6(1), 43–64. [CrossRef]
- Kanwal, S. (2020). India - most common languages 2011. Statistica. Retrieved July 29, 2023.
- Kim, K., & Lowry, D. T. (2005). Television commercials as a lagging social indicator: Gender role stereotypes in Korean television advertising. Sex Roles, 53(11-12), 901–910. [CrossRef]
- Knoll, S., Eisend, M., & Steinhagen, J. (2011). Gender roles in advertising. International Journal of Advertising, 30(5), 867–888. [CrossRef]
- Lee, C. W. (2004). Gender role stereotyping in television commercials -- the case of Singapore. Advertising & Society Review, 5(3). [CrossRef]
- Mau, S. (2019). Numbers matter! The society of indicators, scores, and ratings. International Studies in Sociology of Education, 29(1-2), 19–37. [CrossRef]
- Matthes, J., Prieler, M., & Adam, K. (2016). Gender-role portrayals in television advertising across the globe. Sex Roles, 75(7-8), 314–327. [CrossRef]
- McArthur, L. Z., & Resko, B. G. (1975). The portrayal of men and women in American television commercials. The Journal of Social Psychology, 97(2), 209–220. [CrossRef]
- Milner, L. M., & Higgs, B. (2004). Gender sex-role portrayals in international television advertising over time: The Australian experience. Journal of Current Issues & Research in Advertising, 26(2), 81–95. [CrossRef]
- Nationsonline.org, (2022). Countries of the world by population. Retrieved on July 22, 20203 from https://www.nationsonline.org/oneworld/population-by-country.htm.
- Nassif, A., & Gunter, B. (2008). Gender representation in television advertisements in Britain and Saudi Arabia. Sex Roles, 58(11-12), 752–760. [CrossRef]
- Neale, L., Robbie, R., & Martin, B. (2015). Gender identity and brand incongruence: When in doubt, pursue masculinity. Journal of Strategic Marketing, 24(5), 347–359. [CrossRef]
- Paek, H.-J., Nelson, M. R., & Vilela, A. M. (2010). Examination of gender-role portrayals in television advertising across seven countries. Sex Roles, 64(3-4), 192–207. [CrossRef]
- Prasad, N. (1994). A Vision Unveiled. Har Anand Publications.
- Prieler, M., & Centeno, D. (2013). Gender representation in Philippine television advertisements. Sex Roles, 69(5-6), 276–288. [CrossRef]
- Rakow, L. F. (1986). Rethinking Gender Research in Communication. Journal of Communication, 36(4), 11–26. [CrossRef]
- Roy, A. (1998). Images of domesticity and motherhood in Indian television commercials: A critical study. The Journal of Popular Culture, 32(3), 117–134. [CrossRef]
- Rubio, M. D. S. (2018). A multimodal approach to analyzing gender stereotypes in contemporary British TV commercials: “Women and men at work.” Poznan Studies in Contemporary Linguistics, 54(2), 185–221. [CrossRef]
- Santoniccolo, F., Trombetta, T., Paradiso, M. N., & Rollè, L. (2023). Gender and media representations: A review of the literature on gender stereotypes, objectification and sexualization. International Journal of Environmental Research and Public Health, 20(10), 1-15. [CrossRef]
- Sarkar, S. (2015). Gender stereotyping in product promotion: A dominant tool of advertising in Indian media. International Journal of Media, Journalism and Mass Communications 1(2), 1-12. Retrieved from https://www.arcjournals.org/pdfs/ijmjmc/v1-i2/1.pdf.
- Signorielli, N., & Bacue, A. (1999). Recognition and respect: A content analysis of prime-time television characters across three decades. Sex Roles, 40(7/8), 527–544. [CrossRef]
- Silverstein, A. J., & Silverstein, R. (1974). The portrayal of women in television advertising. Federal Communications Bar Journal, 27, 71-93.
- Singh, R. (2019, May 8). Digital India- campaign launched by the Government of India (GOI). CATKing Educare. Retrieved from https://catking.in/digital-india/#:~:text=Digital%20India%20was%20launched%20on.
- Sivakumar, I., & Manimekalai, K. (2021). Masculinity and challenges for women in Indian culture. Journal of International Women’s Studies, 22(5), 427–436. Retrieved from https://vc.bridgew.edu/cgi/viewcontent.cgi?article=2461&context=jiws.
- Valls-Fernández, F., & Martínez-Vicente, J. M. (2007). Gender stereotypes in Spanish television commercials. Sex Roles, 56(9-10), 691–699. [CrossRef]
- Van Hellemont, C., & Van den Bulck, H. (2012). Impacts of advertisements that are unfriendly to women and men. International Journal of Advertising, 31(3), 623–656. [CrossRef]
- Welter, B. (1966). The cult of true womanhood. University of Pennsylvania.
- Wolf, N. (2009). Afghanistan’s Feminist Revolution. https://www.project-syndicate.org/commentary/afghanistan-s-feminist-revolution.
- Zayer, L. T., McGrath, M. A., & Castro-González, P. (2019). Men and masculinities in a changing world: (de)legitimizing gender ideals in advertising. European Journal of Marketing. 54(1), 238–260. [CrossRef]

Table 1.
Variables and Coding Framework.
| Based on the sample and sampling strategy described and the hypotheses posed, the following section of the thesis documented the results, presented as the Results, followed by the Discussion and Limitations section | ||
| Variable | Code | Definition |
| Primary Character | Primary character 0 = No primary character 1 =Male primary character 2 = Female primary character |
A primary character is 18 and appears on camera for at least three seconds while speaking or being prominently featured (Prieler & Centeno, 2013). When multiple characters received the same importance, we identified the primary characters as one who (1) was central to the story, (2) appeared in close-ups for the longest time, (3) appeared for the longest time, (4) provided substantial information about the advertised good or service, (5) used or held the good, and (6) had the more extensive speaking part (Nassif & Gunter, 2008) |
| Voice-over | 0 = None 1 =Male 2 = Female 3 = Both |
The voices of those who could not be seen were heard through voiceovers. There were no children's voices or voices that could only be heard singing in voice-overs (Prieler & Centeno, 2013). |
|
Character Setting |
1= Home 2= Workplace 3= Other indoor 4= Outdoor 5= Other (artificial) |
The location where the main character first appears in the advertisement serves as the setting (Mastro & Stern, 2003). The dominant setting was coded if multiple settings were present. The main character's perspective was used to code the environment. For instance, the context would be "workplace" for a waiter serving food in a restaurant, but "other indoors" for the customer taking the service. (Prieler & Centeno, 2013) If the customer is the primary character, the setting would be coded as “Other indoors.” If there was no primary character and the TVC was a concoction of multiple stories in different settings, each introducing the product in their respective setting. The majority of the characters’ settings were counted. Ads where the primary character was seen in multiple settings, then the setting where the product was introduced was coded. |
| Product Categories | 1=Home/household products, 2=Banking and technology 3=Healthcare 4=Development 5=Transportation 6=Others |
Home/household products--toiletries, cosmetics, cleaning, and cooking products. Banking, technology, finance, gadgets, electronics, and insurance companies. Healthcare-- health care products, health technologies, hospitals. Development-- industrial products, construction materials, real estate. Transportation--vehicle, airline, travel, tourism Others-- General products that do not fall under the above categories. |
Disclaimer/Publisher’s Note: The statements, opinions and data contained in all publications are solely those of the individual author(s) and contributor(s) and not of MDPI and/or the editor(s). MDPI and/or the editor(s) disclaim responsibility for any injury to people or property resulting from any ideas, methods, instructions or products referred to in the content. |
© 2025 by the authors. Licensee MDPI, Basel, Switzerland. This article is an open access article distributed under the terms and conditions of the Creative Commons Attribution (CC BY) license (http://creativecommons.org/licenses/by/4.0/).
Copyright: This open access article is published under a Creative Commons CC BY 4.0 license, which permit the free download, distribution, and reuse, provided that the author and preprint are cited in any reuse.


