
Submitted:
10 January 2025
Posted:
13 January 2025
You are already at the latest version
Abstract
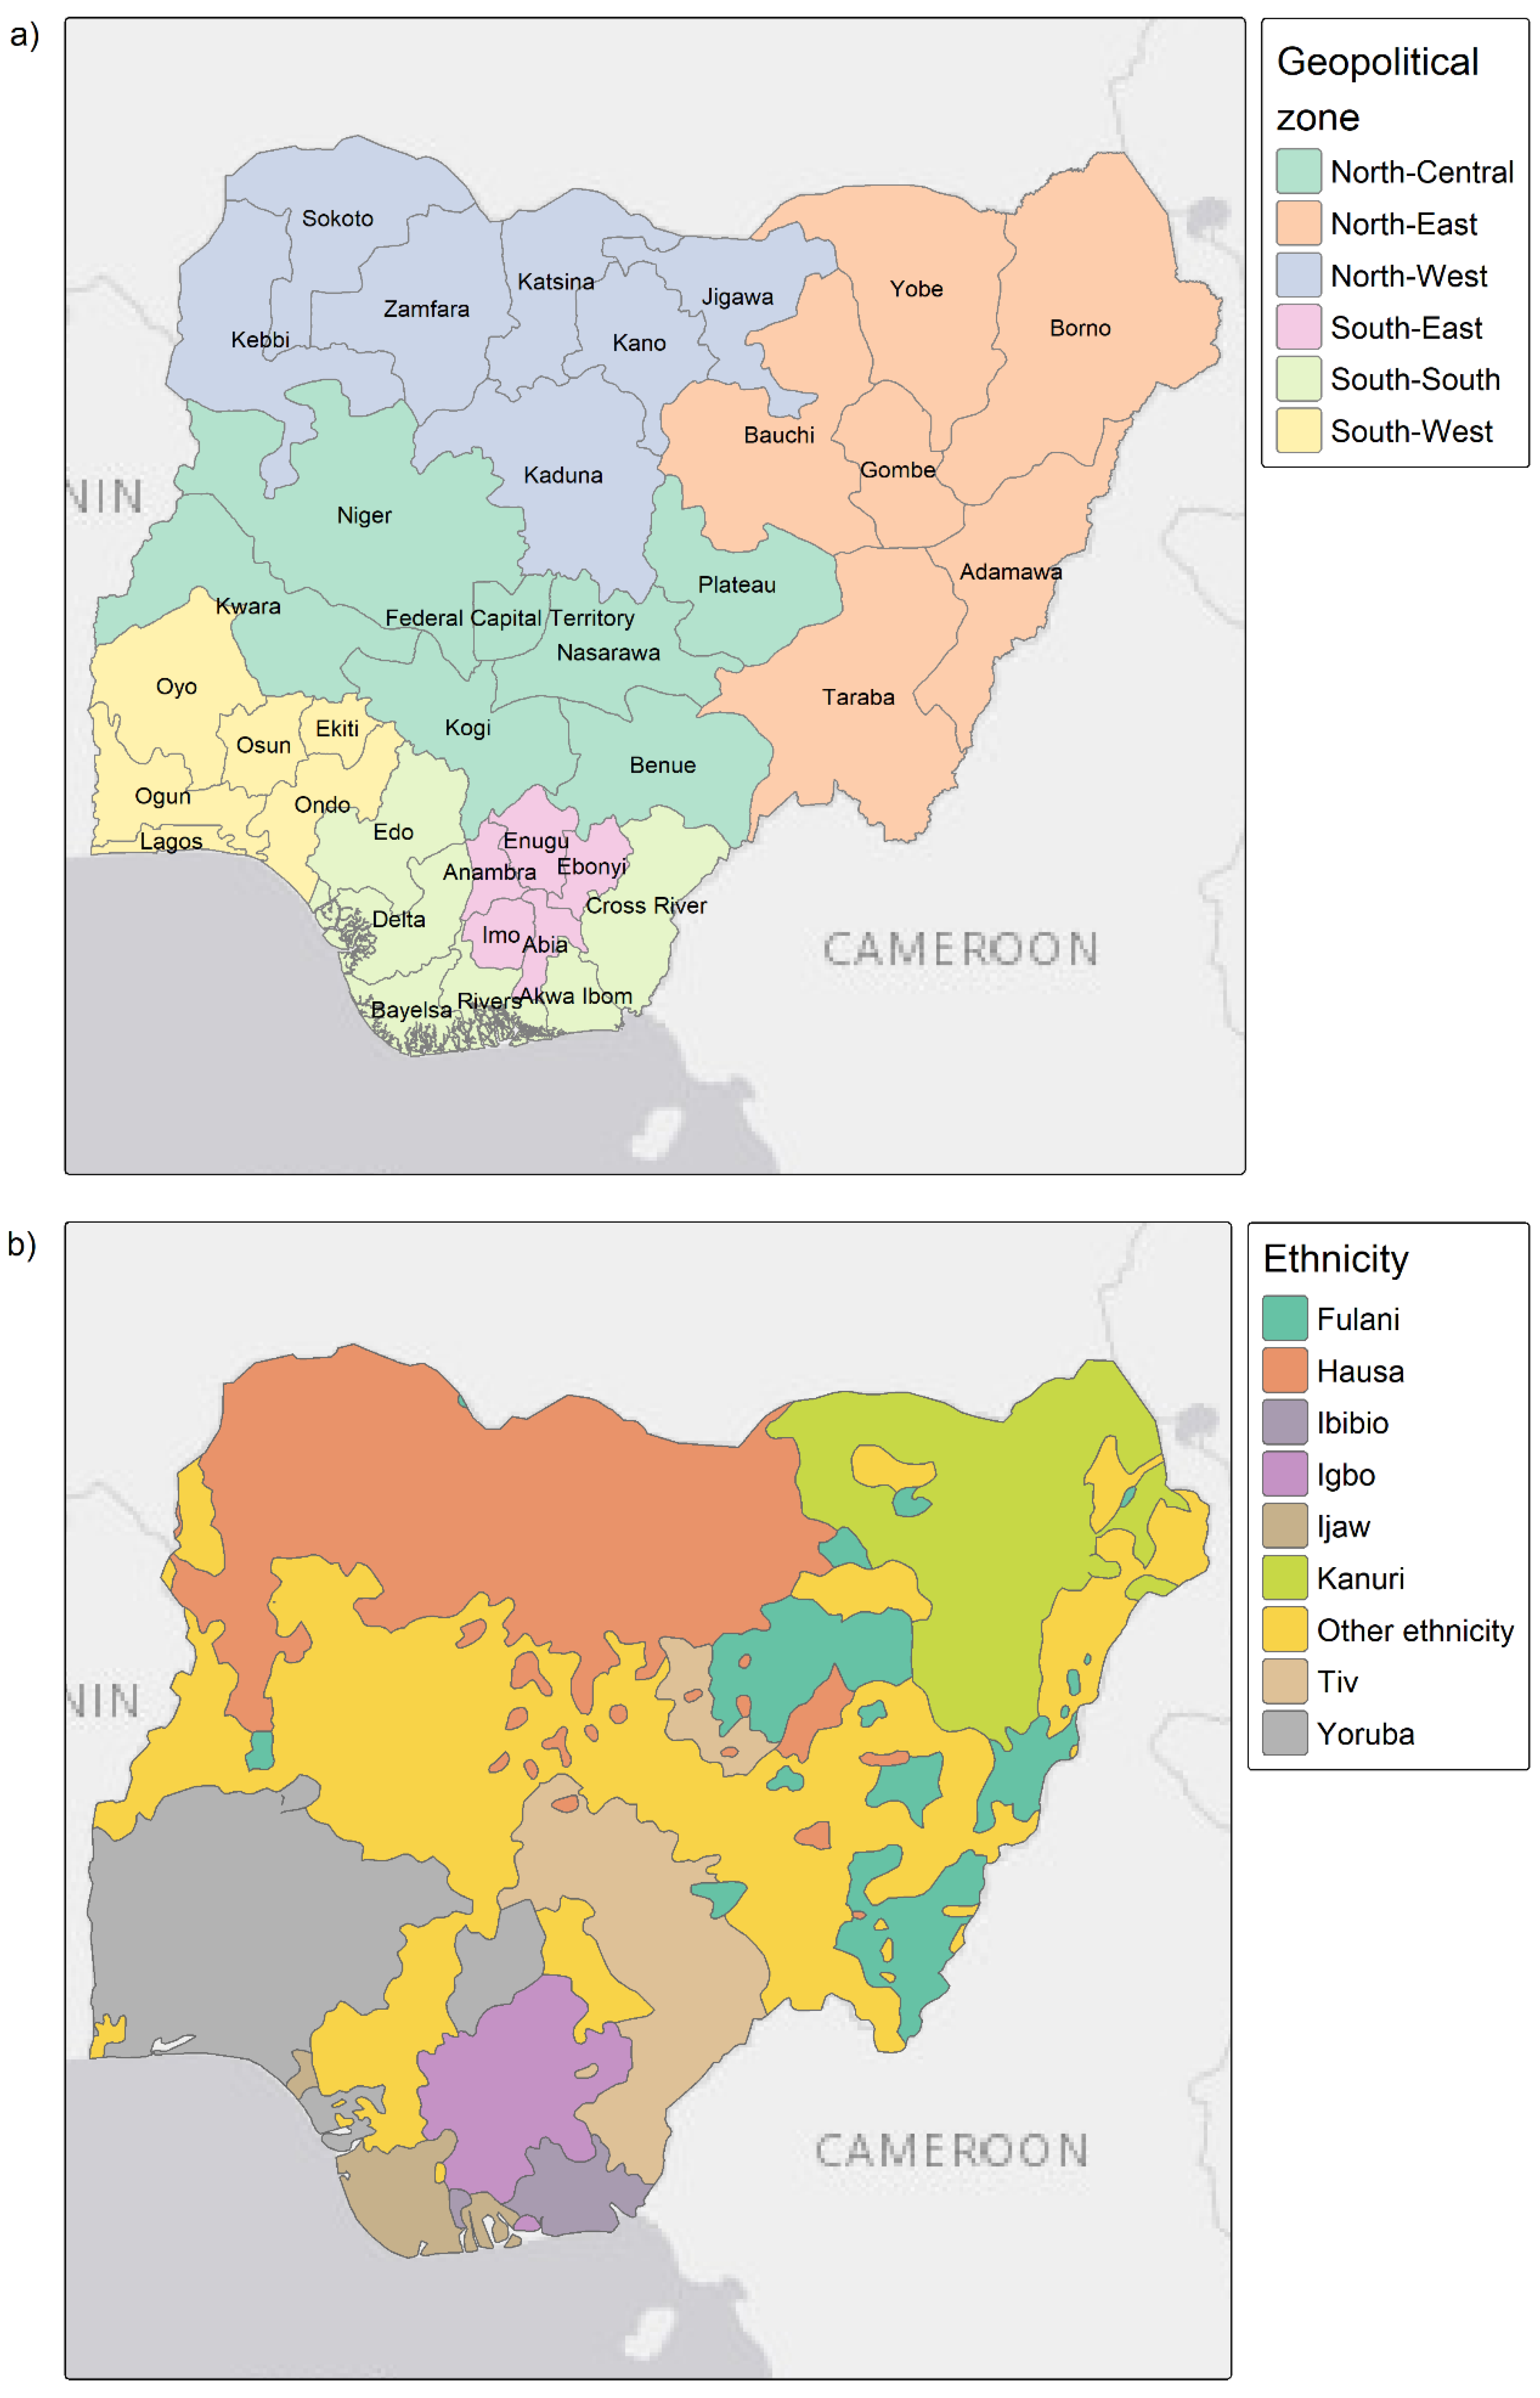
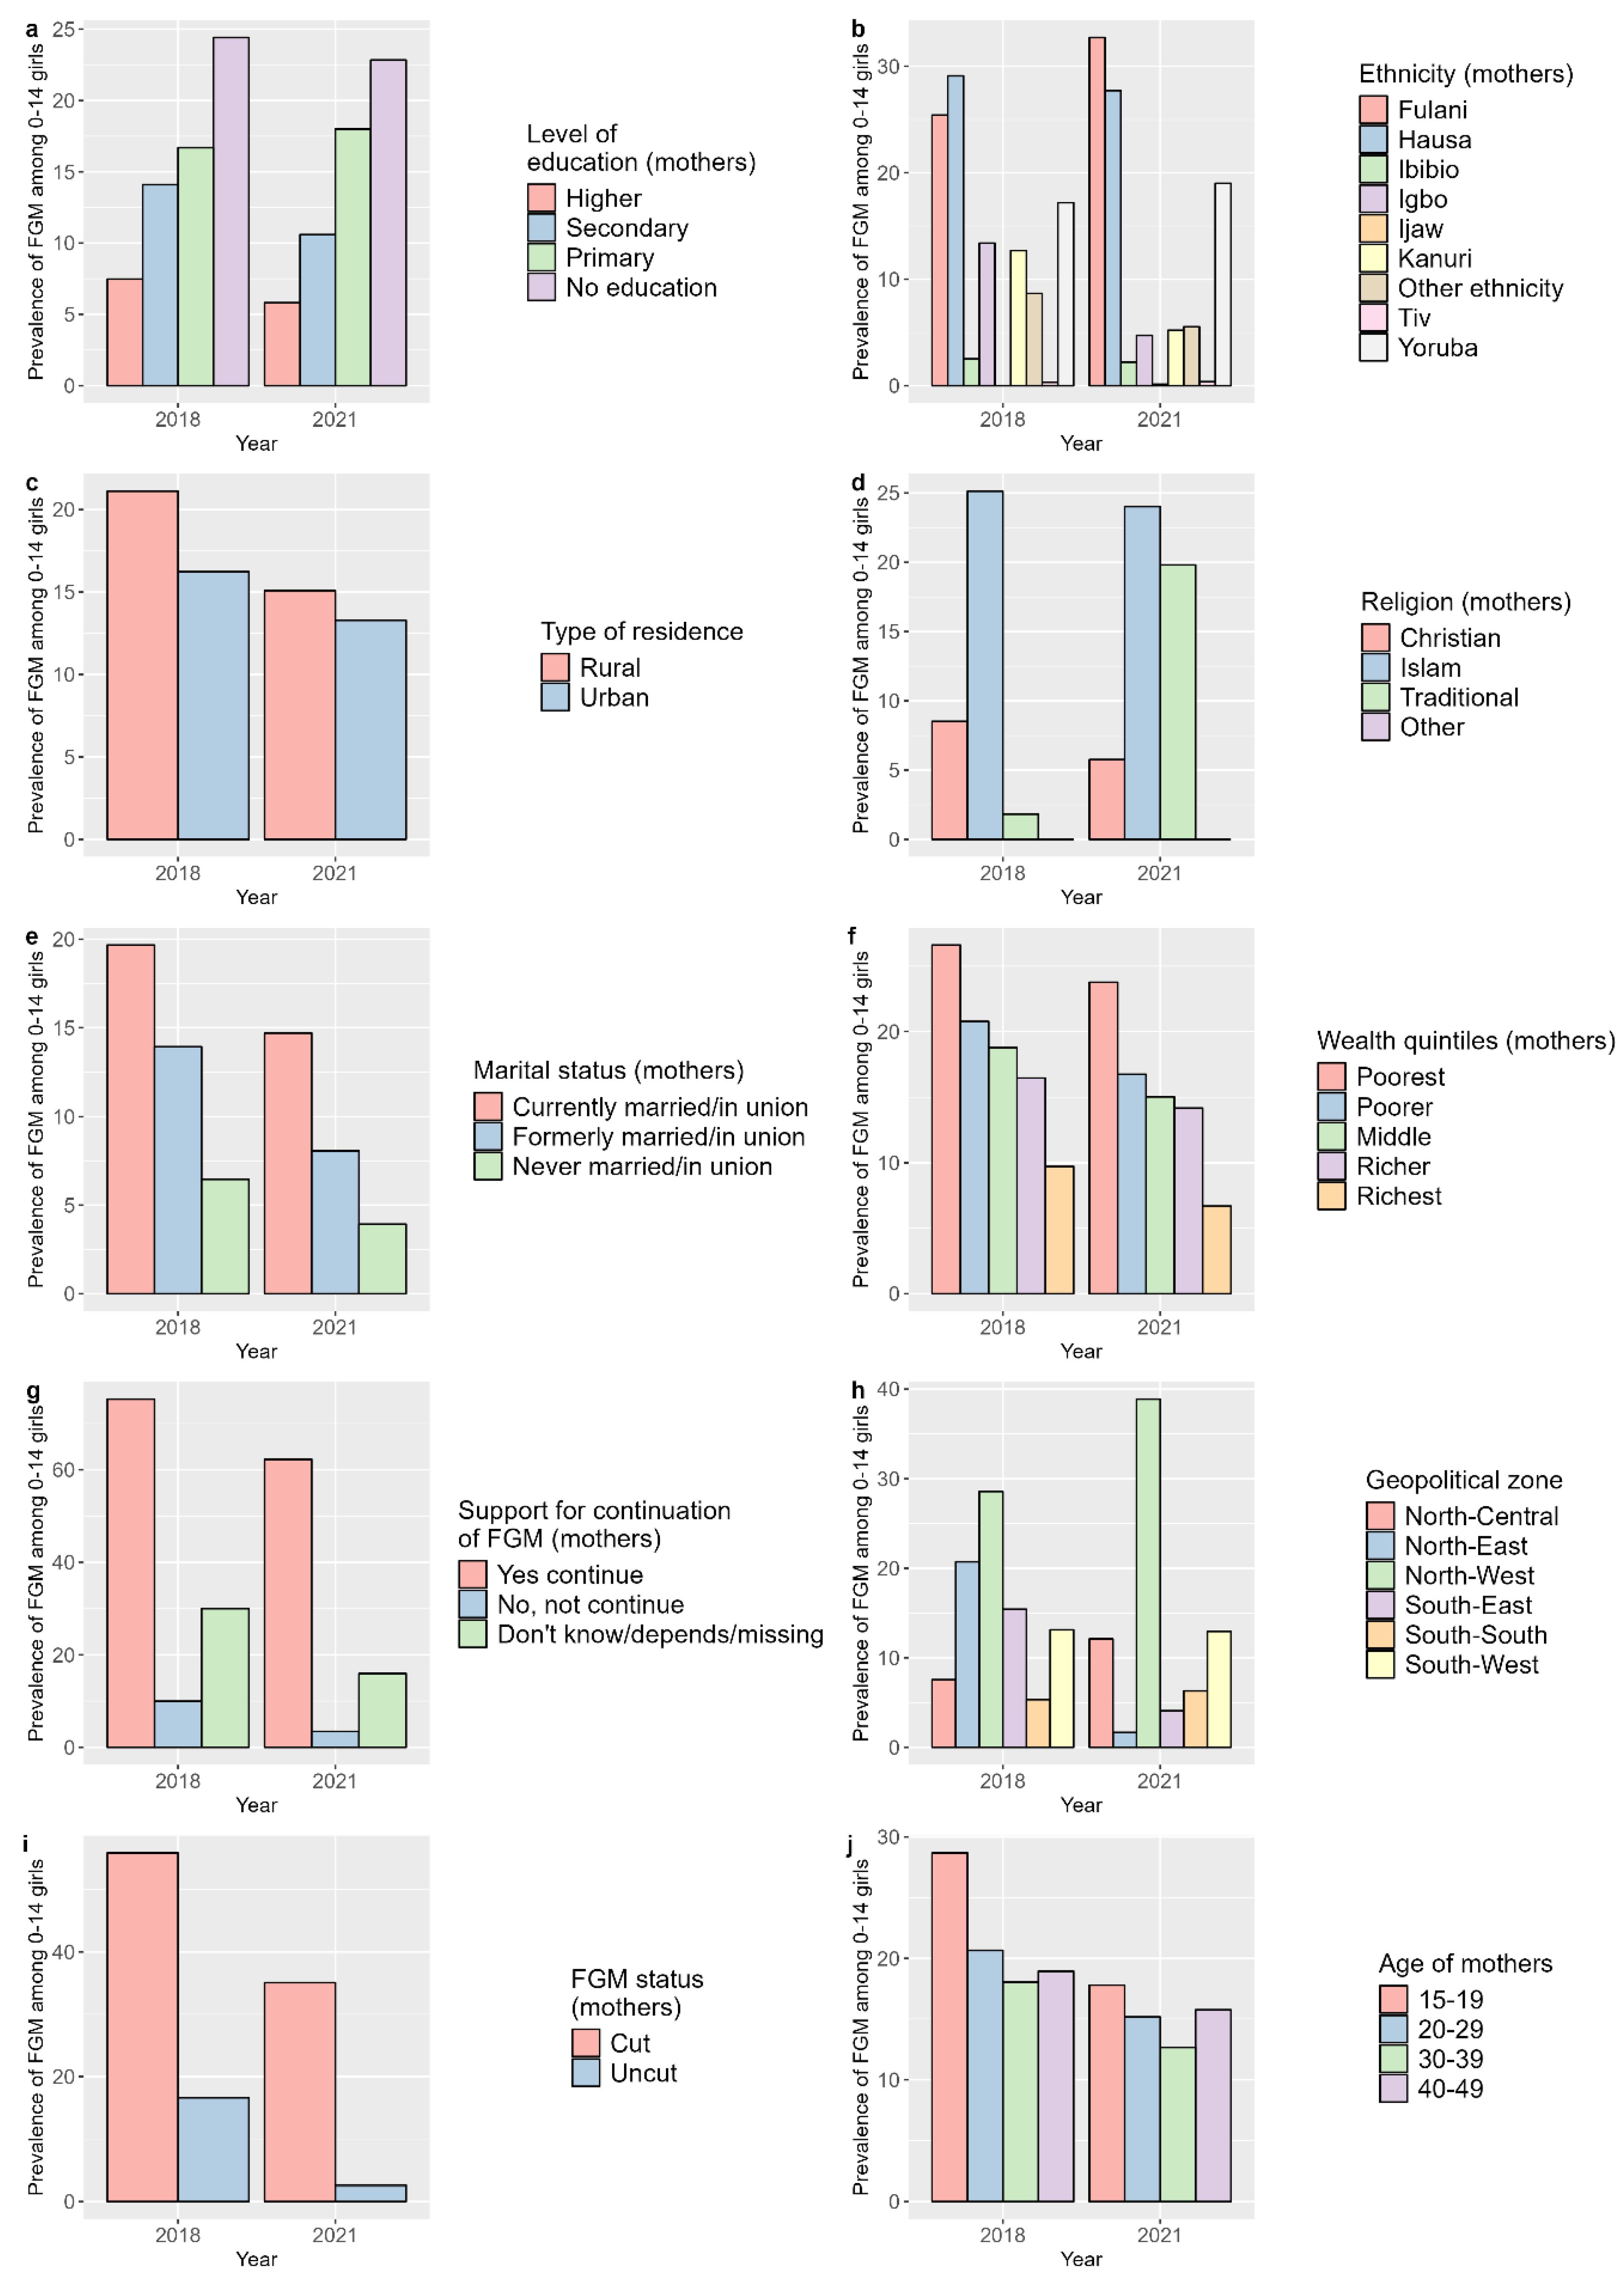
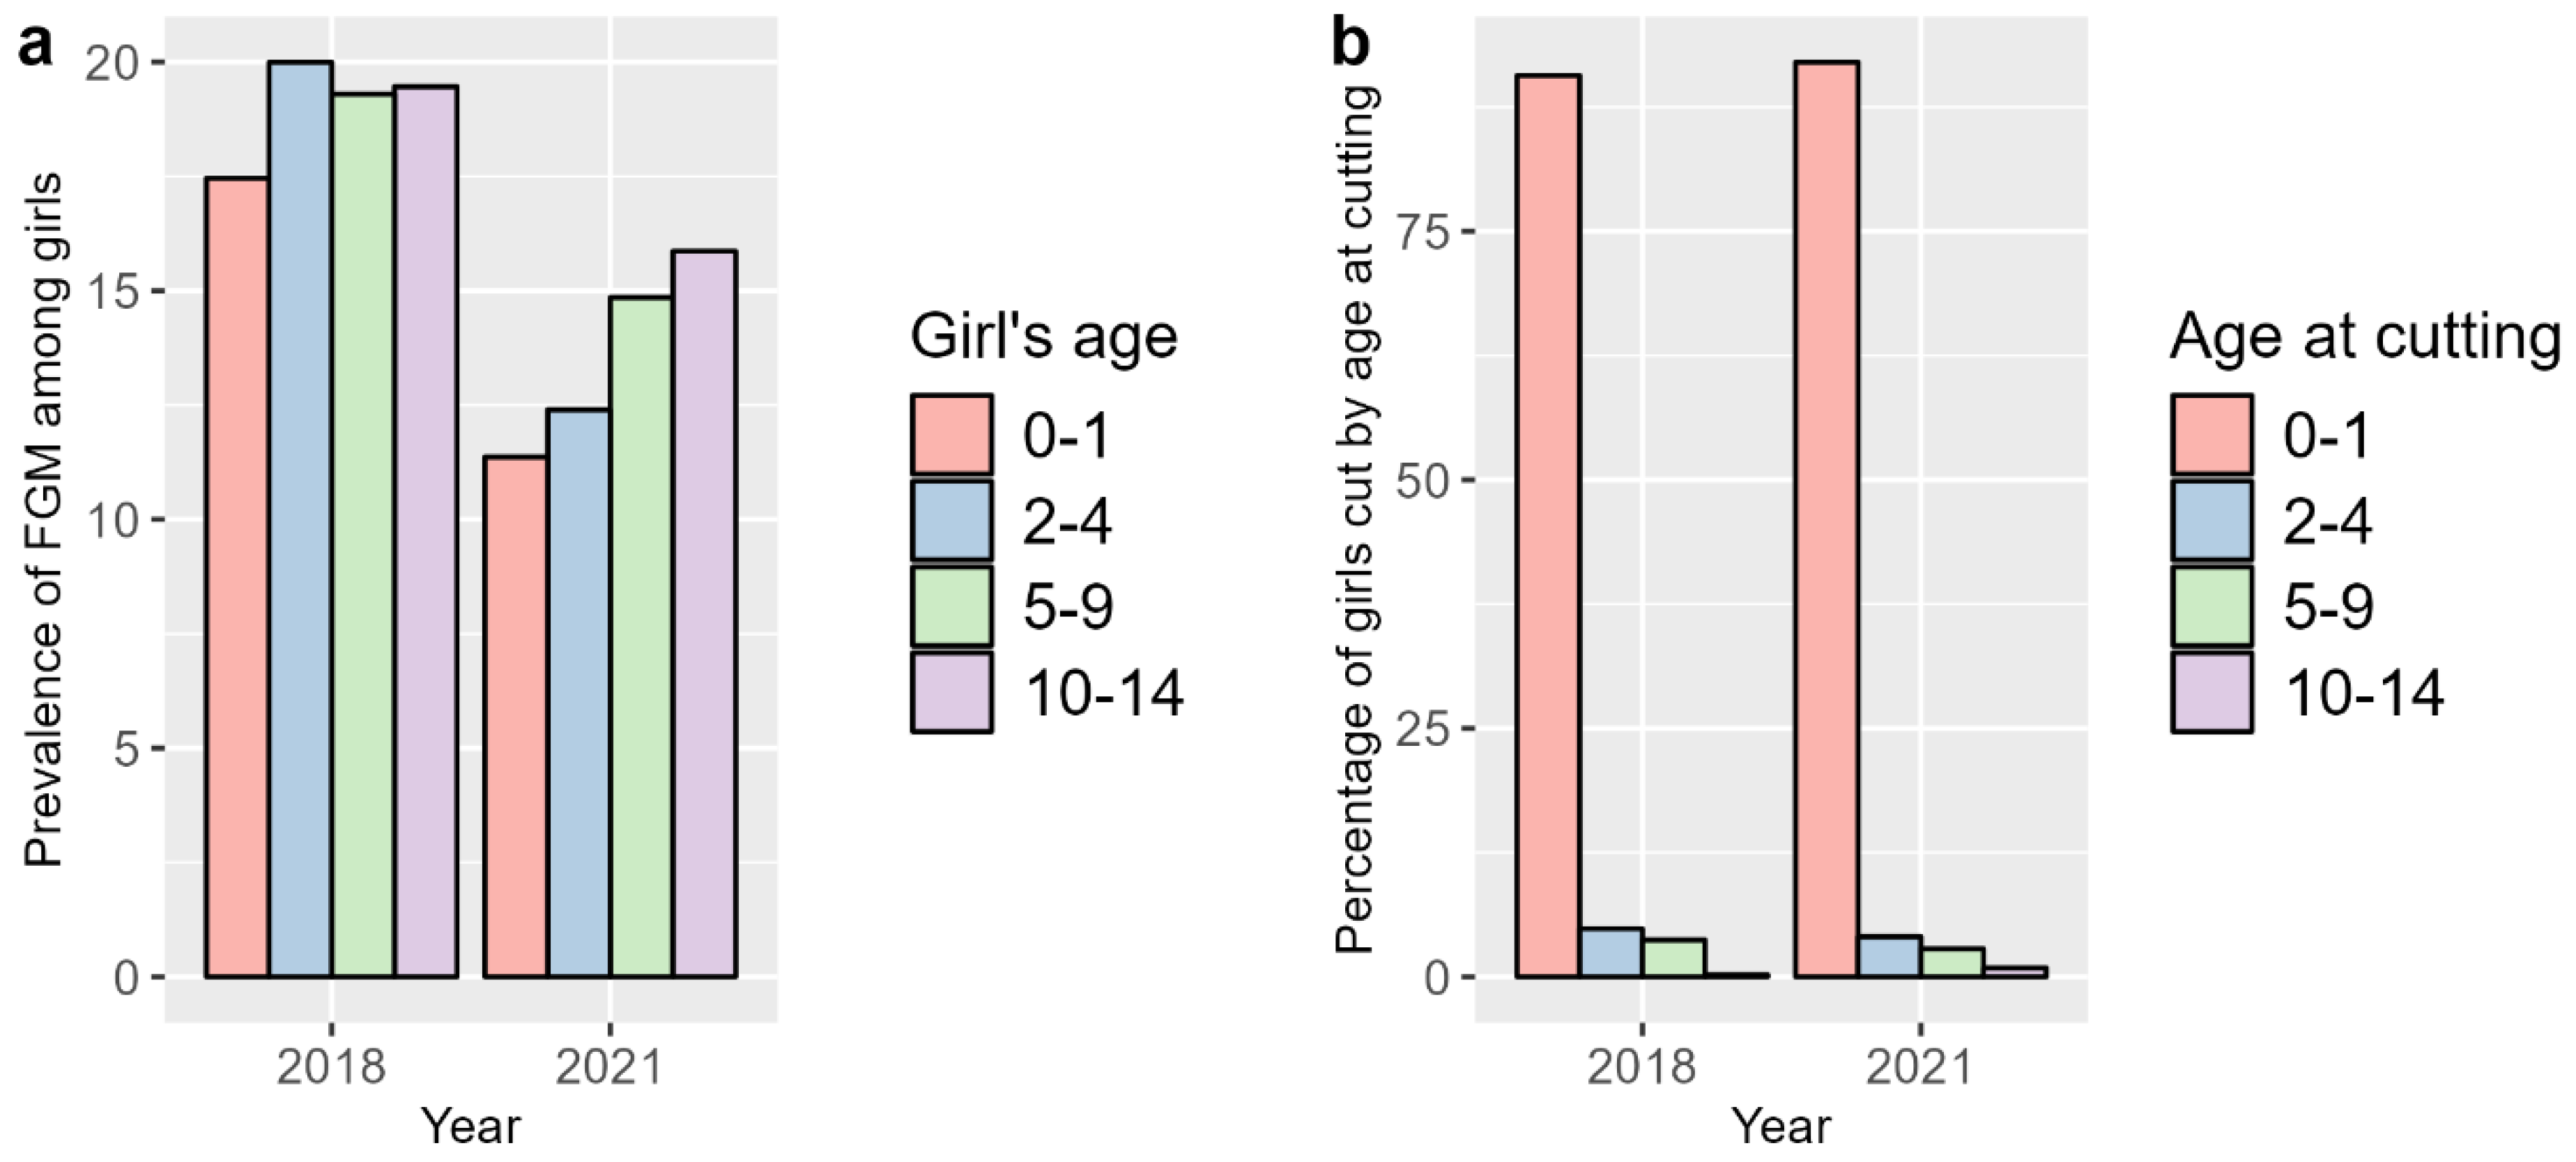
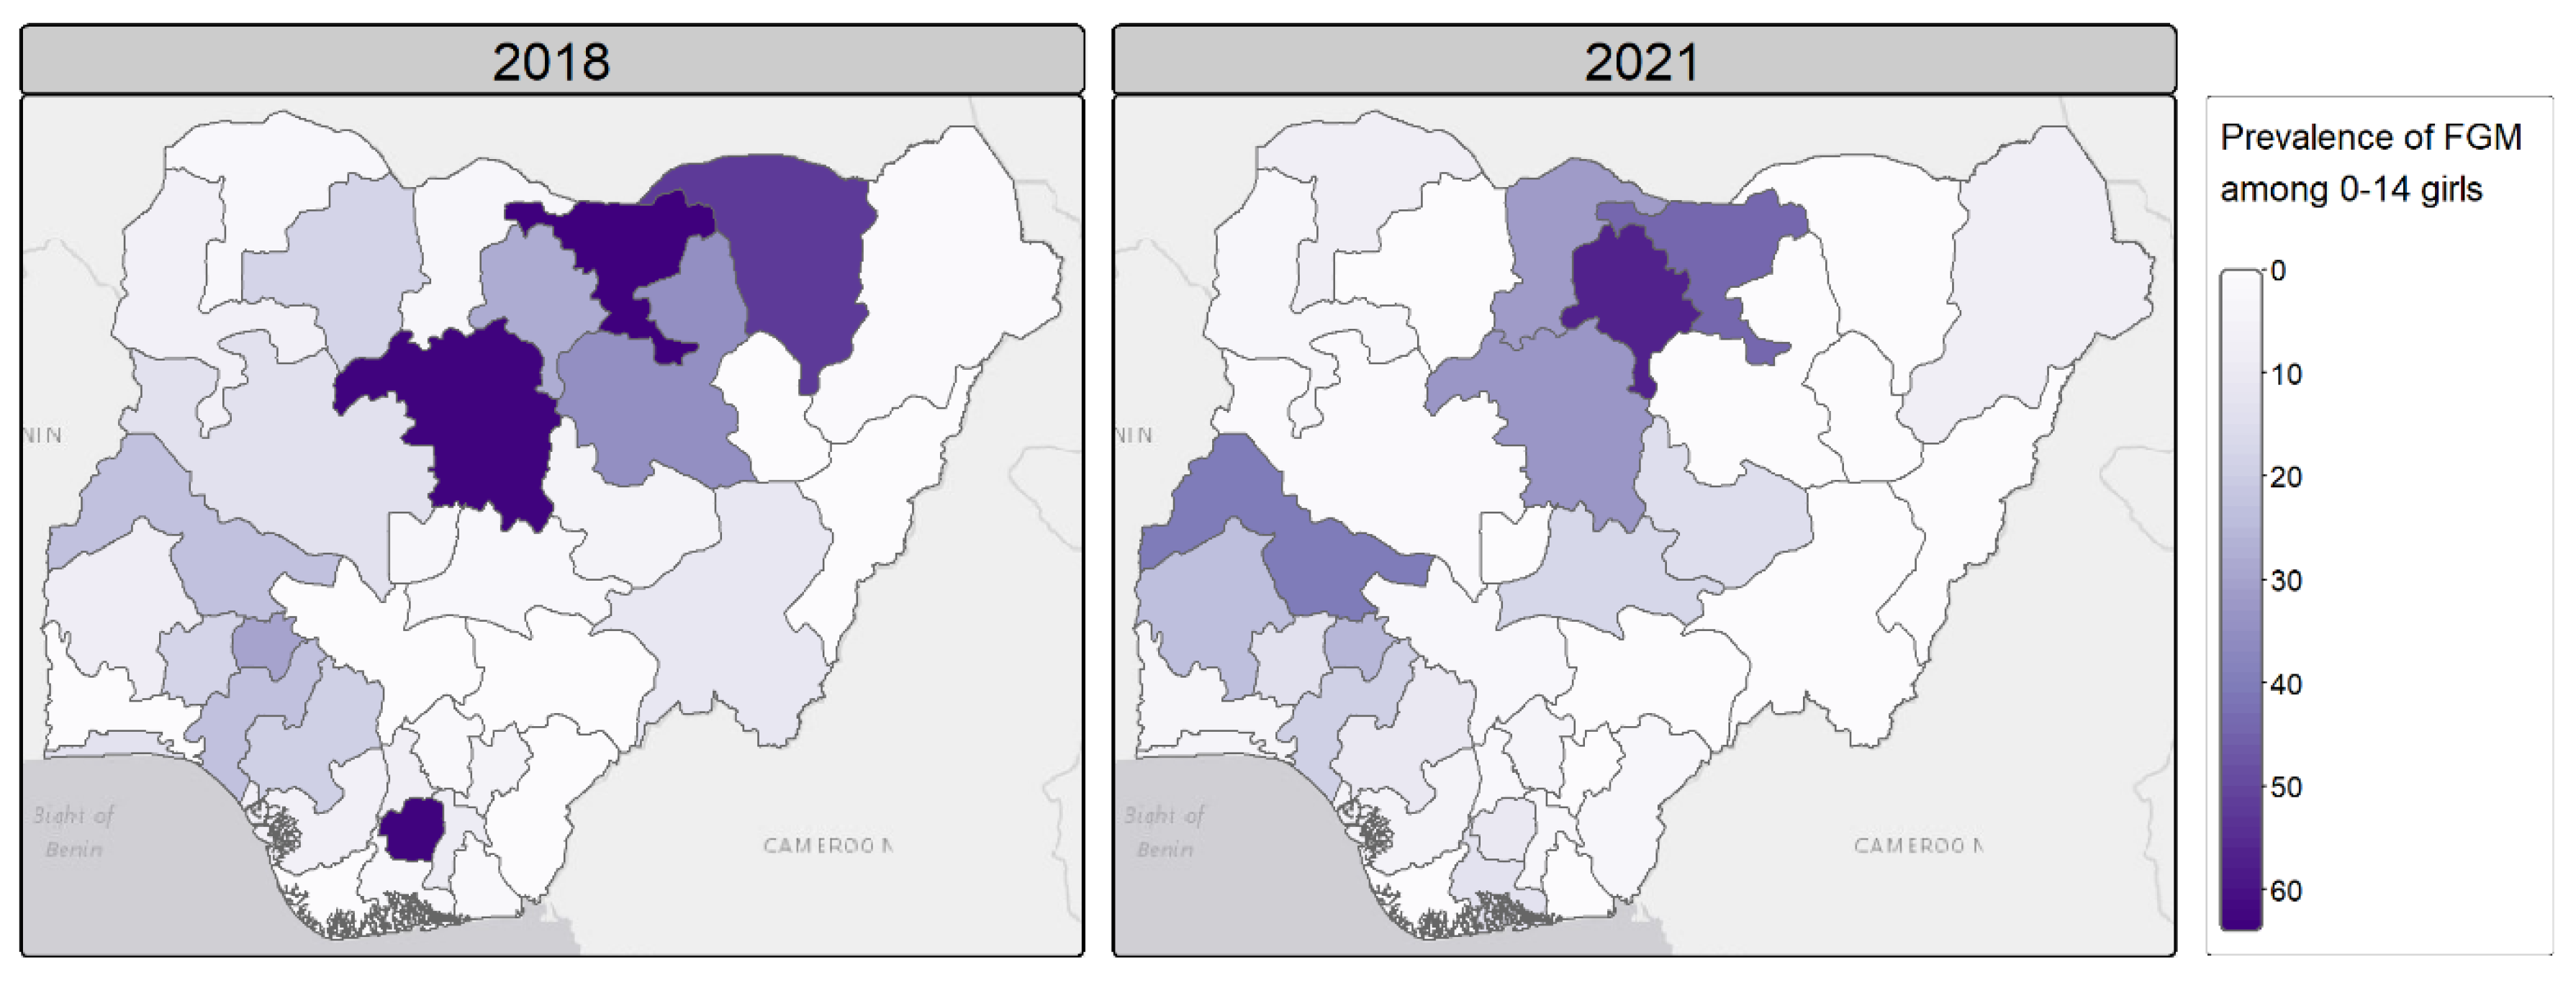
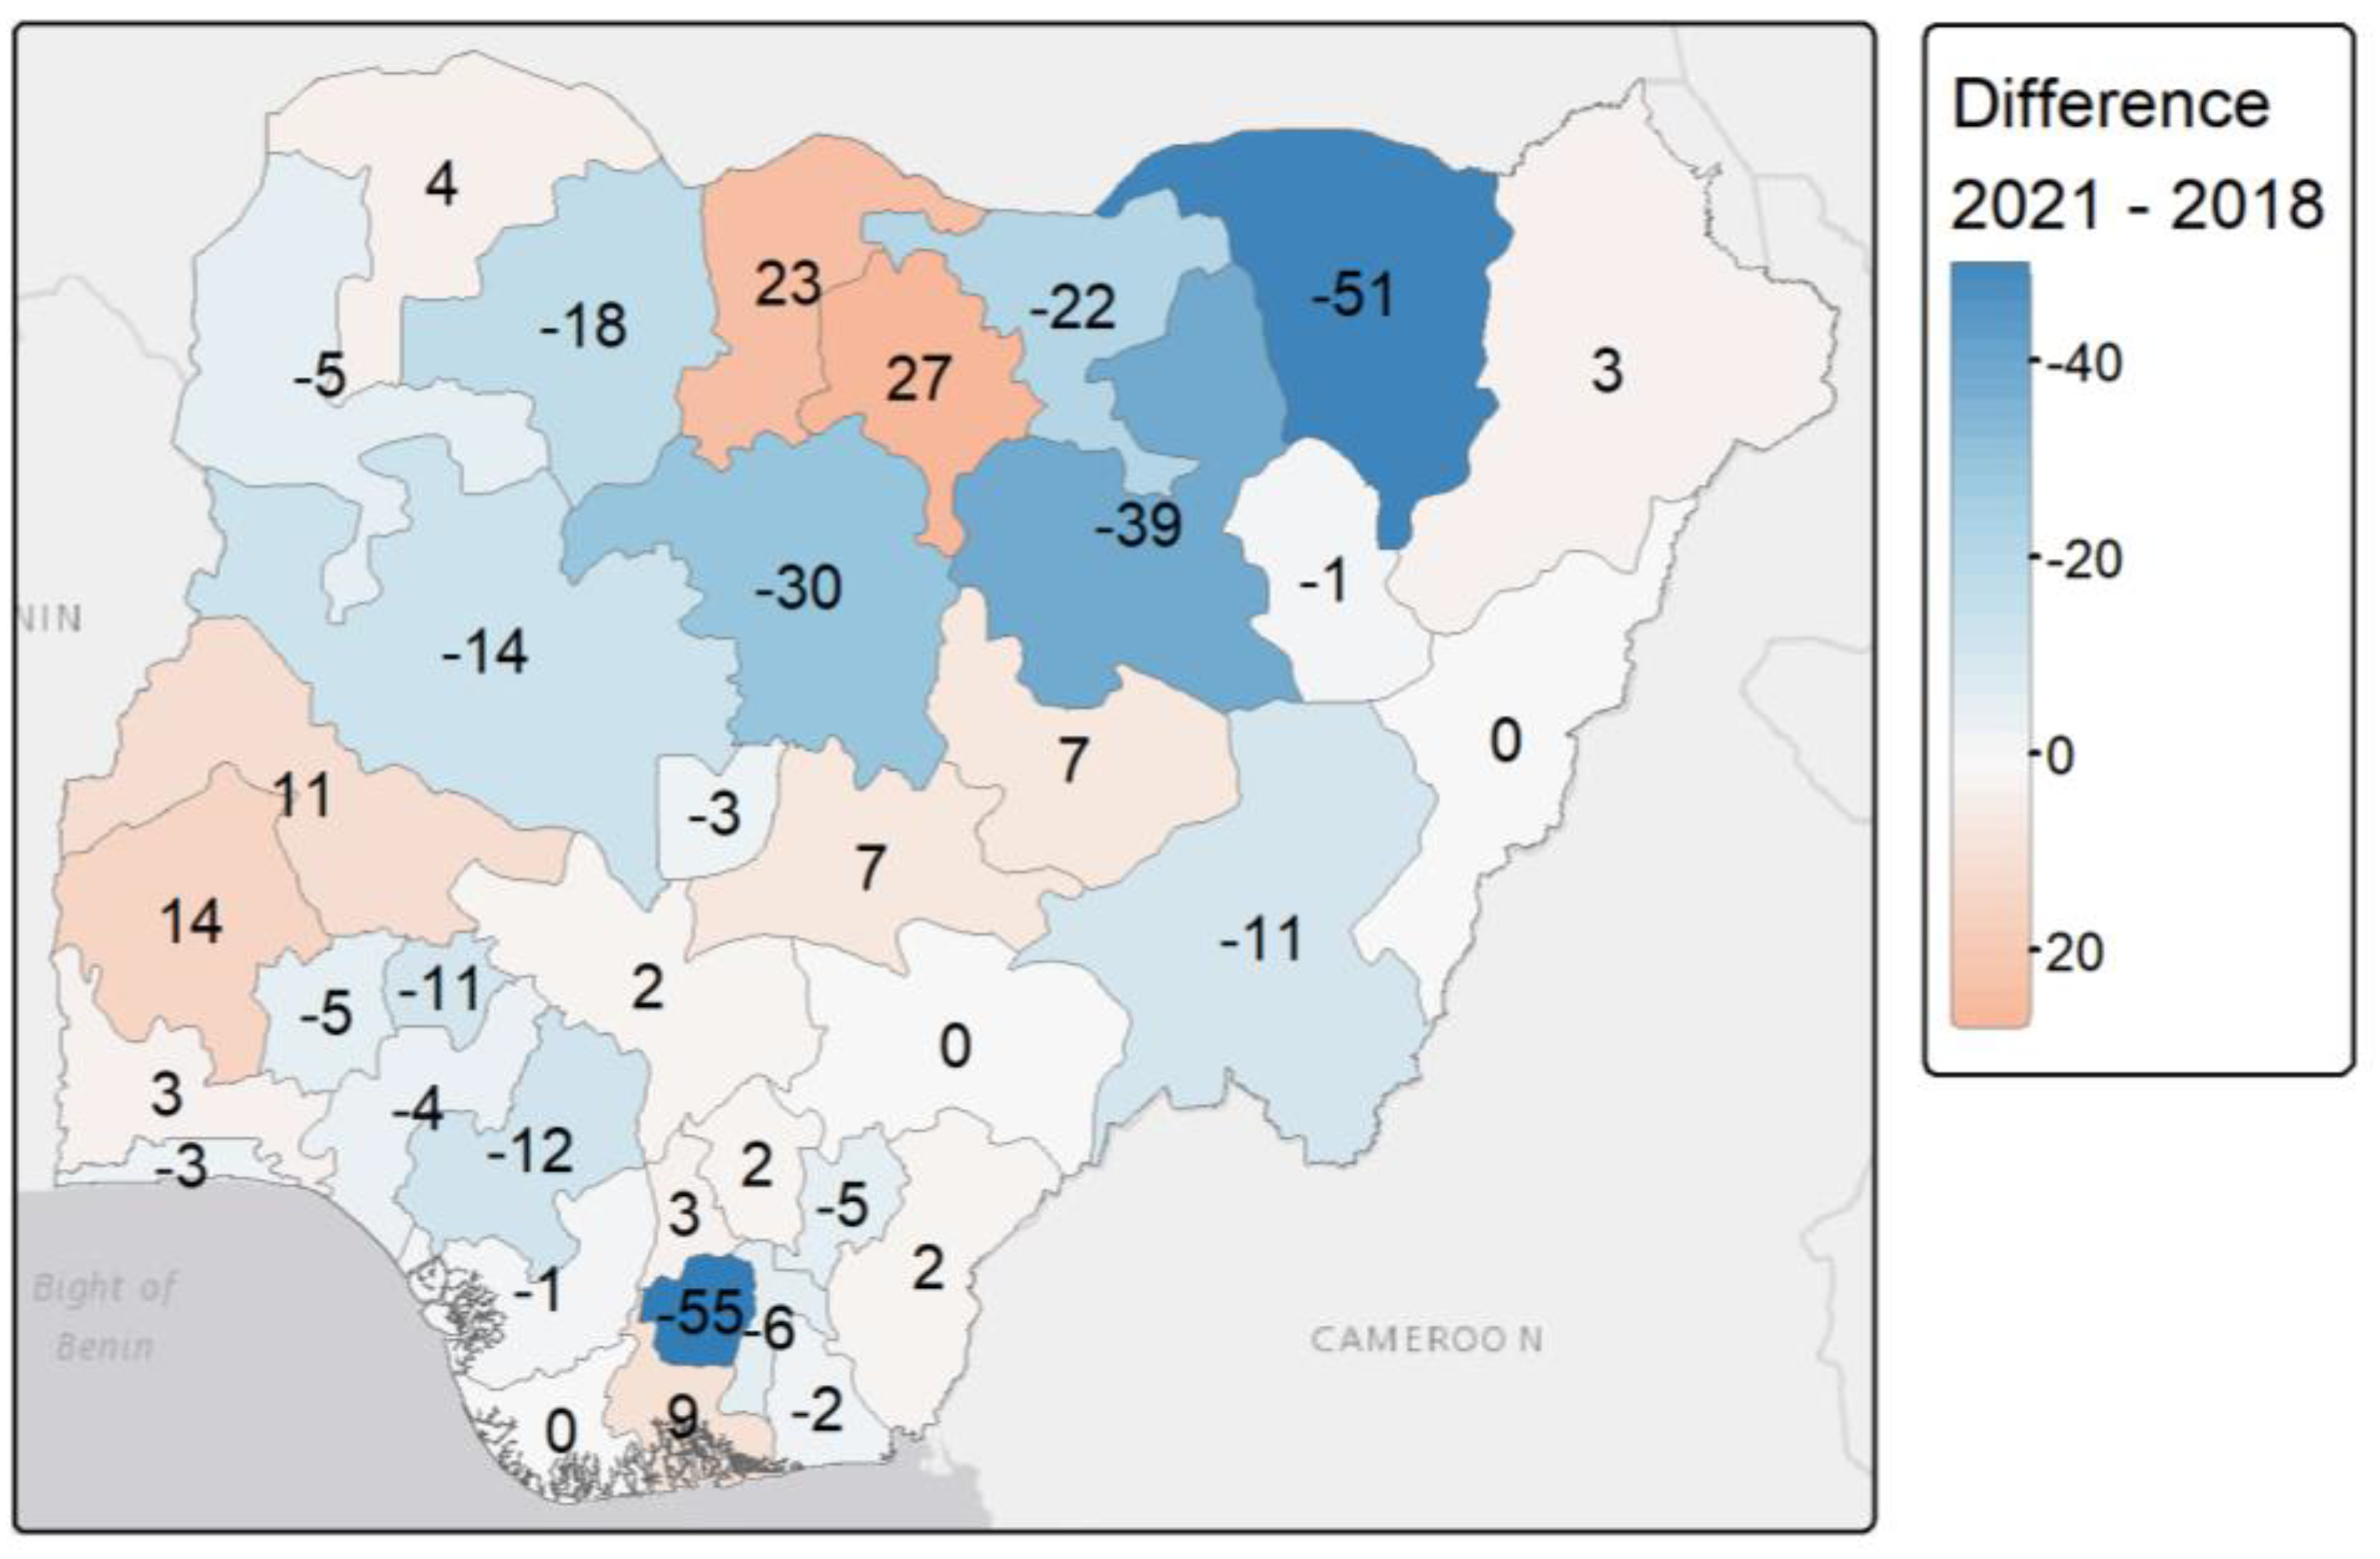
Background: Female genital mutilation (FGM) is a human rights violation that still affects more than 3 million girls aged 0-14 years each year. To achieve the Sustainable Development Goal 2030 agenda, efforts have been made at the local, national and international levels to end the practice by the year 2030. However, the recent COVID-19 pandemic may have reversed the progress made due to increased rates of early marriage of girls, violence against children and school closures during lockdowns. Although some surveys have examined changes in FGM prevalence over the COVID-19 period, changes at the national and sub-national levels among 0-14 years old girls have not been quantified. ObjectivesThis study aimed to understand the potential impacts of the COVID-19 pandemic on the likelihood of FGM among girls aged 0-14 years, and whether it affected progress towards the elimination of FGM. Design We used Bayesian hierarchical regression models implemented within the integrated nested Laplace Approximations (INLA) frameworks.MethodsWe modelled the likelihood and prevalence of FGM among girls aged 0-14 years before and after the COVID-19 pandemic in Nigeria, with respect to individual and community-level characteristics, using Bayesian hierarchical models. We used the 2018 Demographic and Health Survey as the pre-COVID-19 period and the 2021 Multiple Indicator Cluster Survey as the post-COVID-19 period. ResultsAt the state level, FGM prevalence varied geographically and increased by 23% and 27% in the northwestern states of Katsina and Kana respectively. There were 11% increase in Kwara and 14% increase in Oyo. However, at the national level the prevalence of FGM was found to decrease from 19.5% to 12.3% between 2018 and 2021. Cultural factors were identified as the key drivers of FGM among 0-14 years old girls in Nigeria. The changes in the likelihood of girls undergoing FGM across the two time periods also varied across ethnic and religious groups following COVID-19 pandemic.ConclusionOur findings highlight that FGM is still a social norm in some states/regions and groups in Nigeria, thereby highlighting the need for a continued but accelerated FGM interventions throughout the country.
Keywords:
Introduction
Methods
Study Data and Variables
Statistical Analysis
Bayesian Hierarchical Modelling
Results
Descriptive Analysis
Individual-Level Characteristics
Community-Level Characteristics
Bayesian Hierarchical Modelling
Model Metrics
FGM Prevalence Estimates
Cross-Validation
Discussion
Limitations
Conclusion
Ethics approval and consent to participate
Consent for publication
Supplementary Materials
Author Contributions
Funding
Data Availability Statement
Acknowledgments
Conflicts of Interest
Abbreviations
References
- World Health Organization Eliminating female genital mutilation: an interagency statement - OHCHR, UNAIDS, UNDP, UNECA, UNESCO, UNFPA, UNHCR, UNICEF, UNIFEM, WHO; World Health Organization: Geneva, 2008.
- Andro, A.; Lesclingand, M.; Grieve, M.; Reeve, P. Female Genital Mutilation. Overview and Current Knowledge. Population 2016, 71, 217–296. [Google Scholar]
- Libretti, A.; Bianco, G.; Corsini, C.; Remorgida, V. Female genital mutilation/cutting: going beyond urogynecologic complications and obstetric outcomes. Arch Gynecol Obstet 2023, 308, 1067–1074. [Google Scholar] [CrossRef]
- Bertuit, J.; Luzolo Nzinga, A.-M.; Jaouan, M.L.; Feipel, V. Systematic Review of Obstetric and Neonatal Complications Associated With Female Genital Mutilation. Nursing for Women’s Health 2023, 27, 152–161. [Google Scholar] [CrossRef] [PubMed]
- Obiora, O.L.; Maree, J.E.; Nkosi-Mafutha, N. Female genital mutilation in Africa: Scoping the landscape of evidence. International Journal of Africa Nursing Sciences 2020, 12, 100189. [Google Scholar] [CrossRef]
- Mohan, V. Navigating Intimate Spaces of Violence: Global Legal Responses on Female Genital Mutilation/Cutting. In Violence in Intimate Spaces: Law and Beyond; Anurag, P.M., Dwivedy, S., Eds.; Springer Nature: Singapore, 2024; ISBN 978-981-9726-57-8. [Google Scholar]
- Farouki, L.; El-Dirani, Z.; Abdulrahim, S.; Akl, C.; Akik, C.; McCall, S.J. The global prevalence of female genital mutilation/cutting: A systematic review and meta-analysis of national, regional, facility, and school-based studies. PLoS Med 2022, 19, e1004061. [Google Scholar] [CrossRef]
- Mberu, B. Female genital mutilation/cutting in Nigeria: A scoping review. Evidence to End FGM/C: Research to Help Women Thrive; Population Council: New York, 2017. [Google Scholar]
- WHO Female genital mutilation, Female genital mutilation: fact sheet. Available online: https://www.who.int/news-room/fact-sheets/detail/female-genital-mutilation (accessed on Mar 31, 2024).
- UNICEF Female genital mutilation / cutting: a global concern; UNICEF: New York, 2016.
- Orchid Project Impacts of COVID-19 on female genital cutting. 2020.
- Mahlangu, P.; Gibbs, A.; Shai, N.; Machisa, M.; Nunze, N.; Sikweyiya, Y. Impact of COVID-19 lockdown and link to women and children’s experiences of violence in the home in South Africa. BMC Public Health 2022, 22, 1029. [Google Scholar] [CrossRef] [PubMed]
- UNICEF Female genital mutilation and the humanitarian development nexus: practical ways to support programme-level implementation. 2022.
- Mubaiwa, O.; Bradley, T.; Meme, J. The gendered impact of COVID-19 on FGM. Development in Practice 2022, 32, 840–850. [Google Scholar] [CrossRef]
- Matanda, D.; Walgwe, E.L. A research agenda to strengthen evidence generation and utilisation to accelerate the elimination of female genital mutilation. 2022.
- Orchid Project Nigeria: the law and FGM. 2018.
- UNICEF UNICEF warns FGM on the rise among young Nigerian girls Available online:. Available online: https://www.unicef.org/nigeria/press-releases/unicef-warns-fgm-rise-among-young-nigerian-girls (accessed on Apr 1, 2024).
- Nnanatu, C.C.; Atilola, G.; Komba, P.; Mavatikua, L.; Moore, Z.; Matanda, D.; Obianwu, O.; Kandala, N.-B. Evaluating changes in the prevalence of female genital mutilation/cutting among 0-14 years old girls in Nigeria using data from multiple surveys: A novel Bayesian hierarchical spatio-temporal model. PLoS ONE 2021, 16, e0246661. [Google Scholar] [CrossRef]
- Poix, S.; Elmusharaf, K. The cost of inaction on preconception health in Nigeria: An economic impact analysis. Global Public Health 2024, 19, 2361782. [Google Scholar] [CrossRef] [PubMed]
- Kandala; Nnanatu; Atilola; Komba; Mavatikua; Moore; Mackie; Shell-Duncan A Spatial Analysis of the Prevalence of Female Genital Mutilation/Cutting among 0–14-Year-Old Girls in Kenya. IJERPH 2019, 16, 4155. [CrossRef]
- Nnanatu, C.C.; Fagbamigbe, A.F.; Afuecheta, E.; Utazi, C.E. Spatially varying intergenerational changes in the prevalence of female genital mutilation/cutting in Nigeria: lessons learnt from a recent household survey. Applied Spatial Analysis and Policy 2023, 16, 703–727. [Google Scholar] [CrossRef]
- Massay, E.M. ; Emy Susanti; Sutinah Impact of COVID-19 on increasing female genital mutilation (FGM) in Africa: A study of Tanzania and Nigeria. Jurnal Masyarakat, Kebudayaan dan Politik 2022, 35, 134–146. [Google Scholar] [CrossRef]
- ICF International Demographic and Health Survey Sampling and Household Listing Manual; Measure DHS; Calverton, Maryland, U.S.A.: ICF International. 2012.
- UNICEF MICS Tools: Survey design. Available online: https://mics.unicef.org/tools (accessed on Oct 4, 2024).
- National Population Commission - NPC/Nigeria; ICF Nigeria Demographic and Health Survey 2018; NPC and ICF: Abuja, Nigeria, and Rockville, Maryland, USA, 2019.
- National Bureau of Statistics (NBS); UNICEF Multiple Indicator Cluster Survey 2021, Survey Findings Report, Ed.; National Bureau of Statistics and UNICEF: Abuja, Nigeria, 2022. [Google Scholar]
- Kandala, N.-B.; Atilola, G.; Nnanatu, C.; Ogundimu, E.; Mavatikua, L.; Komba, P.; Moore, Z.; Matanda, D. Female genital mutilation/cutting in Nigeria: Is the practice declining? 2003. [Google Scholar]
- von Elm, E.; Altman, D.G.; Egger, M.; Pocock, S.J.; Gøtzsche, P.C.; Vandenbroucke, J.P. ; STROBE Initiative The Strengthening the Reporting of Observational Studies in Epidemiology (STROBE) statement: guidelines for reporting observational studies. Ann Intern Med 2007, 147, 573–577. [Google Scholar] [CrossRef] [PubMed]
- Rue, H.; Martino, S.; Chopin, N. Approximate Bayesian inference for latent Gaussian models by using integrated nested Laplace approximations. Journal of the Royal Statistical Society: Series B (Statistical Methodology) 2009, 71, 319–392. [Google Scholar] [CrossRef]
- Bakka, H.; Rue, H.; Fuglstad, G.-A.; Riebler, A.; Bolin, D.; Krainski, E.; Simpson, D.; Lindgren, F. Spatial modelling with R-INLA: A review. WIREs Comput Stat, 1443. [Google Scholar]
- Dogucu, A.A.J. , Miles Q. Ott, Mine Bayes Rules! An Introduction to Applied Bayesian Modeling; Text in Statistical Science; 2021; ISBN ISBN 9780367255398.
- Shell-Duncan, B.; Wander, K.; Hernlund, Y.; Moreau, A. Dynamics of change in the practice of female genital cutting in Senegambia: Testing predictions of social convention theory. Soc Sci Med 2011, 73, 1275–1283. [Google Scholar] [CrossRef] [PubMed]
- Mackie, G. Ending Footbinding and Infibulation: A Convention Account. American Sociological Review 1996, 61, 999. [Google Scholar] [CrossRef]
- Mackie, G. Social Dynamics of Abandonment of Harmful Practices: A new look at the theory; Innocenti Working Paper. 2009. [Google Scholar]
- Weidmann, N.B.; Rød, J.K.; Cederman, L.-E. Representing ethnic groups in space: A new dataset. Journal of Peace Research 2010, 47, 491–499. [Google Scholar] [CrossRef]
- Besag, J.; York, J.; Mollié, A. Bayesian image restoration, with two applications in spatial statistics. Annals of the Institute of Statistical Mathematics 1991, 43, 1–20. [Google Scholar] [CrossRef]
- Spiegelhalter, D.J.; Best, N.G.; Carlin, B.P.; Van Der Linde, A. Bayesian Measures of Model Complexity and Fit. Journal of the Royal Statistical Society Series B: Statistical Methodology 2002, 64, 583–639. [Google Scholar] [CrossRef]
- Ibukun, C.O.; Adebayo, A.A. Household food security and the COVID-19 pandemic in Nigeria. African Development Review 2021, 33, S75–S87. [Google Scholar] [CrossRef]
- Josephson, A.; Kilic, T.; Michler, J.D. Socioeconomic impacts of COVID-19 in low-income countries. Nat Hum Behav 2021, 5, 557–565. [Google Scholar] [CrossRef]
- Geremew, T.T.; Azage, M.; Mengesha, E.W. Hotspots of female genital mutilation/cutting and associated factors among girls in Ethiopia: a spatial and multilevel analysis. BMC Public Health 2021, 21, 1–18. [Google Scholar] [CrossRef] [PubMed]
- Anyanwu, C.E.; Torpey, K.; Abiodun, O.P.; Sanni, O.F.; Anyanwu, I.D. Variations in the Prevalence of Female Genital Mutilation Among Reproductive-aged Women in Nigeria Across Three Generations. Int J MCH AIDS 2022, 11, e548. [Google Scholar] [CrossRef]
- Shell-Duncan, B.; Moreau, A.; Wander, K.; Smith, S. The role of older women in contesting norms associated with female genital mutilation/cutting in Senegambia: A factorial focus group analysis. PLoS One 2018, 13, e0199217. [Google Scholar] [CrossRef] [PubMed]
- 28 Too Many Country profile: FGM in Nigeria. 2016.
- Kandala, N.-B.; Shell-Duncan, B. Trends in female genital mutilation/cutting in Senegal: what can we learn from successive household surveys in sub-Saharan African countries? Int J Equity Health 2019, 18, 1–19. [Google Scholar] [CrossRef]
- Kazeem, A.; Jensen, L.; Stokes, C.S. School Attendance in Nigeria: Understanding the Impact and Intersection of Gender, Urban-Rural Residence, and Socioeconomic Status. Comparative Education Review 2010, 54, 295–319. [Google Scholar] [CrossRef] [PubMed]
- Onwuteaka, C. Understanding access to education in Nigeria. GRID3 2020.
- Elom, N.A.; Nwimo, I.O.; Elom, S.O.; Alegu, D.N.; Afoke, E.N.; Okpata, O.O.; Ogodo, J.O.; Ilo, C.I.; Okeworo, C.G.; Elom, C.O. Emotional impact of COVID-19 lockdown and mitigation options: A cross-sectional survey of households in Ebonyi State, Nigeria. SAGE Open Medicine 2021. [Google Scholar] [CrossRef]
- Morlighem, C.; Visée, C.; Nnanatu, C.C. Comparison of FGM prevalence among Nigerian women aged 15–49 years using two household surveys conducted before and after the COVID-19 pandemic. BMC Public Health 2024, 24, 1866. [Google Scholar] [CrossRef] [PubMed]


| Level | Characteristics |
| Individual | Mother education, mother age, girl age, household wealth quintile, mother marital status, ethnicity, religion, mother support for FGM continuation, mother FGM status |
| Community | Geopolitical zone, residence, percentage of women with at least secondary education, percentage of women supporting FGM continuation, percentage of women that are cut, EFI, main religion in community, main wealth quintile in community |
| Complexity | Model | Specification |
| Low | m1 | |
| m2 | ||
| High | m3 |
| DHS 2018 | MICS 2021 | |||||
|---|---|---|---|---|---|---|
| Model | m1 | m2 | m3 | m1 | m2 | m3 |
| Individual | 10293.1 | 8710.5 | 8707.6 | 6809.7 | 5554.2 | 5555.7 |
| Community | 10670.6 | 10479.1 | 10480.1 | 7506.0 | 7119.0 | 7119.3 |
| Individual & community | 10862.3 | 10479.7 | 10479.9 | 7491.0 | 7015.3 | 7010.4 |
| DHS 2018 | MICS 2021 | |||||
|---|---|---|---|---|---|---|
| Model | R2 | RMSE | MAE | R2 | RMSE | MAE |
| Individual (m2) | 0.97 | 3.46 | 2.01 | 0.97 | 2.69 | 1.34 |
| Community (m2) | 0.88 | 8.95 | 5.49 | 0.97 | 2.70 | 1.34 |
| Individual & community (m2) | 0.87 | 9.09 | 5.69 | 0.97 | 2.69 | 1.35 |
| Variables | Levels | DHS 2018 | MICS 2021 | ||||
|---|---|---|---|---|---|---|---|
| POR | 2.5% | 97.5% | POR | 2.5% | 97.5% | ||
| (Intercept) | 0.022 | 0.014 | 0.034 | 0.0076 | 0.0046 | 0.0123 | |
| Mother education | No education (ref) | 1 | - | - | 1 | - | - |
| Higher | 0.708 | 0.522 | 0.961 | 0.8362 | 0.5912 | 1.1829 | |
| Secondary | 0.971 | 0.802 | 1.176 | 1.1939 | 0.9537 | 1.4947 | |
| Primary | 1.033 | 0.870 | 1.227 | 1.1743 | 0.9472 | 1.4557 | |
| Mother marital status | Currently married/in union (ref) | 1 | - | - | 1 | - | - |
| Formerly married/in union | 0.764 | 0.585 | 0.997 | 0.8262 | 0.6036 | 1.131 | |
| Never married/in union | 1.207 | 0.575 | 2.531 | 2.099 | 1.047 | 4.2078 | |
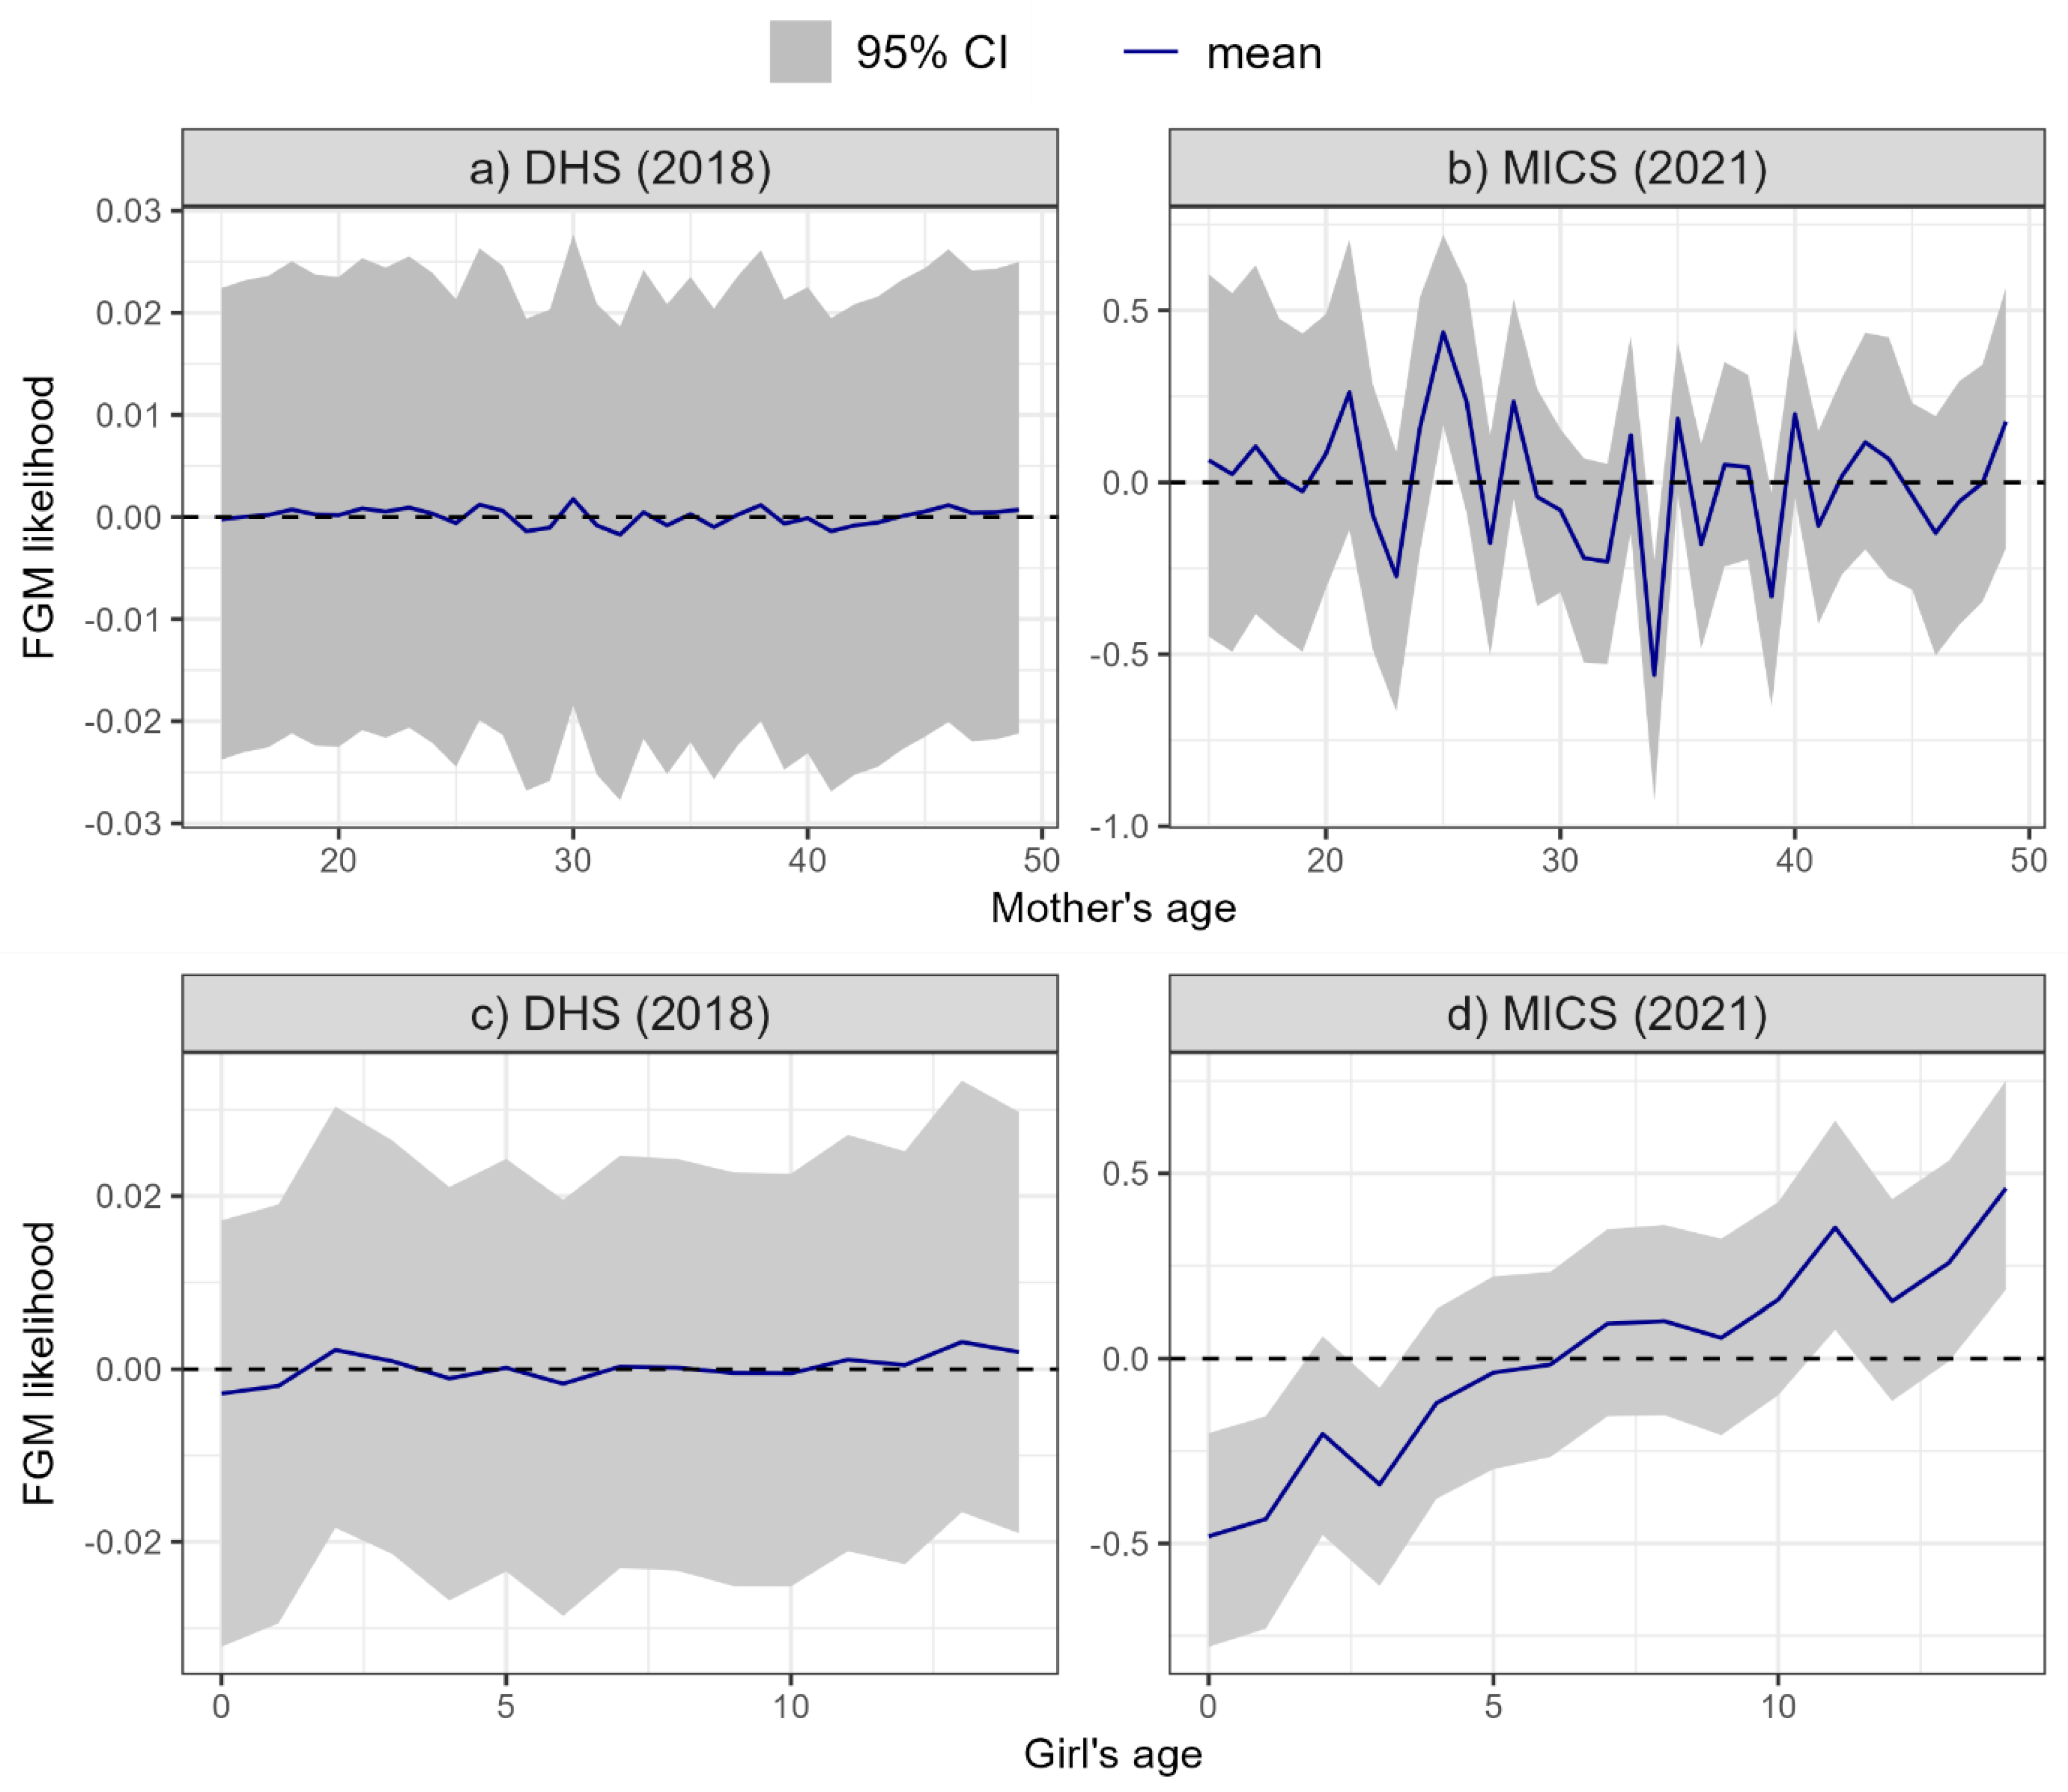
| Mother age | See Figure 8a | See Figure 8b | |||||
| Girl age | See Figure 8c | See Figure 8d | |||||
| Mother support for FGM continuation | No, not continue (ref) | 1 | - | - | 1 | - | - |
| Yes continue | 16.436 | 14.324 | 18.861 | 26.728 | 22.280 | 32.072 | |
| Don't know/depends/missing | 2.311 | 1.942 | 2.750 | 3.620 | 2.972 | 4.409 | |
| Mother FGM status | Uncut (ref) | 1 | - | - | 1 | - | - |
| Cut | 8.145 | 7.022 | 9.461 | 10.992 | 8.991 | 13.439 | |
| Wealth quintile | Poorest (ref) | 1 | - | - | 1 | - | - |
| Poorer | 0.937 | 0.799 | 1.100 | 1.006 | 0.797 | 1.271 | |
| Middle | 0.952 | 0.797 | 1.137 | 1.060 | 0.831 | 1.354 | |
| Richer | 0.804 | 0.655 | 0.987 | 1.212 | 0.934 | 1.572 | |
| Richest | 0.606 | 0.473 | 0.777 | 0.800 | 0.578 | 1.105 | |
| Ethnicity | Fulani (ref) | 1 | - | - | 1 | - | - |
| Hausa | 0.930 | 0.768 | 1.127 | 0.478 | 0.356 | 0.643 | |
| Ibibio | 0.851 | 0.274 | 2.643 | 0.246 | 0.086 | 0.706 | |
| Igbo | 1.043 | 0.637 | 1.708 | 0.241 | 0.130 | 0.447 | |
| Ijaw | 0.000 | 0.000 | 0.000 | 0.016 | 0.003 | 0.078 | |
| Kanuri | 0.614 | 0.405 | 0.932 | 0.242 | 0.112 | 0.524 | |
| Other | 0.552 | 0.438 | 0.696 | 0.147 | 0.096 | 0.224 | |
| Tiv | 0.086 | 0.010 | 0.778 | 0.140 | 0.027 | 0.733 | |
| Yoruba | 0.809 | 0.541 | 1.210 | 0.654 | 0.419 | 1.021 | |
| Religion | Christian (ref) | 1 | - | - | 1 | - | - |
| Islam | 1.344 | 1.059 | 1.705 | 1.998 | 1.564 | 2.553 | |
| Traditional | 0.163 | 0.035 | 0.754 | 2.779 | 1.533 | 5.039 | |
| Other | 0.000 | 0.000 | 0.017 | 0.000 | 0.000 | 0.002 | |
| Sampling weight | 1.018 | 0.933 | 1.110 | 0.8901 | 0.8209 | 0.9652 | |
Disclaimer/Publisher’s Note: The statements, opinions and data contained in all publications are solely those of the individual author(s) and contributor(s) and not of MDPI and/or the editor(s). MDPI and/or the editor(s) disclaim responsibility for any injury to people or property resulting from any ideas, methods, instructions or products referred to in the content. |
© 2025 by the authors. Licensee MDPI, Basel, Switzerland. This article is an open access article distributed under the terms and conditions of the Creative Commons Attribution (CC BY) license (http://creativecommons.org/licenses/by/4.0/).


