
Submitted:
09 January 2025
Posted:
13 January 2025
You are already at the latest version
Abstract
In starfish oocytes, the hormone 1-methyladenine (1-MA) induces germinal vesicle breakdown (GVBD) through a signaling cascade involving PI3K, SGK, Cdc25, and Cdk1/cyclin via G-proteinβγ subunit. Following GVBD, fertilization triggers an intracellular calcium increase, leading to the formation of the fertilization envelope (FE) via cortical granule exocytosis. While transient calcium elevations are known to occur after 1-MA stimulation even without fertilization, the inability of these calcium elevations to induce cortical granule exocytosis and FE formation remained unexplained. In this study, we found that co-treatment with 1-MA and calcium ionophore A23187 prevents FE formation, revealing a transient period termed the “no FE phase” persisting for several minutes. After no FE phase, the oocytes regain full competence to form the FE. Furthermore, we identified that the GEF/Rac1 signaling cascade is activated during the no FE phase. Notably, constitutively active Rac1 expressed in oocytes reproduces this inhibition even in the absence of 1-MA stimulation. These findings suggest that the GEF/Rac1 cascade, triggered by 1-MA, initiates the no FE phase and plays a critical role in coordinating the progression of subsequent fertilization events.
Keywords:
starfish
; oocyte maturation
; Rac1
; actin
; calcium
; fertilization
; fertilization envelope
1. Introduction
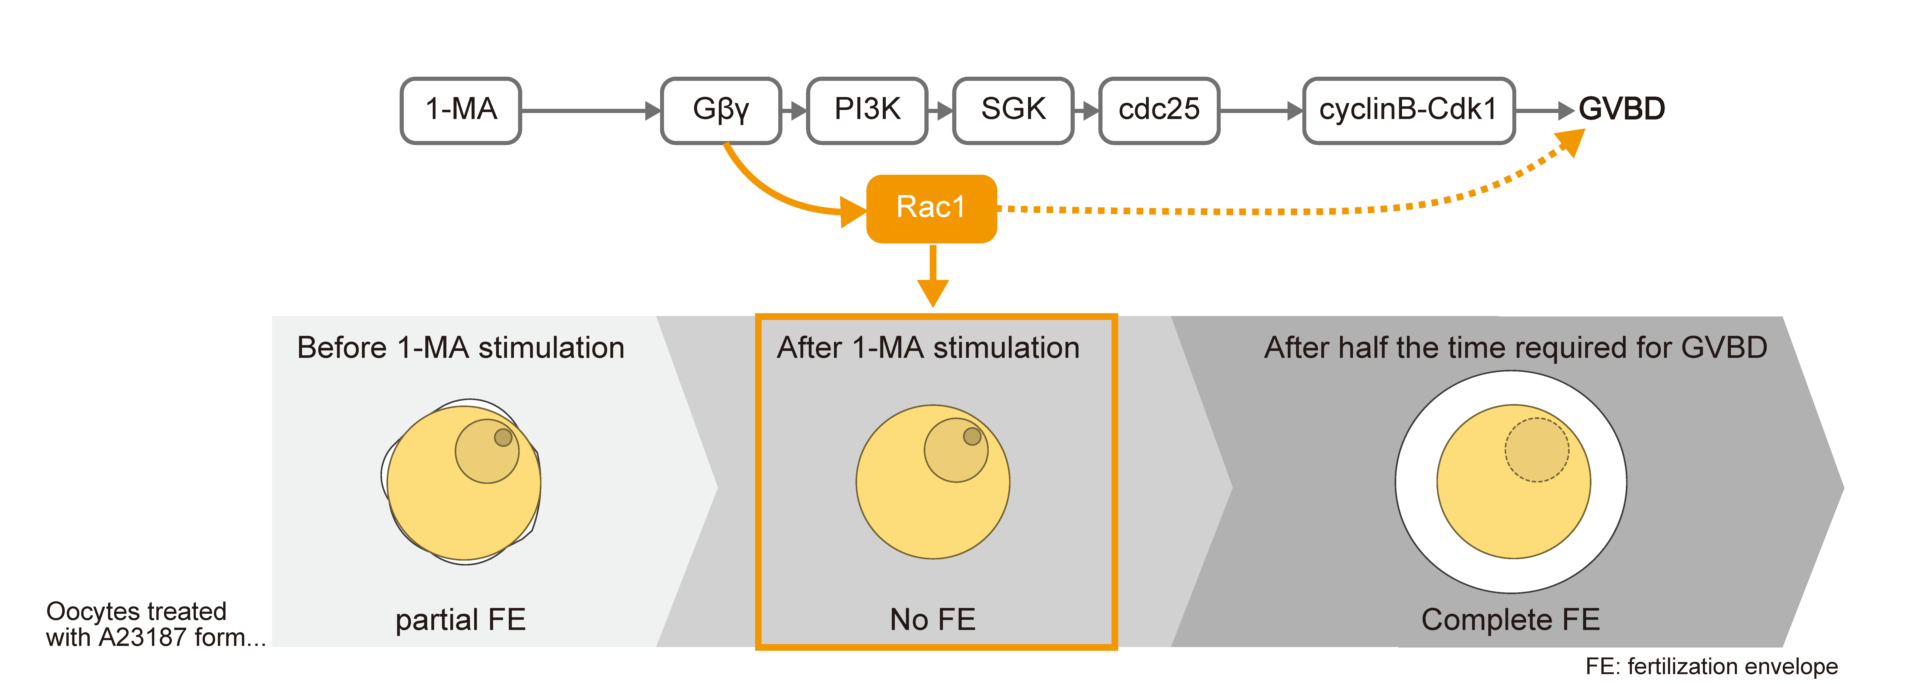
Starfish oocytes are arrested at the prophase of meiosis I in the ovaries, and hormonal stimulation by 1-methyladenine (1-MA) induces germinal vesicle breakdown (GVBD) [1]. After GVBD, oocytes are spawned and they acquire the ability to form a complete fertilization envelope (FE) in response to fertilization in the seawater or calcium ionophore A23187, which increases intracellular calcium ion levels [2,3,4]. Prior to hormonal stimulation, however, oocytes remain immature, displaying only partial FE elevation or vitelline envelope elevation due to insufficient inositol 1,4,5-trisphosphate (IP3)-mediated calcium release and inadequate calcium-induced cortical granule exocytosis [5,6]. Interestingly, oocytes lose the ability to form even a partial FE after 1-MA treatment but before GVBD [3]. Notably, simultaneous treatment with A23187 and 1-MA prevents FE formation entirely, indicating that 1-MA exerts an inhibitory effect on FE formation or exocytosis, though the precise mechanism remains unclear [3].
The 1-MA receptor located on the cortex of starfish oocytes is thought to be G-protein-coupled, as its high-affinity state is converted to a low-affinity state in the presence of a non-hydrolyzable GTP analog [7]. Indeed, starfish oocytes express a heterotrimeric G-protein, and the Gα subunit is ADP-ribosylated by pertussis toxin, which inhibits 1-MA-induced GVBD [8,9]. Because starfish Gβγ injection into oocytes induces GVBD [10,11], 1-MA stimulation likely promotes the dissociation of Gαi from Gβγ. The released Gβγ then activates PI3K [10,12], leading to the phosphorylation and activation of SGK via TORC2 and PDK1[13,14]. In turn, SGK phosphorylates cdc25 and myt1, ultimately activating Cdk1 and triggering GVBD [13,14]. While the signaling events linking PI3K to SGK activation remain unresolved, additional unidentified signaling components appear to contribute, as neither mutant Gβγ nor PI3K alone is sufficient to induce GVBD, but their co-expression restores GVBD [15]. Furthermore, mammalian Gβγ is known to activate small G-protein guanine nucleotide exchange factors (GEFs) [16,17,18], suggesting that both GVBD and the 1-MA-induced inability to form a FE before GVBD in starfish may be regulated via GEF activation.
In this study, we investigated whether GEFs and the small G-protein Rac1 are involved in the loss of FE-forming capacity after 1-MA treatment but prior to GVBD. Understanding this regulatory mechanism could provide insights into the block of FE formation before fertilization, as 1-MA stimulation transiently increases intracellular calcium levels [19,20], which is regulated by actin cytoskeleton in the cortex of the starfish oocytes [21,22].
2. Materials and Methods
2.1. Animals and Oocyte Preparation
Asterina pectinifera were collected on the coast of Japan during the breeding season and were kept in laboratory aquaria with filtered seawater at 10–16 °C. Ovaries were collected from female animals, and oocytes were squeezed from the ovaries using tweezers in the ice-cold Ca2+-free seawater (462mM NaCl, 10mM KCl, 36mM MgCl2, 17mM MgSO4, 10mM EPPS, pH 8.2). To remove follicle cells, they were washed several times with ice-cold Ca2+-free seawater and incubated in artificial seawater (462mM NaCl, 9mM CaCl2, 10mM KCl, 36mM MgCl2, 18mM MgSO4, 20mM H3BO3, pH 8.2) at 20 °C. The oocytes having GV (called GV oocytes) are selected and used for experiments.
2.2. Observation of the Maturing Process and Inhibitor Treatment
The timing of germinal vesicle breakdown (GVBD) was monitored under a microscope at designated time points before (0 min) and after treatment with artificial seawater containing 1 µM 1-MA. Oocytes were pre-treated with 100 µM Rac1 inhibitor NSC23766 (Abcam, Cambridge, UK) for 1 hour or 20µM PI3K inhibitor Wortmannin (LC laboratories, Woburn, USA) for 30 min, followed by incubation with or without 0.25 µM 1-MA. The timing of GVBD was then monitored under the same conditions.
2.3. Observation of Fertilization Envelope Formation
Fertilization envelope (FE) formation or vitelline envelope elevation was observed as described by Chiba and Hoshi [3]. Briefly, immature or maturing oocytes were treated with or without 20 µM calcium ionophore A23187 (Sigma-Aldrich, St. Louis, MO, USA). The FE formation and its morphology were classified into three categories: partial FE (abnormal or incomplete FE), no FE (invisible FE), and complete FE (normal and fully formed FE). In general, complete FE was observed in germinal vesicle breakdown (GVBD) oocytes treated with A23187. In contrast, partial FE (abnormal FE) was observed in immature oocytes treated with A23187 in the absence of 1-MA. FE formation was not observed (no FE) in oocytes treated with A23187 after 1-MA treatment but before GVBD. Images of FE formation were captured using a DIC microscope and a camera system.
2.4. Sample Preparation and SDS-PAGE
Oocytes were recovered in 5 µL of seawater, mixed with 5 µL of sample buffer (125 mM Tris-HCl pH 6.8, 20% glycerol, 4% SDS, 10% 2-mercaptoethanol, 0.01% bromophenol blue), and frozen in liquid nitrogen. After thawing and boiling at 95°C for 5 minutes, proteins in the sample buffer were separated by SDS-PAGE using gels with different concentrations: 8.5% for Cdc25, SGK, Akt, and Cdk1; 12% for Cdk1 and Rac1; and 13% for Rac1.
2.5. Western Blotting
Proteins were transferred to PVDF membranes (Merck, Darmstadt, Germany) using a semi-dry blotting system. Membranes were blocked and incubated with the following primary antibodies at specified dilutions: Anti-sfCdc25 (1:1000, Can Get Signal Immunoreaction Enhancer Solution 1, TOYOBO, Tokyo, Japan)[23]; Anti-Cdc25-pS188 (1:1000, Can Get sol. 1, TOYOBO, Tokyo, Japan) [15]; Anti-SGK-pAloop (1:50, in TBS-T)[14]; Anti-sfSGK-HM (1:1000, in TBS-T)[13]; Anti-sfAkt phospho-Ser477 (1:1000) [24]; Anti-sfAkt C-terminal 88 amino acids fragment (1:1000, Can Get sol. 1)[25]; Anti-Cdk1 phospho-Tyr15 (1:1000, Can Get sol. 1); Anti-Cdk1 (PSTAIR) (1:1000, Can Get sol. 1); Anti-mouse Rac1 (clone 23A8, Sigma-Aldrich, St. Louis, MO, USA) (1:1000, in TBS-T); Anti-Myc tag (Cat# ab9106, Abcam, Cambridge, UK) (1:1000, Can Get sol. 1). HRP-conjugated secondary antibodies (anti-rabbit IgG or anti-mouse IgG) were used at a 1:2000 dilution in TBS-T or Can Get sol. 2. Proteins reactive with the antibodies were detected using the ECL Prime Western Blotting Detection System (GE Healthcare, Chicago, IL, USA). Digital images were captured with the LAS-4000mini Luminescent Image Analyzer (FUJIFILM Wako Pure Chemical, Osaka, Japan).
2.6. cDNA Cloning of Rac1
To get a cDNA encoding starfish homologue of Rac1, total mRNA was isolated from starfish immature oocytes using TRI regent (Molecular Research Center, OH, Cincinnati, USA). The first-strand cDNA library was prepared from total mRNA using SMARTerTM RACE cDNA Amplification Kit (Clontech, Mountain View, CA, USA). PCR was performed using starfish Rac1 gene-specific 3′primer (TGCAGCGGTATCAGAGTGTG) and a 5′ primer (GCGTGTTGGCTATTGCACTT). PCR products were purified by agarose gel electrophoresis and extracted from the gel using the Wizard SV Gel and PCR Clean-Up System (Promega, Madison, WI, USA). Purified PCR products were cloned into a pCR2.1-TOPO vector (Invitrogen, Carlsbad, CA, USA), and insert sequences were determined using Sanger sequencing with the Applied Biosystems™ 3130 DNA Analyzers (Applied Biosystems, Waltham, MA, USA).
2.7. DNA Constructs
To express wild Rac1 in starfish oocytes, starfish Rac1 was amplified by PCR using primers having myc-tag sequence (forward: 5′- CAGAAGCTGATCTCAGAGGAGGACCTGATGCAAGCCATCAAATGTGTCG-3′, and reverse: 5′- GTGGTAACCAGATCTTTATATCAAGCTGCATTTGGGCC-3′), followed by PCR using primers for In-Fusion (forward: 5′- ACCGAATTCTACAATATGGAGCAGAAGCTGATCTCAGAGGAGG-3′, and reverse: 5′- GTGGTAACCAGATCTTTATATCAAGCTGCATTTGGGCC-3′). The psfSGK vector including A. pectinifera cyclin B Kozak sequence (5′-TACAAT-9′)[13] was amplified by PCR using primers (forward: 5′- AGATCTGGTTACCACTAAACCAGCCTCAAG -3′, and reverse: 5′- ATTGTAGAATTCGGTACCGATCTGCCAAAG-3′). These fragments were ligated using In-Fusion HD Cloning Kit (Clontech, Mountain View, CA, USA) and the resultant plasmid was named psfRac1_WT.
To express constitutively active Rac1 (Q61L) in starfish oocytes, psfRac1_WT was amplified using primers for mutagenesis (forward: 5′-GCGGGACTGGAGGACTACGACAGACT-3′, and reverse: 5′- GTCCTCCAGTCCCGCCGTATCCCACA -3′) and PrimeSTAR® Mutagenesis Basal Kit (Takara Bio, Shiga, Japan), and the resultant plasmid was named psfRac1_CA.
To express fluorescence resonance energy transfer (FRET) sensor visualizing an activity of Rac1 in starfish oocytes, RaichuEV-Rac1 sequence was amplified using pCAGGS-RaichuEV-Rac1 [26] and specific primers (forward: 5′-ACCGAATTCTACAATGCTGGTTGTTGTGCTGTCTC-3′, and reverse: 5′- TTCTTGAGGCTGGTTGTCAGATGCTCAAG GGCTT-3′), followed by ligation with the psfSGK vector amplified using primers (forward: 5′-AACCAGCCTCAAGAACACCCG-3′, and reverse: 5′-ATTGTAGAATTCGGTACCGATCTGCC-3′) and In-Fusion HD Cloning Kit (Clontech, Mountain View, CA, USA). The resultant plasmid was named psfRaichuEV-Rac1.
The in vitro transcription of wild Rac1(psfRac1_WT), mutant Rac1 (psfRac1_CA) and RaichuEV-Rac1 was performed using the mMESSAGE mMACHINE T7 kit (Ambion Thermo Fisher Scientific, Waltham, MA, USA) and poly A tailing kit (Ambion Thermo Fisher Scientific, Waltham, MA, USA). They were purified using phenol/chloroform extraction and ethanol precipitation.
2.8. Microinjection
Microinjection was performed as previously described [8]. Briefly, the oocytes were injected using a constricting pipet filled with in vitro synthesized RNAs (10pg/oocyte), Suc1 protein (1ng/oocyte), or anti-SGK antibody (200pg/oocyte). Injected oocytes were incubated for the indicated periods.
2.9. Rac1 Pull Down
Active Rac1 of starfish was pull down using Rac activation kit Cat#17-283(Merck Millipore, Darmstadt, Germany): Sedimented 1000 oocytes were frozen in liquid nitrogen, dissolved in 50µL Mg2+ Lysis/Wash Buffer (25mM HEPES pH 7.5, 150mM NaCl, 5% lgepal CA-630, 50mM MgCl2, 5mM EDTA, 10% glycerol, 10% artificial seawater, protease inhibitor cocktail; Merck, Darmstadt, Germany), and then mixed occasionally for 30 minutes on ice. The supernatant (oocyte lysate) was recovered by centrifugation (14,000rpm, 15min). PAK1 agarose beads to pull down Rac1 were incubated in the oocyte lysate with GTPγS or GDP. PAK1 agarose beads were washed with Mg2+ Lysis/Wash Buffer for 3 times, and boiled in sample buffer for SDS-PAGE to release Rac1 from the beads. Rac1 protein were transferred to PVDF membranes (Merck, Darmstadt, Germany) using a semi-dry blotting system. Rac1 on the membrane was detected using Anti-mouse Rac1 (clone 23A8, Sigma-Aldrich, St. Louis, MO, USA) (1:1000, in TBS-T);
2.10. FRET Measurement Using Confocal Microscopy
The RaichuEV-Rac1 biosensor, which consists of the donor CFP and acceptor YFP, was expressed in starfish oocytes by microinjection of the mRNA. Excitation of CFP was performed at a wavelength of 405 nm, and emitted fluorescence from CFP (415–511 nm) and YFP (514–604 nm) was detected using a laser scanning confocal microscope (LSM710, Carl Zeiss, Germany) with a scan time of 3.87 seconds. Given that the molar ratio of CFP to YFP in the RaichuEV-Rac1 biosensor remains constant at every pixel, the FRET efficiency was calculated as the simple ratio between the fluorescence intensities of CFP and YFP (YFP intensity/CFP intensity) [27]. To calculate the average fluorescence intensities, regions of interest (ROI) encompassing individual oocytes were determined. CFP and YFP fluorescence intensities were measured during 1-MA treatment, exported in Excel format, and processed to generate line graphs. To visualize FRET images during the time course of 1-MA treatment, pixel-based calculations of the FRET efficiency (YFP-to-CFP ratio) were performed using Carl Zeiss software ZEN.
3. Results and Discussion
3.1. Changes in FE Formation upon 1-MA Stimulation and the Involvement of Rac1 in the No FE Phase
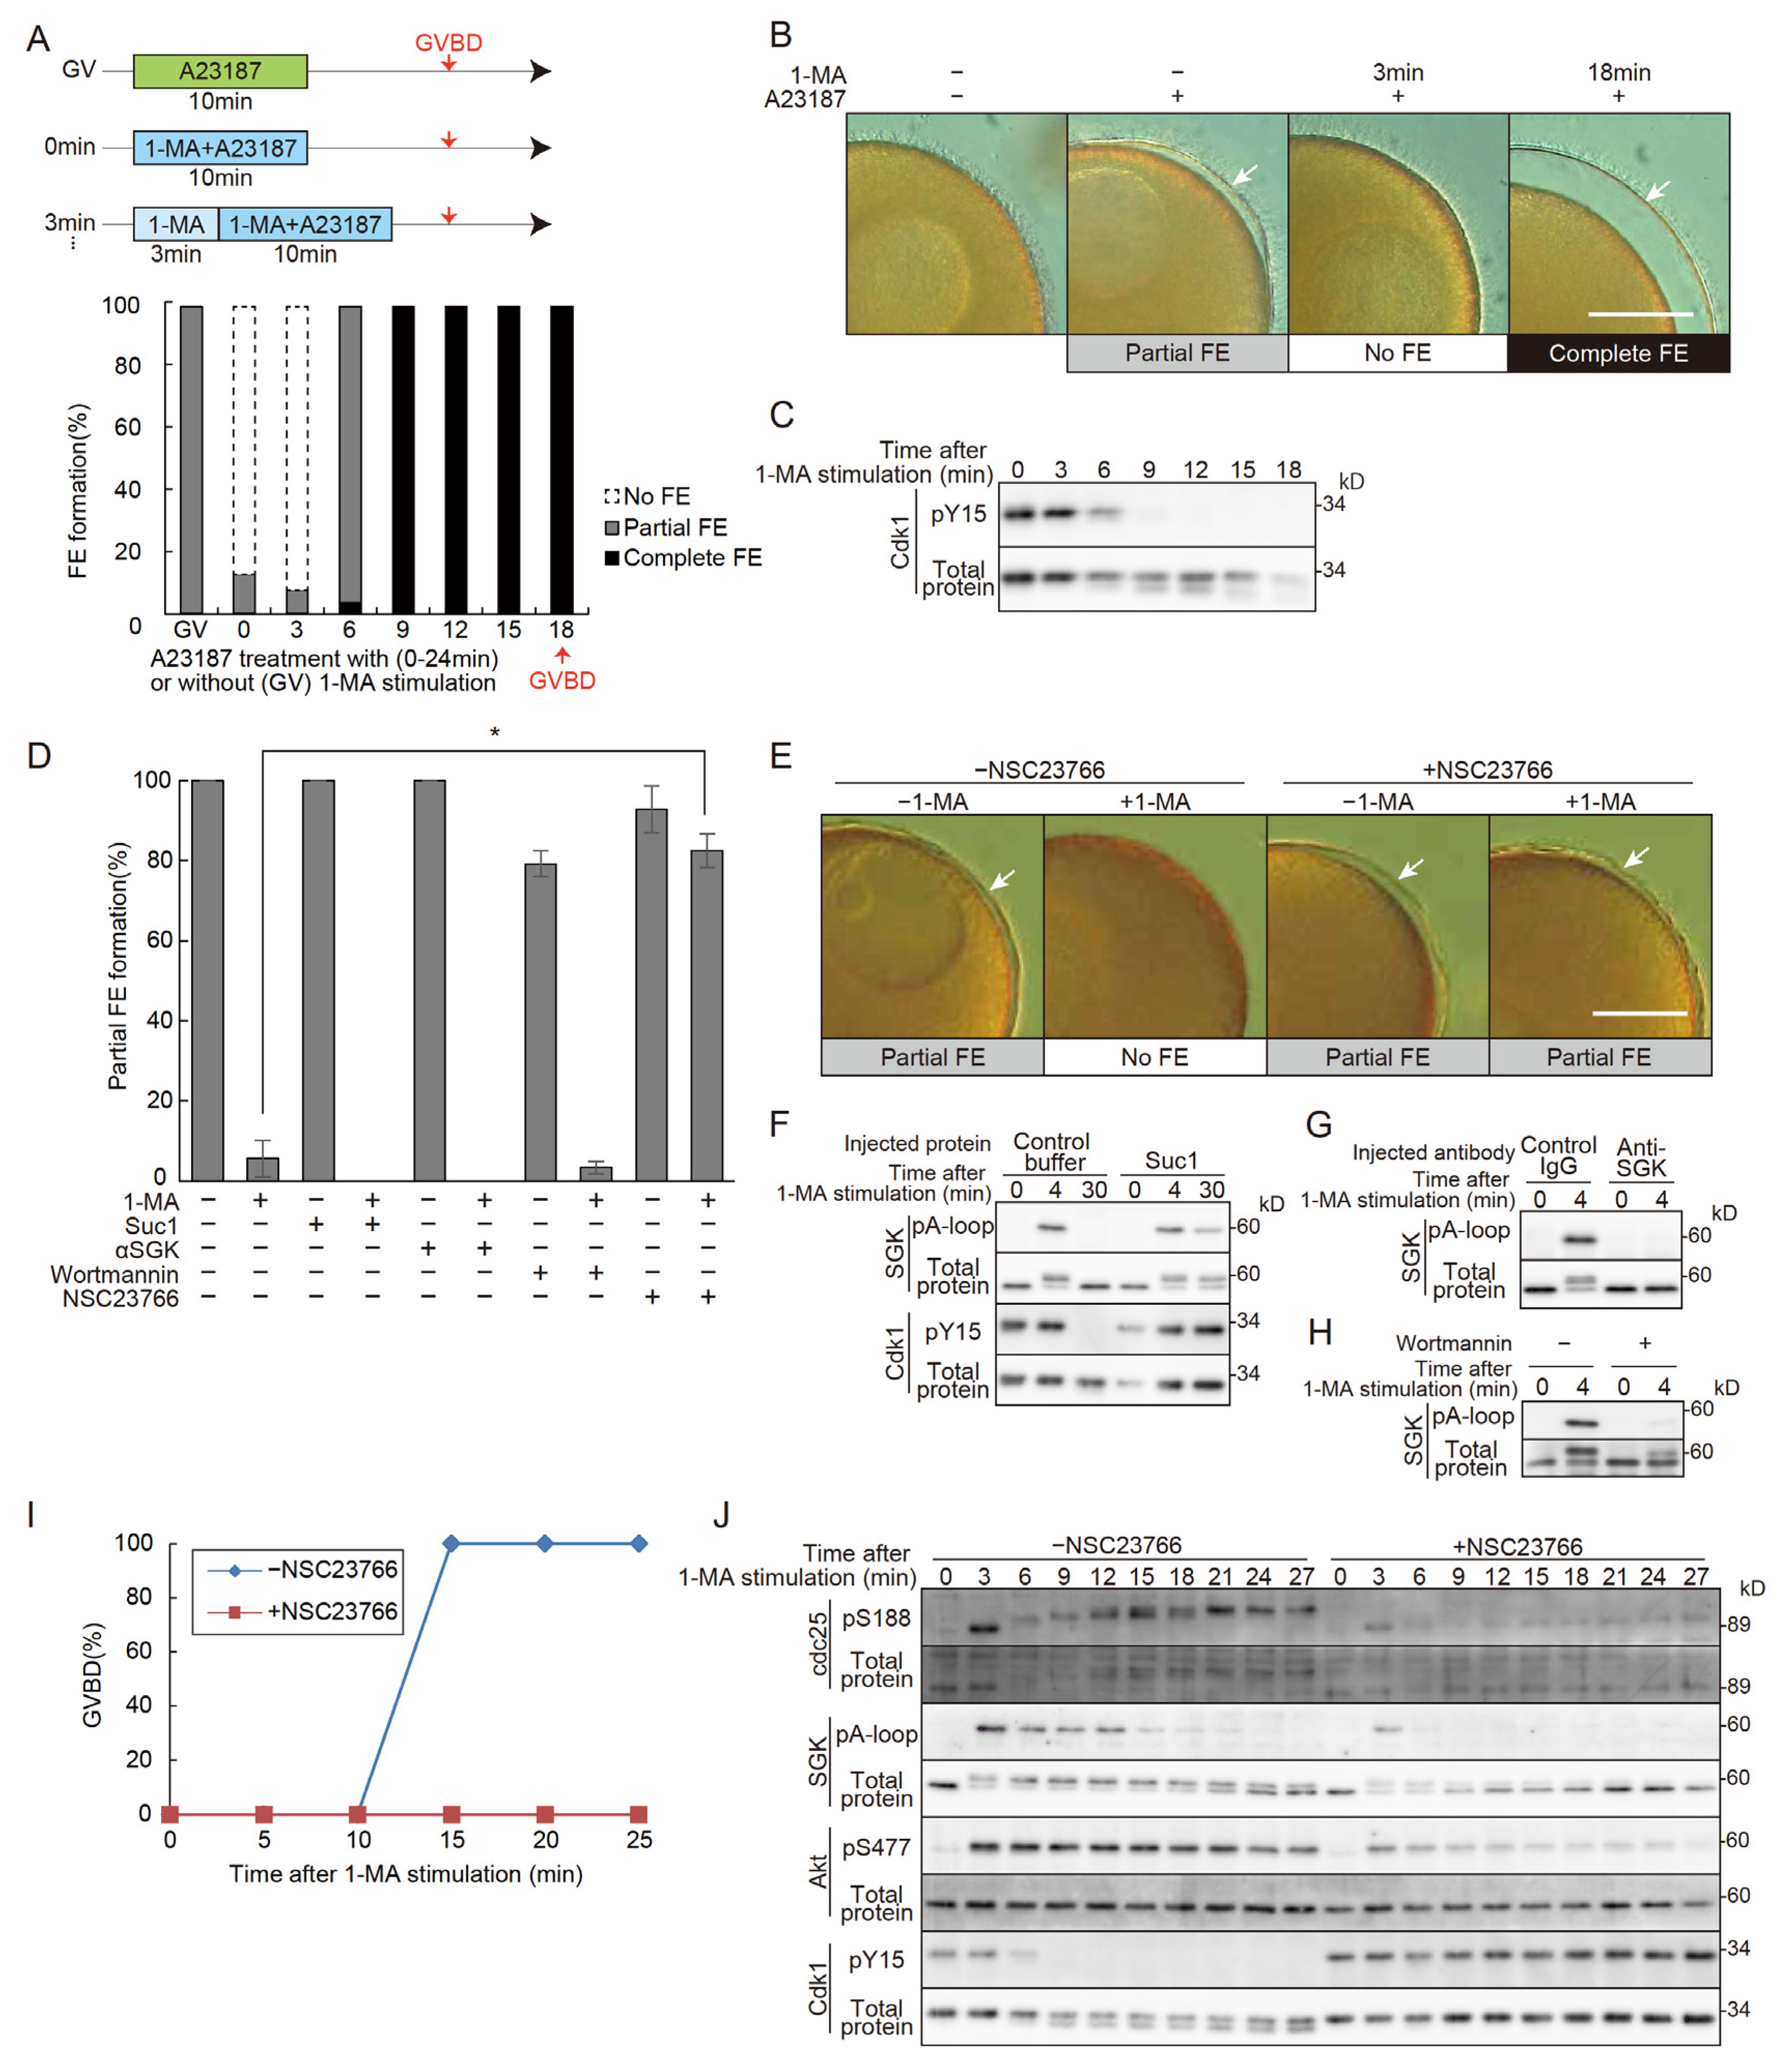
It has been established that co-treatment with 1-MA and A23187 prevents fertilization envelope (FE) formation and that the full ability to form an FE is only acquired after GVBD [3]. However, the precise timing of the recovery of FE-forming capacity following 1-MA treatment remained unclear. To address this, oocytes were treated with A23187 for 10 minutes at 3, 6, 9, and 12 minutes after 1-MA exposure. The results revealed that the loss of FE-forming ability persisted until 6 minutes after 1-MA treatment (Figure 1A,B). We define this period as the “no FE phase”. By 9 minutes, the no FE phase ended, and the oocytes regained the ability to form a complete FE. In this batch, GVBD occurred at 18 minutes, indicating that the no FE phase concludes at approximately half the time required for GVBD. Notably, dephosphorylation of Cdk1 was observed at the end of the no FE phase (Figure 1A,C), suggesting that Cdk1 activation may be involved in the termination of this phase. Similarly, oocytes from other individuals exhibited no FE phases that ended at about half the time to GVBD, coinciding with the activation of Cdk1 (Figure S1).
To identify the molecular components of the 1-MA signaling pathway involved in the initiation of the no FE phase, we injected Suc1, an inhibitor of Cdk1/cyclin B [28,29], into immature oocytes. Following A23187 treatment, these oocytes formed partial FEs (Figure 1D,F). Similarly, partial FE formation was observed when oocytes were injected with a functional-blocking antibody against SGK or treated with a PI3K inhibitor (Figure 1D,G,H). These findings indicate that the signaling cascade downstream of PI3K does not contribute to the initiation of the no FE phase.
Next, we tested the effect of NSC23766, an inhibitor of guanine-nucleotide exchange factor (GEF)/Rac1, which is potentially activated by Gβγ[30]. NSC23766 treatment allowed formation of the partial FE to occur with simultaneous application of 1-MA and A23187 (Figure 1D,E). Furthermore, NSC23766 not only inhibited 1-MA-induced GVBD (Figure 1I) but also blocked the activation of SGK, Akt, Cdc25, and Cdk1/cyclin B (Figure 1J). These findings indicate that Gβγ activates both the PI3K and GEF/Rac1 signaling pathways, with the latter playing a pivotal role in initiating the no FE phase. It is also possible that GEF/Rac1 corresponds to the signaling cascade that could not be activated by mutant Gβγ [15].
Figure 1.
Changes in FE formation upon 1-MA stimulation and the involvement of Rac1 in the no FE phase. (A) The upper panel illustrates the experimental schedule, while the lower panel presents the results. In the upper panel: GV, untreated condition; 0 min, stimulation with both 1-MA and A23187 for 10 minutes; 3 min, treatment with 1-MA alone for 3 minutes, followed by the addition of A23187 and continued stimulation with both reagents for 10 minutes. In the lower panel: The proportion of partial or absent FE (no FE) formation is shown for the GV, 0 min, and 3 min conditions. Additionally, treatments at 6, 9, 12, 15, and 18 min involved stimulation with 1-MA alone for the specified durations, followed by the additional A23187 plus 1-MA treatments for 10 minutes. The proportion of partial or complete FE formation is shown. (B) Representative images of fertilization envelopes observed in the experiments described in (A). Scale bar: 100 μm. Arrows indicate partial or complete FE. (C) In the same oocytes used in (A), samples were collected every 3 minutes following 1-MA stimulation, and Cdk1 dephosphorylation was monitored by Western blotting. The no FE phase terminated in parallel with the onset of Cdk1 dephosphorylation, showing Cdk1 activation. (D) Fertilization envelope formation rates were quantified following microinjection of Suc1 protein or anti-SGK inhibitory antibodies into oocytes, or after treatment with Wortmannin or NSC23766, followed by co-stimulation with 1-MA and A23187. While the no FE phase was maintained in the Suc1, anti-SGK, and Wortmannin treatments, oocytes treated with 100 μM NSC23766 displayed a higher proportion of partial FE formation, with the no FE phase abolished compared to controls Error bars indicate the standard error of the mean for three independent experiments. A Tukey HSD test (p < 0.05). (E) Representative images of fertilization envelopes observed in the NSC23766 treatment described in (D). Scale bar: 100 μm. Arrows indicate partial FEs. (F) Cdk1 inactivation following Suc1 treatment was monitored by Western blotting. (G) SGK inhibition in oocytes injected with anti-SGK antibodies was monitored by Western blotting. (H) SGK inhibition by Wortmannin treatment was monitored by Western blotting. (I) GVBD rates were plotted following 1-MA stimulation in NSC23766-treated oocytes. Treatment with 100 μM NSC23766 inhibited GVBD. (J) Western blot analysis was performed on samples collected every 3 minutes following 1-MA stimulation in NSC23766-treated oocytes. Although SGK was partially phosphorylated at 3 minutes, subsequent dephosphorylation was observed, with complete dephosphorylation of Cdk1 not occurring.
3.2. Presence and Activity of Rac1 Protein in Starfish Oocytes
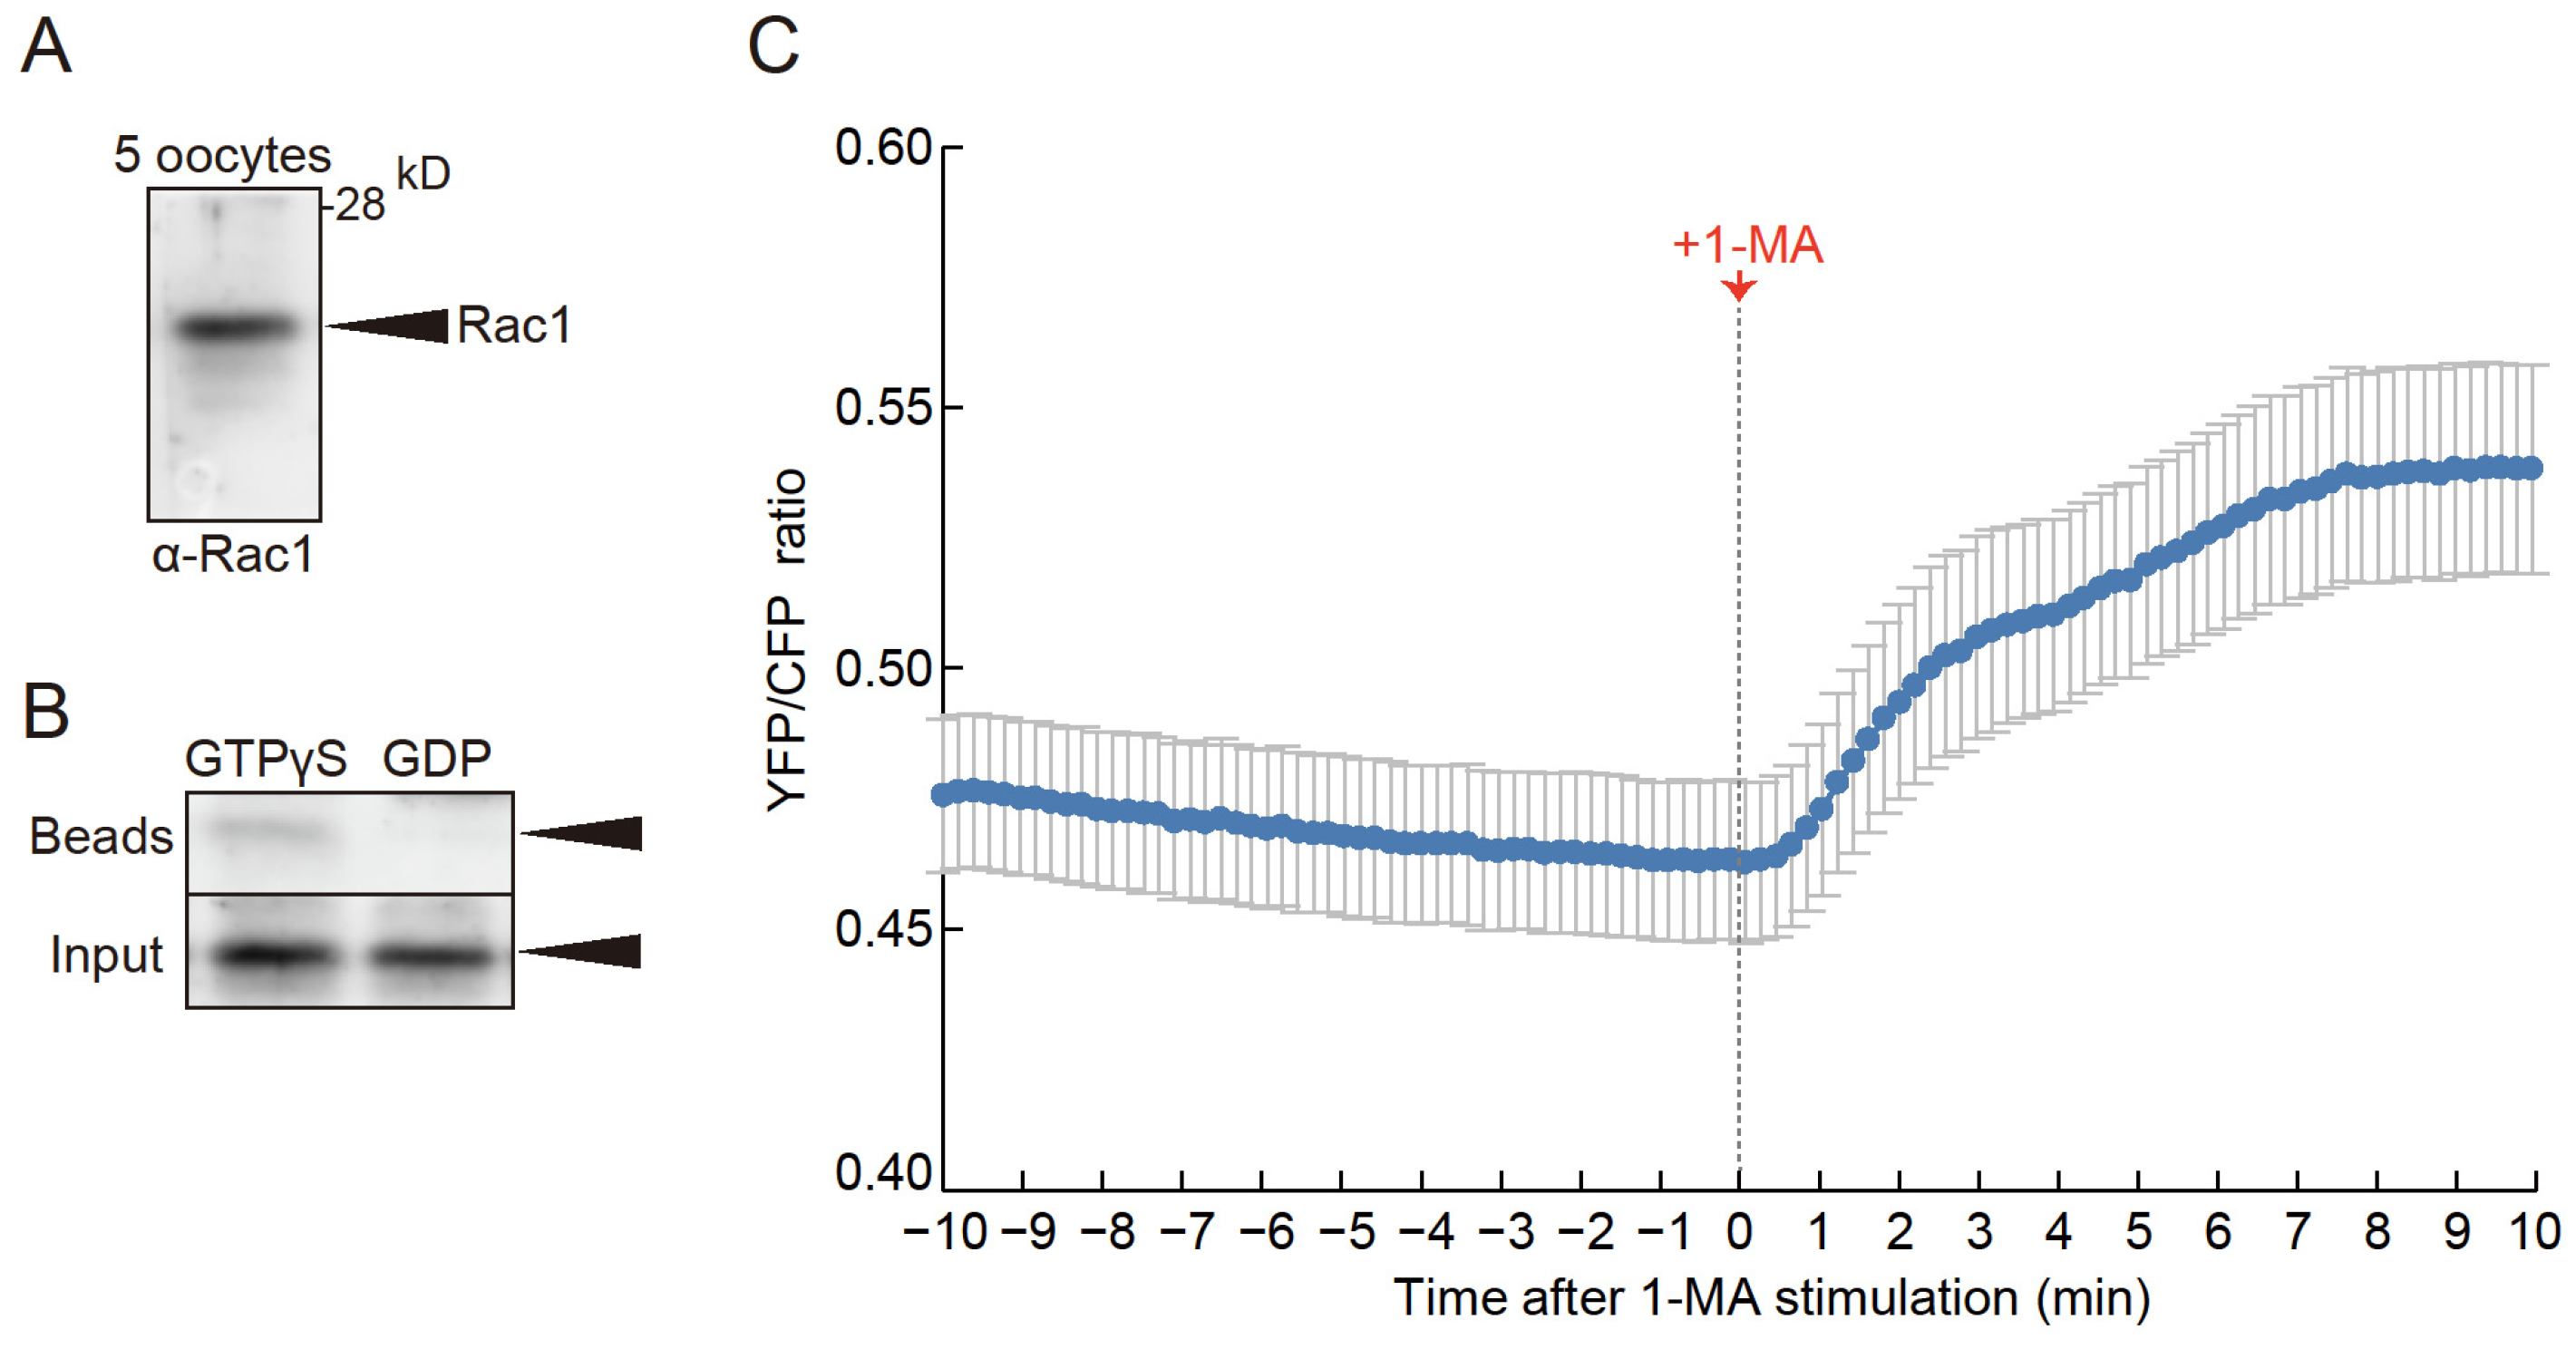
To confirm the expression of Rac1 in starfish oocytes, we performed Western blot analysis using an anti-mammalian Rac1 antibody, which detected a 21-kDa band (Figure 2A). Since active mammalian Rac1 is known to interact with PAK1 [31], we conducted a pull-down assay with mammalian PAK1-conjugated beads and lysates from starfish oocytes in the presence of GTPγS to activate Rac1. A 21-kDa band was observed in samples treated with GTPγS (Figure 2B, lane 1), but not in samples treated with GDP, which maintains Rac1 in its inactive state (Figure 2B, lane 2). These findings confirm that the 21-kDa band corresponds to starfish Rac1.
Furthermore, expression of a FRET sensor for Rac1[32] within oocytes revealed that 1-MA stimulation led to an increase in FRET signal (Figure 2C, Video S1), confirming that Rac1 is not only present in starfish oocytes but is also activated in a 1-MA-dependent manner.
Figure 2.
Presence and activity of Rac1 protein in starfish oocytes. (A) Western blotting with anti-mammalian Rac1 antibodies confirmed the presence of Rac1 in oocytes, with a band detected near the expected molecular weight of 21 kDa. (B) Lysates from immature oocytes were treated with either GTPγS (lane 1) or GDP (lane 2) and subjected to pulldown assays using beads conjugated with mammalian PAK1. The GTPγS-treated lysates showed stronger bands, while GDP-treated lysates displayed weaker bands, indicating that Rac1 from starfish oocytes interacts with mammalian PAK1. Arrows indicate Rac1 bands. (C) Using a FRET sensor, endogenous Rac1 activity during oocyte maturation was monitored in real-time. Upon 1-MA stimulation, Rac1 activity increased. Error bars indicate the standard error of the mean for ten independent experiments.
3.3. Constitutively Active Rac1 Induces the No FE Phase
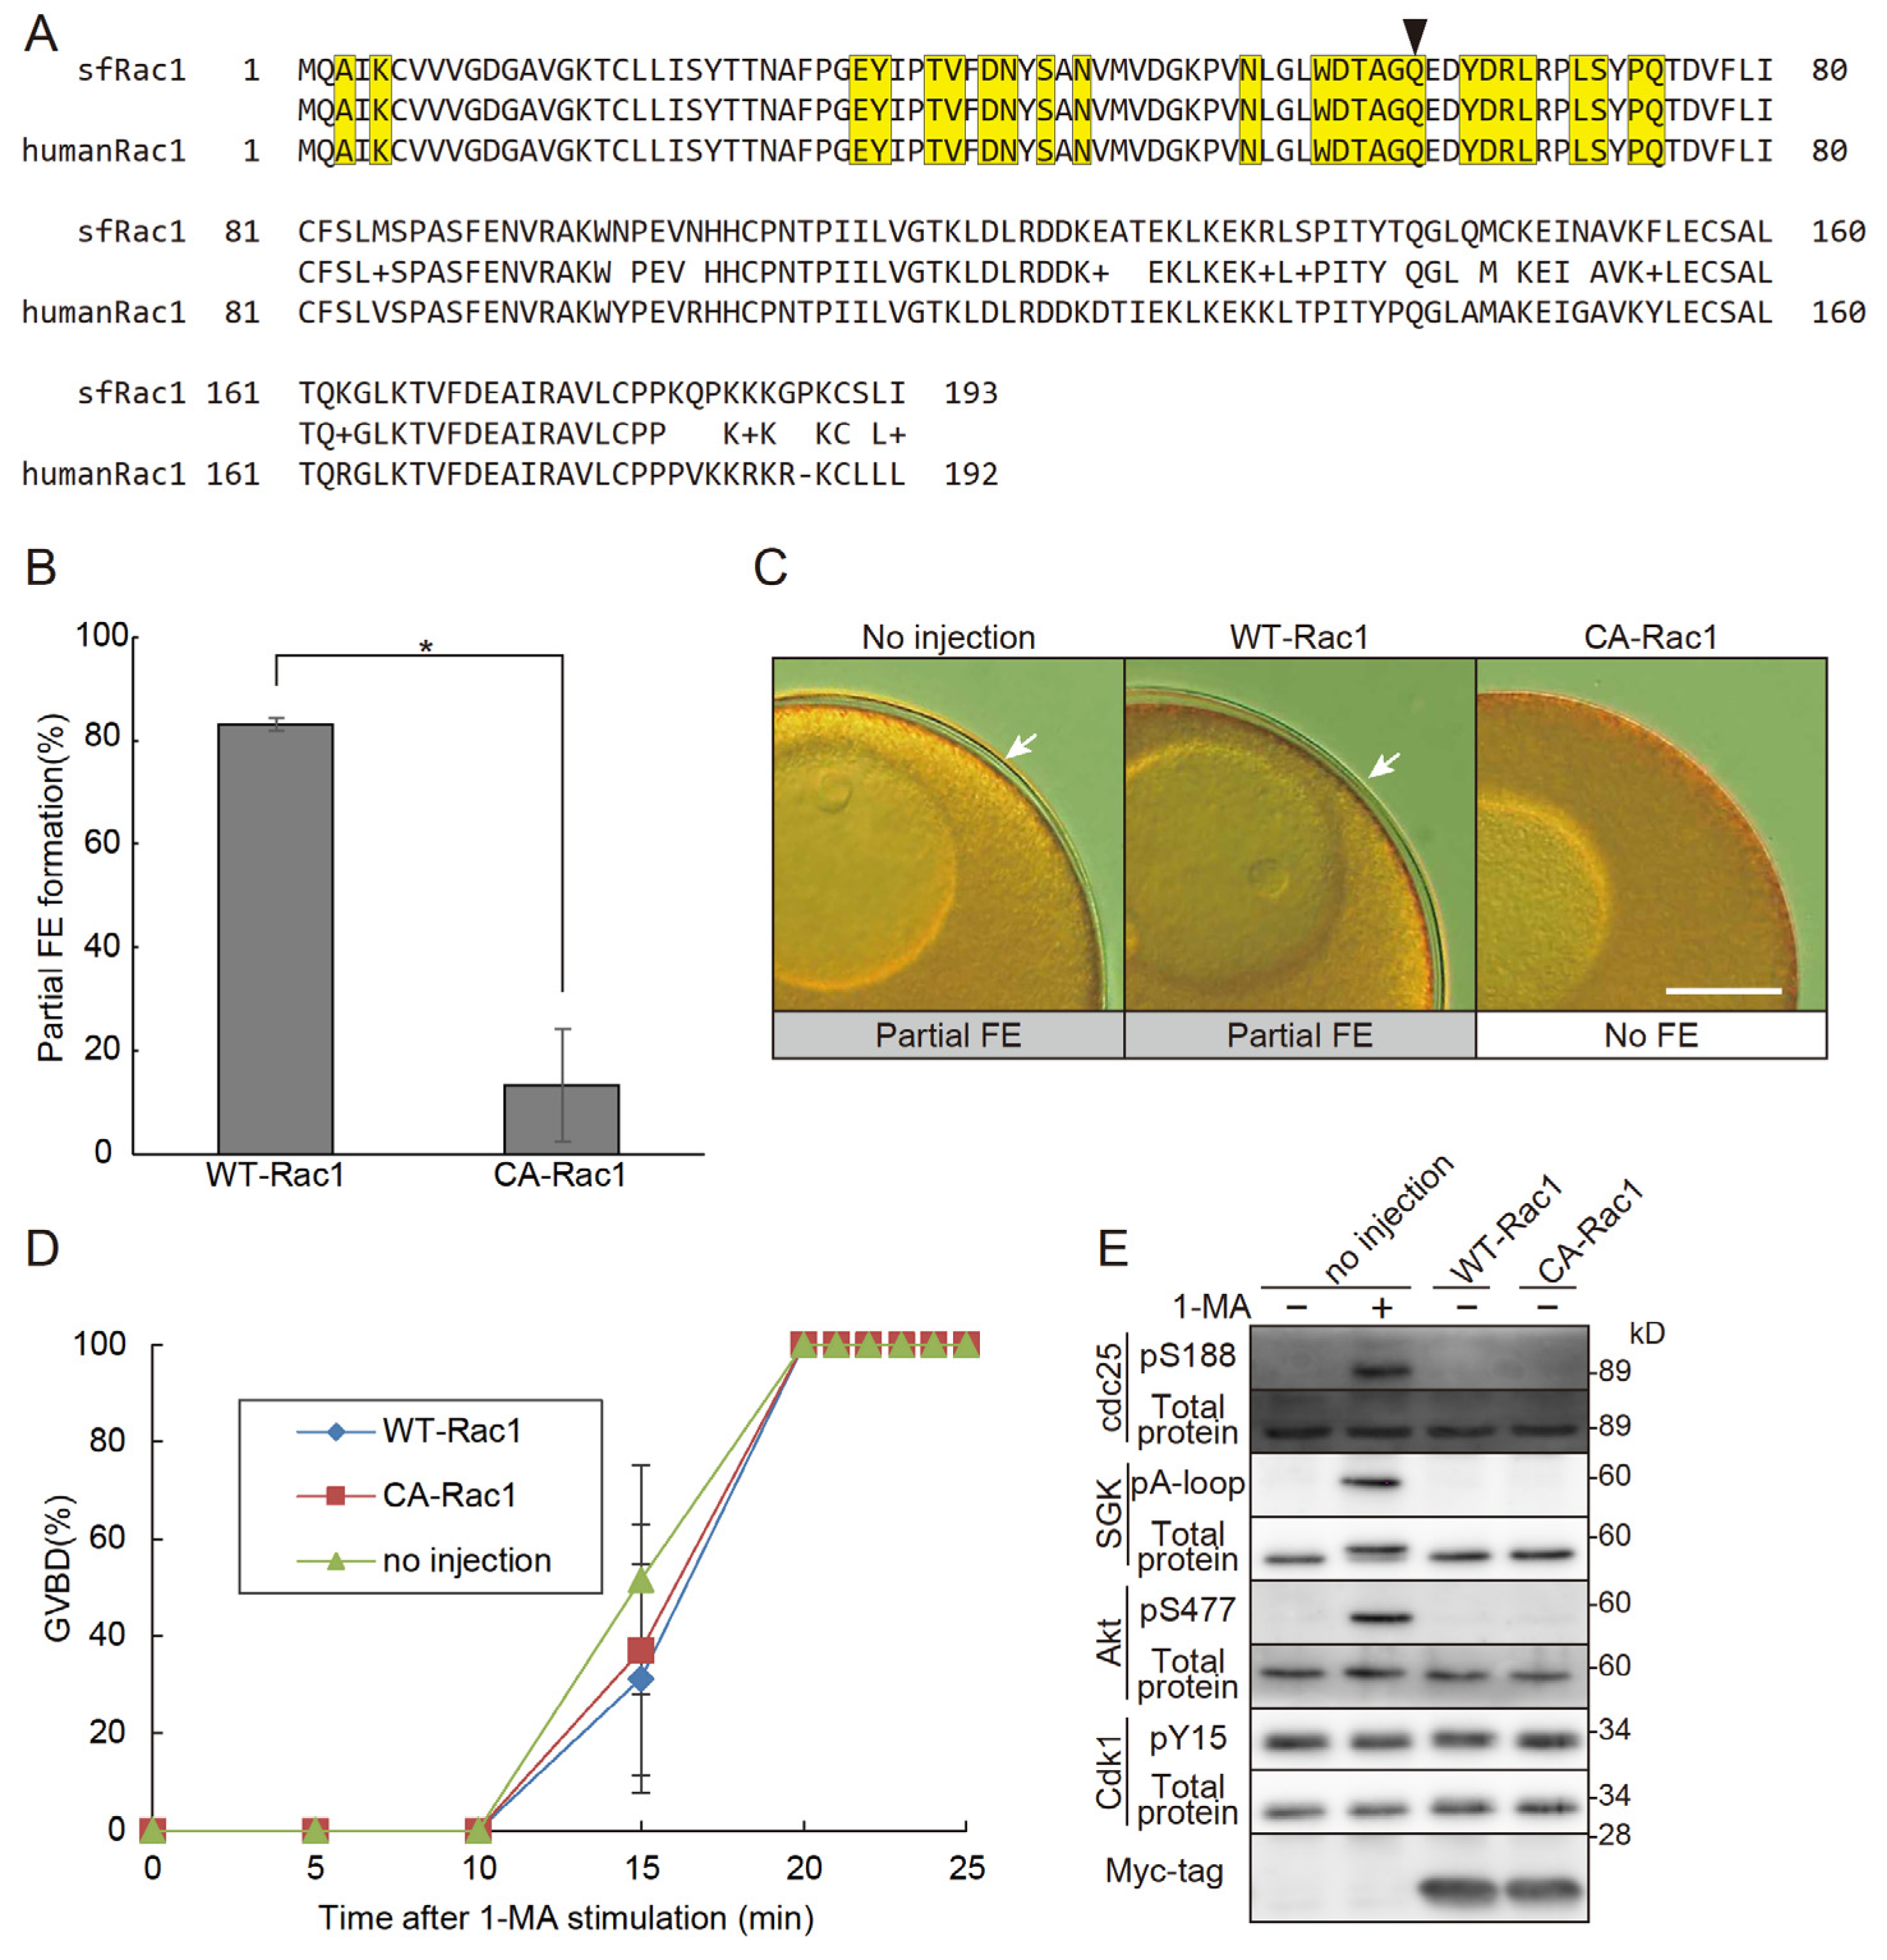
If Rac1 is truly involved in the no FE phase, the expression of active Rac1 within oocytes should induce this phase. To test this, we cloned the cDNA of starfish Rac1 and generated a constitutively active Rac1 mutant. The amino acid sequence of the cloned sfRac1 showed a high degree of similarity to that of human Rac1 (Figure 3A). Notably, the amino acid sequence at the GEF interaction site of sfRac1 was identical to that of human Rac1. As expected, expression of the constitutively active Rac1 triggered the no FE phase independently of 1-MA stimulation (Figure 3B,C). Importantly, this constitutively active Rac1 did not inhibit 1-MA-dependent GVBD, confirming that it does not interfere with the 1-MA signaling pathway (Figure 3D). These results strongly suggest that the inhibition of FE formation was not caused by unintended toxicity from constitutively active Rac1 but rather by its specific involvement in the no FE phase. Notably, the expression of Rac1 alone did not induce GVBD, nor did it activate the molecules involved in GVBD (Figure 3E).
How Rac1 induces the no FE phase remains to be determined, but its known role in actin polymerization suggests that actin may be involved. Rac1 promotes the formation of branched actin filament networks through the WAVE complex, contributing to the formation of lamellipodia [33]. Indeed, it is well established that the structure and dynamics of the cortical F-actin of immature oocytes are dramatically reorganized following 1-MA stimulation to make the mature oocyte successfully fertilizable [20,22,34,35,36].
The physiological significance of the no FE phase may lie in preventing “erroneous” FE formation triggered by the transient calcium increase induced by 1-MA. Physiological FE formation is normally induced by intracellular calcium elevation following fertilization, which occurs after GVBD. Therefore, a mechanism that prevents premature FE formation in response to earlier calcium increases is essential. Our findings demonstrate that 1-MA-dependent Rac1 activation ensures that FE formation does not occur in response to the transient calcium rise induced by 1-MA. Future studies elucidating how the GEF pathway contributes to SGK activation may provide further insights into the mechanisms underlying the resumption of meiosis.
Figure 3.
Constitutively active Rac1 induces the no FE phase. (A) The amino acid sequence of sfRac1 was aligned with that of human Rac1 (Sequence ID: NP_008839.2). The middle column represents the quality of the alignment: identical amino acids are shown as letters, “+” indicates amino acids with similar characteristics, and dashes represent gaps. Yellow boxes highlight the GEF interaction site. The arrow marks the glutamine residue replaced by leucine to generate constitutively active sfRac1 (Q61L). (B) Oocytes expressing constitutively active Rac1 (CA-Rac1) were treated with A23187, and the rates of partial FE formation were assessed. Oocytes expressing CA-Rac1 exhibited no FE. Error bars indicate the standard error of the mean for three independent experiments. Student’s t-test (p<0.05). (C) Representative images of fertilization envelopes from the CA-Rac1 experiments in (B). Scale bar: 100 μm. Arrows indicate partial FEs. (D) GVBD rates were plotted following 1-MA stimulation in CA-Rac1-expressing oocytes. Expression of CA-Rac1 did not induce spontaneous GVBD, nor did it accelerate the timing of GVBD. Error bars indicate the standard error of the mean for three independent experiments. (E) Western blot analysis was performed on CA-Rac1-expressing oocytes. Expression of CA-Rac1 did not alter the phosphorylation status of SGK or Cdk1.
Supplementary Materials
The following supporting information can be downloaded at the website of this paper posted on Preprints.org, Figure S1: Changes in FE formation in response to 1-MA stimulation in different starfish specimens. (A) The experimental setup shown in Figure 1A was repeated using two different starfish specimens (Starfish no.1 and Starfish no.2). Consistent with the observations in Figure 1A, the no FE phase concluded prior to GVBD, and complete FE formation commenced before GVBD. (B) Cdk1 dephosphorylation was monitored in the same specimens, demonstrating that the termination of the no FE phase coincided with Cdk1 dephosphorylation. Figure S2: Original Western blot data. (A) Original data from Figure 1. (B) Original data from Figure 2. (C) Original data from Figure 3. (D) Original data from Figure S1. Video S1: Live imaging of Rac1 activity in starfish oocytes using a FRET sensor. Live imaging was performed to monitor Rac1 activity in response to 1-MA stimulation using a FRET sensor. The oocyte was treated with 1-MA 10 minutes after the start of the movie. A significant increase in Rac1 activity was observed following 1-MA stimulation.
Author Contributions
Conceptualization, SA, TM, YY, NL, LS, KC; methodology, SA, TM, YY, KC; formal analysis, SA, TM, YY, NL, LS, KC; investigation, SA, TM, YY, NL, LS, KC; writing—original draft preparation, KC writing—review and editing, SA, TM, YY, NL, LS, KC; supervision, KC; project administration, KC; funding acquisition, KC. All authors have read and agreed to the published version of the manuscript.
Funding
This work was supported by JSPS KAKENHI [Grant Number JP17K07405, 21K06185 to K.C., the Takeda Science Foundation and the Cooperative Program provided by the Atmosphere and Ocean Research Institute, The University of Tokyo. The research received funding from the ASSEMBLE Plus/Stazione Zoologica Anton Dohrn project (contract number 13533) through a Transnational access project.
Institutional Review Board Statement
Ethical review and approval were waived for this study in accordance with the Ochanomizu University ethics committee’s policy, which states that ethical review is not required for research involving non-mammalian species such as starfish.
Informed Consent Statement
This study did not involve humans.
Data Availability Statement
GenBank accession numbers of sf Rac1 is LC848442.
Acknowledgments
We thank M. Matsuda (Kyoto University, Kyoto, Japan) for providing pCAGGS-RaichuEV-Rac1, E. Okumura (Institute of Science Tokyo, Yokohama, Japan) for providing anti-sfCdc25 antibody, anti-sfAkt C-terminal fragment antibody and Suc1 protein, and D. Hiraoka (Ochanomizu University) for providing Anti-sfAkt phospho-Ser477 antibody.
Conflicts of Interest
The authors declare no conflict of interest.
References
- Kanatani, H.; Shirai, H.; Nakanishi, K.; Kurokawa, T. Isolation and Identification on Meiosis Inducing Substance in Starfish Asterias amurensis. Nature 1969, 221, 273–274. [CrossRef]
- Fujimori, T.; Hirai, S. Differences in Starfish Oocyte Susceptibility to Polyspermy during the Course of Maturation. Biological Bulletin 1979, 157, 249–257. [CrossRef]
- Chiba, K.; Hoshi, M. Three Phases of Cortical Maturation during Meiosis Reinitiation in Starfish Oocytes. Development, Growth & Differentiation 1989, 31, 447–451. [CrossRef]
- Chiba, K. Oocyte Maturation in Starfish. Cells 2020, 9, 476. [CrossRef]
- Chiba, K.; Kado, R.T.; Jaffe, L.A. Development of Calcium Release Mechanisms during Starfish Oocyte Maturation. Dev. Biol. 1990, 140, 300–306. [CrossRef]
- Iwasaki, H.; Chiba, K.; Uchiyama, T.; Yoshikawa, F.; Suzuki, F.; Ikeda, M.; Furuichi, T.; Mikoshiba, K. Molecular Characterization of the Starfish Inositol 1,4,5-Trisphosphate Receptor and Its Role during Oocyte Maturation and Fertilization. J. Biol. Chem. 2002, 277, 2763–2772. [CrossRef]
- Tadenuma, H.; Takahashi, K.; Chiba, K.; Hoshi, M.; Katada, T. Properties of 1-Methyladenine Receptors in Starfish Oocyte Membranes: Involvement of Pertussis Toxin-Sensitive GTP-Binding Protein in the Receptor-Mediated Signal Transduction. Biochem. Biophys. Res. Commun. 1992, 186, 114–121. [CrossRef]
- Chiba, K.; Tadenuma, H.; Matsumoto, M.; Takahashi, K.; Katada, T.; Hoshi, M. The Primary Structure of the Alpha Subunit of a Starfish Guanosine-Nucleotide-Binding Regulatory Protein Involved in 1-Methyladenine-Induced Oocyte Maturation. Eur. J. Biochem. 1992, 207, 833–838. [CrossRef]
- Shilling, F.; Chiba, K.; Hoshi, M.; Kishimoto, T.; Jaffe, L.A. Pertussis Toxin Inhibits 1-Methyladenine-Induced Maturation in Starfish Oocytes. Dev. Biol. 1989, 133, 605–608. [CrossRef]
- Chiba, K.; Kontani, K.; Tadenuma, H.; Katada, T.; Hoshi, M. Induction of Starfish Oocyte Maturation by the Beta Gamma Subunit of Starfish G Protein and Possible Existence of the Subsequent Effector in Cytoplasm. Mol. Biol. Cell 1993, 4, 1027–1034. [CrossRef]
- Jaffe, L.A.; Gallo, C.J.; Lee, R.H.; Ho, Y.K.; Jones, T.L. Oocyte Maturation in Starfish Is Mediated by the Beta Gamma-Subunit Complex of a G-Protein. J. Cell Biol. 1993, 121, 775–783. [CrossRef]
- Sadler, K.C.; Ruderman, J.V. Components of the Signaling Pathway Linking the 1-Methyladenine Receptor to MPF Activation and Maturation in Starfish Oocytes. Dev. Biol. 1998, 197, 25–38. [CrossRef]
- Hosoda, E.; Hiraoka, D.; Hirohashi, N.; Omi, S.; Kishimoto, T.; Chiba, K. SGK Regulates pH Increase and Cyclin B–Cdk1 Activation to Resume Meiosis in Starfish Ovarian Oocytes. J Cell Biol 2019, 218, 3612–3629. [CrossRef]
- Hiraoka, D.; Hosoda, E.; Chiba, K.; Kishimoto, T. SGK Phosphorylates Cdc25 and Myt1 to Trigger Cyclin B-Cdk1 Activation at the Meiotic G2/M Transition. J. Cell Biol. 2019, 218, 3597–3611. [CrossRef]
- Hiraoka, D.; Aono, R.; Hanada, S.-I.; Okumura, E.; Kishimoto, T. Two New Competing Pathways Establish the Threshold for Cyclin-B-Cdk1 Activation at the Meiotic G2/M Transition. J. Cell. Sci. 2016, 129, 3153–3166. [CrossRef]
- Coso, O.A.; Teramoto, H.; Simonds, W.F.; Gutkind, J.S. Signaling from G Protein-Coupled Receptors to c-Jun Kinase Involves Βγ Subunits of Heterotrimeric G Proteins Acting on a Ras and Rac1-Dependent Pathway (∗). Journal of Biological Chemistry 1996, 271, 3963–3966. [CrossRef]
- Niu, J.; Profirovic, J.; Pan, H.; Vaiskunaite, R.; Voyno-Yasenetskaya, T. G Protein Betagamma Subunits Stimulate p114RhoGEF, a Guanine Nucleotide Exchange Factor for RhoA and Rac1: Regulation of Cell Shape and Reactive Oxygen Species Production. Circ Res 2003, 93, 848–856. [CrossRef]
- Cervantes-Villagrana, R.D.; Adame-García, S.R.; García-Jiménez, I.; Color-Aparicio, V.M.; Beltrán-Navarro, Y.M.; König, G.M.; Kostenis, E.; Reyes-Cruz, G.; Gutkind, J.S.; Vázquez-Prado, J. Gβγ Signaling to the Chemotactic Effector P-REX1 and Mammalian Cell Migration Is Directly Regulated by Gαq and Gα13 Proteins. J Biol Chem 2019, 294, 531–546. [CrossRef]
- Santella, L.; De Riso, L.; Gragnaniello, G.; Kyozuka, K. Separate Activation of the Cytoplasmic and Nuclear Calcium Pools in Maturing Starfish Oocytes. Biochemical and Biophysical Research Communications 1998, 252, 1–4. [CrossRef]
- Kyozuka, K.; Chun, J.T.; Puppo, A.; Gragnaniello, G.; Garante, E.; Santella, L. Guanine Nucleotides in the Meiotic Maturation of Starfish Oocytes: Regulation of the Actin Cytoskeleton and of Ca2+ Signaling. PLOS ONE 2009, 4, e6296. [CrossRef]
- Kyozuka, K.; Chun, J.T.; Puppo, A.; Gragnaniello, G.; Garante, E.; Santella, L. Actin Cytoskeleton Modulates Calcium Signaling during Maturation of Starfish Oocytes. Dev Biol 2008, 320, 426–435. [CrossRef]
- Santella, L.; Limatola, N.; Vasilev, F.; Chun, J.T. Maturation and Fertilization of Echinoderm Eggs: Role of Actin Cytoskeleton Dynamics. Biochem Biophys Res Commun 2018, 506, 361–371. [CrossRef]
- Okumura, E.; Sekiai, T.; Hisanaga, S.; Tachibana, K.; Kishimoto, T. Initial Triggering of M-Phase in Starfish Oocytes: A Possible Novel Component of Maturation-Promoting Factor besides Cdc2 Kinase. J Cell Biol 1996, 132, 125–135. [CrossRef]
- Hiraoka, D.; Okumura, E.; Kishimoto, T. Turn Motif Phosphorylation Negatively Regulates Activation Loop Phosphorylation in Akt. Oncogene 2011, 30, 4487–4497. [CrossRef]
- Okumura, E.; Fukuhara, T.; Yoshida, H.; Hanada Si, S.; Kozutsumi, R.; Mori, M.; Tachibana, K.; Kishimoto, T. Akt Inhibits Myt1 in the Signalling Pathway That Leads to Meiotic G2/M-Phase Transition. Nat. Cell Biol. 2002, 4, 111–116. [CrossRef]
- Komatsu, N.; Aoki, K.; Yamada, M.; Yukinaga, H.; Fujita, Y.; Kamioka, Y.; Matsuda, M. Development of an Optimized Backbone of FRET Biosensors for Kinases and GTPases. Mol Biol Cell 2011, 22, 4647–4656. [CrossRef]
- Nakamura, T.; Aoki, K.; Matsuda, M. Monitoring Spatio-Temporal Regulation of Ras and Rho GTPases with GFP-Based FRET Probes. Methods 2005, 37, 146–153. [CrossRef]
- Kishimoto, T. MPF-Based Meiotic Cell Cycle Control: Half a Century of Lessons from Starfish Oocytes. Proceedings of the Japan Academy, Series B 2018, 94, 180–203. [CrossRef]
- Kusubata, M.; Tokui, T.; Matsuoka, Y.; Okumura, E.; Tachibana, K.; Hisanaga, S.; Kishimoto, T.; Yasuda, H.; Kamijo, M.; Ohba, Y. P13suc1 Suppresses the Catalytic Function of P34cdc2 Kinase for Intermediate Filament Proteins, in Vitro. J Biol Chem 1992, 267, 20937–20942.
- Gao, Y.; Dickerson, J.B.; Guo, F.; Zheng, J.; Zheng, Y. Rational Design and Characterization of a Rac GTPase-Specific Small Molecule Inhibitor. Proc Natl Acad Sci U S A 2004, 101, 7618–7623. [CrossRef]
- Frost, J.A.; Steen, H.; Shapiro, P.; Lewis, T.; Ahn, N.; Shaw, P.E.; Cobb, M.H. Cross-cascade Activation of ERKs and Ternary Complex Factors by Rho Family Proteins. The EMBO Journal 1997, 16, 6426–6438. [CrossRef]
- Itoh, R.E.; Kurokawa, K.; Ohba, Y.; Yoshizaki, H.; Mochizuki, N.; Matsuda, M. Activation of Rac and Cdc42 Video Imaged by Fluorescent Resonance Energy Transfer-Based Single-Molecule Probes in the Membrane of Living Cells. Mol Cell Biol 2002, 22, 6582–6591. [CrossRef]
- Chen, B.; Chou, H.-T.; Brautigam, C.A.; Xing, W.; Yang, S.; Henry, L.; Doolittle, L.K.; Walz, T.; Rosen, M.K. Rac1 GTPase Activates the WAVE Regulatory Complex through Two Distinct Binding Sites. eLife 2017, 6, e29795. [CrossRef]
- Schroeder, T.E. Microfilament-Mediated Surface Change in Starfish Oocytes in Response to 1-Methyladenine: Implications for Identifying the Pathway and Receptor Sites for Maturation-Inducing Hormones. J Cell Biol 1981, 90, 362–371. [CrossRef]
- Longo, F.J.; Woerner, M.; Chiba, K.; Hoshi, M. Cortical Changes in Starfish (Asterina pectinifera) Oocytes during 1-Methyladenine-Induced Maturation and Fertilisation/Activation. Zygote 1995, 3, 225–239. [CrossRef]
- Limatola, N.; Chun, J.T.; Kyozuka, K.; Santella, L. Novel Ca2+ Increases in the Maturing Oocytes of Starfish during the Germinal Vesicle Breakdown. Cell Calcium 2015, 58, 500–510. [CrossRef]
Disclaimer/Publisher’s Note: The statements, opinions and data contained in all publications are solely those of the individual author(s) and contributor(s) and not of MDPI and/or the editor(s). MDPI and/or the editor(s) disclaim responsibility for any injury to people or property resulting from any ideas, methods, instructions or products referred to in the content. |
© 2025 by the authors. Licensee MDPI, Basel, Switzerland. This article is an open access article distributed under the terms and conditions of the Creative Commons Attribution (CC BY) license (http://creativecommons.org/licenses/by/4.0/).
Copyright: This open access article is published under a Creative Commons CC BY 4.0 license, which permit the free download, distribution, and reuse, provided that the author and preprint are cited in any reuse.


