
Submitted:
09 January 2025
Posted:
10 January 2025
You are already at the latest version
Abstract
Composite Index of anthropometric failure (CIAF) studies co-occurences of three forms of child undernutrition-stunting (S), wasting (W) and underweight (U). The study attempts to modify it by inclusion of a fourth form of undernutrition, that is anemia (A), serving as a proxy for micronutrient deficiencies among under-five children of India. Descriptive Statistics, bivariate and multivariate analysis and spatial autocorrelation were used to analyse the co-occurences of child undernutrition w.r.t. child’s and mother’s characterstics using National Family Health Survey data. The modified index of “CIAF+Anemia” identified thirteen manifestations of child undernutrition in India, the most prevalent co-occurrence being “only anemia” (30%), followed by triple burden of co-occurrence of stunting, underweight and anemia (SUA) (12%). The prevalence of quadruple burden of child undernutrition (SWUA) was found to be highest in the state of Jharkhand and Gujarat (7%). Higher likelihood of burden "SUA"was observed among underweight mothers (16%), whereas that of "only anemia" among overweight mothers (35%) compared to their counterparts. The co-occurences of SUA and SWUA were found to be moderately clustered among districts of India (moran’s-I>0.5). Overall, the study re-inforces need of early identification and specialised treatment approaches for children burdened with multiple forms of undernutrition to prevent its scarring effect.
Keywords:
Co-occurences
; Stunting
; Wasting
; Underweight
; Anemia
; Child Undernutrition
; India
; NFHS
; CIAF
1. Introduction
Given the nutrition transition, characterised by changes in the food environment, physical activity, and lifestyle, the world is witnessing declining undernutrition levels and increasing overnutrition levels over time [1]. Hence, a common issue analysed in the literature is the burden of child malnutrition, which is on the rise. Even though India is witnessing an increasing trend in overnutrition, the findings of the latest NFHS, 2019-21, show worrisome rising levels of undernutrition and India is still found to be mainly burdened by various forms of child undernutrition. The WHO recommends cut-offs of 20% for stunting and 10% for overweight that were used to define the Dual Burden of Malnutrition (DBM) nationally.
As defined by WHO, undernutrition has four broad sub-forms: stunting, wasting, underweight, and deficiencies in vitamins and minerals [2]. Svedberg (2000) came up with the Composite indicator of Child Anthropometric failure (CIAF) to reflect the true burden of undernutrition at the individual level, studying all possible combinations of Stunting, Wasting and underweight together [3]. Such indices help identify communities or areas where many children experience multiple failures and allocate resources to areas of greatest need [4]. Below are the seven different categories of CIAF.
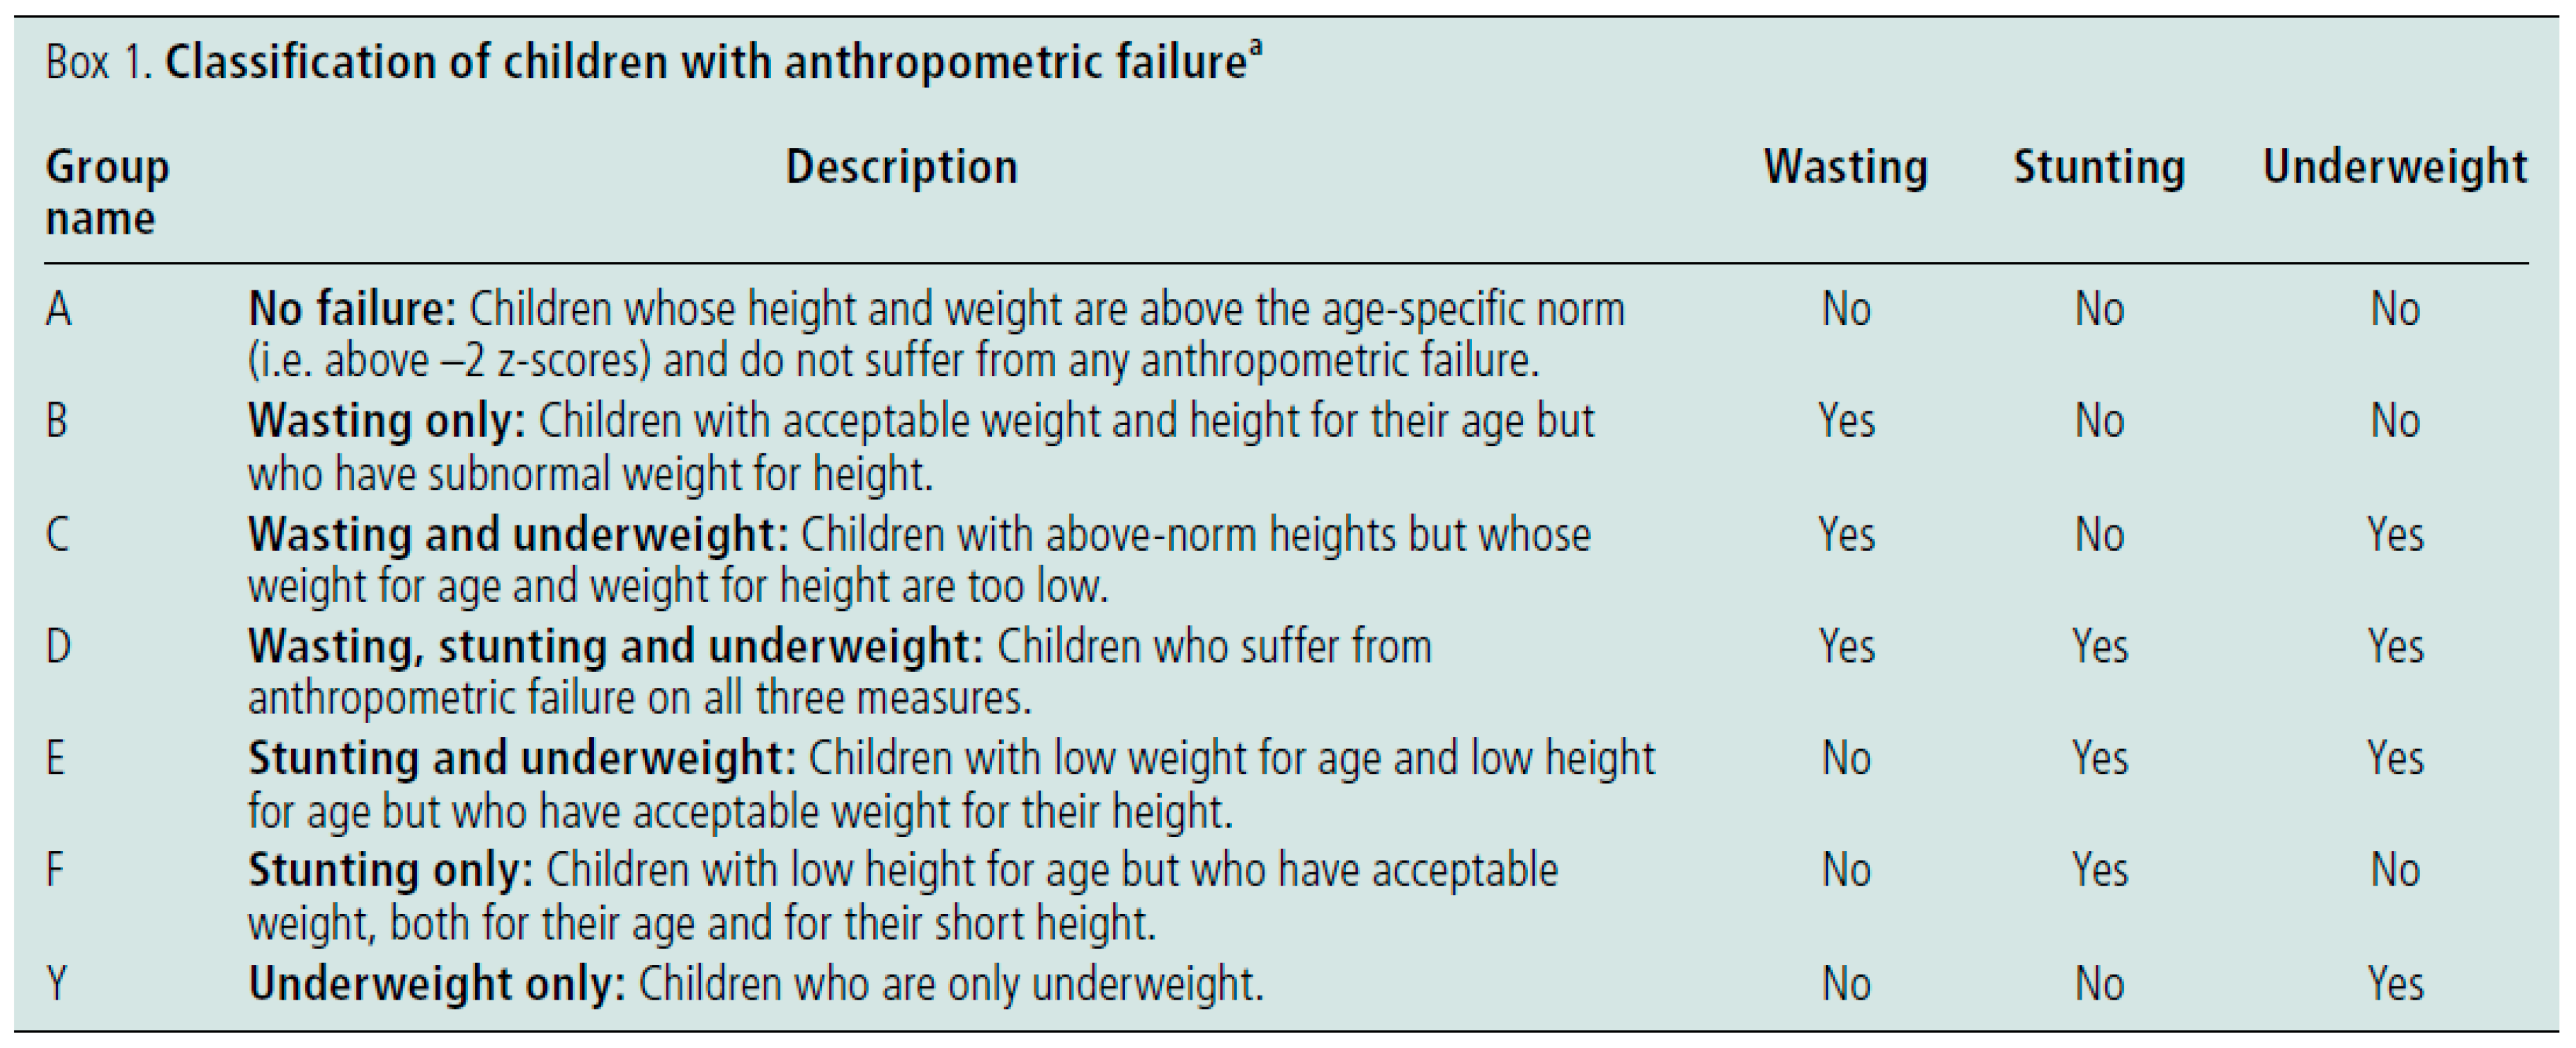
- Source: [5]
Quoted from a 2019 report by Govt. of India, Figure 3.1.2 is a Venn diagram showing the co-existence of multiple forms of undernutrition among under-5 children in India using NFHS 2015-16 data [6]. Among children aged 0-5 years, 6.5% of children were stunted, wasted as well as underweight; 18.4% of children were stunted, and underweight, and 8.2% of children were wasted and underweight. It revealed that after disaggregating the co-existence of these three conditions, 13.6% of children were only stunted (against 38.4% overall prevalence of stunting), 2.6% were only underweight (against 35.7% overall prevalence of underweight), and 6.3% (against 21% overall prevalence of wasting) were wasted. State-wise analysis showed that Jharkhand (10.9%) led with the highest prevalence of multiple burdens of malnutrition encompassing stunting, wasting and underweight conditions among under-five children, followed by Madhya Pradesh (8.5%) and Bihar (8.1%).
The fourth sub-form of undernutrition involves deficiencies in the intake of essential vitamins and minerals commonly known as micronutrients; when grouped with Stunting, Wasting, and underweight, it can help understand the real burden of undernutrition. Often, the triple form of malnutrition is defined as when child undernutrition, micronutrient deficiency and overweight/obesity co-exist. Essential micronutrients play a vital role in fostering physical growth as they help produce various necessary enzymes and hormones that aid in regulating biological processes in our body [7]. However, due to a lack of data, there is a shortage of literature that studies such burdens at the national level. The recent Comprehensive National Nutrition Survey is India's first national survey and the largest one globally to have collected information on micronutrients and other nutrition failures for children aged 0-19 years. However, the biological samples collected are representative only at the state level, limiting us from studying it at deeper levels like the district.
In many cases where diets are poor in micronutrients, multiple micronutrient deficiencies are likely to affect the development of anemia synergistically [8]. Hence, anemia also represents a lack of essential vitamins and minerals to a certain extent. The most common causes of anemia include nutritional deficiencies, particularly iron, though deficiencies in folate and vitamins B12 and A are also essential causes [9].
Iron-deficiency anemia is common in infants and young children owing to the high iron requirements needed during the first two years of life [10]. In addition, common complementary foods often lack sufficient iron and contain elevated levels of inhibitors that hinder iron absorption [11,12,13]. Insufficient birth weight and premature birth adversely affect the initial iron reserves, thus further compromising the iron status of very young children, particularly in countries where intrauterine growth restriction is common [14,15]. Though children over two years of age generally have a lower prevalence of anemia than the youngest children, as a group, children aged under five years bear the largest burden of anemia globally, where India is also the highest contributor to child anemia among developing countries [16]. To see the latest picture of child anemia in India, 56% of 6- to 59-month-old children were found to be anemic from the fourth round of the National Family Health Survey conducted in 2015–16 (NFHS-4).
The three anthropometric indicators, Stunting, Wasting and Underweight, have also shown linkages with each other. For example, a child can't be stunted and wasted at the time, without being underweight as there is a high effect of underweight on concurrence of both [17]. A recent study showed that stunting and wasting are linked and that wasting can increase the risk of subsequent stunting. It can have profound programmatic and policy implications, as Jonathan Wells and colleagues highlighted in their Lancet publication [18]. Another study tried to assess the role of underweight in predicting the stunting status of the child using CNNS 2016-18 data and concluded that it could be used as a substitute for surveys that poorly measured length or height data [19]. Clearly, a shift in how child undernutrition is understood and managed is urgently needed if the World Health Assembly and the UN Sustainable Development Goal targets are to be met.
Stunting, wasting and underweight are manifestations of undernutrition that are assessed through body measurements and have been associated with anemia in many studies [16]. As anemia indicates inadequate nutrition, compromised health and lack of energy, it can impact growth indicators such as stunting and wasting. Also, many risk factors of anemia and anthropometric failures are similar. A South American study by Castejon (2004) that determined the co-existence of micronutrient deficiency (Anemia), iron and vitamin A, and macronutrient deficiency (Stunting and Underweight), suggested that malnutrition could be implicated as one of the causal factors of anemia too [20]. Mohammed (2019) found a high level of CAS (Concurrent Anemia and Stunting) among infants and young children in Ethiopia that was associated with various dietary and non-dietary factors [21].
Some studies have also examined the concurrences between anemia and different growth indicators at the population level. A recently published article analysed clustering in Indian districts of 19 pairs of combinations of dual burdens of different nutritional outcomes (Anemia, Stunting, Underweight, Overweight) within individuals and households using data from NFHS round 2015-16 [22]. They tried to assess co-occurrences within individuals and mother-child pairs to analyse burden at the individual and household level. The study found that out of 19, 8 and 5, such dual burdens had significantly higher prevalence at the state and district levels, respectively. It also showed that while dual burdens of anemia, stunting, and underweight were prevalent, there was no indication of clustering of overweight with other forms of malnutrition in India.
Child growth anthropometric failures and anemia are children's most commonly used indicators of nutritional status. Still, their interactions are rarely studied. A better understanding of clustering between all nutritional outcomes is required as co-existing forms of malnutrition (CFM) in any form result in a heightened risk of distinct health adversities, diverging from comparable standalone conditions (Khaliq et al, 2022). Findings from the 2019 GBD study by ICMR suggest that the malnutrition targets set by NNM are aspirational, and the rate of improvement needed to achieve these targets is much higher than the rate observed presently, which might be challenging to reach in a short period. Hence, there is a need to understand these co-morbidities of nutritional outcomes and gain more insights on multifactorial approaches for enhancing public health/nutrition interventions accordingly. In addition, the existing guidelines in the literature also recommend adopting comprehensive and multi-sectoral undernutrition prevention strategies [23].
It is called dual or multiple burden of malnutrition when two or more forms of malnutrition co-occur within communities, families, and even individuals. Similarly, this study tries to identify the dual, triple, and quadruple burden of child undernutrition by studying the co-occurrences of stunting, wasting, underweight, and anemia among children and districts of India. Spatial analysis of such burdens at the district level can help the government plan interventions as per the intensity of different burdens across regions. Hence, this study tries to understand the clustering of child undernutrition outcomes at the individual and population levels.
2. Materials and Methods
Data from the National Family Health Survey, Kids file is used in this study. For the present study, round V 2019-21 data is mainly analysed. Round III 2005-06 and Round IV 2015-16 datasets of NFHS are used for comparison purposes to observe trends. Comprehensive National Nutrition Survey (CNNS) is also used in a few instances for descriptive statistics. Since the thesis is based on secondary data from various surveys conducted in India, these datasets have been archived in a public repository; therefore, the data is easily accessible, and ethical approval is not needed to conduct this study.
Computing Modified CIAF: A modified version of the Composite Index with Anthropometric Failure (CIAF) is computed after the inclusion of anemia. At the child level, different co-occurrences are observed amongst Stunting, Wasting, Underweight and Anemia. Its prevalence is studied across NFHS survey rounds and CNNS for India and States. Such burdens are also studied across various background characteristics for the 2019-21 survey round of NFHS.
Clustering at the Population Level: Spatial autocorrelation is analysed for some of the prevalent burdens at the district level. Moran's I is a statistic used to detect spatial patterns and clustering in the data. Uni-variate Moran's I and Bi-variate Moran's I are computed to assess whether burdens are significantly clustered at the population level.
3. Results
Figure 3.1 shows the declining trend of different undernutrition outcomes w.r.t. NFHS-3, 4, 5 and CNNS. A significant improvement over time is observed in Stunting and Underweight, as their prevalence of 48% and 43% in NFHS-3 comes down to 36% and 32% in NFHS-5. The trend of wasting is also decreasing over time, but still, not much progress is observed, as a reduction of only 1% in wasting is evident from NFHS-3 to NFHS-5. Anemia has shown the most worrisome trend, increasing from 59% in NFHS-4 to 68% in NFHS-5. Estimates of CNNS have been nearly the same as that in NFHS-5, except for anemia, where only 41% of children were found to be anemic in 2016-18.
Figure 3.2 shows the CIAF, which shows the occurrence of stunting, wasting and underweight in combination as per NFHS-5. Around half of the children were not conditioned with any type of undernutrition like stunting, wasting or underweight, whereas the other half were burdened with one, two or three types of undernutrition deficits. Around 16% of the children were both stunted and underweight, whereas 15% of children were found to be only stunted without being wasted or underweight. These two were the most prevalent co-existent conditions, followed by a dual burden of 8% of children who were both wasted and underweight. Around 5% of the children were suffering from stunting, wasting, as well as underweight. The least prevalent condition was "underweight only" (2%).
Figure 3.3 shows the newly formed modified index of CIAF+Anemia analysing co-occurrences of stunting, wasting, underweight, and anemia. From the univariate distribution of the new index, we can say that around 20% of children had no burden, 30% had a single burden, 20% had dual burden, 16% had triple burden, whereas 4% had quadruple burden of undernutrition. We find that the most prevalent burden amongst all the combinations or burdens is "Only Anemia" (23%), followed by the co-occurrence of Stunting, Underweight and Anemia (SUA), which stands at around 13% among children aged 6-59 months in India (NFHS 2019-21). If a child is found to be both stunted and wasted, then it is not possible without the child being underweight as well. Our findings confirm that no dual burden of "stunting and wasting" is observed. Also, no child was found to have the double burden of co-occurrence of both "underweight and anemia". They co-occur only in the presence of stunting, wasting or both. Anemia, being the most prevalent condition overall, is found to have the highest amount of interference with almost every other growth indicator, whereas stunting is the next dominating one, followed by underweight. The quadruple burden, meaning the presence of all undernutrition morbidities, accounts for a prevalence of 4% at the national level.
Figure 3.4 observes the trend of all co-occurrences of undernutrition outcomes across NFHS rounds and CNNS. Most co-morbidities have shown a decreasing trend till NFHS-4, but a spike is observed in the burdens that involve the co-occurrence of anemia during NFHS-5. A similar pattern is also confirmed using CNNS 2016-18 data except in a few instances. Prevalence of the "None" category, that is, those free from any form of undernutrition, stands at 17% in NFHS-5, while it is 33% as per CNNS. The trend of co-occurrence of the "only stunting" category and "SU" category" (co-occurrence of Stunting and Underweight) also shows a rising trend as per CNNS 2016-18 findings.
Figure 3.5 shows the state-wise variation of the quadruple burden of child undernutrition: co-existence of stunting, wasting, underweight and anemia in children aged 6-59 months. It is observed to range from 0% in Mizoram to 7% in Jharkhand. Figure 3.6 represents a spatial representation of the same indicator district-wise. We observe that some parts of north-eastern, northern and southern states perform well, with the least prevalence of 0-1% of quadruple burden of child undernutrition. Eastern and western parts of India had some of the worst-performing districts. Dhule district had the highest prevalence of around 14% of children suffering from all four issues of undernutrition, followed by Jalgaon district of Maharashtra (13%) and Paschimi Singhbhum district of Jharkhand (13%).
Figure 3.7 observes the prevalence of the four undernutrition outcomes across ages, giving us a longitudinal perspective as a child ages from 0 to 59 months. Anemia stands out with the highest prevalence throughout. It stands constant at around 70% for children aged 6-23 months. The prevalence of wasted children (approximately 40%) is observed to be almost twice at the time of birth compared to that of stunted and underweight children (around 20%). But after the age of 1 year, children become more likely to be stunted or underweight and less likely to be wasted. Wasting shows a declining trend, while stunting and underweight show an increasing trend. This pattern is evident till the age of 2 years, after which the prevalence of all three indicators, stunting, wasting, and underweight, remains constant. Anemia also starts witnessing a decline after the age of 2 years till the age of 5 years. After the age of 4 years, there are almost equal chances of around 40% for the child to be either stunted, underweight or anemic.
Table 3.2 shows the bi-variate analysis, representing the prevalence of components of the newly made index of anthropometric deficits and anemia (CIAF+Anemia) w.r.t. background characteristics. One needs to be cautious of interpreting single burdens, especially of "only wasting" and "only underweight", as their overall prevalence at the national level is relatively low, at 2% and 1%, respectively. It is observed that dual and triple burdens of undernutrition were found to be more common among children with low birth weight than their counterparts. In contrast, the prevalence of "only Anemia" and "only Stunting" was found to be highest in normal-weight babies (30.5% and 4.2%, respectively). The prevalence of having multiple forms of undernutrition was highest among children with birth order four or more than their counterparts. At the same time, a reverse pattern was observed in the case of "only Anemia", as it was found to be most prevalent among children with birth order 1. Male children are found to be more burdened with co-morbidities of undernutrition compared to females. Lesser prevalence of the indicators "SWUA", "WUA", "SA", and "only Anemia" was observed in children above two years of age and older children were found to be more burdened with conditions like "SUA" and "SWU". A lower prevalence of clustering of multiple occurrences of undernutrition outcomes was observed among children whose delivery took place at an institution, those who were wanted and those with literate mothers. Co-morbidities of undernutrition were found to be higher in the case of mothers with a lower diet than mothers consuming a diet richer in various food groups. The quadruple burden of undernutrition "SWUA" was found to be highest in the western region (6.2%), followed by the Eastern and Central regions (5.1% and 3.6% respectively). Around 29% of children were free from any form of undernutrition among those with overweight mothers, whereas the prevalence of the same was 18% among those with underweight mothers. Talking about the two most prevalent burdens, the burden "SUA" was found to be most prevalent among undernourished mothers (15.6%), whereas "only anemia" was found to be highest among overnourished or overweight mothers (35.1%). Children from poorer households, rural backgrounds, those using unimproved sources of toilet facilities or exposed to open defecation, and those from the caste SC/ST/OBC were more burdened with co-occurrences of undernutrition compared to their counterparts.
Table 3.3 represents findings from spatial analysis performed in the NFHS-5 dataset to assess spatial autocorrelation of different health indicators of undernutrition across districts in India with the help of local Univariate Moran's-I. The values of Moran's I range from -1 to 1, where positive values indicate positive spatial autocorrelation (clustering of similar values), negative values indicate negative spatial autocorrelation (dispersion of similar values), and values around 0 indicate randomness. The positive value of 0.511 indicates a moderate level of positive spatial autocorrelation in stunting prevalence. This suggests that regions with high stunting prevalence are spatially clustered, and areas with low stunting prevalence are also spatially clustered. Similarly, the positive value of Moran's I for the rest of the indicators implies the presence of positive spatial autocorrelation in them. Amongst the four child undernutrition outcomes of Stunting, Wasting, Underweight and Anemia, the strongest clustering across districts was found in the case of Underweight (Moran's I=0.677), followed by Anemia, Stunting and Wasting (Moran's I=0.579, 0.511, 0.463 respectively). Only selected types of co-occurrences or burdens have been kept in this table for meaningful comparison across the indicators from the two indices of CIAF and CIAF+Anemia. The co-occurrences involving the presence of stunting and anemia were selected as they were the most dominating and relevant ones. The aim is to understand the relevance of both the indices, CIAF and CIAF+Anemia, and analyse the distinction amongst the types of co-occurences it identifies. For instance, the “none” category of CIAF (Moran's I= 0.632) is more clustered than the “none category” of CIAF+Anemia index (Moran's I= 0.547). On the other hand, the "only stunting" category of CIAF+Anemia (Moran’s I= 0.422) shows higher spatial autocorrelation compared to the "only stunting" category of CIAF (Moran’s I= 0.306). The burdens or co-occurrences called "SUA", "SWUA", and "only Anemia" of the CIAF+Anemia index were found to moderately clustered with positive spatial autocorrelation (Moran's I= 0.588, 0.555, 0.511 respectively), whereas the co-occurrence of Stunting and Anemia ("SA") had a comparatively lower spatial clustering (Moran's I= 0.285).
Table 3.4 represents findings from spatial analysis performed in the NFHS-5 dataset to assess spatial autocorrelation between two types of undernutrition indicators across districts of India with the help of local Bivariate Moran's-I. The aim is to understand the spatial association between the general indicators of undernutrition that are popularly used (like stunting, underweight, and anemia) with the indicators of co-occurrences identified from indices like CIAF and CIAF+Anemia. Again, some selected combinations are analysed. As the "SUA" category from the CIAF+Anemia index was one of the most prevalent triple burdens of child undernutrition, we assess its spatial correlation with Stunting, Underweight and Anemia. Bivariate Moran's I is a statistic used to simultaneously determine the spatial autocorrelation between two variables (Table 3.4). Positive values of Bivariate Moran's I indicate that regions with similar values of both variables tend to be clustered, while negative values suggest that areas with dissimilar values are clustered. The positive value suggests a moderate positive spatial relationship between the co-occurrence of Stunting, Underweight and Anemia (SUA) with all three indicators of Stunting, Underweight and Anemia. Out of all three indicators, anemia is found to be the most clustered with the burden "SUA" (Moran's I= 0.578) followed by the other two indicators of Stunting (Moran's I= 0.491) and Underweight (Moran's I=0.404). This means areas with high anemia prevalence are more likely to be located near areas with high "SUA" prevalence, and regions with low anemia prevalence are more likely to be near areas with low "SUA" prevalence. However, when we study the spatial dependence of the co-occurrence of Stunting and Anemia "SA" with that of Stunting or Anemia separately, the association, although positive, is observed to be less strong than what was observed in the case of the co-occurrence of "SUA". "SA" is found to be more clustered with Anemia (Moran's I=0.238) than with Stunting (Moran's I=0.232). On testing whether Anemia and "only Anemia" without the occurrence of Stunting, Wasting and Underweight co-occur spatially, we find a weak positive spatial relationship across Indian districts (Moran's I=0.188). Similarly, the negative value of Moran's I of -0.039 suggests a weak negative spatial relationship between the indicator of stunting and "only Stunting" identified from CIAF+Anemia. This implies that areas with high stunting prevalence might not necessarily be located near areas with high "only Stunting" prevalence of the CIAF+Anemia index, and vice versa. However, the positive value of Moran's I of 0.16 indicates a weak positive spatial relationship between the "Stunting" and "only Stunting" categories from CIAF. This implies that areas with high stunting prevalence might be somewhat clustered near areas with high "only Stunting" prevalence of the CIAF index and vice versa.
4. Discussion
The present study began by analysing the prevalence and trend of the four child undernutrition outcomes: stunting, wasting, and underweight anemia. The age pattern studied of the four outcomes is similar to that portrayed in the CNNS 2016-18 report [24]. The recently observed rising levels of anemia have been attributed to the mother's education status, anemia level and socio-economic status of the household [25]. The study further proceeds to compute the prevalence of the Composite Index of Anthropometric Failure as coined by Svedberg and Nandy [3,5]. The importance of studying CIAF is immense, as it is seen as a better indicator to assess undernutrition than the measures generally used which are stunting, wasting and underweight [26]. Literature highlights that areas with a high prevalence of co-occurrences of Stunting, Wasting and Underweight carry more burden of child mortality in India [27,28,29]. The findings of the present paper are in convergence with similar studies that have computed CIAF using datasets of NFHS-5 and CNNS, which find that around half of the children are free from Stunting, Wasting and Underweight, and the other half are burdened with one issue or the other [30,31,32].
Besides the CIAF, various studies in the literature have determined co-occurrences among different child malnutrition indicators (Chopra et al., 2023; Dixit et al., 2023; Singh et al., 2023). The present study identifies the dominant role of two child undernutrition indicators; one is stunting, which signifies chronic undernutrition and is well-known for its scarring effect; the other is anemia, a silent killer of productivity and one's well-being, which has recently caught everyone's eyes given its rising trend. There is wide literature that analyses the co-occurrence of especially Stunting and Anemia, as it is bound to have stark consequences for one's health [21,36,37,38,39]. Analysing co-occurrence of Stunting and Wasting is another known phenomenon [40,41,42,43].
The present study also tries to modify the CIAF by including anemia as a substitute for the fourth form of undernutrition, which is micronutrient-deficiencies, the first three being stunting, wasting and underweight. This way, the newly formed index of CIAF+Anemia tries to encapsulate all four major forms of child undernutrition holistically. But this is not the first time one has attempted to modify the CIAF. Given the rising trend of overnutrition, many have tried to add overweight or obese as a component alongside stunting, wasting and underweight [44,45,46]. Some have tried to modify CIAF by replacing underweight indicators calculated from Weight-for-height with the underweight computed from BMI-for-age [47]. There is a dearth of literature in India that studies the co-occurrence of all four outcomes as studied in this paper, but a study done in Ethiopia has done a similar exercise and found that two-thirds of the children had at least one or the other issue out of the four undernutrition conditions, namely, Stunting, Wasting, Underweight and Anemia and called this index as multiple nutrition deficits index [48]. Similar to our study, it studied the association of multiple nutrition deficits and discovered that male children, those older, those from poorer households and those with mothers belonging to the illiterate category were more likely to have multiple nutrition deficits. Varghese (2019) also analysed the mean prevalences of the dual burden of stunting, anemia and overweight among children at the individual and population levels w.r.t. states and districts. Similar to our study, it also found a strong presence of stunting and anemia at the district level. As our research identified worst-performing districts in terms of quadruple burden of child undernutrition, similarly, another study using NFHS-4 data has identified hotspots of higher prevalences of co-occurrences of Stunting, Wasting and Anemia [49]. It also found strong spatial autocorrelation in the co-occurences of "SWU", "SU", and "WU" that are part of CIAF with Moran's I as 0.615, 0.695 and 0.438, respectively, at the district level. In conclusion, analysing such burdens can be a supportive step for our government as it has the potential for substantial programmatic implications [50]. Action can be directed towards investing in children with multiple nutritional deficits with enhanced tracking, screening and service delivery across public health platforms.
5. Conclusions
This paper tried to study the co-occurrences of Stunting, Wasting, Underweight and Anemia under an index called "CIAF+Anemia" among under-five children in India using NFHS data. Around half of the children were free from any form of undernutrition, as per the CIAF in NFHS-5. It reduces to around one-fifth as per the new index of CIAF+Anemia. The new index identifies different types of burdens and co-occurrences at the individual level and finds out that the burden of "SUA" and "SA" to be the most prevalent triple burden and dual burden of child undernutrition, respectively, which were also found to be moderately and positively clustered at the population level across districts of India. It studies the spatial pattern of the quadruple burden of child undernutrition and identifies the worst-performing pockets in Jharkhand and Maharashtra. The age pattern of child-age in months is also studied for the four undernutrition indicators, giving a sense of what trajectory a child, on average, will follow over time. Also, the pattern of the co-occurrences discovered from the index CIAF+Anemia was studied across different background characteristics. It was observed that male children, those born with low birth weight, those with birth order four or more, those born to underweight mothers or short-height mothers or mothers consuming a lower quantity of diet, those from poorer households, rural backgrounds, those using an unimproved source of toilet facilities and those from the caste SC/ST/OBC showed more association with having dual and triple burdens of undernutrition in comparison to their counterparts. Children above two years of age, those whose delivery took place at an institution and those with literate mothers were less susceptible to clustering of multiple forms of undernourishment compared to their counterparts. Talking about the two most prevalent burdens, the burden "SUA" is more prevalent in children having undernourished mothers, whereas "only Anemia" is found more amongst children with overnourished or overweight mothers. In most scenarios, the burden of "only Anemia" showed an opposite pattern compared to the pattern observed in the case of dual and triple burdens of child undernutrition. From the spatial autocorrelation analysis, we infer that the "only stunting" from the new index is more clustered spatially compared to the "only stunting" from the index of CIAF. From the bi-variate analysis, we infer that the spatial pattern of stunting in general is far from what was observed in the case of "only stunting" from both indices. Hence, it can be inferred that "only stunting" is a condition that may be treated separately. Similarly, a weak positive autocorrelation was found between overall anemia and "only Anemia", and they also may be treated as distinct conditions. The burden "SUA" was found to be highly clustered alongside Stunting, Underweight and Anemia. Overall, the present study contributes to understanding burdens and clustering of undernutrition at various levels, which can help develop screening measures to identify such high-risk individuals or districts and target interventions for marginalised groups accordingly.
Author Contributions
All the authors have approved the submitted version and agree to be personally accountable for their own contributions and for ensuring that questions related to the accuracy or integrity of any part of the work, even ones in which the author was not personally involved, are appropriately investigated, resolved, and documented in the literature. Conceptualization, P.A. and LK.D.; Methodology, P.A. and LK.D..; Data Curation, Formal Analysis, Visualisation and Investigation, P.A.; Writing – Original Draft Preparation, P.A.; Writing – Review & Editing, Supervision, P.A., LK.D. and M.B.; Funding Acquisition, M.B.
Institutional Review Board Statement
IRB was not applicable for this research as the study used data of survey rounds of National Family Health Survey (NFHS) which collects data of humans. NFHS is a survey conducted by Ministry of Family Health and Welfare, Government of India according to the guidelines of the Declaration of Helsinki, and approved by the Institutional Review Board (or Ethics Committee) of International Institute for Population Sciences, Mumbai, India.
Informed Consent Statement
Not applicable as the study used data of survey rounds of National Family Health Survey (NFHS) where informed consent was obtained from all subjects involved in the study.
Data Availability Statement
Data supporting reported results can be accessed from www.dhsprogram.com.
Acknowledgments
None.
Conflicts of Interest
The authors declare no conflict of interest.
References
- Popkin, B.M. Nutritional Patterns and Transitions. Popul. Dev. Rev. 1993, 19. [CrossRef]
- WHO Fact Sheets - Malnutrition. 2023.
- Svedberg, P. Poverty and Undernutrition: Theory, Measurement, and Policy. 2000, 348.
- Nandy, S.; Jaime Miranda, J. Overlooking Undernutrition? Using a Composite Index of Anthropometric Failure to Assess How Underweight Misses and Misleads the Assessment of Undernutrition in Young Children. Soc. Sci. Med. 2008, 66. [CrossRef]
- Nandy, S.; Irving, M.; Gordon, D.; Subramanian, S. V.; Smith, G.D. Poverty, Child Undernutrition and Morbidity: New Evidence from India. Bull. World Health Organ. 2005, 83.
- MOSPI Food and Nutrition Security Analysis, India. Minist. Stat. Program. Implement. World Food Program. 2019.
- Singh, M. Role of Micronutrients for Physical Growth and Mental Development. Indian J. Pediatr. 2004, 71. [CrossRef]
- Houghton, L.A.; Trilok-Kumar, G.; McIntosh, D.; Haszard, J.J.; Harper, M.J.; Reid, M.; Erhardt, J.; Bailey, K.; Gibson, R.S. Multiple Micronutrient Status and Predictors of Anemia in Young Children Aged 12-23 Months Living in New Delhi, India. PLoS One 2019, 14. [CrossRef]
- Sarna, A.; Porwal, A.; Ramesh, S.; Agrawal, P.K.; Acharya, R.; Johnston, R.; Khan, N.; Sachdev, H.P.S.; Nair, K.M.; Ramakrishnan, L.; et al. Characterisation of the Types of Anaemia Prevalent among Children and Adolescents Aged 1–19 Years in India: A Population-Based Study. Lancet Child Adolesc. Heal. 2020, 4. [CrossRef]
- Unger, S.L.; Fenton, T.R.; Jetty, R.; Critch, J.N.; O’connor, D.L. Iron Requirements in the First 2 Years of Life. Paediatr. Child Health 2019, 24. [CrossRef]
- Abeshu, M.A.; Lelisa, A.; Geleta, B. Complementary Feeding: Review of Recommendations, Feeding Practices, and Adequacy of Homemade Complementary Food Preparations in Developing Countries – Lessons from Ethiopia. Front. Nutr. 2016, 3.
- Gibson, R.S.; Bailey, K.B.; Gibbs, M.; Ferguson, E.L. A Review of Phytate, Iron, Zinc, and Calcium Concentrations in Plant-Based Complementary Foods Used in Low-Income Countries and Implications for Bioavailability. Food Nutr. Bull. 2010, 31.
- Jaiswal, A.; Jyothi Lakshmi, A. Maximising the Bioaccessibility of Iron and Zinc of a Complementary Food Mix through Multiple Strategies. Food Chem. 2022, 372. [CrossRef]
- Domellöf, M. Meeting the Iron Needs of Low and Very Low Birth Weight Infants. Ann. Nutr. Metab. 2017, 71. [CrossRef]
- Rao, R.; Georgieff, M.K. Iron in Fetal and Neonatal Nutrition. Semin. Fetal Neonatal Med. 2007, 12. [CrossRef]
- WHO Nutritional Anaemias : Tools for Effective Prevention and Control; 2017;
- Myatt, M.; Khara, T.; Schoenbuchner, S.; Pietzsch, S.; Dolan, C.; Lelijveld, N.; Briend, A. Children Who Are Both Wasted and Stunted Are Also Underweight and Have a High Risk of Death: A Descriptive Epidemiology of Multiple Anthropometric Deficits Using Data from 51 Countries. Arch. Public Heal. 2018, 76. [CrossRef]
- Baye, K.; Hirvonen, K. Seasonality: A Missing Link in Preventing Undernutrition. Lancet Child Adolesc. Heal. 2020, 4.
- Ramesh, S.; Khan, N.; Acharya, R.; Sarna, A.; Ashraf, S.; Agrawal, Praween K. Porwal, A. Using Underweight for Predicting Stunting among Children in India: Analysis from the Comprehensive National Nutrition Survey (Pre-Print). Res. Sq. 2021. [CrossRef]
- Castejon, H. V.; Ortega, P.; Amaya, D.; Gomez, D.; Leal, J.; Castejon, O.J. Co-Existence of Anemia, Vitamins A Deficiency and Growth Retardation among Children 24-84 Months Old in Maracaibo, Venezuela. Nutr. Neurosci. 2004, 7. [CrossRef]
- Mohammed, S.H.; Larijani, B.; Esmaillzadeh, A. Concurrent Anemia and Stunting in Young Children: Prevalence, Dietary and Non-Dietary Associated Factors. Nutr. J. 2019, 18. [CrossRef]
- Varghese, J.S.; Stein, A.D. Malnutrition among Women and Children in India: Limited Evidence of Clustering of Underweight, Anemia, Overweight, and Stunting within Individuals and Households at Both State and District Levels. Am. J. Clin. Nutr. 2019, 109, 1207–1215. [CrossRef]
- Reinhardt, K.; Fanzo, J. Addressing Chronic Malnutrition through Multi-Sectoral, Sustainable Approaches: A Review of the Causes and Consequences. Front. Nutr. 2014, 1. [CrossRef]
- MoHFW; UNICEF; Population Council Comprehensive National Nutrition Survey, 2016-18, Report. GOI 2019.
- Singh, S.K.; Lhungdim, H.; Shekhar, C.; Dwivedi, L.K.; Pedgaonkar, S.; James, K.S. Key Drivers of Reversal of Trend in Childhood Anaemia in India: Evidence from Indian Demographic and Health Surveys, 2016–21. BMC Public Health 2023, 23. [CrossRef]
- Mandal, G.C.; Bose, K. Composite Index of Anthropometric Failure (CIAF): A Better Indicator of Overall Burden of Undernutrition Among Primary School Children. Sri Lanka J. Child Heal. 2021, 50. [CrossRef]
- Khan, J.; Das, S.K. The Burden of Anthropometric Failure and Child Mortality in India. Sci. Rep. 2020, 10. [CrossRef]
- Gausman, J.; Kim, R.; Subramanian, S. V. Associations of Single versus Multiple Anthropometric Failure with Mortality in Children under 5 Years: A Prospective Cohort Study. SSM - Popul. Heal. 2021, 16. [CrossRef]
- McDonald, C.M.; Olofin, I.; Flaxman, S.; Fawzi, W.W.; Spiegelman, D.; Caulfield, L.E.; Black, R.E.; Ezzati, M.; Danaei, G. The Effect of Multiple Anthropometric Deficits on Child Mortality: Meta-Analysis of Individual Data in 10 Prospective Studies from Developing Countries. Am. J. Clin. Nutr. 2013, 97. [CrossRef]
- Chakrabarty, S. Regional Differences of Child Undernutrition in India: The Reflection of Composite Index of Anthropometric Failure (CIAF) from CNNS-2016-18 Data. Online J. Heal. Allied Sci. 2022, 21.
- Porwal, A.; Acharya, R.; Ashraf, S.; Agarwal, P.; Ramesh, S.; Khan, N.; Sarna, A.; Johnston, R. Socio-Economic Inequality in Anthropometric Failure among Children Aged under 5 Years in India: Evidence from the Comprehensive National Nutrition Survey 2016–18. Int. J. Equity Health 2021, 20. [CrossRef]
- Ghosh, P. Undernutrition Among the Children from Different Social Groups in India: Prevalence, Determinants, and Transition Over Time (2005–2006 to 2019–2021). J. Racial Ethn. Heal. Disparities 2023. [CrossRef]
- Singh, S.K.; Chauhan, A.; Sharma, S.K.; Puri, P.; Pedgaonkar, S.; Dwivedi, L.K.; Taillie, L.S. Cultural and Contextual Drivers of Triple Burden of Malnutrition among Children in India. Nutrients 2023, 15. [CrossRef]
- Chopra, H.; Paul, B.; Virk, A.; Pandey, G.; Lahariya, C. Triple Burden of Malnutrition among Children in India: Current Scenario and the Way Forward. Indian J. Pediatr. 2023, 90, 95–103. [CrossRef]
- Dixit, P.; Tonpe, M.; Bhatia, M. Decomposition Analysis of the Decline in Binary and Triad Undernutrition among Preschool Children in India. PLoS One 2023, 18, e0292322. [CrossRef]
- Gosdin, L.; Martorell, R.; Bartolini, R.M.; Mehta, R.; Srikantiah, S.; Young, M.F. The Co-Occurrence of Anaemia and Stunting in Young Children. Matern. Child Nutr. 2018, 14. [CrossRef]
- Gaston, R.T.; Habyarimana, F.; Ramroop, S. Joint Modelling of Anaemia and Stunting in Children Less than Five Years of Age in Lesotho: A Cross-Sectional Case Study. BMC Public Health 2022, 22. [CrossRef]
- Orsango, A.Z.; Loha, E.; Lindtjørn, B.; Engebretsen, I.M.S. Co-Morbid Anaemia and Stunting among Children 2-5 Years Old in Southern Ethiopia: A Community-Based Cross-Sectional Study. BMJ Paediatr. Open 2021, 5. [CrossRef]
- Sahiledengle, B.; Mwanri, L.; Petrucka, P.; Agho, K.E. Coexistence of Anaemia and Stunting among Children Aged 6–59 Months in Ethiopia: Findings from the Nationally Representative Cross-Sectional Study. Int. J. Environ. Res. Public Health 2023, 20. [CrossRef]
- Khura, B.; Mohanty, P.; Gandhi, A.P.; Patnaik, L.; Mewara, A.; Pradhan, K.B.; Padhi, B.K. Mapping Concurrent Wasting and Stunting Among Children Under Five in India: A Multilevel Analysis. Int. J. Public Health 2023, 68. [CrossRef]
- Garenne, M.; Myatt, M.; Khara, T.; Dolan, C.; Briend, A. Concurrent Wasting and Stunting among Under-Five Children in Niakhar, Senegal. Matern. Child Nutr. 2019, 15. [CrossRef]
- Khara, T.; Mwangome, M.; Ngari, M.; Dolan, C. Children Concurrently Wasted and Stunted: A Meta-Analysis of Prevalence Data of Children 6–59 Months from 84 Countries. Matern. Child Nutr. 2018, 14. [CrossRef]
- Roba, A.A.; Başdaş, Ö. Multilevel Analysis of Trends and Predictors of Concurrent Wasting and Stunting among Children 6–59 Months in Ethiopia from 2000 to 2019. Front. Nutr. 2023, 10. [CrossRef]
- Bejarano, I.F.; Oyhenart, E.E.; Torres, M.F.; Cesani, M.F.; Garraza, M.; Navazo, B.; Zonta, M.L.; Luis, M.A.; Quintero, F.A.; Dipierri, J.E.; et al. Extended Composite Index of Anthropometric Failure in Argentinean Preschool and School Children. Public Health Nutr. 2019. [CrossRef]
- Nandeep, E.R.; Jaleel, A.; Reddy, P.B.; Geddam, J.J.B.; Reddy, S.N.; Hemalatha, R. Developing and Demonstrating an Atomistic and Holistic Model of Anthropometric Failure among Children under Five Years of Age Using the National Family Health Survey (NFHS)-5 Data from India. Front. Nutr. 2023, 10. [CrossRef]
- Saif, S.; Anwar, S. Unraveling the South Asian Enigma: Concurrent Manifestations of Child Anthropometric Failures and Their Determinants in Selected South Asian Countries. BMC Nutr. 2023, 9, 1–13. [CrossRef]
- Destaw, Z.; Wencheko, E.; Zemenfeskidus, S.; Challa, Y.; Tiruneh, M.; Fite, M.T.; Shaleka, D.; Ashenafi, M. Use of Modified Composite Index of Anthropometric Failure and MUAC-for-Age to Assess Prevalence of Malnutrition among School-Age Children and Adolescents Involved in the School Feeding Program in Addis Ababa, Ethiopia. BMC Nutr. 2021, 7. [CrossRef]
- Geda, N.R.; Feng, C.X.; Henry, C.J.; Lepnurm, R.; Janzen, B.; Whiting, S.J. Multiple Anthropometric and Nutritional Deficiencies in Young Children in Ethiopia: A Multi-Level Analysis Based on a Nationally Representative Data. BMC Pediatr. 2021, 21. [CrossRef]
- Kochupurackal, S.U.; Channa Basappa, Y.; Vazhamplackal, S.J.; Srinivas, P.N. An Intersectional Analysis of the Composite Index of Anthropometric Failures in India. Int. J. Equity Health 2021, 20. [CrossRef]
- Hasman, A. Programmatic Implications of a Revised Classification System for Undernutrition. JAMA Netw. Open 2022, 5. [CrossRef]
Figure 3.1.2.
Multiple forms of Child Undernutrition, India, NFHS 2015-16.
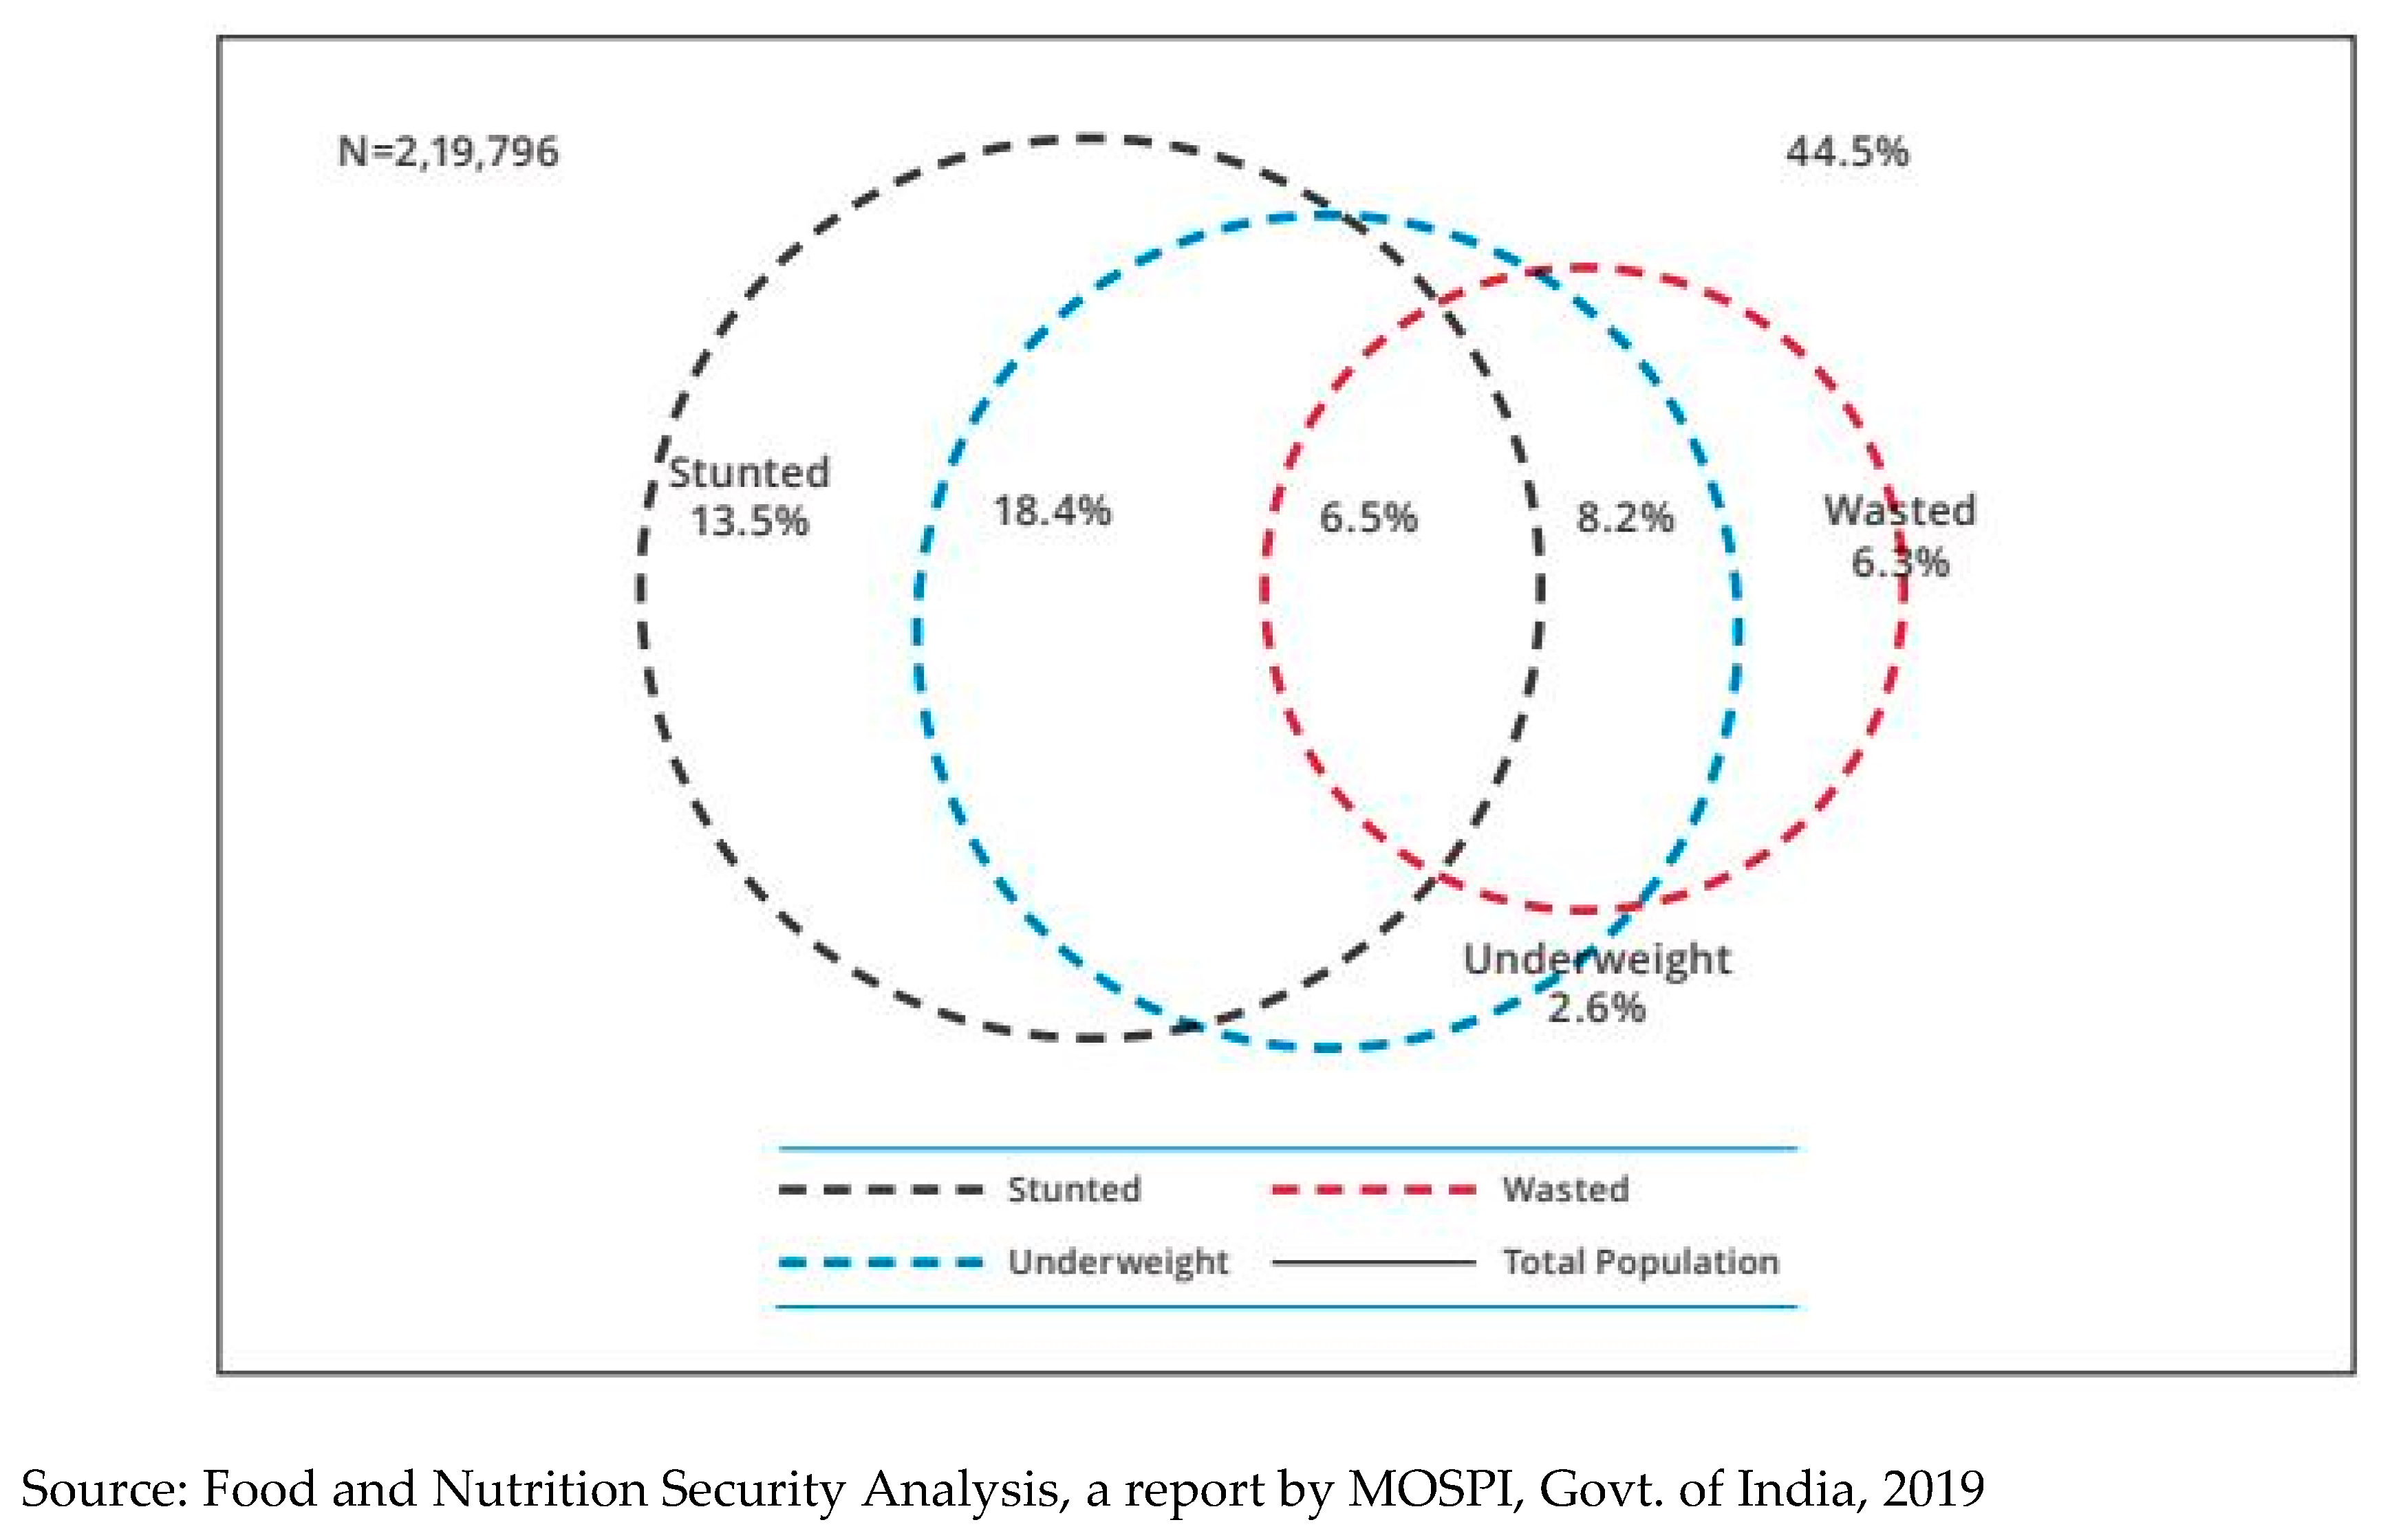
Figure 3.1.
Trend for Stunting, Wasting, Underweight and Anemia across different surveys, NFHS and CNNS.
Figure 3.1.
Trend for Stunting, Wasting, Underweight and Anemia across different surveys, NFHS and CNNS.
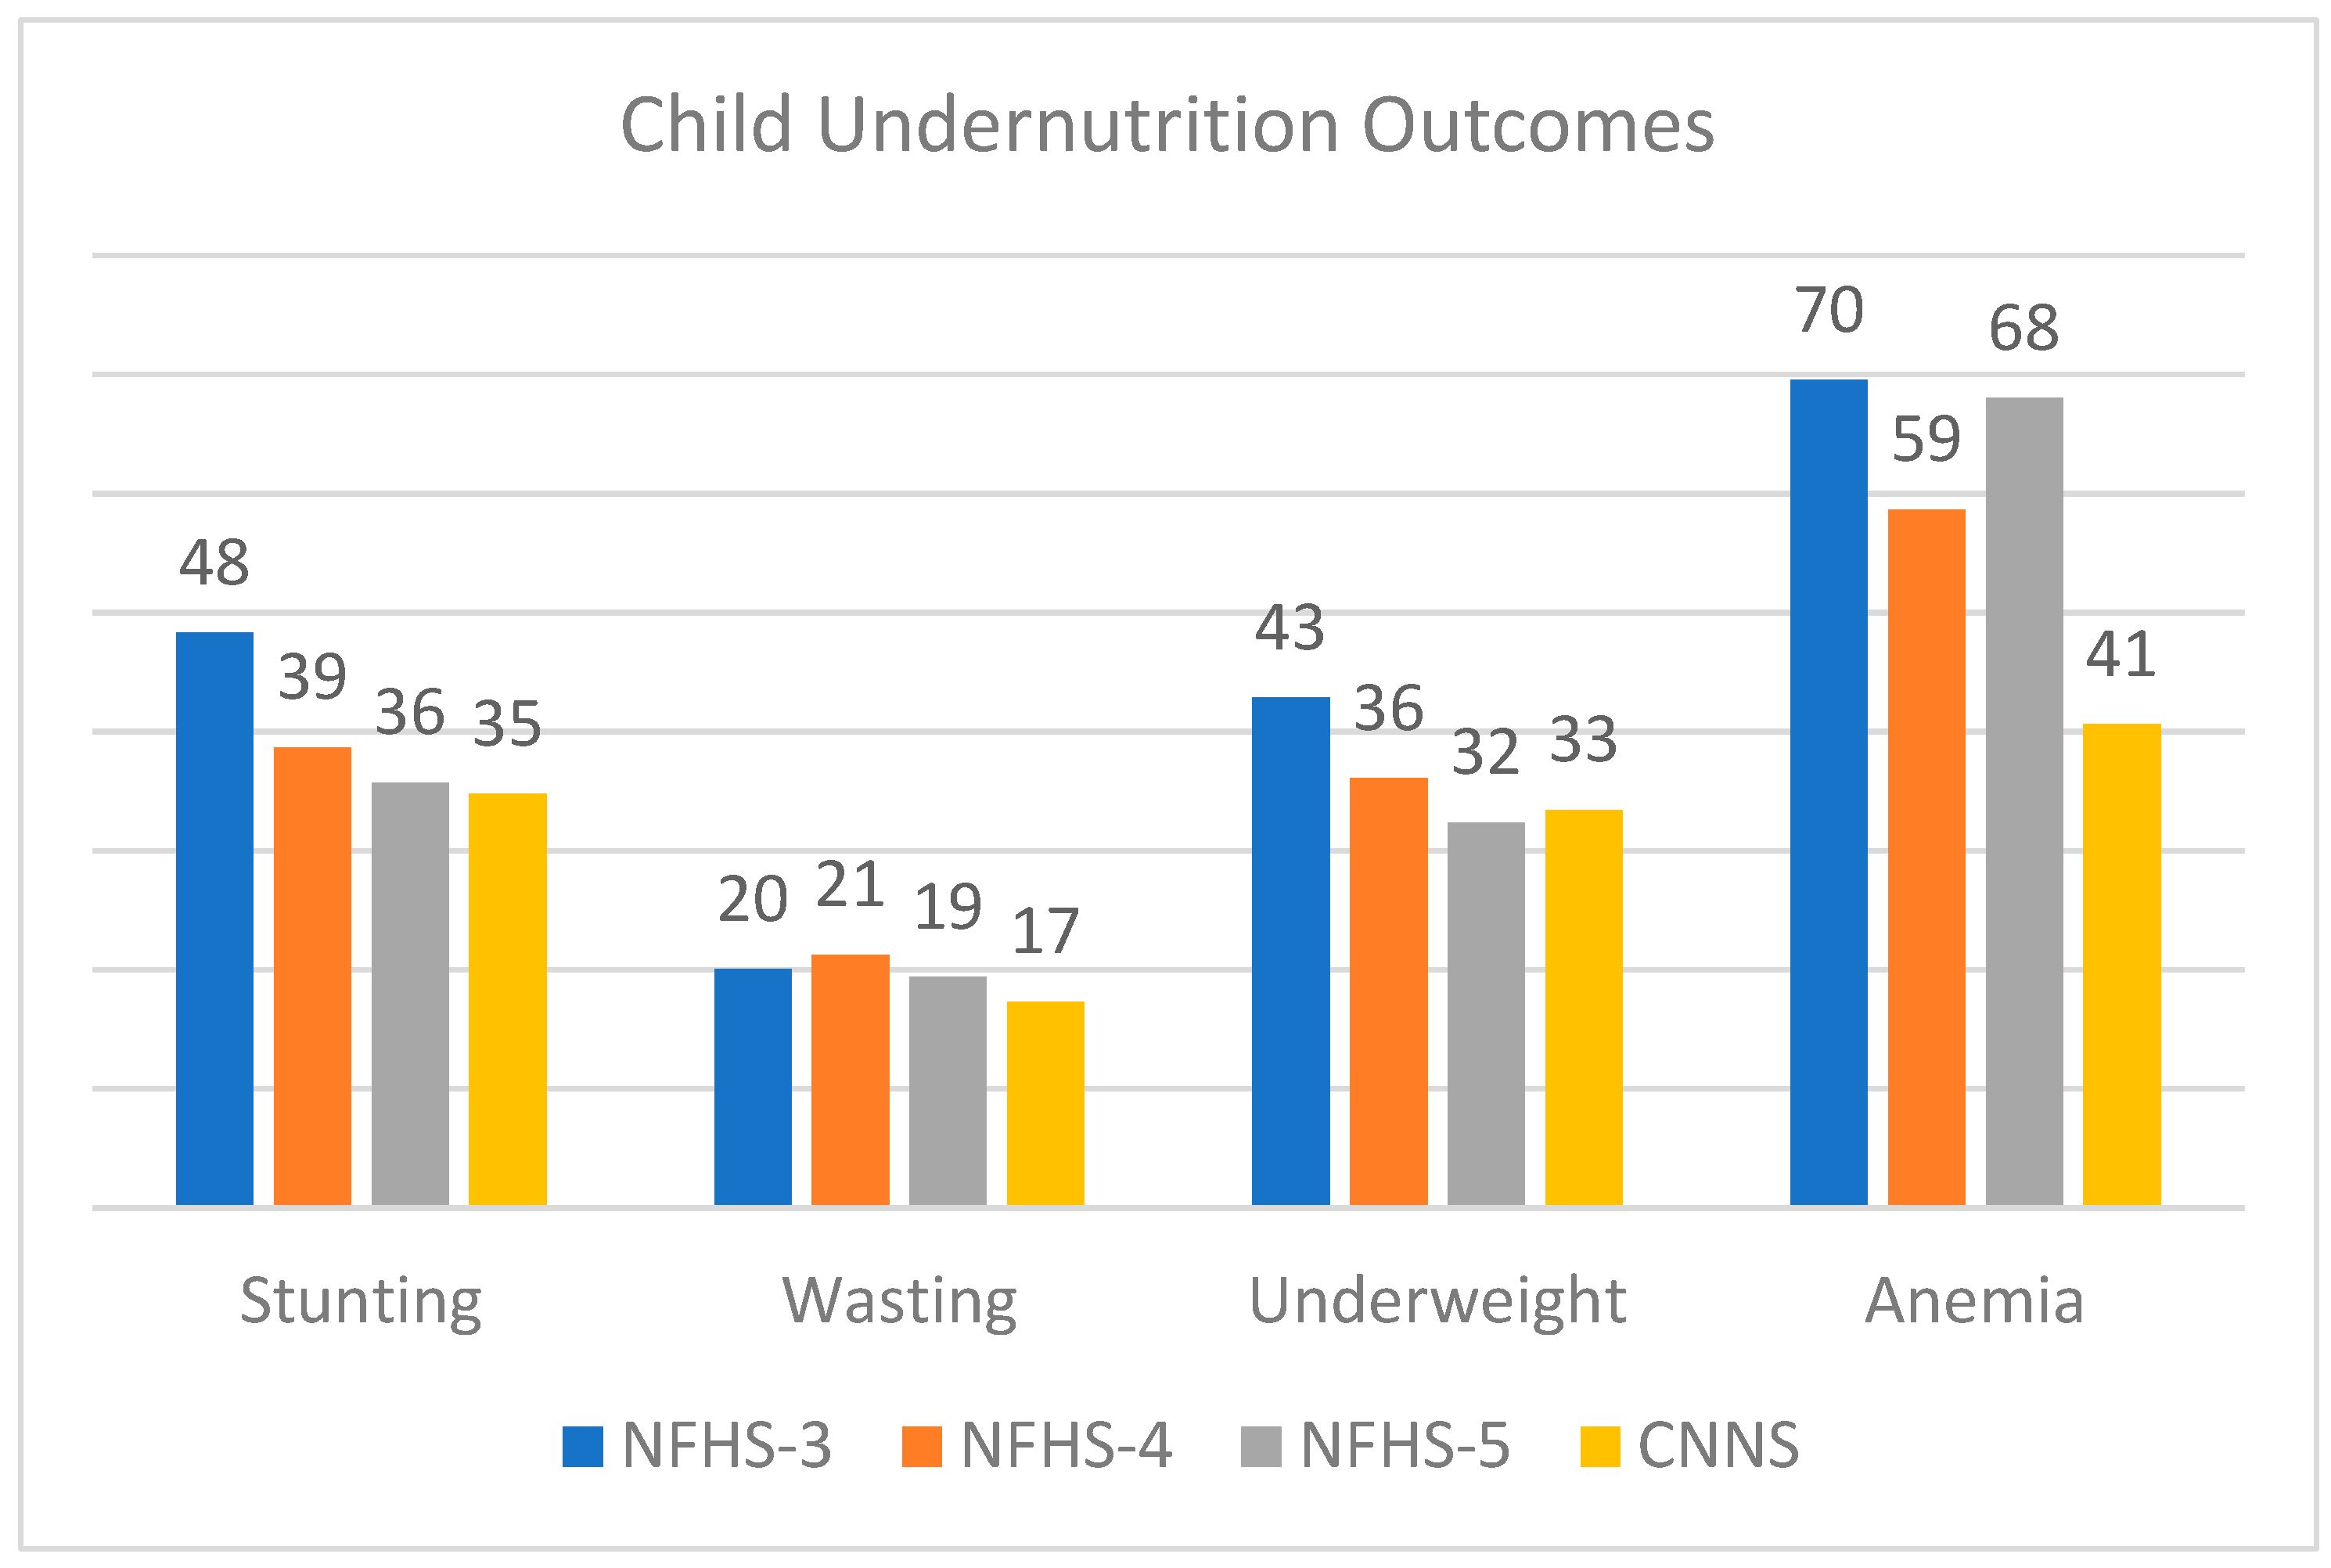
Figure 3.2.
Prevalence of CIAF, NFHS 2019-21.
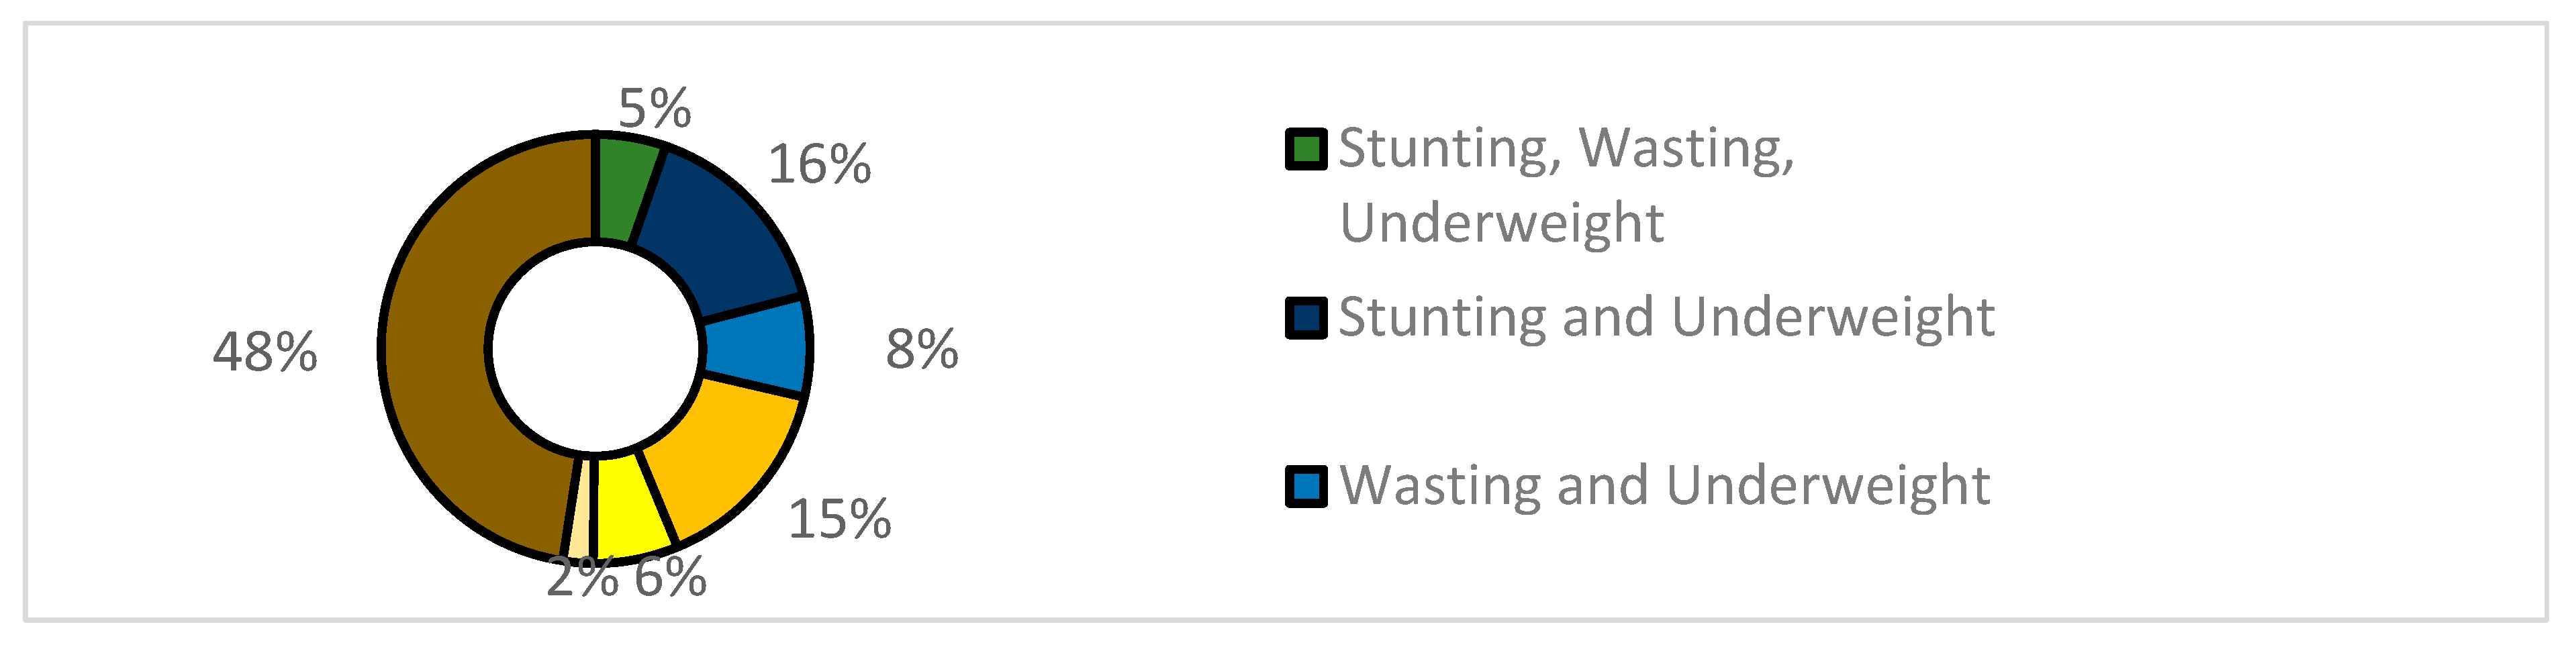
Figure 3.3.
Stunting (S), Wasting (W), Underweight (U) and Child Anemia (A) of 6-59 months children, NFHS-5.
Figure 3.3.
Stunting (S), Wasting (W), Underweight (U) and Child Anemia (A) of 6-59 months children, NFHS-5.
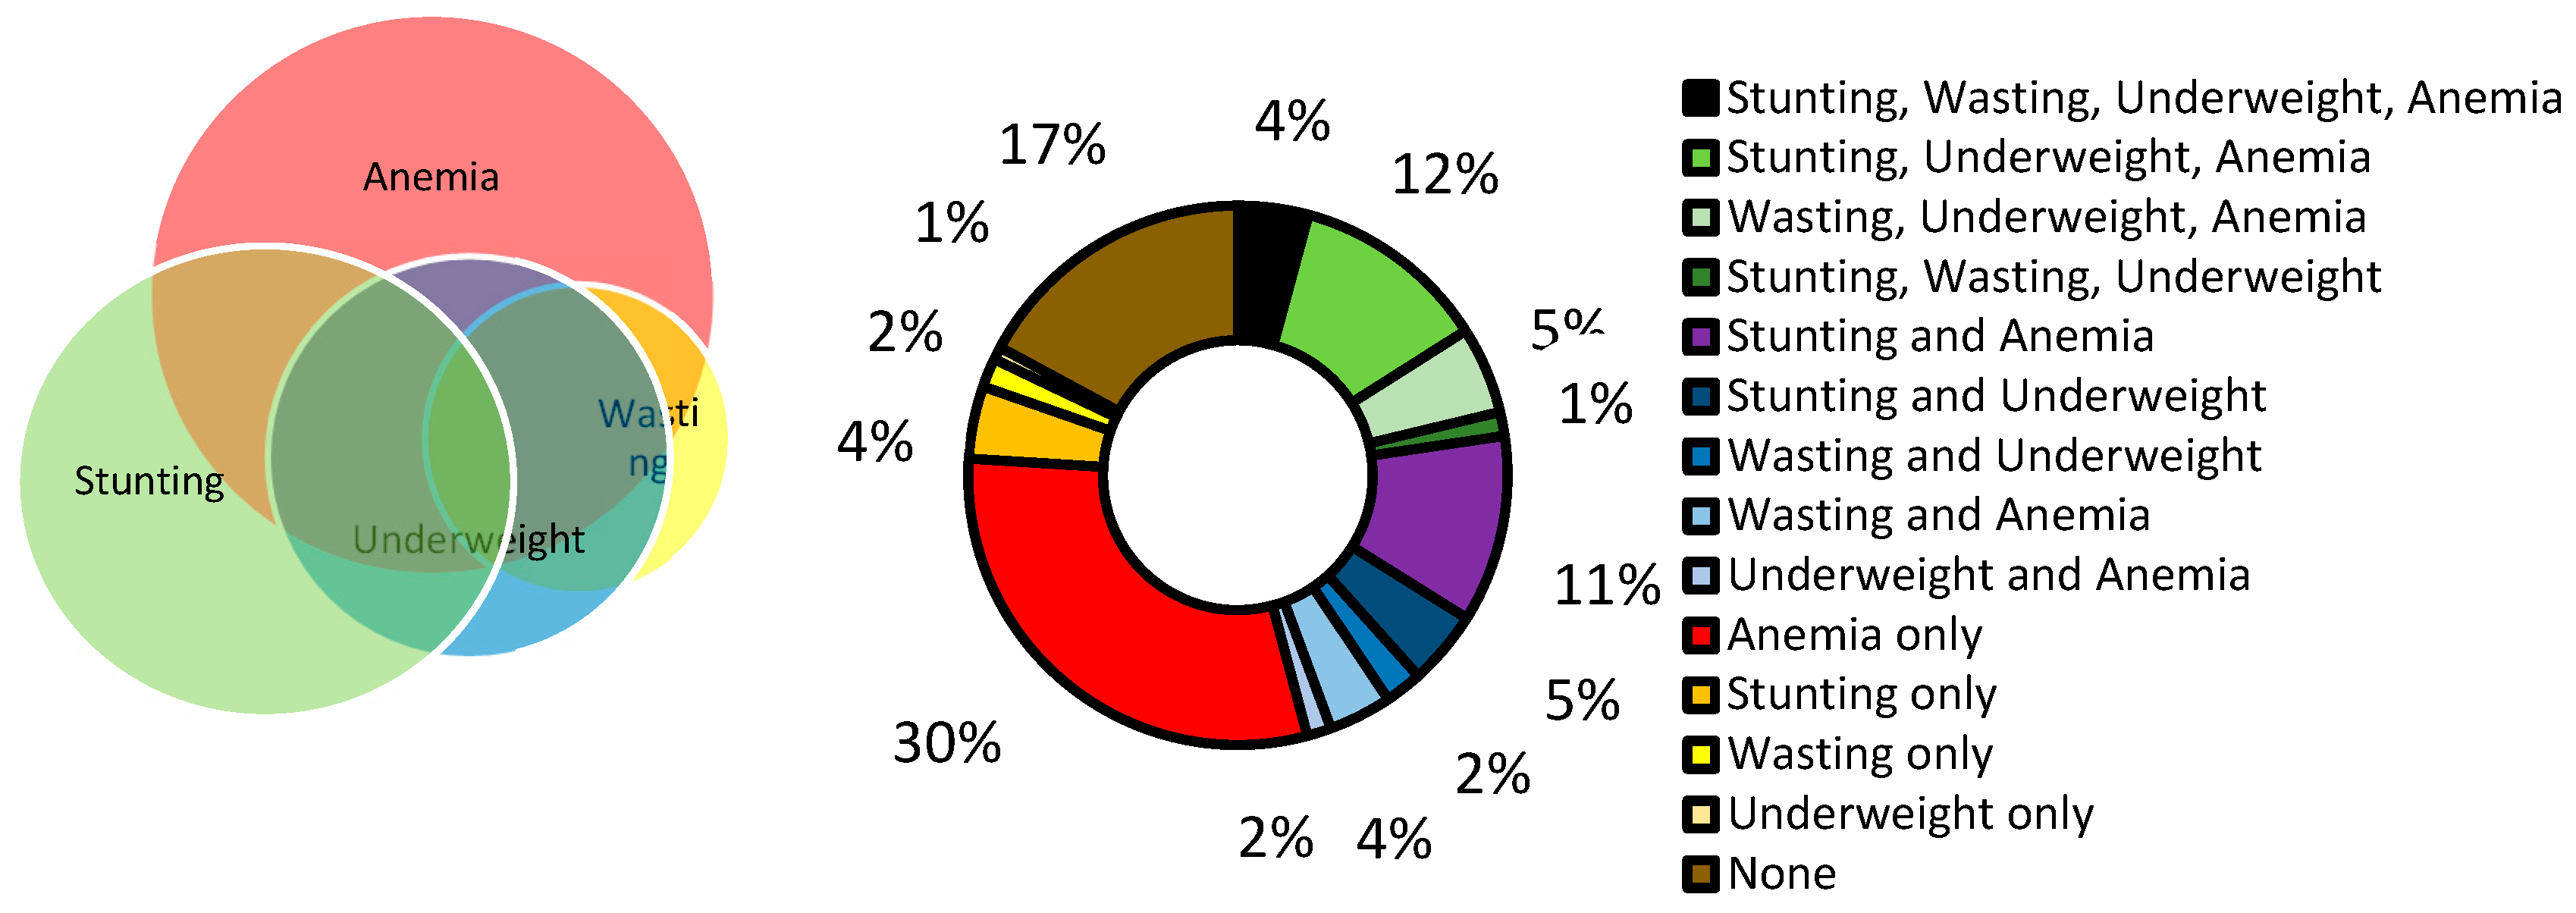
Figure 3.4.
Trend of different burdens over time and survey rounds, NFHS and CNNS.
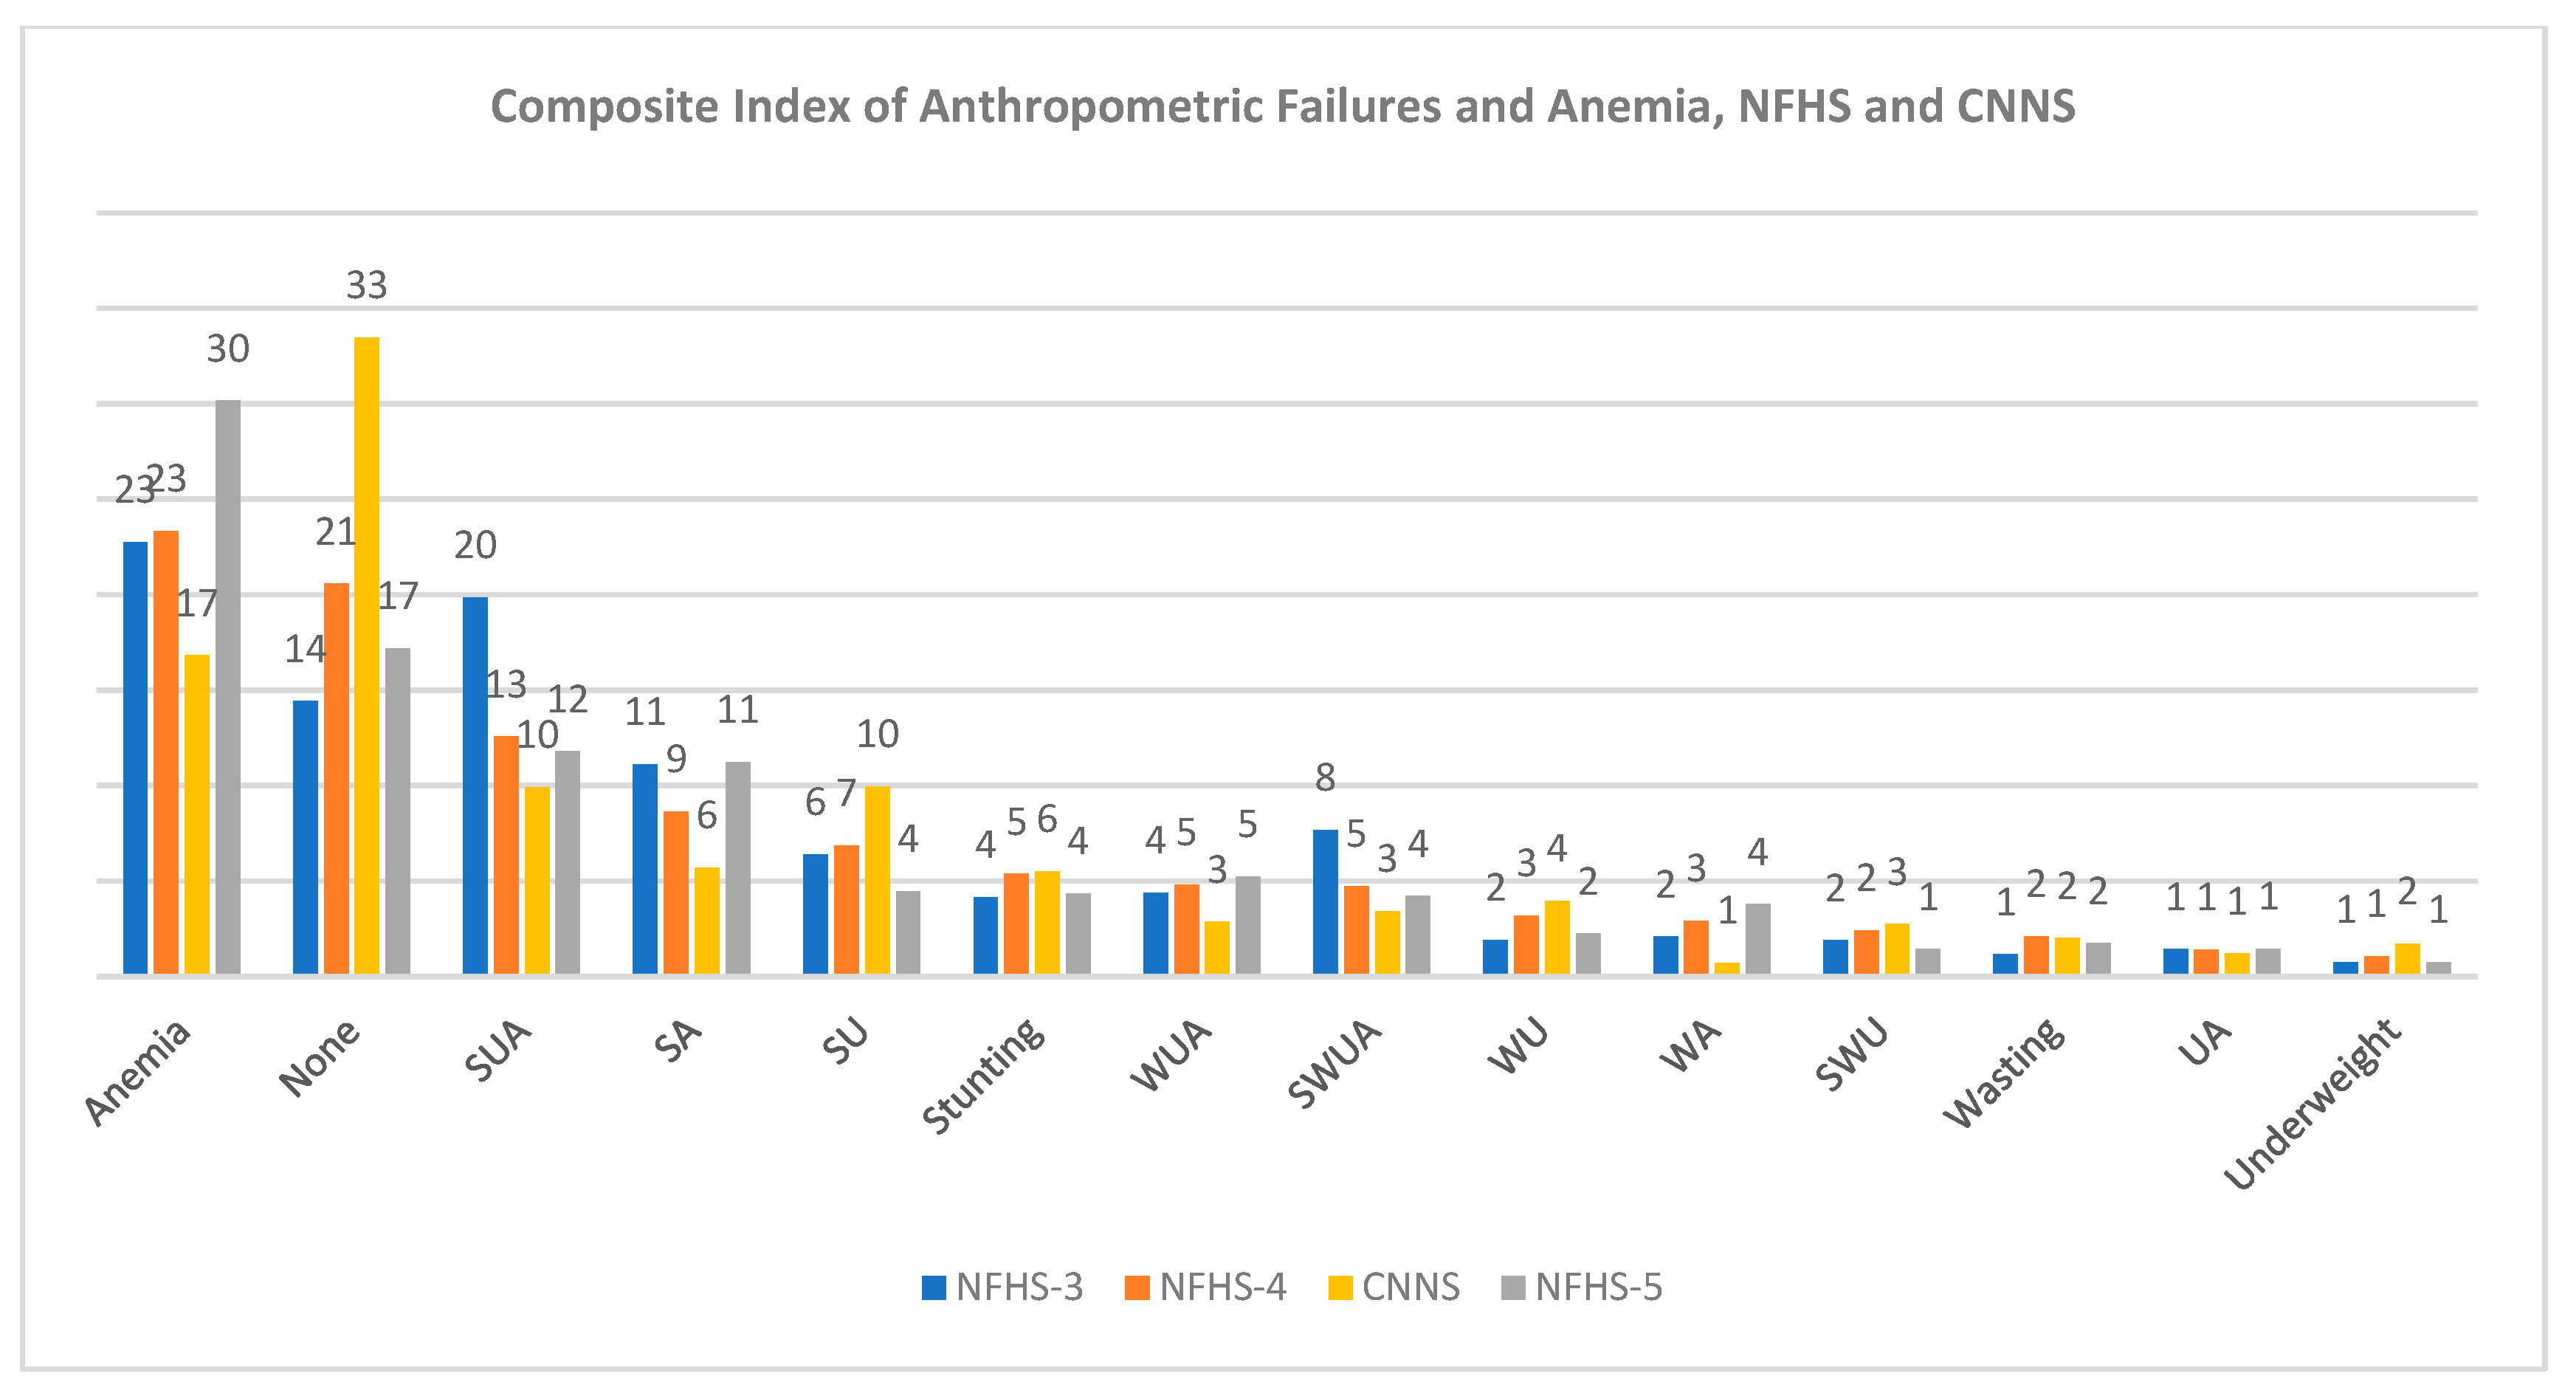
Figure 3.5.
Quadruple burden of Undernutrition, CNNS and NFHS-5.
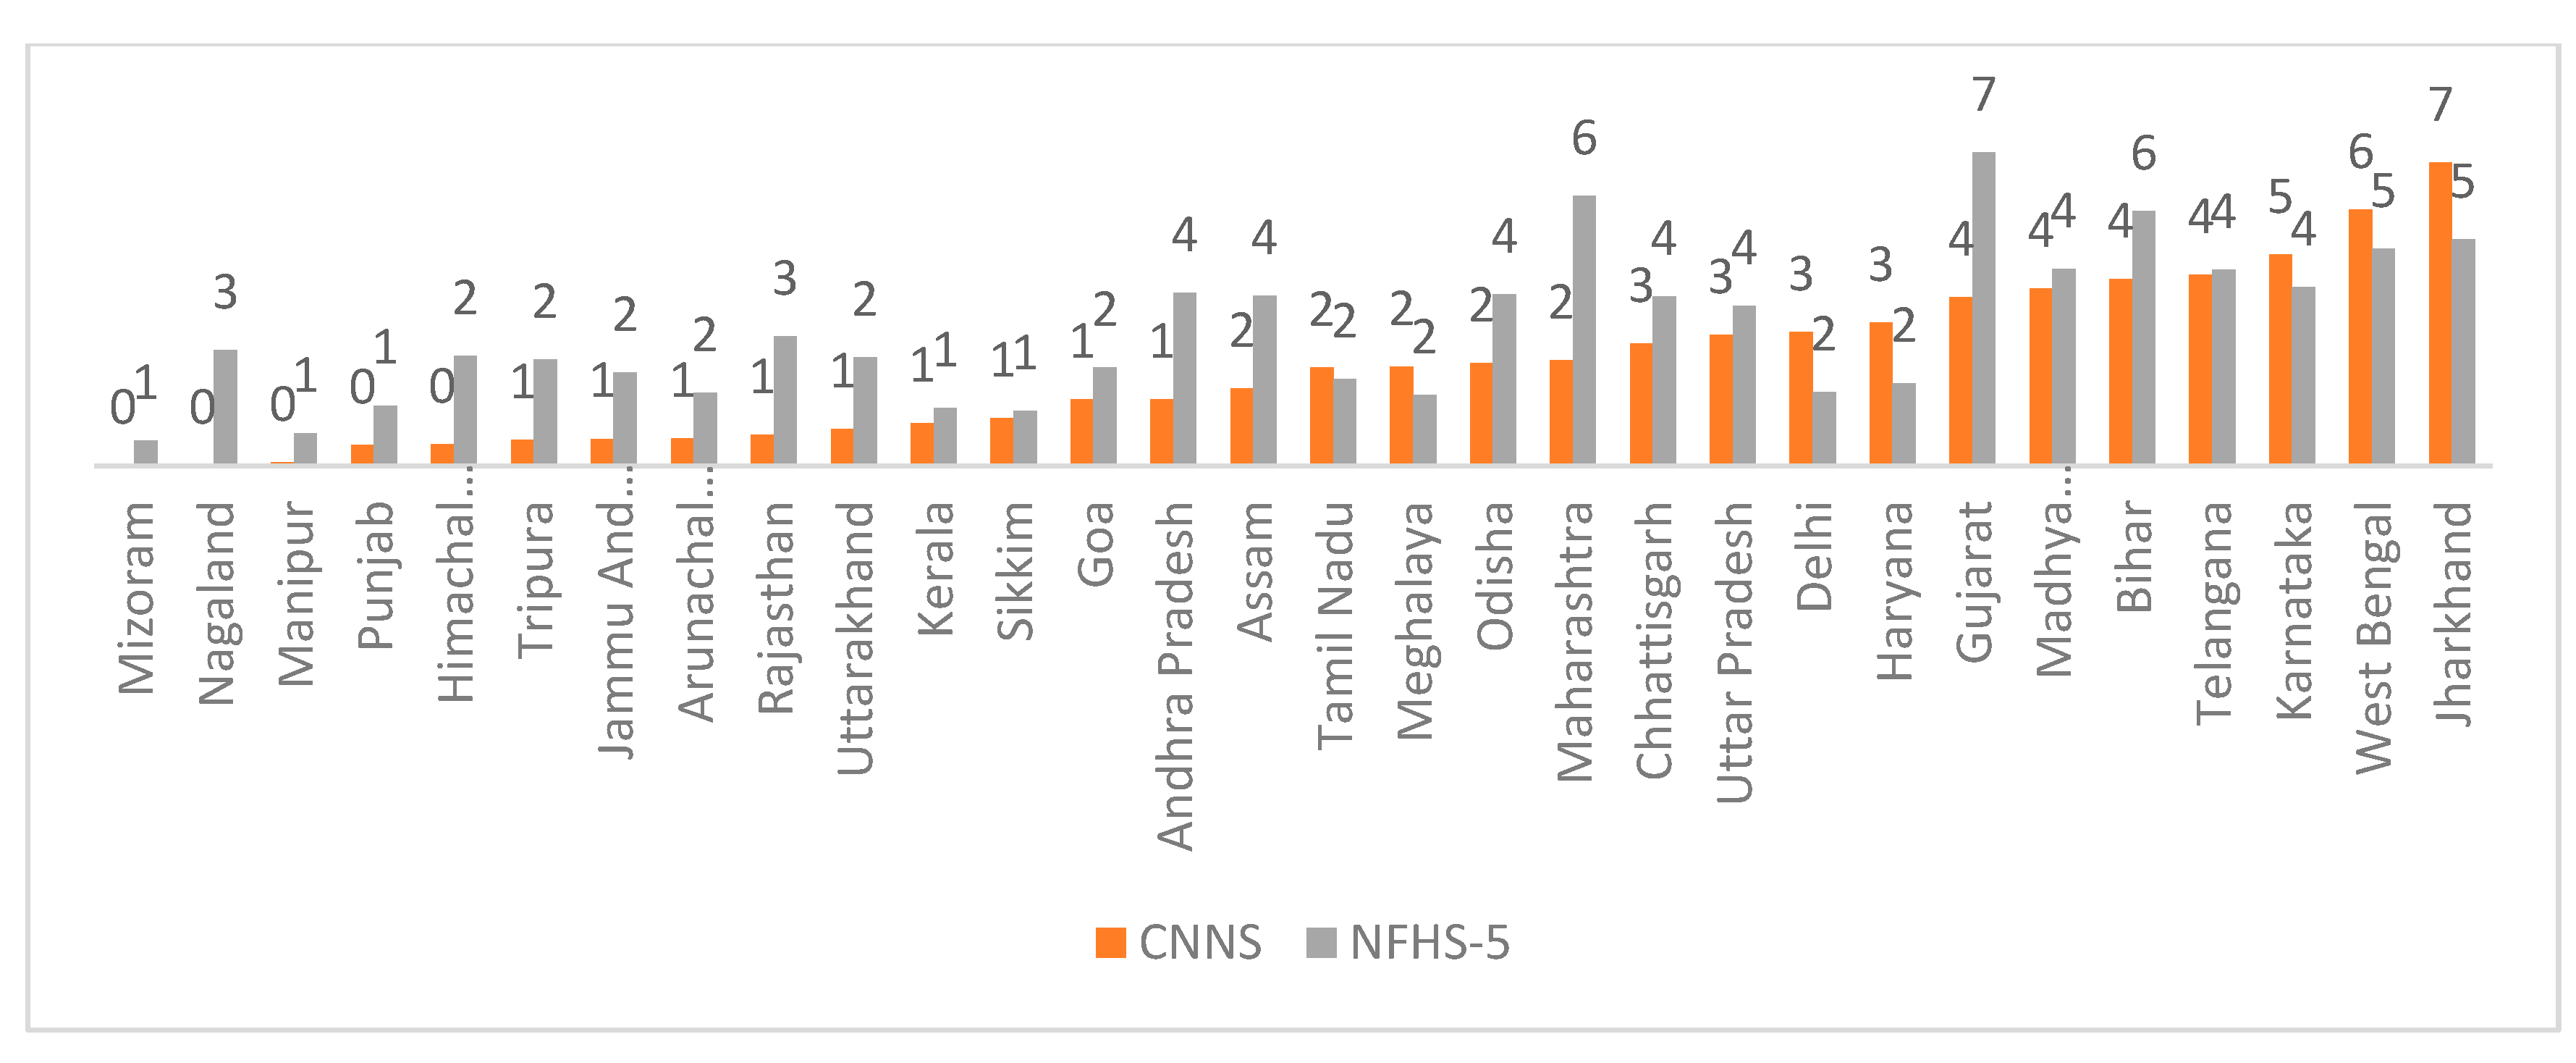
Figure 3.6.
Quadruple burden across district of India, NFHS 2019-21.
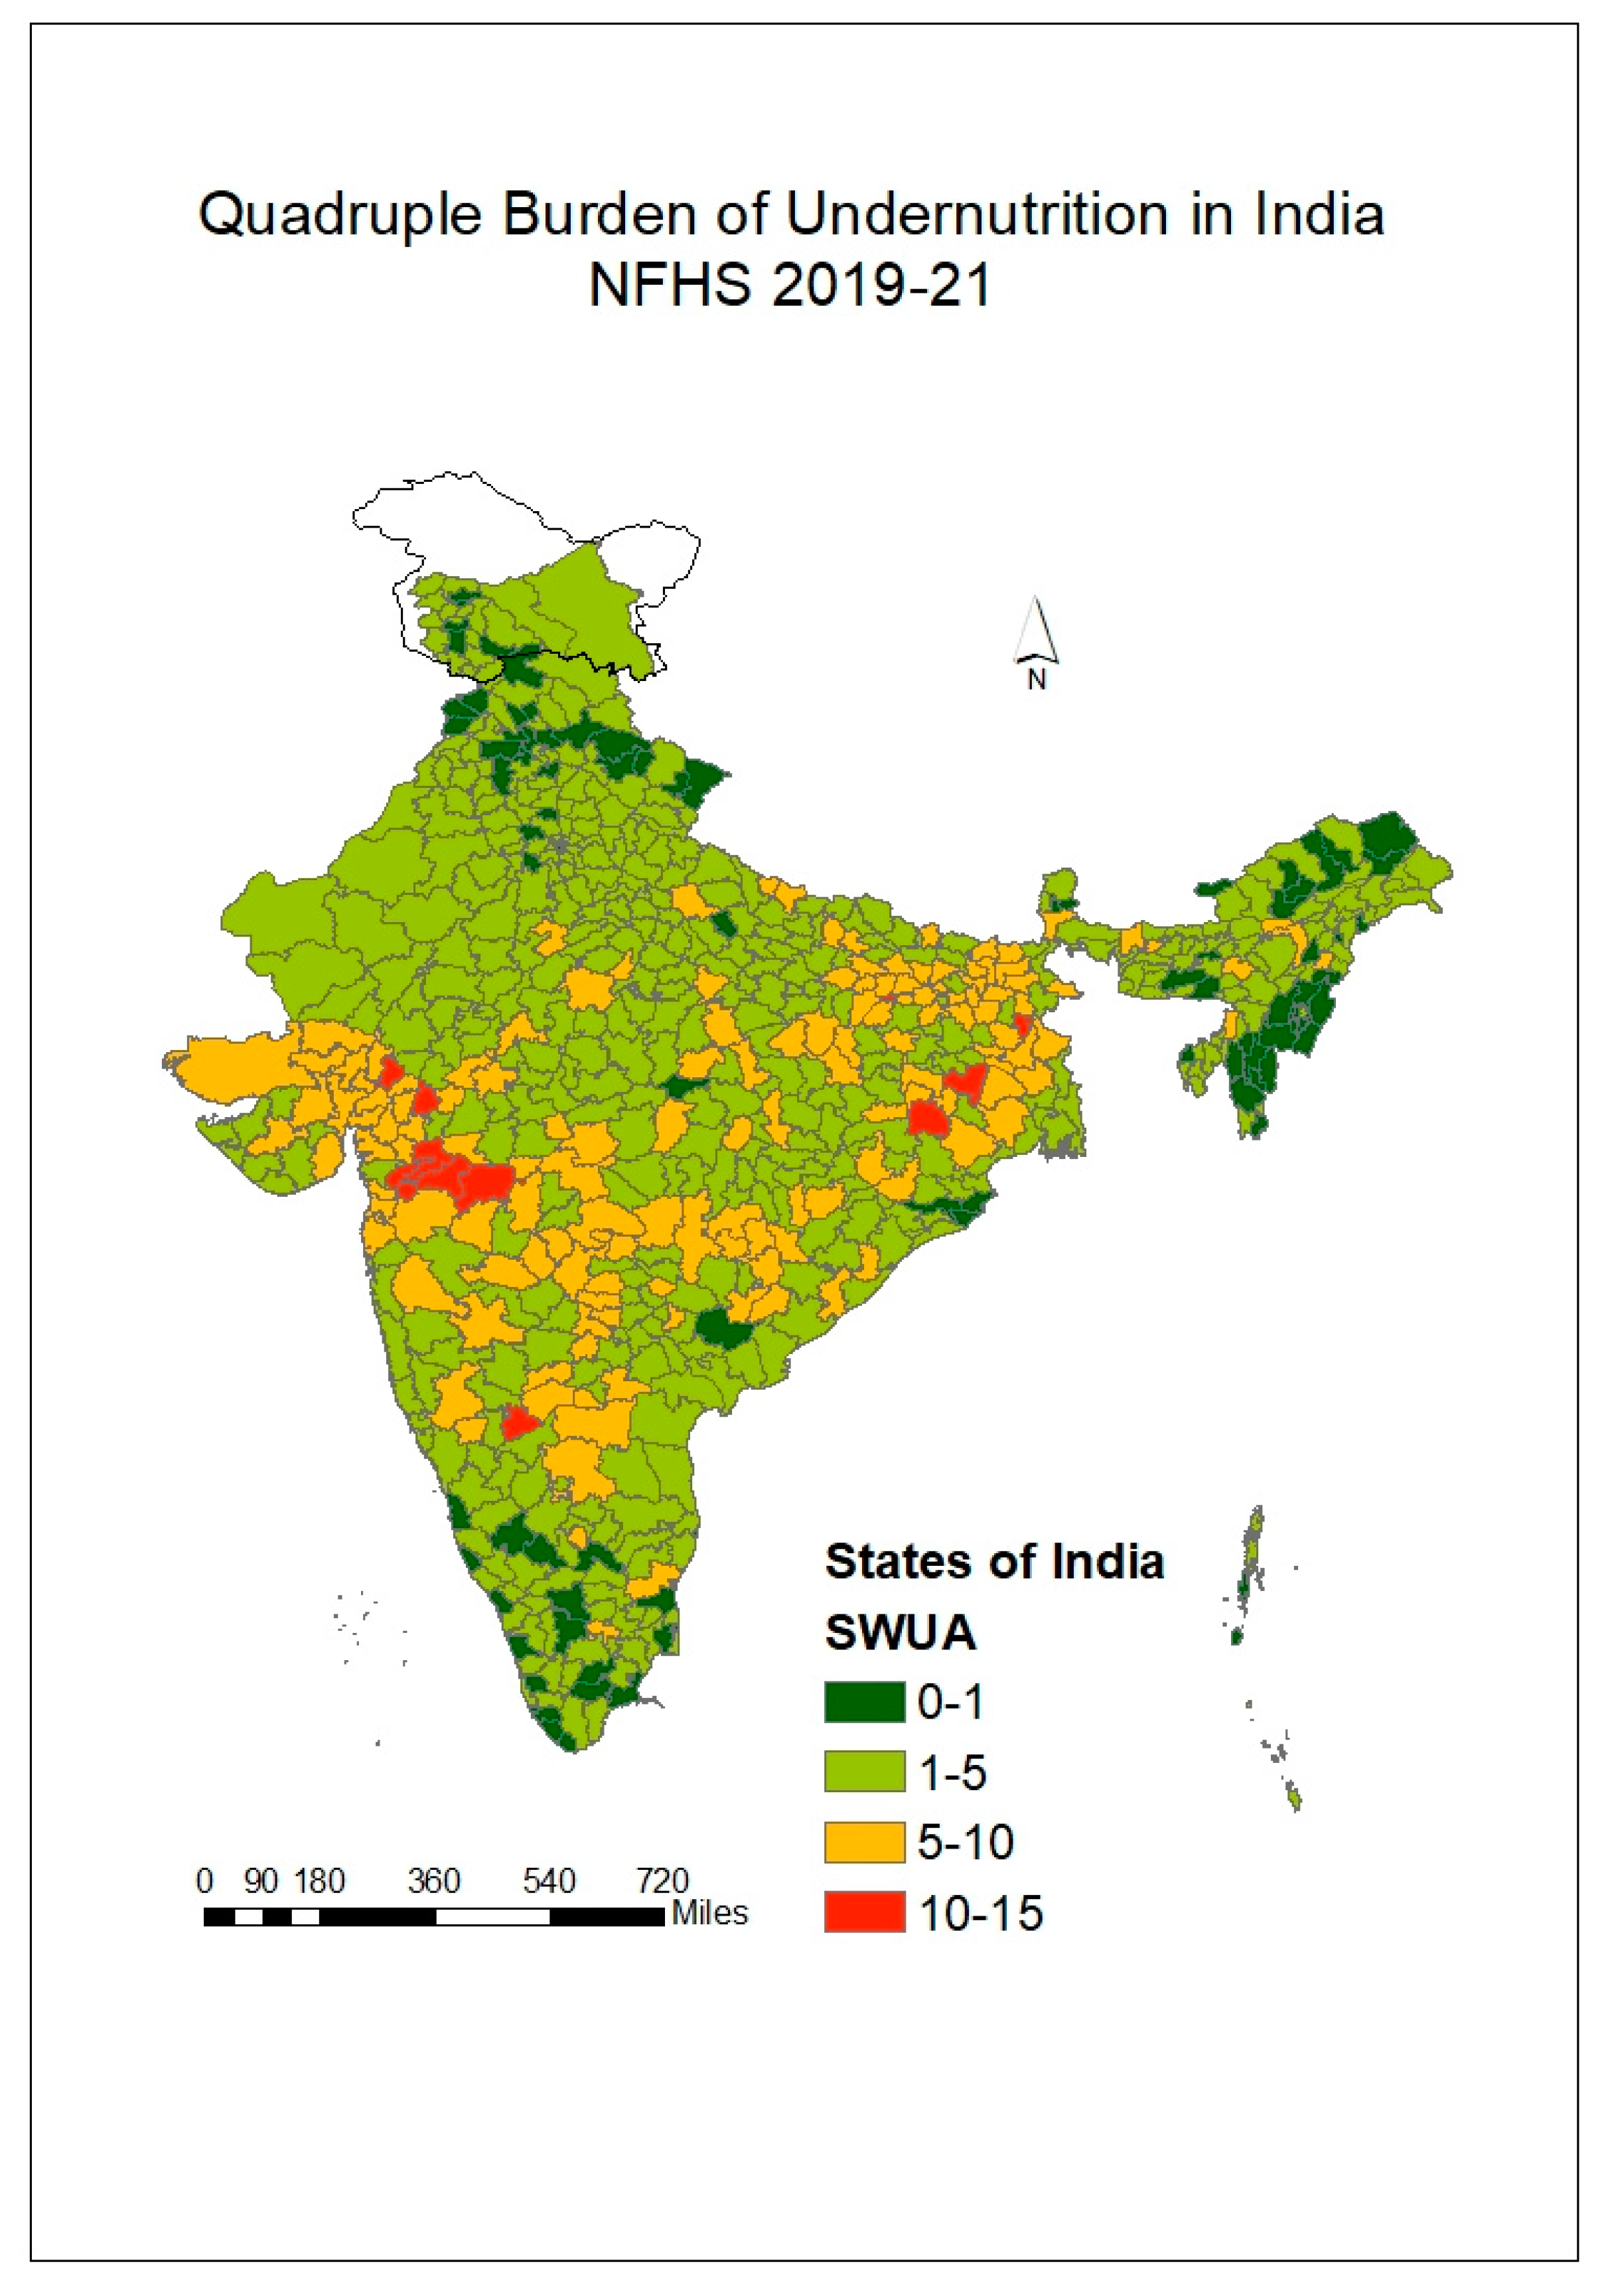
Figure 3.7.
Age-pattern of Stunting, Wasting, Underweight, Anemia & Quadruple Burden, w.r.t NFHS-4 and NFHS-5.
Figure 3.7.
Age-pattern of Stunting, Wasting, Underweight, Anemia & Quadruple Burden, w.r.t NFHS-4 and NFHS-5.
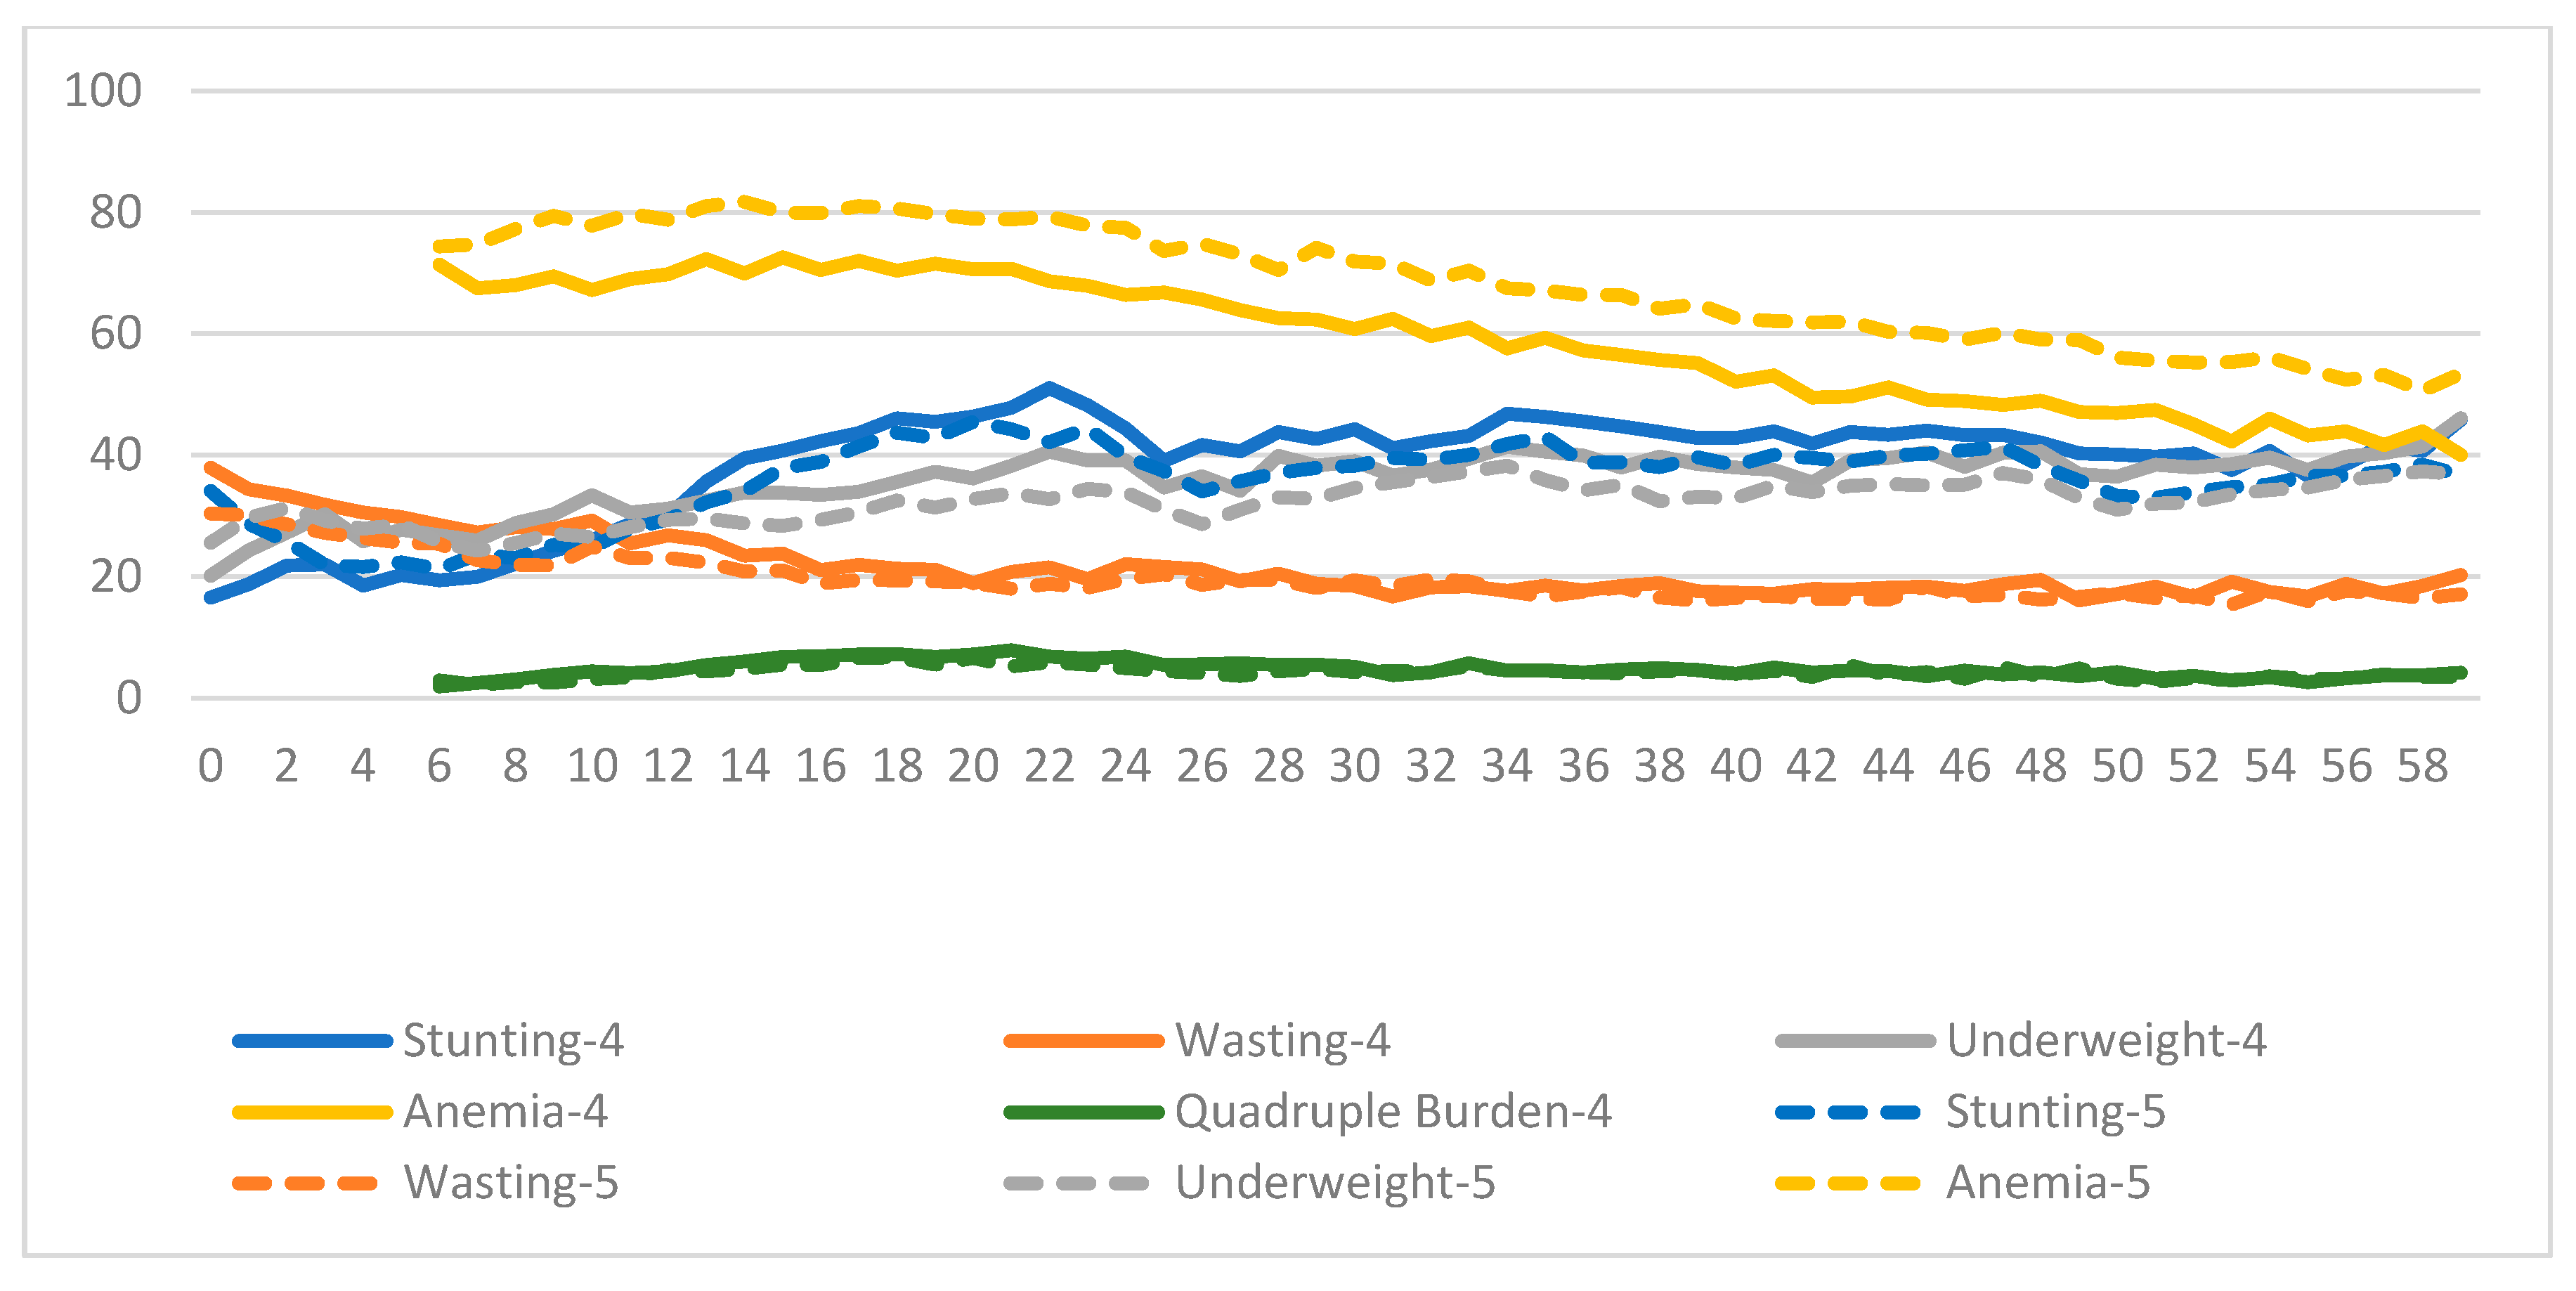

Table 3.2.
Sample Description and Prevalence of different burdens of Child Undernutrition w.r.t. background characteristics, NFHS 2019-21.
Table 3.2.
Sample Description and Prevalence of different burdens of Child Undernutrition w.r.t. background characteristics, NFHS 2019-21.
|
Univariate Analysis Sample Description |
Bivariate Analysis Prevalence of different burdens or co-occurrences w.r.t. background characteristics |
|||||||||||||||
| n | % | None | SWUA | WUA | SWU | SUA | SA | SU | WU | WA | UA | Anemia | Stunting | Wasting | Underweight | |
| Birth weight | ||||||||||||||||
| Low | 28807 | 15.9 | 16.7 | 6.1 | 6.1 | 2.1 | 15.3 | 10.7 | 5.5 | 2.5 | 3.5 | 1.6 | 23.7 | 3.9 | 1.3 | 0.9 |
| Normal | 146016 | 80.7 | 20.9 | 3.6 | 4.8 | 1.2 | 10.5 | 10.7 | 4.0 | 2.1 | 3.6 | 1.4 | 30.5 | 4.2 | 1.8 | 0.7 |
| High | 3775 | 2.1 | 20.2 | 4.3 | 5.3 | 1.5 | 12.3 | 10.9 | 5.2 | 2.0 | 3.6 | 1.1 | 28.2 | 3.9 | 1.1 | 0.5 |
| Not weighed/Don't know | 2260 | 1.2 | 17.5 | 5.5 | 5.9 | 1.8 | 15.3 | 12.5 | 5.6 | 1.5 | 3.4 | 1.3 | 23.2 | 4.5 | 1.3 | 0.6 |
| Birth Order | ||||||||||||||||
| 1 bo | 68718 | 38.0 | 23.0 | 3.3 | 4.6 | 1.1 | 9.0 | 9.9 | 3.8 | 2.2 | 3.7 | 1.4 | 31.4 | 4.1 | 1.7 | 0.7 |
| 2-3 bo | 88451 | 48.9 | 19.2 | 4.2 | 5.3 | 1.4 | 11.9 | 10.8 | 4.5 | 2.2 | 3.6 | 1.5 | 28.8 | 4.1 | 1.7 | 0.8 |
| 4& more | 23689 | 13.1 | 15.1 | 5.5 | 5.5 | 1.7 | 16.7 | 13.0 | 5.4 | 2.1 | 3.3 | 1.5 | 23.7 | 4.5 | 1.4 | 0.7 |
| Sex of the child | ||||||||||||||||
| male | 93113 | 51.5 | 20.1 | 4.5 | 5.2 | 1.5 | 11.2 | 11.0 | 4.3 | 2.2 | 3.6 | 1.4 | 28.7 | 4.2 | 1.6 | 0.7 |
| female | 87745 | 48.5 | 20.2 | 3.5 | 4.9 | 1.2 | 11.6 | 10.5 | 4.3 | 2.1 | 3.7 | 1.6 | 29.8 | 4.1 | 1.7 | 0.9 |
| Institutional delivery | ||||||||||||||||
| No | 25092 | 13.9 | 16.0 | 5.5 | 5.4 | 1.9 | 16.3 | 12.5 | 6.1 | 2.1 | 3.2 | 1.7 | 22.9 | 4.5 | 1.2 | 0.8 |
| Yes | 155766 | 86.1 | 20.7 | 3.8 | 5.0 | 1.3 | 10.7 | 10.5 | 4.1 | 2.2 | 3.7 | 1.4 | 30.0 | 4.1 | 1.7 | 0.8 |
| Child age | ||||||||||||||||
| 6-23 months | 56528 | 31.5 | 15.6 | 4.4 | 6.3 | 0.9 | 9.7 | 13.2 | 2.0 | 1.6 | 5.2 | 1.3 | 35.0 | 3.1 | 1.4 | 0.3 |
| 24-59 months | 122805 | 68.5 | 22.2 | 3.8 | 4.4 | 1.6 | 12.1 | 9.6 | 5.4 | 2.4 | 2.9 | 1.5 | 26.6 | 4.6 | 1.8 | 1.0 |
| Mother's age at child birth | ||||||||||||||||
| <18 | 10744 | 5.9 | 18.1 | 5.3 | 5.4 | 1.4 | 13.9 | 10.7 | 5.1 | 2.2 | 3.6 | 1.7 | 26.3 | 4.0 | 1.3 | 1.0 |
| 19-25 | 101613 | 56.2 | 19.9 | 4.0 | 5.0 | 1.4 | 11.4 | 10.9 | 4.4 | 2.1 | 3.5 | 1.5 | 29.2 | 4.2 | 1.6 | 0.8 |
| 25-34 | 60657 | 33.5 | 20.9 | 3.7 | 5.1 | 1.1 | 10.7 | 10.5 | 4.0 | 2.2 | 3.8 | 1.3 | 30.2 | 4.1 | 1.8 | 0.7 |
| 35-44 | 7672 | 4.2 | 21.9 | 4.1 | 5.3 | 1.4 | 11.2 | 10.7 | 4.4 | 2.0 | 3.7 | 1.5 | 26.0 | 4.5 | 2.7 | 0.8 |
| 45+ | 172 | 0.1 | 10.1 | 6.1 | 25.3 | 2.1 | 12.3 | 12.9 | 3.1 | 0.5 | 6.1 | 0.1 | 16.6 | 1.6 | 3.0 | 0.1 |
| Wantedness of child | ||||||||||||||||
| No more/Later | 11856 | 6.6 | 18.3 | 4.5 | 4.8 | 1.7 | 13.4 | 11.4 | 4.5 | 1.7 | 3.6 | 1.9 | 28.7 | 3.7 | 1.1 | 0.7 |
| Wanted | 169002 | 93.4 | 20.3 | 4.0 | 5.1 | 1.3 | 11.2 | 10.7 | 4.3 | 2.2 | 3.6 | 1.4 | 29.3 | 4.2 | 1.7 | 0.8 |
| Education of mother | ||||||||||||||||
| Illiterate | 39419 | 21.8 | 14.3 | 5.8 | 6.1 | 1.7 | 17.3 | 12.6 | 5.6 | 2.0 | 3.5 | 1.4 | 23.4 | 4.2 | 1.4 | 0.7 |
| Literate | 141439 | 78.2 | 21.7 | 3.5 | 4.8 | 1.3 | 9.8 | 10.2 | 3.9 | 2.2 | 3.7 | 1.5 | 30.8 | 4.1 | 1.8 | 0.8 |
| Body Mass Index | ||||||||||||||||
| Underweight | 32647 | 18.1 | 14.5 | 6.9 | 7.0 | 2.0 | 15.6 | 10.6 | 5.0 | 2.3 | 3.6 | 2.1 | 24.5 | 3.5 | 1.4 | 1.0 |
| Normal | 103089 | 57.2 | 19.6 | 3.6 | 5.1 | 1.3 | 11.1 | 10.9 | 4.3 | 2.3 | 4.0 | 1.4 | 29.6 | 4.2 | 1.8 | 0.7 |
| Overweight | 30308 | 13.1 | 28.9 | 1.7 | 2.9 | 0.7 | 6.3 | 9.4 | 3.0 | 1.6 | 2.7 | 0.9 | 35.1 | 4.7 | 1.6 | 0.9 |
| Missing/NA (Currently Pregnant) | 14064 | 7.8 | 17.8 | 4.9 | 5.0 | 1.5 | 14.2 | 12.6 | 4.8 | 1.8 | 2.8 | 1.6 | 27.0 | 4.2 | 1.3 | 0.6 |
| Diet of mother | ||||||||||||||||
| Low | 62082 | 34.3 | 18.7 | 4.2 | 5.0 | 1.2 | 12.0 | 11.6 | 4.3 | 2.1 | 3.5 | 1.5 | 29.8 | 3.9 | 1.4 | 0.8 |
| Medium | 82015 | 45.3 | 19.7 | 4.2 | 5.2 | 1.4 | 11.7 | 10.5 | 4.6 | 2.2 | 3.6 | 1.5 | 28.7 | 4.3 | 1.7 | 0.7 |
| High | 36761 | 20.3 | 23.1 | 3.4 | 4.8 | 1.3 | 9.8 | 9.9 | 3.8 | 2.3 | 3.8 | 1.3 | 29.4 | 4.3 | 2.0 | 0.9 |
| Maternal height categorized | ||||||||||||||||
| Short | 20605 | 11.4 | 13.1 | 6.5 | 5.2 | 2.2 | 19.6 | 13.2 | 7.9 | 1.9 | 2.7 | 1.5 | 18.7 | 5.5 | 1.2 | 0.8 |
| Normal | 144035 | 79.6 | 20.5 | 3.8 | 5.1 | 1.3 | 10.8 | 10.7 | 4.0 | 2.2 | 3.7 | 1.5 | 29.8 | 4.1 | 1.7 | 0.8 |
| Tall | 15405 | 8.5 | 26.6 | 2.1 | 4.0 | 0.7 | 5.3 | 7.7 | 1.9 | 1.9 | 4.0 | 1.3 | 38.9 | 3.0 | 2.1 | 0.5 |
| Not weighed/Missing | 813 | 0.4 | 30.5 | 4.5 | 5.2 | 1.0 | 10.4 | 13.6 | 2.5 | 2.0 | 3.5 | 0.4 | 20.9 | 3.2 | 1.8 | 0.4 |
| Toilet facility in household | ||||||||||||||||
| Improved, not shared | 113599 | 62.8 | 22.5 | 3.3 | 4.7 | 1.2 | 9.5 | 10.0 | 3.8 | 2.2 | 3.7 | 1.4 | 30.9 | 4.2 | 1.9 | 0.8 |
| Unimproved source/Shared/Other | 29571 | 16.4 | 19.3 | 3.9 | 5.1 | 1.4 | 11.3 | 11.3 | 4.2 | 2.3 | 3.6 | 1.4 | 29.9 | 4.1 | 1.4 | 0.8 |
| Open defecation | 37688 | 20.8 | 14.6 | 6.1 | 6.0 | 1.7 | 16.5 | 12.3 | 5.6 | 2.0 | 3.3 | 1.7 | 24.3 | 4.0 | 1.3 | 0.7 |
| Wealth index of the HH | ||||||||||||||||
| Poorer | 91240 | 50.4 | 15.6 | 5.4 | 6.0 | 1.6 | 15.3 | 12.0 | 5.4 | 2.1 | 3.5 | 1.7 | 24.8 | 4.3 | 1.4 | 0.8 |
| Middle | 35271 | 19.5 | 20.0 | 3.7 | 4.6 | 1.2 | 10.4 | 10.7 | 4.4 | 2.4 | 3.5 | 1.5 | 30.9 | 4.4 | 1.6 | 0.7 |
| Richer | 54347 | 30.0 | 26.4 | 2.3 | 4.0 | 1.0 | 6.5 | 9.0 | 2.8 | 2.1 | 3.8 | 1.2 | 34.2 | 3.8 | 2.1 | 0.8 |
| Social Group | ||||||||||||||||
| SC | 36830 | 20.4 | 17.7 | 4.5 | 5.3 | 1.4 | 13.8 | 11.5 | 4.5 | 1.9 | 3.5 | 1.6 | 27.8 | 4.3 | 1.4 | 0.7 |
| ST | 36974 | 20.4 | 14.6 | 6.2 | 7.0 | 1.4 | 14.7 | 11.2 | 4.3 | 1.9 | 4.2 | 1.7 | 26.9 | 3.6 | 1.5 | 0.7 |
| OBC | 68730 | 38.0 | 21.2 | 3.8 | 4.7 | 1.5 | 10.8 | 10.6 | 4.5 | 2.3 | 3.4 | 1.4 | 28.8 | 4.2 | 1.8 | 0.8 |
| General/Others | 38324 | 21.2 | 23.1 | 2.9 | 4.5 | 1.0 | 8.5 | 9.9 | 3.6 | 2.2 | 3.8 | 1.3 | 32.5 | 4.0 | 1.8 | 0.8 |
| Place of residence | ||||||||||||||||
| urban | 36595 | 20.2 | 24.1 | 3.1 | 4.3 | 1.2 | 8.7 | 9.5 | 3.4 | 2.3 | 4.0 | 1.3 | 31.1 | 4.1 | 2.2 | 0.7 |
| rural | 144263 | 79.8 | 18.7 | 4.4 | 5.3 | 1.4 | 12.3 | 11.2 | 4.6 | 2.1 | 3.5 | 1.5 | 28.6 | 4.2 | 1.5 | 0.8 |
| EAG State | ||||||||||||||||
| Non-EAG | 90356 | 50.0 | 21.7 | 4.0 | 5.0 | 1.2 | 9.9 | 9.8 | 3.6 | 2.3 | 3.9 | 1.6 | 30.4 | 3.9 | 1.8 | 0.8 |
| EAG | 90502 | 50.0 | 18.8 | 4.1 | 5.1 | 1.4 | 12.6 | 11.5 | 4.9 | 2.1 | 3.4 | 1.4 | 28.2 | 4.3 | 1.5 | 0.7 |
| Region | ||||||||||||||||
| North | 33433 | 18.5 | 21.6 | 2.3 | 3.9 | 0.8 | 8.7 | 10.7 | 3.0 | 1.4 | 3.3 | 1.2 | 37.5 | 3.8 | 1.5 | 0.5 |
| Central | 45428 | 25.1 | 20.2 | 3.6 | 4.3 | 1.3 | 12.0 | 12.3 | 4.7 | 2.1 | 3.2 | 1.2 | 28.2 | 4.7 | 1.4 | 0.8 |
| East | 35412 | 19.6 | 17.5 | 5.1 | 6.3 | 1.6 | 13.5 | 10.5 | 5.2 | 2.2 | 3.7 | 1.7 | 26.5 | 3.9 | 1.5 | 0.8 |
| North-East | 27805 | 15.4 | 21.9 | 3.0 | 4.9 | 1.4 | 9.7 | 11.0 | 4.2 | 2.4 | 4.4 | 1.2 | 27.3 | 5.6 | 2.3 | 0.7 |
| West | 16174 | 8.9 | 15.5 | 6.2 | 7.0 | 1.6 | 12.3 | 10.5 | 3.6 | 2.6 | 5.0 | 2.0 | 28.2 | 3.0 | 1.8 | 0.7 |
| South | 22606 | 12.5 | 26.4 | 3.0 | 3.7 | 1.3 | 8.7 | 8.8 | 3.8 | 2.4 | 3.1 | 1.4 | 29.8 | 4.4 | 2.2 | 0.9 |
Table 3.3.
Univariate Moran's I computed for assessing clustering at the district level for different nutritional outcomes, NFHS-5.
Table 3.3.
Univariate Moran's I computed for assessing clustering at the district level for different nutritional outcomes, NFHS-5.
| Indicators | Univariate Moran's I |
| Child Undernutrition Outcomes | |
| Stunting | 0.511 |
| Wasting | 0.463 |
| Underweight | 0.677 |
| Anemia | 0.579 |
| Co-occurrences from the index CIAF+Anemia | |
| Co-occurrence of Stunting, Underweight and Anemia (SUA) | 0.588 |
| Co-occurrence of Stunting and Anemia (SA) | 0.285 |
| Co-occurrence of Stunting, Wasting, Underweight and Anemia (SWUA) | 0.555 |
| Stunting, without co-occurrence of any other undernutrition issue like Wasting, Underweight or Anemia (only stunting) | 0.422 |
| Anemia, without co-occurrence of any other undernutrition issue like Stunting, Wasting, Underweight (only anemia) | 0.511 |
| Free from any form of undernutrition like Stunting, Wasting, Underweight or Anemia (None) | 0.547 |
| Co-occurrences from the index CIAF | |
| Stunting, without co-occurrence of any other undernutrition issue like Wasting or Underweight (only stunting) | 0.306 |
| Free from any form of undernutrition like Stunting, Wasting or Underweight (None) | 0.632 |
Table 3.4.
Bivariate moran's I computed for assessing clustering at the district level for selected combination of nutritional outcomes, NFHS-5.
Table 3.4.
Bivariate moran's I computed for assessing clustering at the district level for selected combination of nutritional outcomes, NFHS-5.
| Indicator-1 | Indicator-2 | Bivariate Moran's I |
| Child Undernutrition indicators | Co-occurrences from CIAF+Anemia | |
| Stunting | SUA | 0.491 |
| Underweight | SUA | 0.404 |
| Anemia | SUA | 0.578 |
| Stunting | SA | 0.232 |
| Anemia | SA | 0.238 |
| Anemia | only Anemia | 0.188 |
| Stunting | only Stunting | -0.039 |
| Child Undernutrition indicators | Co-occurrences from CIAF | |
| Stunting | only Stunting | 0.16 |
Disclaimer/Publisher’s Note: The statements, opinions and data contained in all publications are solely those of the individual author(s) and contributor(s) and not of MDPI and/or the editor(s). MDPI and/or the editor(s) disclaim responsibility for any injury to people or property resulting from any ideas, methods, instructions or products referred to in the content. |
© 2025 by the authors. Licensee MDPI, Basel, Switzerland. This article is an open access article distributed under the terms and conditions of the Creative Commons Attribution (CC BY) license (http://creativecommons.org/licenses/by/4.0/).
Copyright: This open access article is published under a Creative Commons CC BY 4.0 license, which permit the free download, distribution, and reuse, provided that the author and preprint are cited in any reuse.


