
Submitted:
05 June 2023
Posted:
05 June 2023
You are already at the latest version
Abstract
The study examines malnutrition's triple burden, including anaemia, overweight, and stunting, among children aged 6-59 months. Using data from the National Family Health Survey-5 (2019-21), the study identifies risk factors and assesses the contribution at different levels to existing malnutrition burden. A random intercept multilevel logistic regression model and spatial analysis are employed to identify child, maternal, and household level risk factors for stunting, overweight, and anaemia. The study finds that 34% of children were stunted, 4% overweight, and 66% anaemic. Stunting and anaemia prevalence were higher in central and eastern regions, while overweight was more prevalent in the north-eastern and northern regions. At macro-level, the coexistence of stunting, overweight, and anaemia circumstantiates the triple burden of childhood malnutrition with substantial spatial variation (Moran’s I: stunting-0.53, overweight-0.41 and anaemia-0.53). Multilevel analysis reveals that child, maternal, and household variables play a substantial role in determining malnutrition burden in India. The nutritional health is significantly influenced by a wide range of determinants, necessitating multilevel treatments targeting households to address this diverse group of coexisting factors. Given the intra-country spatial heterogeneity, the treatment also needs to be tailor-made for various disaggregated levels.
Keywords:
Children
; Malnutrition
; India
; Overweight
; Stunting
; Anaemia
1. Introduction
The developing nations have come a long way in reducing child mortality. With improvements in income, education, and healthcare utilization, the Asia-Pacific region has substantially reduced the under-five mortality rates [1,2]. Despite more children surviving, millions of young children in developing countries fail to thrive, as indicated by stagnation in reducing stunting, wasting and the fastest-growing rates of overweight and obesity [3,4]. It was found that child survival interventions were less efficient in countries grappled mainly by childhood malnutrition [4]. According to the National Family Health Survey (NFHS), 2019-21, 36 percent of children under five are stunted, 32 percent are underweight, and 67 percent are anaemic.
Malnutrition has always been a crucial public health challenge and entails high healthcare costs and increased morbidity and mortality [4]. The nutritional needs of children are unique and crucial. Large populations suffer from undernutrition, overweight, and obesity as a result of a lack of nutritious food. These forms of malnutrition often exist simultaneously and are interconnected [5,6]. In the Indian context, there are stagnant improvements in undernutrition, with growing rates of overweight and anaemia, especially among children. Thus, overall, India’s under-five population is facing an increased burden resulting from higher rates of underweight, overweight, and anaemia.
In the recent Global Nutrition Report, India was marked as likely to miss global nutrition targets by 2025. Approximately 45 percent of deaths among children under-five years of age can be attributed to undernutrition [6]. Childhood undernutrition may result in irreversible long-term effects, including impaired physical growth and cognitive development [1,4,8]. Poor nutrition in the first 1000 days of a child’s life can also lead to stunted growth, impaired cognitive ability, and reduced school and work performance. This might further disable them from leading a socially and economically productive life at later ages [8,9] .
While there has been some progress in Asian sub-continents concerning the reduction of the undernourished population from over one billion people in the 1990s to 793 million in 2015 [5,10,11,12] childhood overweight and obesity rates are rising. In the past 40 years, the obesity pandemic has changed malnutrition patterns globally. Furthermore, overweight exhibits an increasing trend with a notable prevalence among lower-income groups, where being underweight is already a major challenge [3]. Therefore, more than two indicators of malnutrition may coexist in various parts of the Indian subcontinent. The triple burden of malnutrition among Indian must be investigated in order to inform comprehensive action against childhood malnutrition in all its forms.
Malnutrition among children is multifaceted; the mother’s nutritional status is the most important factor causing childhood malnutrition. Increased maternal education helps to reduce cases of childhood malnutrition. Children of uneducated mothers showed a greater risk of malnutrition than their counterparts [13,14]. It has been reported that girls are more susceptible to malnutrition than boys. It was seen that boys were timely fed and continued to drink mother’s milk than the girls, which in turn led to health issues [15]. Higher birth order children are more prone to malnutrition than those born in the lower orders. Children of higher order were found to be affected by severe cases of malnutrition. It has been found that mothers with many children don’t get time to feed and take care of them. Shorter birth intervals do not allow the mother to regain her health properly; this results in the deteriorating health of both mothers and their children [16]. Thus, it is essential to understand these disparities in order ensure that policies are developed to address nutrition problems among the most vulnerable sections of society.
Existing literature has adopted different approaches to define malnutrition in India. Some studies employed mother-child dyads, others highlighted the clustering of sibling malnutrition [17,18]. Other studies have focused on the intra-household burden of malnutrition based on two or more individuals affected by under- or over nutrition [19,20]. However, only few have captured these contrasting dimensions of malnutrition holistically for children at population-level in India. Being a highly diverse country, it is necessary to capture contrasting forms of malnutrition at varied levels in India. In addition, existing studies fail to holistically capture the emerging burden at disaggregated levels. The present study utilizes three indicators of malnutrition, stunting, overweight, and anaemia among children aged 6-59 months in India. Furthermore, the study focuses on identifying the risk factors of stunting, overweight and anaemia, as well as assessing the contribution at various hierarchical levels to the existing burden of malnutrition.
2. Materials and Methods
2.1. Participants
The data from fifth rounds of the National Family Health Survey (NFHS-5), 2019-21, India is used in this study. NFHS is designed to provide national and sub-national estimates of various critical indicators to monitor the SDGs on population, health, nutrition, and gender equality, among others. NFHS-5 included data from 636,699 households with 724,115 eligible women aged 15-49 years, 101,839 men and 230,978 children under the age of five years [21].
We used a combined dataset for the current study that contained data on 219,399 children under the age of five from kid and household member files. Anemia was one of the three markers of malnutrition that was specifically examined in children aged 6-59 months, therefore we restricted the analysis to 198,335 kids.
2.2. Measurements
2.2.1. Outcome Variables
Three anthropometric indicators of nutritional status among children, namely, stunting (height-for-age), overweight (weight-for-age), and anaemia were used as the dependent variable in this study.
Height-for-age is a measure of linear growth retardation and cumulative growth deficits. Children whose height-for-age z-score is below minus two standard deviations (-2 SD) from the median of the reference population are considered short for their age (stunted) or chronically undernourished [21]. Weight-for-age is a composite index of height-for-age and weight-for-height. It takes into account both acute and chronic malnutrition. Children whose weight-for-age z-score is below minus two standard deviations (-2 SD) from the median of the reference population are classified as underweight while children whose weight-for-height z-score is more than two standard deviations (+2 SD) above the median of the reference population are considered overweight. Anaemia is a condition marked by low levels of haemoglobin in the blood. For this study, any form of anaemia among children aged 6-59 months was marked by haemoglobin levels (Haemoglobin levels are adjusted for the altitude in enumeration areas above 1,000 meters) below 11 g/dl [21].
2.2.2. Explanatory Variables
The study explores the burden of selected indicators of malnutrition in a nested set-up. The study included child, household, and mother level characteristics. These included child’s age (in months), child’s sex, birth size, birth order, place of residence, religion, caste, wealth, mother’s age, education, body mass index (BMI), mass media exposure. In addition, for childhood anaemia, mothers’ anaemia status was also included as a predictor.
2.3. Statistical Analysis
A number of hierarchical levels can be used to quantify the extent of malnutrition in the nation. The first part of this study focuses at the spatial heterogeneity of the selected indicators among 707 districts across the nation. We first created thematic maps to assess the prevalence of malnutrition at sub-regional level. To investigate the spatial dependence and clustering of malnutrition indicators, we estimated the univariate Local Indicator of Spatial (LISA) cluster, significance maps, and Moran's I statistics. We identified the areas with statistically significant clustering of hotspots (high levels of malnutrition indicators) and cold spots (low levels of malnutrition indicators). This gave us within country information on high performing and low performing regions with respect to geographical proximity. The computation of the spatial autocorrelation indices required spatial weights of order one, which were produced using a Queen's contiguity weight matrix. Weights based on contiguity from the polygon boundary file were calculated using Queen's contiguity matrix. The study proceeded with descriptive statistics to describe the sample characteristics. Furthermore, a bivariate analysis was carried out to explore the pattern of indicators of malnutrition by selected background characteristics. These values were supplemented with chi-square p-values to identify the statistical significance associations.
It is worth mentioning that NFHS dataset follows a hierarchical structure, where children were nested within a household, households were nested within PSU, and PSUs were nested within districts. Thus, to account for nested data structure, a multi-level logistic regression analysis was employed to identify the possible risk factors and to assess the contribution of selected analytical levels on malnutrition. For the present analysis, a three-level logistic regression model was applied. Three-level random intercept logistic model has been specified for the probability of a child in the age group 6-59 months in PSU j and district k being stunted (Yijk =1), and the same model is repeated to get results for overweight and anaemia [22] . This model estimates the log odds of πijk adjusted for vector (Xijk) of explanatory variables measured at the individual level. The parameter βo represents the log odds of the malnutrition for a child belonging to the reference category of all the categorical variables. The random effect inside the brackets is interpreted as a residual differential for the district k (), PSU j () and individual i () assumed to be independent and normally distributed with mean 0 and variance , , and , respectively. The variances quantify between districts and between PSU variations, respectively, in the log-odds of children aged 6-59 months having stunting, overweight or anaemia. The results were presented in the form of adjusted odds ratios (AORs).
The analysis was performed using STATA Version 17.0 (StataCorpTM, Texas). Geo-Da version 1.20.0.814 (TeknowledgistTM, New York) was used to complete spatial analysis. All the estimates provided in this study are derived by applying appropriate sampling weights computed by the Demographic and Health Survey (DHS) India, 2019–21.
3. Results
Triple Burden of Malnutrition among under Five Children in India
Figure 1 represents the triple burden of malnutrition, stunting (x-axis), anaemia (y-axis) and overweight (z axis-bubble size) among children aged 6-59 months across 707 districts in India. Findings suggest that in 2021, 34 percent of the children were stunted, 4 percent were overweight and 66 percent were anaemic. In the figure, districts are segmented into six regions, central (orange), east (light blue), north (green), north-east (yellow), south (dark blue) and west (pink). Findings illustrates that districts hailing from the central and eastern regions have higher prevalence of stunting and anaemia, but lower burden of overweight. Children hailing from the northern region have higher overweight, with higher prevalence of anaemia. The findings present that anaemia burden is a growing concern among children, as around 90 percent (635 out of 707) districts had a prevalence greater than 50 percent.
Figure 2 illustrates the distribution of stunting, overweight and anaemia across 707 districts in India. In case of stunting, 339 districts (47.9% of the districts) had a prevalence greater than the national average (~34%). Out of 339, 105 (~31%) of the districts belonged to the central region, 81 districts (~24%) belonged to eastern, 49 districts (~15%) belonged to western region, 42 districts (12%) belonged to north-eastern region, 32 districts (~9%) belonged to southern region 30 district (~9 %) belonged to northern region in the country.
For overweight, 270 districts (38.1% of the districts) had a prevalence greater than the national average (~4%). Out of 270, 71 districts (26.3%) belonged to north-eastern region, 61 district (22.6%) belonged to northern region, 51 districts (7.2%) belonged to southern region, 34 districts (12.6%) belonged to the central region, 30 districts (11.1%) belonged to western region and 23 districts (8.5%) belonged to eastern region in the country.
For anaemia, 409 districts (57.9% of the districts) had a prevalence greater than the national average (66.4%). Out of 409, 95 districts (23.2%) belonged to the central region, 91 districts (22.2%) belonged to northern region, 74 districts (18.1%) belonged to eastern region, 62 districts (15.2%) belonged to western region, 52 districts (12.7%) belonged to southern region and 35 districts (~5%) belonged to north-eastern region of the country.
Spatial Heterogeneity in the Triple Burden of Malnutrition
Figure 3A–C present findings from univariate LISA maps along with univariate Moran’s I statistics. In addition, significance maps for all the three indicators are presented in Figure S1. These findings depict the spatial clustering and extent of spatial autocorrelation for three indictors of malnutrition, stunting, overweight, and anaemia. All three outcomes of malnutrition show a considerably high spatial autocorrelation. There is a high spatial clustering for stunting (Moran’s I = 0.53, p value=0.001) with 133 ‘hotspots’ and 128 ‘cold spots,’ most ‘hotspots’ are located in the states of Uttar Pradesh and Bihar.
There is statistically significant clustering for overweight (Moran’s I = 0.41, p value=0.001), with 53 ‘hotspots’ concentrated in Northern and North-eastern regions and 103 ‘cold spots’ in the Central region. Spatial clustering is higher for anaemia (Moran’s I = 0.53, p value=0.001) and identified 99 ‘hotspots’ concentrated in the Western states of Gujarat and Maharashtra. In the present context, hot spot depicts districts which are higher prevalence of selected outcomes of interests (stunting, overweight, and anaemia) and are surrounded by other districts with high prevalence as well; whereas a cold spot depicts districts with low prevalence surrounded by district with lower prevalence.
Description of the Study Population
Table 1 provides the descriptive statistics of the child, household, and mother level characteristics. Findings suggest that 45 percent of the study population comprised of children aged 36-59 months, 52 percent were males and 39 percent were first birth order. Around 73 percent of the population resided in the rural areas, 79 percent belonged to the Hindu households, 43 percent belonged to other backward classes and 46 percent belonged to poor households.
Furthermore, Table 1 presented the burden of selected indicators of malnutrition by background characteristics. Findings suggest that for stunting, all the child, household, and mother level characteristics were found to be significantly associated. Stunting was found to be higher among children aged 24-35 months (38.2%), males (37.0%), and birth order four or more (43.8%). Stunting was higher for children residing in rural areas (38.4%), following Muslim faith (37.9%), are from Scheduled Castes/Tribes (40.8%) and belong to poorest wealth quintile (47.9%). Stunting was higher among children whose mothers age at their birth was below 19 years (40.9%), had no education (47.8%), were underweight (44.4%) and had no exposure to mass media (45.6%).
Overweight was found to be higher among children aged 6-23 months’ (4.4%), males (3.3%), and birth order one (3.7%). Overweight was higher for children residing in urban areas (4.1%), following Muslim faith (%), are from other caste categories (~4.0%) and belong to richest wealth quintile (4.7%). Overweight was higher among children whose mothers age at their birth was 25-49 years (4.2%), had higher education (4.6%), were overweight/obese (4.2%) and had any exposure to mass media (3.4%).
Anaemia was found to be higher among children aged 6-23 months (4.5%) and birth order four or more (70.8%). Anaemia was higher for children residing in rural areas (69.3%), following faith other than Hindu/Muslim or Christianity (71.5%), are from Scheduled Castes/Tribes (71.6%) and belong to poorest wealth quintile (72.7%). Anaemia was higher among children whose mothers age at their birth was below 19 years (72.3%), had no education (72.8%), were underweight (72.9%), had no exposure to mass media (72.1%) and had anaemia (73.0%).
Multi-Level Regression Analysis
Table 2 presents the findings from the multi-level regression analysis showing the effects of fixed-effect and random-effect parameters. From the null model, the variance estimate is greater than zero it indicates that there are area differences in the selected indicators of nutrition among children aged 6-59 months. It is worth mentioning that all the selected outcomes are binary in nature, thus, a multilevel logistic regression model was considered appropriate for further analysis. The results as presented as adjusted odds ratio (AOR) for stunting, overweight, and anaemia.
Considering the final model, the intra-class correlation coefficient (ICC) indicated that 31.2 percent of the total variability in stunting is due to differences across households, followed by PSUs (10.7%) and districts (2.4%). In the random effect part, the p-value of the log-likelihood ratio test (LR) versus logistic regression is 0.000 for all three indicators. This suggests that variance in selected indicators of malnutrition differs significantly across household, PSU and district level.
Model 3 represents the findings after controlling for all child, mother, household and community level characteristics. All explanatory factors were found to be statistically significant associated with stunting. Among them, children aged 36-59 months were more likely to be stunted as compared to children in the age group 6-23 months. Female children are 14 percent less likely to be stunted than their male counterparts. Children with birth order 4 or above were are approximately 25 percent more likely to be stunted as compared to first birth order children. Children whose birth size was normal or above average were 31 percent less likely to be stunted as compared to their counterparts. In household level factors, children residing in rural areas were more likely than those from urban areas. Children belonging to households’ following Muslim faith were 13 percent more likely to be stunted as compared to those belonging to Hindu households. Children belonging to others caste category were 25 percent less likely to be stunted as compared to Scheduled Castes/Tribes. Children from richest wealth quintile households were 55 percent less likely to be stunted as compared to poorest households. Moving on to mother-level factors, as the mother’s age increases, the chances of being stunted are reduced. Similarly, children whose mothers have attained higher education are 33 percent less likely to become stunted than children whose mothers have no education. Children of overweight mothers were 22 percent less likely to be stunted as compared to thin mothers. Children of mothers with any mass media exposure were 9 percent less likely to be stunted as compared to those no exposure.
For childhood overweight, except for mother’s age at birth and mass media exposure, all other variables were found to be statistically significant. Among them, children aged 36-59 months were 51 percent less likely to be overweight as compared to children in the age group 6-23 months. Female children are 8 percent less likely to be overweight than their male counterparts. Children with birth order four or above are approximately 17 percent less likely to be overweight as compared to first birth order children. Children whose birth size was normal or above average were 27 percent more likely to be overweight as compared to their counterparts. In household level factors, children residing in rural areas were 13 percent less likely to be overweight than those from urban areas. Children belonging to households’ following Christian faith were 29 percent more likely to be overweight as compared to those belonging to Hindu households. Children belonging to others backward class category were 12 percent less likely to be overweight as compared to Scheduled Castes/Tribes. Children from richest wealth quintile households were 48 percent more likely to be overweight as compared to poorest households. Moving on to mother-level factors, as the mother’s age increases, the chances of being overweight increases. Similarly, children whose mothers have attained secondary education are 12 percent less likely to become overweight than children whose mothers have no education. Children of overweight mothers were 92 percent more likely to be overweight as compared to thin mothers.
For anaemia, children aged 36-59 months were 70 percent more likely to be anaemic as compared to children in the age group 6-23 months. Children with birth order 4 or above were approximately 8 percent more likely to be anaemic as compared to first birth order children. Children whose birth size was normal or above average were 6 percent less likely to be anaemic as compared to their counterparts. In household level factors, children residing in rural areas were four percent more likely than those from urban areas. Children belonging to households’ following Muslim faith were 7 percent more likely to be anaemic as compared to those belonging to Hindu households. Children belonging to other backward class category were 16 percent less likely to be anaemic as compared to Scheduled Castes/Tribes. Children from richest wealth quintile households were 21 percent less likely to be anaemic as compared to poorest households. Moving on to mother-level factors, children whose mothers have attained higher education are 19 percent less likely to become anaemic than children whose mothers have no education. Children of overweight mothers were 14 percent less likely to be anaemic as compared to thin mothers. Children of mothers with any mass media exposure were 5 percent less likely to be anaemic as compared to those no exposure. Children of anaemic mothers were 66 percent more likely to be anaemic as compared to their counterparts.
4. Discussion
The results show that the country is dealing with a triple nutritional burden, as seen by the concurrent prevalence of stunting (34%), overweight (4%), and anaemia (66%). Further research has revealed regional variation in three indicators of malnutrition among children in 707 districts of India between the ages of 6-59 months. The results of multi-level regression show that child, mother, and household level variables can influence the prevalence of malnutrition in India, with the level of households explaining the most variability.
Children aged 36-59 months, have a birth order of 4 or higher, and had a birth size below normal were shown to have increased rates of stunting and anaemia. Children who lived in rural areas, were Muslims, belonged to scheduled caste groups, and were from the poorest households were more likely to be stunted and anaemic. Children of young, uneducated, thin mothers were more likely to be anaemic and stunted. Children born to anaemic mothers are more prone to be anaemic. Children aged 6-23 months who were male, in the first birth order, and whose birth size was normal or above average were more likely to be overweight. Children living in urban areas, adhering to the Christian faith, and belonging to the richest quintile were more prone to be overweight. Additionally, children of older (35-49 months), uneducated, and overweight mothers were more likely to be overweight.
Possible Mechanism of the Findings
The present study revealed spatial variation in the triple burden of malnutrition and highlighted that the central and eastern regions have a higher burden of stunting and anaemia. The prevalence of overweight was higher in the northern and north-eastern districts of the country. Existing literature from India, have highlighted central and eastern regions as the hotspots stunting and anaemia [23,24]. Further research may be necessary to determine the contextual and policy-related factors that are contributing to this persistently regional disparity. Table S2 illustrates selected contextual determinants of malnutrition at macro-level. This may create a path for context-specific initiatives that will aid in reducing the nation's subnational inequities. The observed regional variations may be explained by the various socioeconomic, cultural, and political systems that exist, which also affect the dietary customs in each region.
The results of this study indicate that firstborn children have a height advantage over those with birth orders of four or more. Results thus show a negative birth-order effect stunting. These results can be supported by Dhingra and Pingali (2020), which found that children in the third (or higher) birth order have a height-to-age gap that is twice as large as that of children in the second birth order. However, these linkages hold true only in the cases where the birth spacing is less than three years. The study reaffirms that negative birth-order effects are monitored via the channels of birth spacing [25]. The instance of overweight, however, showed a positive birth order effect and suggested a greater burden for first birth order children. The firstborn child may receive superior feeding than other siblings, which could account for this. Table S3 shows the result of quantile regression with proportion of children who were stunted, underweight and anaemia by some selected characteristics in 707 districts of India, NFHS-5 (2019-21).
Our research shows a link between undernutrition (stunting and anaemia) and low birth weight, whereas normal or above-average weight children were more likely to be overweight. This is consistent with research done in low- and middle-income nations, which suggests that a child born with a certain birth weight or size is likely to remain that way throughout early life [26]. Numerous mechanisms may be to blame for undernutrition and low birth weight. First, there is a positive correlation between poverty and low birth weight, which is also noted as having a connection to anthropometric growth failures and micronutrient deficiencies. Second, low birth weight is associated with an increased risk of problems and morbidities, including respiratory infections, lethargy, appetite loss, diarrhea, jaundice, and chronic lung diseases. Greater morbidity coupled with lower birth weight results in poor physical development and micronutrient deficiencies among children [26]. Findings identified maternal factors associated with at least one indicator of nutritional status of children aged 6-59 months. These include education and mothers’ nutritional status. In addition, the likelihood of stunting was lower among the children of mothers with lower age at first birth. This finding is consistent with earlier research showing a relationship between mother's age and better child feeding [27]. Numerous more studies relate mother age to better child nutrition through avenues of increased autonomy and empowerment [28].
Historically, studies have shown that maternal education and nutritional status have a significant role in driving the nutritional status of children [22,29]. The regions marked by low female education have a higher prevalence of malnutrition among children, especially undernutrition.28 The findings from the present study corroborates with the existing literature. The evidence suggests that children born to educated mothers have lowered the risk of stunting, overweight and anaemia and thus, malnutrition was found to be negatively and significantly associated with women’s educational attainment[29].
Poor maternal nutrition has been established as an important public health issue for both mothers and their children. Malnutrition among mothers is found to be linked with increased maternal morbidity, preterm deliveries, and small-for-gestational-age babies [2,29]. These babies are at a higher risk of anthropometric failure and micro-nutrient deficiencies.30 Numerous mechanisms may contribute to the link between childhood and maternal anaemia, according to existing research. In addition to premature birth and a child's weight, anaemia has detrimental effects on the iron content of breast milk, which eventually causes childhood anaemia [29]. It is important to note that research in the field indicates a positive relationship between empowerment and exposure to the media. This could possibly be the reason why exposure to the media has a positive impact on reducing malnutrition [28].
While overweight was more common in wealthy households, stunting and anaemia were more common among the poorest households. Existing research based in India have shown that households from low socioeconomic backgrounds are compelled to live with increased food insecurity; as a result, they eat items low in nutrients and calories. Additionally, they may not have enough money to effectively feed their kids, which could lead to malnutrition. The children of wealthy families, on the other hand, may become overweight because they have extra resources and are more inclined to feed their children unhealthy packaged foods that are high in sugar, fat, and sodium.
Distinction between urban and rural settings can be seen in terms of the type of malnutrition. Previous studies have used the greater accessibility of healthcare services in urban settings to explain it. The higher prevalence of stunting and anaemia in rural areas can be explained through the pathways of poverty, but in the context of India, this discrepancy can also be partially attributable to socioeconomic inequalities between rural and urban areas [23,32].
Dealing with malnutrition in India is particularly difficult compared to other nations since it is deeply ingrained in the social structure. It is clear that stunting and anaemia are more common in children from scheduled castes. Studies already conducted highlight differences in the consumption of nutrient-dense foods among socially disadvantaged groups (which includes individuals from lower castes). Wage disparities between poorer and upper castes in India are a key cause of this inequality [33]. Additionally, dietary behaviors that are based on cultural and socioeconomic variations can be linked to differences in malnutrition due to religious differences.
Policy Implications of the Findings
In the past decade, malnutrition has been one of the top priorities of policymakers in India, with increasing efforts to target the affected group and improve nutritional status, especially among children. Overall, India’s strategy has been primarily focused on reducing food insecurity, improving environmental factors associated with malnutrition, and ensuring adequate nutrition. One such scheme to control malnutrition is based on schemes like the Public Distribution System (PDS). PDS is based on reducing food insecurity but suffers from the drawback of a disrupted distribution system, and the food distributed is primarily low in nutritional value. Such schemes might be practical to diminish food insecurity, but they do not contribute significantly to addressing the concerns related to malnutrition.
India’s primary nutritional and child development scheme, the Integrated Child Development Scheme (ICDS), has expanded steadily during the 45 years of its existence. The scheme, which was launched in 1975, now covers almost all development blocks in the country and has addressed some of the important underlying causes of undernutrition. In 2017, the government of India launched POSHAN Abhiyaan, or its flagship National Nutrition Mission, which aims to improve nutrition among children, pregnant women, and lactating mothers. POSHAN Abhiyaan aims to provide a convergence mechanism for the country’s response to malnutrition. Considering the environmental factors, a recent initiative, the Swachh Bharat Abhiyan, launched in 2014, is theorized to reduce stunting. However, the impact of these programs is yet to be evaluated. The present study mapped the spatial variation and identified the hot-spot and cold-spot based on clustering of malnutrition at district levels. These findings would be helpful to the planners and policy makers to help build new intervention for those specific underprivileged districts. In this context, the National Health Mission (NHM) initiative by Govt. of India is working towards child and maternal health across India to improve over the situation prevailing. In another public health intervention to fight against malnutrition, Govt of India has set up the National Nutrition Mission (NNM) for programmatic intervention with a three-year budget of Rs.9046.17 crore which was commenced in 2017 in the high priority districts [34]. Despite these efforts, malnutrition among under-five children is not entirely elevated. Currently, India, on the whole, is experiencing three contrasting indicators of malnutrition; however, there is little focus on increasing rates of overweight among children. Consumption of ultra-processed foods is hypothesized to be the significant driver of overweight among children. Also, they provide little or no nutritional value and thus do not address the problems of undernutrition either. Therefore, there is a need for a more inclusive approach from the government.
One approach that can be adopted rests on monitoring the food environment. Existing literature establishes that the food environment is a significant driver of nutrition-related conditions; hence, it is imperative to pivot policies and interventions to encourage healthy consumption and discourage consumption of unhealthy foods. Simple interventions like front-of-package warning labels are crucial to discourage the excess intake of sugars, fats, and sodium [32,35]. It is important to note that consumption of excess sugar, fats, and sodium bring multi-faceted issues fueling overweight as well as anemia. The Nutritional Advocacy in Public Interest (NAPI) recommends the use of food fact checker to access the nutritional composition and suitability of food items before consumption.
The finding implies that the greatest variation in malnutrition is explained at the household level. Hence, policies that stimulate the food industry to create or reformulate their products’ nutritional content may impact household consumption. This indicates that intervention at this level will help achieve more significant results since children consume the majority of their food in the household. Therefore, simple warning labels that enable easy identification of ‘good’ and ‘bad’ foods will help target less educated women.
Strengths and Limitations
The major strength of this study is its use of a nationally representative dataset to examine the triple burden of malnutrition among children aged 6-59 months in India. The study uses disaggregated level analysis to give a comprehensive picture. The following limitations should be taken into account while evaluating the findings of our investigation. The DHS is a cross-sectional survey, hence it can only support conclusions about association rather than causation, as contrast to a longitudinal study. Second, only DHS-related variables were included in the analysis.
5. Conclusions
This study shows that the triple burden of malnutrition affects children aged 6-59 months in India. The study also identifies susceptible areas and subgroups of the population that primarily exhibit an elevated prevalence of one or more malnutrition indicators. The presence of several forms of malnutrition necessitates a closer examination of the current programmes to begin taking overweight into account alongside stunting and anaemia. Continuous efforts are sought towards formulating strategies to achieve the Sustainable Development Goal of ending all forms of malnutrition by 2030.
Supplementary Materials
The following supporting information can be downloaded at the website of this
paper posted on Preprints.org.
Author Contributions
SKS- Conceptualization, Writing-Review & Editing AC- Formal Analysis, Methodology, Writing-Original, Draft Preparation, Writing-Review & Editing SKS- Formal Analysis, Methodology, Writing-Original, Draft Preparation, Writing-Review & Editing PP- Formal Analysis, Methodology, Draft Preparation, Writing-Review & Editing SP- Writing-Review & Editing LKD- Writing-Review & Editing LTS- Writing-Review and Editing.
Funding
This research was funded by Bill & Melinda Gates Foundation with the provision of partial APC coverage.
Institutional Review Board Statement
This was a secondary study hence; no separate ethical clearance was required by the authors.
Informed Consent Statement
Not applicable.
Data Availability Statement
All data used for the study are publicly available on the website of the International Institute for Population Sciences Mumbai. IIPS was the nodal agency for NFHS-4 and NFHS-5; therefore, the IIPS data centre has also made use of the public's availability of data.
Acknowledgments
Authors are thankful to all the principal investigators of the National Family and Health Survey for their relentless efforts in producing such vital information for community-based estimates.
Conflicts of Interest
The authors declare no conflict of interest.
References
- Isanaka S, Barnhart DA, McDonald CM, et al. Cost-effectiveness of community-based screening and treatment of moderate acute malnutrition in Mali. BMJ Glob Health 2019, 4, 1–10. [CrossRef]
- Davis JN, Engle-stone R. The Double Burden of Malnutrition : A Systematic Review of Operational Definitions. 1–14.
- Ranjani H, Mehreen TS, Pradeepa R, et al. Epidemiology of childhood overweight & obesity in India : A systematic review. 2016, 160–174. [CrossRef]
- Pelletier DL, Frongillo EA. Changes in child survival are strongly associated with changes in malnutrition in developing countries. Journal of Nutrition 2003, 133, 107–119. [CrossRef]
- Blankenship JL, Rudert C, Aguayo VM. Triple trouble: Understanding the burden of child undernutrition, micronutrient deficiencies, and overweight in East Asia and the Pacific. Matern Child Nutr 2020, 16, 1–7. [CrossRef]
- Global Nutrition Report. Global Nutrition Report. Available online: https://www.segeplan.gob.gt/2.0/index.php?option=com_content&view=article&id=472&Itemid=472 (2020).
- Global Nutrition Report. Global Nutrition Report. 2020.
- de Onis M, Blössner M. The World Health Organization Global Database on Child Growth and Malnutrition: Methodology and applications. Int J Epidemiol 2003, 32, 518–526. [CrossRef]
- Biesalski HK. The 1,000-day window and cognitive development. World Rev Nutr Diet 2016, 115, 1–15. [CrossRef]
- Mkhize M, Sibanda M. A review of selected studies on the factors associated with the nutrition status of children under the age of five years in South Africa. Int J Environ Res Public Health 2020, 17, 1–26. [CrossRef]
- Akombi BJ, Agho KE, Merom D, et al. Child malnutrition in sub-Saharan Africa : A meta-analysis of demographic and health surveys ( 2006-2016 ). 2017, 1–11.
- Gödecke T, Stein AJ, Qaim M. The global burden of chronic and hidden hunger: Trends and determinants. Glob Food Sec 2018, 17, 21–29. [CrossRef]
- Miglioli TC, Fonseca VM, Gomes Junior SC, et al. Factors associated with the nutritional status of children less than 5 years of age. Rev Saude Publica; 49. Epub ahead of print 2015. [CrossRef]
- Mittal A, Singh J, Ahluwalia SK. Effect of maternal factors on nutritional status of 1-5-year-old children in urban slum population. Indian Journal of Community Medicine 2007, 32, 264. [CrossRef]
- Dey I, Chaudhuri RN. Gender inequality in nutritional status among under five children in a village in Hooghly district, West Bengal. Indian J Public Health 2008, 52, 218–220.
- Jayant D D, Purushottam A G, Deepak B P, et al. Socio-cultural practices in relation to breastfeeding, weaning and child rearing among Indian mothers and assessment of nutritional status of children under five in rural India. Australasian Medical Journal 2010, 3, 618–624.
- Nguyen PH, Scott S, Headey D, et al. The double burden of malnutrition in India: Trends and inequalities (2006-2016). PLoS One 2021, 16, 1–14. [CrossRef]
- Pomati M, Mendoza-Quispe D, Anza-Ramirez C, et al. Trends and patterns of the double burden of malnutrition (DBM) in Peru: a pooled analysis of 129,159 mother–child dyads. Int J Obes 2021, 45, 609–618. [CrossRef]
- Doak CM, Adair LS, Bentley M, et al. The dual burden household and the nutrition transition paradox. Int J Obes 2005, 29, 129–136. [CrossRef]
- Popkin BM, Corvalan C, Grummer-Strawn LM. Dynamics of the double burden of malnutrition and the changing nutrition reality. Lancet 2020, 395, 65–74. [CrossRef]
- Longitudinal Ageing Study in India (LASI) INDIA REPORT NATIONAL PROGRAMME FOR HEALTH CARE OF ELDERLY & INTERNATIONAL INSTITUTE FOR POPULATION SCIENCES MINISTRY OF HEALTH & FAMILY WELFARE GOVERNMENT OF INDIA.
- Alderman H, Headey DD. How Important is Parental Education for Child Nutrition? World Dev 2017, 94, 448–464.
- Khan J, Mohanty SK. Spatial heterogeneity and correlates of child malnutrition in districts of India. BMC Public Health 2018, 18, 1–13. [CrossRef]
- Puri P, Khan J, Shil A, et al. A cross-sectional study on selected child health outcomes in India : Quantifying the spatial variations and identification of the parental risk factors. Sci Rep 2020, 1–15. [CrossRef]
- Dhingra S, Pingali PL. Effects of short birth spacing on birth-order differences in child stunting: Evidence from India. Proc Natl Acad Sci U S A 2021, 118, 1–8. [CrossRef]
- Rahman MS, Howlader T, Masud MS. Association of Low-Birth Weight with Malnutrition in Children under Five Years in Bangladesh : Do Mother ’ s Education , Socio- Economic Status , and Birth Interval Matter ? 2016, 23, 1–16.
- Sk R, Banerjee A, Rana MJ. Nutritional status and concomitant factors of stunting among pre-school children in Malda, India: A micro-level study using a multilevel approach. BMC Public Health 2021, 21, 1–13. [CrossRef]
- Sserwanja Q, Kamara K, Mutisya LM, et al. Rural and Urban Correlates of Stunting Among Under-Five Children in Sierra Leone: A 2019 Nationwide Cross-Sectional Survey. Nutr Metab Insights; 14. Epub ahead of print 2021. [CrossRef]
- Onyeneho NG, Ozumba BC, Subramanian S V. Determinants of Childhood Anemia in India. Sci Rep 2019, 9, 1–7. [CrossRef]
- Alderman H, Headey DD. How Important is Parental Education for Child Nutrition? World Dev 2017, 94, 448–464.
- Nguyen PH, Kachwaha S, Tran LM, et al. Maternal diets in india: Gaps, barriers, and opportunities. Nutrients 2021, 13, 1–28. [CrossRef]
- Singh SK, Taillie LS, Gupta A, et al. Front-of-Package Labels on Unhealthy Packaged Foods in India: Evidence from a Randomized Field Experiment. Nutrients 2022, 14, 1–26. [CrossRef]
- Choudhury S, Shankar B, Aleksandrowicz L, et al. Caste-Based Inequality in Fruit and Vegetable Consumption in India. Food Nutr Bull 2021, 42, 451–459. [CrossRef]
- India NP of. National Nutrition Mission [Internet]. 2018. Available from: https://www.india.gov.in/national-nutrition-mission.
- Champagne B, Arora M, ElSayed A, Løgstrup S, Naidoo P, Shilton T, et al. Front of pack Labelling- Unhealthy Chnages in the Global Food System. 2020,17.
Figure 1.
Patterns of stunting, overweight and anaemia among children under 6-59 months across 707 districts in India, National Family Health Survey (NFHS-5), 2019-21.
Figure 1.
Patterns of stunting, overweight and anaemia among children under 6-59 months across 707 districts in India, National Family Health Survey (NFHS-5), 2019-21.
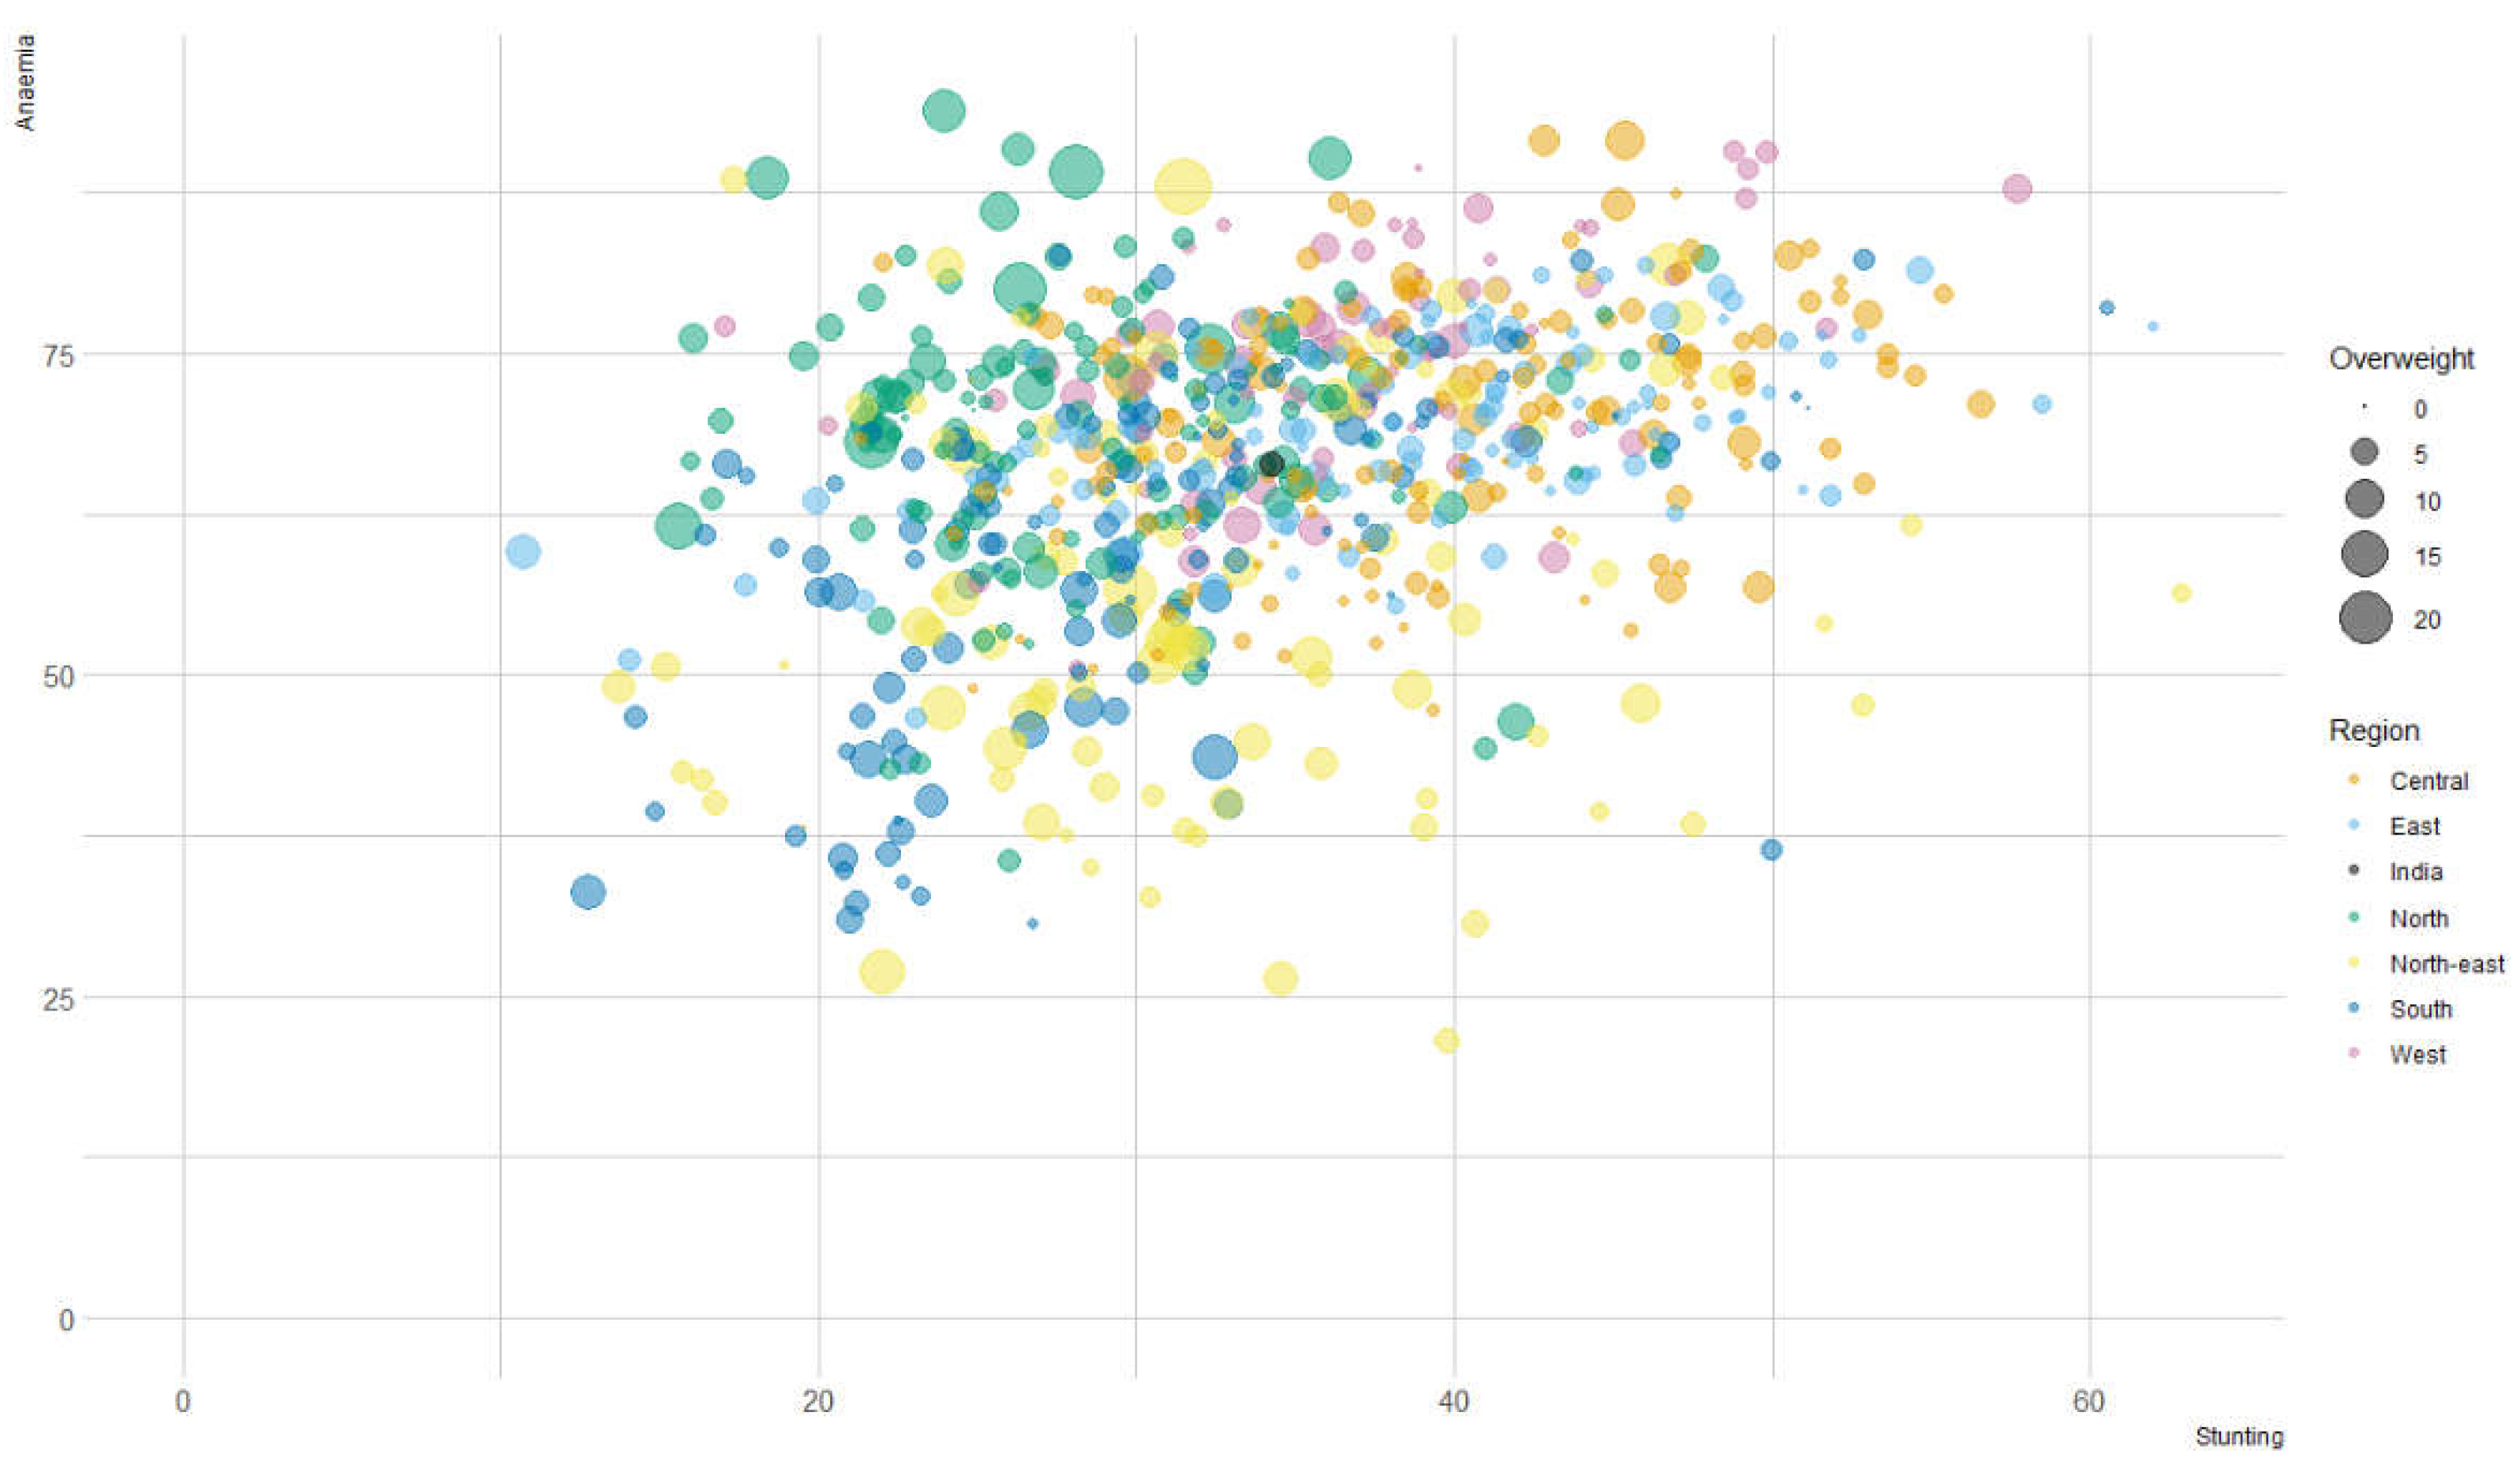
Figure 2.
District distribution of the rates of malnutrition (a) stunting (b) overweight and (c) anaemia among children under 6-59 months across 707 districts in India, National Family Health Survey (NFHS-5), 2019-21.
Figure 2.
District distribution of the rates of malnutrition (a) stunting (b) overweight and (c) anaemia among children under 6-59 months across 707 districts in India, National Family Health Survey (NFHS-5), 2019-21.
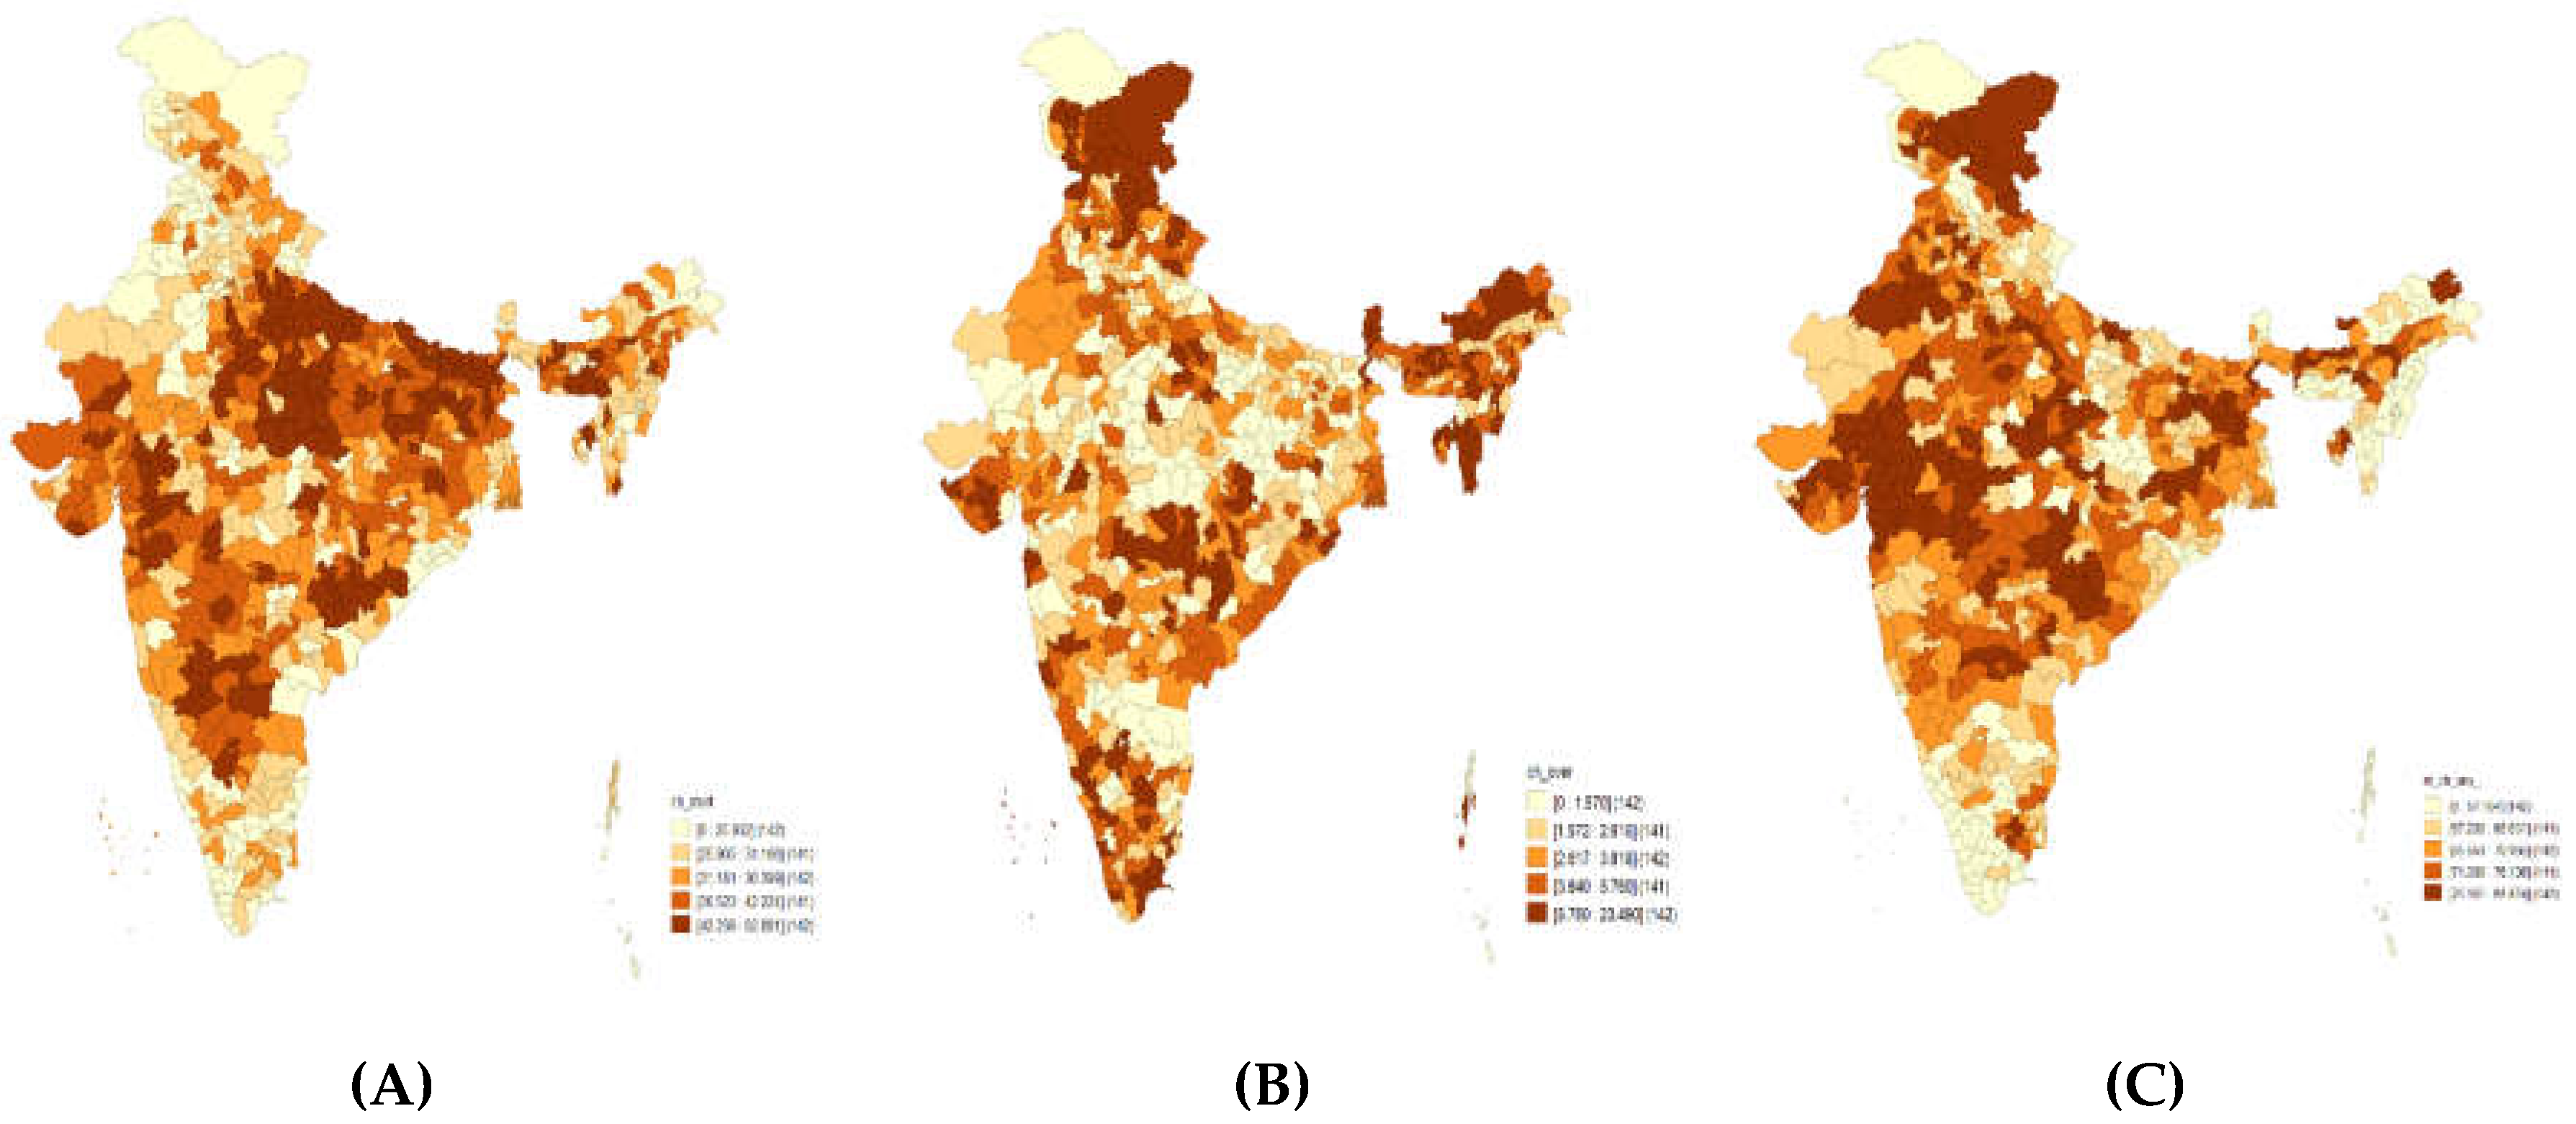
Figure 3.
Univariate LISA clustering of (a) stunting (b) overweight and (c) anaemia among children aged 6-59 months across 707 districts in India, National Family Health Survey (NFHS-5), 2019-21.
Figure 3.
Univariate LISA clustering of (a) stunting (b) overweight and (c) anaemia among children aged 6-59 months across 707 districts in India, National Family Health Survey (NFHS-5), 2019-21.
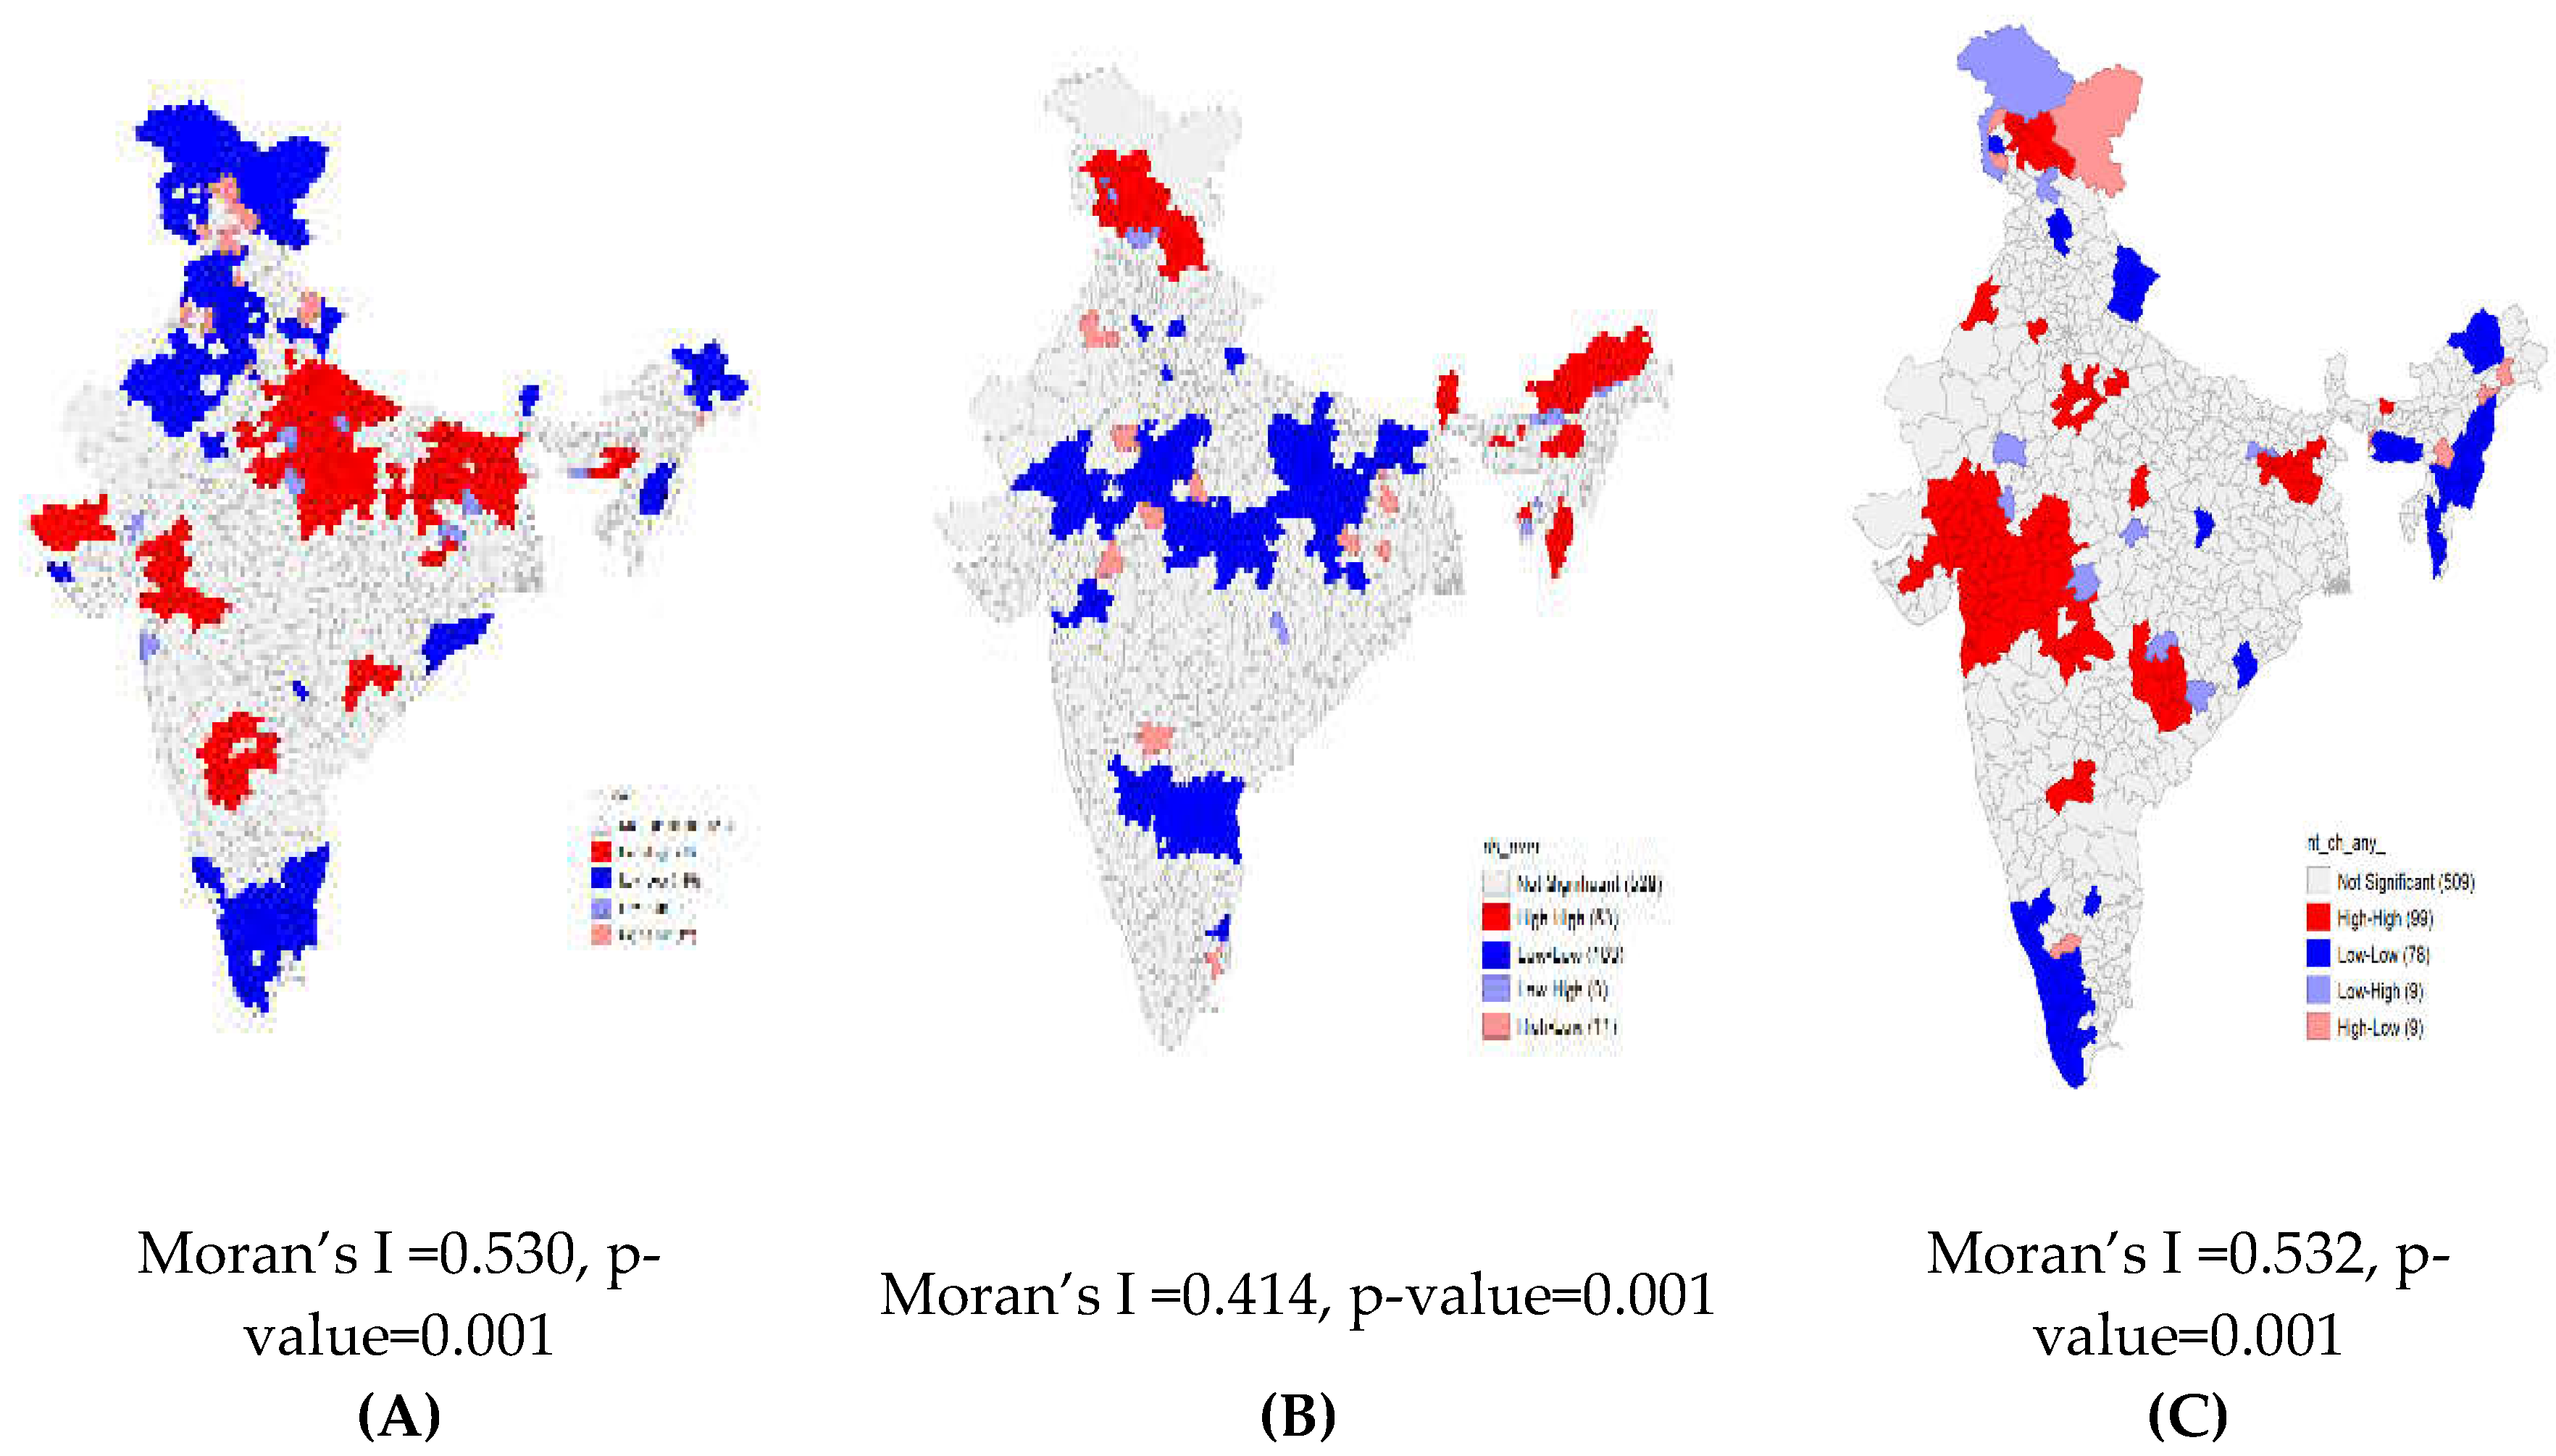

Table 1.
Descriptive Statistics of child, household and mother characteristics and prevalence of stunted, overweight, and anaemia by selected background characteristics among children aged 6-59 months in India, National Family Health Survey (NFHS-5), 2019-21.
Table 1.
Descriptive Statistics of child, household and mother characteristics and prevalence of stunted, overweight, and anaemia by selected background characteristics among children aged 6-59 months in India, National Family Health Survey (NFHS-5), 2019-21.
| Background Characteristics | Weighted Percentage (N=198,335) | Stunting | Overweight | Anaemia |
|---|---|---|---|---|
| Child Characteristics | ||||
| Age of children (months) | ||||
| 6-23® | 32.89 | 33.96 | 4.36 | 79.05 |
| 24-35 | 22.08 | 38.16 | 2.50 | 71.81 |
| 36-59 | 45.02 | 37.25 | 2.56 | 58.71 |
| Chi-square p-value<0.000 | Chi-square p-value<0.000 | Chi-square p-value<0.000 | ||
| Sex of child | 51.92 | |||
| Male® | 48.08 | 37.03 | 3.26 | 68.14 |
| Female | 35.68 | 3.02 | 68.16 | |
| Chi-square p-value<0.000 | Chi-square p-value=0.010 | Chi-square p-value=0.304 | ||
| Birth Order | ||||
| 1® | 39.07 | 31.93 | 3.65 | 66.35 |
| 2 to 3 | 33.94 | 35.52 | 3.08 | 68.06 |
| 4+ | 27.00 | 43.82 | 2.49 | 70.81 |
| Chi-square p-value<0.000 | Chi-square p-value<0.000 | Chi-square p-value<0.000 | ||
| Birth Size and Weight Composite Index | 35.98 | |||
| Low ® | 64.02 | 41.45 | 2.59 | 69.95 |
| Normal or Above Average | 33.39 | 3.47 | 67.11 | |
| Chi-square p-value<0.000 | Chi-square p-value<0.000 | Chi-square p-value<0.000 | ||
| Household Characteristics | ||||
| Place of residence | ||||
| Urban® | 27.18 | 30.63 | 4.09 | 64.93 |
| Rural | 72.82 | 38.44 | 2.80 | 69.29 |
| Chi-square p-value<0.000 | Chi-square p-value<0.000 | Chi-square p-value<0.000 | ||
| Religion | ||||
| Hindu® | 79.33 | 36.36 | 3.06 | 68.74 |
| Muslim | 16.32 | 37.88 | 3.39 | 67.74 |
| Christian | 2.08 | 32.12 | 3.5 | 53.78 |
| Others | 2.27 | 30.45 | 3.95 | 71.48 |
| Chi-square p-value<0.000 | Chi-square p-value<0.000 | Chi-square p-value<0.000 | ||
| Caste | ||||
| Scheduled Caste/Tribes ® | 33.00 | 40.83 | 2.78 | 71.59 |
| Other Backward Classes | 43.40 | 35.97 | 2.96 | 66.31 |
| Others | 23.60 | 30.80 | 3.99 | 66.61 |
| Chi-square p-value<0.000 | Chi-square p-value<0.000 | Chi-square p-value<0.000 | ||
| Wealth | ||||
| Poorest® | 24.17 | 47.87 | 2.38 | 72.66 |
| Poorer | 21.55 | 40.90 | 2.56 | 69.92 |
| Middle | 19.52 | 35.08 | 3.12 | 67.77 |
| Richer | 18.54 | 28.60 | 3.53 | 64.87 |
| Richest | 16.21 | 23.00 | 4.74 | 62.84 |
| Chi-square p-value<0.000 | Chi-square p-value<0.000 | Chi-square p-value<0.000 | ||
| Mother's Characteristics | ||||
| Mother's Age at Birth (in years) | ||||
| Below 19® | 34.32 | 40.92 | 2.68 | 72.32 |
| 20-24 | 49.35 | 35.76 | 3.13 | 66.62 |
| 25-49 | 16.33 | 28.51 | 4.19 | 63.82 |
| Chi-square p-value<0.000 | Chi-square p-value<0.000 | Chi-square p-value<0.000 | ||
| Mother's education | ||||
| No education ® | 21.23 | 47.75 | 2.57 | 72.83 |
| Primary | 12.28 | 42.88 | 2.61 | 70.5 |
| Secondary | 50.72 | 34.09 | 3.08 | 67.53 |
| Higher | 15.77 | 22.97 | 4.58 | 61.71 |
| Chi-square p-value<0.000 | Chi-square p-value<0.000 | Chi-square p-value<0.000 | ||
| Mother's Body Mass Index (BMI) | ||||
| Underweight® | 19.78 | 44.36 | 2.12 | 72.91 |
| Normal | 60.96 | 36.5 | 3.14 | 68.51 |
| Overweight or Obese | 19.26 | 27.71 | 4.17 | 62.02 |
| Chi-square p-value<0.000 | Chi-square p-value<0.000 | Chi-square p-value<0.000 | ||
| Mass Media Exposure | ||||
| No exposure | 28.39 | 45.57 | 2.52 | 72.11 |
| Any Media Exposure | 71.61 | 32.72 | 3.39 | 66.57 |
| Chi-square p-value<0.000 | Chi-square p-value<0.000 | Chi-square p-value<0.000 | ||
| Mother's Anaemia | ||||
| No Anaemia | 40.37 | 60.94 | ||
| Anaemia | 59.63 | 72.99 | ||
| Chi-square p-value<0.000 |
Table 2.
Multilevel logistic regression of stunting, overweight and anaemia among children 6-59 months in India, 2019-21.
Table 2.
Multilevel logistic regression of stunting, overweight and anaemia among children 6-59 months in India, 2019-21.
| Background Characteristics | Adjusted Odds Ratio (95% Confidence Interval) | ||||||||
|---|---|---|---|---|---|---|---|---|---|
| Childhood Stunting | Childhood Overweight | Childhood Anaemia | |||||||
| Model-1 | Model-2 | Model-3 | Model-1 | Model-2 | Model-3 | Model-1 | Model-2 | Model-3 | |
| Age of children (months) | |||||||||
| 6-23® | 1.00 | 1.00 | 1.00 | 1.00 | 1.00 | 1.00 | |||
| 24-35 | 1.27***(1.22, 1.31) | 1.27***(1.22, 1.31) | 0.45***(0.41, 0.49) | 0.44***(0.,41, 0.49) | 0.60*** (0.58, 0.62) | 0.60*** (0.58, 0.63) | |||
| 36-59 | 1.19*** (1.16, 1.23) | 1.19***(1.17, 1.23) | 0.49***(0.46, 0.53) | 0.49***(0.46, 0.53) | 0.30***(0.29, 0.31) | 0.30*** (0.29, 0.31) | |||
| Sex of child | |||||||||
| Male® | 1.00 | 1.00 | 1.00 | 1.00 | 1.00 | 1.00 | |||
| Female | 0.86*** (0.84, 0.89) | 0.86***(0.84, 0.89) | 0.92**(0.87, 0.98) | 0.92*(0.86, 0.98) | 0.98 (0.95, 1.00) | 0.98 (0.95, 1.00) | |||
| Birth Order | |||||||||
| 1® | 1.00 | 1 | 1.00 | 1.00 | 1.00 | 1.00 | |||
| 2 to 3 | 1.16*** (1.13, 1.19) | 1.16***(1.13, 1.19) | 0.85***(0.79, 0.90) | 0.84***(0.78, 0.89) | 1.06***(1.03, 1.09) | 1.06***(1.04, 1.09) | |||
| 4+ | 1.28*** (1.23, 1.34) | 1.25***(1.20, 1.31) | 0.83***(0.74, 0.93) | 0.83***(0.74, 0.93) | 1.09***(1.04, 1.14) | 1.08***(1.03, 1.13) | |||
| Birth Size/Weight | |||||||||
| Low ® | 1.00 | 1.00 | 1.00 | 1.00 | 1.00 | 1.00 | |||
| Normal or Above Average | 0.68***(0.67, 0.71) | 0.69***(0.68, 0.71) | 1.29***(1.20, 1.37) | 1.27***(1.19, 1.37) | 0.94***(0.91, 0.96) | 0.94***(0.92, 0.97) | |||
| Place of residence | |||||||||
| Urban® | 1.00 | 1.00 | 1.00 | ||||||
| Rural | 1.94**(1.90, 1.99) | 0.87***(0.79, 0.95) | 1.04*(1.01, 1.08) | ||||||
| Religion | |||||||||
| Hindu® | 1.00 | 1.00 | 1.00 | ||||||
| Muslim | 1.13***(1.07, 1.18) | 1.03 (0.92, 1.16) | 1.07**(1.02, 1.13) | ||||||
| Christian | 0.83***(0.77, 0.89) | 1.29***(1.08, 1.53) | 0.74***(0.68, 0.80) | ||||||
| Others | 0.86***(0.79, 0.94) | 1.56*** (1.31, 1.86) | 0.99 (0.92, 1.08) | ||||||
| Caste | |||||||||
| Scheduled Caste/Tribes ® | 1.00 | 1.00 | 1.00 | ||||||
| Other Backward Classes | 0.89***(0.86, 0.92) | 0.88*** (0.81, 0.96) | 0.84***(0.82, 0.87) | ||||||
| Others | 0.75***(0.71, 0.78) | 1.04 (0.94, 1.16) | 0.99 (0.92, 1.08) | ||||||
| Wealth | |||||||||
| Poorest® | 1.00 | 1.00 | 1.00 | ||||||
| Poorer | 0.82***(0.79, 0.86) | 1.07 (0.96, 1.19) | 0.90***(0.86, 0.94) | ||||||
| Middle | 0.71***(0.68, 0.74) | 1.16*(1.03, 1.30) | 0.88***(0.84, 0.92) | ||||||
| Richer | 0.55***(0.53, 0.58) | 1.18*(1.04, 1.34) | 0.83***(0.79, 0.88) | ||||||
| Richest | 0.45***(0.42, 0.48) | 1.48***(1.27, 1.72) | 0.79***(0.74, 0.84) | ||||||
| Mother's Age at Birth (in years) | |||||||||
| 15-24® | 1.00 | 1.00 | 1.00 | 1.00 | 1.00 | 1.00 | |||
| 25-34 | 0.92*** (0.89, 0.95) | 0.94***(0.94, 1.03) | 1.05 (0.97, 1.13) | 1.04 (0.97, 1.12) | 0.97 (0.95, 1.00) | 0.98 (0.95, 1.01) | |||
| 35-49 | 0.82*** (0.78, 0.85) | 0.86***(0.83, 0.89) | 1.12*(1.02, 1.23) | 1.07 (0.97, 1.18) | 0.97(0.93, 1.00) | 0.99 (0.94, 1.03) | |||
| Mother's education | |||||||||
| No education ® | 1.00 | 1.00 | 1.00 | 1.00 | 1.00 | 1.00 | |||
| Primary | 0.96* (0.91, 0.99) | 0.98(0.94, 1.03) | 0.97(0.85, 1.01) | 0.95(0.84, 1.07) | 0.94**(0.89, 0.98) | 0.95*(0.91, 0.99) | |||
| Secondary | 0.71*** (0.69, 0.75) | 0.82***(0.79, 0.86) | 0.93(0.84, 1.03) | 0.88*(0.80, 0.98) | 0.84***(0.81, 0.88) | 0.89***(0.86, 0.92) | |||
| Higher | 0.49*** (0.47, 0.52) | 0.67***(0.63, 0.71) | 1.16*(1.03, 1.32) | 1.01(0.88, 1.15) | 0.73***(0.69, 0.77) | 0.81***(0.77, 0.86) | |||
| Mother's Body Mass Index | |||||||||
| Underweight® | 1.00 | 1.00 | 1.00 | 1.00 | 1.00 | 1.00 | |||
| Normal | 0.75*** (0.73, 0.78) | 0.78***(0.75, 0.81) | 1.50***(1.37, 1.65) | 1.47*** (1.34, 1.62) | 0.91*** (0.88, 0.94) | 0.92***(0.88, 0.95) | |||
| Overweight or Obese | 0.57*** (0.54, 0.59) | 0.63*** (0.59, 0.66) | 2.02*** (1.81, 2.27) | 1.92*** (1.71, 2.15) | 0.83*** (0.79, 0.87) | 0.86***(0.82, 0.89) | |||
| Mass Media Exposure | |||||||||
| No exposure | 1.00 | 1.00 | 1.00 | 1.00 | 1.00 | 1.00 | |||
| Any Media Exposure | 0.81*** (0.78, 0.84) | 0.91*** (0.88, 0.95) | 1.06 (0.98, 1.15) | 1.00 (0.92, 1.09) | 0.91*** (0.88, 0.94) | 0.95** (0.92, 0.98) | |||
| Mother's Anaemia | |||||||||
| No Anaemia | 1.00 | 1.00 | |||||||
| Anaemia | 1.67*** (1.63, 1.72) | 1.66*** (1.62, 1.71) | |||||||
| Constant | 0.42*** (0.401-0.435) |
1.06* (0.996-1.132) |
1.31*** (1.217-1.422) |
0.01*** (0.008, 0.012) |
0.01*** (0.006, 0.102) |
0.01*** (0.008, 0.0115) |
2.25*** (2.146, 2.361) |
4.97*** (4.600, 5.370) |
5.45*** (4.987, 5.957) |
| Random intercept parameter | |||||||||
| Var(district) | 0.417 (0.401-0.434) |
0.129 (0.112-0.149) |
0.113 (0.098-0.132) |
0.642 (0.549, 0.749) |
0.607 (0.517, 0.713) |
0.555 (0.469, 0.655) |
0.37 (0.325, 0.412) |
0.34 (0.301, 0.385) |
0.32 (0.28, 0.36) |
| Var (PSU) | 0.462 (0.432-0.493) |
0.403 (0.375-0.434) |
0.397 (0.369-0.428) |
1.483 (1.337, 1.644) |
1.572 (1.415, 1.747) |
1.568 (1.411, 1.741) |
0.48 (0.452, 0.507) |
0.51 (0.482, 0.544) |
0.51 (0.48, 0.54) |
| Var (HHs) | 1.071 (0.987-1.162) |
1.003 (0.920-1.094) |
0.977 (0.895-1.068) |
1.579 (1.277, 1.955) |
1.741 (1.415, 2.142) |
1.728 (1.403, 2.128) |
0.14 (0.093, 0.210) |
0.29 (0.231, 0.370) |
0.29 (0.23, 0.37) |
| ICC (district) (%) | 4.621 | 2.67 | 2.38 | 9.17 | 8.42 | 7.77 | 8.56 | 7.67 | 7.16 |
| ICC(PSU) (%) | 13.75 | 11.04 | 10.69 | 30.37 | 30.22 | 29.72 | 19.76 | 19.22 | 18.68 |
| ICC(HHs) (%) | 34.93 | 31.83 | 31.16 | 52.96 | 54.37 | 53.92 | 23.03 | 25.82 | 25.25 |
| Model fit statistics | |||||||||
| Wald test X2 | 3820.63 | 4583.49 | 761.65 | 833.12 | 6778.54 | 6897.73 | |||
| Probability> chi-square | 0.000 | 0.000 | 0.000 | 0.000 | 0.000 | 0.000 | |||
| LR test vs. logistic regression: p-value | 0.000 | 0.000 | 0.000 | 0.000 | 0.000 | 0.000 | |||
Note. 1) ***p<0.001, **<p<0.05, *p<0.1. 2) Model 1. Null Model; Model 2. Child + Mother Level Characteristics; Model 3. Child + Mother+ Household and Community Level Characteristics.
Disclaimer/Publisher’s Note: The statements, opinions and data contained in all publications are solely those of the individual author(s) and contributor(s) and not of MDPI and/or the editor(s). MDPI and/or the editor(s) disclaim responsibility for any injury to people or property resulting from any ideas, methods, instructions or products referred to in the content. |
© 2023 by the authors. Licensee MDPI, Basel, Switzerland. This article is an open access article distributed under the terms and conditions of the Creative Commons Attribution (CC BY) license (http://creativecommons.org/licenses/by/4.0/).
Copyright: This open access article is published under a Creative Commons CC BY 4.0 license, which permit the free download, distribution, and reuse, provided that the author and preprint are cited in any reuse.


