Background
Thyroid eye disease (TED) occurs in about 25% of individuals with Graves' disease, making it a prevalent orbital condition. It is an autoimmune disorder that mainly impacts orbital tissues, particularly the extraocular muscles and connective tissue[
1]. TED is commonly linked to hyperthyroidism, particularly Graves' disease, but can also affect individuals with normal or reduced thyroid function. The development of TED involves immune system dysregulation, where the immune system targets not only the thyroid gland but also the surrounding eye tissues, leading to inflammation and fibrosis. Clinical symptoms include eye bulging, eyelid swelling, restricted eye movement, double vision, and in severe cases, vision impairment. The severity of TED can vary from mild discomfort to significant visual issues, sometimes requiring surgery. Treatment typically includes managing thyroid function, using immunosuppressants to reduce inflammation, and surgical intervention for severe cases. However, both medical and surgical treatments may not always yield satisfactory results. Numerous studies are currently investigating the pathogenesis of TED[
2,
3,
4], focusing on potential therapeutic targets, including receptor proteins, immune cells, adipose inhibition, anti-fibrosis, transcription factors and metabolism-regulating enzymes[
1]. However, the pathogenesis has not been fully elucidated.
Past TED treatments relied on immunotherapy and immunosuppression. Research on immune responses in TED has primarily centered on inflammation, oxidative stress, adipose tissue changes, and fibrosis. Connective tissue emerged as a significant autoimmune target during active TED phases, as shown by the dense presence of T lymphocytes, mast cells, and sporadic B cells among extraocular muscle fibers and orbital fat[
2,
3,
4]. Fibroblasts in the orbital tissues of patients with TED overexpressed the insulin-like growth factor receptor (IGF-1R)[
5], which stimulated autoimmune responses[
6]. Under the combined action of IL-1β, CD154, and interleukins, excessive production of prostaglandin E2 (PGE2) may lead to inflammation, fat swelling and deposition of excessive extracellular matrix components (e.g., hyaluronic acid) in TED[
7]. Mycophenolate mofetil (MMF) selectively inhibits the differentiation proliferation and activation of T and B lymphocytes and exerts immunosuppressive effects[
8]. Additionally, it reduced mRNA and protein levels of tumor necrosis factor-α, interleukin β, and vascular endothelial growth factor, lowered inflammatory exudate levels, and demonstrated anti-inflammatory properties[
9]. Teprotumumab (TAB), a human monoclonal antibody that inhibited IGF-1R and well controlled the inflammatory response of TED in active phase[
10], has become an emerging targeted therapeutic option for TED. However, the specific pathogenesis of TED remain incompletely understood.
Recent research indicates that mitochondrial energy metabolism significantly influences the development and advancement of thyroid eye disease (TED). Orbital fibroblasts in TED are crucial pathological cells that can transform into adipocytes or myofibroblasts, causing orbital tissue expansion and fibrosis. Mitochondrial dysfunction in these cells leads to overproduction of reactive oxygen species (ROS), activating pro-inflammatory and pro-fibrotic signaling pathways like NF-κB and TGF-β. These pathways worsen inflammation and tissue changes, propelling disease progression. Moreover, increased ROS from mitochondria triggers oxidative stress, harming cellular components and activating immune cells to release pro-inflammatory cytokines such as IL-6 and TNF-α, escalating inflammation. Oxidative stress also triggers hypoxia-inducible factor (HIF-1α), promoting angiogenesis and fibrosis, common in advanced TED stages. Additionally, mitochondrial dysfunction can prevent diseased cells from undergoing apoptosis, sustaining inflammation and tissue alterations. Consequently, mitochondrial function intricately influences TED's pathological processes, suggesting that targeting mitochondrial metabolism could offer new treatment avenues. Current research in various fields explores the mitochondrial energy metabolism pathway, linking abnormalities to oxidative stress caused by excessive free radicals, ROS release, and an imbalance in antioxidant capabilities[
11,
12]. In cancer research, disruptions in mitochondrial pathways and metabolic imbalances can alter gene expression, contributing to cancer initiation, progression, and immune evasion[
13]. In degenerative diseases, inhibiting the mitochondrial pyruvate carrier (MPC) has shown significant neuroprotective effects in Parkinson's disease models. Furthermore, the complement system and mitochondrial energy metabolism are linked to myopia prevention and management, offering potential therapeutic targets[
14]. There is currently a lack of literature on the investigation of mitochondrial energy metabolism-related genes (MEMRGs) in TED. Exploring these genes could be crucial for diagnosing and predicting TED outcomes, making it a valuable area for further research.
In this study, we identified MEMRGs linked to TED from databases. As there were no previous reports on their connection to TED immunity, we compared gene enrichment in biological processes between TED and normal individuals. We investigated the relationship between MEMRG expression and TED immunity, sought bioinformatic approaches for potential therapeutic targets in TED, and assessed their therapeutic and prognostic relevance in this condition.
1. Materials and Methods
1.1. Dataset and Data Processing
The TED datasets GSE58331[
15,
16,
17,
18,
19,
20] (35 TED samples and 29 Control samples), GSE105149[
21] (4 TED samples and 7 Control samples) were obtained by downloading them from the GEO database[
22] (
https://www.ncbi.nlm.nih.gov/geo/), separately. The GSE105149 dataset analyzes gene expression in lacrimal gland biospecimens and surgical waste tissues, while GSE58331 focuses on gene expression in orbital biopsies. Both datasets utilized the GPL570 microarray platform, ensuring technical consistency. MEMRGs were sourced from the GeneCards database[
23] (
https://www.genecards.org/). The set of MEMRGs from the published literature[
24] was obtained from the PubMed website (
https://pubmed.ncbi.nlm.nih.gov/), and after merging and de-duplication, a total of 386 MEMRGs. Datasets GSE58331 and GSE105149 were de-batched using R package sva[
25], which were normalised by R package limma[
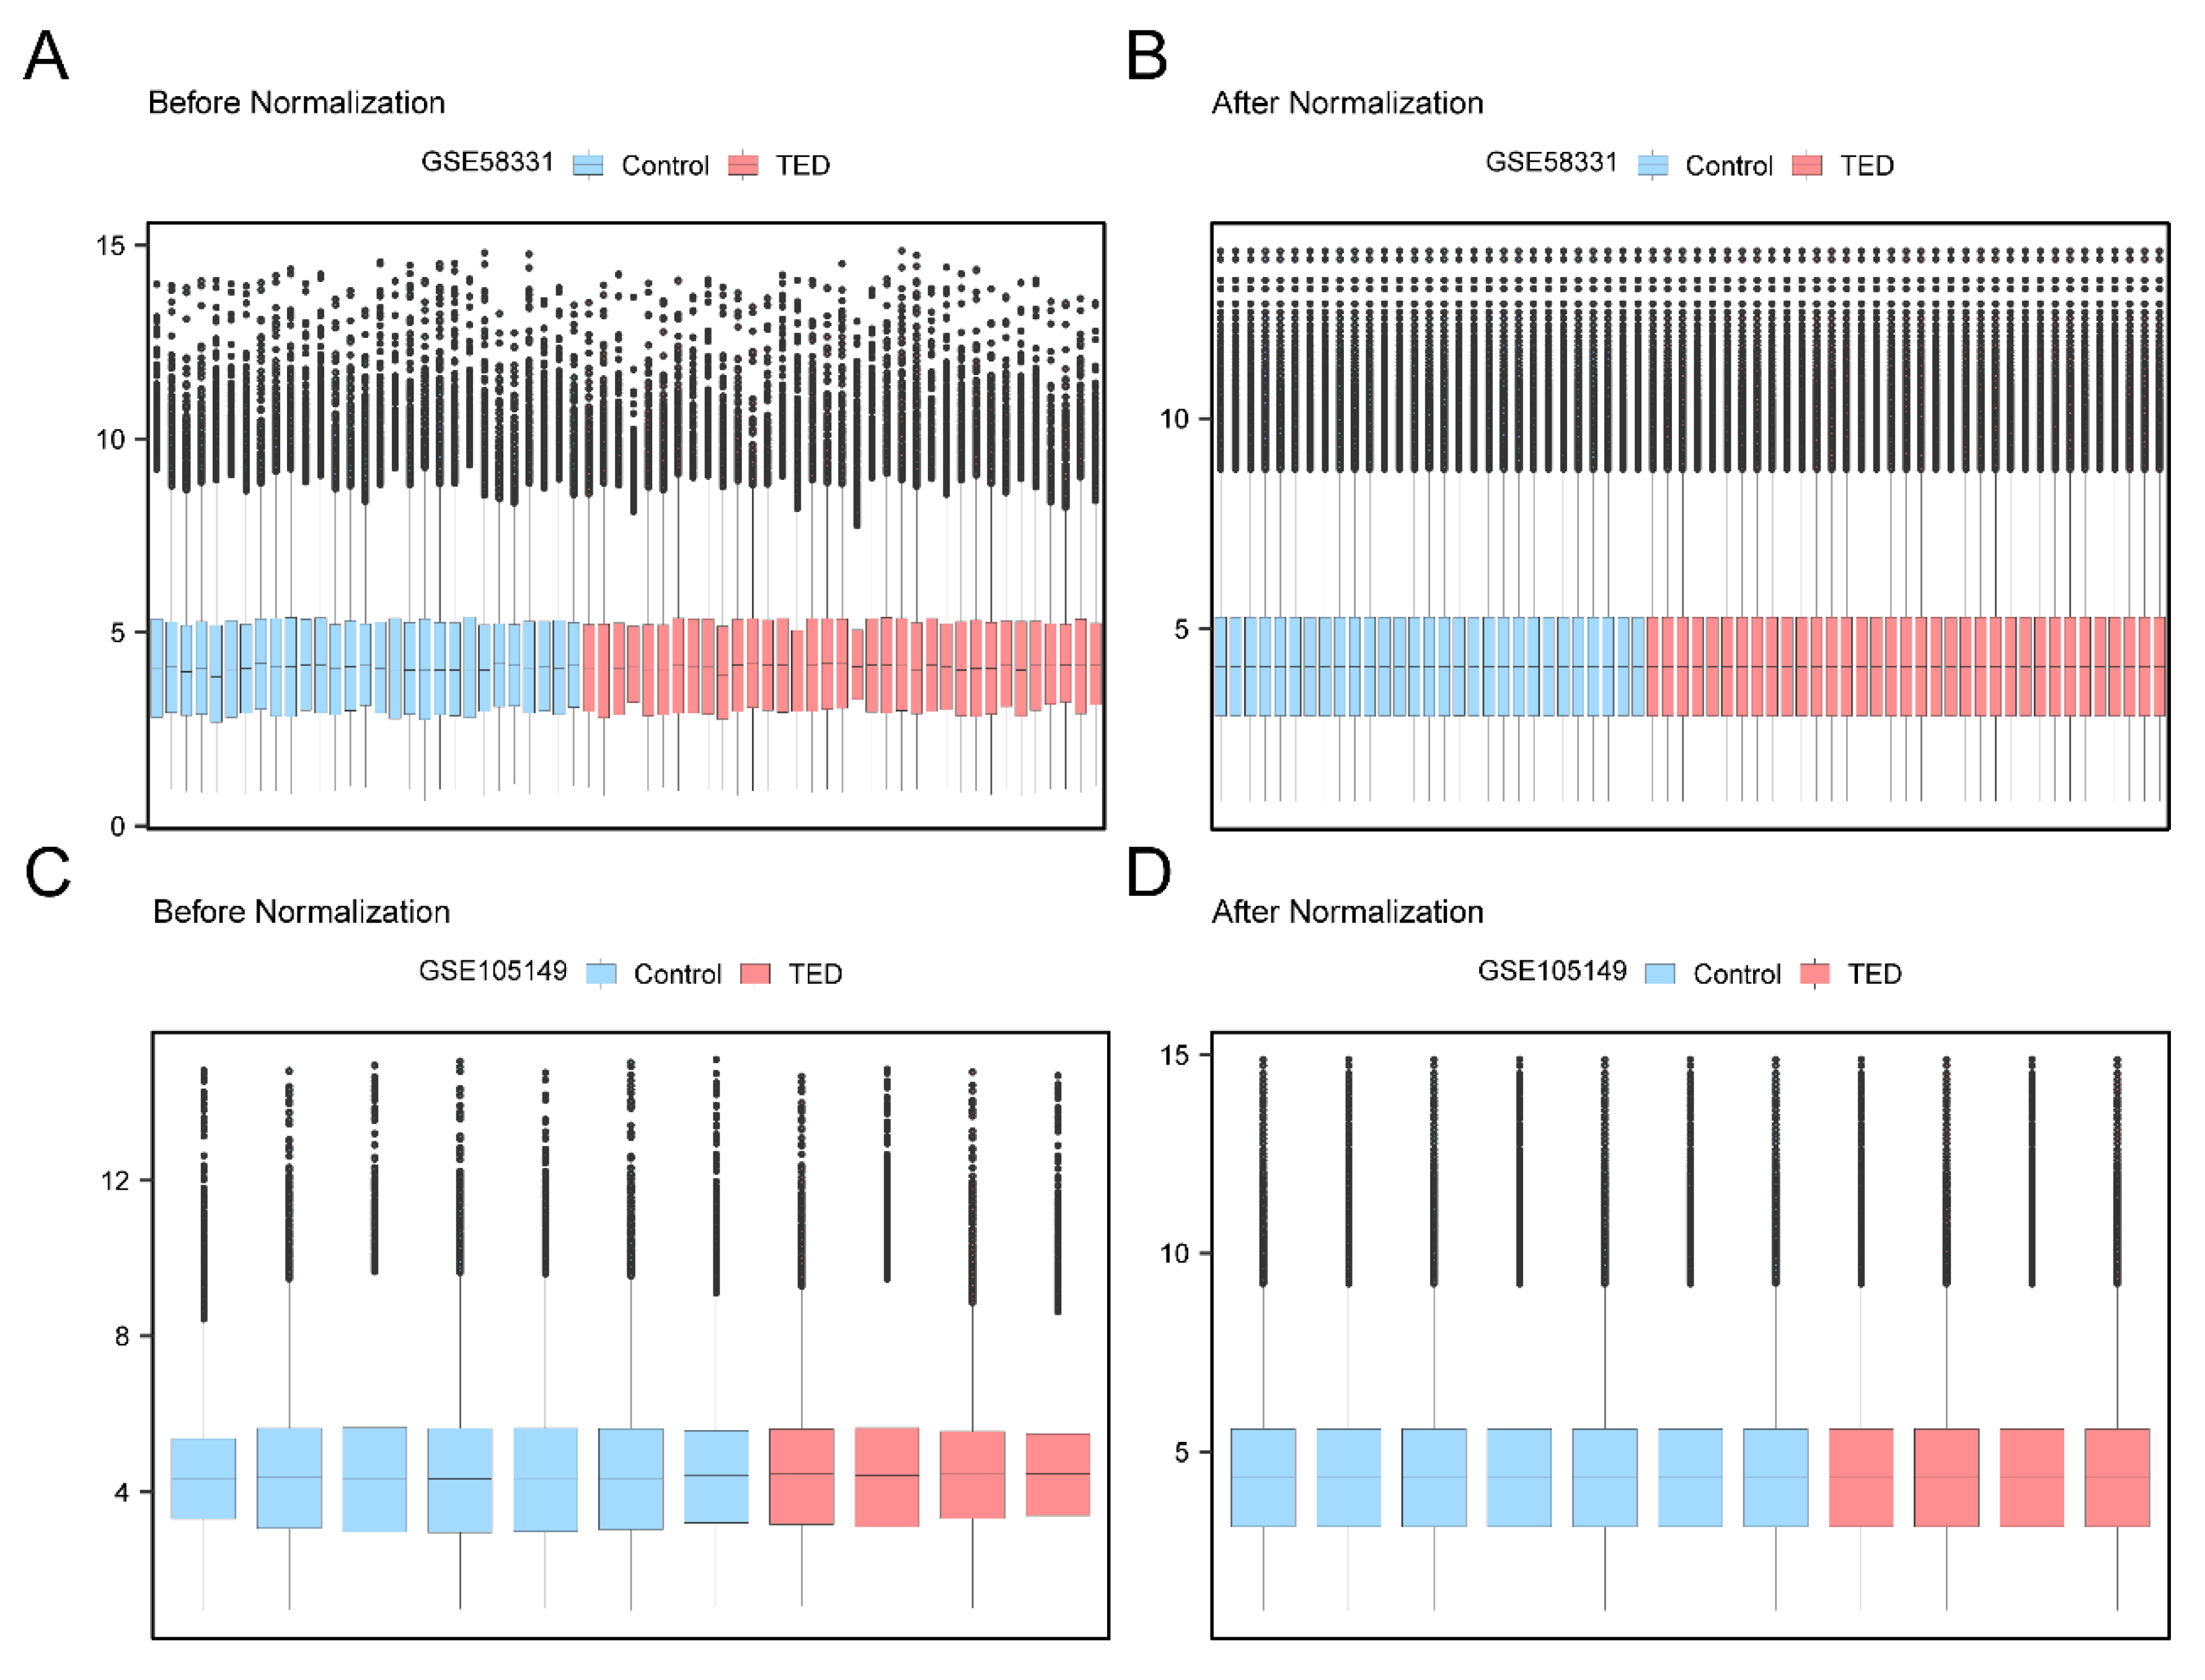
26], annotated probes were standardized and normalized. Distribution boxplots indicate successful removal of batch effects, reducing the impact of sample type variations on results. All chosen samples from GSE58331 were part of the test set, while those from GSE105149 were the validation set for further analyses.
1.2. Analysis of Differentially Expressed Genes
Genes in the TED and Control groups were differentially analyzed using the R package limma. A threshold of |logFC| > 0.30 and p-value < 0.05 was applied for identifying Differentially Expressed Genes (DEGs). Among these, genes with logFC > 0.30 and p-value < 0.05 were classified as Up-regulated Genes, while genes with logFC < -0.30 and p-value < 0.05 were categorized as Down-regulated Genes. Mitochondrial Energy Metabolism-Related Differentially Expressed Genes (MEMRDEGs) were identified by intersecting genes from all TED samples in the DEGs dataset with MEMRGs.The cutoff (|Log2FC| > 0.3) chosen for the DEG analysis was carefully considered. We aimed to capture genes potentially linked to TED's pathological processes, ensuring inclusion of candidates with biological relevance. Additionally, similar or more permissive Log2FC thresholds have been used in previous studies (e.g., PMID: 39021997), supporting our decision.
1.3. Functional Enrichment Analysis of Differentially Expressed MMRGs
For Gene Ontology (GO)[
27] and KEGG[
28] enrichment analysis, the “clusterProfiler”[
29]software package was used to explore the enrichment degree of biological process (BP), cellular component (CC), molecular function (MF) , and biological pathway (KEGG) of the differentially expressed MMRGs. P value < 0.05 and FDR value (q value) < 0.25 was considered statistically significant. Data visualization was performed.
1.4. GSEA
Gene Set Enrichment Analysis (GSEA)[
30]was conducted on all genes in dataset GSE58331 using the "clusterProfiler" package in R, sorted based on logFC values. TED samples from GSE58331 were then divided into high-risk and low-risk groups using the median RiskScore value. Genes meeting the criteria of |logFC| > 0.30 and p-value < 0.05 in these groups were selected for variance analysis with the limma package. Subsequently, GSEA was repeated on all genes within the different risk groups using the "clusterProfiler" package..
The analysis utilized the seed 2020, 1000 permutations, a minimum of 10 genes per set, and a maximum of 500 genes per set. The gene set c2.cp.all.v2022.1.Hs.symbols.gmt [All Canonical Pathways] (3050 sets) was sourced from the Molecular Signatures Database (MSigDB)[
31] for GSEA, and the gene set GSEA screening criteria were adj. p < 0.05 and FDR value (q value) < 0.25, and the p value correction method was Benjamini-Hochberg (BH).
1.5. Screening of Key Genes
To identify Key Genes and build diagnostic models, we initially conducted one-way logistic regression on MEMRDEGs, considering a significance threshold of p < 0.05 for screening. The selected MEMRDEGs were then included in the subsequent random forest analysis.Model construction was performed using the Random Forest package[
32] with the expression of the MEMRDEGs obtained from the screening of the one-way logistic regression in the expression matrix of the dataset GSE58331 with the parameters set.seed (234), ntree = 300. MeanDecreaseGini is the average decrease in the Gini coefficient. the Gini coefficient represents the impurity of a node, the larger the Gini coefficient the less pure it is and the more impurities it contains. We then trade-off the number of variables by performing five ten-fold cross-validations in conjunction with the cross-validation curves. We used the training set itself for cross-validation, retaining a relatively small number of variables with relatively small errors, and then selected our significant variables for subsequent analyses based on MeanDecreaseGini. Least Absolute Shrinkage and Selection Operator(LASSO)[
33] Regression analyses were conducted following random forest screening using the "glmnet" R package, with set.seed(300) to set the seed and a run period of 200 to prevent overfitting. The outcomes of the LASSO regression analyses were visualized using diagnostic model plots and variable trajectory plots. MEMRDEGs incorporated in the ultimate LASSO regression model were identified as the Key Genes for further analyses.
We selected LASSO regression for its robust feature selection, effectively managing high-dimensional data while minimizing overfitting. Its penalty term inherently eliminates less relevant variables, making it ideal for identifying key genes. Compared to elastic net, LASSO offers greater simplicity and interpretability, which is crucial when prioritizing model clarity.
1.6. Key Genes Constructs Diagnostic Logistic Regression Models
We developed a multifactorial logistic model to derive coefficients for each Key Gene. These coefficients were multiplied by their respective expressions to calculate the Risk Score for each sample. Based on the median Risk Score, the dataset's disease groups were categorized into high and low-risk groups (High, Low). The Risk Score was computed using the following formula:
Nomogram[
35] is a graphical representation of the functional relationships among multiple independent variables in a two-dimensional rectangular coordinate system, typically showing disjointed line segments. The results of the multifactorial logistic model were visualized using the "rms" R package. Plotting the columns illustrated the interconnections among the Key Genes featured in the multifactorial logistic model.
Calibration Curve to evaluate the accuracy and discriminatory power of the model based on the results of the multifactorial logistic regression analysis through Calibration analysis. Decision Curve Analysis (DCA) was plotted through Decision Curve Analysis (DCA)[
36] using the R package “ggDCA” based on Key Genes from the dataset GSE58331.
Finally, the R package pRO was used to plot the ROC curves of the Logistic Risk Score (Risk Score) in datasets GSE58331 and GSE105149 and to calculate the Area Under the Curve (AUC) to assess the expression of Logistic Risk Score (Risk Score) volume on the diagnostic effect of TED occurrence. The functional correlation of Key Genes was calculated by R package “GOSemSim”[
37], and the functional correlation between Key Genes was analysed for Friends. Finally, the chromosomal localisation map was drawn to show the position of Key Genes on chromosomes by R package “RCircos”[
38].
1.7. Validation of Differential Expression of Key Genes
To further explore the expression differences of Key Genes in the datasets GSE58331 and GSE105149 in the TED group and on the Control group, group comparison plots were drawn based on the expression of Key Genes. Finally, the R package “pROC” was used to plot the ROC curve of Key Genes and calculate the Area Under the Curve (AUC) to assess the diagnostic effect of Key Genes expression on the occurrence of TED The AUC of the ROC curve is generally between 0.5 and 1. The closer the AUC is to 1, the better the diagnostic effect. The AUC of 0.5 to 0.7 has low accuracy, the AUC of 0.7 to 0.9 has some accuracy, and the AUC of 0.9 or more has high accuracy.
1.8. Key Genes' ssGSEA Algorithm for Immune Infiltration Analysis
Single-Sample Gene-Set Enrichment Analysis (ssGSEA)[
39] quantifies the relative abundance of each immune cell infiltration. First, each infiltrating immune cell type is labeled, such as Activated CD8 T cell, Activated dendritic cell, Gamma delta T cell, Natural killer cell, Regulatory T cell, and many other human immune cell subtypes. Next, the enrichment scores calculated using ssGSEA analysis were used to represent the relative abundance of each immune cell infiltration in each sample to derive the immune cell infiltration matrix. Subsequently, immune cells with significant differences in the two groups were screened for subsequent analysis, the correlation between immune cells was calculated based on the Spearman algorithm, and the correlation heatmap was drawn using the R package pheatmap to demonstrate the results of the correlation analysis of the immune cells themselves. The correlation between Key Genes and immune cells was calculated based on the Spearman algorithm, and the result of p value < 0.05 was retained, and the correlation bubble map was plotted using the R package “ggplot2” to show the results of the correlation analysis between Key Genes and immune cells.
1.9. mRNA-miRNA, mRNA-TF, mRNA-RBP Interaction Network Analysis of Key Genes
ENCORI Database[
40] is the version 3.0 of starBase database. miRNA-ncRNA, miRNA-mRNA, ncRNA-RNA, RNA-RNA, RBP-ncRNA and RBP-mRNA interactions in ENCORI database are based on the data mining of CLIP-seq and degradome sequencing (for plants), and we utilized ENCORI database to predict miRNAs interacting with Key Genes and screen mRNA-miRNA interaction pairs using pancancerNum > 7 as a screening criterion, and visualize the mRNA-miRNA interaction network using Cytoscape software.
CHIPBase database (version 3.0)[
41] (
https://rna.sysu.edu.cn/chipbase/) identifies thousands of binding motif matrices and their binding sites from ChIP-seq data of DNA-binding proteins and predicts transcriptional regulatory relationships between millions of transcription factors (TFs) and genes. We searched for TFs binding to Key Genes through the CHIPBase database (version 3.0) and used the sum of Number of samples found (upstream) and Number of samples found (downstream) greater than 10 as a filtering criterion for mRNA-TF interaction pairs. The mRNA-TF interaction pairs were screened and the mRNA-TF interaction network was visualized using Cytoscape software.
RNA-Binding Protein (RBP)[
42] plays a key role in gene regulation, and is critical for the regulation of life activities such as RNA synthesis, selective splicing, modification, translocation and translation. Based on the StarBase v3.0 database (
https://starbase.sysu.edu.cn/), the target RBPs of Key Genes were predicted and the mRNA-RBP interaction pairs were screened using clusterNum > 12 as the screening criterion. mRNA-RBP interaction networks were visualized by Cytoscape software ( mRNA-RBP Interaction Network).
1.10. Statistical Analysis
All data processing and analyses in this study were conducted using R software (Version 4.2.2). For comparing two groups of continuous variables, statistical significance of normally distributed variables was assessed using the independent Student's T-Test, while non-normally distributed variables were analyzed with the Mann-Whitney U-Test (Wilcoxon Rank Sum Test). Comparisons involving three or more groups utilized the Kruskal-Wallis test. Spearman correlation analysis was employed to calculate correlation coefficients between different molecules. Unless specified otherwise, all p values were two-sided, with p < 0.05 considered statistically significant.
3. Discussion
The prevalence of Thyroid Eye Disease (TED) among Graves' disease patients is approximately 25%, making it the most prevalent orbital condition. Existing treatments such as medications, surgery, and radiation have not consistently yielded satisfactory outcomes and can potentially result in complications and adverse effects. While numerous studies have explored the pathogenesis of TED and potential treatment targets, the precise mechanisms remain elusive. Contrasting gene expression profiles between TED and other orbital inflammatory conditions have shown weaker associations with inflammatory markers in TED, indicating a relatively subdued inflammatory response in TED[
19], This implies that targeting metabolic or alternative pathways could be more effective in treating Thyroid Eye Disease (TED). Dysregulation in mitochondrial energy metabolism pathways is linked to oxidative stress. Inflammation is implicated in a range of degenerative conditions, acute illnesses, and the aging process. Mitochondria are key players in amplifying inflammatory signals, leading to heightened mitochondrial oxidative stress and perpetuating a detrimental cycle of inflammation[
43]. There is currently no definitive target or treatment mechanism in the study of mitochondrial energy metabolism-related genes in TED, which holds potential and guiding significance for the diagnosis and treatment of TED.
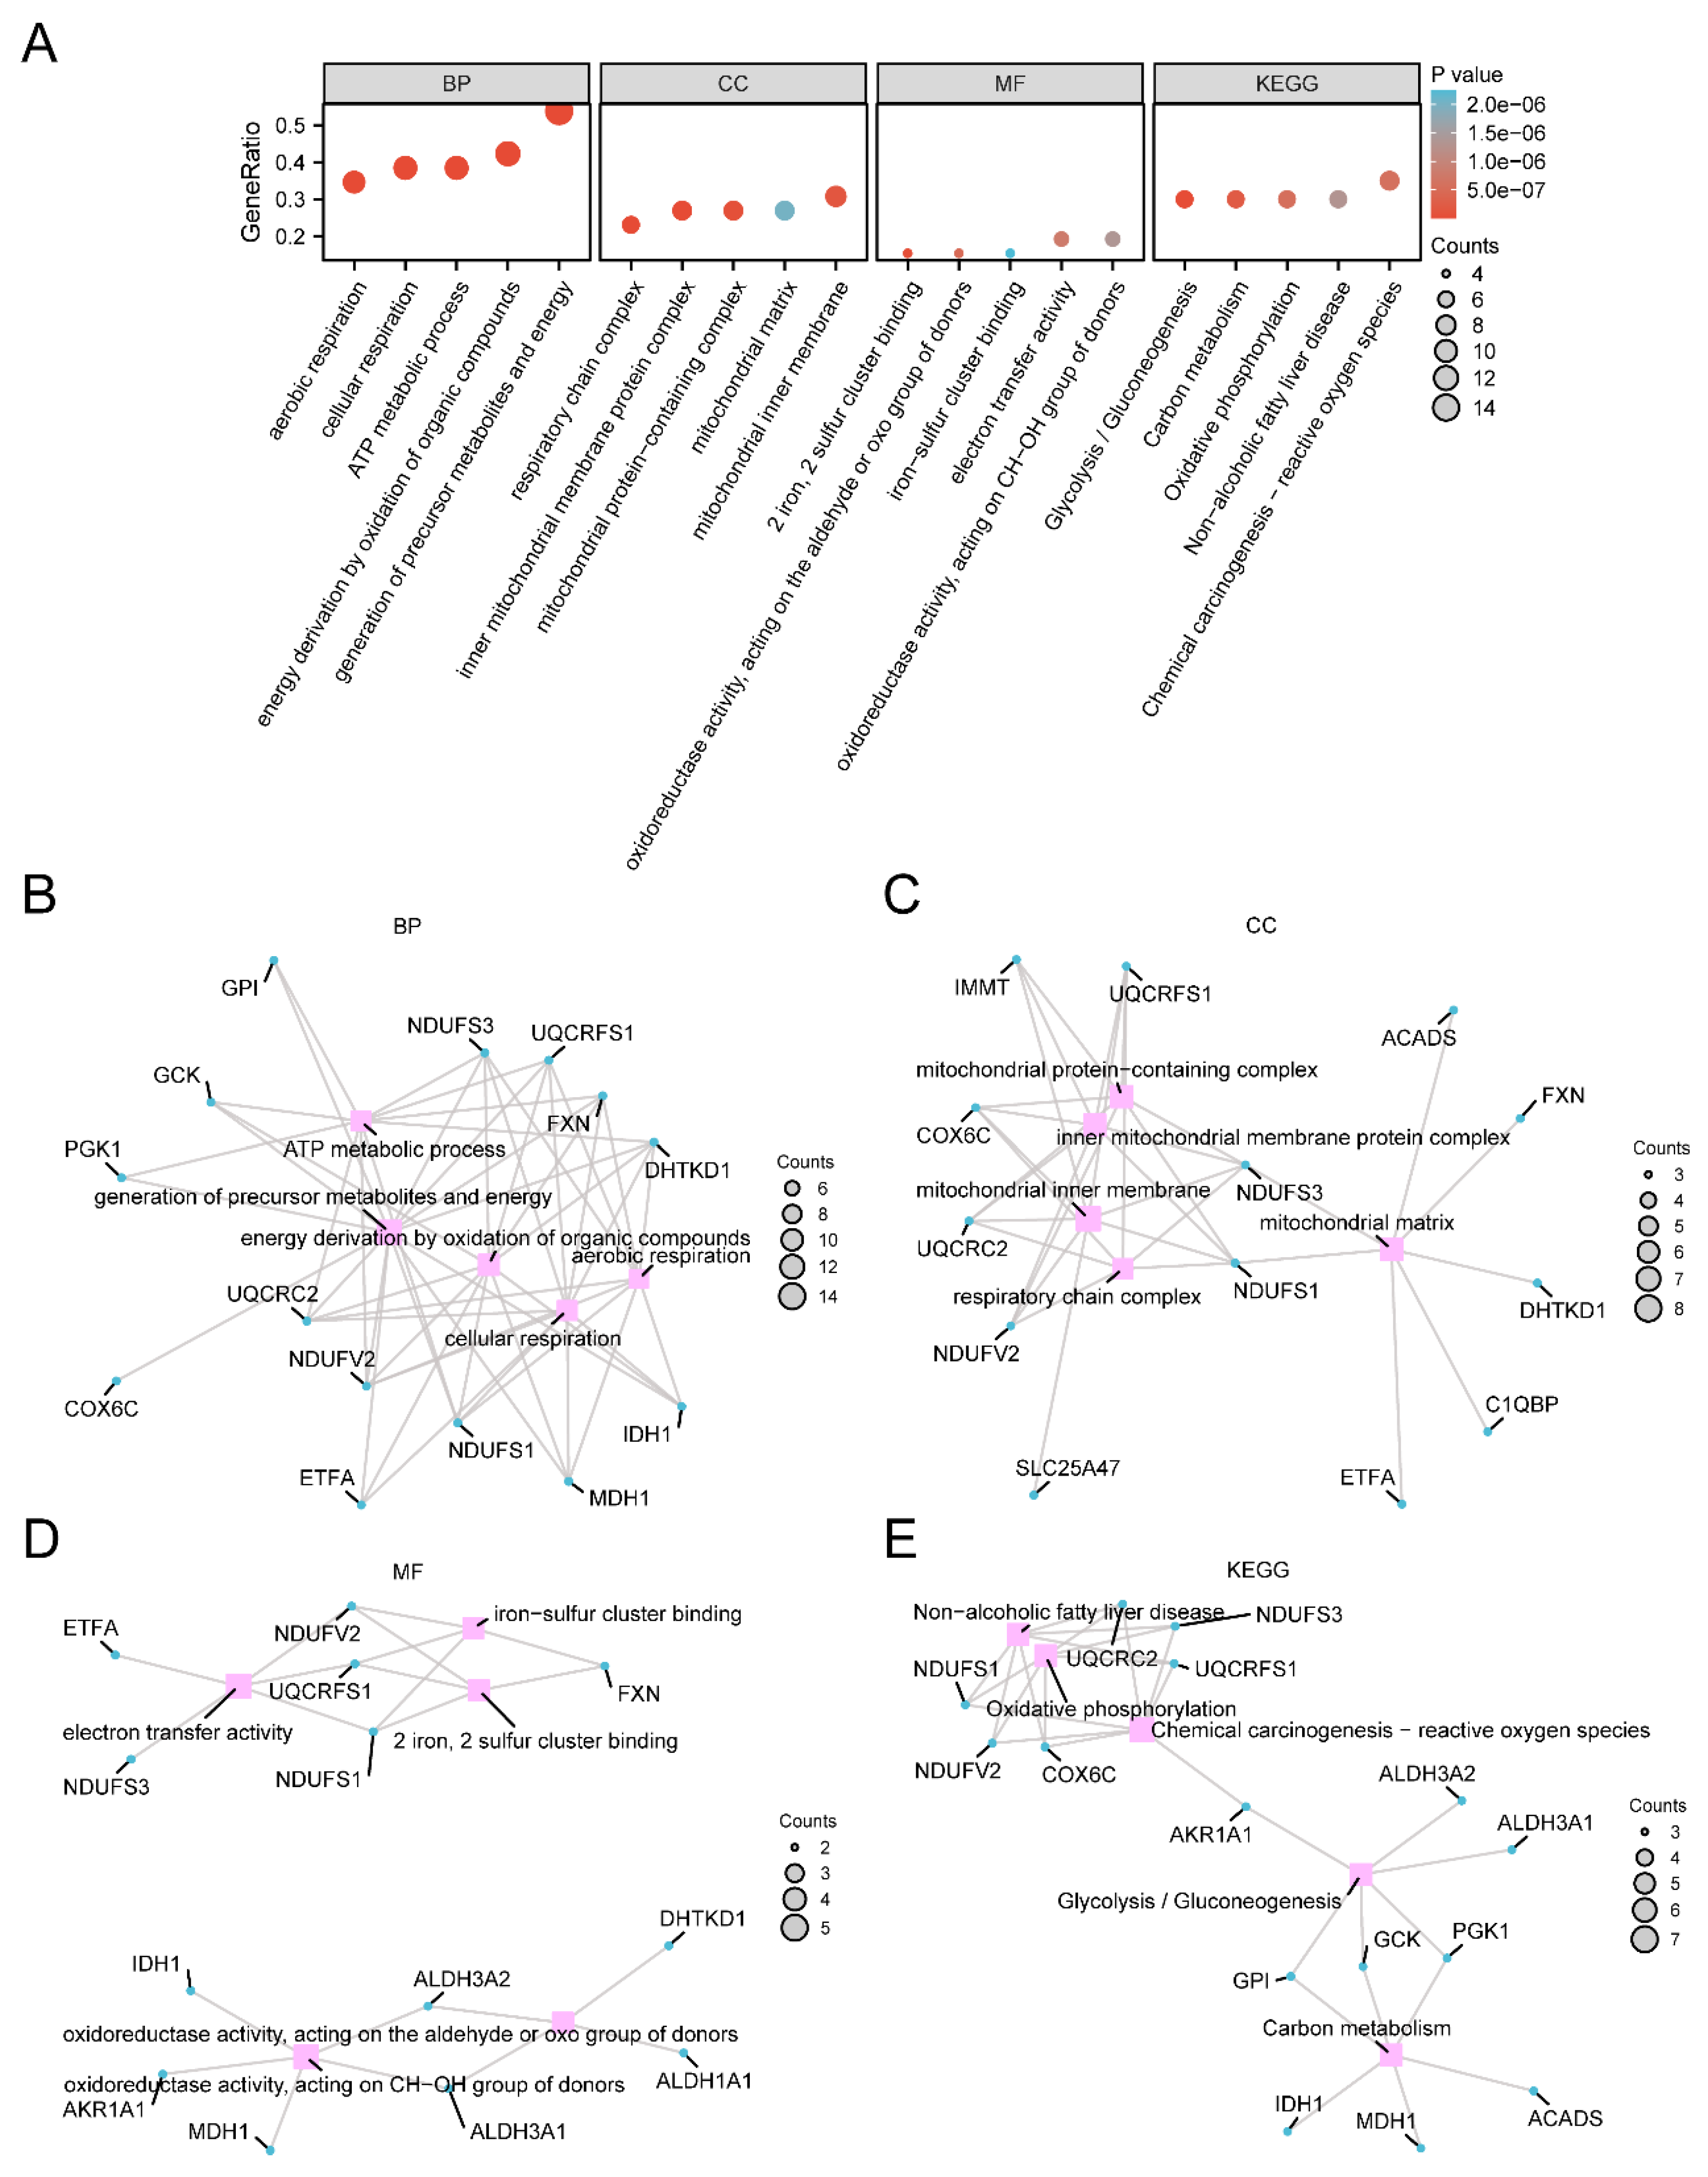
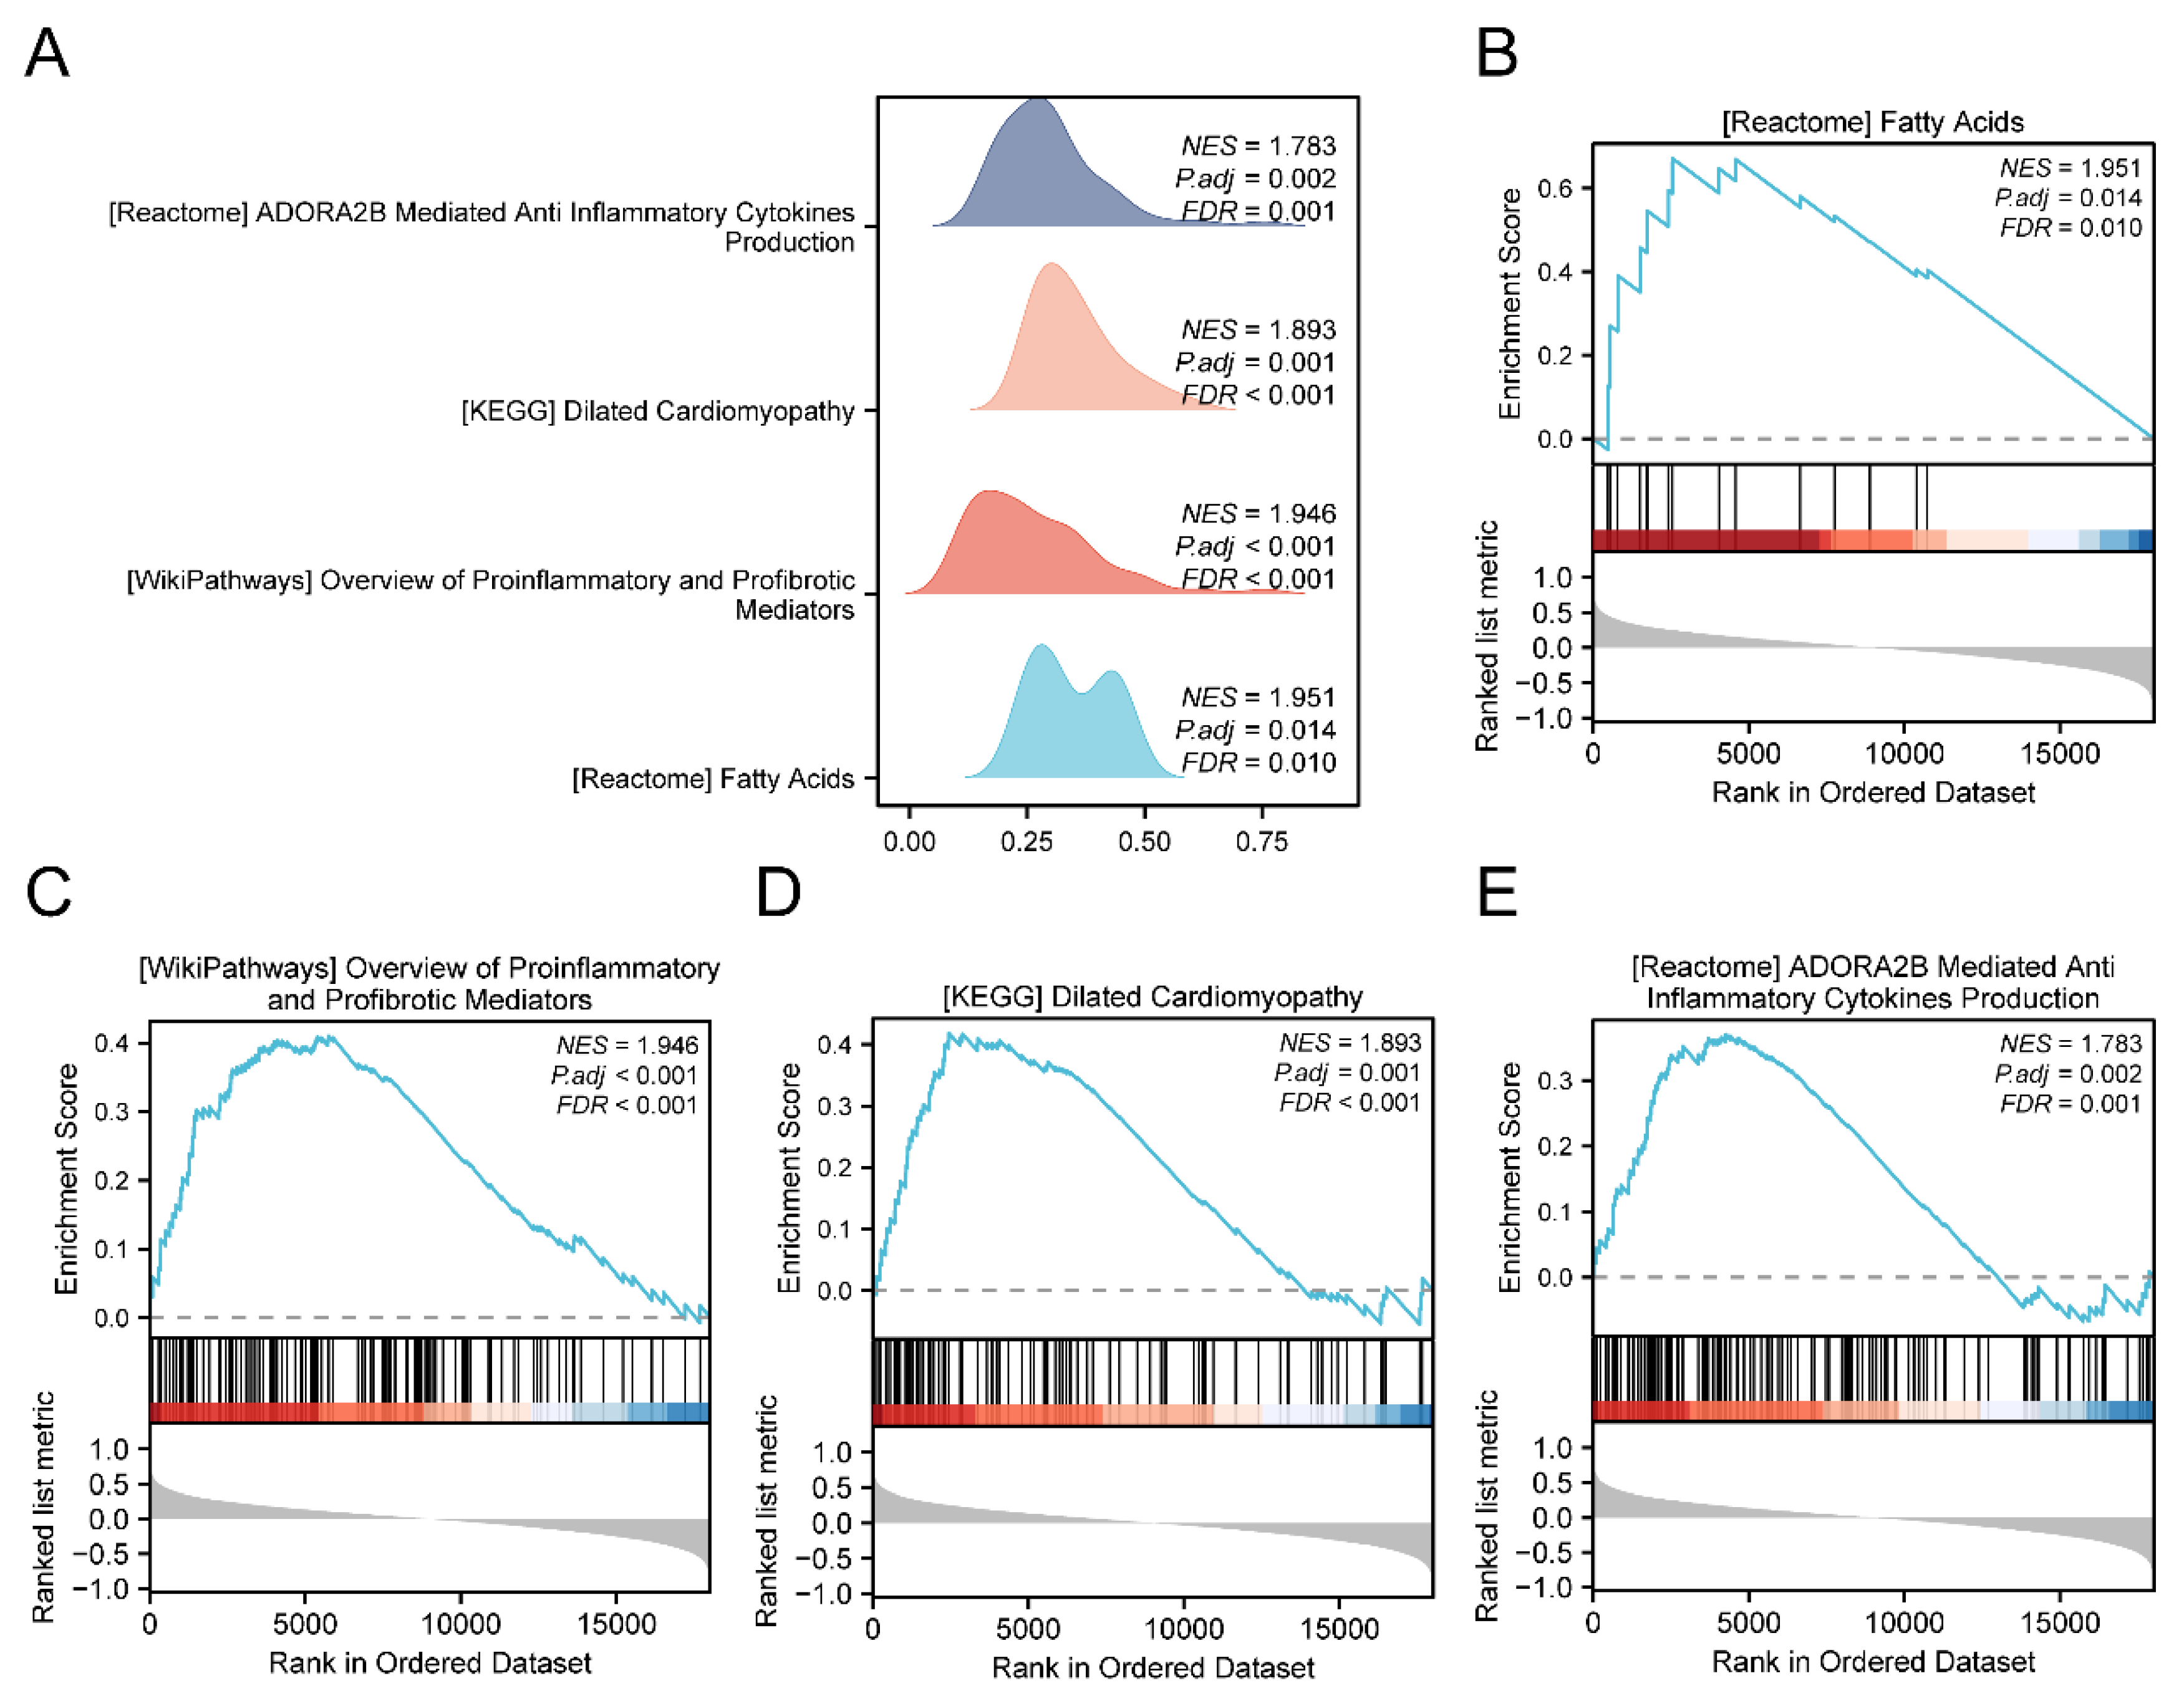
Following GO and KEGG analyses, 26 differentially expressed mitochondria-related genes (MEMRDEGs) were identified as enriched in various biological processes, cellular components, molecular functions, and pathways in Thyroid Eye Disease (TED). The primary aim of this study is to evaluate the diagnostic potential of these 26 MEMRDEGs in TED. While the specific regulation status (upregulation or downregulation) of these genes in TED was not detailed, their enrichment in the disease context suggests diagnostic relevance. Our analysis focuses on the collective impact of these genes in TED pathogenesis. Gene Set Enrichment Analysis (GSEA) revealed significant enrichment of gene expression levels related to TED in dataset GSE58331, particularly in pathways involving fatty acids, proinflammatory and profibrotic mediators, and ADORA2B-mediated anti-inflammatory cytokine production. Mitochondrial energy metabolism pathways encompass glycolysis, the tricarboxylic acid cycle, oxidative phosphorylation, ketone body metabolism, lipid metabolism, and gluconeogenesis. Oxidative phosphorylation, crucial for ATP synthesis, stands out as a central pathway in energy metabolism. The activation of the ADORA2B receptor triggers the cyclic adenosine monophosphate (cAMP) pathway and associated downstream pathways, linked to immunosuppression and potential applications in asthma and tumor immunotherapy[
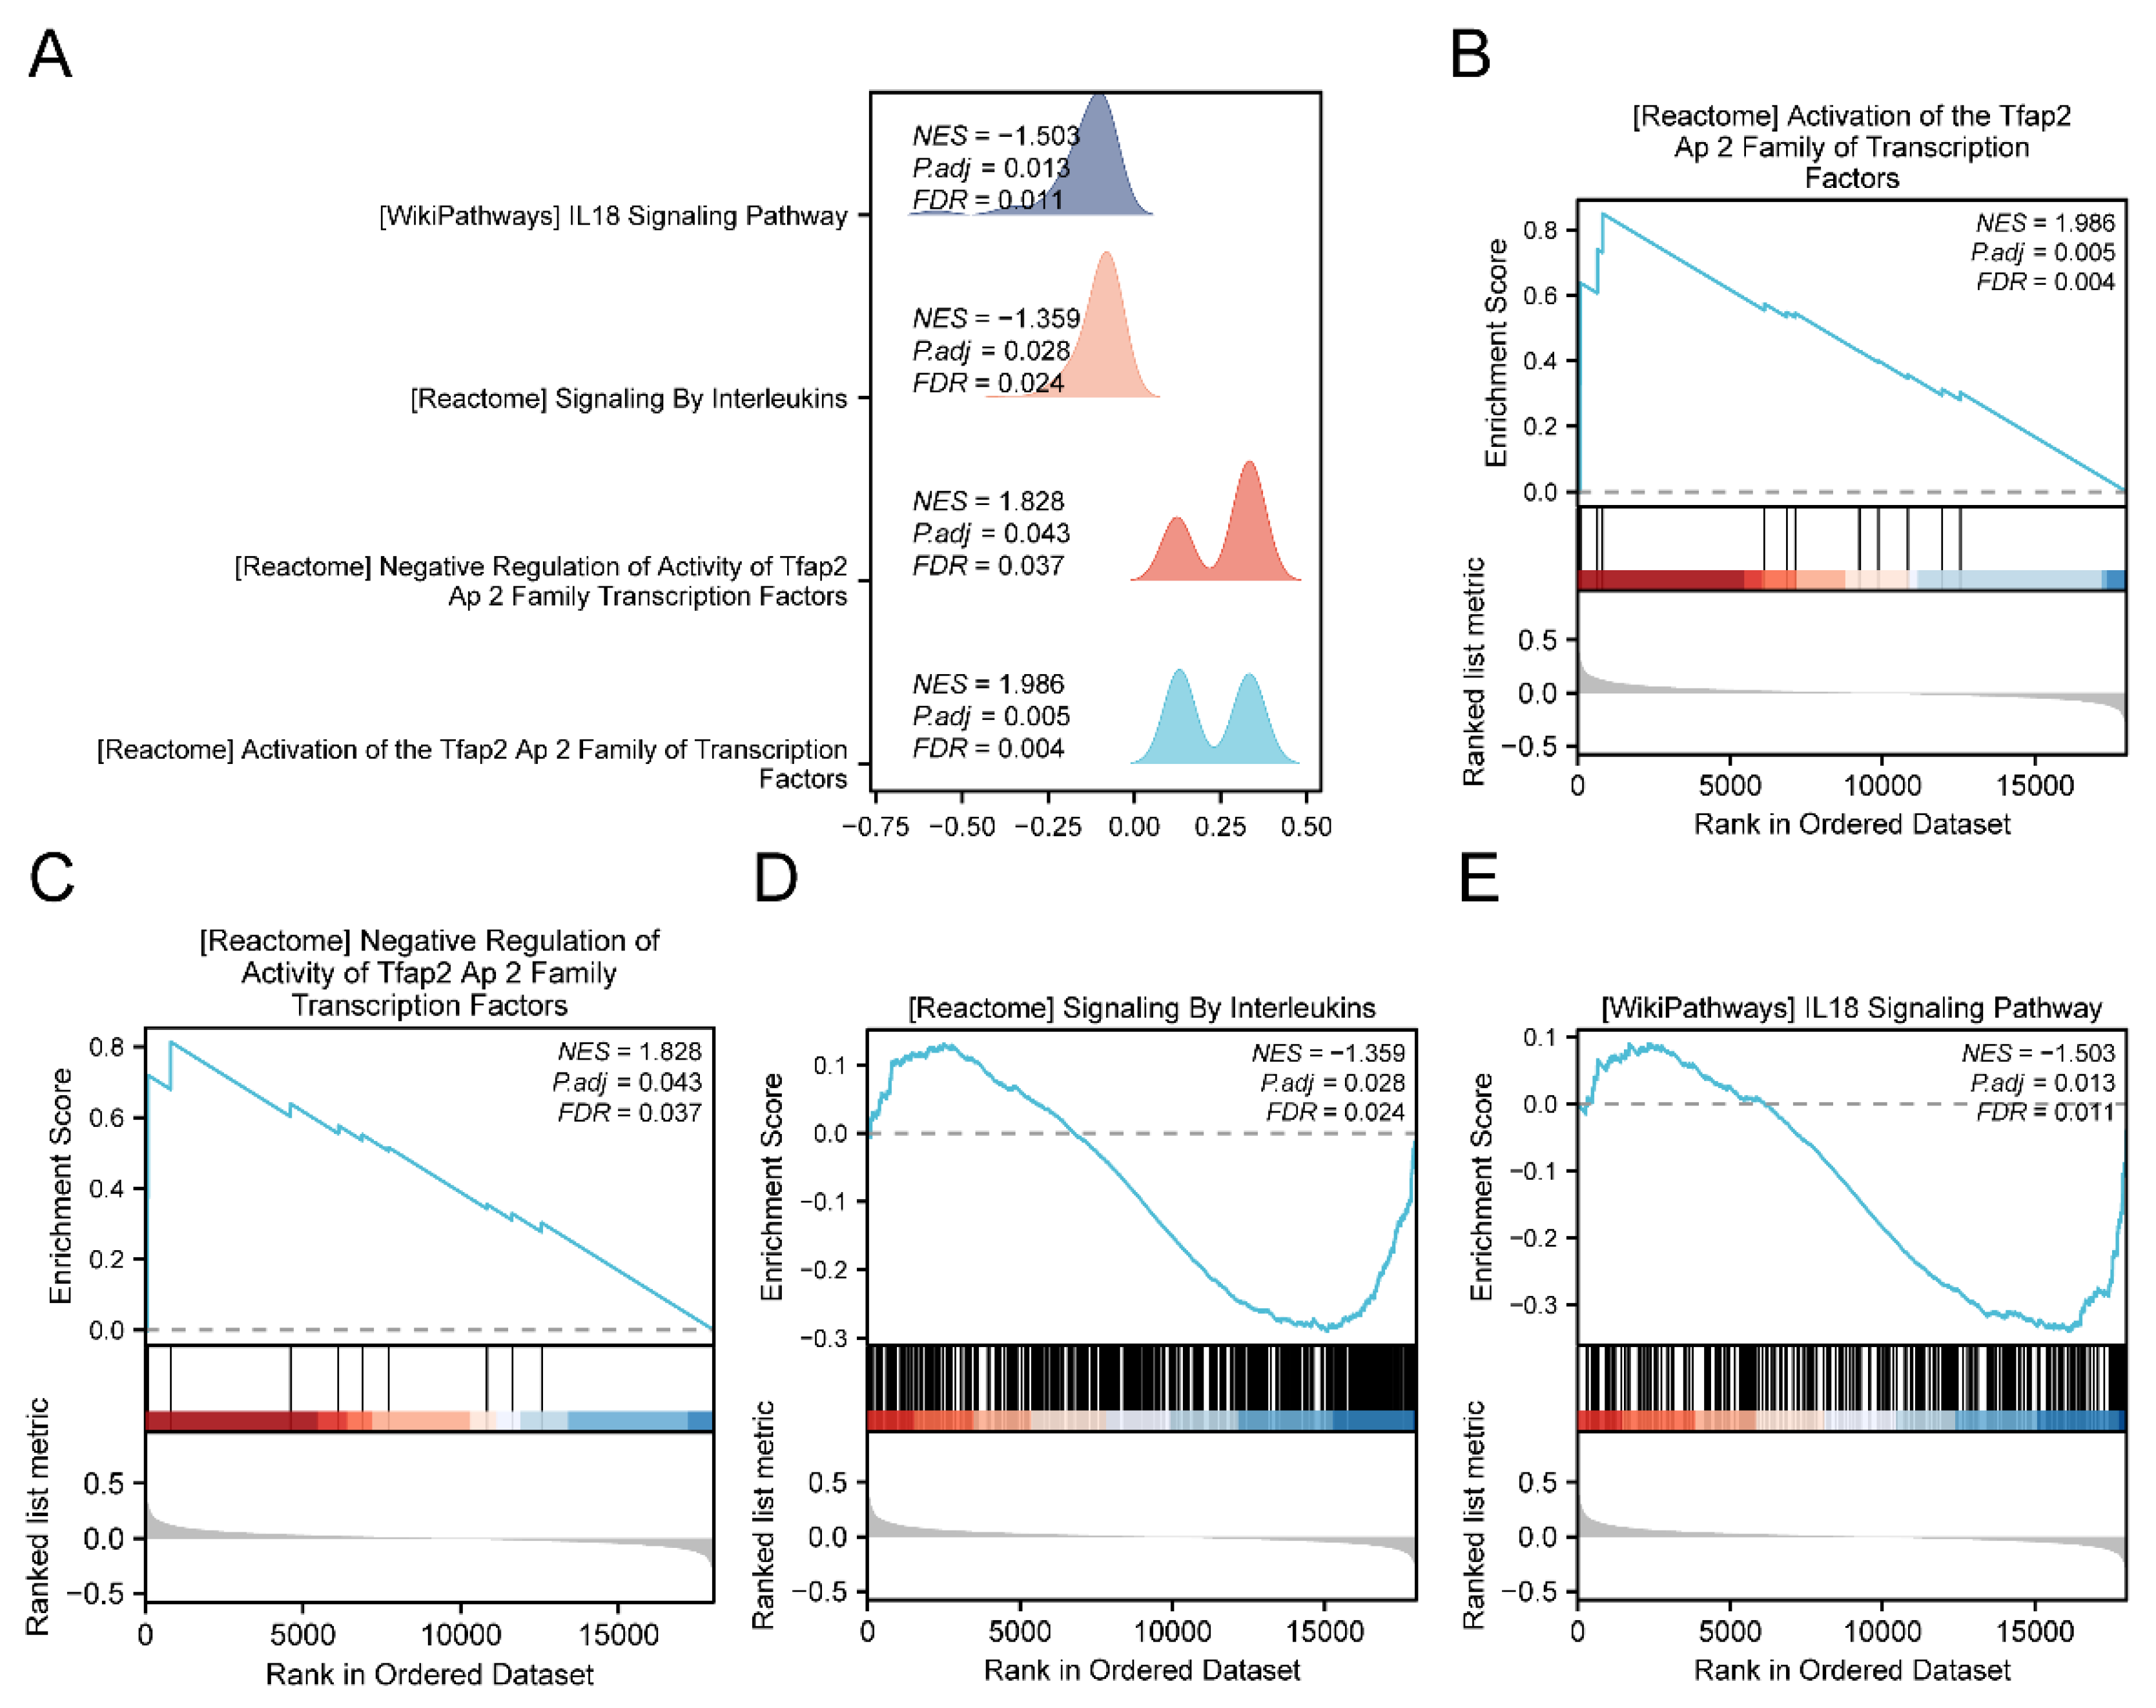
44]. GSEA indicated significant enrichment related to oxidative phosphorylation and ATP energy production within mitochondria. By categorizing high and low-risk groups using Logistic risk scoring, GSEA demonstrated significant enrichment of TED genes across pathways such as Signaling By Interleukins, IL18 Signaling Pathway, and other relevant biological functions. In the context of intracytoplasmic mitochondrial DNA and ROS, the activation of inflammatory vesicles can lead to IL-1β and IL-18 secretion upon release from dysfunctional mitochondria[
45]. We suggest that the mitochondrial energy metabolism pathway in TED involves inflammasome signaling pathways. These findings suggested that MEMRGs were involved in the immune aspects of TED and were associated with the pathogenesis of TED. Therefore, we further compared the immune infiltration abundance in TED grouped by high and low risk score.
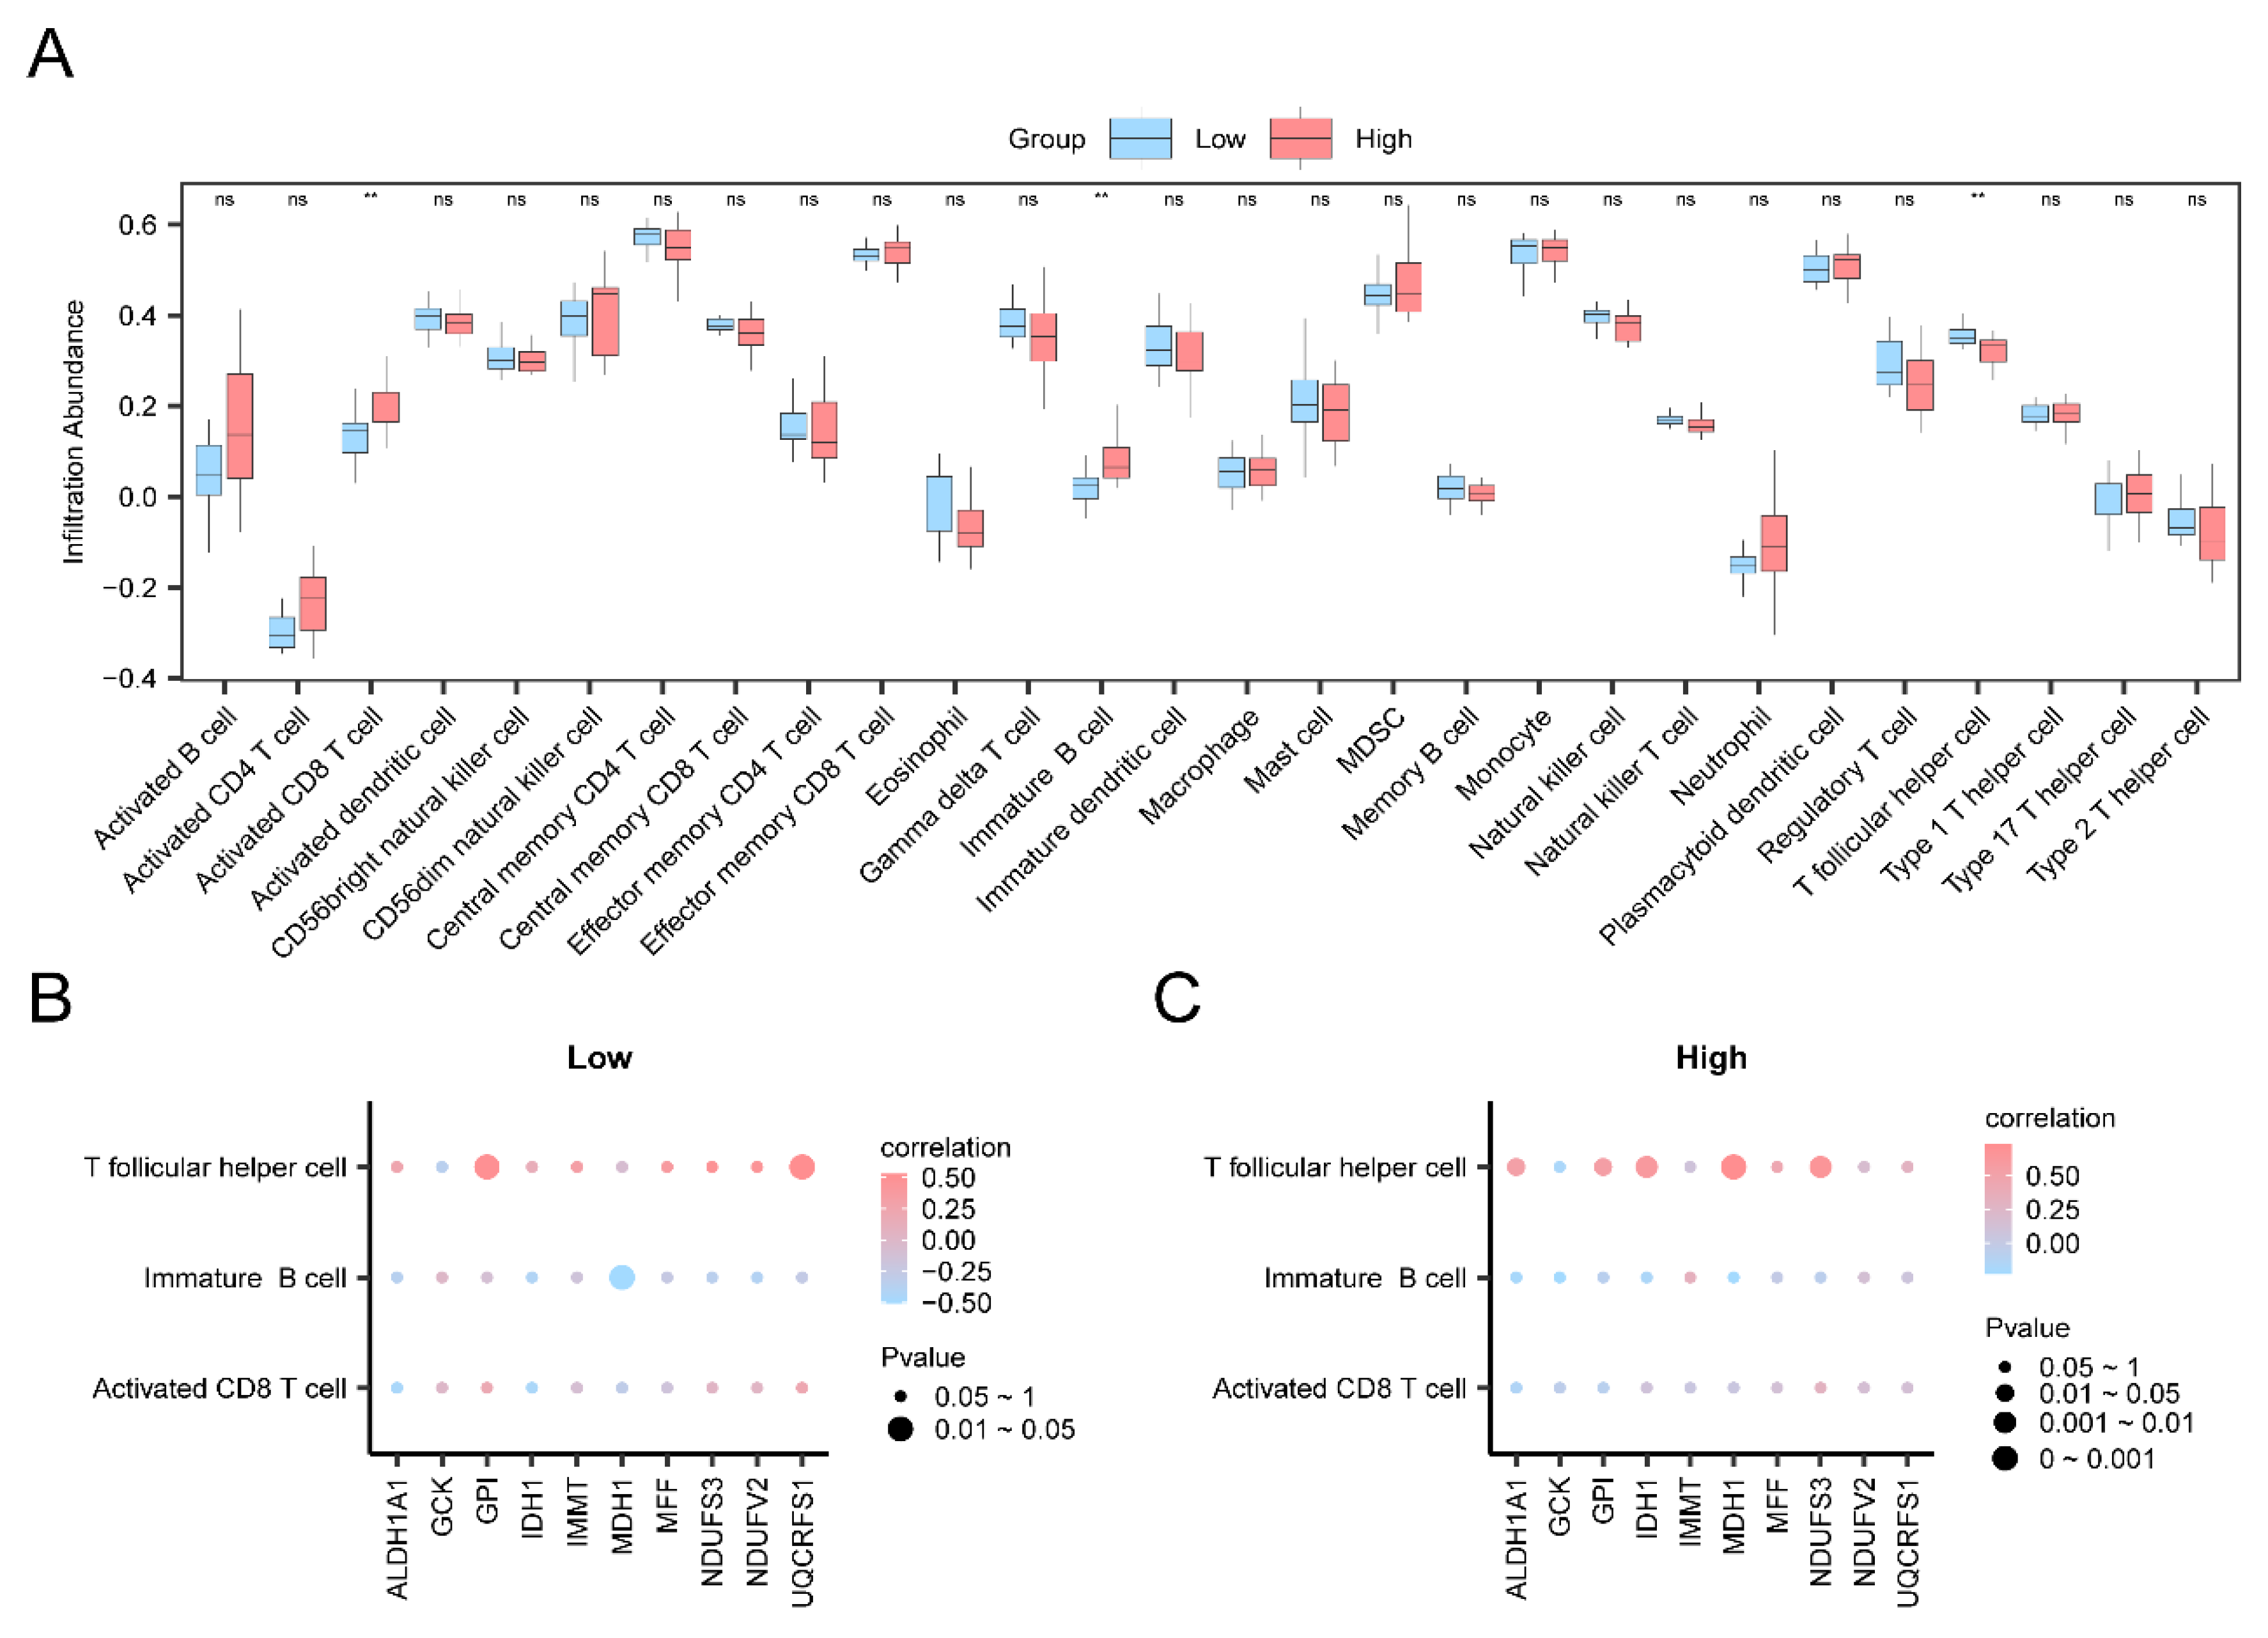
Using the ssGSEA algorithm to assess immune cell infiltration abundance in Thyroid Eye Disease (TED) high and low-risk groups, significant findings (p < 0.05) were observed for Activated CD8 T cells, Immature B cells, and T follicular helper cells. Key Genes displayed strong positive correlations with immune cells in both Low Risk and High Risk TED groups. Notably, UQCRFS1 exhibited the strongest positive correlation with T follicular helper cells in the Low Risk group (r = 0.529, p < 0.05), while MDH1 showed the strongest positive correlation with T follicular helper cells in the High Risk group (r = 0.733, p < 0.05). Previous immunohistochemical studies have linked cytokines such as interferon-γ (IFN-γ), tumor necrosis factor-α (TNF-α), and interleukin-1α (IL-1α) with T-cell infiltration in TED connective tissues. During the Active phase of TED, CD4+ and CD45RO+ T cells are abundant in early orbital infiltration, secreting cytokines and chemokines to enhance the immune response. Follicular helper T cells (Tfh) play a crucial role as regulators of germinal center (GC) B cells and in sustaining long-term protective humoral responses[
46,
47]. Tfh cells aided in immunoglobulin class switch reorganization and supported germinal center responses, thereby promoting immunoglobulin affinity maturation and the generation of humoral immune memory[
48]. While their primary function was to promote B-cell responses, Tfh cells also exhibited phenotypic and functional diversity depending on the immunologic and spatial environment they encounter[
49].
UQCRFS1 was highly expressed in gastric and breast cancers. Knocking out
UQCRFS1 cells can reduce cell proliferation, induce cell cycle arrest in G1 phase, increase the proportion of apoptosis, ROS production and DNA damage gene expression, and inhibit the AKT/mTOR pathway[
50]. Dysregulation of Tfhs and follicular regulation T cells had been reported to be positively associated with the pathogenic process of autoimmune diseases[
51].
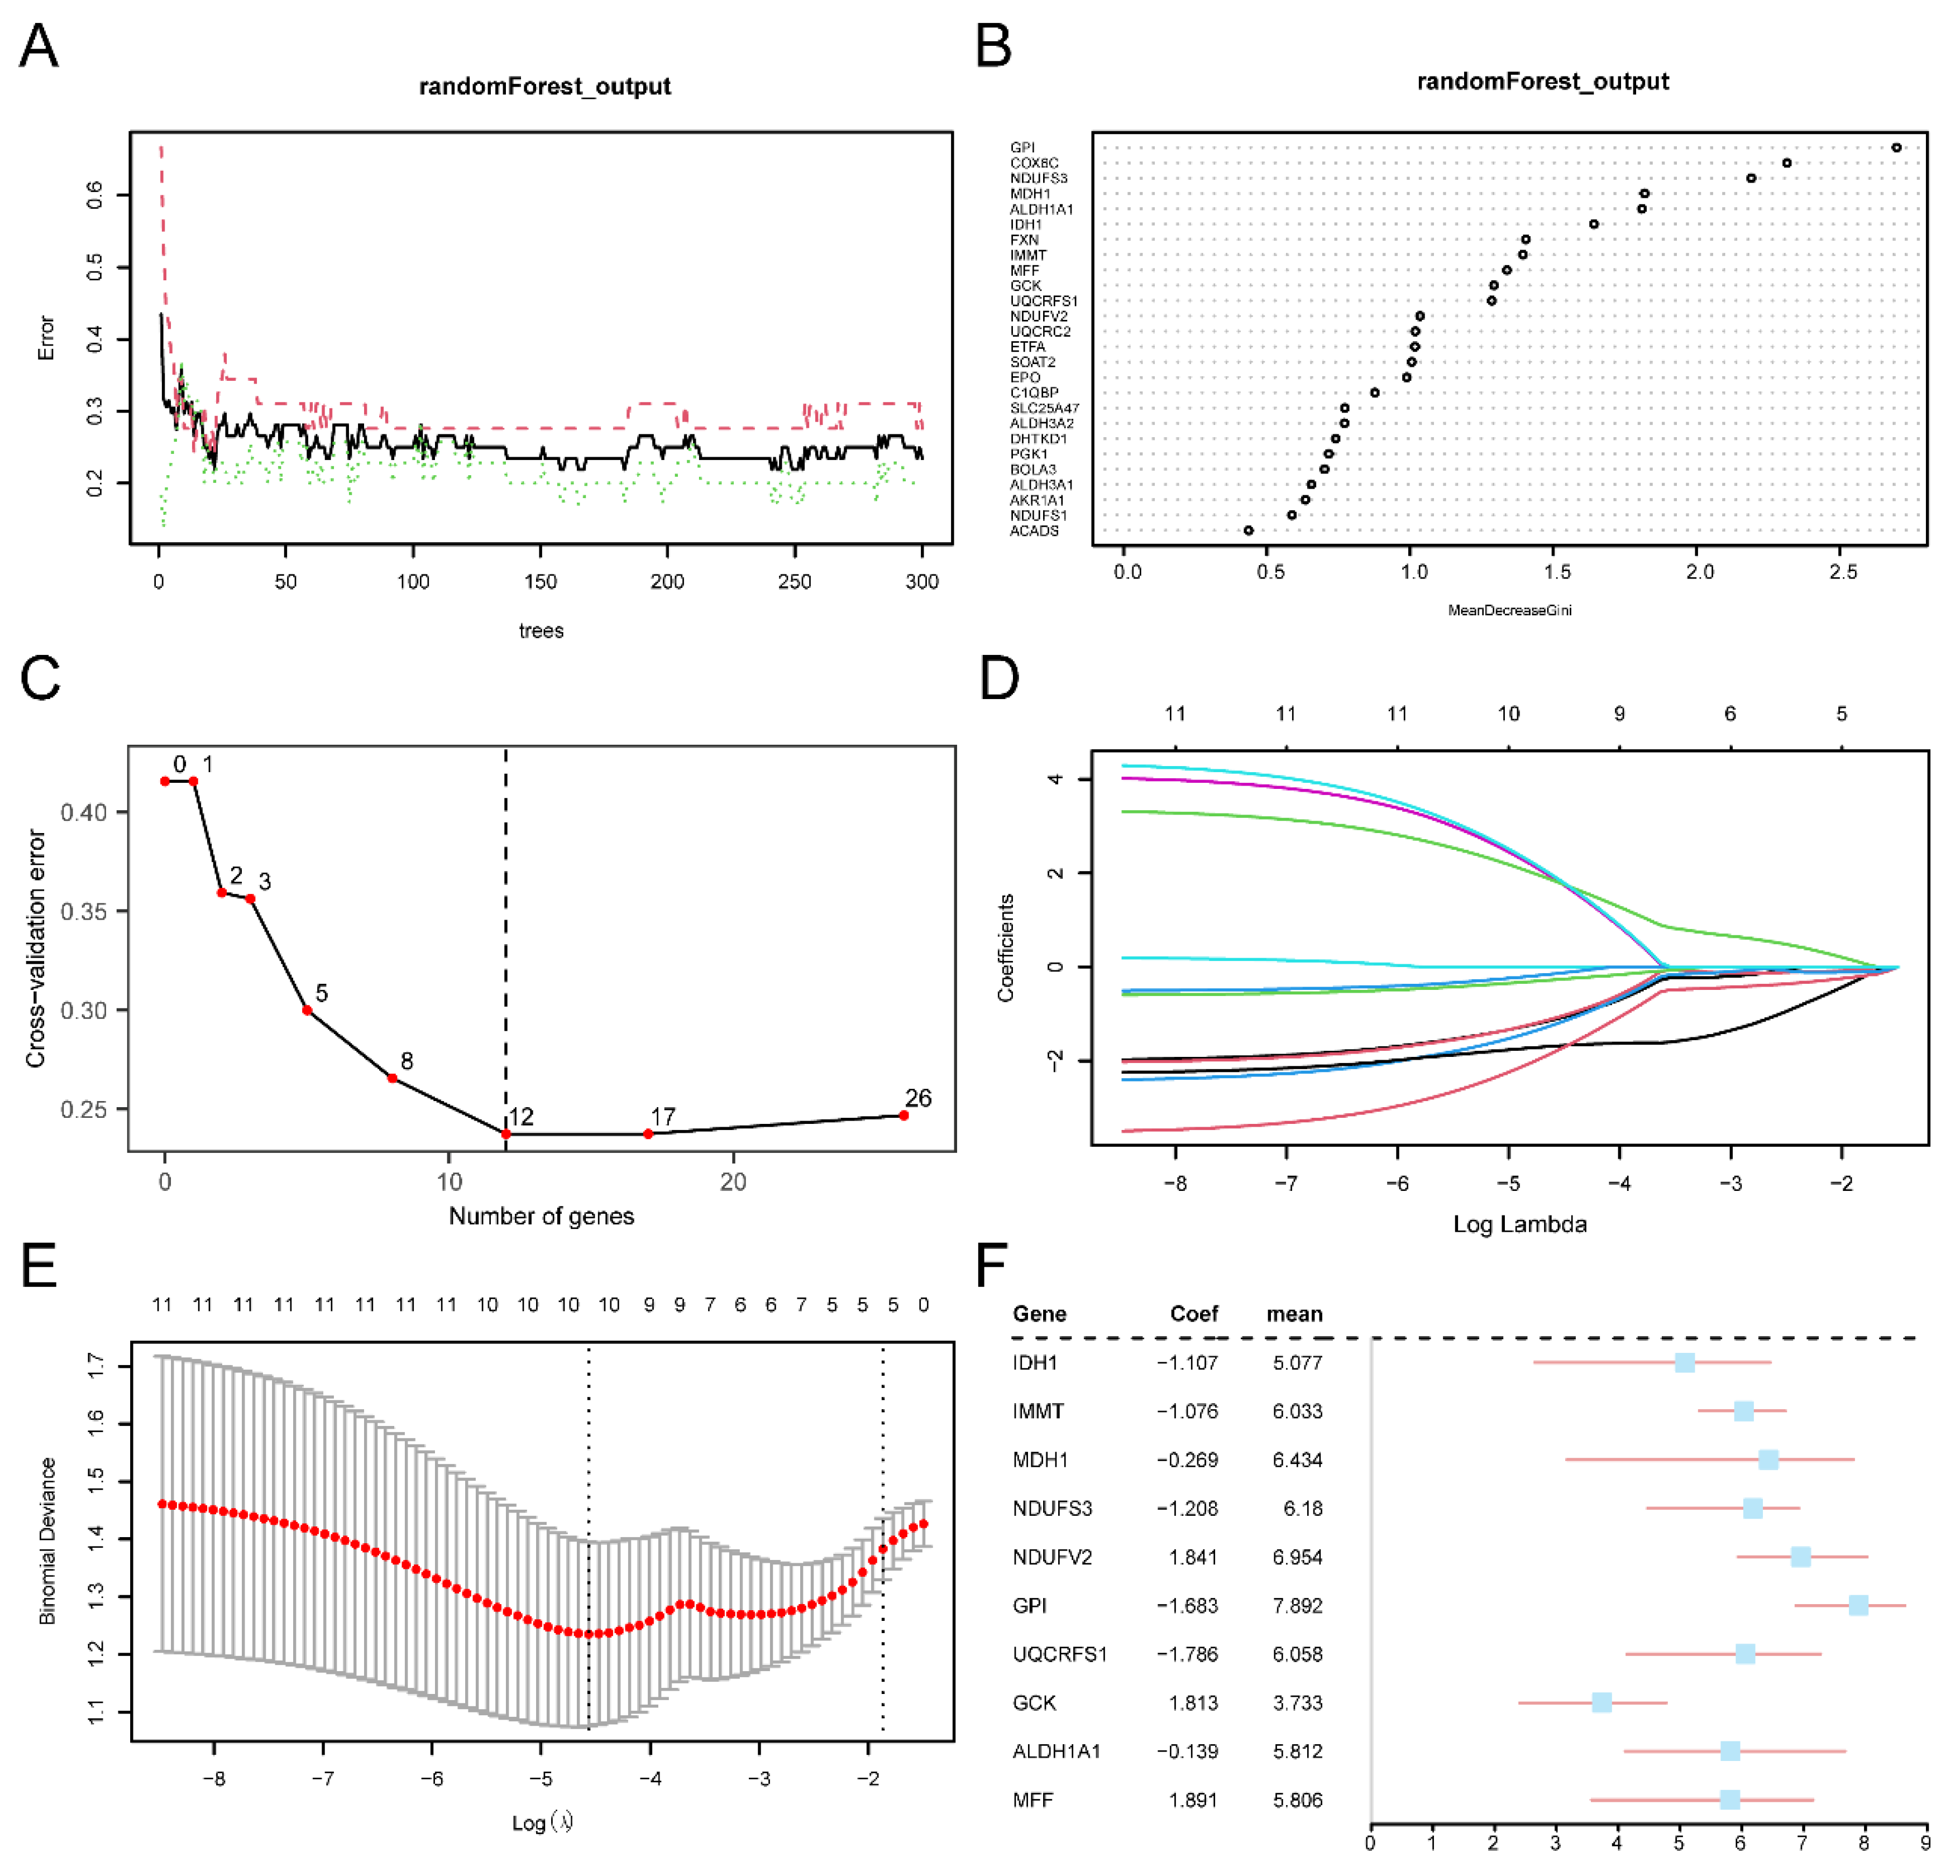
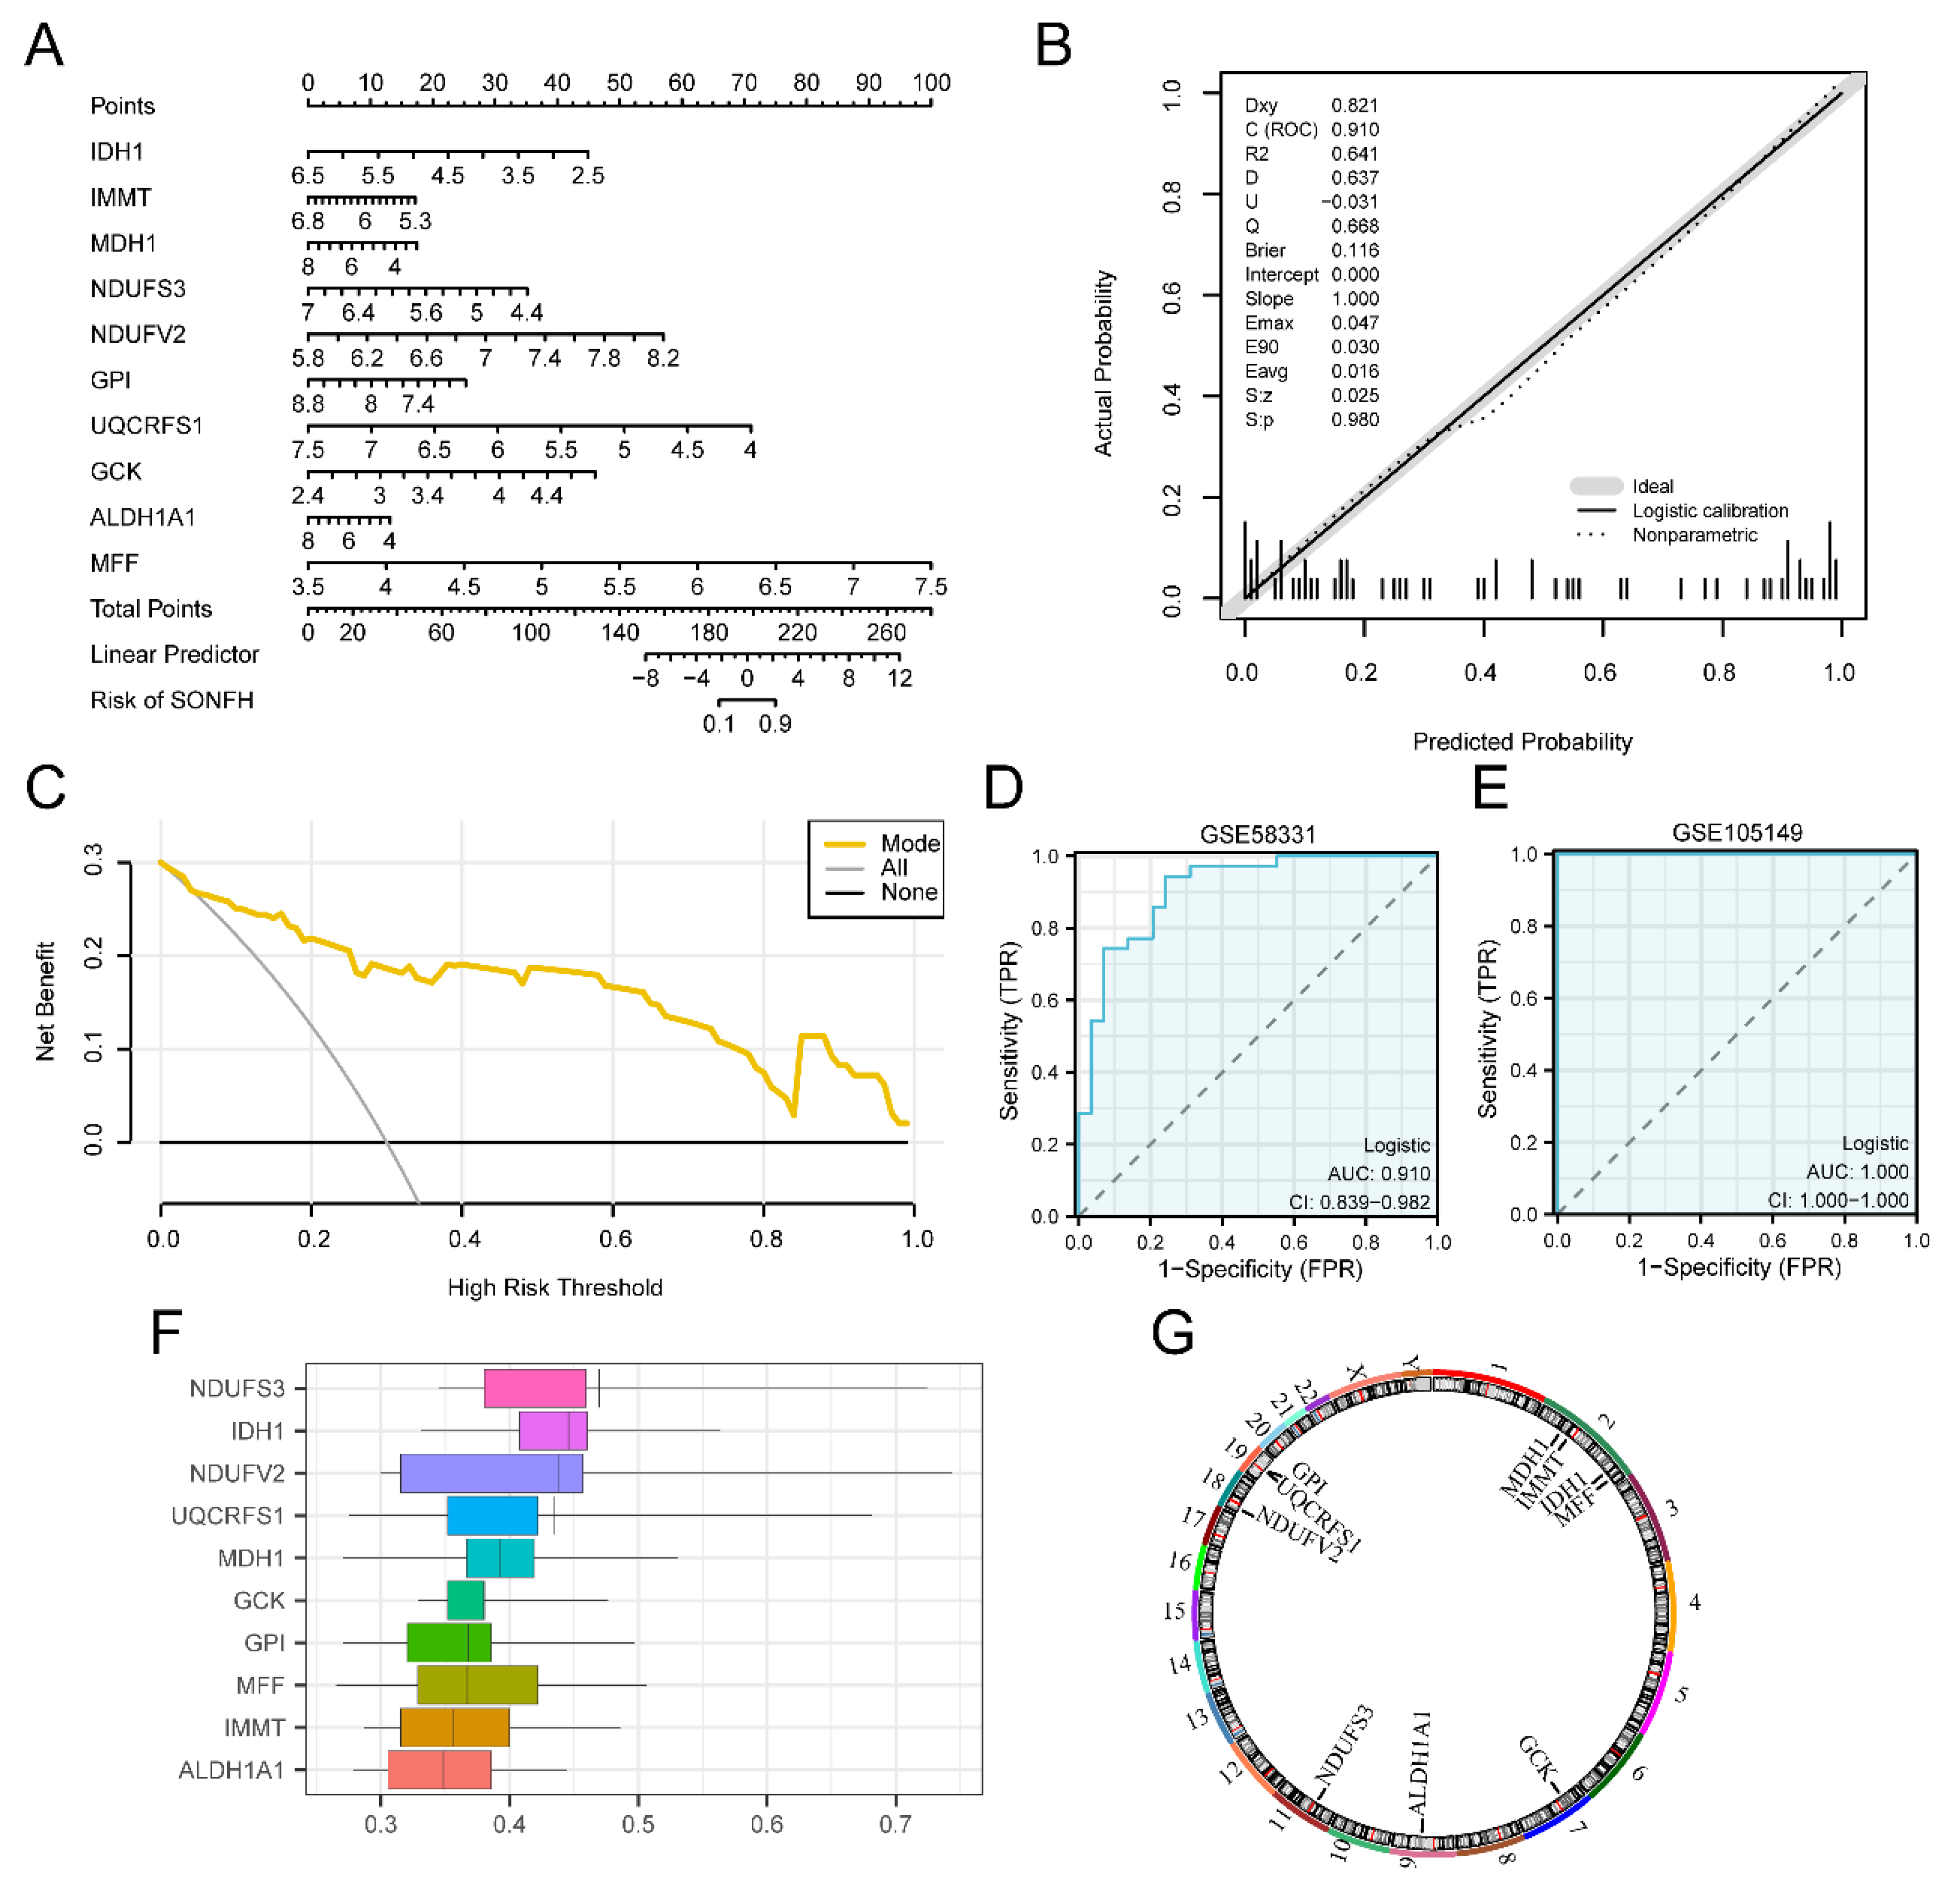
The LASSO regression model identified 10 key genes in Thyroid Eye Disease (TED): IDH1, IMMT, MDH1, NDUFS3, NDUFV2, GPI, UQCRFS1, GCK, ALDH1A1, and MFF. ROC curves revealed that IDH1, IMMT, MDH1, NDUFS3, NDUFV2, ALDH1A1, and MFF expression levels are highly accurate in distinguishing between the TED and Control groups (AUC > 0.9). NDUFS3, highlighted by Friends analysis, was deemed crucial in TED's biological processes (cut-off value = 0.60). In invasive ductal breast carcinoma samples, the mitochondrial complex I subunit NDUFS3 exhibited a distinct signature as a marker for hypoxia/necrosis. NDUFS3 expression levels were significantly and positively associated with nuclear grading, enabling improved diagnosis and survival rate predictions for breast cancer patients[
52]. Furthermore, Complex I (CI) is the largest enzyme in the mitochondrial respiratory chain, and its defects were a major cause of mitochondrial disease. CI disassembly processes were identified as occurring in a hierarchical and modular manner when the amount of
NDUFS3 gradually decreases[
53]. Inner membrane mitochondrial protein (IMMT) is crucial for preserving mitochondrial structural integrity, regulating mitochondrial dynamics, and contributing to various cellular functions. It plays a role in cell cycle advancement and mitochondrial antioxidant protection. Elevated IMMT levels are linked to lung adenocarcinoma and independently predict a poor prognosis in patients with this condition. IMMT has the potential to serve as a novel prognostic marker and therapeutic target in lung adenocarcinoma[
54].
IMMT played a crucial role in shaping the inner mitochondrial membrane, regulating metabolism and innate immunity. Low expression of
IMMT in tumors was associated with mitochondrial inhibition and activation of angiogenesis, indicating a poor prognosis for patients with kidney renal clear cell carcinoma (KIRC) and being linked to the progression of KIRC[
55]. NDUFS3 and IMMT exhibited high expression levels in Thyroid Eye Disease (TED) datasets and were linked to mitochondrial energy metabolism pathways, potentially influencing TED's immune responses. These genes are considered promising research directions and potential therapeutic targets for TED. However, our study has limitations. While we identified associations between 26 differentially expressed genes and TED, lack of biological validation hinders a comprehensive understanding of their roles in the disease's pathophysiology. Resource constraints prevent further wet lab experiments, and the absence of clinical relevance studies limits analysis with clinical data. Future research aims to address these gaps through experimental validation. Despite combining data from GSE105149 and GSE58331 to enhance statistical power, the relatively small sample size may impact result reliability. Relying on publicly available data introduces potential bias, necessitating future studies with independent datasets and experimental confirmation to bolster our findings.
Figure 1.
data de-batching process.A. Boxplot of the distribution of dataset GSE58331 before de-batching. B. Boxplot of the distribution of dataset GSE58331 after de-batching. C. Boxplot of the distribution of dataset GSE105149 before de-batching. D. Boxplot of the distribution of dataset GSE105149 after de-batching. The light red color is for the TED group and the light blue color is for the Control group.
Figure 2.
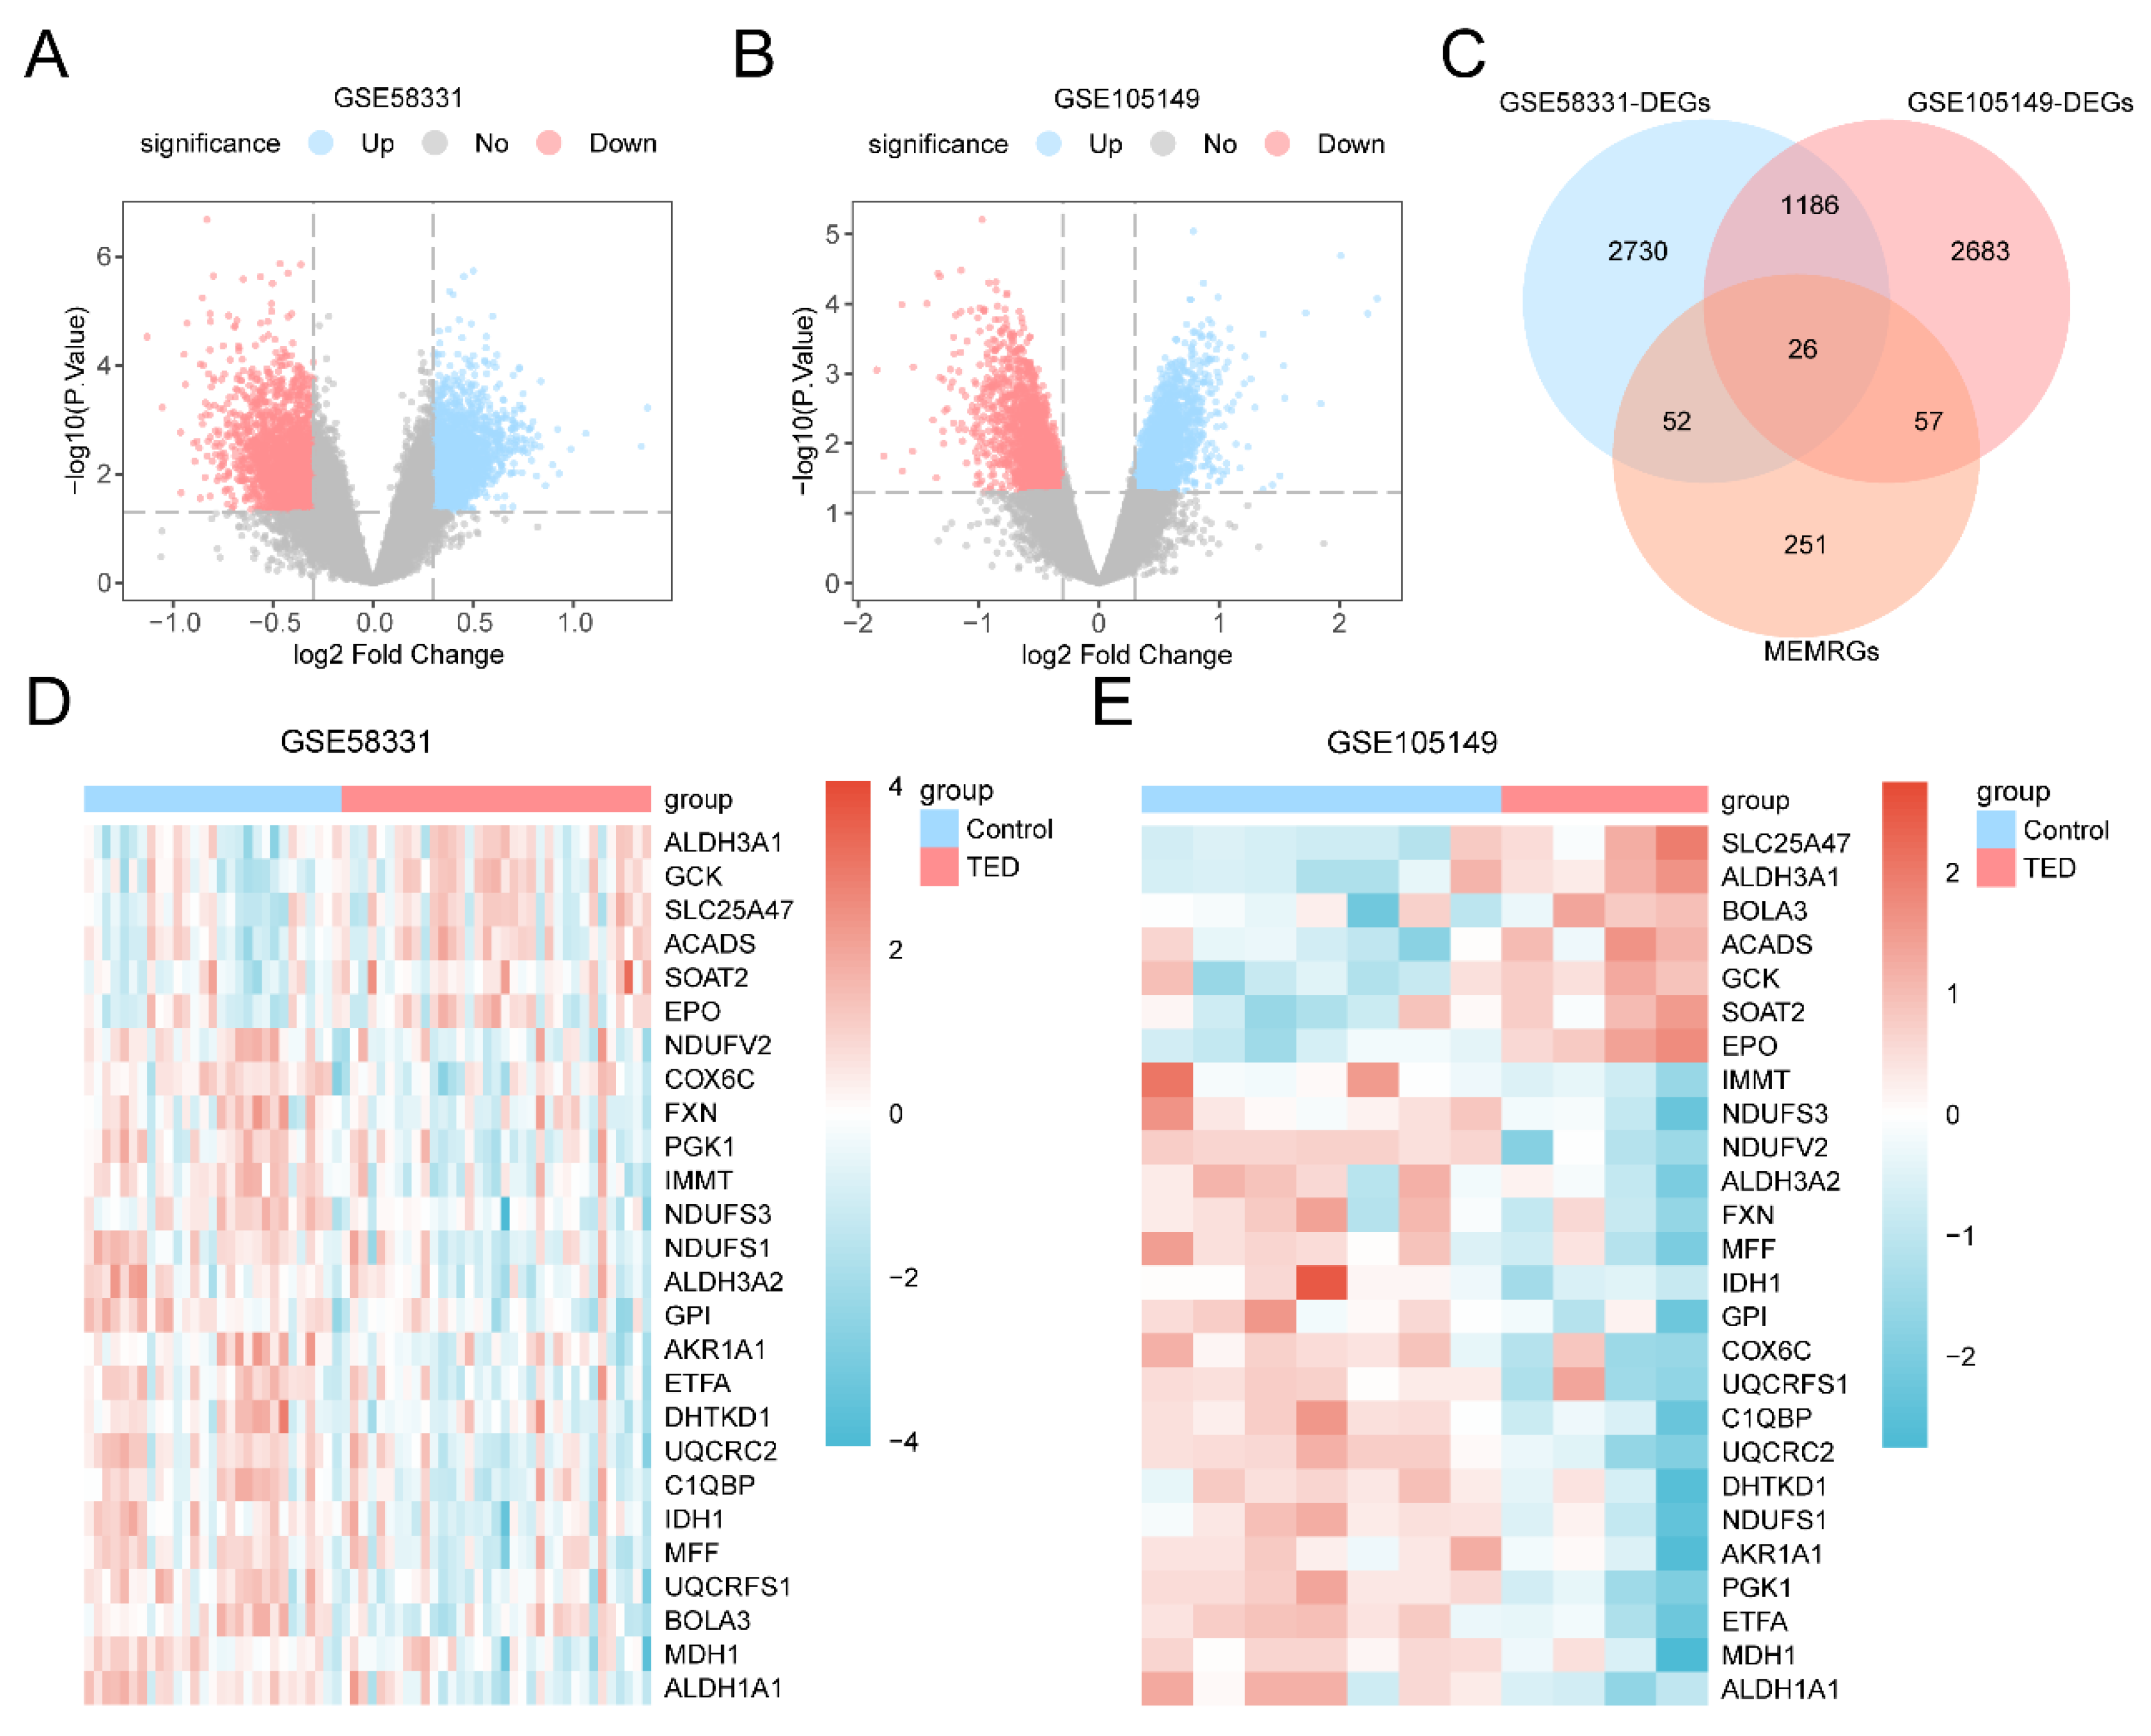
differential gene expression analysis. A-B. Volcano plots of DEGs analyzed in the TED group and Control group in the GSE58331 (A) and GSE105149 datasets (B). C. Wayne plots of all the genes in TED and MEMRGs in the DEGs in the GSE58331 and GSE105149 datasets. D-E. Heatmaps of all the genes in DEGs and MEMRGs in the GSE58331 (D) and Heatmap of MEMRDEGs in GSE105149 dataset (E). DEGs: Differentially Expressed Genes; MEMRGs: Mitochondrial Energy Metabolism-Related Genes; MEMRDEGs: Mitochondrial Energy Metabolism-Related Differentially Expressed Genes. The light red color is for the TED group and the light blue color is for the Control group. Red color in the heatmap represents high expression and blue color represents low expression.
Figure 2.
differential gene expression analysis. A-B. Volcano plots of DEGs analyzed in the TED group and Control group in the GSE58331 (A) and GSE105149 datasets (B). C. Wayne plots of all the genes in TED and MEMRGs in the DEGs in the GSE58331 and GSE105149 datasets. D-E. Heatmaps of all the genes in DEGs and MEMRGs in the GSE58331 (D) and Heatmap of MEMRDEGs in GSE105149 dataset (E). DEGs: Differentially Expressed Genes; MEMRGs: Mitochondrial Energy Metabolism-Related Genes; MEMRDEGs: Mitochondrial Energy Metabolism-Related Differentially Expressed Genes. The light red color is for the TED group and the light blue color is for the Control group. Red color in the heatmap represents high expression and blue color represents low expression.
Figure 3.
GO and KEGG enrichment analysis of MEMRDEGs. A. Bubble diagram presentation of GO and KEGG enrichment analysis resulted for MEMRDEGs : BP, CC, MF and KEGG. Horizontal coordinates are GO and KEGG terms. B-E. MEMRDEGs of GO and KEGG Enrichment analysis results network graphs showing: BP (B), CC (C), MF (D) and KEGG (E). The pink nodes represent the entries, the blue nodes represent the molecules, and the connecting lines represent the relationship between the entries and the molecules. MEMRDEGs: Mitochondrial Energy Metabolism-Related Differentially Expressed Genes; GO: Gene Ontology; KEGG: Kyoto Encyclopedia of Genes and Genomes; BP: Biological Process; CC: Cellular Component; MF: Molecular Function. The size of the bubbles in the bubble diagram represents the number of genes, and the color of the bubbles represents the magnitude of the p value, and the redder the color, the smaller the p value, the bluer the color the larger the p value.
Figure 4.
GSEA analysis of thyroid-related eye disease. The GSEA 4 biological functions of dataset GSE58331 were shown in mountain range plots.B-E. GSEA showed significant enrichment of all genes in Fatty Acids (B), Overview of Proinflammatory and Profibrotic Mediators (C), Dilated Cardiomyopathy (D), ADORA2B Mediated Anti Inflammatory Cytokines Production (E). GSEA: Gene Set Enrichment Analysis.
Figure 5.
Screening of Key Genes. A. Model training error plot for the Random Forest algorithm. B. MeanDecreaseGini scatterplot for MEMRDEGs (in descending order of MeanDecreaseGini). C. Cross validation error plot. D. Diagnostic model plot for the LASSO regression model. E. Variable trajectories for the LASSO regression model. F. Forest plot for Key Genes in the LASSO regression model. MEMRDEGs: Mitochondrial Energy Metabolism-Related Differentially Expressed Genes; LASSO: Least Absolute Shrinkage and Selection Operator.
Figure 6.
Key Genes constructs diagnostic logistic regression models. A. Column line plot (Nomogram) of Key Genes in diagnostic multifactor logistic model based on dataset GSE58331. B. Calibration curve plot of Key Genes in diagnostic multifactor logistic model based on dataset GSE58331. C. DCA plot of Key Genes based on the diagnostic multifactor logistic model for dataset GSE58331. D-E. Diagnostic ROC curves of diagnostic multifactorial logistic model Risk Score in datasets GSE58331 (D) and GSE105149 (E). F. Friends plots of Key Genes. G. Chromosomal localization map of Key Genes. DCA plots have net gain in the vertical coordinate and probability threshold or Threshold Probability (TPR) in the horizontal coordinate. DCA: Decision Curve Analysis; ROC: Receiver Operating Characteristic; TPR: True Positive Rate; FPR: False Positive Rate.
Figure 7.
Expression difference validation analysis of Key Genes. A. Group comparison plots of Key Genes in the TED group and Control group of dataset GSE58331. B-F. Key Genes in IDH1 and IMMT (B), MDH1 and NDUFS3 (C), NDUFV2h and GPI (D), UQCRFS1 and GCK (E), ALDH1A1 and MFF (F) in the ROC curves in dataset GSE58331. G. Group comparison plots of Key Genes in dataset GSE105149 in the TED group and Control group. H-L. Key Genes in IDH1 and IMMT (H), MDH1 and NDUFS3 (I), NDUFV2 and GPI (J), UQCRFS1 and GCK ( K), ALDH1A1 and MFF (L) in the ROC curves in dataset GSE105149. ns represents p value ≥ 0.05, not statistically significant; * represents p value < 0.05, statistically significant; ** represents p value < 0.01, highly statistically significant; *** represents p value ≤ 0.001, extremely high statistically significant. When AUC > 0.5, it indicates that the expression of the molecule is a trend to promote the event. The closer the AUC is to 1, the better the diagnosis. ROC, Receiver Operating Characteristic; AUC: Area Under the Curve; TPR: True Positive Rate; FPR: False Positive Rate. Light blue color represents the Control group and light red color represents the TED group.
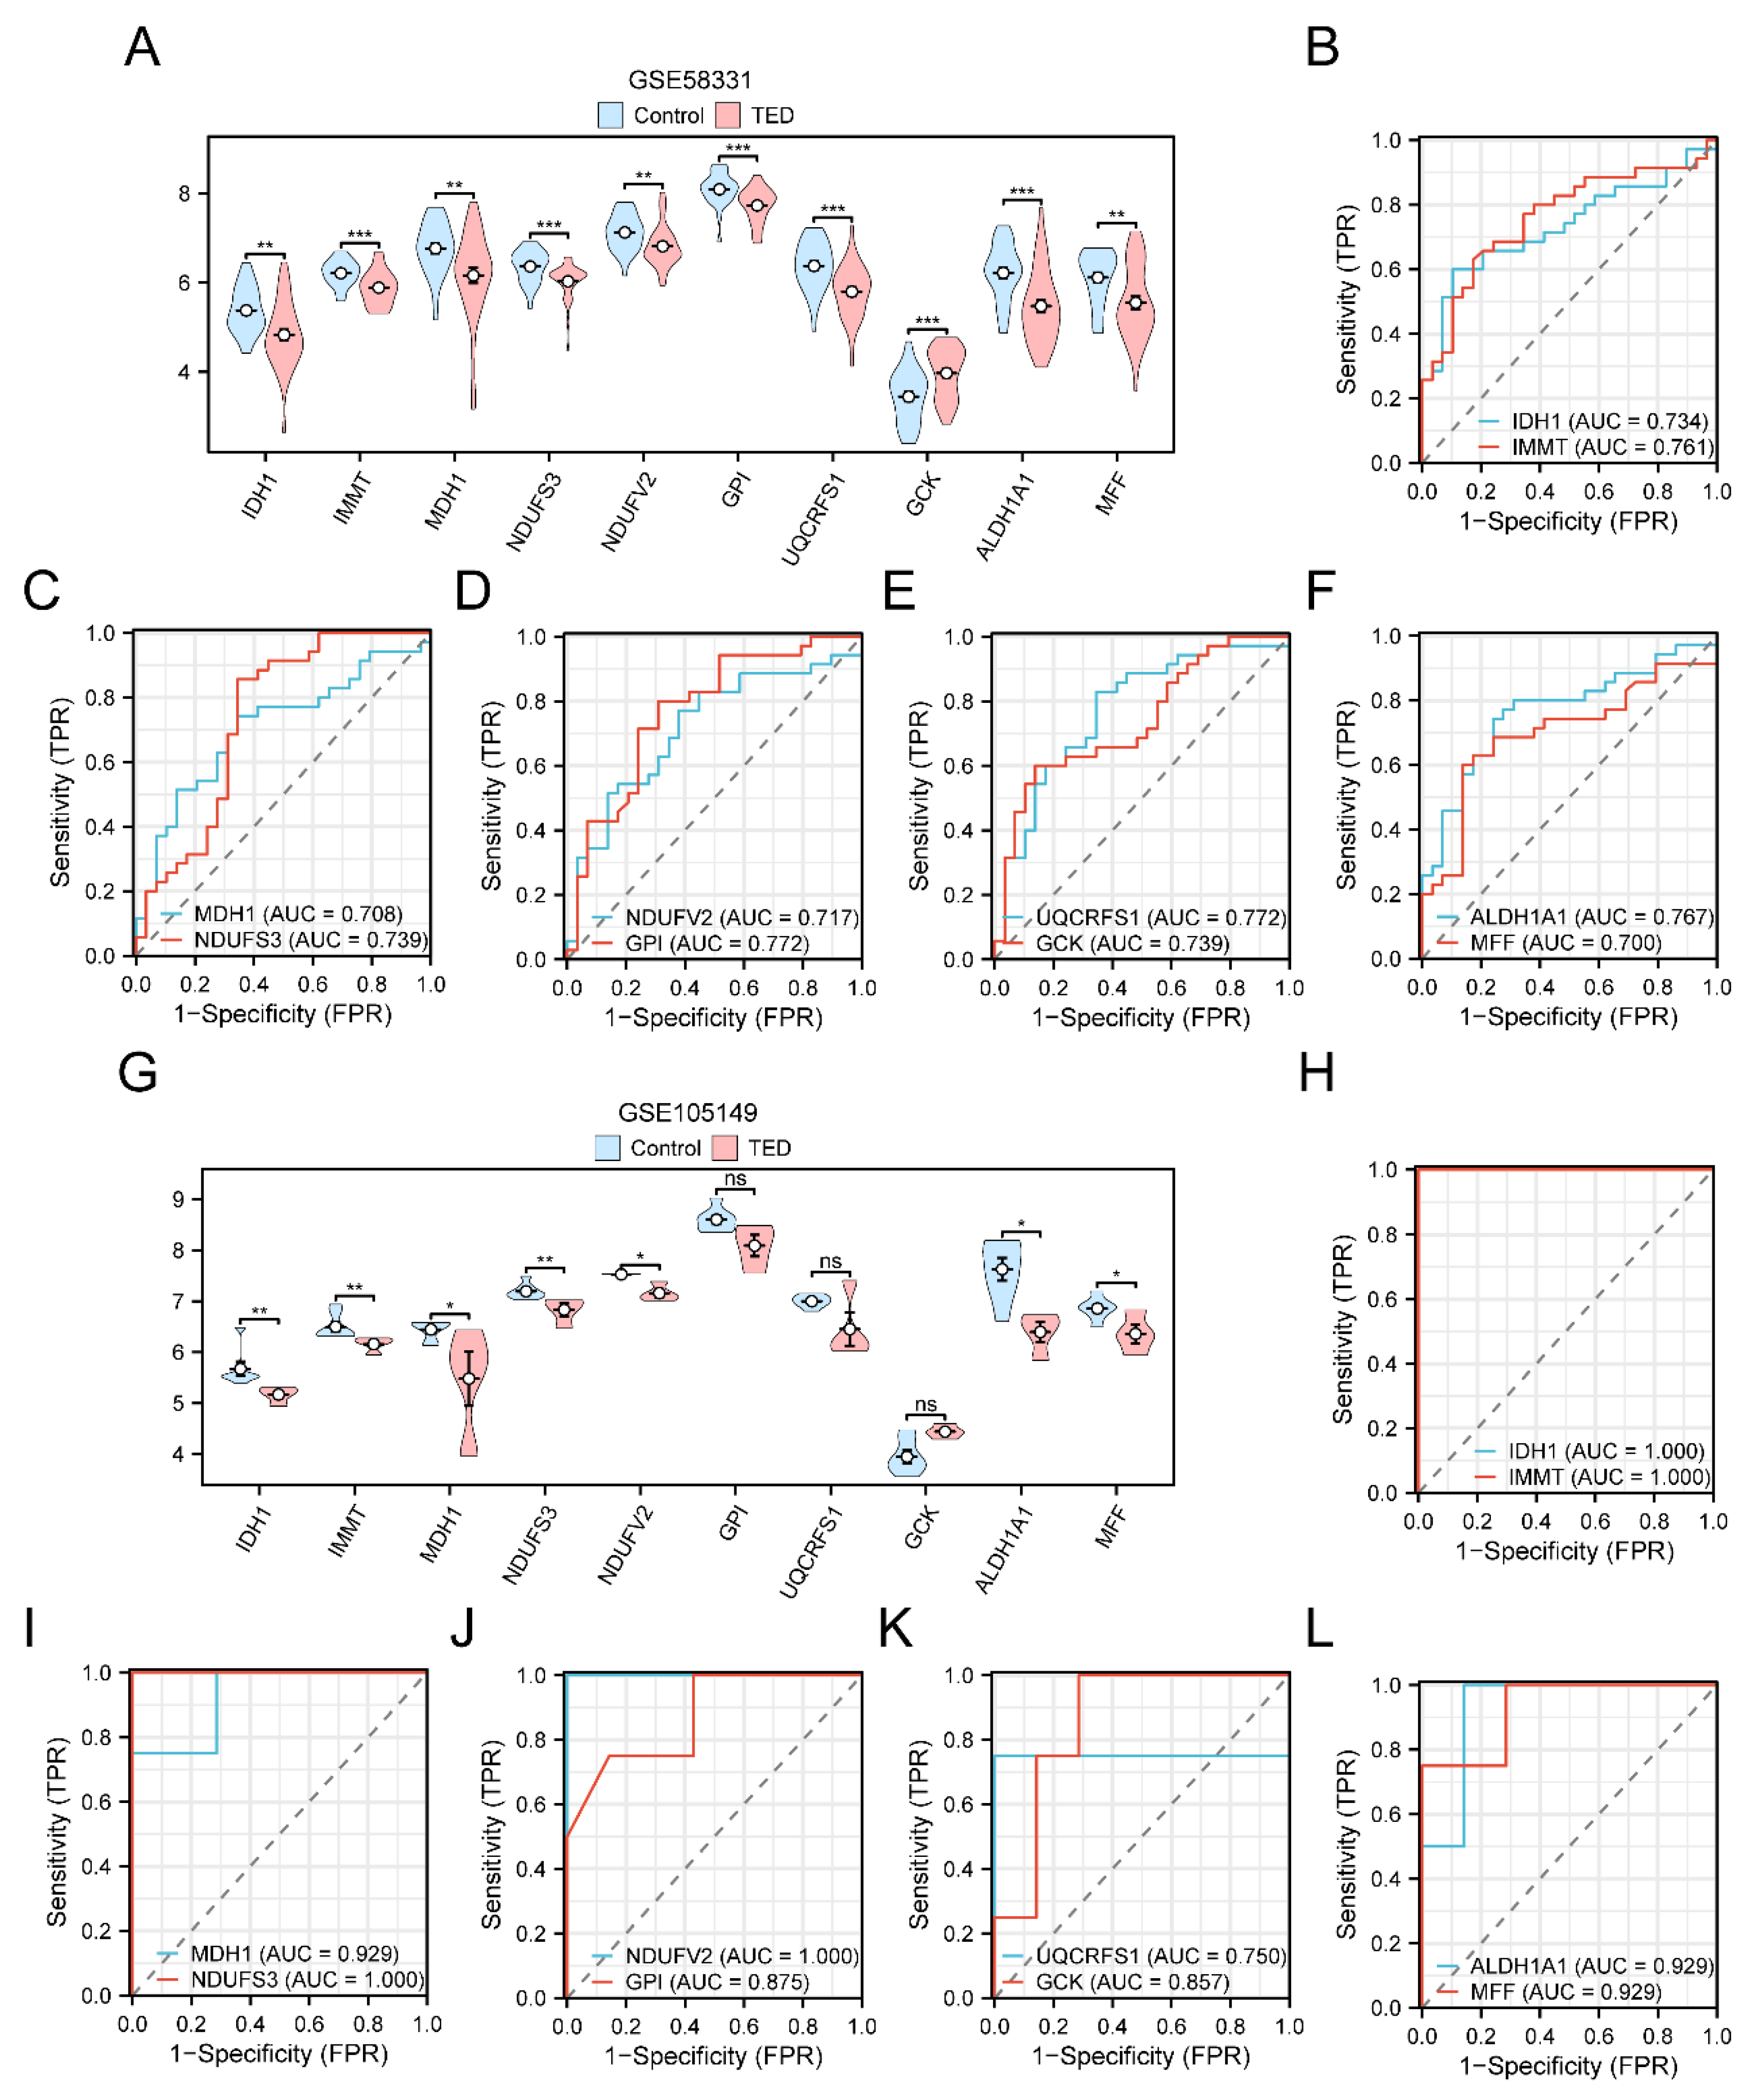
Figure 8.
GSEA of high and low risk groups in TED. A. GSEA of the dataset GSE58331 for 4 biological functions shown in mountain range plots. B-E. GSEA showed significant enrichment of all genes in Activation of the Tfap2 Ap 2 Family of Transcription Factors (B), Negative Regulation of Activity of the Tfap2 Ap 2 Family Transcription Factors (C), Signaling By Interleukins (D), IL18 Signaling Pathway (E). GSEA: Gene Set Enrichment Analysis.
Figure 9.
Immune infiltration analysis based on ssGSEA algorithm. A. Comparative plots of immune cells grouped in the TED group and Control group of dataset GSE58331. B-C. Bubble plots of correlation between immune cell infiltration abundance and Key Genes in the low risk (Low Risk) group (B) and the high risk (High Risk) group (C) of the TED . ssGSEA: single-sample Gene-Set Enrichment Analysis; TED: Thyroid Eye Disease. ns represents a p value ≥ 0.05 with no statistical significance; ** represents p value < 0.01, highly statistically significant. Correlation coefficients (r value) with absolute values between 0.5 and 0.8 were considered moderately correlated. Light purple color was for the Control group and light red color was for the TED group. Red color was positive correlation and blue color was negative correlation. Shades of color represent the strength of the correlation.
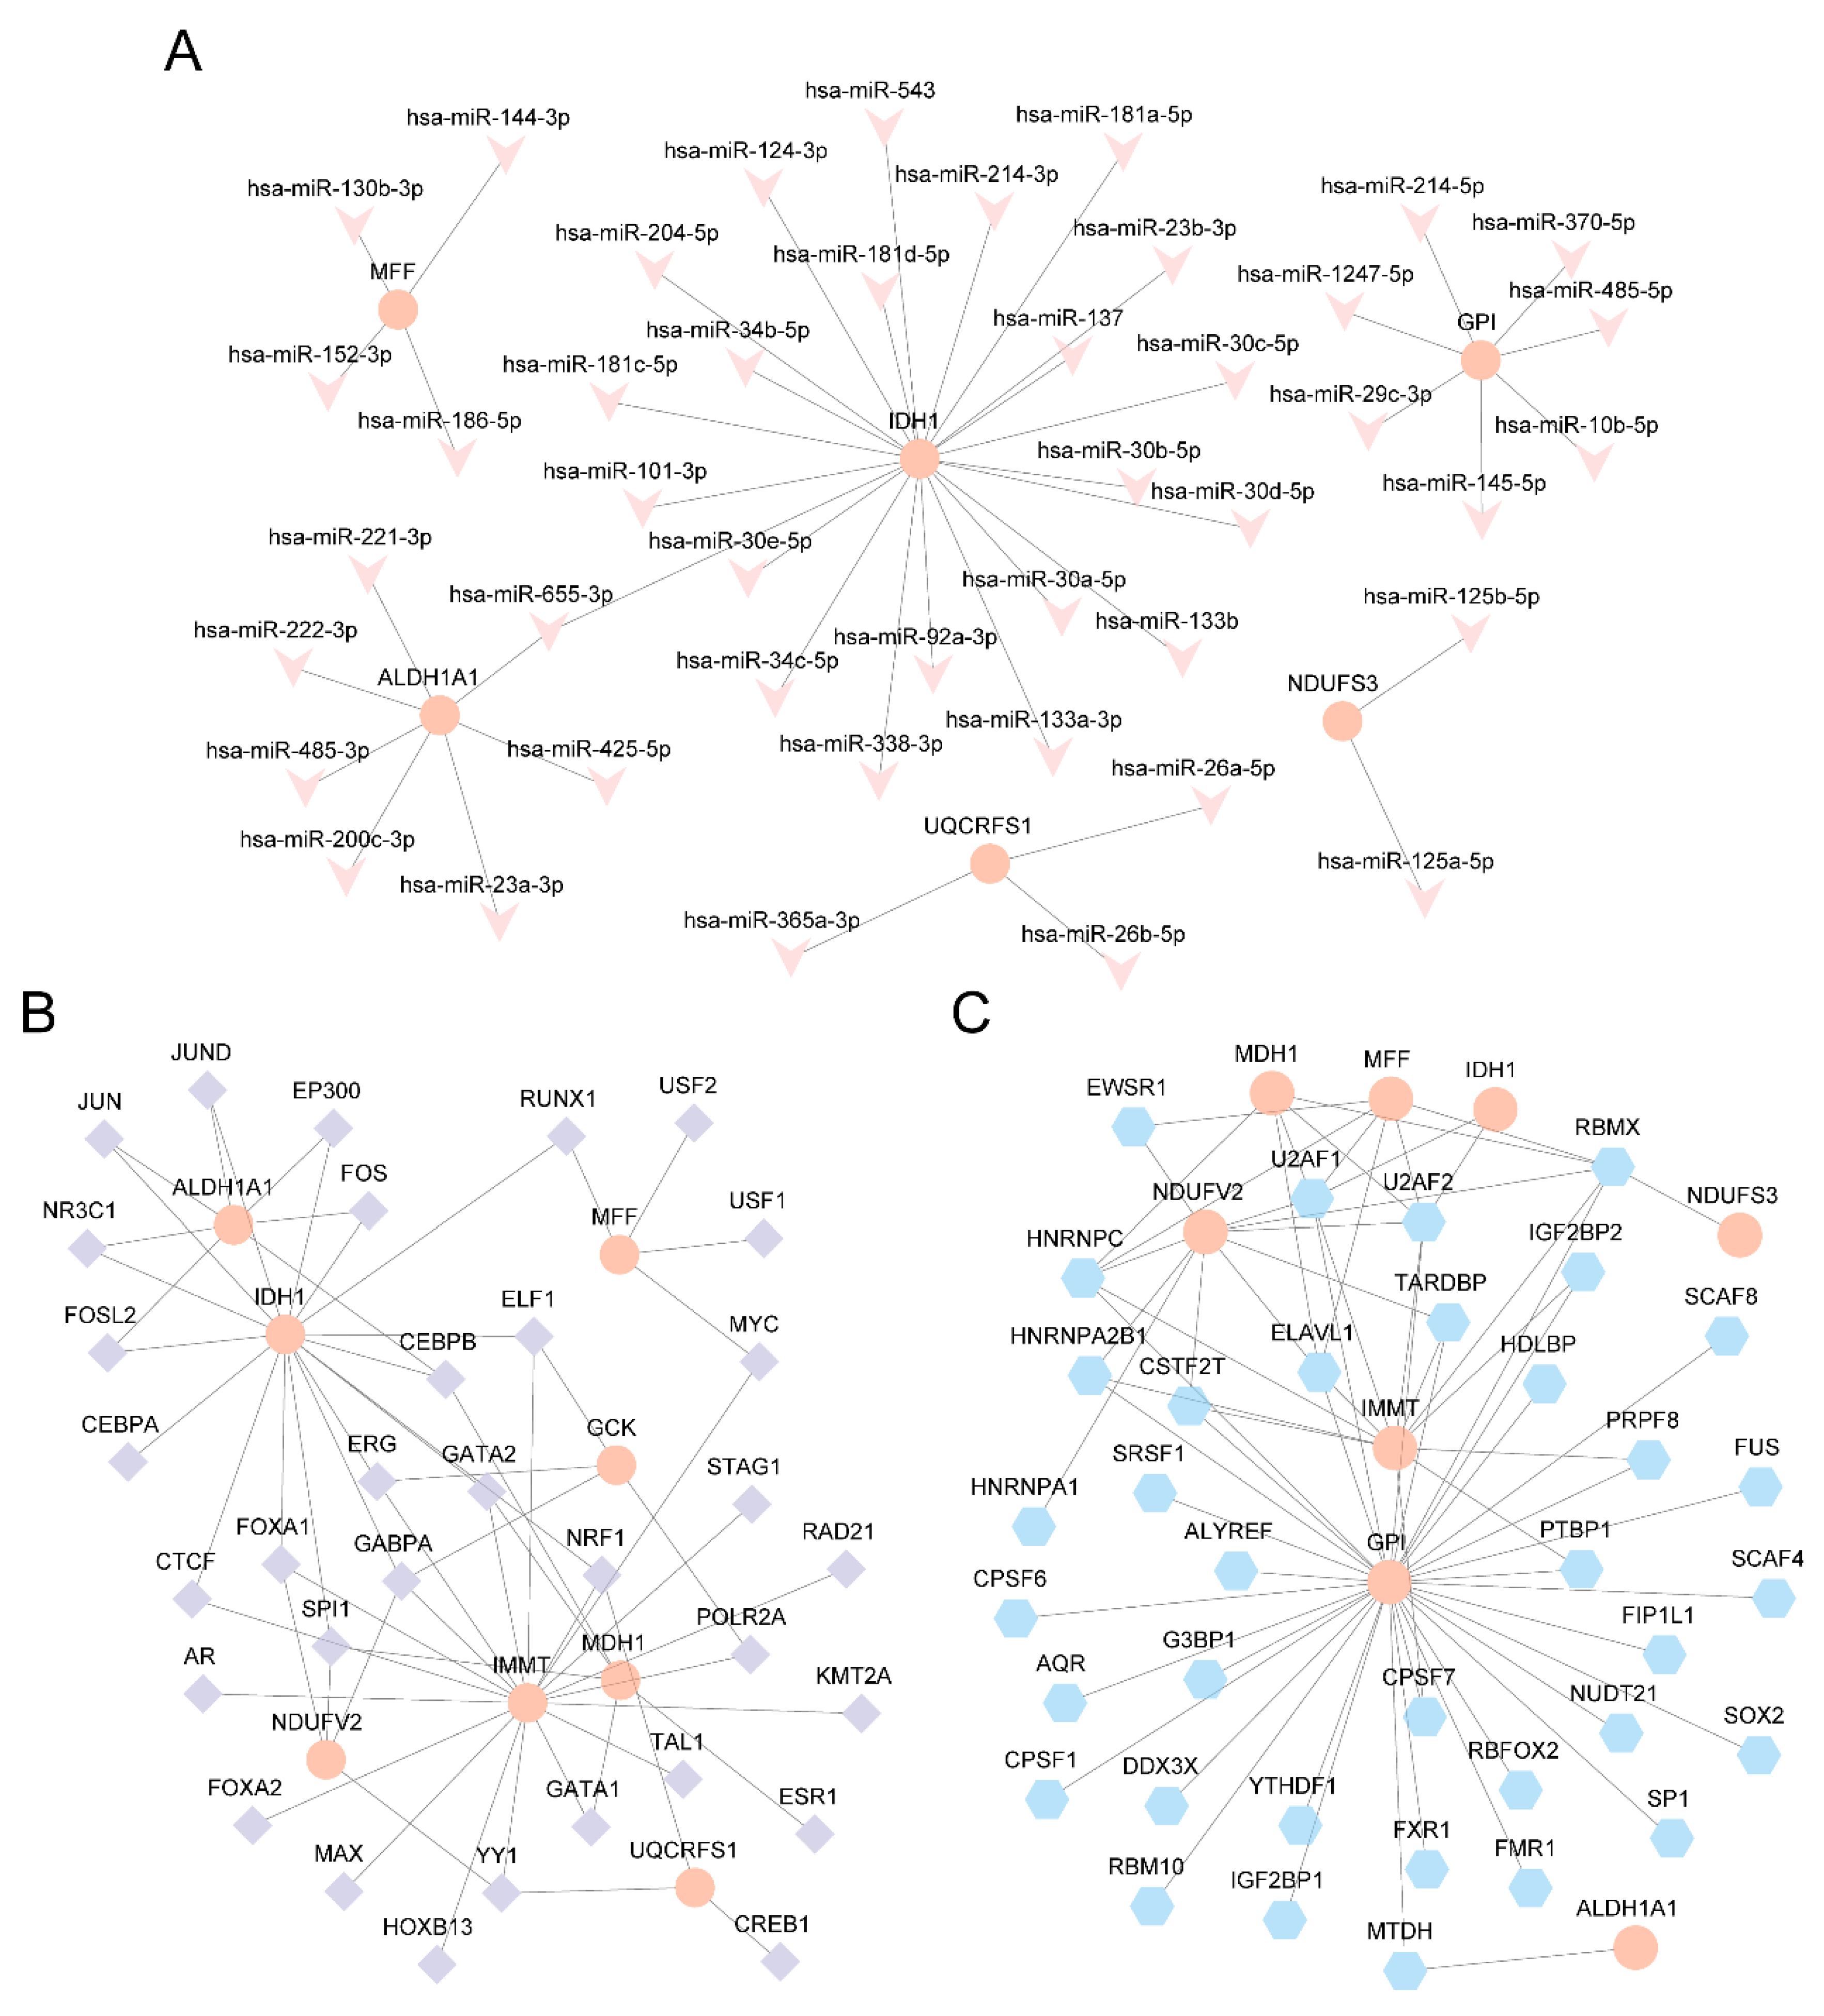
Figure 10.
Interaction network analysis of Key Genes. A. Key Genes' mRNA-miRNA Interaction Network. B. Key Genes' mRNA-TF Interaction Network. C. Key Genes' mRNA-RBP Interaction Network. TF: Transcription Factor; RBP: RNA-Binding Protein. Orange is mRNA, purple is TF, Pink is miRNA and blue is RBP.
Figure 10.
Interaction network analysis of Key Genes. A. Key Genes' mRNA-miRNA Interaction Network. B. Key Genes' mRNA-TF Interaction Network. C. Key Genes' mRNA-RBP Interaction Network. TF: Transcription Factor; RBP: RNA-Binding Protein. Orange is mRNA, purple is TF, Pink is miRNA and blue is RBP.
Table 1.
Results of GO and KEGG Enrichment Analysis for MEMRDEGs.
Table 1.
Results of GO and KEGG Enrichment Analysis for MEMRDEGs.
| ONTOLOGY |
ID |
Description |
GeneRatio |
BgRatio |
pvalue |
p.adjust |
qvalue |
| BP |
GO:0006091 |
generation of precursor metabolites and energy |
14/26 |
494/18800 |
4.5129E-16 |
3.0913E-13 |
2.247E-13 |
| BP |
GO:0015980 |
energy derivation by oxidation of organic compounds |
11/26 |
321/18800 |
1.8646E-13 |
6.3862E-11 |
4.6418E-11 |
| BP |
GO:0045333 |
cellular respiration |
10/26 |
231/18800 |
2.8864E-13 |
6.5906E-11 |
4.7904E-11 |
| BP |
GO:0046034 |
ATP metabolic process |
10/26 |
273/18800 |
1.5309E-12 |
2.6217E-10 |
1.9056E-10 |
| BP |
GO:0009060 |
aerobic respiration |
9/26 |
187/18800 |
2.1217E-12 |
2.9067E-10 |
2.1127E-10 |
| CC |
GO:0005743 |
mitochondrial inner membrane |
8/26 |
491/19594 |
1.5426E-07 |
1.3883E-06 |
6.495E-07 |
| CC |
GO:0098800 |
inner mitochondrial membrane protein complex |
7/26 |
155/19594 |
9.8092E-10 |
4.6403E-08 |
2.1709E-08 |
| CC |
GO:0098798 |
mitochondrial protein-containing complex |
7/26 |
281/19594 |
6.0318E-08 |
6.3334E-07 |
2.963E-07 |
| CC |
GO:0005759 |
mitochondrial matrix |
7/26 |
473/19594 |
2.0195E-06 |
1.5903E-05 |
7.4402E-06 |
| CC |
GO:0098803 |
respiratory chain complex |
6/26 |
91/19594 |
1.8137E-09 |
4.6403E-08 |
2.1709E-08 |
| MF |
GO:0009055 |
electron transfer activity |
5/26 |
125/18410 |
7.8129E-07 |
2.1672E-05 |
1.2377E-05 |
| MF |
GO:0016614 |
oxidoreductase activity, acting on CH-OH group of donors |
5/26 |
140/18410 |
1.3693E-06 |
2.1672E-05 |
1.2377E-05 |
| MF |
GO:0051537 |
2 iron, 2 sulfur cluster binding |
4/26 |
24/18410 |
3.2572E-08 |
3.0617E-06 |
1.7486E-06 |
| MF |
GO:0016903 |
oxidoreductase activity, acting on the aldehyde or oxo group of donors |
4/26 |
46/18410 |
4.8979E-07 |
2.1672E-05 |
1.2377E-05 |
| MF |
GO:0051536 |
iron-sulfur cluster binding |
4/26 |
67/18410 |
2.2548E-06 |
2.6493E-05 |
1.5131E-05 |
| KEGG |
hsa05208 |
Chemical carcinogenesis - reactive oxygen species |
7/20 |
223/8164 |
5.9144E-07 |
9.6109E-06 |
4.8249E-06 |
| KEGG |
hsa00010 |
Glycolysis / Gluconeogenesis |
6/20 |
67/8164 |
8.6123E-09 |
5.598E-07 |
2.8103E-07 |
| KEGG |
hsa01200 |
Carbon metabolism |
6/20 |
115/8164 |
2.2616E-07 |
7.3501E-06 |
3.6899E-06 |
| KEGG |
hsa00190 |
Oxidative phosphorylation |
6/20 |
134/8164 |
5.6088E-07 |
9.6109E-06 |
4.8249E-06 |
| KEGG |
hsa04932 |
Non-alcoholic fatty liver disease |
6/20 |
155/8164 |
1.3226E-06 |
1.7194E-05 |
8.6316E-06 |
Table 2.
Results of GSEA for GSE58331.
Table 2.
Results of GSEA for GSE58331.
| ID |
setSize |
enrichmentScore |
NES |
pvalue |
p.adjust |
qvalue |
| REACTOME_FATTY_ACIDS |
14 |
0.67142152 |
1.95098985 |
0.00148696 |
0.01380593 |
0.01019448 |
| WP_OVERVIEW_OF_PROINFLAMMATORY_AND_PROFIBROTIC_MEDIATORS |
117 |
0.4102937 |
1.94596727 |
5.6869E-06 |
0.00019312 |
0.0001426 |
| KEGG_DILATED_CARDIOMYOPATHY |
88 |
0.41831241 |
1.8933955 |
6.9883E-05 |
0.0013069 |
0.00096503 |
| REACTOME_ADORA2B_MEDIATED_ANTI_INFLAMMATORY_CYTOKINES_PRODUCTION |
127 |
0.37030597 |
1.78255692 |
0.00012253 |
0.00202508 |
0.00149534 |
Table 3.
Results of GSEA (Low/High) for GSE58331.
Table 3.
Results of GSEA (Low/High) for GSE58331.
| ID |
setSize |
enrichmentScore |
NES |
pvalue |
p.adjust |
qvalue |
| REACTOME_ACTIVATION_OF_THE_TFAP2_AP_2_FAMILY_OF_TRANSCRIPTION_FACTORS |
12 |
0.84970469 |
1.98625648 |
9.7375E-05 |
0.00524769 |
0.00449219 |
| REACTOME_NEGATIVE_REGULATION_OF_ACTIVITY_OF_TFAP2_AP_2_FAMILY_TRANSCRIPTION_FACTORS |
10 |
0.81338831 |
1.8275564 |
0.00231583 |
0.04332249 |
0.03708547 |
| REACTOME_SIGNALING_BY_INTERLEUKINS |
441 |
-0.29000623 |
-1.35894345 |
0.00107874 |
0.02751538 |
0.02355407 |
| WP_IL18_SIGNALING_PATHWAY |
259 |
-0.33916019 |
-1.50256587 |
0.00033336 |
0.0133291 |
0.01141015 |