1. Introduction
When developing new materials, the preliminary tests to determine some of their properties are usually destructive (e.g. tensile tests). To perform such tests, suitable machines and instruments are required, as well as a data acquisition system that provides the stress-strain curve for the tested sample. These tensile testing machines are usually specially designed for this type of test and are expensive.
Most structures in the field of engineering consist of components such as beams, slabs and shells. The beam in particular has the characteristic of having a large ratio between its length and its lateral dimensions and is subjected to longitudinal and transverse forces along its length. In addition, the generated moment tends to rotate the element about an axis perpendicular to its length [
1].
The unknown variables depend only on the position of the beam axis and its structural behavior is defined by the well-known beam theories described in textbooks on mechanical structures, which form the basis for more modern analyses of beams and many other structural members. In the case of small deflections, beam theories are divided into two main groups. The first ignores shear deformations, while the second takes this effect into account [
1].
In [
2,
3], the authors found that the stress–strain relationship of linear viscoelastic materials is characterized by a complex-valued, frequency-dependent elastic modulus E(jω) (Young’s modulus), and they used system identification techniques to show how E(jω) can be accurately measured in a wide frequency band from forced bending (transverse) and longitudinal vibration experiments on a beam under free– boundary conditions. According to the authors, the advantage of the proposed method is that it includes the disturbing noises and the nonlinear distortions
In [
4] the authors show a numerical method to identify the elastic modulus of linear elastic coated materials. The identification is based on an inverse analysis where the minimization of a cost functional is performed by a gradient degression algorithm. The main result is the calculation of the gradient of the cost function using a direct differentiation technique. The validity and clarity of this approach is demonstrated by the authors using several numerical examples.
Some material properties can be determined by their identification without the need for destructive test or a special device for this purpose.
Image processing using a genetic algorithm is not only used in engineering [
5]–[
8] but also in various fields of knowledge to determine the elastic modulus. In medicine, [
9] determines the relationship between the EI (emissivity and moment of inertia) and the elastic modulus of muscle after ankle fracture surgery, [
10] simulates the microenvironment of cancer cells to determine their mechanical properties. In agriculture, [
11] analyzes RGB images with ImageJ to investigate the effect of compression on the quality degradation of spinach leaves during storage, [
12] uses the same method to verify the composition of natural date palm fibers for use as reinforcement in composite materials, and [
13] proposes a method to determine Poisson’s ratio and elastic modulus by combining image processing and mechanical compression. In the field of biology, [
14] investigates the basic micromechanical properties of porous coral reef limestone using image processing and transport modeling.
In this paper, a methodology to determine the elastic modulus of materials using the Genetic Algorithm method is proposed, which optimizes the error between the experimental curvature of a beam and its analytical model. Preliminary results showed that the comparison between the analytical and the experimental model leads to a value that is very close to the real modulus of elasticity of the material.
2. Deflections in Cantilevered Beams
The deflections of a cantilever beam with a concentrated vertical force at the free end are a well-known problem in the theory of elasticity [
15,
16] and in the elementary mechanics of material [
17].
The Feynmann Lectures on Physics [
18] deals with the problem of deflection of a beam that is built up at one end and loaded with a concentrated vertical force at the other end, taking into account small deflections. In this literature, a formula for the vertical deflection of the free end of the cantilever beam is presented, showing a proportionality relationship between this deflection and the applied external force [
19,
20].
Landau’s book on elasticity [
21], deals with large deflections in cantilever beams of elastic material and Bisshopp and Drucke [
22] discuss solutions in terms of elliptic integrals.
This study deal with a cantilever beam with a vertical force concentrated at the free end. This system is often studied to approximate small deflections as it is possible to find a simple analytical solution to the problem [
19]. When large deflections are considered, the solution of the elastic equation is given in terms of elliptic integrals [
23].
Simply supported beams can be accurately modeled by the Euler-Bernoulli theory if linear conditions are guaranteed and shear effects are negligible. However, the Timoshenko-Ehrenfest theory is excellent for capturing shear effects in beams with a relevant vertical dimension, as it takes into account the rotation of the cross-section with respect to the neutral plane [
24].
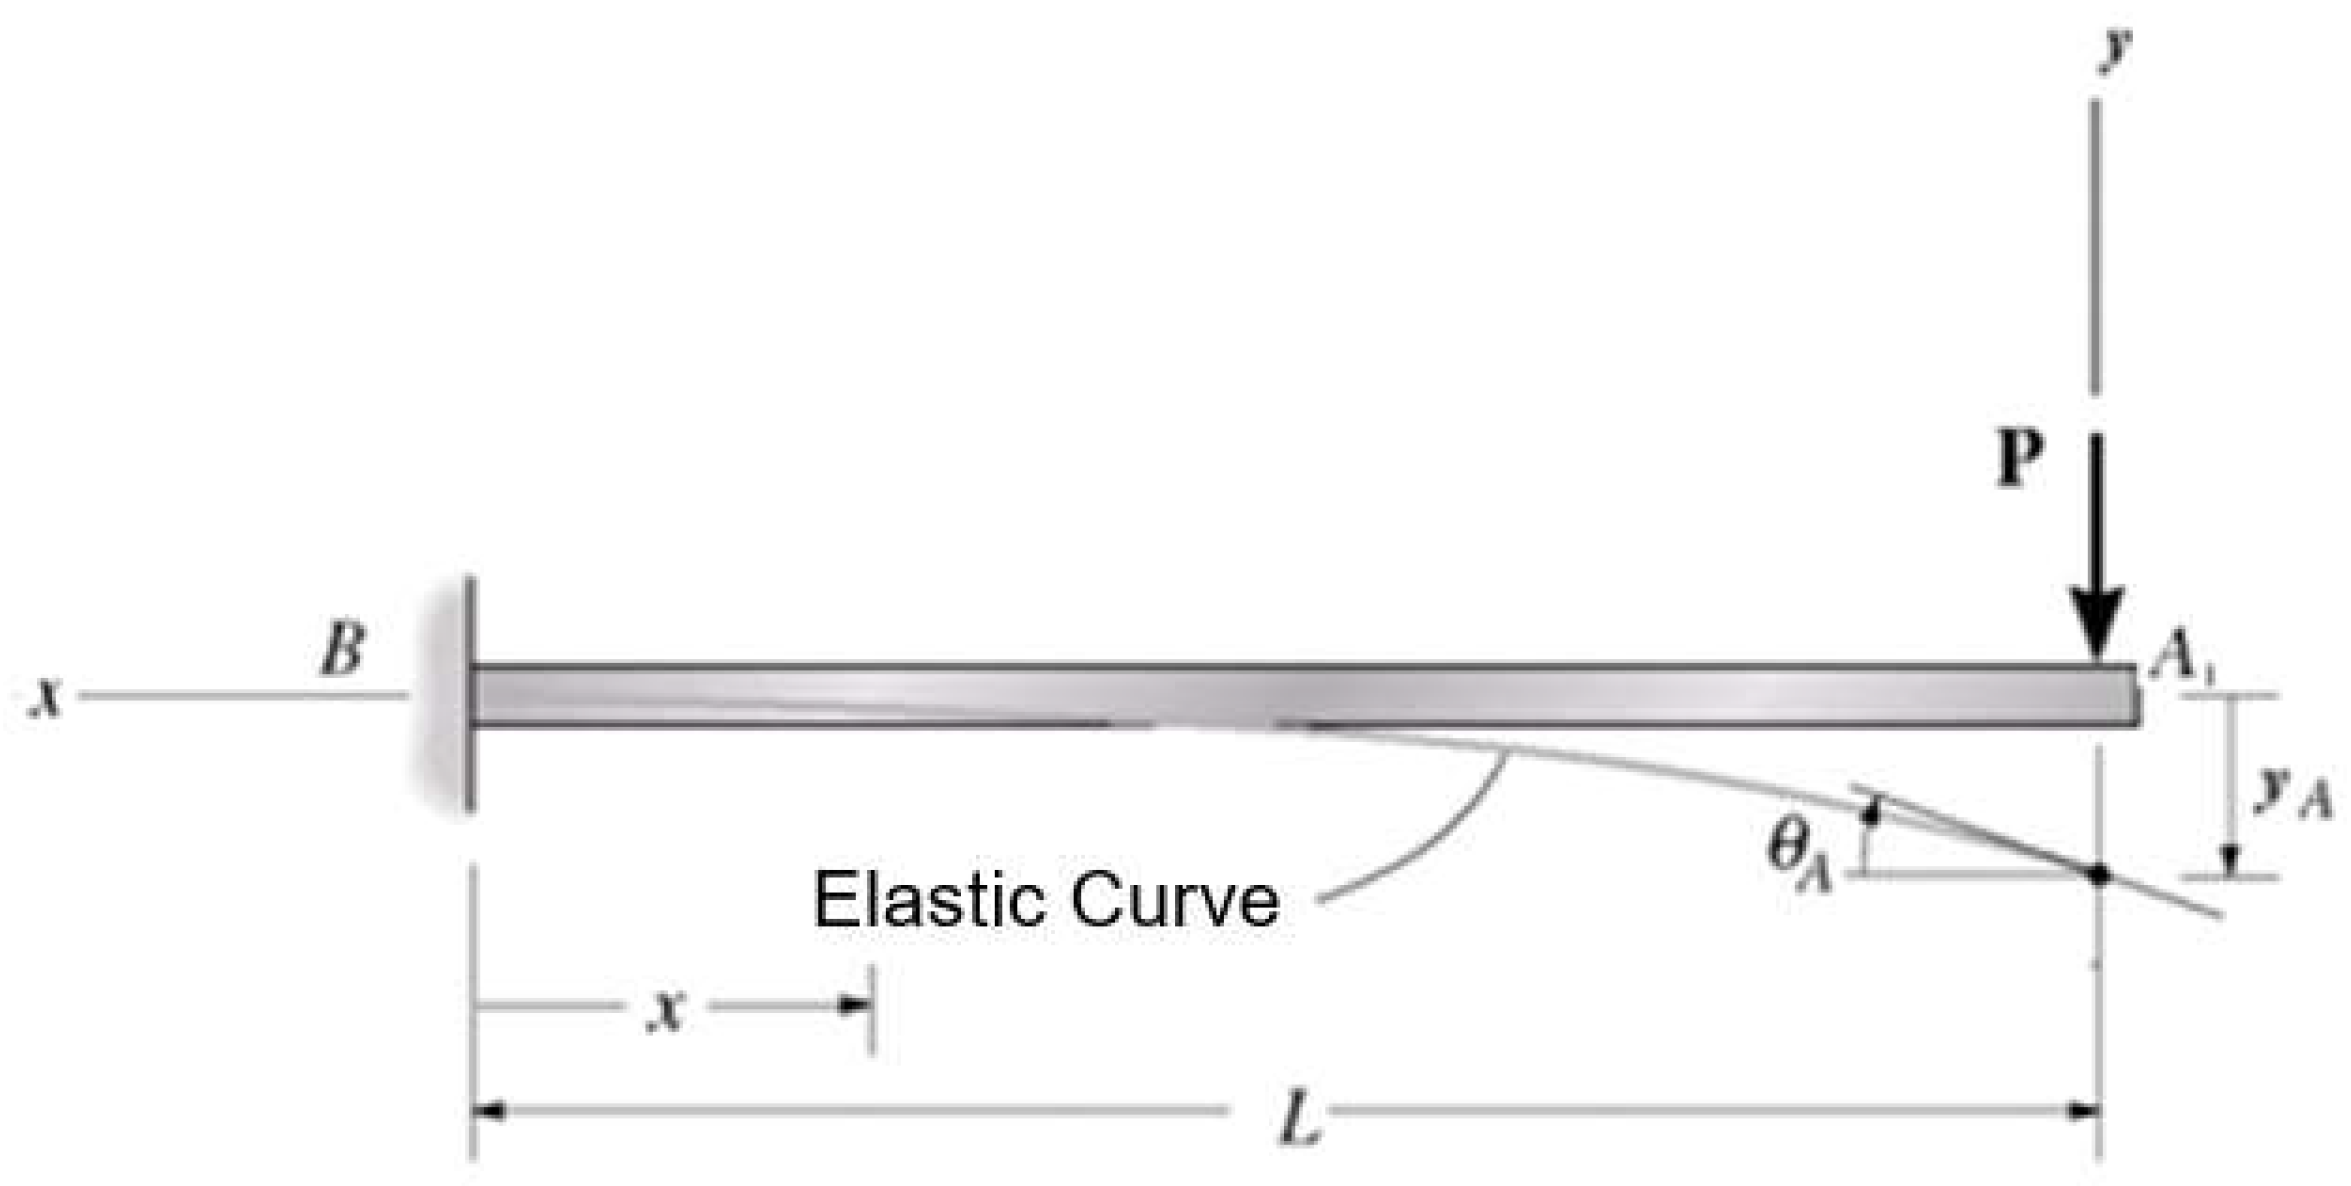
For a fixed beam, as shown in the figure below, we can write the equation for the bending moment as a function of the length of the beam as follows:
Figure 1.
- Cantilever beam.
Figure 1.
- Cantilever beam.
Using the relationship [
1]:
The equation for the curvature of the beam is obtained by double integration of the previous equation as follows:
Equation (3) is the analytical equation of the elastic line of a cantilever beam with a known force (P) acting on its end.
3. Genetic Algorithms (GA)
The genetic algorithm method (GAM) is a modern computer technique widely used in various fields of engineering and science. This method was originally based on some ideas from the biological theory of evolution. GA starts with a large population of possible solutions, which are then selected as parents and used to produce offspring for the next generation. The best solutions are retained and recombined, with crosses and mutations creating new solutions in each generation. By iterating over many generations, the population of solutions evolves towards an optimal result [
25] .
Genetic algorithms are more stable in the sense that they can always converge to a solution, even if it is not optimal. Constraints are imposed on the solutions with the help of penalty functions, which correspond to regulatory stabilizers or preconditioners in the deterministic framework, i.e. situations in which a good solution is sufficient but not necessarily the best one [
26].
Even with this approach, where the answer is not necessarily optimal, it is important to have a procedure for assessing the quality of a solution. This process is necessary to eliminate some solutions and accept others. In recent years, GAM has been used with increasing success in various fields of science, for example in sociology, civil engineering, artificial intelligence and many other areas [
27].
The Genetic Algorithm has a number of advantages: It can find solutions in cases where there are multiple local optima or where the data used for the fit is in a very large parameter range, and it will still converge to a fit with the minimum global error. If the global minimum is not included in the specified initial values, GA will find a local minimum given the imposed constraints. Therefore, it is still necessary to choose the initial parameters and the boundaries of the search space carefully [
25].
In practice, GA models are often tested individually until a satisfactory fit is achieved. This process is time-consuming, costly and difficult to repeat as it depends on the subjective decisions of the engineer [
25].
For the actual reconstruction of the stiffness of realistic beam and frame structures with tens or even hundreds of degrees of freedom, the minimization problem can be a very difficult numerical task to solve with classical optimization methods. GA has evolved significantly and coincided with the considerable increase in computer power, so the best answer is chosen for the final solution [
28].
3. Image Processing
In recent years, techniques have been developed in the field of industrial automation that make use of computer vision [
29,
30]. Computer vision technology is based on the theory of image processing to replace the human eye and to identify and recognise objects without contact. The principle of this technology is based on segmenting the target image, extracting the important features for analysis and then comparing the results with the standard requirements in a set of criteria so that it can be verified whether the measured target meets the specified standard [
31].
This technique has been developed for various applications, but its use must be verified for each analytical application. In order to detect product marks with non-fixed patterns, the operating parameters must be adjusted according to the different working conditions using image processing algorithms [
32].
For monitoring the structural health of a project, the integration of image processing techniques represents a significant development in the way the integrity of a project can be perceived, assessed and maintained [
33].
The template matching algorithm is achieved by calculating the similarity between the template and the image. This technique is often used in industrial image analysis applications [
34,
35]. As long as the model is accurate enough, i.e. has a high resolution, the results of the analysis are accurate and reliable enough to be used [
32].
The image processor used in this study is ImageJ. ImageJ is a public domain Java image processing and analysis program based on NIH Image for Macintosh. The source code is freely available. It can calculate area and pixel value statistics of user-defined selections as well as measure distances and angles, create density histograms and line profile graphs. ImageJ also supports standard image processing functions such as contrast manipulation, sharpening, smoothing, edge detection and median filtering [
36] .
Because it is open source software, an ImageJ user has the four essential freedoms defined by Richard Stallman in 1986: 1) The freedom to run the program for any purpose; 2) The freedom to study how the program works and modify it to do what you want; 3) The freedom to share copies so you can help your neighbor; 4) The freedom to improve the program and publish your improvements so that the entire community benefits [
36].
4. Materials and Methods
4.1–. Image Processing
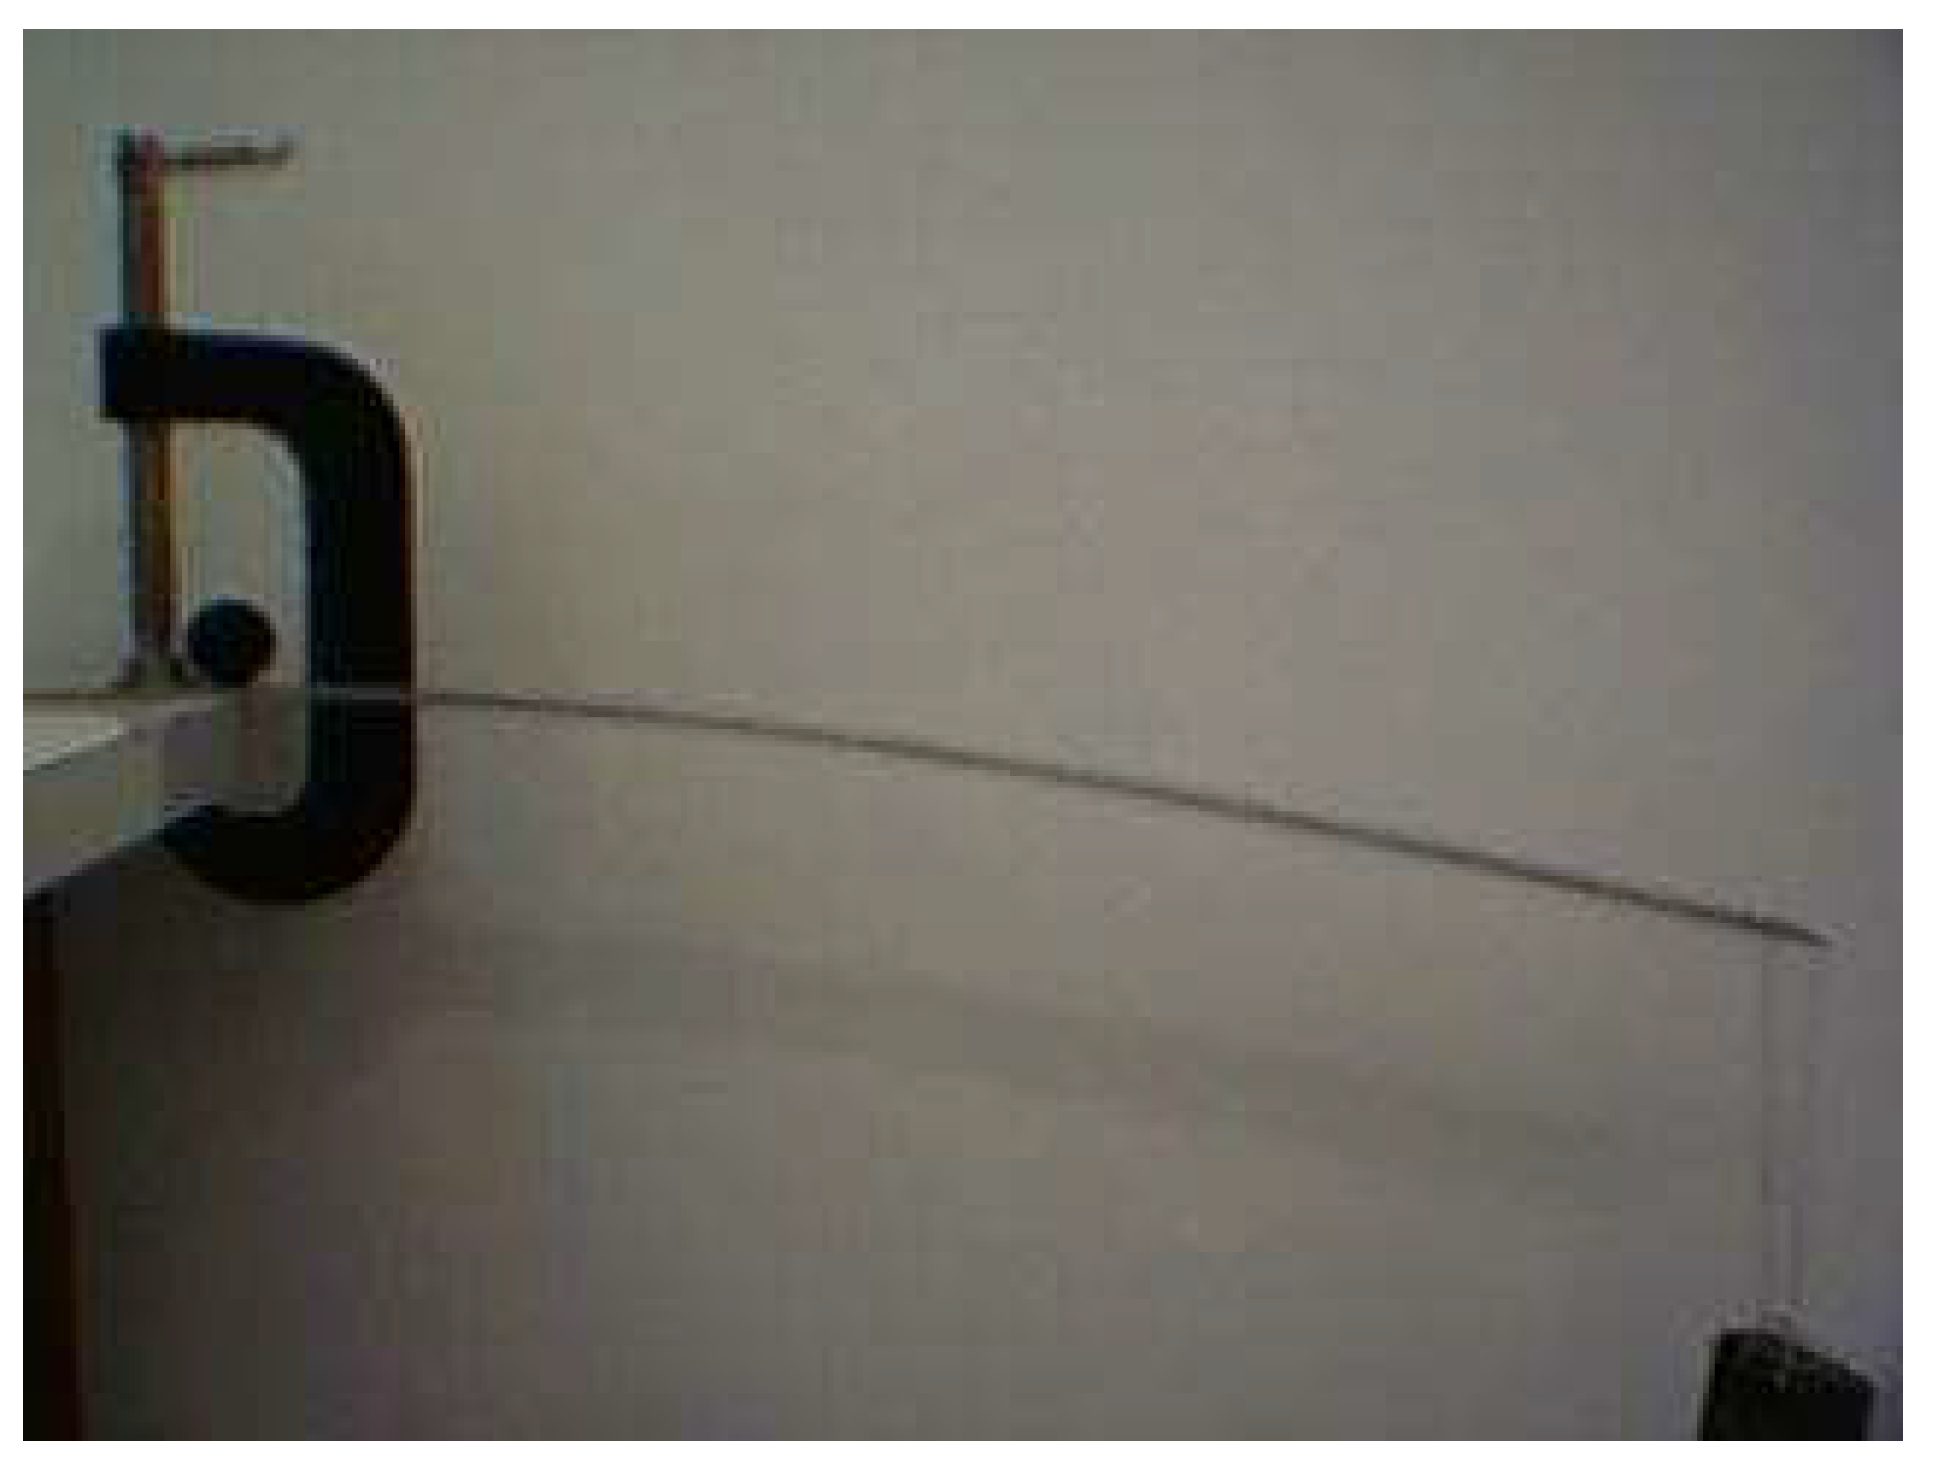
In this work, digital image processing was used as a tool to experimentally determine the elastic curve of a cantilever beam with a known load at its free end, as shown in
Figure 2. The properties and parameters of the beam are listed in
Table 1.
The ImageJ program was used for data reduction. ImageJ is a widely used open source image processing program that is particularly useful in engineering for the analysis and quantification of image-based data. It supports various file formats and provides tools for tasks such as edge detection, particle analysis and intensity measurements, making it ideal for processing visual data from experiments. In the context of data acquisition, ImageJ can be used to extract precise measurements from images or video frames, such as object dimensions, motion tracking or surface feature analysis, which are crucial for validating engineering models or evaluating material properties. Its extensibility through macros and plugins also enables customization for specific engineering applications and ensures efficiency and repeatability when processing large data sets. It is also free of charge and available on the Internet.
Figure 2.
- Experiment set up in the laboratory.
Figure 2.
- Experiment set up in the laboratory.
2.2. Identification of the beam’s Young’s modulus
The determination of the modulus of elasticity of a material requires a destructive test (tensile test) to obtain it. In this paper, it is proposed to determine the modulus of elasticity of a simply clamped beam by comparing the experimental model of the elastic line of the beam with the analytical model. For this purpose, the experimental data obtained in the previous section and the analytical model of the beam given by equation (3) were used. For the identification process, an optimization function (equation 4) was created that calculates the inverse of the difference between the models, experimental and analytic. This function was optimized using the genetic algorithm technique.
2.3. Genetic Algorithms
Genetic algorithms are a popular form of evolutionary computation. Optimization problems can be divided into three main phases: Problem encoding, determination of the objective function to be optimized, and the associated solution space. An optimization problem can be understood as a black box with multiple buttons, where each button represents a parameter of the problem and an output, which is the value of the objective function that indicates whether a particular set of parameters gives a good result for solving the problem.
In this work, a binary representation was used for the elastic modulus of the beam. In addition, the population size was set to 400 individuals, the population mutation rate to 0.01, the population crossover rate to 0.25 and 10 generations. The parameters used in the genetic algorithm have the values shown in
Table 2.
The inverse square error was used to evaluate the performance of each phenotype and is defined in equation (4). The genetic algorithms were implemented using Octave® software. They were applied using subroutines that implement each task involved in the solution separately.
4. Results
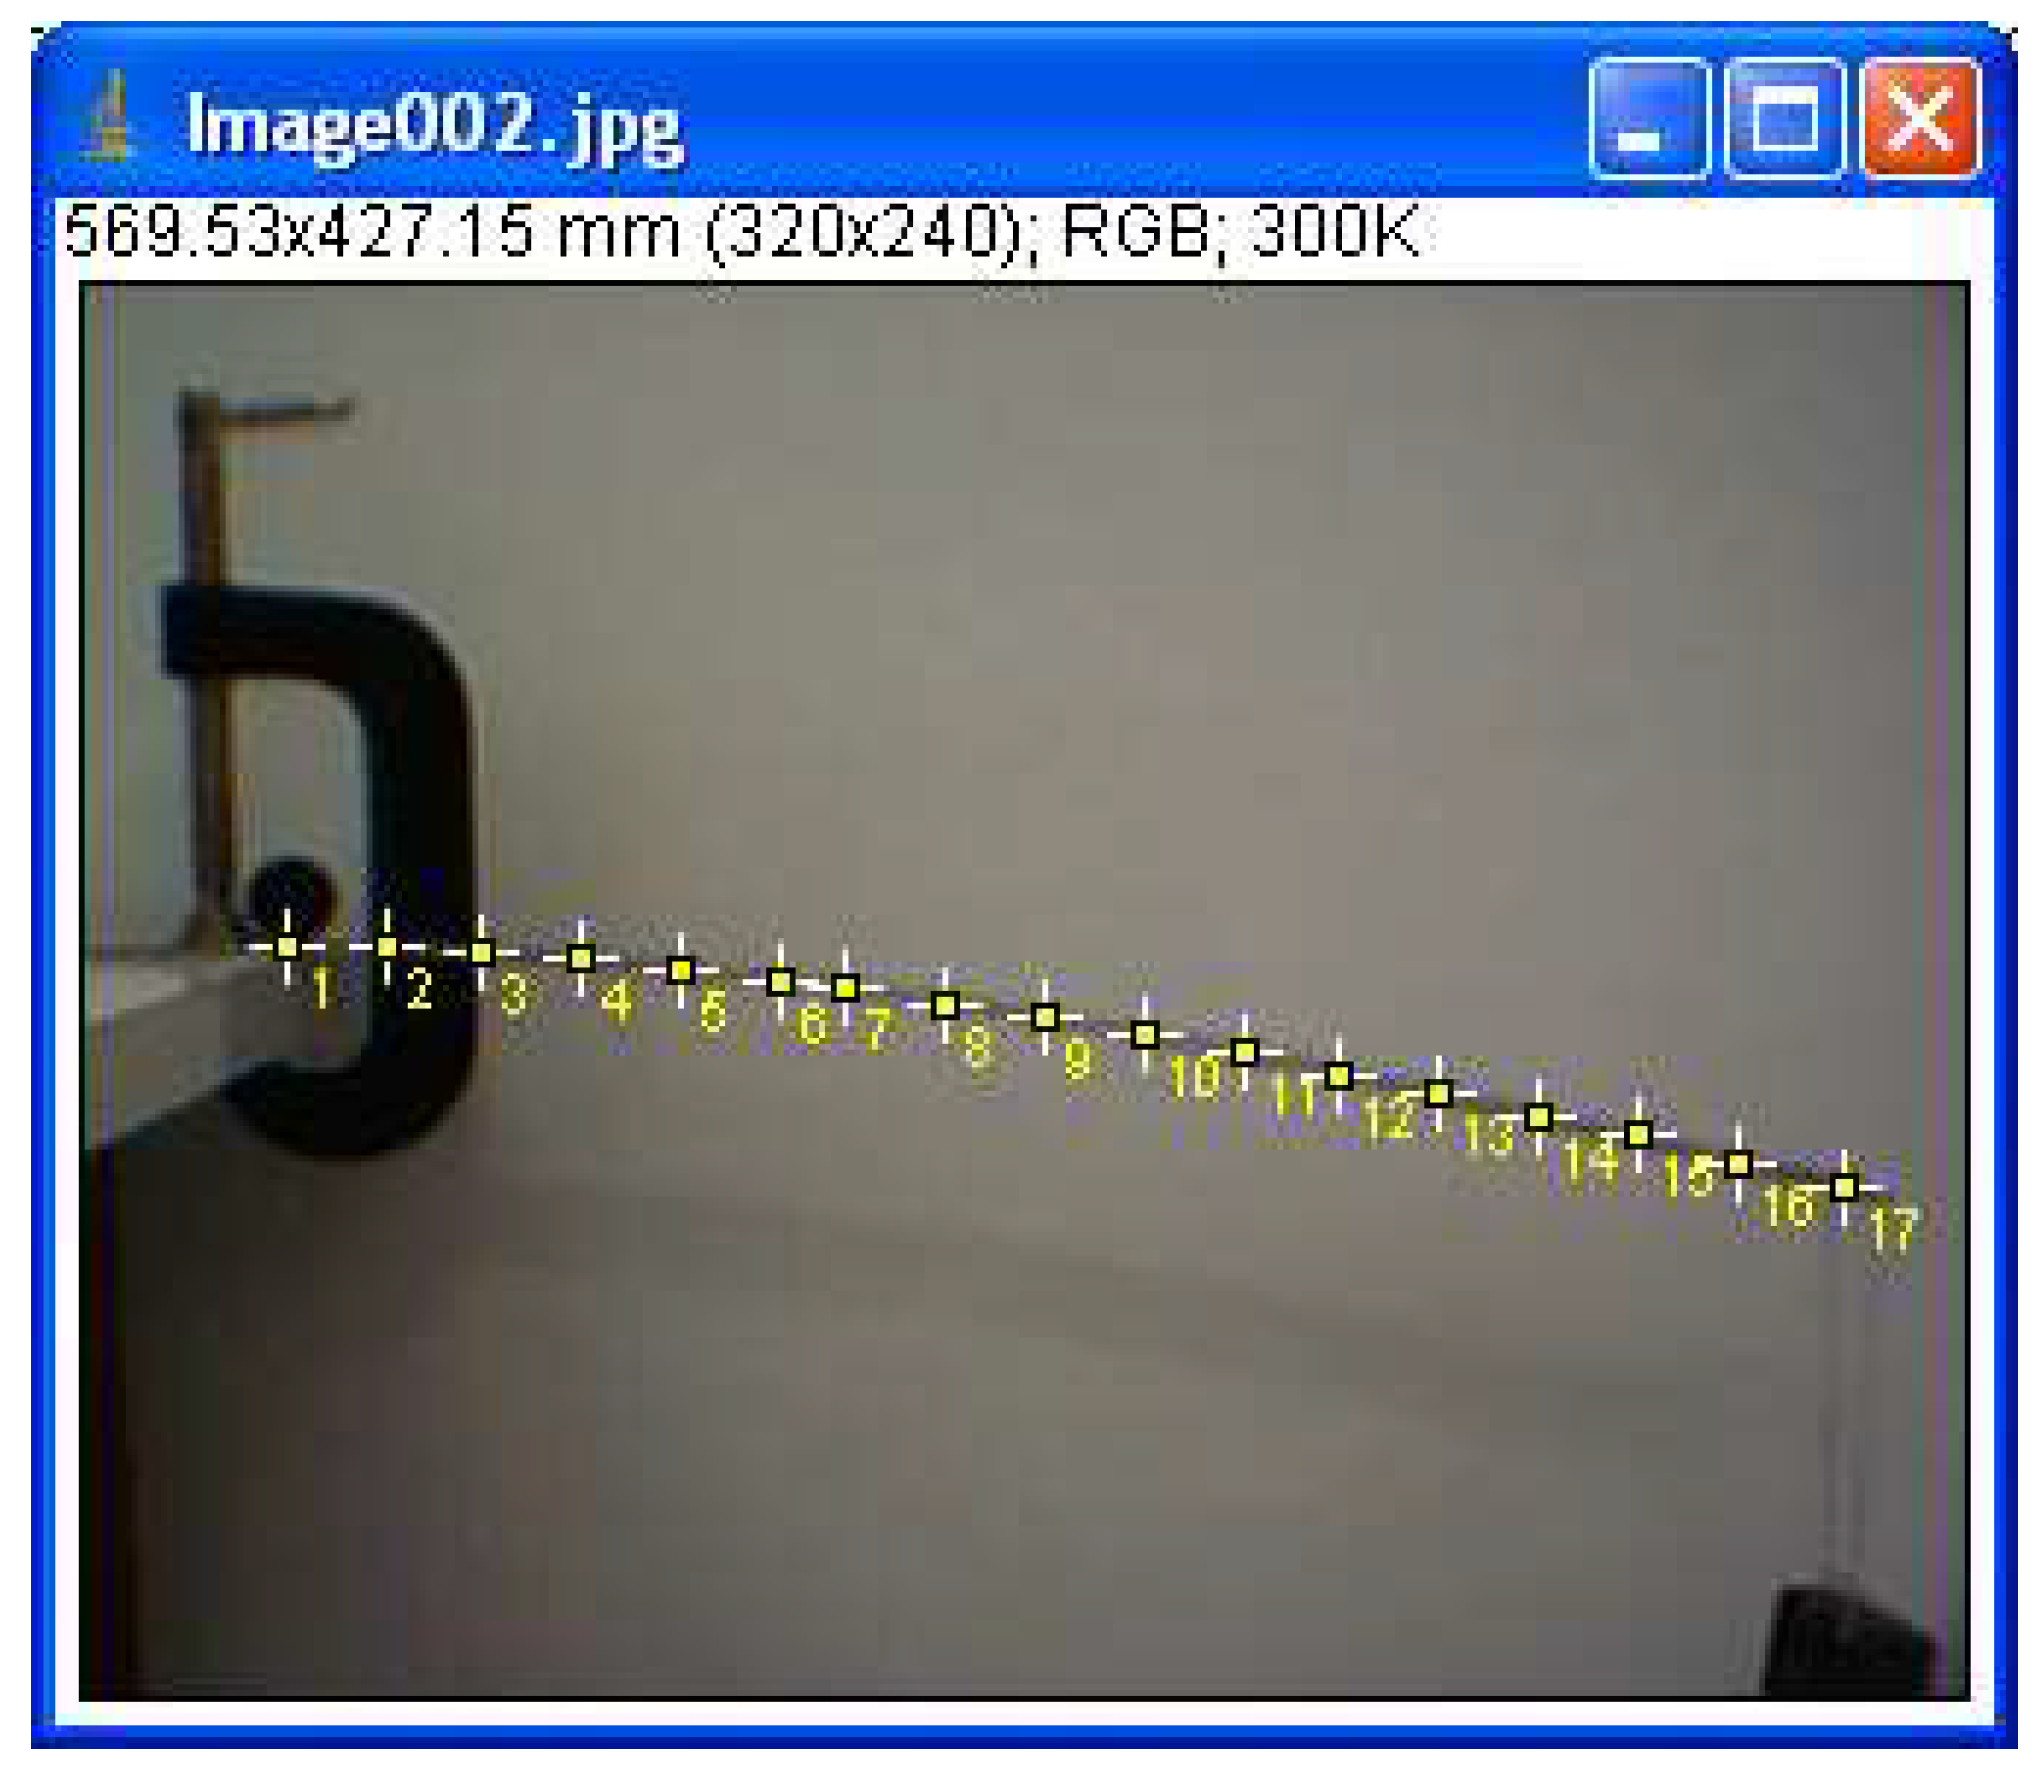
Using the image processing program, the image was calibrated using the sphere, which is located on the bar in the upper left corner of the image in
Figure 2 and has a diameter of 26.4 mm, as a reference. Then points (Fig. 3) were marked along the bar (selecting the tool
points in ImageJ) and the data obtained from ImageJ was exported to a file in ASCII format.
Figure 3.
- Marking points in the image to obtain experimental data.
Figure 3.
- Marking points in the image to obtain experimental data.
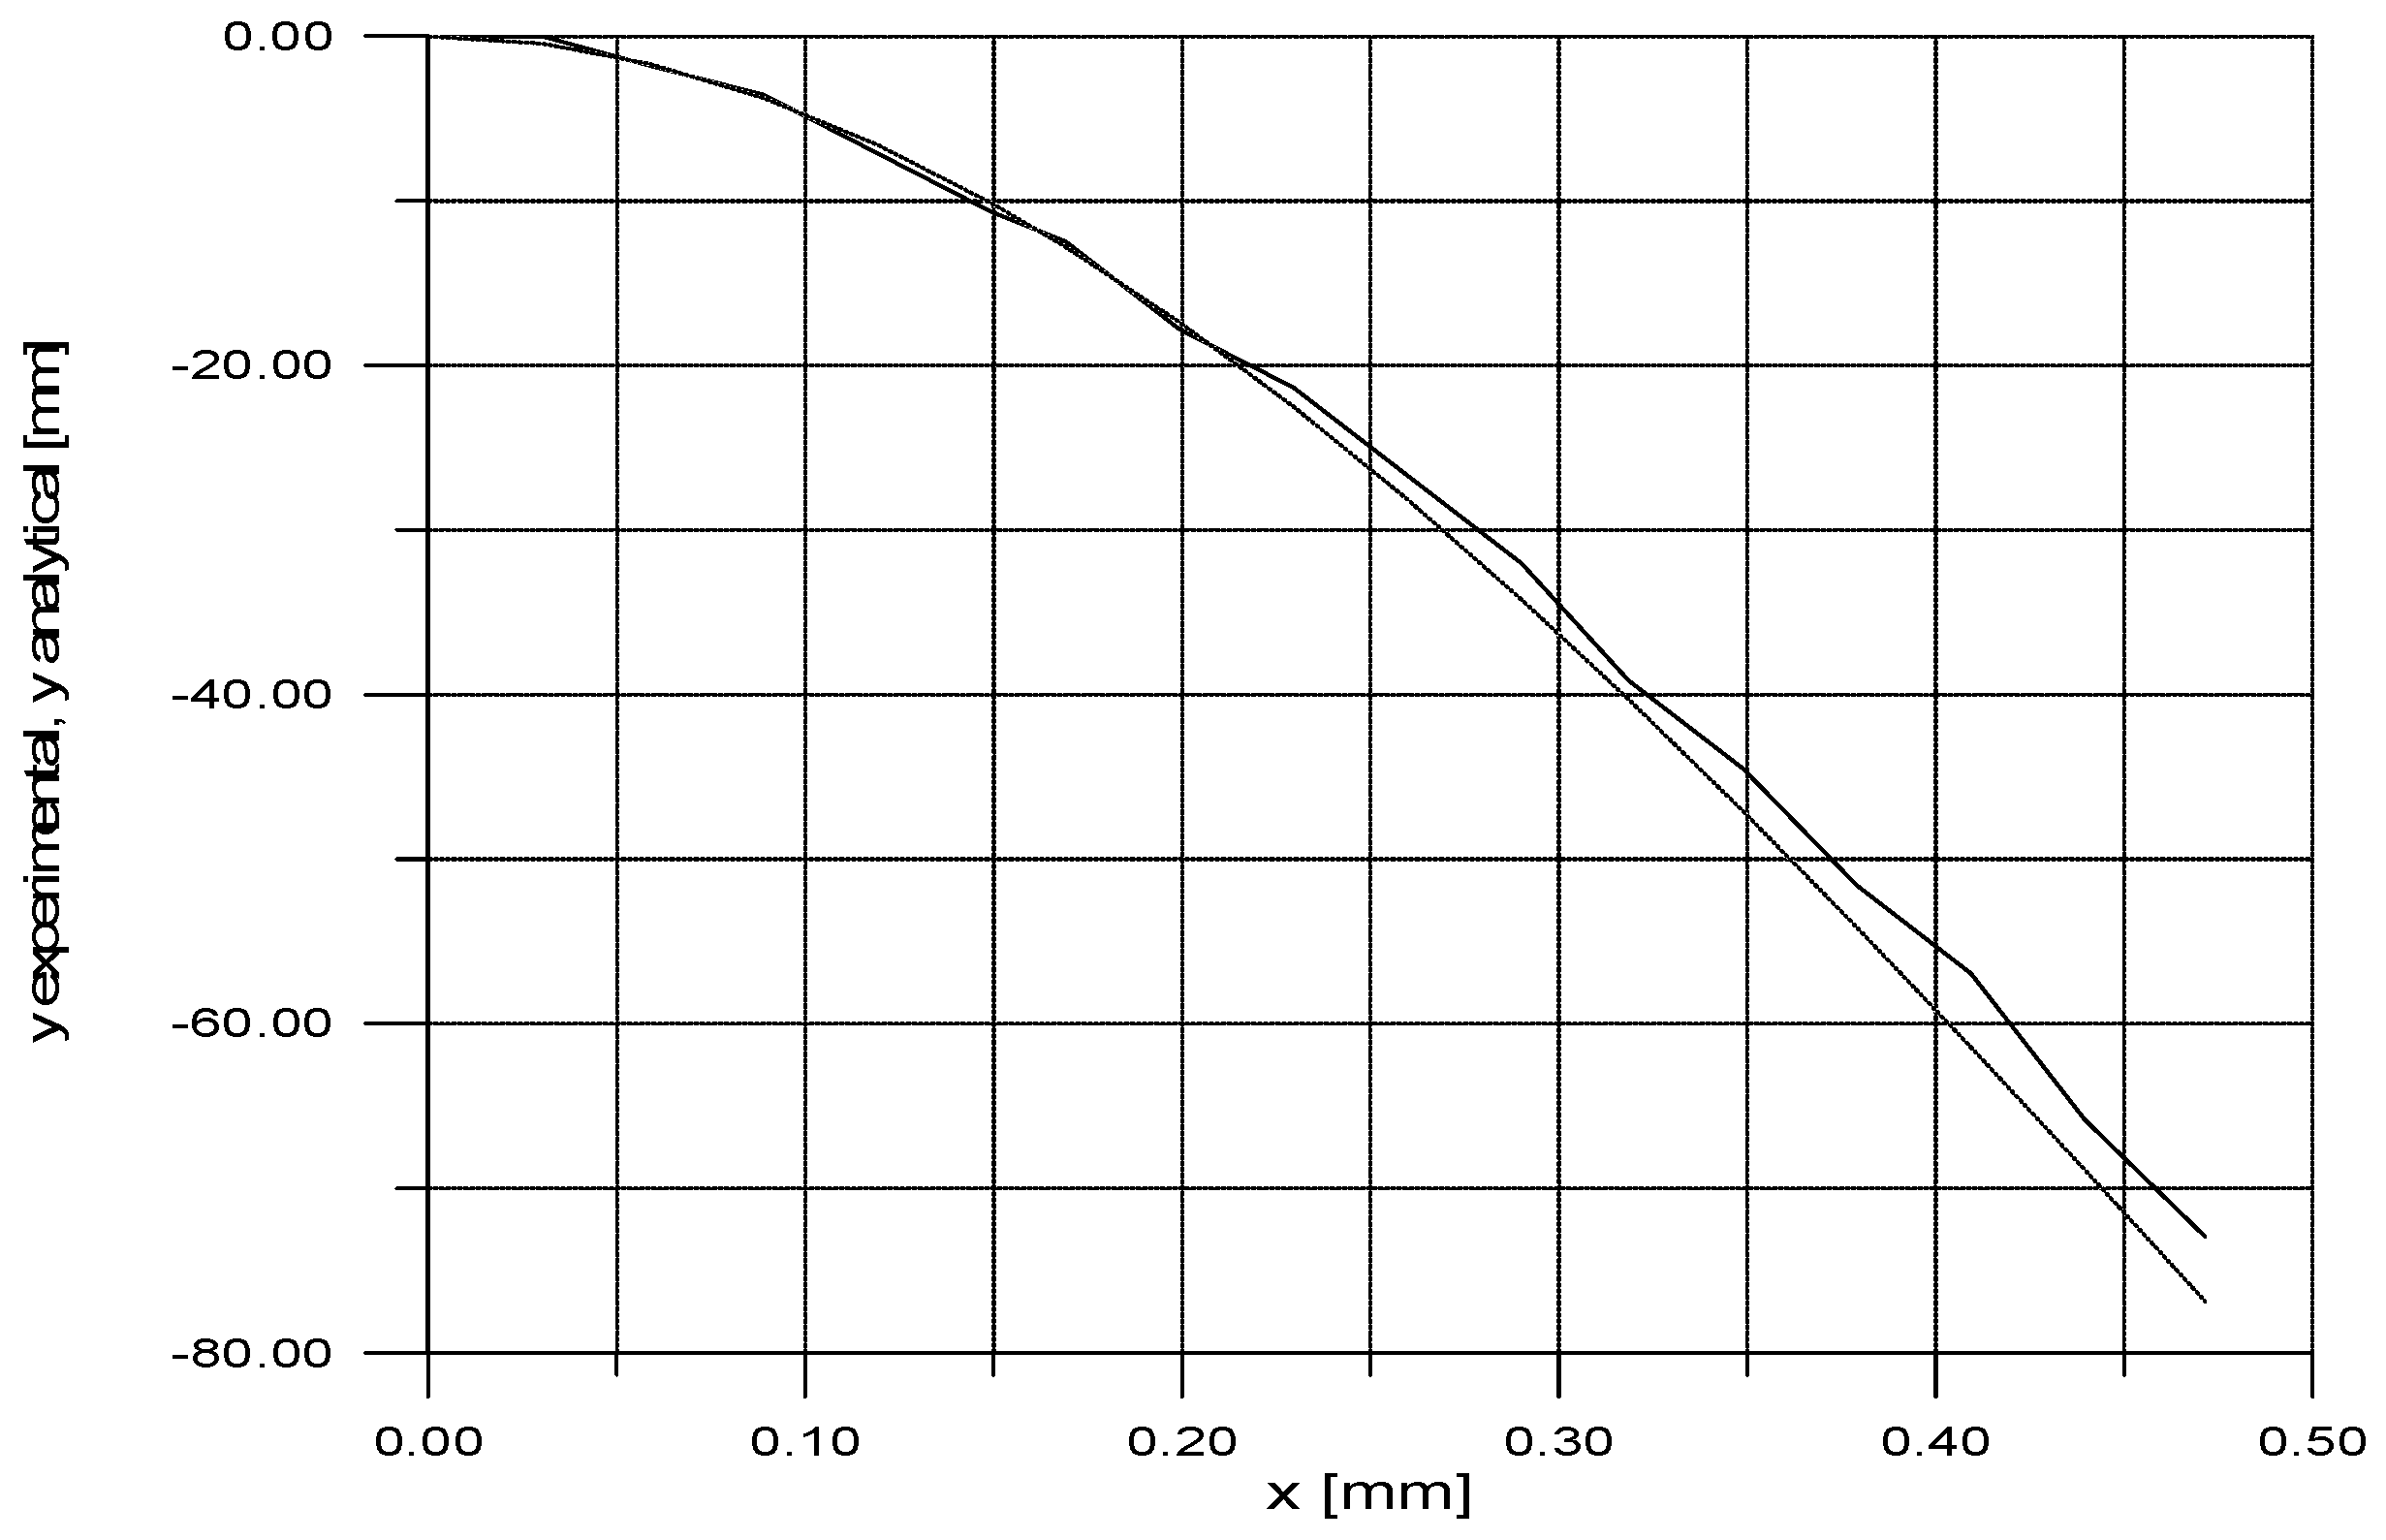
After this procedure, the graph of the experimental elastic line was obtained, which was already calibrated with the sizes in millimeters.
Figure 4 shows a comparison between the analytical and experimental curves.
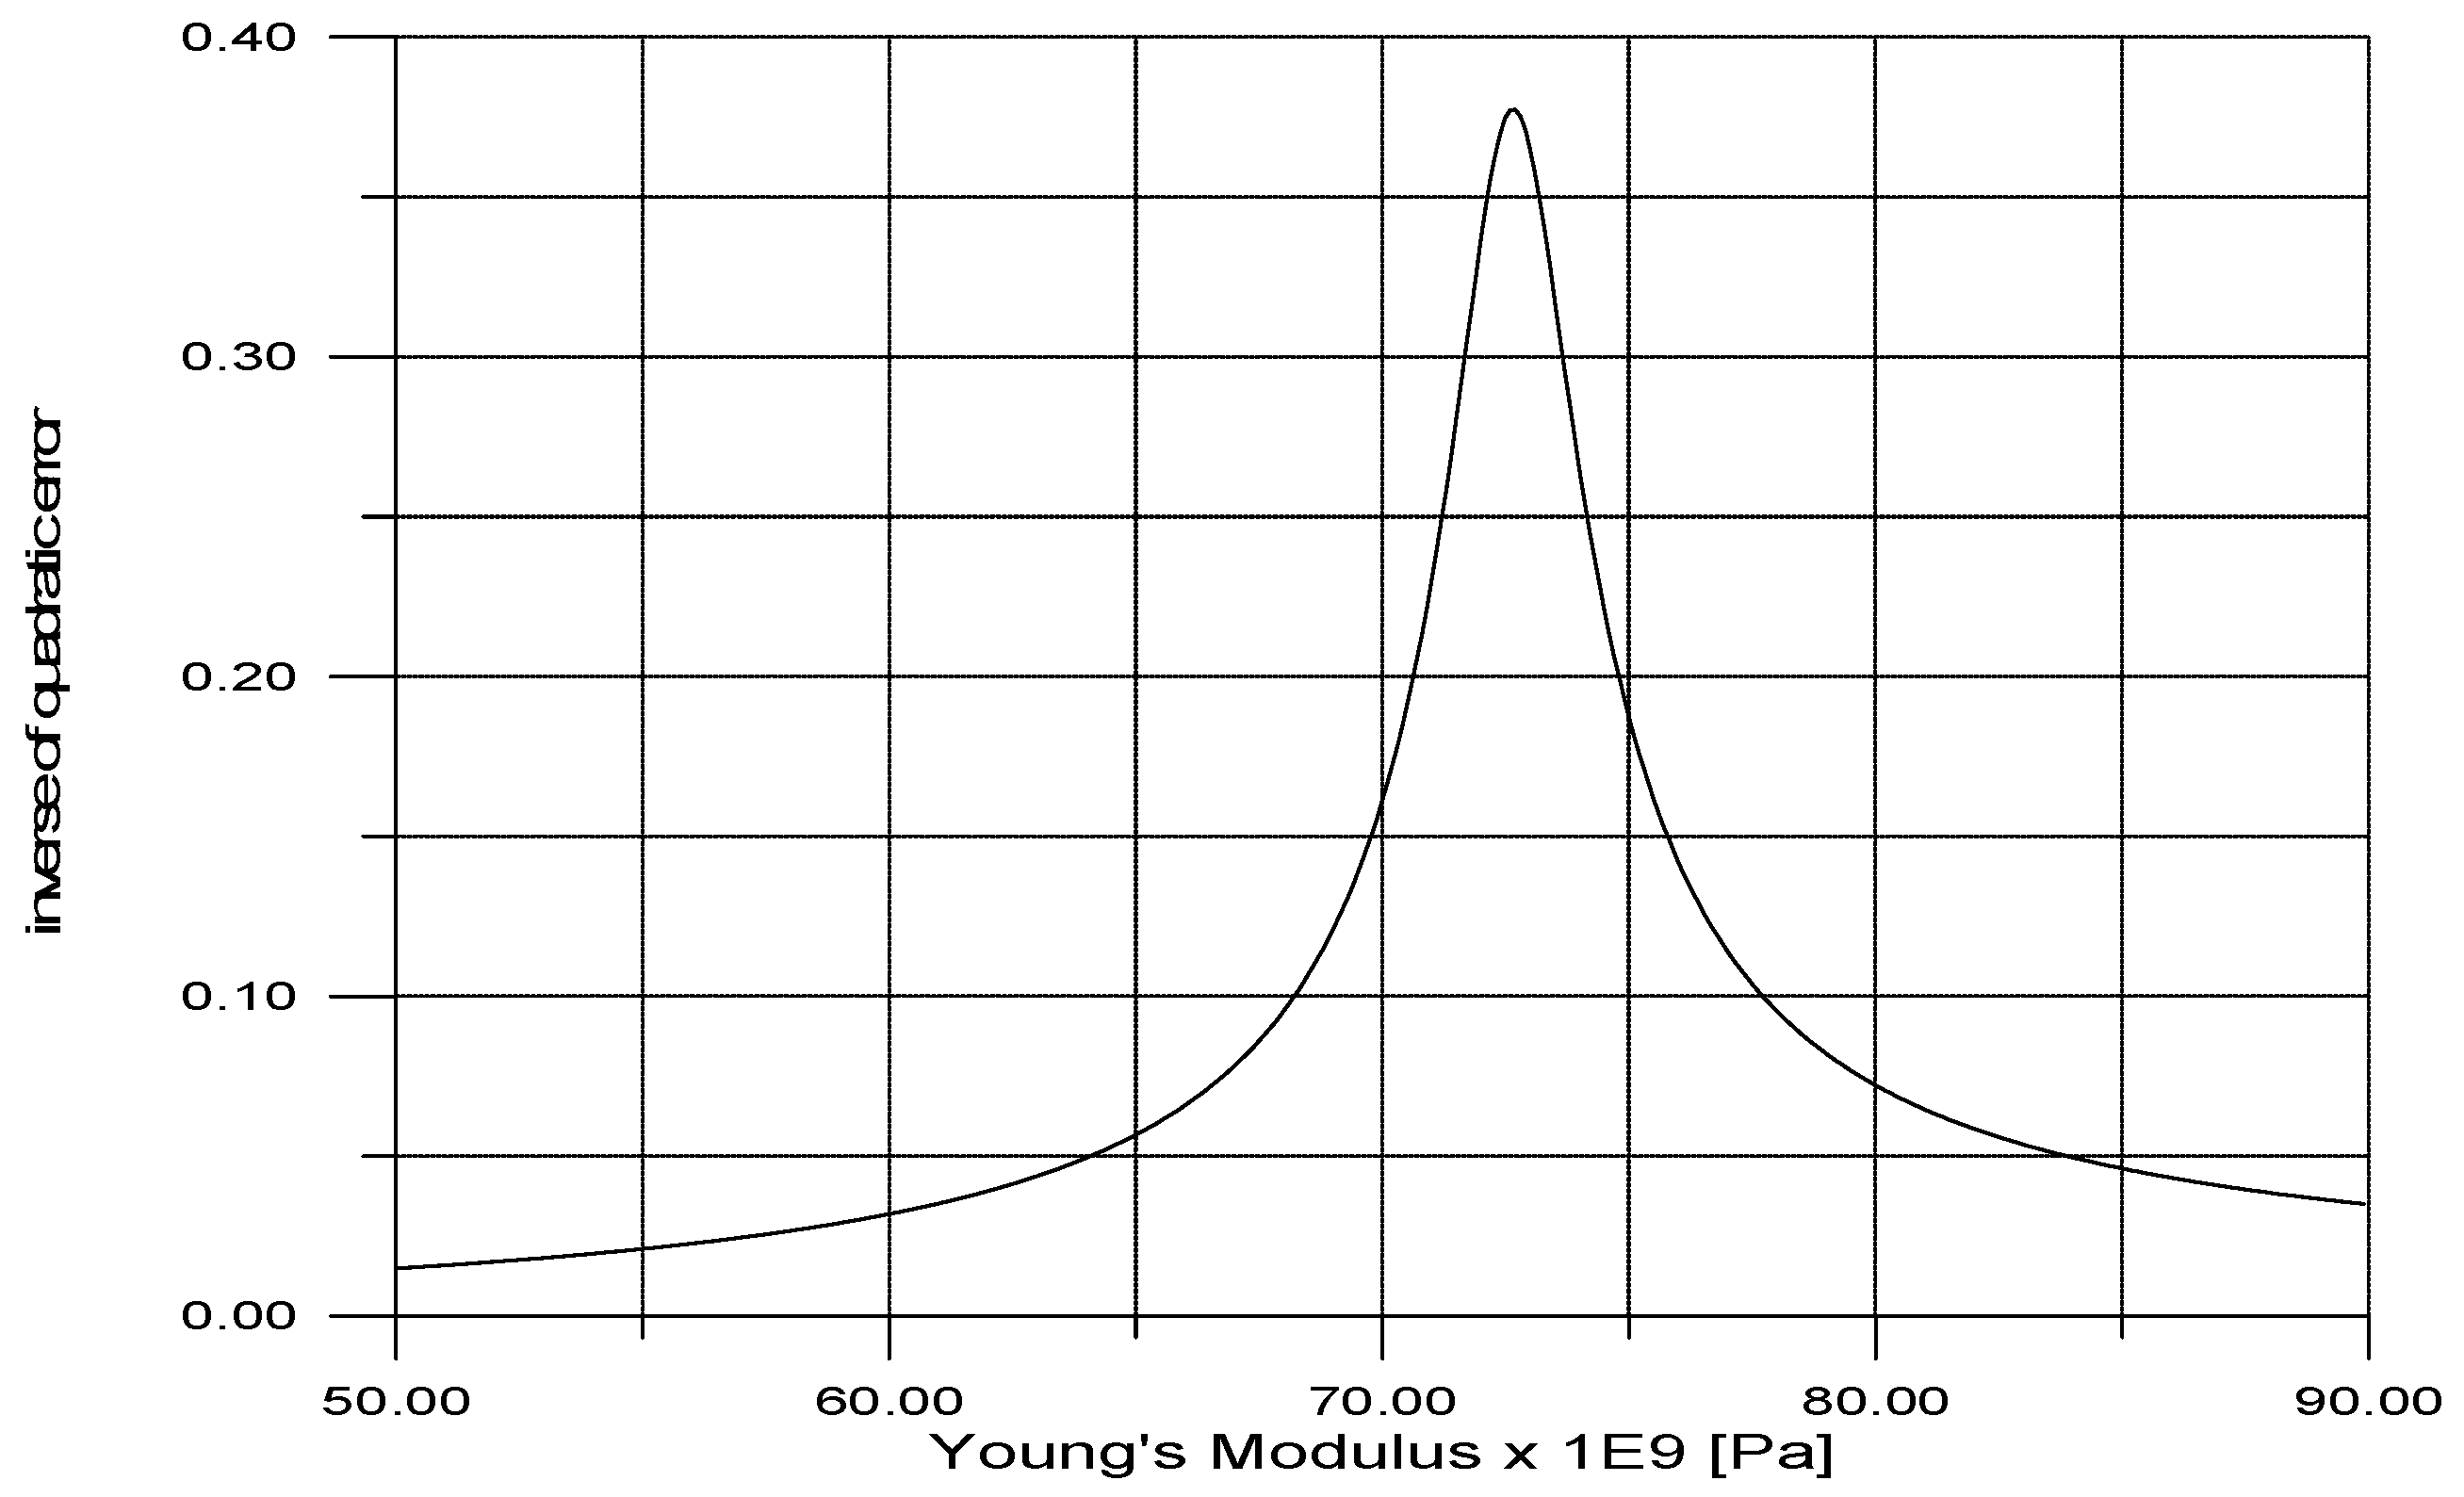
After the program was developed, it was run several times. The last ten results obtained are listed in
Table 3. According to [
17], the tabulated value of the Young’s modulus of aluminum is 71 GPa, which leads to an error of 3.056%.
Figure 5 shows the spectrum of the cost function to be optimized.
5. Conclusion and further work
In this work, a methodology was proposed to determine the elastic modulus of materials through a non-destructive test and the use of the genetic algorithm method to optimize the error between the experimental curvature of a beam and its analytical model.
The method proved to be very efficient in obtaining experimental data from the elastic line of the beam. The comparison between the analytical and the experimental model leads to the determination of a value that is very close to the real modulus of elasticity of the material. To reduce the errors, it is proposed as an improvement of this work to use a more precise calibration object for the image processing system (instead of the sphere) and to improve the parallelism between the camera plane and the beam plane. The work is in progress and it is intended to develop a plug-in in Java for the ImageJ ® package that implements data reduction to eliminate manual data acquisition.
6. References
- A. M. Ahmed and A. M. Rifai, “Euler-Bernoulli and Timoshenko Beam Theories Analytical and Numerical Comprehensive Revision,” Eur. J. Eng. Technol. Res., vol. 6, no. 7, pp. 20–32, 2021. [CrossRef]
- R. Pintelon, P. Guillaume, S. Vanlanduit, K. D. Belder, and Y. Rolain, “Identification of Young’s modulus from broadband modal analysis experiments,” Mech. Syst. Signal Process., vol. 18, no. 4, pp. 699–726, Jul. 2004. [CrossRef]
- R. Pintelon, P. Guillaume, K. De Belder, and Y. Rolain, “Measurement of young’s modulus via modal analysis experiments: a system identification approach,” IFAC Proc. Vol., vol. 36, no. 16, pp. 375–380, Sep. 2003. [CrossRef]
- J. PROU, K. KISHIMOTO, and A. CONSTANTINESCU, “Identification of Young’s Modulus from Indentation Testing and Inverse Analysis,” J. Solid Mech. Mater. Eng., vol. 4, no. 6, pp. 781–795, 2010. [CrossRef]
- Y. Zhao, Z. Yang, and C. Xu, “Bolt Loosening Detection for a Steel Frame Multi-Story Structure Based on Deep Learning and Digital Image Processing,” ASME Int. Mech. Eng. Congr. Expo. Proc., vol. 3, no. February, 2022. [CrossRef]
- X. Zhu, Y. Gao, Z. Dai, D. J. Corr, and S. P. Shah, “Effect of interfacial transition zone on the Young’s modulus of carbon nanofiber reinforced cement concrete,” Cem. Concr. Res., vol. 107, pp. 49–63, May 2018. [CrossRef]
- K. Nering and K. Nering, “A Low-Stress Method for Determining Static and Dynamic Material Parameters for Vibration Isolation with the Use of VMQ Silicone,” Materials (Basel)., vol. 16, no. 8, p. 2960, Apr. 2023. [CrossRef]
- T. Zhang, K. Lu, Z. Zhang, X. Shang, and Q. Wang, “Experimental investigations on parameter identification and failure predictions of titanium alloy by Gurson–Tvergaard–Needleman model,” Theor. Appl. Fract. Mech., vol. 127, no. August, p. 104058, 2023. [CrossRef]
- H. Miyasaka, B. Ebihara, T. Fukaya, and H. Mutsuzaki, “Evaluation of the Relationship Between Echo Intensity and Young’s modulus of the Soleus Muscle Using Ultrasound Images After Ankle Fracture Surgery,” Cureus, Sep. 2024. [CrossRef]
- Y. Zhuang, Y. Huang, Z. He, T. Liu, X. Yu, and S. X. Xin, “Effect of substrate stiffness on the mechanical properties of cervical cancer cells,” Arch. Biochem. Biophys., vol. 725, p. 109281, Aug. 2022. [CrossRef]
- S. H. Ariffin, K. Gkatzionis, and S. Bakalis, “Leaf injury and its effect towards shelf-life and quality of ready-to-eat (RTE) spinach,” Energy Procedia, vol. 123, pp. 105–112, Sep. 2017. [CrossRef]
- S. Amroune, A. Bezazi, A. Dufresne, F. Scarpa, and A. Imad, “Investigation on Microstructure, Tensile Properties and Fatigue Characterization of Porous Date Palm Fiber,” J. Nat. Fibers, vol. 19, no. 17, pp. 15751–15764, Dec. 2022. [CrossRef]
- J. Fan et al., “An Experimental Study of Axial Poisson’s Ratio and Axial Young’s Modulus Determination of Potato Stems Using Image Processing,” Agric., vol. 12, no. 7, 2022. [CrossRef]
- D. Xu, S. Zhang, and Y. Qin, “Study of the Micromechanical Properties and Dissolution Characteristics of Porous Coral Reef Limestone,” J. Geophys. Res. Solid Earth, vol. 129, no. 11, Nov. 2024. [CrossRef]
- J. T. . D. F. M. Beer, Ferdinand P.; Johnston, Russell; DeWolf, Mechanics of Materials, 7th ed. New York - USA: McGraw-Hill, 2014.
- J. M. Gere, Mecanica Dos Materiais, 7st ed. São Paulo - SP: Cengage, 2013.
- R. Hibbeler, Mechanics of Materials, 10th ed. New York - USA: Pearson, 2016.
- L. R. B. and S. M. Feynman R, “Mainly Electromagnetism and Matter,” in The Feynman Lectures on Physics, Volume II, Massachusetts: AddisonWesley Publishing, 1989, p. 592.
- T. Beléndez, C. Neipp, and A. Beléndez, “Large and small deflections of a cantilever beam,” Eur. J. Phys., vol. 23, no. 3, pp. 371–379, 2002. [CrossRef]
- A. Beléndez, C. Neipp, and T. Beléndez, “Experimental study of the bending of a cantilever beam,” Rev. Esp. Fis., vol. 15, pp. 42–45, 2001.
- L. D. Landau and E. M. Lifshitz, Theory of Elasticity, 2nd ed., vol. 7. London: Pergamon Press, 1986.
- K. E. Bisshopp and D. C. Drucker, “Large deflection of cantilever beams,” Q. Appl. Math., vol. 3, pp. 272–275, 1945, [Online]. Available: https://api.semanticscholar.org/CorpusID:126132966.
- E. S. Carrillo, “The cantilevered beam: An analytical solution for general deflections of linear-elastic materials,” Eur. J. Phys., vol. 27, no. 6, pp. 1437–1445, 2006. [CrossRef]
- J. I. S. Lustosa, F. C. Bannwart, and E. C. Oliveira, “On the Separate Assessment of Structural Effects on the Simple Beam Deflection in the Light of Fractional Calculus,” Trends Comput. Appl. Math., vol. 24, no. 2, pp. 211–227, 2023. [CrossRef]
- J. D. Robson, D. Armstrong, J. Cordell, D. Pope, and T. F. Flint, “Calibration of constitutive models using genetic algorithms,” Mech. Mater., vol. 189, no. December 2023, p. 104881, 2024. [CrossRef]
- Y. Zhang, L. O. Hall, D. B. Goldgof, and S. Sarkar, “A constrained genetic approach for reconstructing Young’s modulus of elastic objects from boundary displacement measurements,” Proc. 2002 Congr. Evol. Comput. CEC 2002, vol. 1, pp. 1003–1008, 2002. [CrossRef]
- K. Wierzbanowski, J. Tarasiuk, and A. Lodini, “Optimization of material properties using genetic algorithms,” Mater. Sci. Forum, vol. 652, no. May, pp. 1–6, 2010. [CrossRef]
- S. Kokot and Z. Zembaty, “Damage reconstruction of 3D frames using genetic algorithms with Levenberg-Marquardt local search,” Soil Dyn. Earthq. Eng., vol. 29, no. 2, pp. 311–323, 2009. [CrossRef]
- B. Zion, “The use of computer vision technologies in aquaculture - A review,” Comput. Electron. Agric., vol. 88, pp. 125–132, 2012. [CrossRef]
- P. B. Pathare, U. L. Opara, and F. A. J. Al-Said, “Colour Measurement and Analysis in Fresh and Processed Foods: A Review,” Food Bioprocess Technol., vol. 6, no. 1, pp. 36–60, 2013. [CrossRef]
- Q. Cheng, “Application of computer vision technology in industrial automation,” J. Phys. Conf. Ser., vol. 2037, no. 1, 2021. [CrossRef]
- C. C. Peng, B. L. Jian, T. C. Wu, and C. L. Chen, “Mark identification of proofed steel products,” 2015 IEEE Int. Conf. Consum. Electron. - Taiwan, ICCE-TW 2015, vol. 2, no. 1, pp. 312–313, 2015. [CrossRef]
- J. W. Kim, H. W. Choi, S. K. Kim, and W. S. Na, “Review of Image-Processing-Based Technology for Structural Health Monitoring of Civil Infrastructures,” J. Imaging, vol. 10, no. 4, 2024. [CrossRef]
- K. Wang, H. Lu, L. Shu, and J. J. P. C. Rodrigues, “A context-aware system architecture for leak point detection in the large-scale petrochemical industry,” IEEE Commun. Mag., vol. 52, no. 6, pp. 62–69, 2014. [CrossRef]
- X. Bai, Y. Fang, W. Lin, L. Wang, and B. F. Ju, “Saliency-based defect detection in industrial images by using phase spectrum,” IEEE Trans. Ind. Informatics, vol. 10, no. 4, pp. 2135–2145, 2014. [CrossRef]
- ImageJ, “ImageJ User Guide,” 2024. https://imagej.net/ij/ (accessed Dec. 19, 2024).
|
Disclaimer/Publisher’s Note: The statements, opinions and data contained in all publications are solely those of the individual author(s) and contributor(s) and not of MDPI and/or the editor(s). MDPI and/or the editor(s) disclaim responsibility for any injury to people or property resulting from any ideas, methods, instructions or products referred to in the content. |
© 2025 by the authors. Licensee MDPI, Basel, Switzerland. This article is an open access article distributed under the terms and conditions of the Creative Commons Attribution (CC BY) license (http://creativecommons.org/licenses/by/4.0/).