

Submitted:
08 January 2025
Posted:
09 January 2025
You are already at the latest version
Abstract
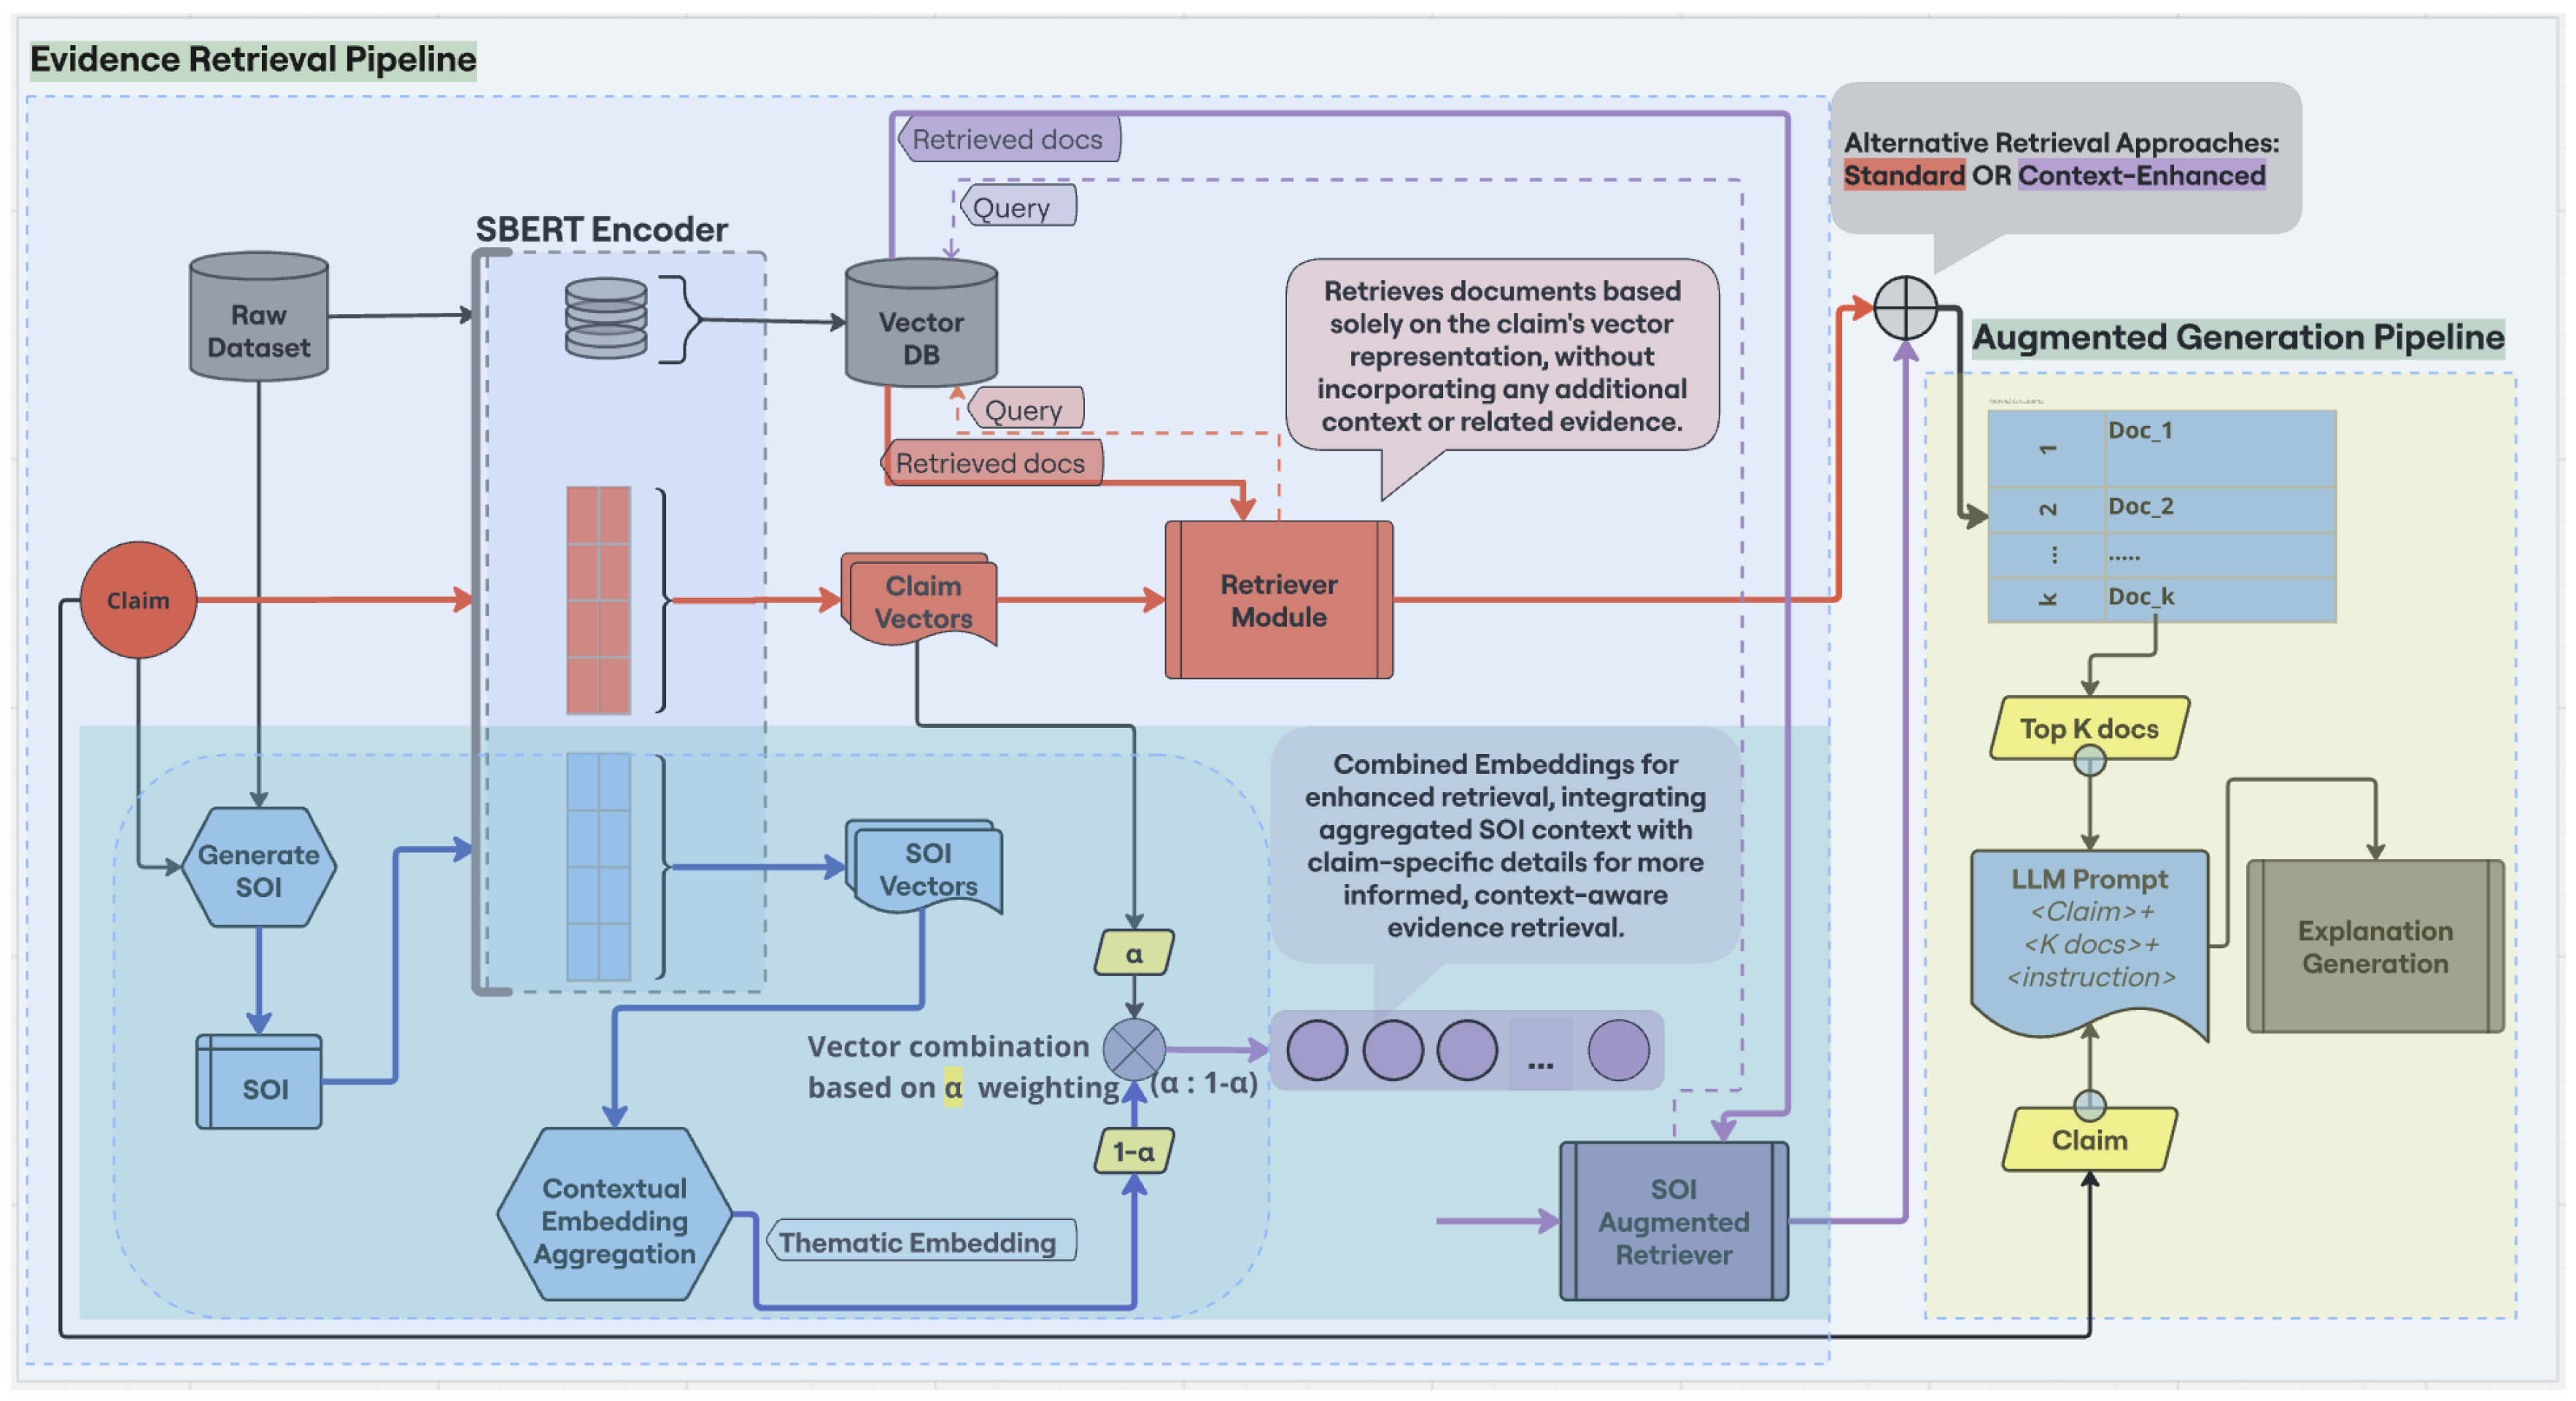
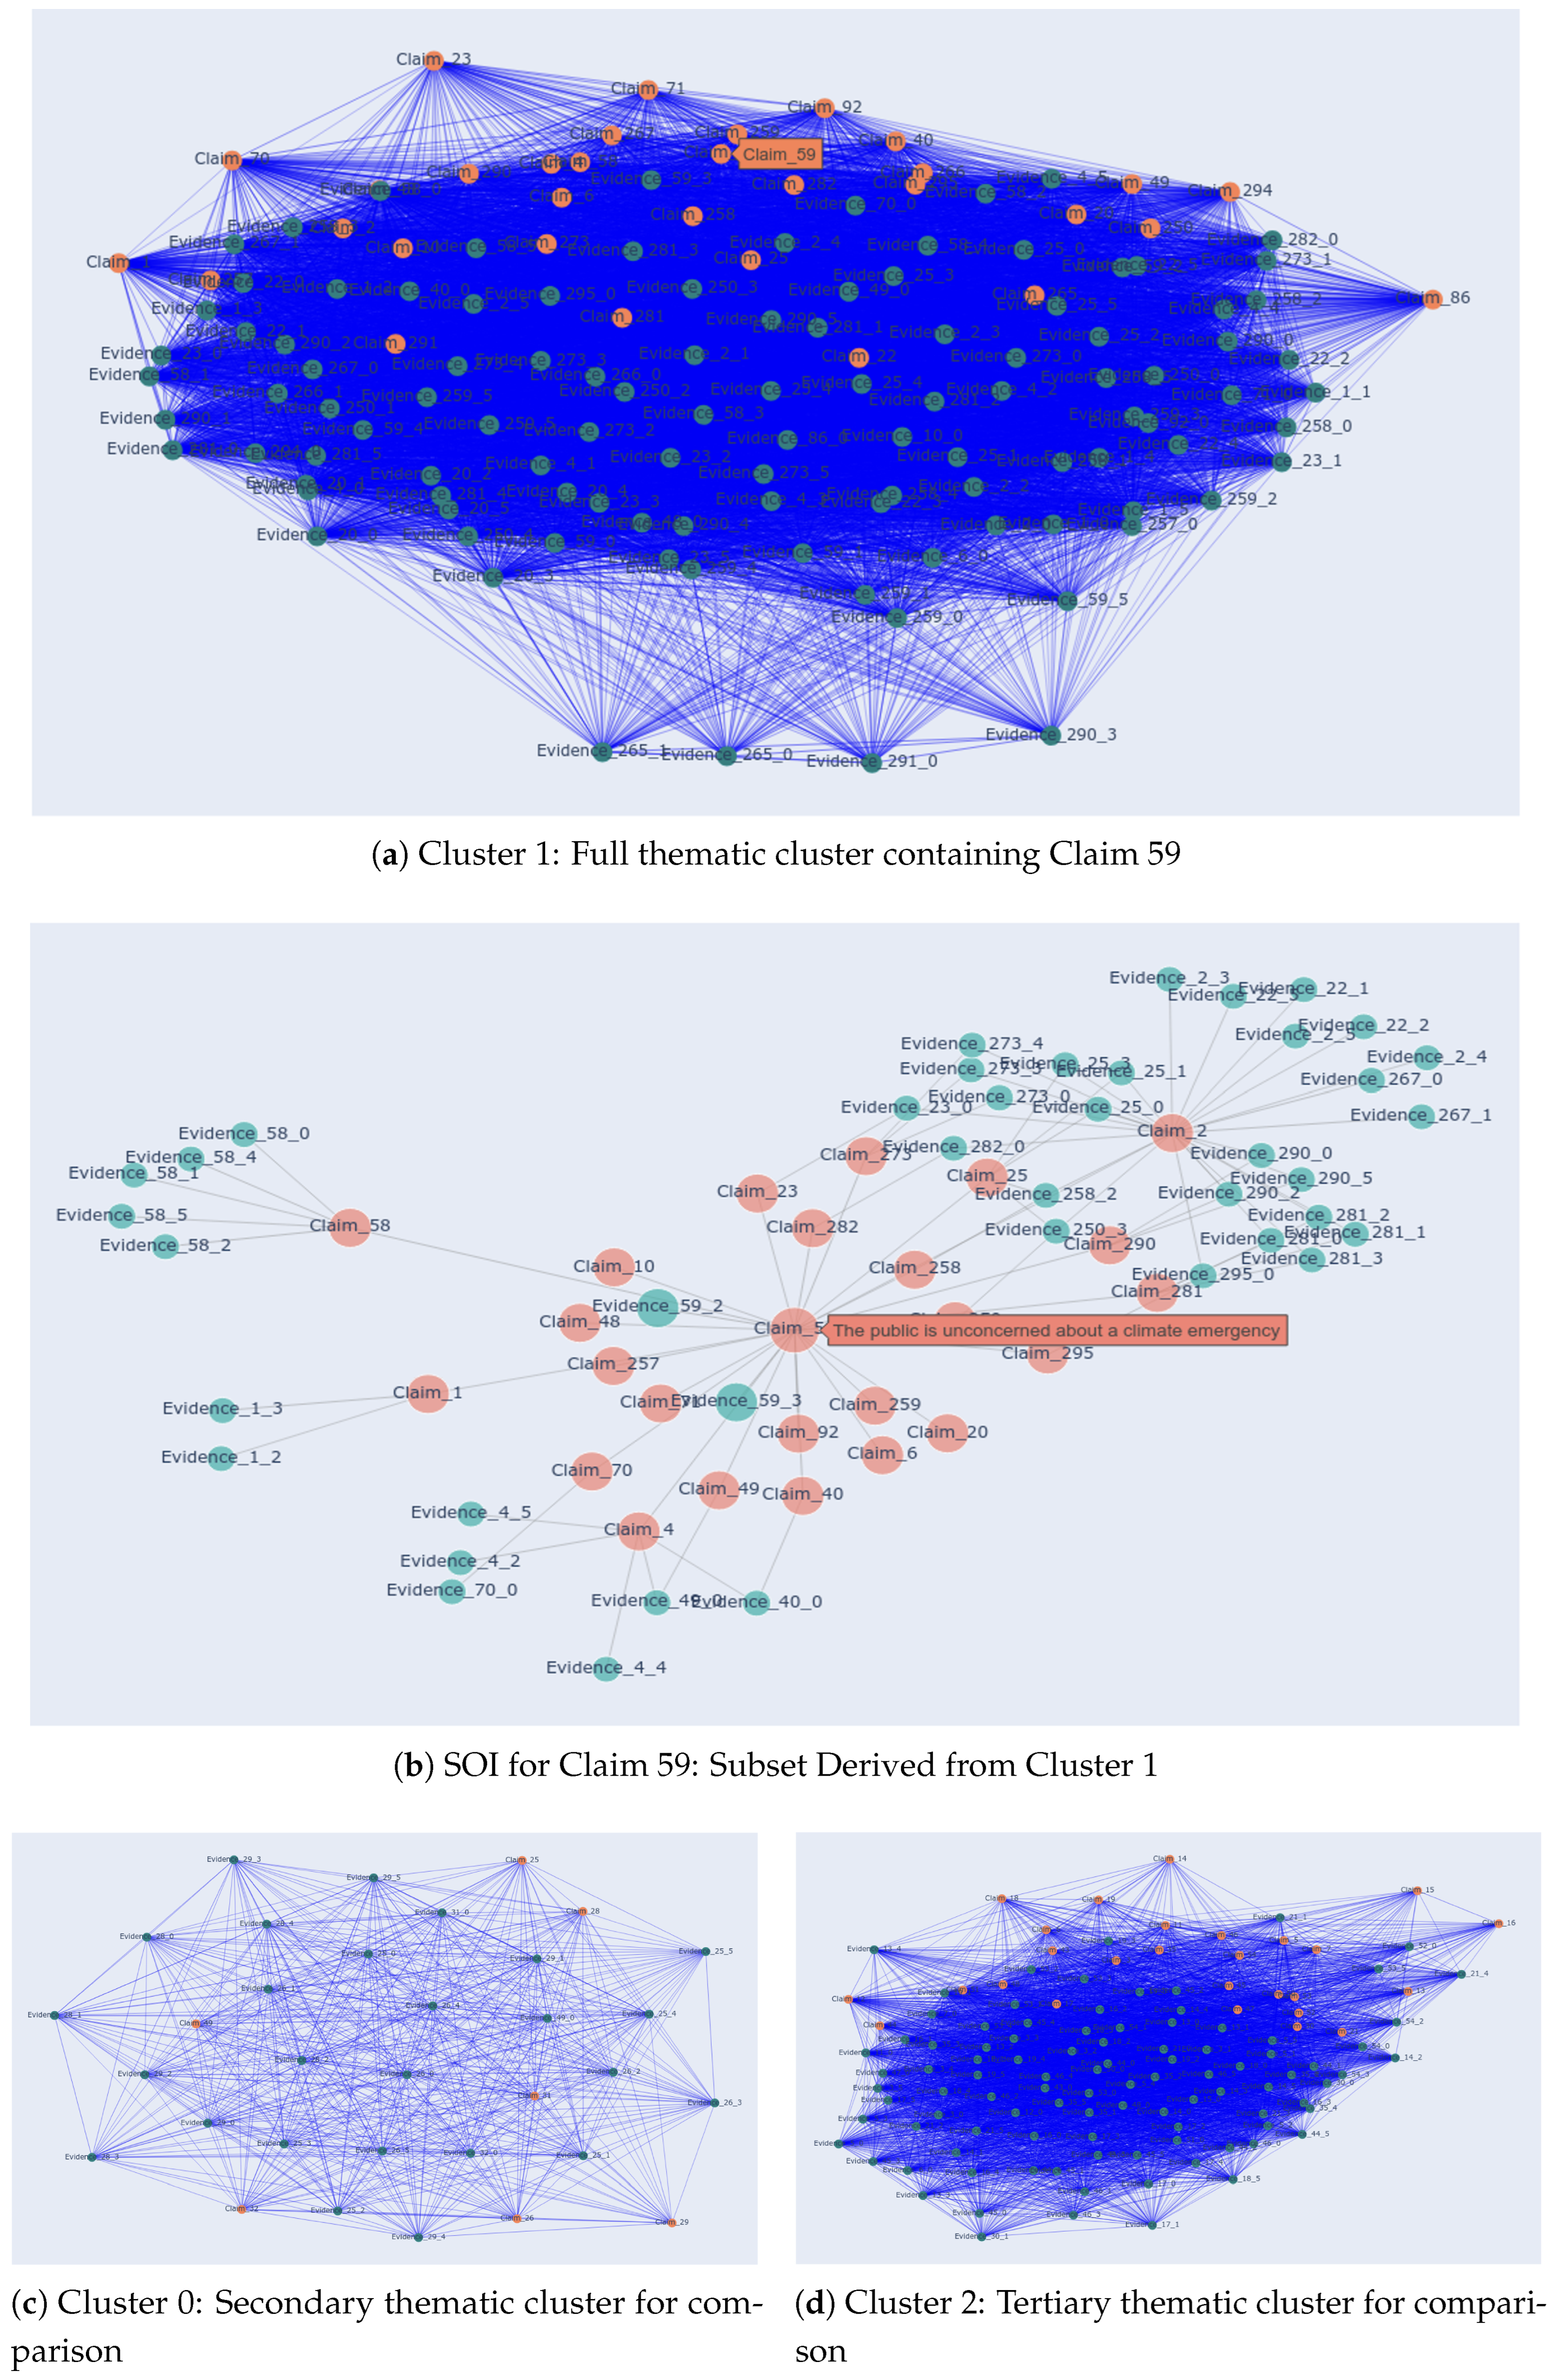
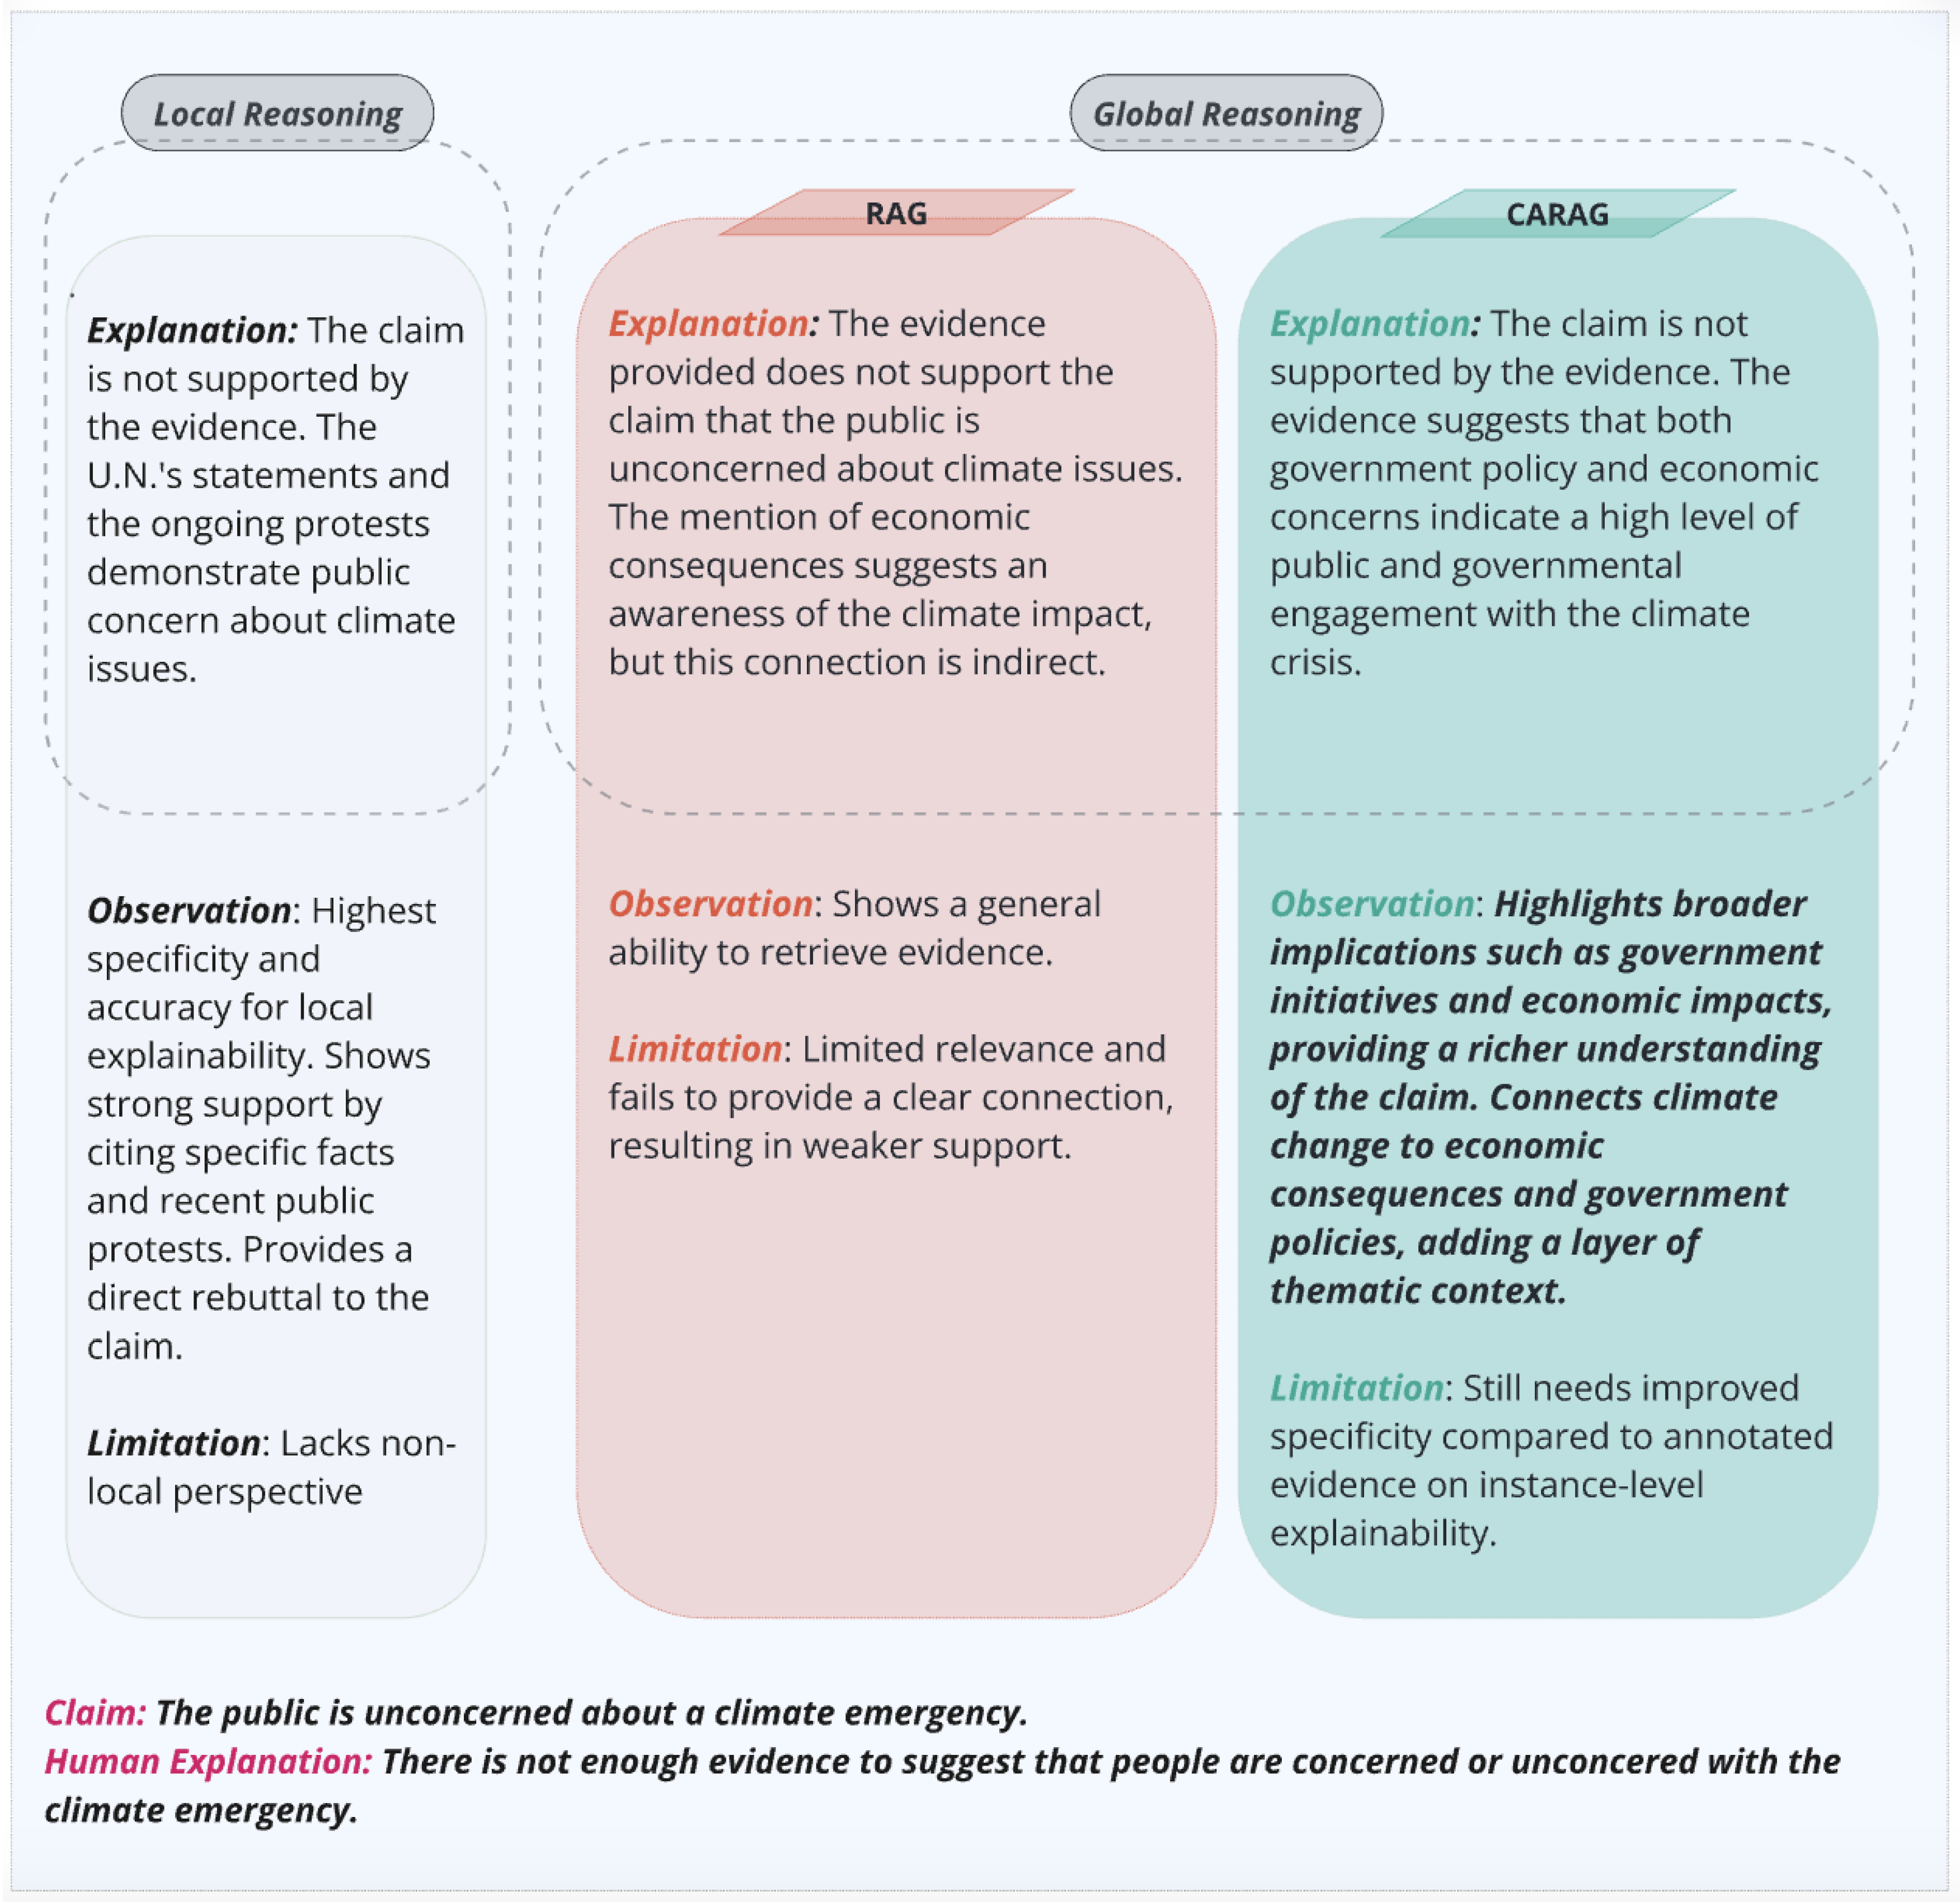
This study introduces an explainable framework for Automated Fact Verification (AFV) systems, integrating a novel Context-Aware Retrieval and Explanation Generation (CARAG) methodology. CARAG enhances evidence retrieval by leveraging thematic embeddings derived from a Subset of Interest (SOI, a focused subset of the fact verification dataset), to integrate local and global perspectives. The retrieval process combines these thematic embeddings with claim-specific vectors to refine evidence selection. Retrieved evidence is integrated into an explanation generation pipeline employing a Large Language Model (LLM) in a zero-shot paradigm, ensuring alignment with topic-based thematic contexts. The SOI and its derived thematic embeddings, supported by a visualized SOI graph, provide transparency into the retrieval process and promote explainability in AI by outlining evidence selection rationale. CARAG is evaluated using FactVer, a novel explanation-focused dataset curated to enhance AFV transparency. Comparative analysis with standard Retrieval-Augmented Generation (RAG) demonstrates CARAG’s effectiveness in generating contextually aligned explanations, underscoring its potential to advance explainable AFV frameworks.
Keywords:
1. Introduction
- Lack of Explanation-Focused Datasets: Existing fact verification datasets like FEVER [27] and MultiFC [28] are not designed to support explanation learning aligned with XAI standards. There is a need for datasets that facilitate training models not only to verify facts, but also to generate meaningful explanations, as previously noted by [29]. This gap in dataset availability limits the development of models capable of both verification and explainability.
- Overemphasis on Local Explainability: Current explainable AFV systems focus predominantly on local explainability, explaining individual predictions, while neglecting global explainability, which is essential for understanding the system’s overall decision-making logic [26]. This local focus leaves AFV systems lacking a holistic view of their behavior, limiting transparency and accountability.
- Ambiguity in Local and Global Explainability: There is a lack of consensus on how local and global explainability are defined and implemented in AFV systems. While local explainability focuses on individual prediction-level explanations, global explainability refers to understanding the model’s overall reasoning process [30]. Different researchers interpret and apply these concepts inconsistently [1,31,32,33], leading to confusion and retarded progress in explainable AFV research.
- Inconsistencies in Explainability Taxonomy: There are discrepancies in how explainability concepts are categorized across studies in AFV. For instance, some researchers distinguish between intrinsic and post-hoc explainability [22], while others conflate interpretability with explainability, restricting it to individual explanations [18]. This lack of standardization creates further confusion in the field, hindering cohesive advancements in explainable AFV.
2. Background
3. Dataset
3.1. Structure and Composition
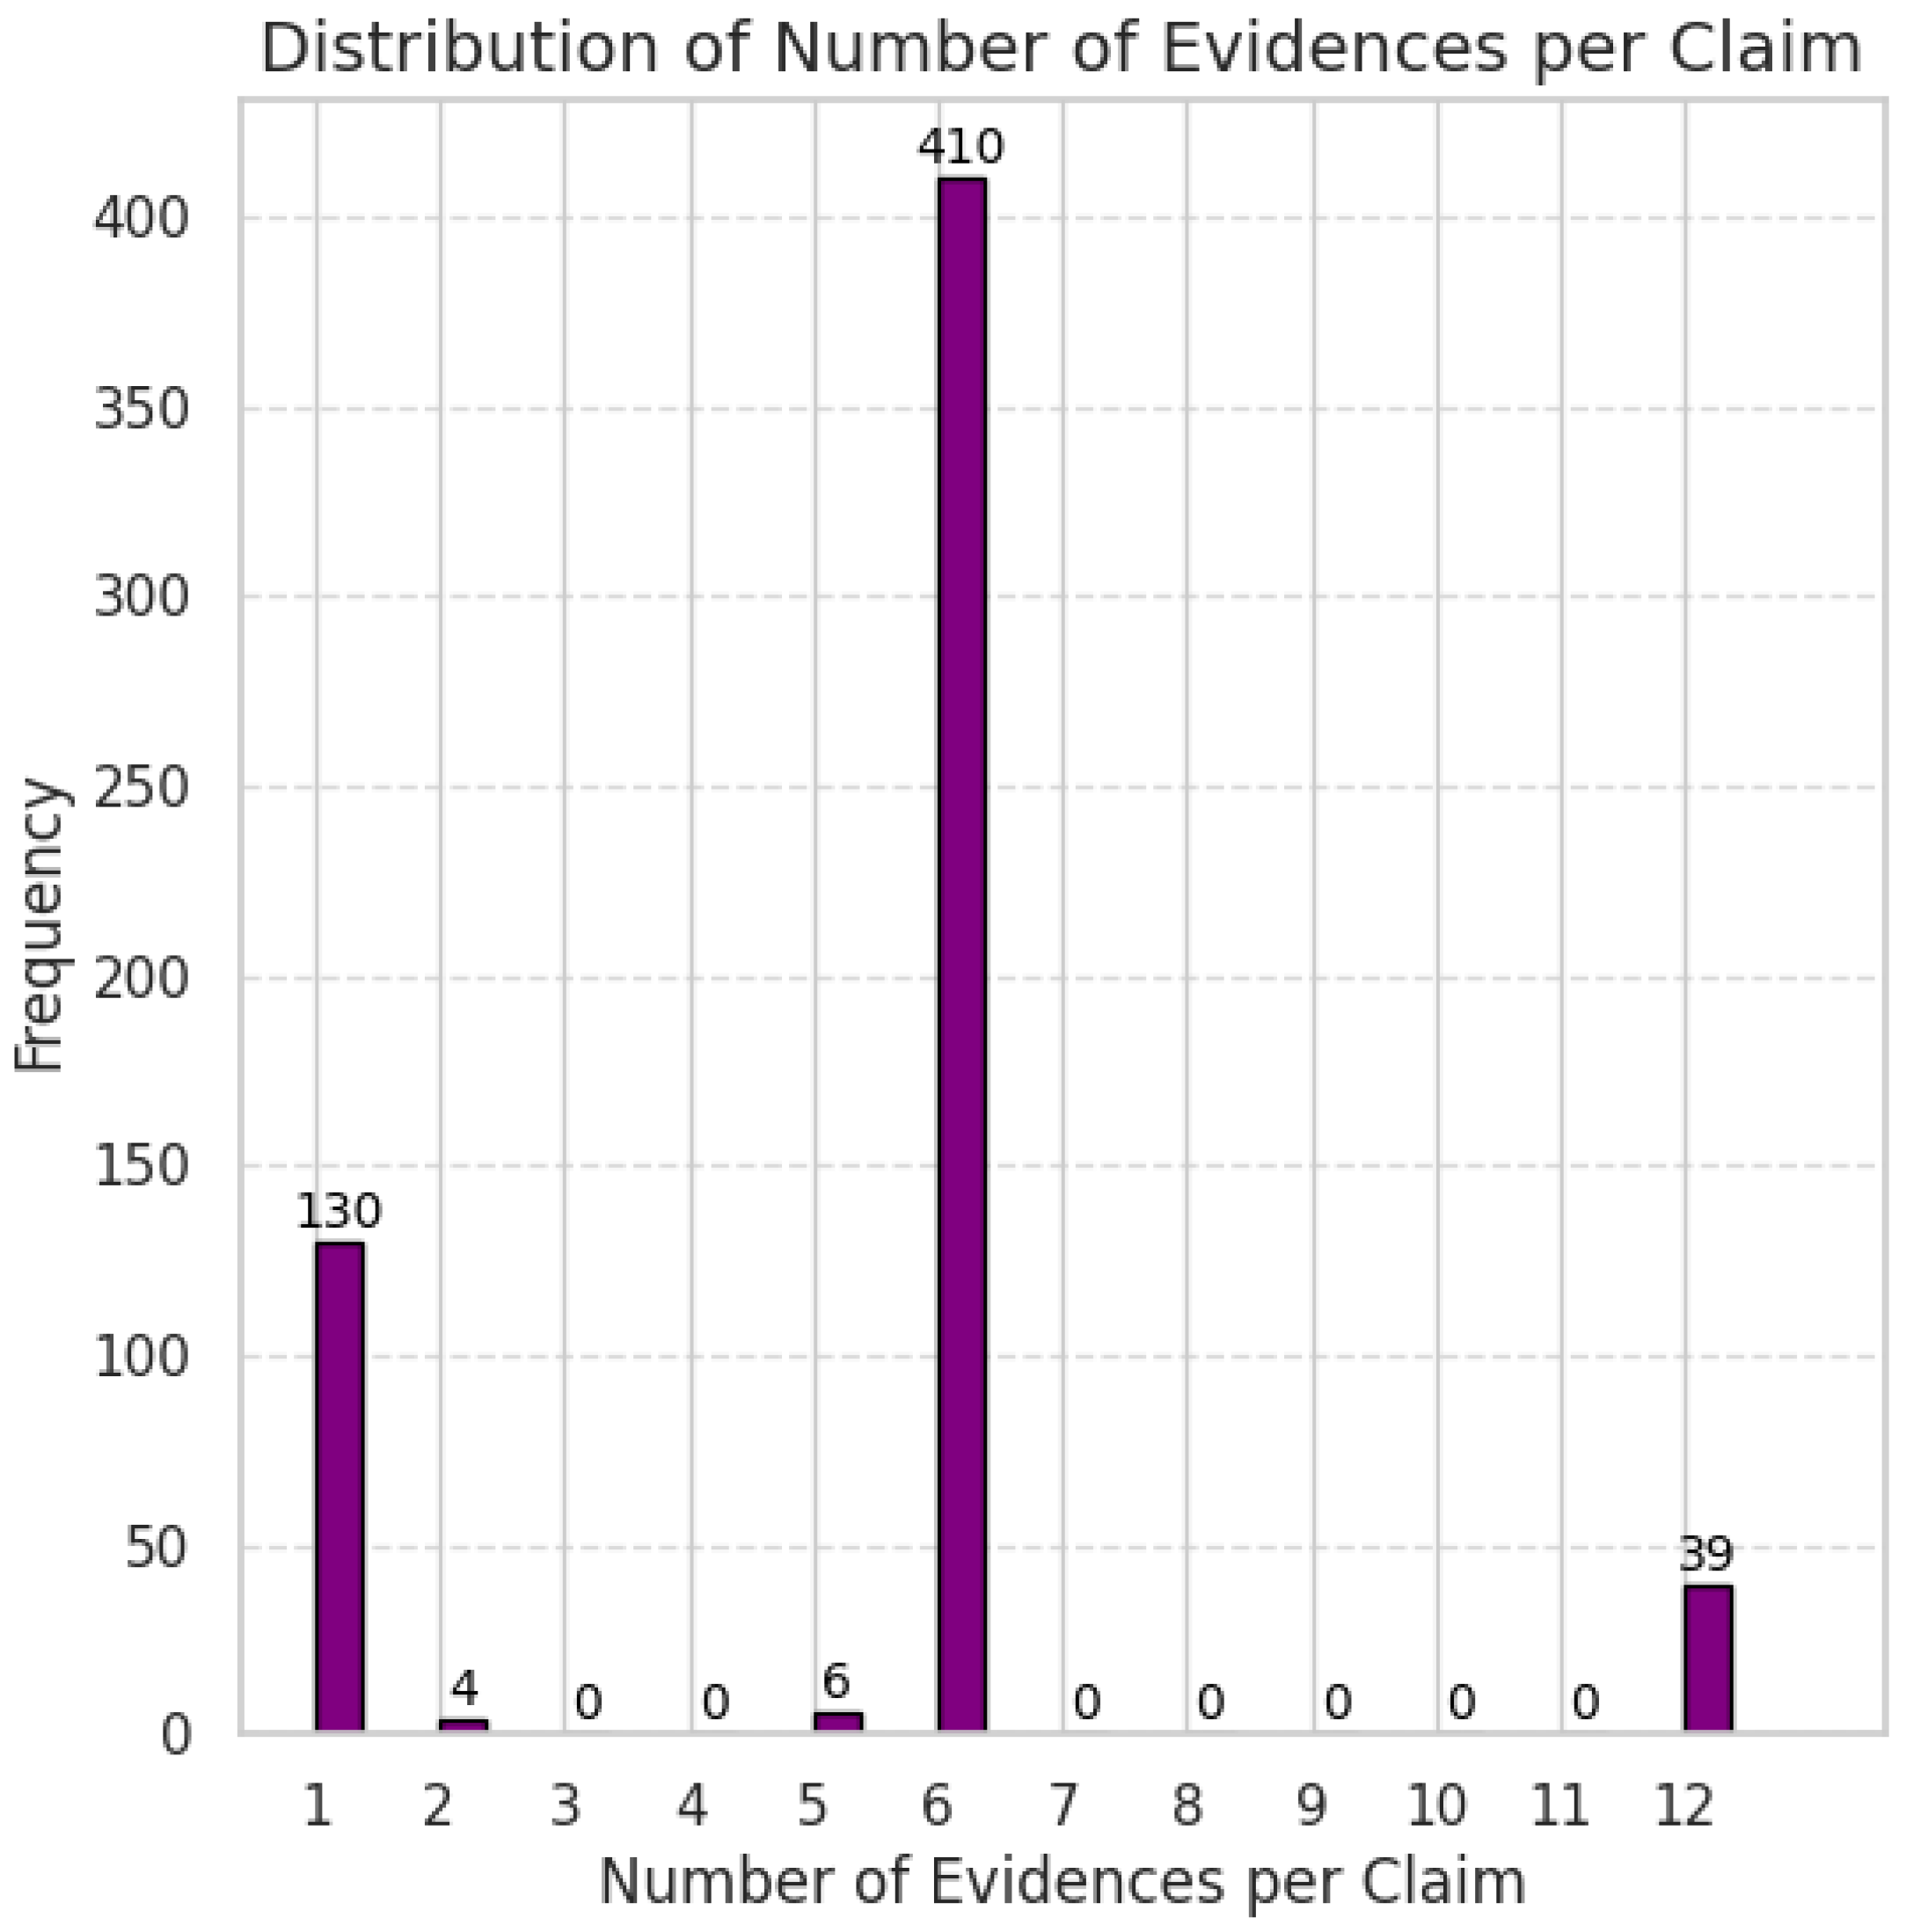
- Climate Change: Claims and evidence related to global warming, environmental policies, and their socioeconomic impacts.
- Covid-19: Claims and evidence concerning the pandemic, vaccines, treatments, and public health measures.
- Electric Vehicles: Claims and evidence focused on electric vehicle technology, battery innovations, efficiency, and market trends.
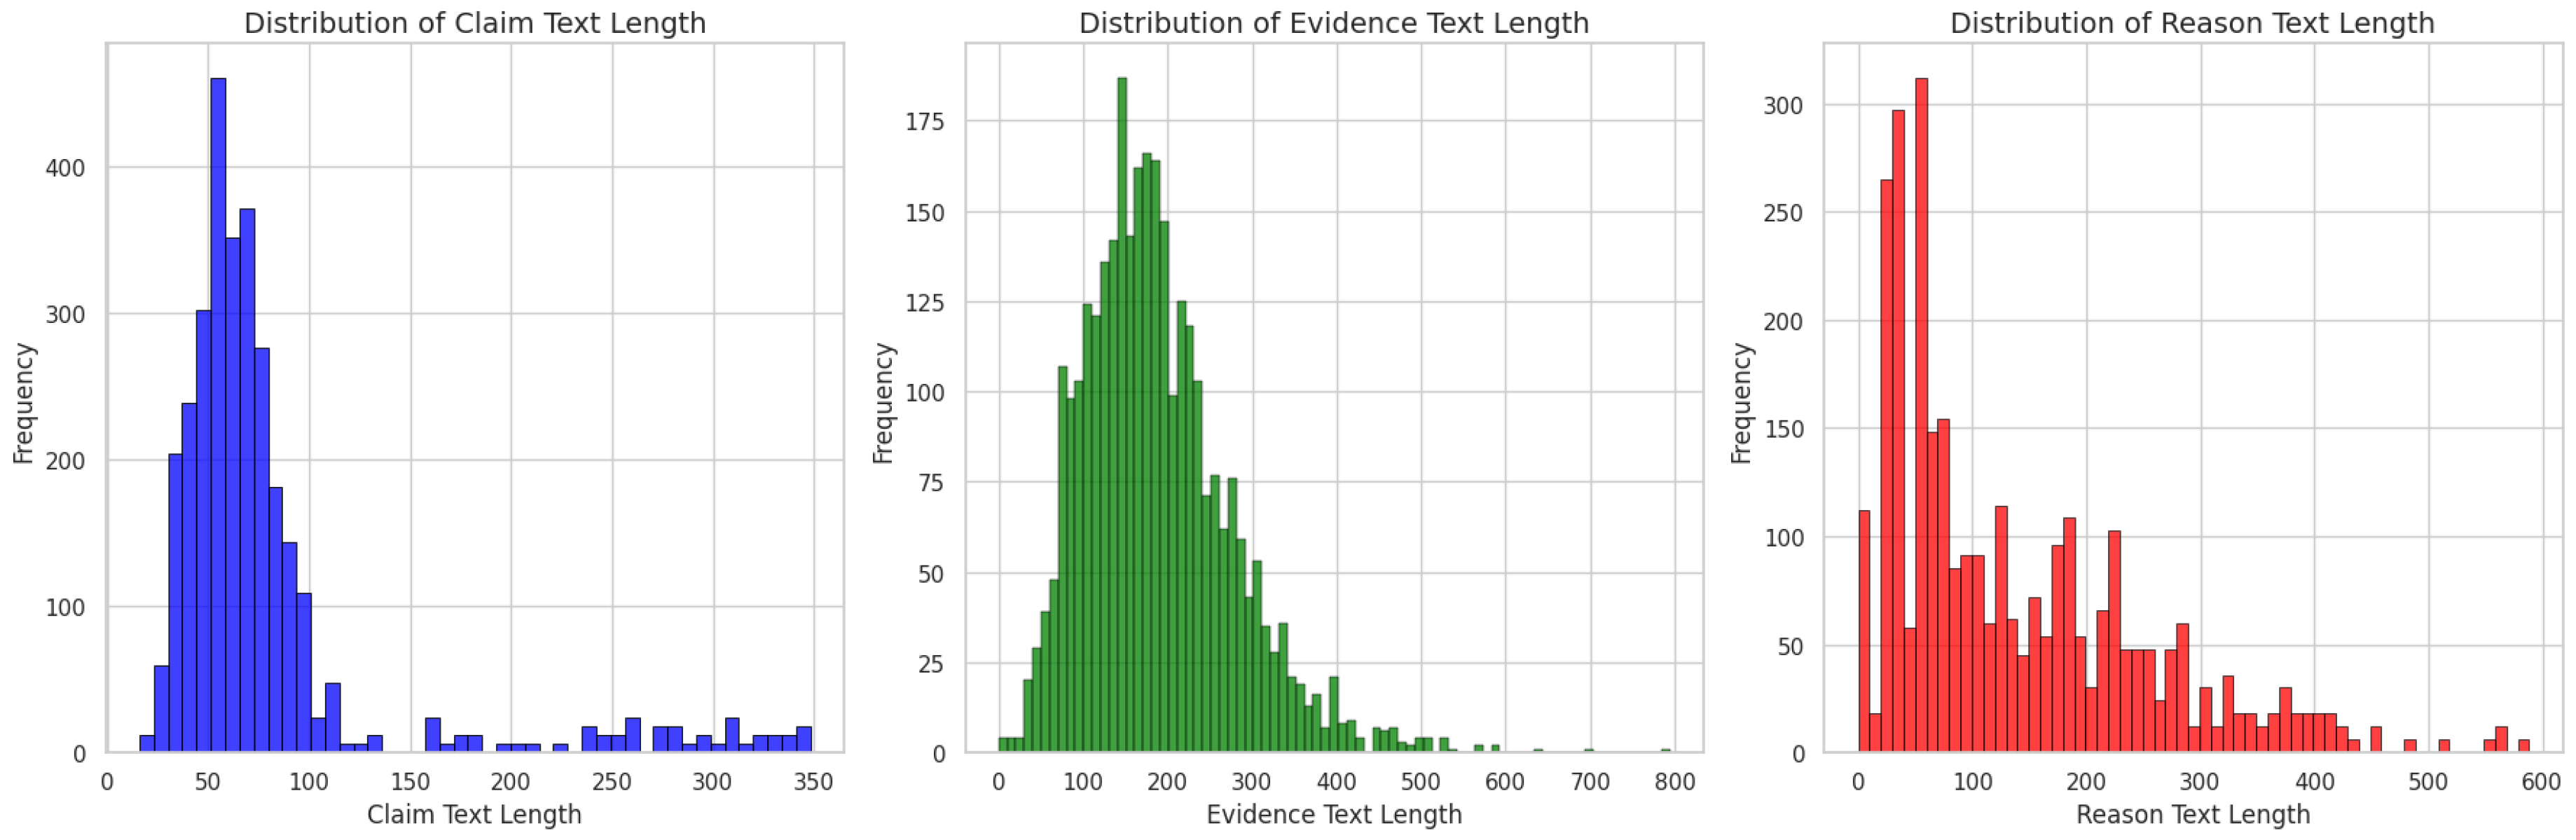
3.2. Dataset Description
- Claim_Text Length: The majority of claims are concise, typically within the 40-60 word range. Longer claims exceeding 100 words are less common.
- Evidence_Text Length: Evidence text length varies widely, with most evidence ranging from 150-250 words, though some extend up to 700 words, reflecting varying levels of detail required to support different claims.
- Reason Length: Reasons are generally concise, with most falling within the 50-100 word range. While some explanations exceed 200 words, very few extend beyond 400 words.
3.3. Preparation
3.4. Example Data Entries
- Claim_Topic_ID: Claims_Climate_B2.0_1
- Claim_Text: New Zealand has a carbon trading system
- Label: T
-
Evidence_Text: (The following list contains the six pieces of annotated evidence associated with this claim:)
- -
- Evidence 1: A number of other countries have, however, also implemented a carbon trading system at a national or sub-national level, or have one in development, including Canada, China, Japan, New Zealand, South Korea, Switzerland, and the United States, according to the European Commission.
- -
- Evidence 2: As of July, 46 countries are pricing emissions through carbon taxes or emissions trading schemes (ETS), according to the International Monetary Fund.
- -
- Evidence 3: NZ’s agricultural emissions aren’t currently captured under the ETS (unlike other sources like industrial processes).
- -
- Evidence 4: The number of emission units released for auction is designed to meet New Zealand’s international obligations.
- -
- Evidence 5: With many New Zealand farms having been converted to forestry due to rising carbon prices in recent years, feedback last week closed on a proposal to change settings in the Emissions Trading Scheme, where permanent plantings of exotic forests, like pine forests, would be excluded from the scheme from next year.
- -
- Evidence 6: China, South Korea, Canada, Japan, New Zealand, Switzerland and the US already have a number of national or regional systems, however the international carbon market is said to develop through a bottom-up approach, whereby the EU ETS will be linked with other international systems, with a common aim to reduce the amount of emissions.
- Reason: New Zealand has an existing emissions trade scheme
- Reason_Type: Abstractive
3.5. Summary
4. Methodology
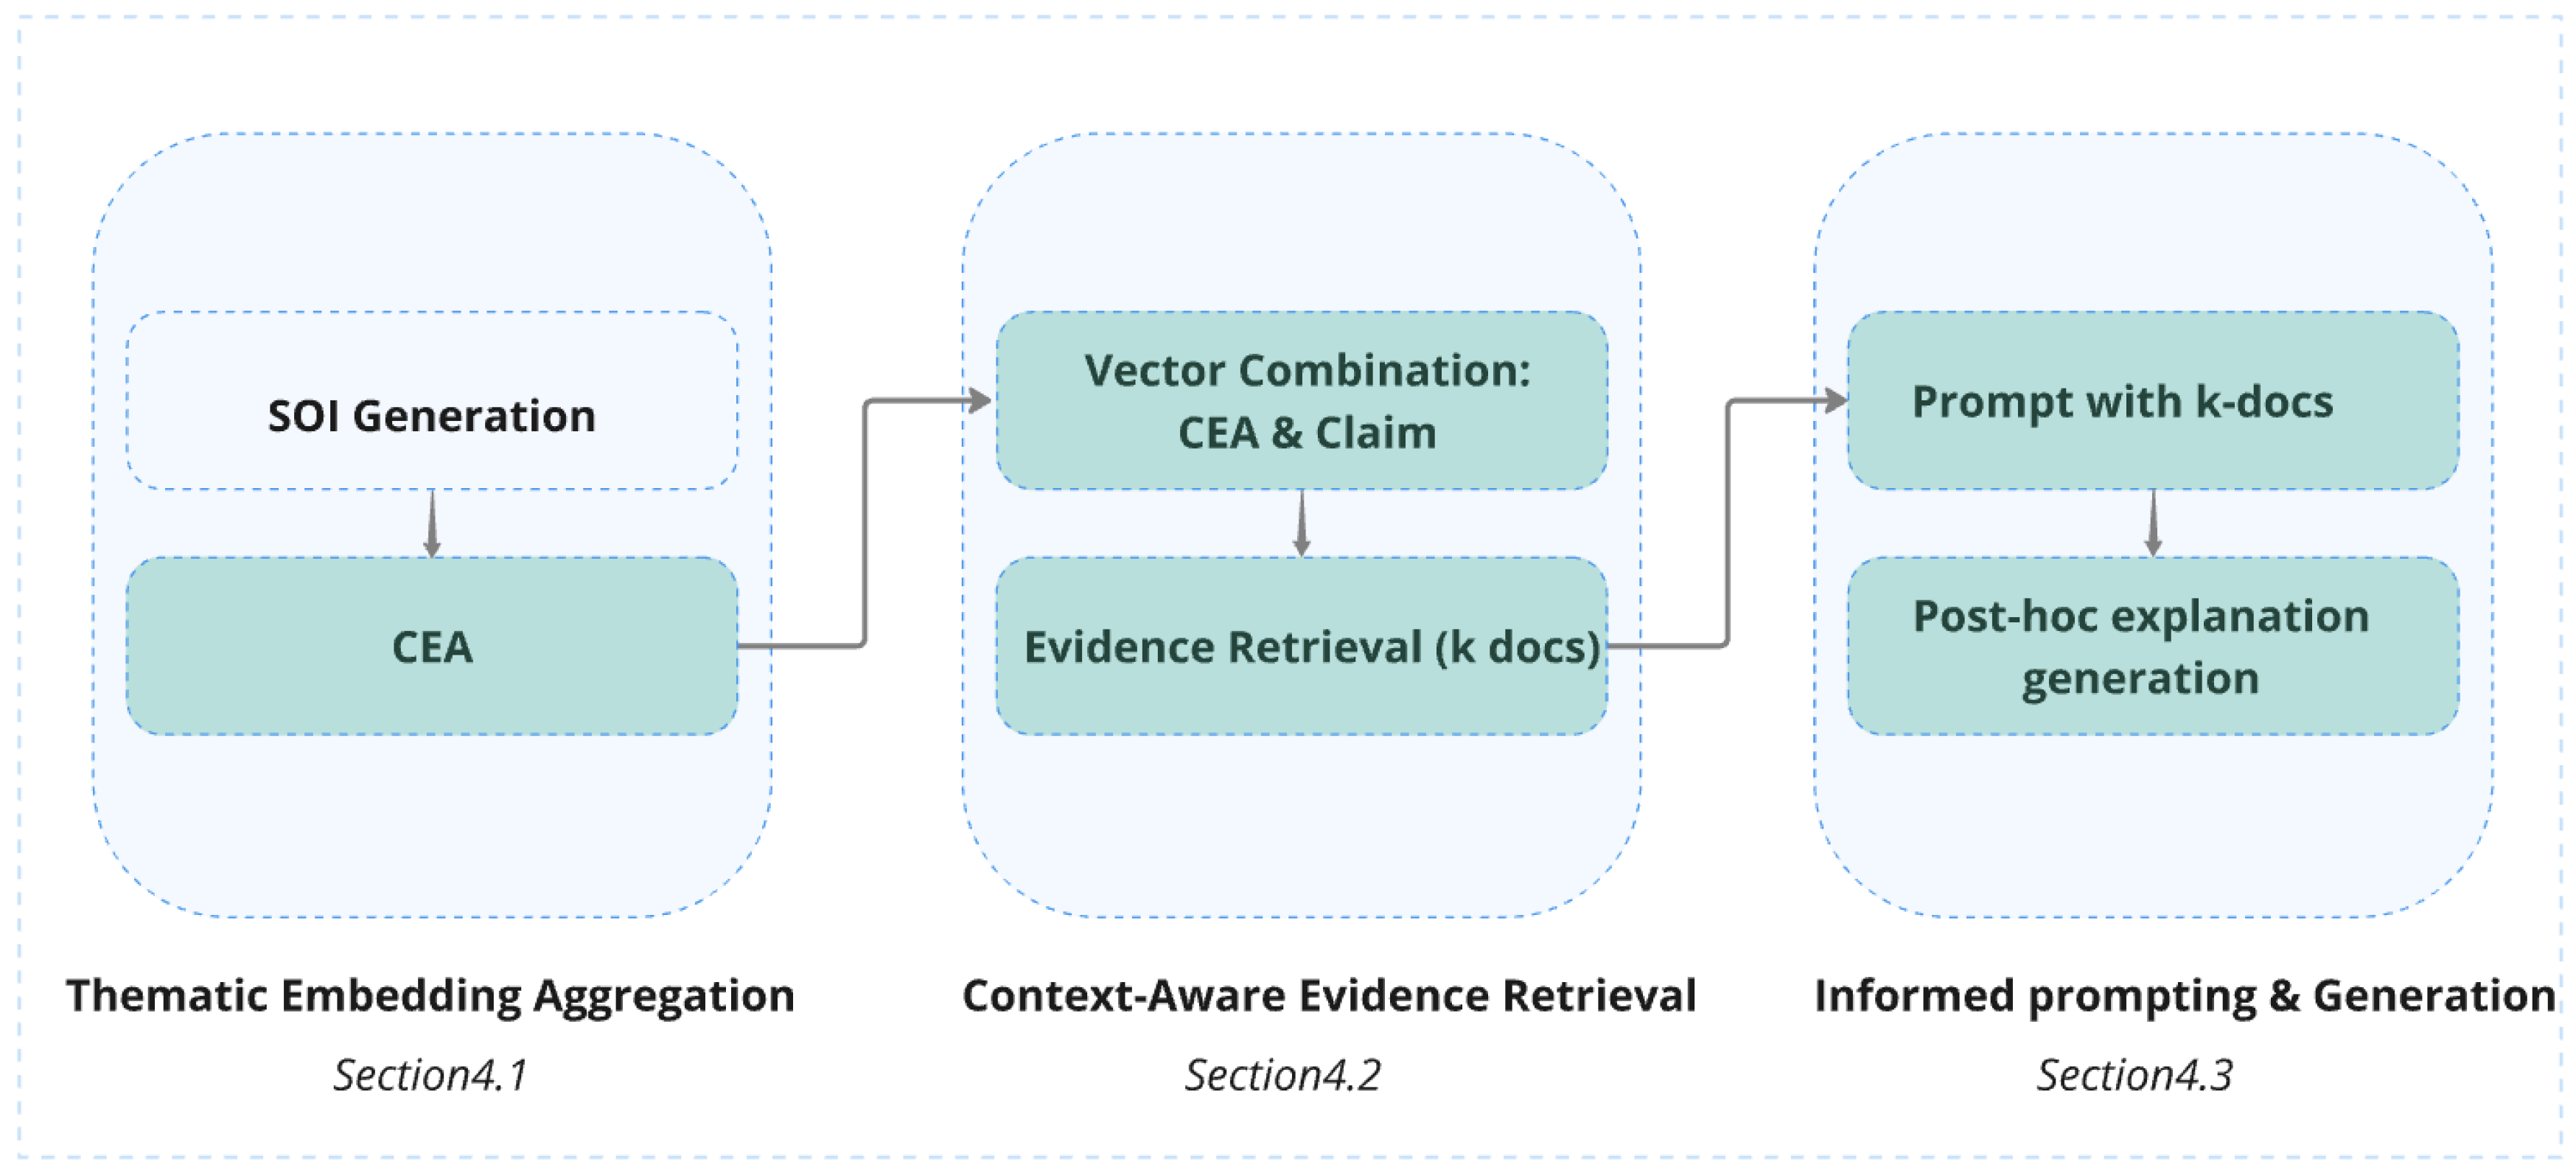
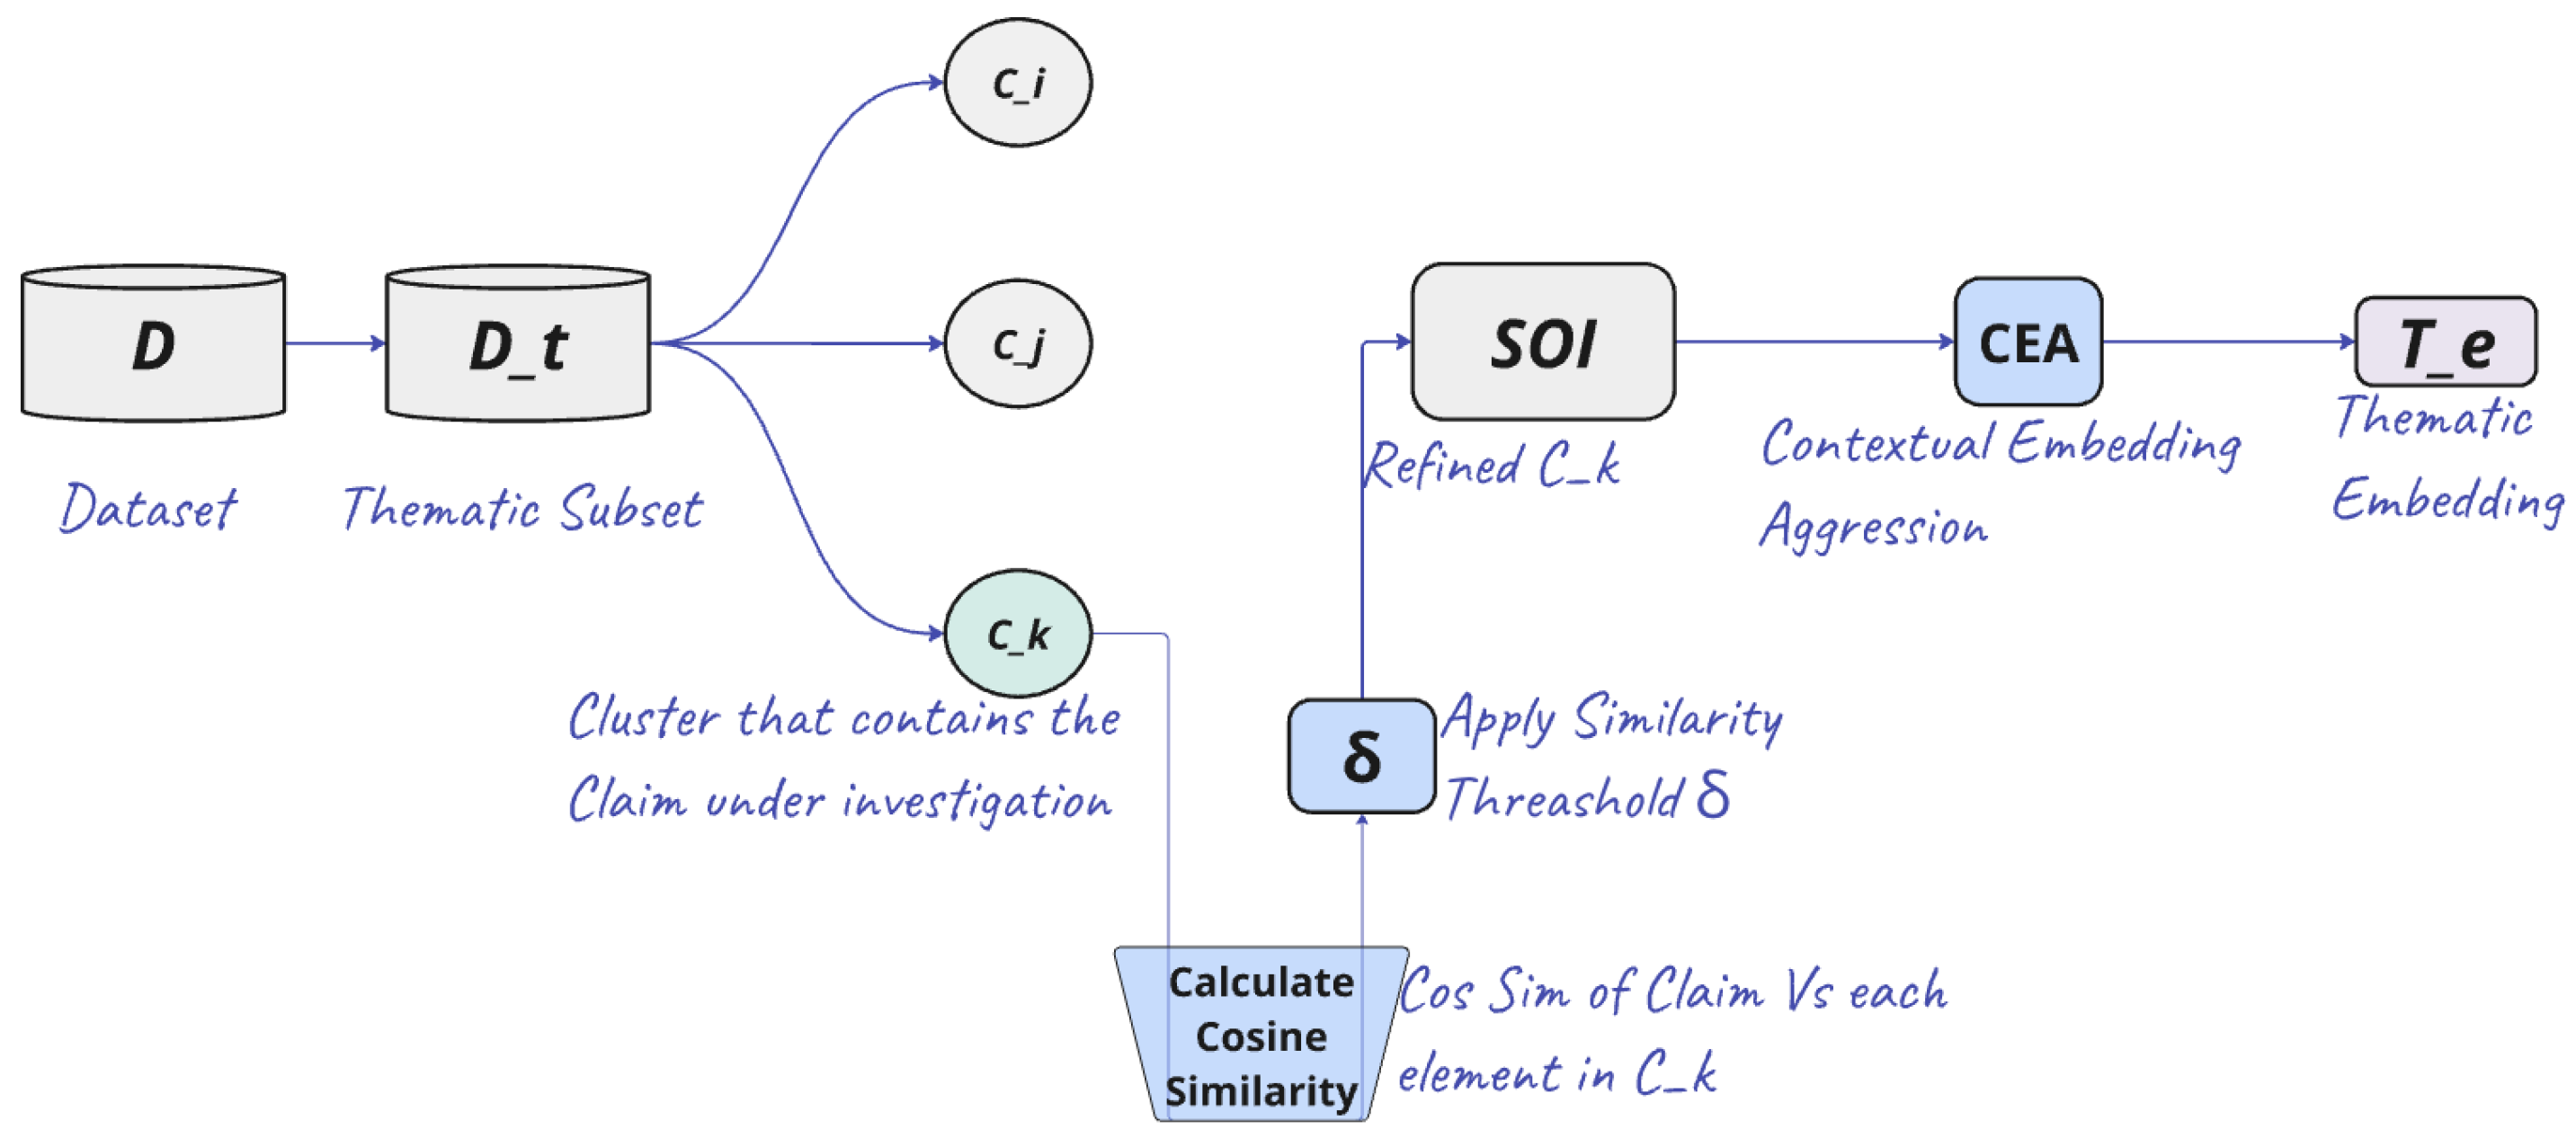
4.1. Thematic Embedding Generation
4.2. Context-Aware Evidence Retrieval
4.3. Smart Prompting for Explanation Generation
5. Experimental Framework & Results
5.1. Case Study Analysis of CARAG
5.1.1. Thematic Embedding Generation for Claim 59
5.1.2. Context-Aware Evidence Retrieval for Claim 59
5.1.3. Smart Prompting for Explanation Generation for Claim 59
Prompt:<Claim 59 (claim text)> + <K docs> + <specific instruction3>
5.2. Comparative Analysis of RAG and CARAG Approaches
5.3. Limitations of Standard Analysis & Visualization Techniques in Explainable AI
6. Challenges and Limitations
7. Future Research Directions
- Label-Independent SOI Refinement: We aim to eliminate reliance on theme labels for SOI refinement, enabling CARAG to generate SOIs without predefined themes.
- Comprehensive Ablation Study on Parameter Effects: We plan to perform an in-depth ablation study to assess CARAG’s component contributions by analyzing key parameters in SOI composition and retrieval vector generation. This analysis aims to determine how these parameters influence retrieval quality, thematic relevance, and interpretability.
- Agreement-Based Performance Evaluation: Building on our analysis (Section 5.2), we aim to explore CARAG’s alignment with human-annotated evidence using agreement metrics. Recognizing that standard evaluation methods may fall short in capturing thematic depth, we will experiment with tailored metrics to better assess CARAG’s nuanced thematic alignment, ensuring transparency and reliability.
8. Conclusions
Author Contributions
Funding
Institutional Review Board Statement
Informed Consent Statement
Data Availability Statement
Acknowledgments
Conflicts of Interest
Abbreviations
| AI | Artificial Intelligence |
| XAI | Explainable Artificial Intelligence |
| AFV | Automated Fact Verification |
| RAG | Retrieval-Augmented Generation |
| GMM | Gaussian Mixture Models |
| EM | Expectation-Maximization |
| SOI | Subset of Interest |
Appendix A. Template and Instructions for Annotation

| Field | Description |
|---|---|
| Claim ID | An integer ID allocated to each claim. |
| Evidence ID | A unique ID for each evidence, ranging from E1 to E6, to ensure traceability between claims and their corresponding evidence. |
| Claim | A span of text specifying the statement of fact or assertion to be verified. |
| Label | A label indicating the veracity of the claim—True (T), False (F), or Not Enough Info (N). |
| Evidence | The text span that supports, refutes, or remains neutral about the claim. |
| Article ID | The identifier from the FactVer_1.1 dataset containing the evidence text span. |
| Reason | A text description providing the rationale for the assigned label, which could be novel or derived from one of the evidence spans. |
Appendix A.1. Steps for Annotation
- Obtain the Template: Obtain the Excel template file containing fields as specified in Table A1.
- Select Topic: Choose the allocated topic and filter the FactVer_1.1 dataset to only show articles on your chosen topic.
- Generate Claims: Read an article from the filtered set and generate a claim in the Excel file. Copy and paste sentences that you think support the claim as evidence. Label the claim-evidence pair as either True (T), False (F), or Not Enough Info (N).
- Record Article ID: Copy the article ID from the FactVer_1.1 dataset into your spreadsheet in the "Article ID" field.
- Gather Additional Evidence: Read other or the same articles for further evidence to either support, refute, or be neutral about your claim.
- Create Evidence Rows: Make 6 rows for each claim, each containing a different evidence span. If no additional evidence is found, fill up with neutral text to reach 6 rows per claim. Typically, a claim is expected to have multiple supporting evidence pieces and some neutral evidence. It is also possible for a claim to have some supporting and some refuting evidence.
Appendix A.2. Notes on Claim and Evidence Creation
- Evidence-Based Labeling: Claims should be labeled according to the evidence in the dataset, without considering outside knowledge.
- Consistent Labeling: Each claim must have a consistent label (T, F, or N) across all 6 rows. While the evidence set may contain text spans that contradict the claim, the label should reflect the overall judgment.
- Expected Evidence Distribution: Typically, a claim should have about 3 supporting evidence pieces, with the remainder being a mix of neutral and refuting evidence if available.
- Reason Field: Fill ’Reason’ field with text that explains the assigned label. This can be a novel explanation or drawn directly from the evidence.
Appendix A.3. Data Consolidation and Preprocessing Steps
- Text Cleaning & Preprocessing: Extraneous characters and irrelevant columns were removed to ensure consistency. Temporary columns, such as the `Old Reason’ column left by different annotation teams, were dynamically updated or removed as needed.
- Claim & Evidence ID Generation: Unique Claim_Topic_ID and Evidence_Topic_IDs were generated to maintain traceability between claims and their corresponding evidence, as detailed in Table 1.
- Annotation Tracking & Traceability: After cleaning the individual files from each annotation team, the Annotation_ID column was added to the dataset, with the same ID assigned to all instances curated by the respective team (B_2.0, C_2.1, C_2.2), enabling traceability back to the raw files.
- Dataset Consolidation: The cleaned datasets were concatenated into a single DataFrame, and the index was reset to ensure consistency and avoid any indexing issues across the combined dataset.
- Consistency in Labeling & Reason Propagation: Claims with the same Claim_Topic_ID were assigned the same propagated human-generated reasons to ensure consistency within each claim group, maintaining coherence across the related evidence pieces.
- Validation & Reason Type Assignment: The dataset was validated by grouping entries by Claim_Topic_ID to verify that each claim was correctly linked with its evidence and explanation. The reasons were further categorized into Abstractive and Extractive, as described in Table 1.
Appendix B. SOI Generation
| Algorithm 1:SOI Generation with Thematic Clustering and Filtering |
|
References
- Aranceta-Bartrina, Javier. 1999a. Title of the cited article. Journal Title 6: 100–10.
- Aranceta-Bartrina, Javier. 1999b. Title of the chapter. In Book Title, 2nd ed. Edited by Editor 1 and Editor 2. Publication place: Publisher, vol. 3, pp. 54–96.
- Baranwal, Ajay K., and Costea Munteanu. 1955. Book Title. Publication place: Publisher, pp. 154–96. First published 1921 (op-tional).
- Berry, Evan, and Amy M. Smith. 1999. Title of Thesis. Level of Thesis, Degree-Granting University, City, Country. Identifi-cation information (if available).
- Cojocaru, Ludmila, Dragos Constatin Sanda, and Eun Kyeong Yun. 1999. Title of Unpublished Work. Journal Title, phrase indicating stage of publication.
- Driver, John P., Steffen Rohrs, and Sean Meighoo. 2000. Title of Presentation. In Title of the Collected Work (if available). Paper presented at Name of the Conference, Location of Conference, Date of Conference.
- Harwood, John. 2008. Title of the cited article. Available online: URL (accessed on Day Month Year).
| 1 | Dataset available at: https://link_removed_for_review_purposes
|
| 2 | Code repository available at: https://link_removed_for_review_purposes
|
| 3 | For example: You are a fact verification assistant. From the given Claim and its Evidence, determine if the claim is supported by the evidence and generate a concise explanation (two sentences max). |
| Header | Description |
|---|---|
| Claim_Topic_ID | A unique identifier representing the claim, which also encodes information about the thematic topic it belongs to. For example, in the identifier Claims_Climate_B2.0_1, the middle segment (`Climate’) denotes the theme, while B2.0 refers to the annotation team responsible for curating the claim, facilitating efficient data processing. |
| Claim_Text | The textual content of the claim, which needs to be verified for its truthfulness. |
| Evidence_Topic_ID | A unique identifier for the evidence corresponding to each claim. The Evidence ID is constructed by consolidating the claim ID with the prefix `Evidence’ and appending a unique serial number. For example, in Evidence_Claims_Climate_B2.0_1_n, the ‘n’ uniquely distinguishes each piece of evidence associated with the claim. This structure efficiently organizes the multiple pieces of evidence for a given claim. |
| Evidence_Text | The actual textual evidence supporting or refuting the claim. |
| Label | The label indicating the veracity of the claim (T/F/N representing True/False/Not Enough Info respectively). |
| Reason | An explanation that provides justification for the label assigned to the claim. |
| Reason_Type | Classifies the nature of the explanation as either Abstractive for human-generated explanations that are crafted based on the evidence but not directly copied, or Extractive, copied directly from the supporting evidence. If no explanation is provided, it is marked as Nil. |
| Annotation_ID | An identifier assigned to each entry, reflecting the annotation team responsible for curating the data. There are three types of IDs, B_2.0, C_2.1, C_2.2, corresponding to the three annotation teams involved, allowing for traceability back to the raw files from each team during data processing and analysis. |
| Article_Topic_ID | A reference to the specific source or article from which the evidence is derived. This ensures the data can be linked back to the original source used by the teams during the annotation process. |
| Key | Description |
| claim_id | The unique identifier of the selected claim. |
| claim | The text of the selected claim. |
| annotated_evidences | The evidence pieces directly associated with the claim, including both the text and unique evidence IDs. |
| related_claims | Other claims within the thematic cluster that are semantically related to the selected claim. |
| thematic_cluster_evidences | Evidence from other claims within the thematic cluster that are thematically relevant to the selected claim, including both text and unique evidence IDs. |
| similarities | The similarity scores between the selected claim and the associated evidence/related claims, calculated using cosine similarity. |
| Annotated Evidence | RAG Retrieved Evidence | CARAG Retrieved Evidence |
|---|---|---|
| 1. Government pledge to act on the climate emergency. | ||
| 2. U.N. notes 1.5 degrees Celsius as a crucial limit | ||
| 3. Todd’s opposition to increasing traffic during a climate emergency | ||
| 4. Declaration of a climate emergency in 2020. | ||
| 5. Groundswell NZ’s protest against He Waka Eke Noa. | ||
| 6. Chinese protests demanding action on climate change. | ||
| 1. Failure will result in the country’s once-successful car-making industry being scrapped. | ||
| 2. Two-week journey which would have meant missing Wales’ first match. | ||
| 3. Shares fell as low as $6.50-apiece on Monday, down 97 percent from August 2021. | ||
| 4. BMW-branded cars, motorcycles, and Mini models sold since October 1 get the new warranty. | ||
| 5. Korean officials discussing several possible options to correct what they believe to be unfair policies that eliminated up to $7,500 of tax credits for EVs produced outside North America. | ||
| 6. White House statement about Biden’s health condition. | 1. Failure will result in the country’s once-successful car-making industry being scrapped. | |
| 2. Greenhouse gas trading scheme forms part of the UK government’s ambition to achieve net-zero emissions by 2050. | ||
| 3. Short-notice public investigatory attention affecting businesses. | ||
| 4. Korean officials discussing options to correct unfair EV tax policies. | ||
| 5. Two-week journey potentially missing Wales’ first match. | ||
| 6. Reliance on imports from China, US, and Europe for the car industry. |
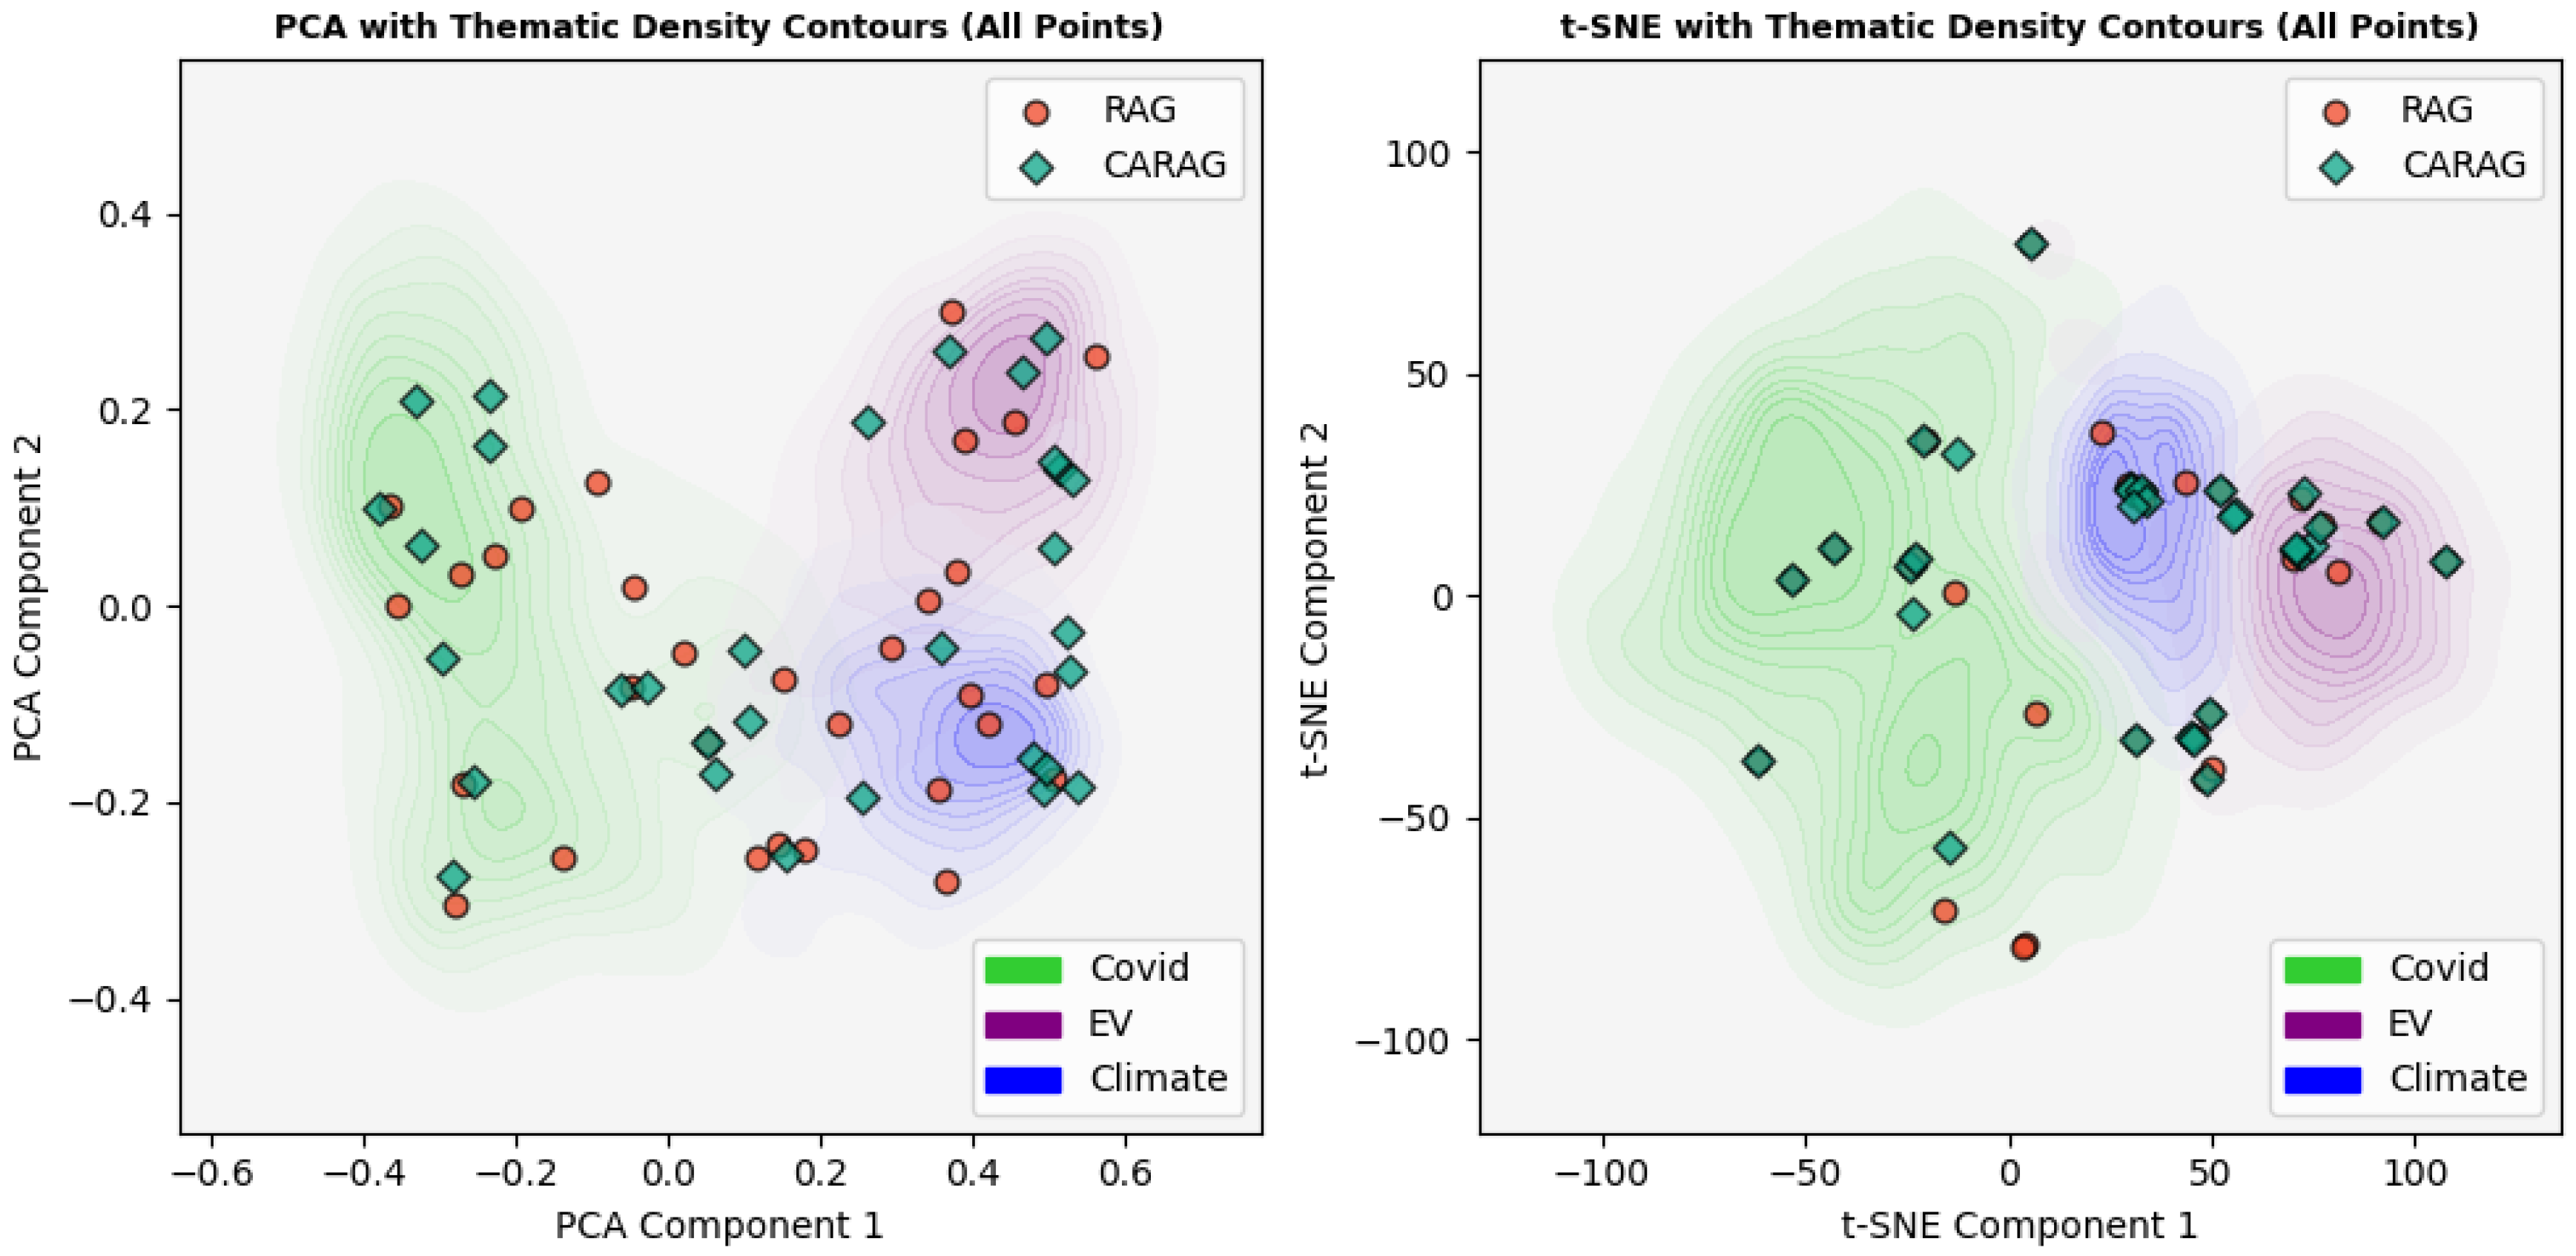
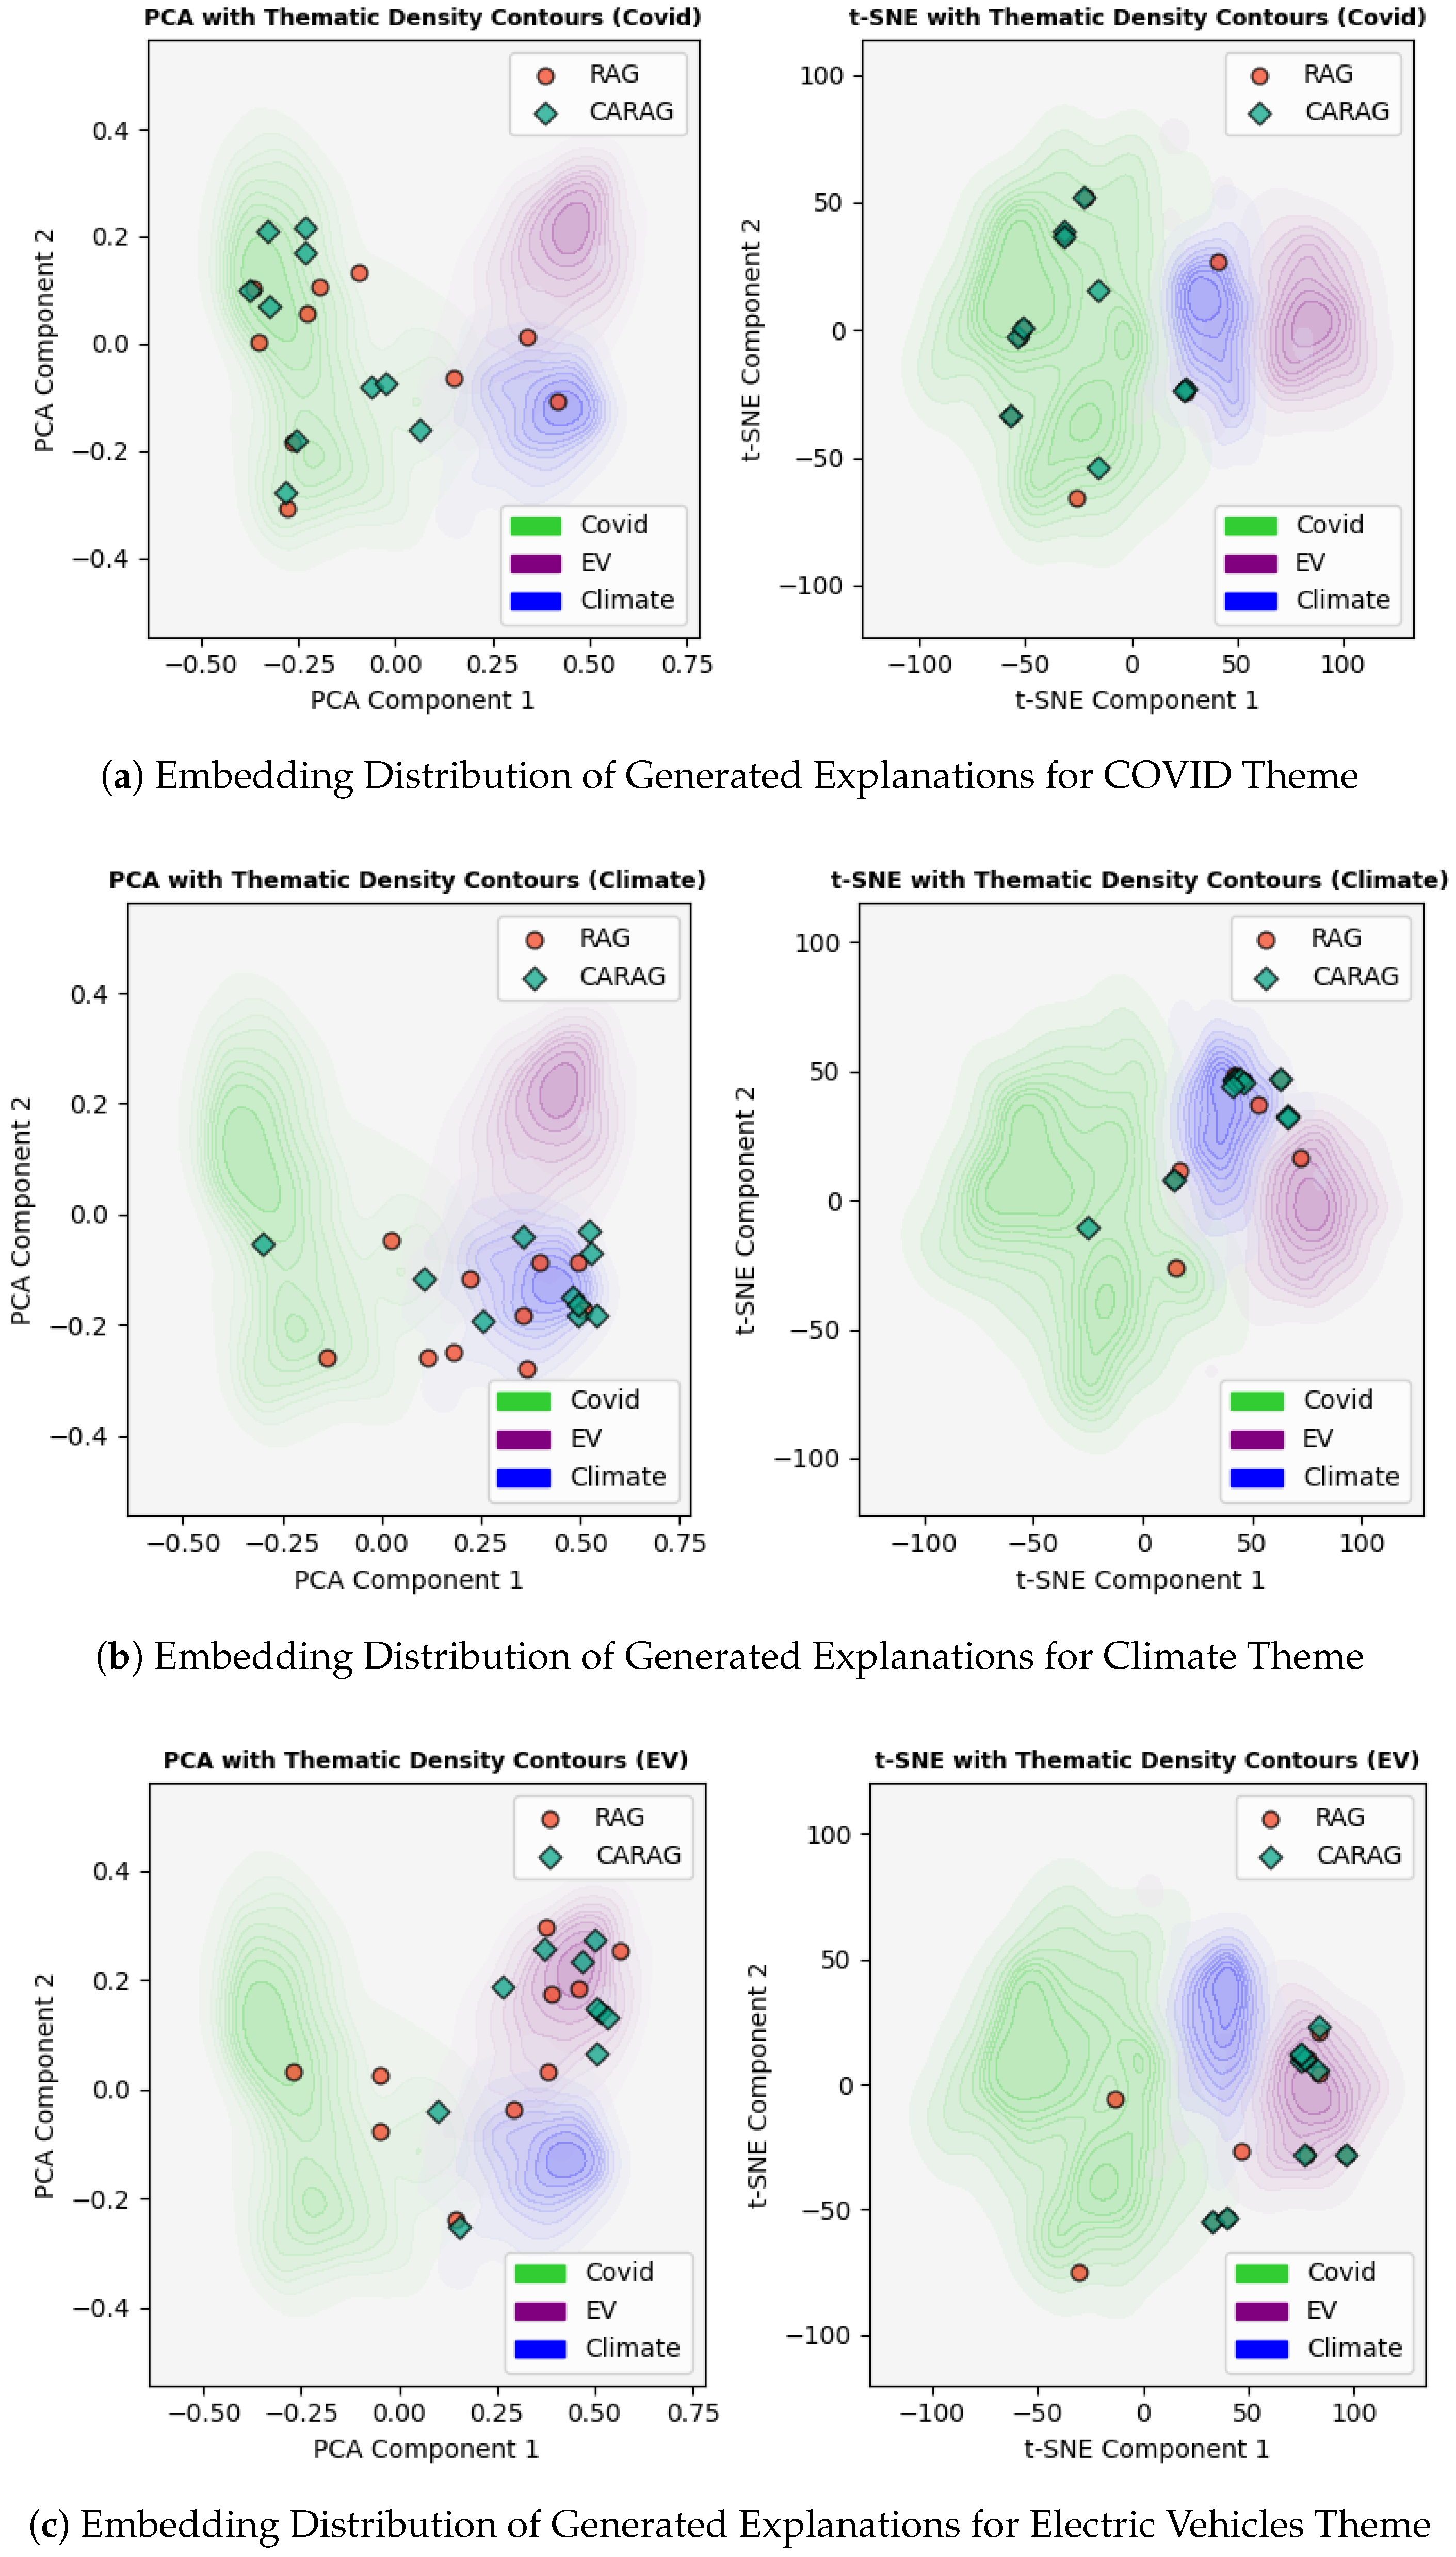
| Index | RAG (PCA) | CARAG (PCA) | Diff (PCA) | RAG (t-SNE) | CARAG (t-SNE) | Diff (t-SNE) |
|---|---|---|---|---|---|---|
| 0 | 0.1133 | 0.2263 | 0.1130 | 31.5851 | 31.5608 | -0.0242 |
| 1 | 0.1423 | 0.2506 | 0.1083 | 31.4120 | 31.4665 | 0.0544 |
| 2 | 0.3000 | 0.2720 | -0.0280 | 31.4419 | 31.4444 | 0.0025 |
| 3 | 0.1913 | 0.1995 | 0.0083 | 31.4158 | 31.4030 | -0.0128 |
| 4 | 0.0645 | 0.1354 | 0.0709 | 31.5440 | 31.4492 | -0.0948 |
| 5 | 0.1779 | 0.1736 | -0.0043 | 31.4712 | 31.4843 | 0.0132 |
| 6 | 0.1809 | 0.1767 | -0.0042 | 31.6878 | 31.5558 | -0.1320 |
| 7 | 0.6405 | 0.1687 | -0.4717 | 32.1598 | 31.6895 | -0.4704 |
| 8 | 0.3688 | 0.1994 | -0.1693 | 31.9011 | 31.7242 | -0.1769 |
| 9 | 0.5524 | 0.3178 | -0.2346 | 32.0992 | 31.8005 | -0.2987 |
| Average | 0.2732 | 0.2120 | -0.0612 | 31.6718 | 31.5578 | -0.1140 |
| Index | RAG (PCA) | CARAG (PCA) | Diff (PCA) | RAG (t-SNE) | CARAG (t-SNE) | Diff (t-SNE) |
| 0 | 0.0590 | 0.6626 | 0.6035 | 37.3316 | 37.8603 | 0.5287 |
| 1 | 0.2180 | 0.1234 | -0.0946 | 37.5164 | 37.2024 | -0.3139 |
| 2 | 0.0531 | 0.1442 | 0.0911 | 37.2505 | 37.2061 | -0.0443 |
| 3 | 0.1518 | 0.2534 | 0.1016 | 37.3610 | 37.5232 | 0.1623 |
| 4 | 0.1551 | 0.1397 | -0.0154 | 37.1891 | 37.1950 | 0.0060 |
| 5 | 0.1368 | 0.0855 | -0.0512 | 37.4192 | 37.2654 | -0.1538 |
| 6 | 0.2749 | 0.1878 | -0.0871 | 37.5750 | 37.1636 | -0.4115 |
| 7 | 0.3473 | 0.1930 | -0.1543 | 37.5689 | 37.1082 | -0.4607 |
| 8 | 0.1461 | 0.1789 | 0.0328 | 37.1552 | 37.1223 | -0.0329 |
| 9 | 0.5143 | 0.1252 | -0.3891 | 37.8044 | 37.4247 | -0.3797 |
| Average | 0.2056 | 0.2094 | 0.0037 | 37.4171 | 37.3071 | -0.1100 |
| Index | RAG (PCA) | CARAG (PCA) | Diff (PCA) | RAG (t-SNE) | CARAG (t-SNE) | Diff (t-SNE) |
| 0 | 0.1989 | 0.1155 | -0.0834 | 76.1226 | 76.1748 | 0.0522 |
| 1 | 0.6796 | 0.1405 | -0.5391 | 76.9621 | 76.4237 | -0.5385 |
| 2 | 0.4984 | 0.1093 | -0.3891 | 76.7383 | 76.1809 | -0.5574 |
| 3 | 0.1112 | 0.1338 | 0.0226 | 76.3114 | 76.1575 | -0.1540 |
| 4 | 0.4627 | 0.4668 | 0.0041 | 76.5504 | 76.5409 | -0.0095 |
| 5 | 0.0260 | 0.1643 | 0.1382 | 76.2979 | 76.1871 | -0.1108 |
| 6 | 0.1565 | 0.1188 | -0.0377 | 76.3120 | 76.3179 | 0.0059 |
| 7 | 0.2151 | 0.1403 | -0.0748 | 76.3986 | 76.1808 | -0.2178 |
| 8 | 0.4607 | 0.3522 | -0.1085 | 76.7354 | 76.5901 | -0.1453 |
| 9 | 0.0718 | 0.1159 | 0.0441 | 76.2318 | 76.2199 | -0.0119 |
| Average | 0.2881 | 0.1858 | -0.1023 | 76.4661 | 76.2973 | -0.1687 |
| Theme | RAG (PCA)Avg | CARAG (PCA) Avg | Diff (PCA) Avg | RAG (t-SNE) Avg | CARAG (t-SNE) Avg | Diff (t-SNE) Avg |
|---|---|---|---|---|---|---|
| Covid | 0.2732 | 0.2120 | -0.0612 | 31.6718 | 31.5578 | -0.1140 |
| Climate | 0.2056 | 0.2094 | 0.0037 | 37.4171 | 37.3071 | -0.1100 |
| Electric Vehicles | 0.2881 | 0.1858 | -0.1023 | 76.4661 | 76.2973 | -0.1687 |
| Overall Average | 0.2556 | 0.2024 | -0.0532 | 48.5183 | 48.3874 | -0.1309 |
Disclaimer/Publisher’s Note: The statements, opinions and data contained in all publications are solely those of the individual author(s) and contributor(s) and not of MDPI and/or the editor(s). MDPI and/or the editor(s) disclaim responsibility for any injury to people or property resulting from any ideas, methods, instructions or products referred to in the content. |
© 2025 by the authors. Licensee MDPI, Basel, Switzerland. This article is an open access article distributed under the terms and conditions of the Creative Commons Attribution (CC BY) license (http://creativecommons.org/licenses/by/4.0/).