
Submitted:
07 January 2025
Posted:
08 January 2025
You are already at the latest version
Abstract
Background: Increased demand of the serological biomarker test (GastroPanel®) in non-invasive diagnosis of gastric cancer (GC) risk conditions, i.e., atrophic gastritis (AG) and Helicobacter pylori (Hp) infection, prompted the design of GastroPanel® Quick test (GPQT)(Biohit Oyj, Helsinki, Finland) for point-of-care (POC) settings. Objective: This study validated the diagnostic accuracy (DA) of GPQT in diagnosis of AG and Hp among gastroscopy referral patients. Material and Methods: Altogether, 266 patients were enrolled among the consecutive gastroscopy referrals at the Department of Gastroenterology, Fortis Hospital (Mohali Chandigarh, India). All patients underwent gastroscopy with biopsies (n=249) classified using the Updated Sydney System (USS) and finger prick blood sampling for GPQT testing. Results: Biopsy-confirmed AG was found in 15.3% (38/249) of the patients. The overall agreement between the GPQT and the USS classification was 71.4% (95%CI 65.4-77.0%), with the weighted kappa (w) of 0.823 (95%CI 0.773-0.862). In ROC analysis for moderate/severe AG of the corpus (AGC) endpoint, AUC=0.990 (95%CI 0.979-1.000) and AUC=0.971 (95%CI 0.948-0.995) for PGI and PGI/PGII, respectively. Hp IgG Ab test detected biopsy-confirmed Hp with AUC=0.836 (95%CI 0.783-0.889). Conclusions: The accuracy of GPQT favourably competes with the ELISA test version (unified-GP) in diagnosis of AG and Hp in patients referred for diagnostic gastroscopy.
Keywords:
atrophic gastritis (AG)
; serological biomarker panel
; GastroPanel® Quick Test
; non-invasive diagnosis
; clinical validation
; diagnostic accuracy (DA)
; gastroscopy
; biopsies
; updated Sydney System (USS)
; Helicobacter pylori
; pepsinogen I
; pepsinogen II
; gastrin-17
; Hp IgG antibody
1. Introduction
In India, gastric cancer (GC) is the 7th most common cancer, with annual incidence of 4.5/100.000 (64.600 new cases) and annual mortality rate of 4.1/100.000 (57.000 GC deaths)[1]. Two risk factors of GC exceed all the others in importance: i) Helicobacter pylori (Hp) infection and ii) atrophic gastritis (AG)[2,3,4]. Hp is a Group 1 human carcinogen (IARC), shown to induce cancer via virulence factors, such as cagA, by mediating the manipulation of intracellular signaling and promoting neoplastic transformation of gastric epithelial cells [5], and Hp-induced AG is the single most important high-risk condition of GC [2,4,6]. The risk of GC increases in parallel with the severity of AG up to 90-fold in patients with severe AG both in the corpus and in the antrum (so called pan-gastritis; AGP)[2,3,4,7]. Of all Hp-infected patients (roughly 40-50% of the world population), 5-10% are estimated to eventually develop moderate to severe AG, if Hp is not effectively eradicated [7].
GC develops through a stepwise process known as Correa cascade [2], with mild, moderate and severe AG as intermediate steps [2,4]. Debate continues whether this cascade can be interrupted (or even reverted) by eradication of Hp-infection [3,6,8]. According to the Updated Sydney System (USS) classification, AG is named by its topographic location (antrum, corpus, or both) as AGA, AGC or AGP, respectively [9]. AG with or without Hp-involvement is frequently asymptomatic, but also associated with upper abdominal symptoms known as dyspepsia [9].
AG is usually diagnosed by esophago-gastro-duodenoscopy (EGD) and biopsies [2,9,11]. As an invasive method EGD is expensive, not free from complications, and felt uncomfortable by the patients, thus emphasizing the need for non-invasive tests with equivalent diagnostic accuracy (DA) [12]. The early studies in Japan testing pepsinogens (PGs) as serological biomarkers of AG [13,14] paved the way to the design of a 4-biomarker panel (GastroPanel® test) that combines serum pepsinogen I (PGI) and II (PGII), gastrin-17 (G-17), and Hp antibody (Hp IgG) as an ELISA test, by Biohit Oyj (Helsinki, Finland) [15]. Primarily used in diagnosis and screening of Hp-infections and AG, GP test also accurately measures the state of gastric acid output, but does not cover all potential causes of functional dyspepsia [12,15,16].
The GP test has gained increasing global interest, with rapidly increasing number of DA studies in different clinical and screening settings [17,18,19,20,21,22,23,24,25,26,27,28,29]. Accumulated literature has already been covered by three separate meta-analyses [30,31,32], consistently reporting sensitivity (SE) of 70-75% and pooled specificity (SP) close to 95% for the GP test in diagnosing AGC. The latest ELISA version of the GP test (unified-GP) harmonizes the laboratory processing conditions of the 4 biomarkers [33,34]. GastroPanel® quick test (GPQT) was developed for point-of care (POC) diagnosis during a single clinical appointment [35]. The results of GPQT (a lateral-flow test) are read in 15 minutes with the GastroPanel® Reader instrument (GP reader NT)[36], and their interpretation is based on the same diagnostic GastroSoft® algorithm as in the ELISA versions [16,25,33,34,35].
This is the first clinical validation study of GPQT in a cohort of gastroscopy referral patients in a major hospital in India (Fortis Hospital, Mohali Chandigarh). Due to the heavy burden of GC, the endoscopy capacity in the country is constantly overloaded, which offers a rational for adopting GPQT: i) to obtain cost savings by reducing unnecessary clinical appointments, ii) to speed up the access to clinical triage (EGD) of the patients when truly indicated, as well as iii) to allow more rational allocation of the limited endoscopy capacity while unnecessary EGD examinations can be avoided [35].
2. Materials and Methods
2.1. Materials
The patients were enrolled at the outpatient Department of Gastroenterology, Fortis Hospital, Mohali Chandigarh, India, among the consecutive patients referred for gastroscopy due to upper abdominal symptoms (dyspepsia). The potentially eligible patients (18 years or older) were identified among the gastroscopy referral outpatients, and were asked to sign a written consent. The exclusion criteria were the same as listed in the recent validation studies of previous GP test versions [26,27,33]. The study protocol followed the Declaration of Helsinki, and was approved by the Institutional Ethics Committee (Fortis Hospital) (02/09/2020).
A cohort of 266 patients completed the study protocol. The key characteristics of the patients and their history of dyspepsia-related symptoms are summarized in Table 1. Of the 266 patients, 50.8% (n=135) were women and 49.2% were men. The median age of the patients was 52 years (range 18-92 years).
2.2. Methods
2.2.1. Preparation for GPQT Sampling
Detailed instructions on the pre-sampling preparatory measures were given to the patient at the time of his/her consenting to participate. The patient was instructed to follow a 10-hour fasting overnight [34,35]. It was recommended to discontinue using gastric acid blockers (PPI-medication and H2-receptor antagonists) 7 days before the date of GPQT sampling (35), while medication neutralizing gastric acid secretion (i.e., antacids and mucosa protecting agents) was allowed to continue until the preceding day [15,16].
2.2.2. Completion of the GPQT Referral Form
Complete record of the Referral Form is an essential part of reliable GPQT testing, because the GastroSoft® application incorporates the key clinical information with the biomarker profile while creating the final GPQT report [15,16,34]. The clinical information recorded in the referral form includes the following specific questions: 1) A history of previously eradicated Hp-infection? If yes, was this done less or over a year ago? 2) Use of gastric acid blockers, and the interval (in days) in their usage before GPQT sampling? 3) Do you have reflux symptoms due to high acid output? and 4) Use of non-steroidal anti-inflammatory drugs (NSAIDs)? [26,27,34,35].
2.2.3. GastroPanel® Quick Test (GPQT)
GastroPanel® Quick Test (GPQT) is a lateral-flow test, based on immunoassay method detecting four biomarkers, PGI, PGII, G-17 and HpAb, from a blood sample (whole blood, plasma, or serum)[35]. The capability of the GPQT to provide the test results during a single clinical visit is a major advantage to the GastroPanel® ELISA versions that all need a clinical laboratory [15,16,34].
2.2.4. Sample Collection for GPQT
For GPQT, the whole blood sample can be obtained from fingertip blood drop. Finger-prick blood samples (2×40µl) are collected with disposable micropipettes, and transferred into the sample tubes pre-filled with sample dilution buffer [35].
2.2.5. Sample Processing for GPQT
Dispensed samples are transferred with disposable transfer pipettes from the sample tubes into the four sample holes (100µl into each hole) of the lateral-flow test cassette. The cassette is measured after 15 minutes using the GastroPanel® Reader instrument (GP reader NT)[36]. Results can be read on the reader screen and also printed. The printed report shows both numerical values of all biomarkers and a written interpretation of the test result [15,16,26,27,33,34,35].
2.2.6. Interpreting the GPQT Results
The results of the GPQT are interpreted by GastroSoft® application, designed for use with the Updated Sydney System (USS) classification of gastritis [9,11]. Both use the same diagnostic categories: 1) normal stomach mucosa, 2) Hp-induced gastritis (with no atrophy), 3) atrophic antrum gastritis (AGA), 4) atrophic corpus gastritis (AGC) and 5) atrophic pan-gastritis (AGP) [9,11,16,26,27,33,35,36].
2.2.7. Gastroscopy and Biopsies
Esophago-gastro-duodenoscopy (EGD) was performed by certificated endoscopists at the Department of Gastroenterology, Fortis Hospital, using videoscopes (GIF-H240, GIF-H260, or GIF-HQ290, Olympus, Tokyo, Japan) and following the routine procedures of the clinic. On EGD, the gastric mucosal atrophy was evaluated according to the endoscopic atrophic border scale described by Kimura and Takemoto and known as K-T classification [37]. K-T is an endoscopic classification of gastric atrophy as either 1) closed (C) or 2) open (O) type, both graded from 0 to III (C-0 to C-III, and O-0 to O-III) [37]. Grade 0 denotes no atrophy. While performing EGD, the endoscopists were blinded to the GPQT results. Apart from the K-T classification, a detailed description on all observed mucosal abnormalities (including impression of atrophy) were given, including their location in the esophagus, stomach, duodenal bulb and the second part of the duodenum.
2.2.8. Biopsy Protocols
Directed biopsies were taken according to the sampling protocol of the Updated Sydney System (USS). In each patient, routine biopsy specimens were taken from the antrum and corpus, at least two biopsies from each [9,11]. In addition, two extra biopsies were taken from the incisura angularis, and biopsies from the bulb and the second part of the duodenum, distal and mid esophagus were regularly taken [9,11]. Endoscopic biopsies were used as the reference (gold standard) test in calculating the DA of GPQT.
2.2.9. Interpretation of the Gastric Biopsies
All biopsies were examined by expert pathologists at the Department of Pathology, Fortis Hospital, and classified using the USS classification [9,11] as normal, Hp-gastritis, AGA, AGC and AGP (called USS original). All biopsies originally classified as AG (AGA, AGC or AGP) at Fortis Hospital were subjected to whole slide scanning by OS Ultra Scanner (OptraSCAN India Private Ltd., Pune, Maharashtra, India). The scanned whole slides were made available for re-viewing (in Finland) with OS Image Viewer (Optra IMAGEPath). The slides reviewed in Finland (by KS) were also classified using the USS system (named USS Revised).
2.2.10. Statistical Analyses
The descriptive statistics were calculated using the conventional tests. Sensitivity (SE), specificity (SP), positive predictive value (PPV), negative predictive value (NPV) and their 95%CI of the GPQT biomarkers (PGI, PGI/PGII, G-17) were calculated using the algorithm of Seed et al. (2001) [38]. ROC (Receiver Operating Characteristics) analysis was used to identify the optimal SE/SP balance for both endpoints (AGA and AGC), and AUC values were compared by the roccomb test [26,27]. The agreement between the different tests (and classifications) was calculated separately using overall agreement (OA) and intra-class correlation coefficient (ICC) test for weighted kappa (w). In addition, Fagan’s nomogram [39] was constructed to give the post-test predictions for detecting AGC at the population level, based on the indicators calculated for the AGC endpoint in the original cohort: i) the pre-test probability; ii) positive likelihood ratio (LR+), and iii) negative likelihood ratio [39]. Statistical analyses were performed using either SPSS 29.0.2.0 for Windows (IBM, NY, USA) or STATA/SE 18.0 software (STATA Corp., Texas, USA). All tests were interpreted significant at the level of p<0.05.
3. Results
Table 1 (above) summarizes the patients’ medical history recorded in the GPQT referral forms. Both genders were equally represented, and the median age of the patients was 52.0 years (range 18-92 years). Hp-infection was not previously diagnosed in the vast majority (83.8%) of the patients, and Hp-eradication was given to 24/266 (9%) patients only. Regular use of PPI medication was reported by 74% of the patients, while regular experience of symptoms due to high acidity were reported by 97%. The possible discontinuation of PPI-medication before GPQT sampling was not accurately recorded, and the same was true with the history of NSAID (non-steroidal anti-inflammatory drugs) medication.
Table 2 depicts the biomarker values (M±SD) in the five diagnostic categories of the GPQT. The values of all biomarkers fall within the range of the manufacturer’s reference values in each diagnostic category, with the exception of G-17b that shows values exceeding the reference range in two categories (normal, Hp-gastritis). In these two categories, also the PGI values are close to the upper limit (160 g/l).
Table 3 lists the biomarker levels stratified by the gastric biopsy histology (revised USS classification). The biomarker values in the five categories of the USS classification closely follow those of the five GPQT categories. The levels of G-17b values are substantially higher in the USS AGA category as compared with those in the GPQT AGA.
The agreement between GPQT and USS classification is shown in Table 4. Based on the revised USS, the stomach was graded normal in 146/249 (58.6%) of the patients. Hp-associated superficial gastritis (with no AG) was found in 26.1% (65/249) of the patients, AGA was diagnosed in 21 patients, AGC in 15 cases and AGP in 2 patients (Table 4). The overall agreement (OA) between the GPQT and the USS classification is 0.714 (i.e., 71.4%). The w for the GPQT-USS agreement is: w = 0.823 (95%CI 0.773-0.862).
The DA of the (GastroSoft®) AGA- and AGC-profiles of GPQT in detection of biopsy-confirmed AGA and AGC is summarized in Table 5. For AGA and AGA2+ endpoints, SE and PPV of the GPQT AGA profile are poor, while SP and NPV are high, resulting in AUC values between 0.569 and 0.648. In contrast, the AGC-profile predicts the biopsy-confirmed AGC and AGC2+ with high accuracy, AUC=0.933 and AUC=0.977, respectively.
Table 6 summarizes the diagnostic accuracy of GPQT biomarkers (PGI, PGI/PGII) and G-17b in detection of AGC and AGA, respectively, using two different cut-offs for PGI. G-17b is of limited value in diagnosing AGA and AGA2+, with AUC values of 0.532 and 0.585, respectively. Using the AGC2+ endpoint, the best DA (AUC=0.983) is obtained for PGI (30 g/l), followed by PGI (15 g/l) (AUC=0.929). PGI/PGII ratio (cutoff 3.0) did not reach the DA of PGI for either AGC or AGC2+.
Figure 1 shows the ROC curve for PGI using the AGC2+ endpoint, with the AUC=0.990 (95%CI 0.979-1.000).
The ROC curve for PGI/PGII ratio is only slightly inferior, with the AUC=0.971 (95%CI 0.948-0.995)(Figure 2). The DA of fasting G-17 (G-17b) in detection of AGA2+ was clearly inferior in ROC analysis, with AUC=0.675 (95%CI 0.480-0.870)(data not shown).
ROC analysis for Helicobacter IgG Ab test in detecting biopsy-confirmed Hp in the antrum and/or corpus is illustrated in Figure 3. DA of GPQT in Hp-detection is also very good: AUC=0.836 (95%CI 0-783-0.889).
The Fagan’s nomogram illustrated in Figure 4 was drawn by entering the diagnostic indicators of PGI for the AGC endpoint (Table 6), produced by STATA diagti algorithm [38]: i) the pre-test probability, 0.068; ii) LR+, 51.2, and iii) LR-, 0.12. The post-test probabilities in the Fagan’s nomogram indicate that AGC diagnosis of the GPQT predicts AGC in a comparable population with the likelihood of 79%, whereas this likelihood is <1%, if the GPQT result is negative for AGC.
4. Discussion
The present trial is the first clinical validation study of the GastroPanel® Quick test (GPQT) [35,36]. The results clearly confirm that the DA of the GPQT favorably competes with the previous GP ELISA-versions tested in different clinical and screening settings worldwide [16,17,18,19,20,21,22,23,24,25,26,27,28,29]. In the most recent meta-analysis (in 2022) including 49 studies and 22.597 patients, GP test had pooled SE of 0.70 (95%CI=0.64-0.76) and pooled SP of 0.93 (95%CI=0.90-0.95), with AUC=0.900 (95%CI=0.170-1.000) in diagnosis of AGC [32]. Meta-regression disclosed publication year (<2008>) as the only significant study-level covariate of heterogeneity, implicating that the GP test performance in the studies published after 2008 e.g., [25,26,27,28,29,40,41,42,43,44] is constantly improving [e.g. 18-24]. For unified-GP, AUC values exceeding 0.950 have been reported [26,33]. This posed substantial challenges for the designers of the GPQT [35,36], which should demonstrate DA not inferior to the latest ELISA test version [26,27,33,41].
Several good reasons exist, however, to justify complementing the GP-ELISA test [15,16] with a POC-test format [35,36]. While capable of offering the same range of diagnoses as the GP-ELISA test but at one and the same clinical appointment, the GPQT test offers several advantages that all have one feature in common: substantial savings in health care costs. These issues are increasingly important in countries with heavy burden of GC [1,2,9,11]. These arguments were relevant enough to convince Fortis Hospital in India to approve the novel GPQT for clinical testing in their gastroenterology clinic.
A cohort of 266 gastroscopy referral patients consented to participate in this study (Table 1). As compared with a similarly designed study in Finland (for unified-GP)[33], these two cohorts share similarities (mean age, Hp-eradication history), but also important differences, particularly in the usage of PPI-medication (42% vs. 74%) and frequency of symptoms due to high acidity (33.1% vs. 97.4%). These differences make us anticipate differences also in the GP test results in these two cohorts [33]. Such major difference between the two cohorts were detected in their prevalence of Hp-infection: 6.7% in Finland (33) and 39.8% in India (Table 2). However, even the latter is not among the highest encountered in GP studies, e.g. in Kazakhstan [43] and in Russia [41,42], both showing Hp-prevalence close to 70%. One might expect that testing populations with such a divergent risk profile [16] would make the GP testing perform differently [33,41,42,43]. However, this does not seem to be the case, as confirmed by the three meta-analyses [30,31,32], all failing to demonstrate the geographic study origin as a significant source of heterogeneity. This is in perfect agreement with the results of the present study where the DA of the GPQT was practically identical with the DA of unified-GP test [33], despite these dissimilarities in the study cohorts. This is another argument in favor of the uniform performance of the GP test, which does not depend on the target populations [12,16,18,19,20,21,22,23,24,25,26,27,28,29,33,40,41,42,43,44].
The biomarker levels in the five diagnostic GPQT profiles disclosed some irregularities (Table 2) that deserve a mention here [26,27,33,41]. Referring to the manufacturer recommended reference values [15,16,27,35], of note are slightly increased levels of PGI that exceed the upper cut-off (160 g/l) in the “normal” and “Hp-gastritis” categories, and the levels of G-17b that are clearly higher than expected (normal range: 1-7 pmol/l), in these two categories [15,35]. This increase is explained by two well-known features of the GP biomarkers [15,16,35,45]. PGI and G-17 are biomarkers of inflammation that increase in ongoing Hp-infection and normalize after Hp-eradication [15,16,45]. Also PPI-medication causes a substantial increase of both PGI and G-17 [15,16,45]. Almost 75% of the patients in our cohort used PPI-medication (with no data on discontinuation before GPQT sampling), which would neatly explain the elevated PGI and G-17b levels in an otherwise normal GPQT profile (Table 2). These same deviations are seen when the biomarker levels are stratified by the 5 diagnostic USS categories in the biopsies (Table 3). Discontinuation of the PPI medication 7 days before GP testing would result in disappearance of this irregular (G-17 and PGI) biomarker profile [16,33,45,48].
The role of G-17 as an integral component of the GP test has been discussed in detail in two reviews [12,16]. Importantly, G-17 biomarker plays a dual role: i) it measures the activity and mucosal status of the antrum directly, and ii) functional activity and mucosal integrity of the corpus indirectly [16]. Accordingly, the use of G-17 as a stand-alone marker cannot separate between a) AGA, b) AGP, and c) status of gastric acid output [16]. The latter includes disturbances in acid output either by the use of PPI medication or due to mucosal atrophy in cases of AGC and AGP [12]. To make accurate distinction between these conditions, the full 4-biomarker GastroPanel® test is needed, including biomarkers that measure both topographic stomach sites (antrum and corpus) directly and not only indirectly, i.e., G-17, and PGI & PGII, respectively [16]. For the diagnosis of AGA by G-17, the reader is referred to the discussion of Table 5 results that follows. A brief account is given here on the biomarker profiles caused by PPI medication, because pertinent to the present cohort with almost 75% of PPI-user frequency (Table 2).
Any gastric acid-suppressive medication will inevitably interfere with the profile of the GP biomarkers [16]. PPI and H2-blockers effectively reduce gastric acid production by parietal cells [12,16,27,45]. This increases the output of G-17b and also that of both PGs. Once the PPI/H2-blocker treatment is discontinued, it takes 4-10 days for acid output and G-17b levels to normalize. However, PGs respond more slowly, and PGI and PGII levels may remain above the cut-off values for up to 2-3 weeks [16,45]. Of note, an abrupt termination of long-term PPI medication is typically followed by rebound acid hypersecretion, frequently accompanied by symptoms of hyper-acidity and extremely low levels of G-17b [16,45]. To enable an unbiased assessment of the biomarker profiles, the manufacturer recommends that the patient discontinues any acid-suppressive treatment for 10 days before serum/plasma sampling [16,27,45]. This withdrawal of PPI or H2-blocker medication is not always possible because of intractable symptoms, and to acknowledge this, the latest version of GastroSoft® was designed to take into account the continued use of PPI medication [16,45]. In this context, essential information includes i) an accurate recording of the PPI/H2-medication, ii) information of whether or not the medication was discontinued, and if so, iii) for how many days before GP sampling. In the present cohort, the later information was incomplete, unfortunately (Table 2).
The two most widely used histological classifications of gastritis are: 1) the Updated Sydney System (USS) [9,11] and 2) the OLGA/OLGIM staging [46]. The GP test was optimized for use with the USS, both including 5 diagnostic categories [9,11,15,16,26,33,35], which makes it straightforward to calculate the agreement between the two methods. Despite the good inter-rater reproducibility of the USS [9,11,16], challenges are encountered in classifying mild atrophy even among experienced pathologists [9,11,16]. In this study, the original (Fortis) and revised (Finland) USS classification had a very good agreement: weighted kappa, w=0.844 (95%CI 0.800-0.878), and OA=83.9% (95%CI 79.3-88.4%), formally ranking as an “almost perfect agreement” [47]. Divergent ranking of the AGA in Fortis and in Finland; 49 and 21 cases, respectively, caused the majority of the observed disagreement.
GPQT and USS classification were closely agreed: w =0.823 and OA of 71.4% (95%CI 65.4-77.0%)(Table 4), representing “almost perfect” (0.8-1.0) and “substantial” (0.6-0.8) agreement, respectively [47]. This lends further support to the statement that the GP test bears a close concordance with the USS classification [12,15,16,17,18,19,20,21,22,23,24,25,26,27,30,31,32,33,48]. In this context, a word of caution must be stated against the use of OLGA staging [46] for GP validation. Because OLGA staging combines different grades of AGA and AGC into one and the same OLGA stage [46], this obscures an accurate linking of specified GP biomarker profiles to individual OLGA stages [15,16,30,32,48].
GastroSoft® application defines biomarker profiles distinct for AGA (low G-17b and G-17s, Hp+) and AGC (low PGI, PGI/PGII ratio, high G-17b) [15,16,26,27,33,45,48], which can be used for testing the DA of GPQT separately for biopsy-confirmed AGA and AGC (Table 5). The SE of the AGA profile in diagnosis of AGA (n=21) is low (14.3-30.0%), whereas SP is high (>99%), resulting in AUC values between 0.569 and 0.648. This is in sharp contrast to AGC, where GastroSoft® AGC profile detects the biopsy-confirmed AGC2+ with 100% SE and 95.4% SP, equivalent to AUC=0.977. The DA for AGC (all grades) is only slightly inferior (AUC=0.933). The reasons for the divergent DA for AGA and AGC are explained by the inherent characteristics of the GastroPanel® biomarkers, as explained in the following.
First: The GP test has been designed to include biomarkers that measure the function and structure of both the antrum (G-17b, G-17s) and the corpus (PGI, PGII, PGI/PGII ratio) [12,15,16,33,45,48]. Accordingly, completely different GP biomarker profiles reflect this topographic location of AG, and because of this, AGA and AGC should not be combined as a single entity “chronic atrophic gastritis” in any study assessing the diagnostic accuracy of the GP test [12,15,16,33,45,48]. Second: As also shown in the present study, mild AGA and mild AGC are poorly reproducible histopathological diagnoses [9,11,16,45,48], and should never be used as the endpoint while calculating the DA of PGI (PGI/PGII) and G-17, respectively [16,48]. Instead, only moderate/severe AG (AGC2+, AGA2+) should be used in these calculations.
Third: Low G-17b values are due to high acid output of the corpus in the vast majority of patients, while AGA is a far more uncommon cause of low G-17b [9,11,15,16,19,25,26,27,33,45,48]. In the present cohort, there were 21 cases classified as AGA (Table 4), whereas 259 patients reported symptoms of high gastric acid output (Table 1). Because of this dual regulation of the antral G-17, the fasting level (G-17b) of this biomarker cannot accurately indicate only AGA [12,15,16,19,33,45,48]. In this respect, protein-stimulated G-17 (G-17s) is more helpful, but truly low levels of G-17s are encountered only in moderate/severe AGA when the antral G-cells are about to disappear [30,53]. Due to these inherent physiological characteristics of the GP biomarkers, the DA of GP test in detection of AGA never reaches the high level typically achieved in diagnosis of AGC [16,25,26,27,33,45,48].
When the cut-off values of the biomarkers were used instead of the GastroSoft® AGA/AGC profiles, the differences in the DA for AGA and AGC persist (Table 6). G-17b cut-off (1.0 pmol/l) has very low SE (9.5%) but very high SP (>96%) in diagnosing AGA (any grade), which improve to 20% and 97.1%, respectively, for the AGA2+ endpoint. Of the two cut-offs tested for PGI (15 and 30 g/l), the latter is clearly superior (by >20%) in SE for both AGC (all) and AGC2+, while SP is unaffected. For the AGC2+ endpoint, the highest DA (AUC=0.983) was obtained with PGI at 30 g/l cut-off, instead of the PGI/PGII ratio (3.0 cut-off), which proved to be the best in our recent study [33]. These outstanding AUC values are confirmed also by ROC analysis for PGI and PGI/PGII (Figure 1 and Figure 2), both being clearly superior to the pooled AUC values (AUC=0.900) in the latest meta-analysis [32]. Thus, in this setting of gastroscopy referral patients in India, the new GPQT exceeds the DA of the GP testing reported in the majority of the previously published clinical studies [16,19,20,21,22,23,24,25,26,27,28,29,30,31,32,33,40,41,42,43,44].
The Hp IgG ELISA component of the unified-GP test was recently tested in a population with a high (64%) prevalence of Hp-infection, showing a 91% agreement with Hp-detection in biopsies [27]. In the present cohort with Hp-prevalence of 26.1% (Table 3), the DA of the GPQT Hp IgG Ab test had AUC=0.836 (Figure 3). Although slightly inferior to Hp IgG Ab ELISA testing, this AUC value is still ranked within the highest accuracy category of ROC analysis [27]. A detailed discussion on the wide subject of Hp-testing falls outside the scope of this communication, however.
The figures in the Fagan’s nomogram [39], implicate that an AGC result in GPQT test predicts AGC in a population with 79% likelihood, and this likelihood is below 1% if the GPQT result is negative for AGC (Figure 4). These positive and negative post-test probabilities are almost identical with those reported recently for the unified-GP test in Finland [33]. This is yet another indication on the uniform performance of the GP test, irrespective of the test version and the target population [16,48]. Assuming that the present cohort is representative of the local population in this region, the pre-test probability of AGC (6.8%) should closely reflect the AGC prevalence in this region of India [39].
5. Conclusions
The results of this first clinical validation study on the new GastroPanel® Quick test clearly confirm that the DA of the new GPQT test favorably competes with the ELISA test versions in diagnosis of AGC and Hp-infection in patients referred for gastroscopy [30,31,32,33,48]. As already well established for the other GP test versions [15,16,33,48], G-17b alone is not an accurate biomarker of AGA. Being closely concordant with the biopsy histology, GPQT offers an outstanding new tool for the POC diagnosis of GC risk conditions (AG and Hp-infection) at one and the same clinical appointment. Apart from its technical excellence, the adoption of GPQT in the clinical management of the patients at high-risk for GC offers several advantages: i) obtains cost savings by reducing unnecessary clinical appointments, ii) speeds up the access of the patients to clinical triage (EGD) when truly indicated, as well as iii) allows more rational allocation of the endoscopy resources when unnecessary EGD examinations are avoided [35].
Author Contributions
Conceptualization, M.C., P.H and A.K.; methodology, P.H., S.C. and A.J.; software, K.S.; validation, M.K., H.H. and P.H.; formal analysis, K.S.; investigation, M.C., A.K., S.C., A.J.; resources, M.C., A.K., S.C. and A.J.; data curation, K.S.; writing - original draft preparation, K.S.; writing - review and editing, M.C., A.K., M.K., H.H. and P.H.; visualization, S.C and A.J.; supervision, P.H.; project administration, P.H., A.K.; funding acquisition, P.H. and A.K. All authors have read and agreed to the published version of the manuscript.
Funding
This research was sponsored by Biohit Oyj (Helsinki, Finland) as part of their R & D project of the novel GPQT test.
Institutional Review Board Statement
The study was conducted in accordance with the Declaration of Helsinki, and approved by the Institutional Ethics Committee of Fortis Hospital (02/09/2020).
Informed Consent Statement
Informed consent was obtained from all subjects involved in the study.
Data Availability Statement
The original data including all recorded information of the study subjects and their examinations (including the results of the GPQT) are available from the study sponsor upon reasonable request.
Acknowledgments
This study was funded by a non-restricted research grant from Biohit Oyj (Helsinki, Finland). Special thanks are due to the patients at the Fortis Hospital, who consented to participate in this study and by so doing made the completion of the clinical validation study possible.
Conflicts of Interest
Of the authors, PH, HH and MK are employees of the study sponsor (Biohit Oyj). KS is the retired Chief Medical Director of Biohit Oyj, performing the data analysis and writing the manuscript draft as part of his consultancy agreement. AK is a shareholder/stakeholder in GastroLab India Pvt Ltd. None of the other authors have any COI to declare.
Abbreviations
The following abbreviations are used in this manuscript:
| GC | Gastric cancer |
| AG | Atrophic gastritis |
| Hp | Helicobacter pylori |
| GPQT | GastroPanel® Quick test |
| POC | Point-of-care |
| DA | Diagnostic accuracy |
| USS | Updated Sydney System |
| AGA | Atrophic antrum gastritis |
| AGC | Atrophic corpus gastritis |
| AGP | Atrophic pan-gastritis |
| AUC | Area under ROC curve |
| ROC | Receiver operating characteristics |
| PGI | Pepsinogen I |
| PGII | Pepsinogen II |
| G-17 | Gastrin-17; G-17b (basal), G-17s (stimulated) |
| ELISA | Enzyme-linked immunosorbent assay |
| IARC | International Agency of Research on Cancer |
| EGD | Esophago-gastro-duodenoscopy |
| SE | Sensitivity |
| SP | Specificity |
| PPV | Positive predictive value |
| NPV | Negative predictive values |
| K-T | Kimura-Takemoto classification |
| ICC | Intra-class correlation coefficient |
| LR+ | Positive likelihood ratio |
| LR- | Negative likelihood ratio |
| kw | Weighted kappa test |
| OA | Overall agreement |
| PPI | Proton pump inhibitor |
| NSAID | Non-steroidal anti-inflammatory drugs |
| AGA2+ | Moderate/Severe atrophic antrum gastritis |
| AGC2+ | Moderate/Severe atrophic corpus gastritis |
| GP | GastroPanel® |
| H2 | Histamin-2 receptor |
| OLGA | Operative link to gastric atrophy |
| OLGIM | Operative link to gastric intestinal metaplasia |
| G-cells | Gastrin-secreting cells |
References
- Bray, F.; Laversanne, M.; Sung, H.; Ferlay, J.; Siegel, R.L.; Soerjomataram, I.; Jemal, A. Global cancer statistics 2022: GLOBOCAN estimates of incidence and mortality worldwide for 36 cancers in 185 countries. CA Cancer J Clin 2024, 74, 229–263. [Google Scholar] [CrossRef]
- Correa, P.; Haenszel, W.; Cuello, C.; Zavala, D.; Fontham, E.; Zarama, G.; Tannenbaum, S.; Collazos, T.; Ruiz, B. Gastric precancerous process in a high-risk population: cohort follow-up. Cancer Res 1990, 50, 4737–4740. [Google Scholar] [PubMed]
- Marshall, B.J.; Warren, J.R. Unidentified curved bacilli in the stomach of patients with gastritis and peptic ulceration. Lancet 1984, 1, 1311–1315. [Google Scholar] [CrossRef]
- Sipponen, P.; Marshall, B.J. Gastritis and gastric cancer. Western countries. Gastroenterol Clin North Am 2000, 29, 579–592. [Google Scholar] [CrossRef] [PubMed]
- Hatakeyama, M. Structure and function of Helicobacter pylori CagA, the first-identified bacterial protein involved in human cancer. Proc Jpn Acad Ser B Phys Biol Sci 2017, 93, 196–219. [Google Scholar] [CrossRef]
- Malfertheiner, P.; Sipponen, P.; Naumann, M. H. pylori-Gastric Cancer Task Force. Helicobacter pylori eradication has the potential to prevent gastric cancer: a state-of-the-art critique. Am J Gastroenterol 2005, 100, 2100–2115. [Google Scholar] [CrossRef]
- Malfertheiner, P.; Megraud, F.; Rokkas, T.; Gisbert, J.P.; Liou, J.M.; Schulz, C.; Gasbarrini, A.; Hunt, R.H.; Leja, M.; O'Morain, C.; Rugge, M.; Suerbaum, S.; Tilg, H.; Sugano, K.; El-Omar, E.M. European Helicobacter and Microbiota Study group. Management of Helicobacter pylori infection: the Maastricht VI/Florence consensus report. Gut Online ahead of print. 2022. [Google Scholar] [CrossRef]
- Plummer, M.; Franceschi, S.; Munoz, N. Epidemiology of gastric cancer. IARC Sci Publ 2004, 157, 311–326. [Google Scholar] [PubMed]
- Dixon, M.F.; Genta, R.M.; Yardley, J.H.; Correa, P. Classification and grading of gastritis. The updated Sydney System. International Workshop on the Histopathology of Gastritis, Houston 1994. Am J Surg Pathol 1996, 20, 1161–1181. [Google Scholar] [CrossRef]
- Moayyedi, P.; Talley, N.J.; Fennerty, M.B.; Vakil, N. Can the clinical history distinguish between organic and functional dyspepsia? JAMA 2006, 295, 1566–1576. [Google Scholar] [CrossRef] [PubMed]
- Sipponen, P.; Price, A.B. The Sydney system for classification of gastritis 20 years ago. J Gastroenterol Hepatol 2011, 26 (Suppl. 1), 31–34. [Google Scholar] [CrossRef] [PubMed]
- Agréus, L.; Kuipers, E.J.; Kupcinskas, L.; Malfertheiner, P.; Di Mario, F.; Leja, M.; Mahachai, V.; Yaron, N.; van Oijen, M.; Perez- Perez, G.; Rugge, M.; Ronkainen, J.; Salaspuro, M.; Sipponen, P.; Sugano, K.; Sung, J. Rationale in diagnosis and screening of atrophic gastritis with stomach-specific plasma biomarkers. Scand J Gastroenterol 2012, 47, 136–147. [Google Scholar] [CrossRef] [PubMed]
- Miki, K.; Ichinose, M.; Shimizu, A.; Huang, S.C.; Oka, H.; Furihata, C.; Matsushima, T.; Takahashi, K. Serum pepsinogens as a screening test of extensive chronic gastritis. Gastroenterol Jpn 1987, 22, 133–141. [Google Scholar] [CrossRef] [PubMed]
- Samloff, I.M.; Varis, K.; Ihamäki, T.; Siurala, M.; Rotter, J.I. Relationships among serum pepsinogen I, serum pepsinogen II, and gastric mucosal histology. A study in relatives of patients with pernicious anemia. Gastroenterol 1982, 83, 204–209. [Google Scholar] [CrossRef] [PubMed]
- Biohit HealthCare. GastroPanel. Available at: https://www.gastropanel.com/healthcare-professionals-and-laboratories/forms-and-instructions (Last access on October 17, 2024).
- Syrjänen, K.; Eskelinen, M.; Peetsalu, A.; Sillakivi, T.; Sipponen, P.; Härkönen, M.; Paloheimo, L.; Mäki, M.; Tiusanen, T.; Suovaniemi, O.; DiMario, F.; Fan, Z.P. GastroPanel® Biomarker Panel: The most comprehensive test for Helicobacter pylori infection and its clinical sequelae. A critical review. Anticancer Res 2019, 39, 1091–1104. [Google Scholar] [CrossRef]
- Iijima, K.; Abe, Y.; Kikuchi, R.; Koike, T.; Ohara, T.; Sipponen, P.; Shimosegawa, T. Serum biomarker tests are useful in delineating between patients with gastric atrophy and normal, healthy stomach. World J Gastroenterol 2009, 15, 853–859. [Google Scholar] [CrossRef] [PubMed]
- Di Mario, F.; Moussa, A.M.; Caruana, P.; Merli, R.; Cavallaro, L.G.; Cavestro, G.M.; Dal Bo, N.; Iori, V.; Pilotto, A.; Leandro, G.; Franzé, A.; Rugge, M. Serological biopsy in first-degree relatives of patients with gastric cancer affected by Helicobacter pylori infection. Scand J Gastroenterol 2003, 38, 1223–1227. [Google Scholar] [CrossRef]
- Väänänen, H.; Vauhkonen, M.; Helske, T.; Kääriäinen, I.; Rasmussen, M.; Tunturi-Hihnala, H.; Koskenpato, J.; Sotka, M.; Turunen, M.; Sandström, R.; Ristikankare, M.; Jussila, A.; Sipponen, P. Non-endoscopic diagnosis of atrophic gastritis with a blood test. Correlation between gastric histology and serum levels of gastrin-17 and pepsinogen I: a multi-centre study. Eur J Gastroenterol Hepatol 2003, 15, 885–891. [Google Scholar] [CrossRef]
- Hartleb, M.; Wandzel, P.; Waluga, M.; Matyszczyk, B.; Bołdys, H.; Romanczyk, T. Non-endoscopic diagnosis of multifocal atrophic gastritis; efficacy of serum gastrin-17, pepsinogens and Helicobacter pylori antibodies. Acta Gastroenterol Belg 2004, 67, 320–326. [Google Scholar] [PubMed]
- Pasechnikov, V.D.; Chukov, S.Z.; Kotelevets, S.M.; Mostovov, A.N.; Mernova, V.P.; Polyakova, M.B. Possibility of non-invasive diagnosis of gastric mucosal precancerous changes. World J Gastroenterol 2004, 10, 3146–3150. [Google Scholar] [CrossRef] [PubMed]
- Pasechnikov, V.D.; Chukov, S.Z.; Kotelevets, S.M.; Mostovov, A.N.; Mernova, V.P.; Polyakova, M.B. Invasive and non-invasive diagnosis of Helicobacter pylori-associated atrophic gastritis: a comparative study. Scand J Gastroenterol 2005, 40, 297–301. [Google Scholar] [CrossRef]
- Nardone, G.; Rocco, A.; Staibano, S.; Mezza, E.; Autiero, G.; Compare, D.; De Rosa, G.; Budillon, G. Diagnostic accuracy of the serum profile of gastric mucosa in relation to histological and morphometric diagnosis of atrophy. Aliment Pharmacol Ther 2005, 22, 1139–1146. [Google Scholar] [CrossRef]
- Graham, D.Y.; Nurgalieva, Z.Z.; El-Zimaity, H.M.; Opekun, A.R.; Campos, A.; Guerrero, L. Noninvasive versus histologic detection of gastric atrophy in a Hispanic population in North America. Clin Gastroenterol Hepatol 2006, 4, 306–314. [Google Scholar] [CrossRef] [PubMed]
- Storskrubb, T.; Aro, P.; Ronkainen, J.; Sipponen, P.; Nyhlin, H.; Talley, N.J. Serum biomarkers provide an accurate method for diagnosis of atrophic gastritis in a general population: the Kalixanda study. Scand J Gastroenterol 2008, 43, 1448–1455. [Google Scholar] [CrossRef]
- Koivurova, O.-P.; Ukkola, O.; Koivikko, M.; Ebeling, T.; Yliaska, I.; Koskela, R.; Blomster, T.; Ala-Rämi, A.; Kettunen, O.; Karttunen, T.J.; Mäkinen, M.; Ronkainen, J.; Syrjänen, K. Screening of the patients with autoimmune thyroid disease (AITD) and type 1 diabetes mellitus (DM1) for atrophic gastritis (AG) by serological biomarker testing (GastroPanel®). EC Gastroenterol Digest Syst 2020, 7, 181–195. [Google Scholar]
- Mäki, M.; Söderström, D.; Paloheimo, L.; Hendolin, P.; Suovaniemi, O.; Syrjänen, K. Helicobacter pylori (Hp) IgG ELISA of the new-generation GastroPanel® is highly accurate in diagnosis of Hp-Infection in gastroscopy referral patients. Anticancer Res 2020, 40, 6387–6398. [Google Scholar] [CrossRef]
- Sanchez-Lopez, J.Y.; Diaz-Herrera, L.C. Pepsinogen I, pepsinogen II, gastrin-17, and Helicobacter pylori serological biomarkers in the diagnosis of precursor lesions of gastric cancer. Arch Med Sci 2024, 20, 1016–1021. [Google Scholar] [CrossRef] [PubMed]
- Chapelle, N.; Petryszyn, P.; Blin, J.; Leroy, M.; Le Berre-Scoul, C.; Jirka, I. A panel of stomach-specific biomarkers (GastroPanel®) for the diagnosis of atrophic gastritis: A prospective, multicenter study in a low gastric cancer incidence area. Helicobacter 2020, 25, e12727. [Google Scholar] [CrossRef] [PubMed]
- Syrjänen, K. A Panel of serum biomarkers (GastroPanel®) in non-invasive diagnosis of atrophic gastritis. Systematic review and meta-analysis. Anticancer Res 2016, 36, 5133–5144. [Google Scholar] [CrossRef]
- Zagari, R.M.; Rabitti, S.; Greenwood, D.C.; Eusebi, L.H.; Vestito, A.; Bazzoli, F. Systematic review with meta-analysis: Diagnostic performance of the combination of pepsinogen, gastrin-17 and anti-Helicobacter pylori antibodies serum assays for the diagnosis of atrophic gastritis. Aliment Pharmacol Ther 2017, 46, 1–11. [Google Scholar] [CrossRef]
- Syrjänen, K. Accuracy of serum biomarker panel (GastroPanel®) in diagnosis of atrophic gastritis of the corpus (AGC). Systematic review and meta-analysis. Anticancer Res 2022, 42, 1679–1696. [Google Scholar] [CrossRef] [PubMed]
- Koivurova, O.P. ; Koskela, R:, Blomster, T.; Ala-Rämi, A.; Lumme, H.; Kettunen, O.; Hukkanen, J.; Karttunen, T.J.; Mäkinen, M.; Ronkainen, J.; Syrjänen, K. Serological biomarker panel in diagnosis of atrophic gastritis and Helicobacter pylori infection in gastroscopy referral patients. Clinical validation of the new-generation GastroPanel® test. Anticancer Res 2021, 41, 5527–5537. [Google Scholar] [CrossRef] [PubMed]
- Biohit HealthCare. GastroPanel. Available at: GastroPanel® ELISA - Biohit (biohithealthcare.com) Last accessed on October 23, 2024].
- GastroPanel quick test NT. Available online: https://www.biohithealthcare.com/en/products/gastropanel-quick-test-nt/.
- https://www.biohithealthcare.com/wp-content/uploads/2023/12/GPQTNT_402230en_2.1_UG_FINAL_20231219.
- Kimura, K.; Takemoto, T. An endoscopic recognition of the atrophic border and its significance in chronic gastritis. Endoscopy 1969, 1, 87–97. [Google Scholar] [CrossRef]
- Seed, P.T.; Tobias, A. Summary statistics for diagnostic tests. Stata Techn Bull 2001, 59, 9-12. https://www.researchgate.net/publication/24137572_Summary_statistics_for_diagnostic_tests.
- Fagan, T.J. Letter: nomogram for Bayes theorem. N Engl J Med 1975, 293, 257. [Google Scholar] [CrossRef]
- Ebule, A.I.; Ndze, V.N.; Thierry, N.K.; Etienne, G.; Ornella, M.M.M.; Aurelien, M.A.; Dominique, N.N.; Mäki, M.; Syrjänen, K. Association of Helicobacter pylori infection and atrophic gastritis with chronic renal insufficiency in Yaounde Cameroon, using GastroPanel® serological biomarker panel (Pepsinogen I; Pepsinogen II; Gastrin-17; Helicobacter pylori IgG). JAMB 2021, 21, 62–67. [Google Scholar] [CrossRef]
- Bakulina, N.; Tikhonov, S.; Malkov, V.; Vorobyev, S.; Belyakov, I.; Peshkova, N.; Belko, E.; Syrjänen, K. Non-invasive screening of autoimmune atrophic gastritis (AAG) in asymptomatic subjects by serological biomarker (GastroPanel®) test. Anticancer Res 2022, 42, 1517–1526. [Google Scholar] [CrossRef] [PubMed]
- Roman, L.D.; Lukyanchuk, R.; Sablin, O.A.; Araslanova, E.I.; Eklund, C.; Hendolin, P.; Paloheimo, L.; Syrjänen, K. Prevalence of infection and atrophic gastritis in a population-based screening with serum biomarker panel (GastroPanel®) in St. Petersburg. Anticancer Res 2016, 36, 4129–4138. [Google Scholar] [PubMed]
- Benberin, V.; Bektayeva, R.; Karabayeva, R.; Lebedev, A.; Akemeyeva, K.; Paloheimo, L.; Syrjänen, K. Prevalence of H.pylori infection and atrophic gastritis among asymptomatic and dyspeptic adults in Kazakhstan. A Hospital-Based screening with a panel of serum biomarkers. Anticancer Res 2013, 33, 4595–4602. [Google Scholar] [PubMed]
- Sivandzadeh, G.R.; Zadeh Fard, S.A.; Zahmatkesh, A.; Anbardar, M.H.; Lankarani, K.B. Value of serological biomarker panel in diagnosis of atrophic gastritis and Helicobacter pylori Infection. Middle East J Dig Dis 2023, 15, 37–44. [Google Scholar] [CrossRef]
- Paloheimo, L.; Tiusanen, T.; Suovaniemi, O.; Syrjänen, K. Serological biomarker test (GastroPanel®) in diagnosis of functional gastric disorders, Helicobacter pylori and atrophic gastritis in a random sample of patients referred for testing due to dyspeptic symptoms. Anticancer Res 2021, 41, 811–891. [Google Scholar] [CrossRef]
- Rugge, M.; Genta, R.M.; Fassan, M.; Valentini, E.; Coati, I.; Guzzinati, S.; Savarino, E.; Zorzi, M.; Farinati, F.; Malfertheiner, P. OLGA gastritis staging for the prediction of gastric cancer risk: A Long-term follow-up study of 7436 patients. Am J Gastroenterol 2018, 113, 1621–1628. [Google Scholar] [CrossRef] [PubMed]
- McHugh, M.L. Interrater reliability: the kappa statistic. Biochem Med (Zagreb) 2022, 22, 276–282. [Google Scholar] [CrossRef] [PubMed]
- Syrjänen, K.J.; Sipponen, P.; Härkönen, M.; Peetsalu, A.; Korpela, S. Accuracy of GastroPanel testing in detection of atrophic gastritis. Eur J Gastroenterol Hepatol 2015, 27, 102–104. [Google Scholar] [CrossRef] [PubMed]
Figure 1.
PGI in detecting biopsy-confirmed moderate/severe AGC in ROC analysis.
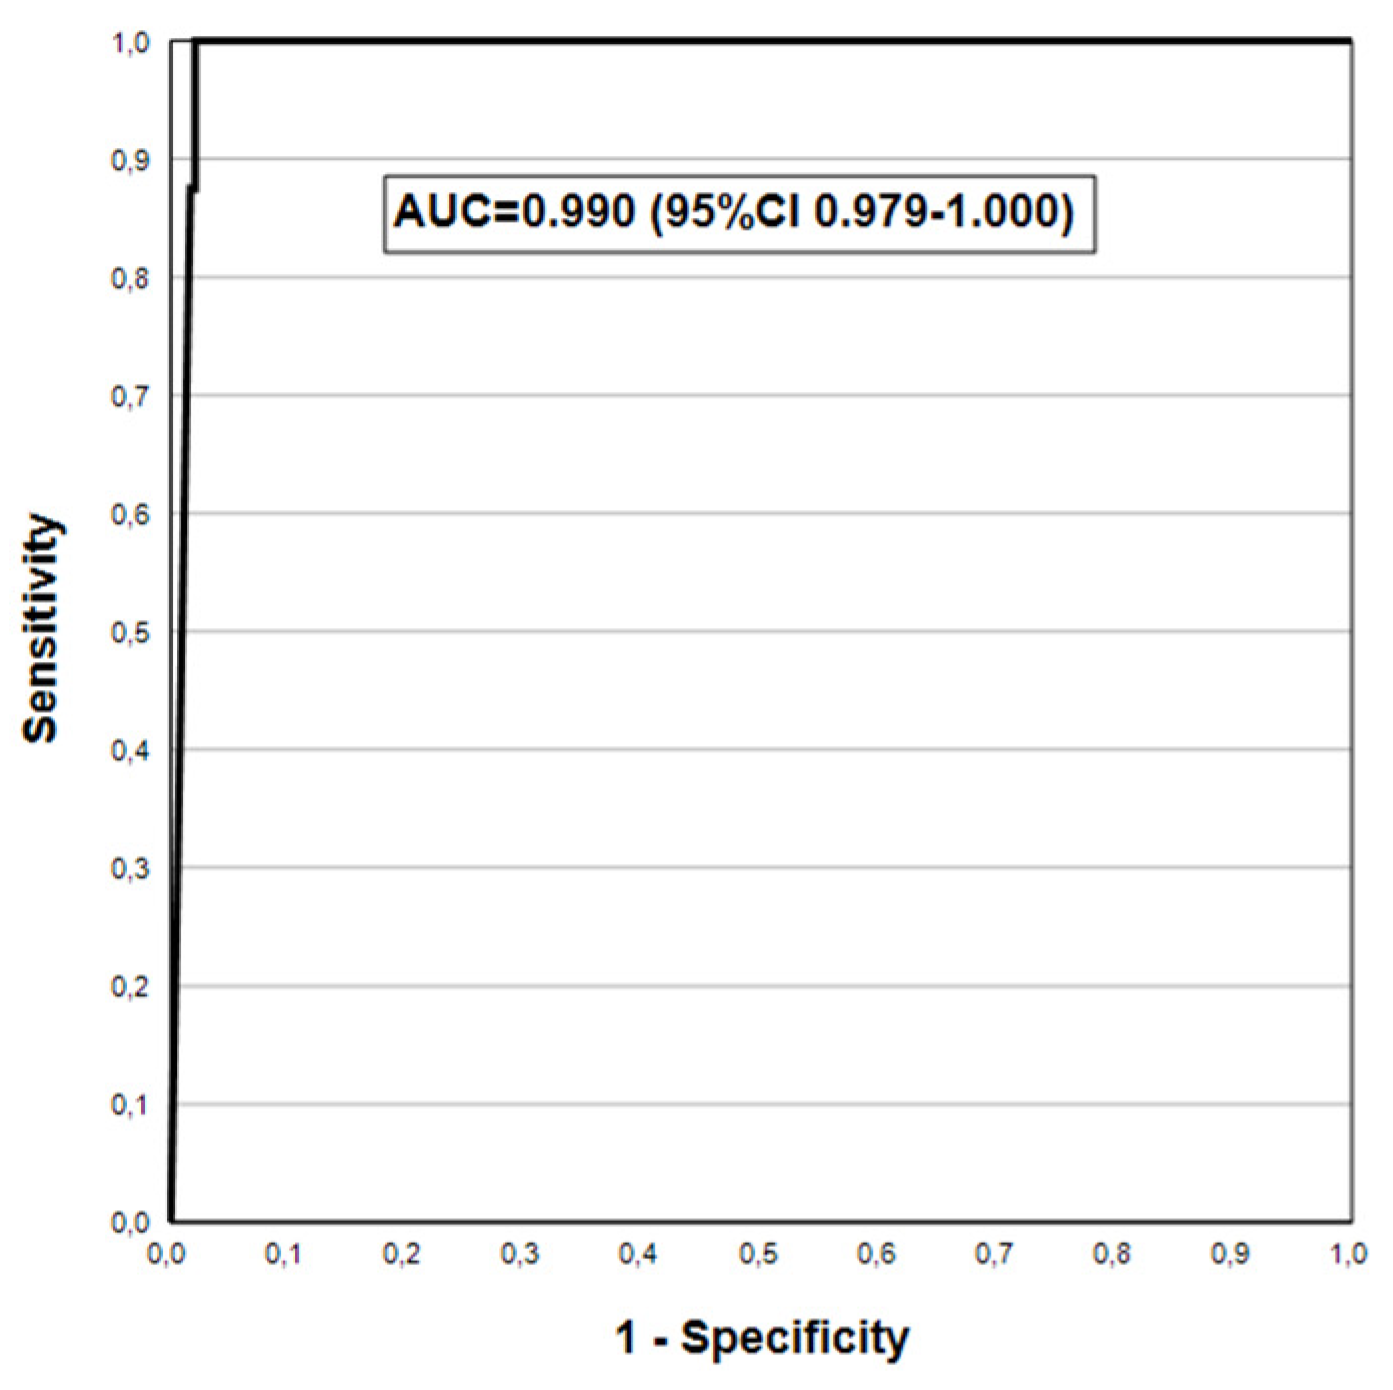
Figure 2.
PGI/PGII ratio in detecting biopsy-confirmed moderate/severe AGC in ROC analysis.
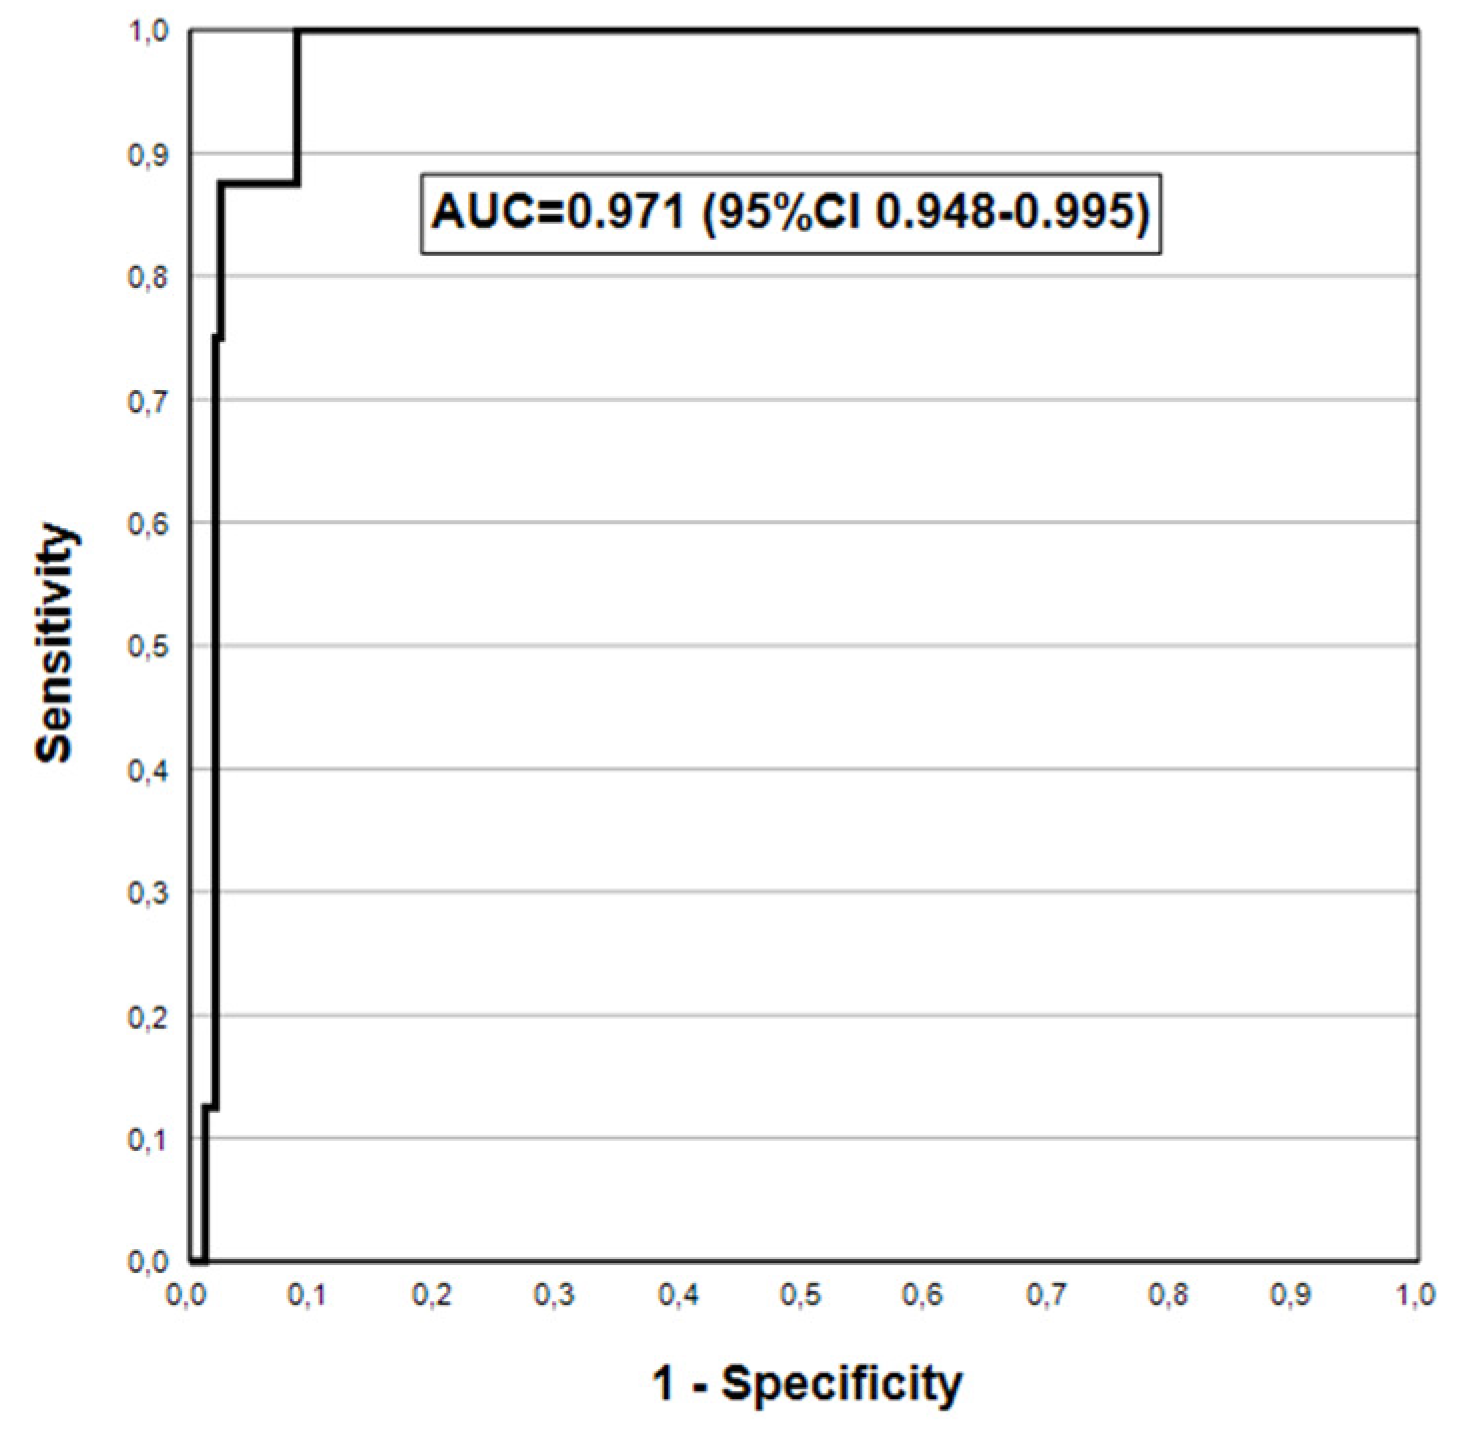
Figure 3.
Hp IgG Ab test in detecting biopsy-confirmed Helicobacter pylori in ROC analysis.
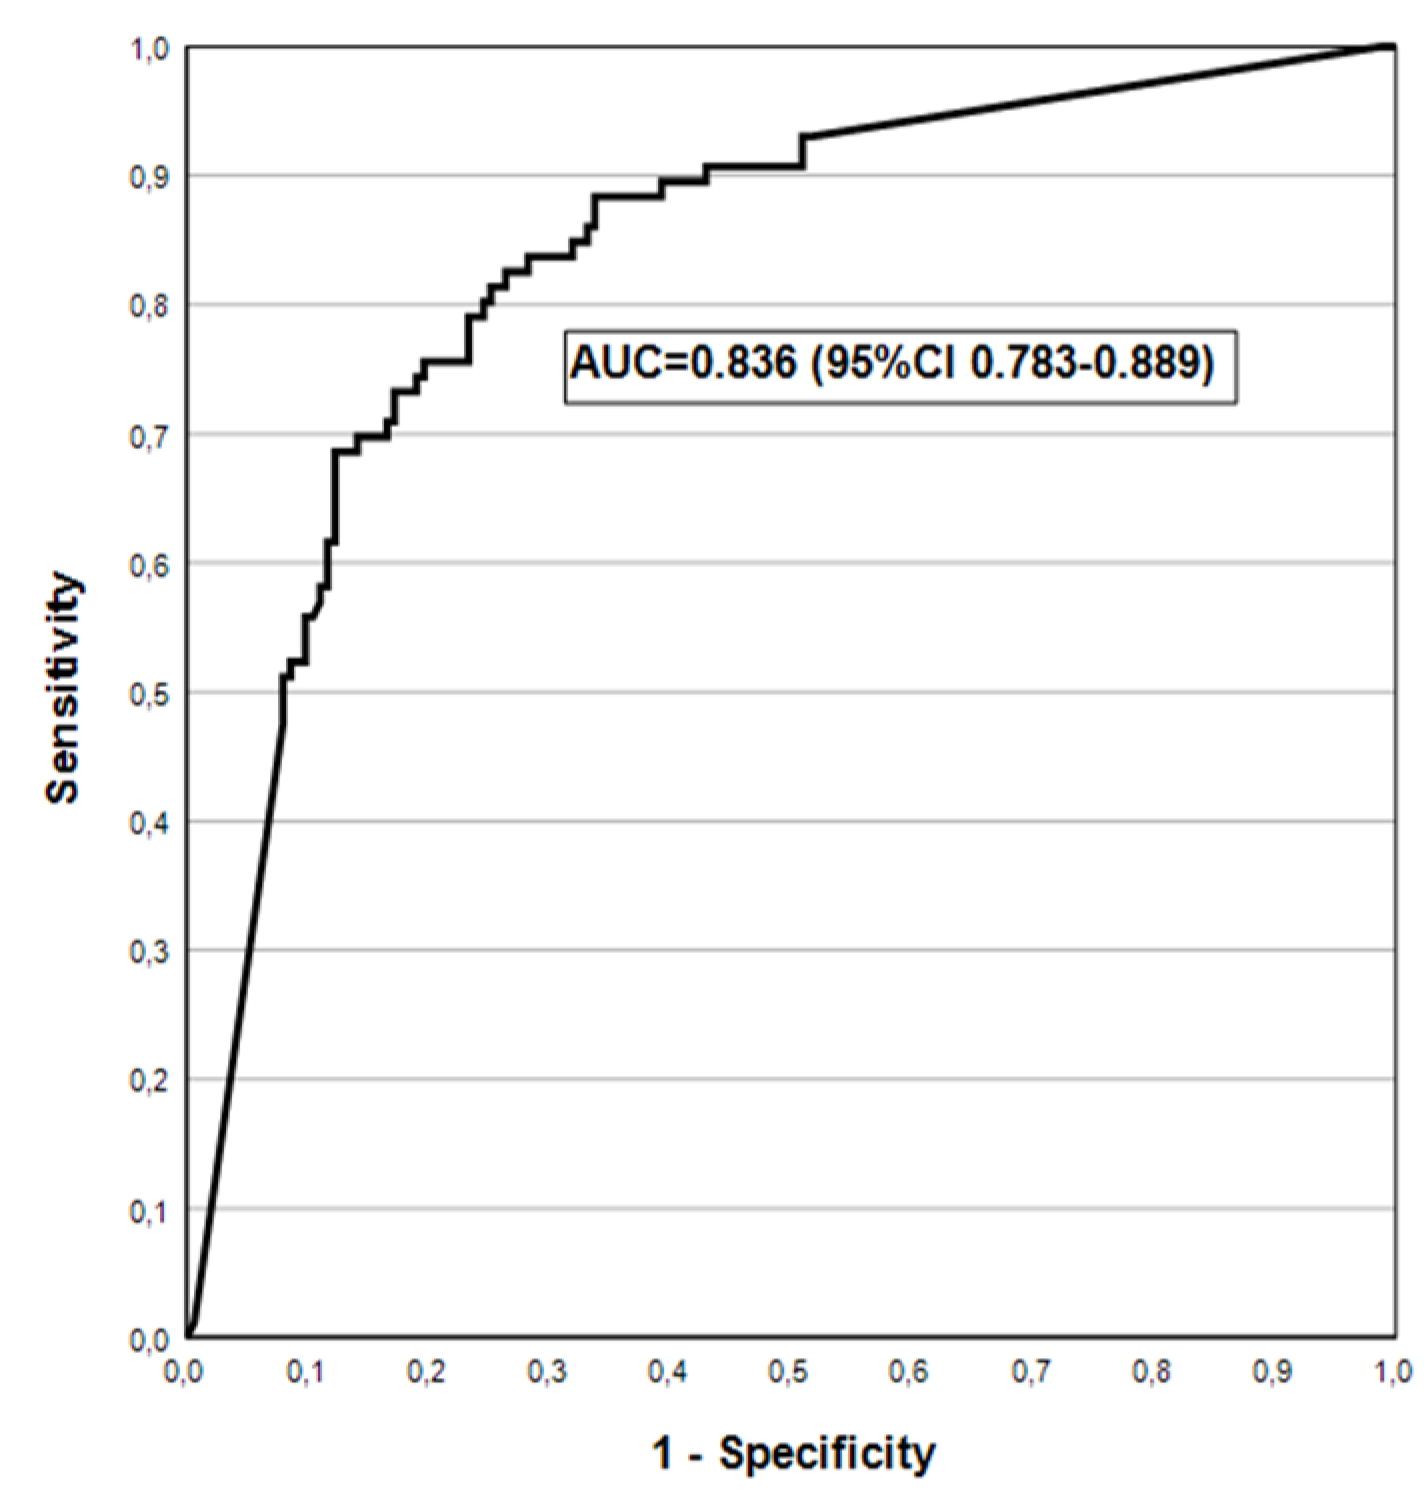
Figure 4.
Fagan’s nomogram for GastroPanel® Quick test as predictor of AGC in a population.
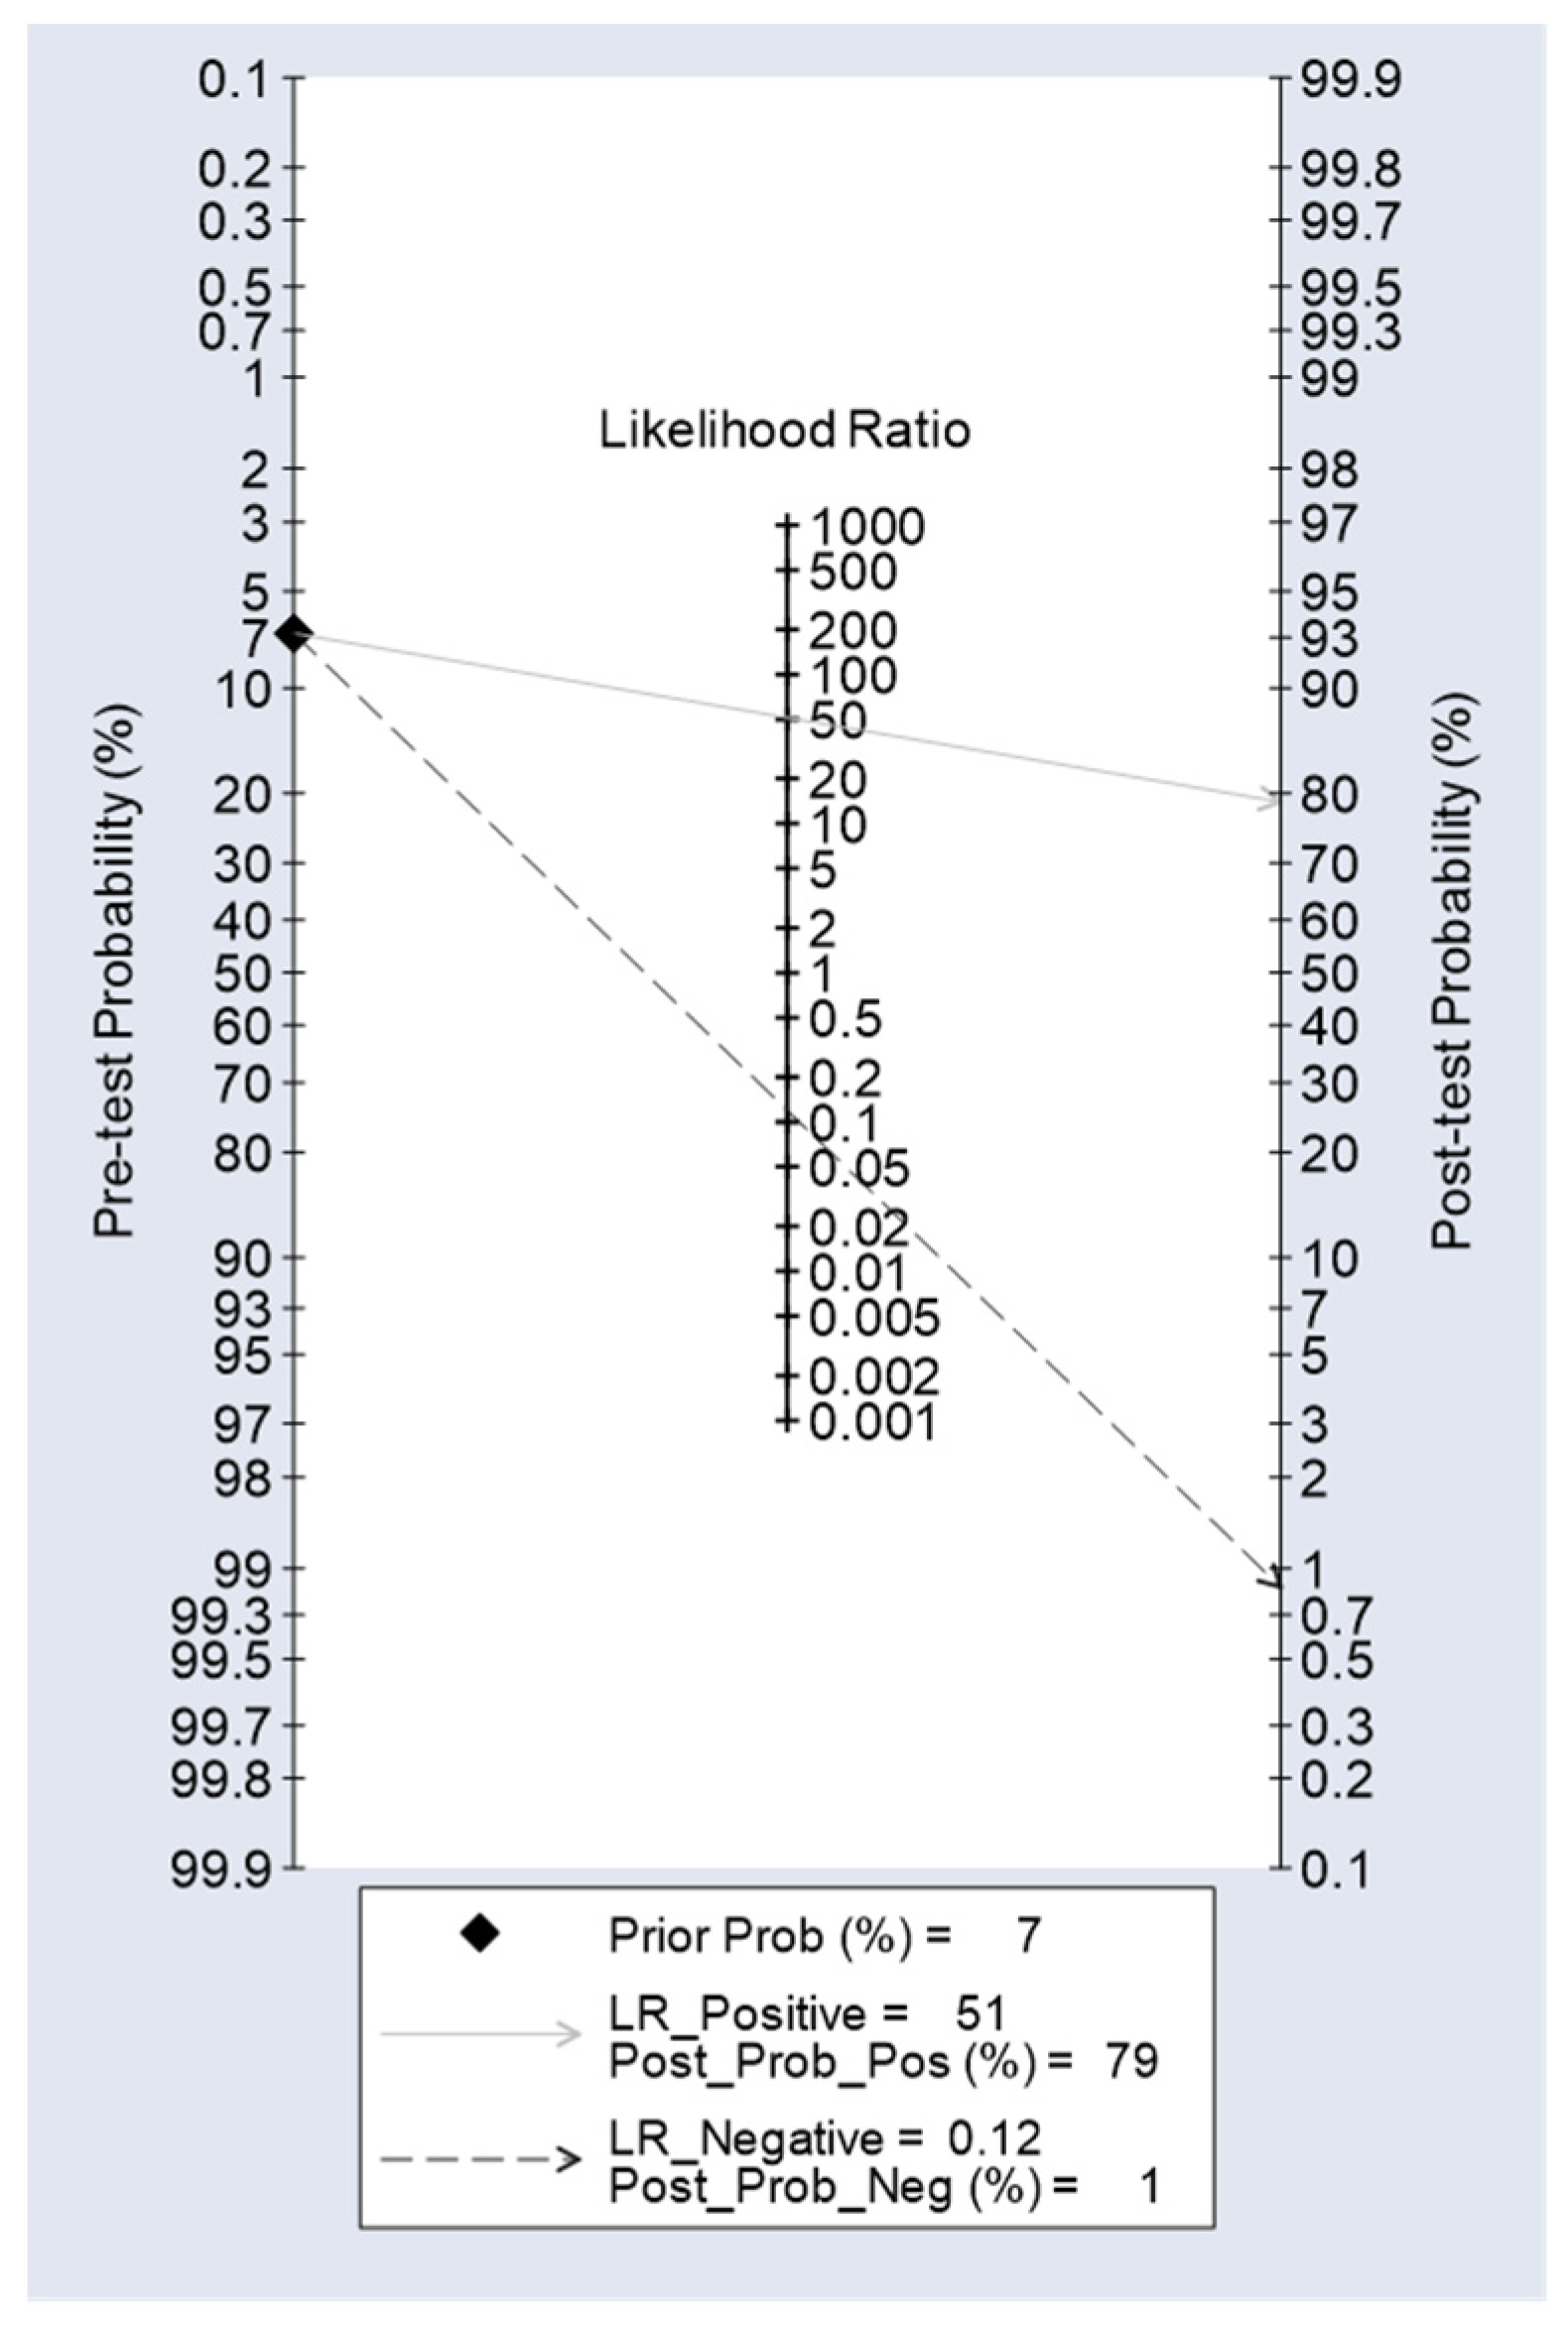

Table 1.
The clinical information requested in the GastroPanel® Quick test referral form should be placed in the main text near to the first time they are cited.
Table 1.
The clinical information requested in the GastroPanel® Quick test referral form should be placed in the main text near to the first time they are cited.
| Characteristics | Number of Patients n=266 |
Per Cent of Total 100% |
|---|---|---|
| Gender: | ||
| Women | 135 | 50.8 |
| Men | 131 | 49.2 |
| Age (Median; Range) | 52.0 years | (18-92 years) |
| History recorded in GastroPanel®(GP) referral form: | ||
| 1.Helicobacter diagnosed: | ||
| Hp diagnosed in GP testing | 15 | 5.6 |
| Hp diagnosed withing one year | 25 | 9.4 |
| Hp never diagnosed | 223 | 83.8 |
| Responder does not know | 3 | 1.2 |
| 2.Helicobacter eradication, if done: | ||
| Yes, eradication successful | 12 | 38.7 |
| Eradication not successful | 12 | 38.7 |
| Responder does not know | 7 | 22.6 |
| 3.Use of PPI-medication: | ||
| No PPI-medication | 68 | 25.6 |
| Continuous use of PPI-medication | 197 | 74.1 |
| Responder does not recall | 1 | 0.3 |
| 4.Symptoms of high acidity (heartburn) | ||
| No symptoms of high acidity | 6 | 2.3 |
| Continuous symptoms of high acidity | 259 | 97.4 |
| Data missing | 1 | 0.3 |
Table 2.
Biomarker levels stratified by the categories of GastroPanel® Quick test.
| GPQT Diagnosis | No. of Cases | PGI (M±SD) | PGII (M±SD) | PGI/PGII (M±SD) | G-17b (M±SD) | HpAb (M±SD) |
|---|---|---|---|---|---|---|
| Normal | 136 | 165.6(80.2) | 17.1(12.0) | 12.3(6.5) | 23.2(21.9) | 10.8(14.7) |
| Hp-gastritis | 106 | 175.8(79.8) | 24.6(16.5) | 9.5(6.9) | 25.4(21.1) | 119.8(51.3) |
| AGA | 2 | 160.0(22.6) | 20.4(2.9) | 7.8(0.3) | 2.3(1.2) | 134.5(40.3) |
| AGC | 19 | 20.1(9.7) | 14.4(9.7) | 1.8(1.0) | 50.6(13.2) | 16.4(35.7) |
| AGP | 2 | 30.9(6.9) | 6.5(5.0) | 6.1(3.6) | 0.9(0.0) | 10.1(5.8) |
| Total Series | 265* | 158.2(86.4) | 19.9(14.3) | 10.4(6.9) | 25.8(22.1) | 55.7(64.1) |
AGA, atrophic antrum gastritis; AGC, atrophic corpus gastritis; AGP, atrophic pan-gastritis; *from one patient, GPQT results are not available.
Table 3.
Biomarker levels across the five categories of the USS classification.
|
USS Grade |
No of Cases |
PGI (M±SD) |
PGII (M±SD) | PGI/PGII (M±SD) | G-17b (M±SD) |
HpAb (M±SD) |
| Normal | 146 | 170.5(82.9) | 18.2(12.7) | 12.1(7.1) | 23.3(21.8) | 30.0(45.6) |
| Hp-gastritis | 65 | 158.7(78.5) | 21.9(15.6) | 9.6(6.5) | 23.0(20.5) | 106.9(62.2) |
| AGA | 21 | 180.1(88.0) | 27.0(16.5) | 8.0(4.9) | 25.3(22.3) | 103.0(69.5) |
| AGC | 15 | 28.0(40.9) | 14.0(10.8) | 2.2(2.0) | 53.0(11.6) | 28.7(54.7) |
| AGP | 2 | 90.5(77.2) | 23.8(19.4) | 3.7(0.2) | 28.5(38.9) | 19.2(18.7) |
| Total Series | 249* | 159.0(86.9) | 19.7(14.0) | 10.4(7.0) | 25.3(22.1) | 56.0(63.9) |
USS, updated Sydney system; AGA, atrophic antrum gastritis; AGC, atrophic corpus gastritis; AGP, atrophic pan-gastritis; *Gastroscopic biopsies are not available from 17 patients.
Table 4.
Agreement between GastroPanel® Quick test and the USS classification.
| GPQT Diagnosis |
The Updated Sydney System (USS) |
|||||
|---|---|---|---|---|---|---|
| Normal | Hp-gastritis | AGA | AGC | AGP | Total | |
| Normal | 109 | 13 | 4 | 0 | 1 | 127 |
| Hp-gastritis | 35 | 52 | 13 | 1 | 0 | 101 |
| AGA | 0 | 0 | 2 | 0 | 0 | 2 |
| AGC | 2 | 0 | 1 | 14 | 0 | 17 |
| AGP | 0 | 0 | 1 | 0 | 1 | 2 |
| Total | 146 | 65 | 21 | 15 | 2 | 249 |
| Overall agreement (OA): 178/249; 0.714 (95%CI 0.654-0.770); | ||||||
| *Weighted kappa (w): ICC=0.823 (95%CI 0.773-0.862); | ||||||
*Weighted kappa (ICC with following set-up: parallel model, two-way random effects, consistency).
Table 5.
Diagnostic accuracy of GastroSoft AGA and AGC profiles@ in diagnosis of biopsy-confirmed AGA and AGC.
Table 5.
Diagnostic accuracy of GastroSoft AGA and AGC profiles@ in diagnosis of biopsy-confirmed AGA and AGC.
| GPQT Profile/ USS Endpoint |
Sensitivity |
Specificity |
PPV |
NPV |
AUC |
|---|---|---|---|---|---|
| @AGA Profile: | |||||
| *AGA | 14.3(3.0-36.3) | 99.6(97.6-100.0) | 75.0(19.4-99.4) | 92.7(88.6-95.6) | 0.569(0.492-0.646) |
| AGA2+ | 30.0(6.6-65.2) | 99.6(97.7-100.0) | 75.0(19.4-99.4) | 97.1(94.2-98.8) | 0.648(0.498-0.798) |
| @AGC Profile: | |||||
| **AGC | 88.2(63.6-98.5) | 98.3(95.6-99.5) | 78.9(54.4-93.9) | 99.1(96.9-99.9) | 0.933(0.853-1.000) |
| AGC2+ | 100(63.1-100) | 95.4(92.0-97.7) | 42.1(20.3-66.5) | 100(98.4-100) | 0.977(0.964-0.990) |
@Diagnosis made by the GastroSoft® application as AGA or AGC; *Biopsy: AGA of any grade; AGA2+ (moderate/severe AGA); **Biopsy: AGC of any grade; AGC2+ (moderate/severe AGC).
Table 6.
Performance indicators of G-17b (1.0 pmol/l cut-off), PGI (15 and 30 g/l cut-off) and PGI/PGII (3.0 cut-off) in diagnosis of biopsy-confirmed AGA and AGC.
Table 6.
Performance indicators of G-17b (1.0 pmol/l cut-off), PGI (15 and 30 g/l cut-off) and PGI/PGII (3.0 cut-off) in diagnosis of biopsy-confirmed AGA and AGC.
| Endpoint | Sensitivity | Specificity | PPV | NPV | AUC |
|---|---|---|---|---|---|
| G-17b: | |||||
| *AGA | 9.5(1.1-30.4) | 96.9(93.8-98.8) | 22.2(2.8-60.0) | 92.1(87.9-95.2) | 0.532(0.467-0.598) |
| AGA2+ | 20.0(2.5-55.6) | 97.1(94.1-98.8) | 22.2(2.8-60.0) | 96.7(93.5-98.6) | 0.585(0.454-0.716) |
| PGI (15): | |||||
| **AGC | 52.9(27.8-77.0) | 99.1(96.9-99.9) | 81.8(48.2-97.7) | 96.6(93.5-98.5) | 0.760(0.638-0.883) |
| AGC2+ | 87.5(47.3-97.7) | 98.3(95.8-99.5) | 63.6(30.8-89.1) | 99.6(97.7-100) | 0.929(0.806-1.000) |
| PGI (30): | |||||
| **AGC | 76.5(50.1-93.2) | 98.7(96.3-99.7) | 81.3(54.4-96.0) | 98.3(95.7-99.5) | 0.876(0.772-0.980) |
| AGC2+ | 100(63.1-100) | 96.7(93.6-98.6) | 50.0(24.7-75.3) | 100(98.4-100) | 0.983(0.972-0.995) |
| PGI/PGII: | |||||
| **AGC | 64.7(38.3-85.8) | 97.4(94.5-99.0) | 64.7(38.3-85.8) | 97.4(94.5-99.0) | 0.811(0.693-0.928) |
| AGC2+ | 87.5(47.3-99.7) | 95.9(92.5-98.0) | 41.2(18.4-67.1) | 99.6(97.6-100) | 0.917(0.794-1.000) |
*AGA of any grade; AGA2+ (moderate/severe AGA); **AGC of any grade; AGC2+ (moderate/severe AGC).
Disclaimer/Publisher’s Note: The statements, opinions and data contained in all publications are solely those of the individual author(s) and contributor(s) and not of MDPI and/or the editor(s). MDPI and/or the editor(s) disclaim responsibility for any injury to people or property resulting from any ideas, methods, instructions or products referred to in the content. |
© 2025 by the authors. Licensee MDPI, Basel, Switzerland. This article is an open access article distributed under the terms and conditions of the Creative Commons Attribution (CC BY) license (http://creativecommons.org/licenses/by/4.0/).
Copyright: This open access article is published under a Creative Commons CC BY 4.0 license, which permit the free download, distribution, and reuse, provided that the author and preprint are cited in any reuse.


