Submitted:
06 January 2025
Posted:
07 January 2025
You are already at the latest version
Abstract
The amount of knowledge is an integral indicator of the development of society. The article examines the knowledge production on a global scale. The measure of knowledge is the number of accumulated publications in the form of patents, articles and books. The rate of knowledge production depends on population size and average human productivity. Productivity generally depends on accumulated knowledge and plays a decisive role in the dynamics of knowledge and related demographic dynamics. Constructing this dependence in the general case, applying it to each type of publication, checking its adequacy and finding parameters is the goal of this study. First, existing econometric models are analyzed, and then a generalized model is developed, of which some literature models are special cases. An important question is under what conditions human productivity can be considered approximately constant, and under what conditions it grows significantly as knowledge accumulates. Finding these conditions provides a criterion that distinguishes a less developed pre-information society from an advanced information society, and allows us to clear up when this transition occurred. The results obtained allow us to forecast the further development of various forms of knowledge in the world.
Keywords:
information society
; econometric models
; knowledge production
; population growth
; informational storage
; bibliometric data
1. Introduction
The development of society is directly related to the accumulation of knowledge both in the field of science and technology, and in the cultural and humanitarian sphere. Knowledge is produced at a rate that depends on its amount and population. In turn, knowledge production controls population growth. The corresponding dynamic equations were obtained by Dolgonosov and Naidenov (2006). In this approach, a crucial factor is per capita productivity of knowledge , which depends on knowledge amount and time . Knowledge production can be represented in general form as
where is the population size, is an external source of knowledge. We assume in
(1) that the number of knowledge producers is proportional to the total
population, as is usually the case in econometric models (Romer, 1986, 1990; Kremer, 1993; Abdih and Joutz, 2006;
Dong et al., 2016, Kato, 2016). In our previous studies (Dolgonosov, 2016,
2020) we looked at the problem of
knowledge production by assuming that productivity is constant. This assumption
has reasonable grounds for a pre-information society with its undeveloped
computing capabilities. However, at present, when we have an information
society, the rapid progress of computer technology and artificial intelligence
leads to increased productivity, which should be reflected in the rate of
knowledge accumulation and, as a consequence, in demographic dynamics. The
problem is to figure out what the function is, how justified the constant productivity
approximation is, and under what conditions it can be applied. We consider the
problem in this work.
Further development of the theory requires
consideration of the general case where productivity depends on accumulated
knowledge. This problem has also been addressed in econometric models
describing the relationship between technological development and population
growth. Unlike technologies, knowledge is understood somewhat more broadly: it
includes all the components of human culture, which undoubtedly influence
population growth to a certain extent. Nevertheless, econometric models capture
the essential features of the phenomenon. First of all, it is worth mentioning Romer's (1986, 1990) model, which was written for
technology, but we will extend it to knowledge in general. Romer's model can be
presented as
with the only difference that Romer's variable is the sum of technologies (although this is not
all knowledge), is the number of only those people who work in
science and technology, and per capita productivity is expressed as
where , and are parameters (everything is in our notation).
Ultimately, Romer accepts and equal to 1.
Kato (2016) analyzes
a model similar to (2)-(3), with the only difference that the total population is used instead of . The author expresses the following thought about
the exponent (in the original it is designated as ):
- “When , then the growth rate of technological progress would rise rapidly with increasing level of technology. However, such situations have not been observed in developed nations through postwar periods, so Barro and Sala-i-Martin (1992) imposed the condition .”
We use this remark when constructing the
productivity function.
Kremer's (1993) model
can also be represented as equation (1). Unlike Romer's model (2), Kremer uses
the total population instead of the number of S&T personnel , but the parameters and are still equal to 1. So, instead of (3) we have
A similar model of technology development was used
by Collins et al (2013) in their
evolutionary theory of long-run economic growth.
Jones (1995, 1999) modified
Romer's model by setting in (3), which after a series of transformations
led him to the equation
where . The meaning of this equation can be clarified
after integrating it, which yields
is a constant. From (6) it follows that the
technologies accumulated to date are only the output of currently working
technology producers. However, this approach does not reflect the influence of
previous generations, whose work also contributed to the development of technology.
Obviously, the equation for must contain an integral term summing up the
contribution of past generations.
The same problem was noted by Dong et al. (2016), who, based on an analysis of
well-known econometric models and extensive empirical material, showed that
technological growth depends not only on the current generation of people, but
also on the achievements of past generations. The authors found deviations from
the proportionality law between the number of technology producers and the
total population when dealing with the long-term evolution of society over
millennia.
Okuducu
and Aral (2017) suggested that productivity could be a constant, linear,
quadratic, or exponential function of knowledge amount, and used these
representations to compute various hypothetical scenarios of knowledge
dynamics.
There is a difference between the knowledge
approach (1) and the econometric one (2)-(4). Productivity is the per capita knowledge product (different
forms of publication, e.g. patents, articles, books; cf. Abramo et al., 2019) in the first case or the per
capita gross product in the second one. Knowledge is measured in information
units, while technology and gross product in monetary units.
The question arises (Court
and McIsaac, 2020): is the information approach to demographic dynamics
divorced from reality and is it possible to calibrate the corresponding model?
The answer to this question is one of the objectives of this work. As for the
reality and prospects of such an approach, we can refer to the work (Dolgonosov, 2020), in which a general
global-scale model was proposed, including economic, environmental, demographic
and information components, and which was successfully calibrated using
extensive empirical data.
In connection with the development of artificial
intelligence, a dilemma has arisen about how to describe the presence of
intelligent machines, whether to include them among the producers of knowledge,
thereby expanding the number , or to continue to believe that knowledge is
produced by people, and the machine is still only a tool that helps them in the
production of knowledge. Sadovnichy, Akaev and Korotayev (2022) develop the former
approach, believing that intelligent machines can now be considered producers
of knowledge and hence included in the number along with humans. This is a promising direction
of research, especially given the rapid development of AI. But for now,
following the analysis of Akaev and Sadovnichii (2021), we will remain with the
traditional approach, according to which it is people who produce knowledge,
while intelligent machines only help them in this matter. Then the effect of AI
manifests itself through an increase in the amount of knowledge and a
corresponding increase in human productivity.
The above-mentioned productivity functions proposed
by various authors require verification based on empirical material. To this
end, we revisit the issue of productivity as a function of knowledge and verify
the theoretical results using literature data.
Another nontrivial problem is how to determine the
amount of knowledge. The most consistent approach is to estimate memory
capacity that knowledge takes up. However, at the moment such information is
unlikely to exist. Meanwhile, there is evidence that digital memory is rapidly
increasing over time, in what appears to be a global information explosion
during the digitization period (1986-2007 onwards) (Hilbert,
2014).
It should be expected that the total memory
capacity far exceeds knowledge capacity due to repeated replication of useful
information, especially in graphic and video formats. In this situation, it is
necessary to use data on different types of knowledge representation, such as
patent applications, original articles and books. These data have been largely
cleared of duplication. Knowledge production should be assessed separately for
each type. Below we use this approach.
2. Model
2.1. Knowledge Production and Accumulation
The need to solve non-standard problems that life
poses to people encourages knowledge production (Figure 1). Knowledge is professionally produced
only by a part of the population. As in many econometric models, we assume that
this part is proportional to population size. Dong
et al. (2016) found deviations from this law for individual countries,
but there is reason to believe that the deviations are likely to be smoothed
out when moving to a global scale, as usually happens when a statistical system
is enlarged. Then the overall rate of knowledge production will be equal to
average productivity multiplied by population size, as expressed by equation
(1). However, for humanity as a global system, this equation can be simplified
by keeping in mind the following fact. Human civilization does not have
extraterrestrial contacts, hence there are no external sources of knowledge, so
in (1) we must put . Due to this isolation, the system is autonomous,
which means that productivity does not depend on time explicitly, but only
through , so that equation (1) reduces to the form
Equation (7) can be written as
Integrating (8) with the initial condition
and introducing functions
we come to the equation
which implicitly specifies as a function of the cumulative population number , thereby formalizing the accumulation of knowledge
over time.
2.2. Productivity Function
To reveal the dependence of productivity on
knowledge amount, we will consider two opposite cases: an extremely undeveloped
society and a highly developed information society. The productivity function
should have the following properties:
- in an extremely undeveloped society, knowledge has not yet been accumulated (), but knowledge is produced with a non-zero initial productivity ;
- in a highly developed information society, productivity increases slowly according to the power law with an exponent ε not exceeding 1 (since an average knowledge producer uses a very limited amount of knowledge in his creative process — this is close to the opinion of Barro and Sala-i-Martin (1992), mentioned in the Introduction).
The simplest interpolation formula with these properties is
where are parameters. If , we can use the constant productivity
approximation as in our previous works. Substitution of (13) into (10) yields
and according to (12) we find
where we use the deformed logarithm and deformed
exponential, which are defined as (Umarov et al.,
2008)
In the limit , we get the natural logarithm and natural exponential:
At the ends of the range, we have:
- a constant productivity
- productivity as a linear function of knowledge
The presence of the integral quantity in (16) describes the contribution of past
generations to the accumulation of knowledge, as discussed by Dong et al. (2016), in contrast to formula (6),
which refers only to the current population.
2.3. Asymptotics
Let us consider a situation where the most probable
values of the parameters in equation (16) correspond to the limit . Minimizing the standard deviation of the model
from data by varying causes to depend on . The asymptotic form of equation (16) is
In the limit , expression (22) must be independent of , which implies
and
where is a positive constant. Productivity (13)
asymptotically obeys the power law
Thus, the general productivity function (13)
includes three special cases: a constant (20), linear (21) and power (25)
function. There is another special case, which we consider in the next item.
2.4. Exponential Productivity
Kato (2016) expressed
the opinion that the option in (3) and, accordingly, in (13) gives an
unrealistically rapid increase in human productivity (see the quote in the
Introduction). This option can even lead to a singularity, nevertheless, for
the sake of completeness, we will consider it. In particular, let us look at
the case where productivity is converted from (13) to an exponential function
of knowledge. Previously, Okuducu
and Aral (2017) considered productivity as an exponential function of as an option.
Let us adopt that in (13) there is no upper limit
for and the coefficient decreases with increasing according to the law . Then , and in the limit we get
From (10)-(12) it is easy to find
where . The cumulative population number increases with time, hence at some point in time
it reaches the value , at which a singularity occurs. Thus, in a finite
time the accumulated knowledge becomes infinite, which now seems weird, but if we
bear in mind the rapid development of artificial intelligence, the singularity
in (27) may be associated with the use of AI as an incredibly powerful tool for
knowledge production, resulting in exponential growth in productivity (26) as
knowledge accumulates.
3. Model Calibration
3.1. From Continuous to Discrete
The productivity function (13) is calibrated by
varying its parameters in order to minimize the standard deviation from data.
Due to the annual discreteness of demographic data, integral (11) should be
replaced by the sum of the population over the years to :
where is the th year population, is a year number.
According to Abramo et al. (2019), knowledge can be measured through
its publication. We will consider three forms of publication: patents, articles
and books. Each form accumulated up to and including a certain year is the sum
where is knowledge production measured on a case-by-case
basis by the annual publication of patents, articles or books (what is denoted
as in the basic equation (7)), corresponds to the th year, is knowledge (number of patents, articles or
books) accumulated up to year (not including itself). This equality is also used to determine
informational storage capacity.
3.2. Bibliometric Data
To calibrate model equations (16) and (24), we used
the bibliometric data presented in Figure 2.
Articles in scientific and technical journals (for 2000-2018) and patent
applications (for 1985-2020) are represented by global data (WB, 2022; OECD, 2022). Data on new book titles
(for 1950-1996) are selected for a group of 30 countries based on information
provided by Fink-Jensen (2015). The group
composition is indicated in the note to Table 1.
The criterion for including a country in the group is the availability of data
on books published for 1950-1996. For other countries, the data range is less
than specified. There are gaps in the data for individual years that are filled
by linear interpolation. When calibrating the model, we used group population
for books and world population for articles and patents (Figure 3).
3.3. Initial Amount of Knowledge
The informational storage capacity at the beginning
of the digitization period is known from the literature (Hilbert, 2014). However, this cannot be said about the initial
amount of knowledge , represented in the form of patents, articles and
books. To find , we use an indirect estimate based on the
relationships between annual knowledge production (as denoted in (29)), gross domestic product , and population . All these quantities are provided with literature
data (for links, see captions to Figure 2 and Figure 3).
The problem is that the time series is usually very short, and in order to find it is necessary to sum over a fairly long retrospective period. This can
be done using the following algorithm:
1° generate a function based on demographic data;
2° generate functions and on ranges provided with data;
3° approximate and with suitable functions and continue the functions
to the origin (where and are zero);
4° make up a composition of functions , continuing it into the distant past, where tends to zero;
5° take the sum of for the entire previous period up to point (not including it), where the data for begins:
Formally, the summation starts from , but in fact it is permissible to take a fairly
distant point in the past, where is very small. We took 1900 as such a point, when
the production of patents, articles and books was negligible compared to modern
amounts;
6° calculate using formula (29) in two ways: (i) using the
available data for , and (ii) using the results of model calculations
according to item 4° (to compare the model with the data).
An example of applying this algorithm to finding
the initial number of articles accumulated by the year is shown in Figure 4.
Data on articles are available in the range 2000-2018. Despite such a short
data range, the use of this algorithm allows us to estimate the accumulation of
articles in a much wider range: 1900-2020. The agreement between the model and
the data is satisfactory. This algorithm was also applied to patents and books
(Figure 5).
4. Results and Discussion
The parameter values found as a result of model
calibration are presented in Table 1 and Figure 6. The accuracy of matching the model
with the data is very high, as evidenced by the determination coefficient , the values of which are close to 1.
4.1. Storage Capacity
The best fit of equation (16) to the data is
achieved at , when a linear productivity (21) is the case:
where
is measured in Exabytes (only in this case), and are measured in billion people×year.
4.2. Patents
Kong et al. (2023) found that patents created absorb
much more knowledge from patents than from articles. Then we can neglect the
contribution of articles to the production of patents.
The number of patents is also best suited to the
linear case , see (21), and obeys equation (31) with parameters
(33) having values
here and further in (35) is measured in million texts.
4.3. Articles
Equation (16) when applied to the number of
articles in scientific and technical journals gives the best result in the
asymptotic limit , which corresponds to equation (24) at (Table 1).
Equation (24) can be rewritten as
where
4.4. Books
For the number of new book titles (in all genres of
literature), the best result corresponds to the same
asymptotic formula (35) as for articles, with and parameter values
4.5. Memory Capacity Assessment
To estimate the memory capacity (in bytes) occupied
by patents, articles and books, we use estimates of the average sizes of these
texts. Analysis of samples of several hundred patents and articles yields an
average size of approximately 1.5 Megabytes per patent (or article). Similarly
for books, we get an average size of 14 Megabytes per book. The latest storage
capacity value of 310 Exabytes dates back to 2007. Memory capacity estimates
for various types of knowledge representation as of 2007 are shown in Table 2.
We see that the memory capacity occupied by each
text type is 6 orders of magnitude less than the total storage capacity. The
storage capacity is filled primarily with visual information (photos, films,
archives of TV programs, video surveillance, digitized museum exhibits, etc.).
It is also necessary to consider the repeated duplication of visual and textual
information, copied by almost every interested user to their devices. The need
to store such immense information causes an accelerated growth in the capacity
of storage devices, which is what we are seeing in reality (Figure 6a).
4.6. Productivity Increase
According to the adopted model, productivity increases for all types of texts studied here (patents, articles and books), as depicted in Figure 7. With an increase in knowledge by 5 times ( from 10 to 50 units), productivity increases by 2.3, 2.5 and 3.4 times for patents, books and articles, respectively. For the same increase in storage capacity, productivity increases by 4.3 times. So, productivity grows more slowly than knowledge.
Table 3 shows that during the observation period productivity increases by 2 – 2.7 times. Unlike knowledge, the information storage stands apart: its capacity increased over the observation period by 113 times, and its productivity increased by 63 times. We see that memory is expanding much faster than new texts (patents, articles, books) are created. Apparently, producing storage devices is a simpler process than creating new knowledge.
4.7. Constant Productivity Approximation
Consider the condition under which the constant productivity approximation may be acceptable. According to (13), this condition is , where is a threshold value. Referring to Table 1, we find for storage and for patents. The former corresponds to 1983, the latter to 1989.
For articles and books, their productivity and accumulated knowledge obey nonlinear laws (25) and (35). As shown above (see (20)), constant productivity causes a linear increase in knowledge. Equation (35) can be linearized if the condition is satisfied, then . According to (36) and (38), for articles and for books. The threshold value is reached in 2016 for articles and in 1982 for books.
So, we can use the constant productivity approximation (20) as long as we do not get too close to the specified dates, staying in the range of where the condition for storage and patents or for articles and books holds. To summarize, as we approach the 1980s, the constant productivity approximation loses its adequacy (for articles it happens later).
The dependence of knowledge production on population size (7), supplemented by the equation of knowledge dynamics, allows us to obtain the equation of demographic dynamics (Dolgonosov, 2016). The constant productivity approximation leads to the well-known hyperbolic law of world population growth (von Foerster et al., 1960), which operated for over a thousand years. However, deviations from this law become increasingly apparent as we approach the 1980s, which is associated with a significant accumulation of knowledge and an increase in productivity — it can no longer be taken as constant. This fact is usually considered as a demographic and technological phase transition (Korotayev et al., 2015; Grinin et al., 2020a, b), and at the same time it can be interpreted as a transition from a pre-information society, where the constant productivity approximation operates, to a more developed information society with advanced computer technologies and growing human productivity.
After the 1980s, personal computers became widespread and the information society continued to develop. Digital memory grew, reaching the level of analog memory and then surpassing it. The share of digital memory increased as follows: 0.8% in 1986, 3% in 1993, 25% in 2000, 94% in 2007 (Hilbert and López, 2011). The capacities of both types of memory became equal in 2003. Thus, the early 2000s can be considered a milestone in the maturation of digital civilization. Currently, the majority of world's technological memory is organized in the most accessible and fastest digital format.
5. Conclusion
The amount of knowledge correlates with the number of patents, articles and books published in the world over the entire previous period, which allowed us to trace the dynamics of knowledge accumulation. The production of knowledge depends on its amount and population size. This dependence plays a crucial role in knowledge dynamics and related demographic dynamics. The goal of this work was to find out the form of this dependence and check how well it corresponds to real data.
We have proposed a model in which the total rate of knowledge production is expressed as the product of average human productivity and population size. Productivity increases as knowledge accumulates and information technology advances. At the early stage of society development, knowledge is very scarce, but productivity is still not zero, which is a necessary condition for further development.
As knowledge grows, productivity gradually increases, reaching high values in a developed information society. In the asymptotic limit, when knowledge amount becomes large, productivity can be described by a power-law dependence on . To combine the extreme cases of an undeveloped society and a highly developed one, we described productivity by the interpolation dependence representing a linear form of raised to a certain power. This dependence generalizes important special cases where productivity can be a constant, linear, power or exponential function of knowledge.
In a developed society, information is stored primarily in digital format on various types of devices, which, together with analog memory, form the global informational storage. With the development of digital technology, storage capacity is rapidly increasing. To describe this process, we used the proposed model.
The model was calibrated using literature data for the world as a whole (applied to patents, articles and informational storage) and for the group of 30 countries (applied to books, given the lack of data for many countries). Good agreement with the data was achieved. The general dependence of human productivity on knowledge amount was reduced to two special cases: a linear function of for patents and storage capacity, and a power function of for articles and books.
The analysis showed that in a pre-information society, with a relatively small amount of knowledge, the constant productivity approximation can be used. The transition to a developed information society occurred in the 1980s. Productivity can no longer be considered constant: it grows with the accumulation of knowledge according to a linear law in the case of patents, and according to a power law in the case of articles and books.
Digital memory surpassed analog memory after 2003. The population's need for repeated duplication of useful information led to a rapid increase in the number of storage devices and, consequently, to an increase in the total capacity of informational storage, which by 2007 exceeded the memory capacity occupied by patents, articles and books by 6 orders of magnitude.
The results obtained open up an opportunity to advance in describing the dynamics of various forms of knowledge and predicting their development in the future.
References
- Abdih, Y., Joutz, F., 2006. Relating the knowledge production function to total factor productivity: An endogenous growth puzzle. IMF Staff Papers, 53 (2), 242–271. http://www.jstor.org/stable/30036013.
- Abramo, G., D’Angelo, C. A., Carloni, M., 2019. The balance of knowledge flows. Journal of Informetrics, 13 (1), 1–9. [CrossRef]
- Akaev, A. A., Sadovnichii, V. A., 2021. The human component as a determining factor of labor productivity in the digital economy. Studies on Russian Economic Development, 32, 29–36. [CrossRef]
- Barro, R. J., Sala-i-Martin, X., 2003. Economic Growth (2nd ed.). Cambridge: MIT Press.
- Collins, J., Baer, B., Weber, E. J., 2013. Population, technological progress and the evolution of innovative potential. University of Western Australia Business School Discussion Paper 13.21. https://ssrn.com/abstract=2284456.
- Court, V., McIsaac, F., 2020. A representation of the world population dynamics for integrated assessment models. Environmental Modeling & Assessment, 25, 611–632. [CrossRef]
- Dolgonosov, B. M., 2016. Knowledge production and world population dynamics. Technological Forecasting and Social Change, 103, 127–141. [CrossRef]
- Dolgonosov, B. M., 2020. A knowledge-based model of civilization under climate change. arXiv:2002.10196.
- Dolgonosov, B. M., Naidenov, V. I., 2006. An informational framework for human population dynamics. Ecological Modelling, 198 (3-4), 375-386. [CrossRef]
- Dong, J., Li, W., Cao, Y., Fang, J., 2016. How does technology and population progress relate? An empirical study of the last 10,000 years. Technological Forecasting and Social Change, 103, 57–70. [CrossRef]
- Fink-Jensen, J., 2015. Book titles per capita. https://hdl.handle.net/10622/AOQMAZ.
- Gapminder, 2022. Population. https://www.gapminder.org/data/documentation/gd003/.
- Grinin, L., Grinin, A., Korotayev, A., 2020a. Dynamics of technological growth rate and the forthcoming singularity. In: Korotayev, A., LePoire, D. (eds) The 21st Century Singularity and Global Futures. World-Systems Evolution and Global Futures. Springer, Cham. [CrossRef]
- Grinin, L., Grinin, A., Korotayev, A., 2020b. A quantitative analysis of worldwide long-term technology growth: From 40,000 BCE to the early 22nd century. Technological Forecasting and Social Change, 155, 119955. [CrossRef]
- Hilbert, M., 2014. How much of the global information and communication explosion is driven by more, and how much by better technology? Journal of the American Society for Information Science and Technology, 65 (4), 856–861.
- Hilbert, M., López, P., 2011. The world’s technological capacity to store, communicate, and compute information. Science, 332, 60–65. [CrossRef]
- Jones, C. I., 1995. R&D-based models of economic growth. Journal of Political Economy, 103 (4), 759–784. [CrossRef]
- Jones, C. I., 1999. Growth: with or without scale effects? American Economic Review, 89 (2): 139-144. [CrossRef]
- Kato, H., 2016. Population Growth and Technological Progress—From a Historical View. In: An Empirical Analysis of Population and Technological Progress. Springer Briefs in Population Studies. Springer, Tokyo. [CrossRef]
- Kong, J., Zhang, J., Deng, S., Kang, L., 2023. Knowledge convergence of science and technology in patent inventions. Journal of Informetrics, 17 (3), 101435. [CrossRef]
- Korotayev, A., Goldstone, J. A., Zinkina, J., 2015. Phases of global demographic transition correlate with phases of the great divergence and great convergence. Technological Forecasting and Social Change, 95, 163-169. [CrossRef]
- Kremer, M., 1993. Population, Population growth and technological change: one million B.C. to 1990. Quarterly Journal of Economics, 108 (3), 681–716. [CrossRef]
- OECD, 2022. Triadic patent families. https://data.oecd.org/rd/triadic-patent-families.htm#indicator-chart.
- Okuducu, M. B., Aral, M. M., 2017. Knowledge based dynamic human population models. Technological Forecasting and Social Change, 122, 1–11. [CrossRef]
- Romer, P. M., 1986. Increasing returns and long-run growth. Journal of Political Economy, 94 (5), 1002–1037. [CrossRef]
- Romer, P. M., 1990. Endogenous technological change. Journal of Political Economy, 98 (5), S71–S102. [CrossRef]
- Sadovnichy, V., Akaev, A., Korotayev, A., 2022. A mathematical model for forecasting global demographic dynamics in the age of intelligent machines. Preprint (available at Research Square). [CrossRef]
- Umarov, S., Tsallis, C., Steinberg, S., 2008. On a q-central limit theorem consistent with nonextensive statistical mechanics. Milan Journal of Mathematics, 76, 307–328. [CrossRef]
- UN, 2022. Population. https://population.un.org/wpp/Download/Standard/Population/.
- von Foerster, H., Mora, P. M., Amiot, L. W., 1960. Doomsday: Friday, 13 November, A.D. 2026. Science, 132, 1291–1295. [CrossRef]
- WB, 2022. World Bank. Scientific and technical journal articles. https://data.worldbank.org/indicator/IP.JRN.ARTC.SC?yearlowdesc=true.
Figure 1.
Conceptual diagram of knowledge production and accumulation.
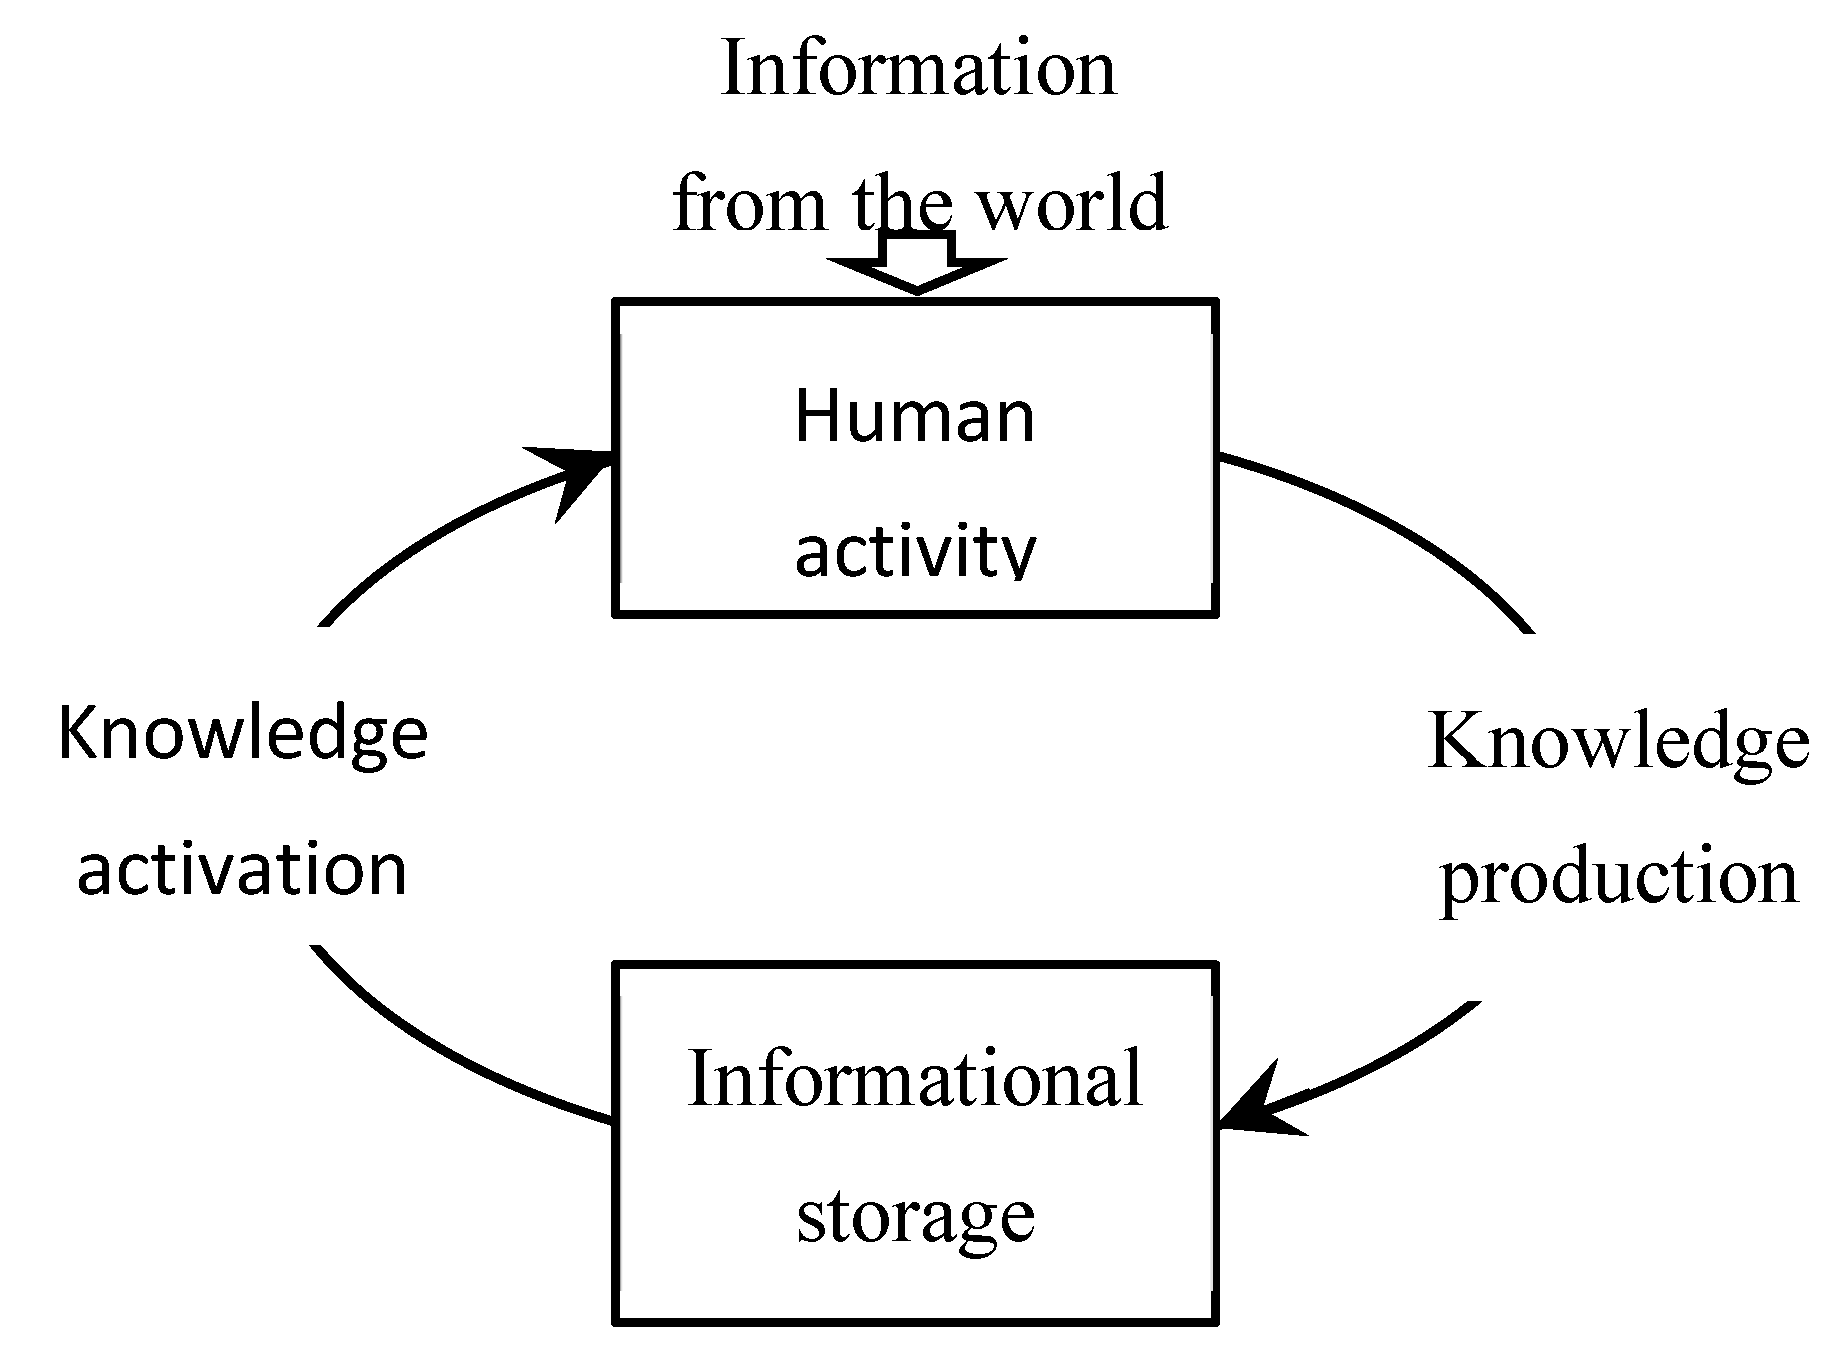
Figure 2.
Cumulative sums of patents, articles and books for the years of observation. Patents and articles represent global data, while books refer to the group of 30 countries listed in the note to Table 1. Data sources: number of scientific and technical journal articles — WB, 2022; number of patent applications — OECD, 2022; number of new book titles — Fink-Jensen, 2015.
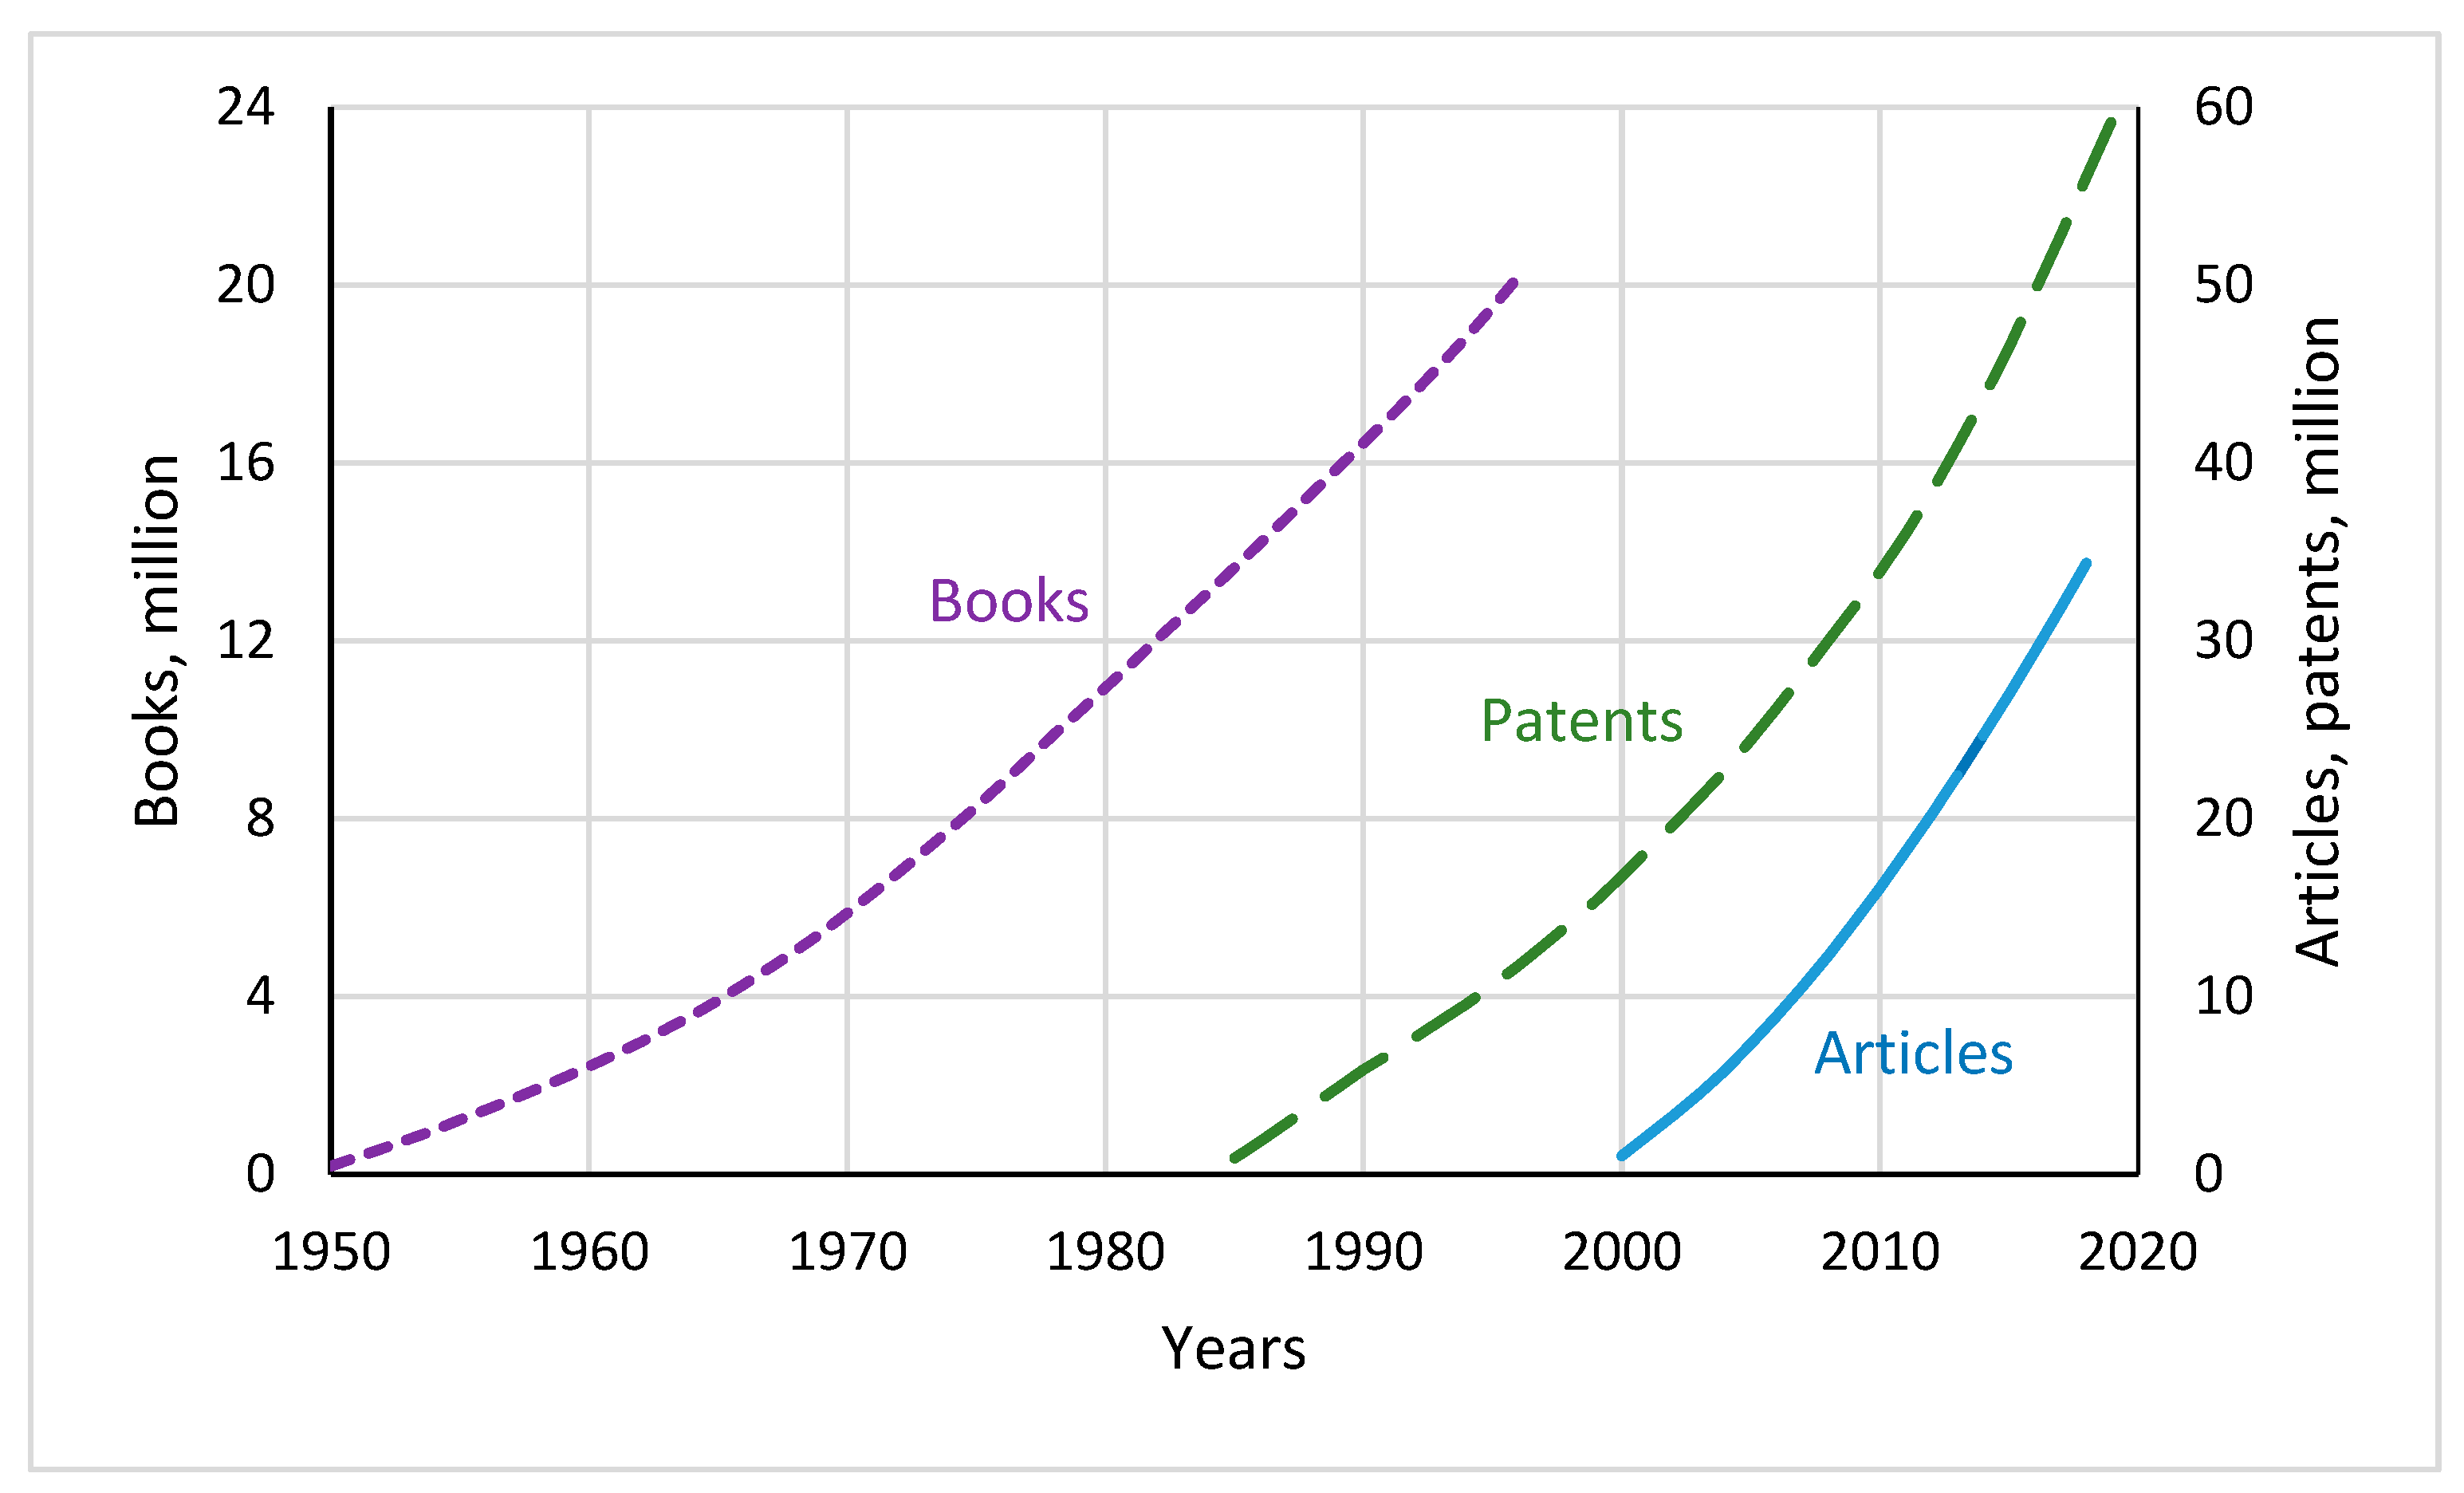
Figure 3.
World population and population of the group of 30 countries by year. See note to Table 1 for group composition. Data sources: UN, 2022; Gapminder, 2022.
Figure 3.
World population and population of the group of 30 countries by year. See note to Table 1 for group composition. Data sources: UN, 2022; Gapminder, 2022.
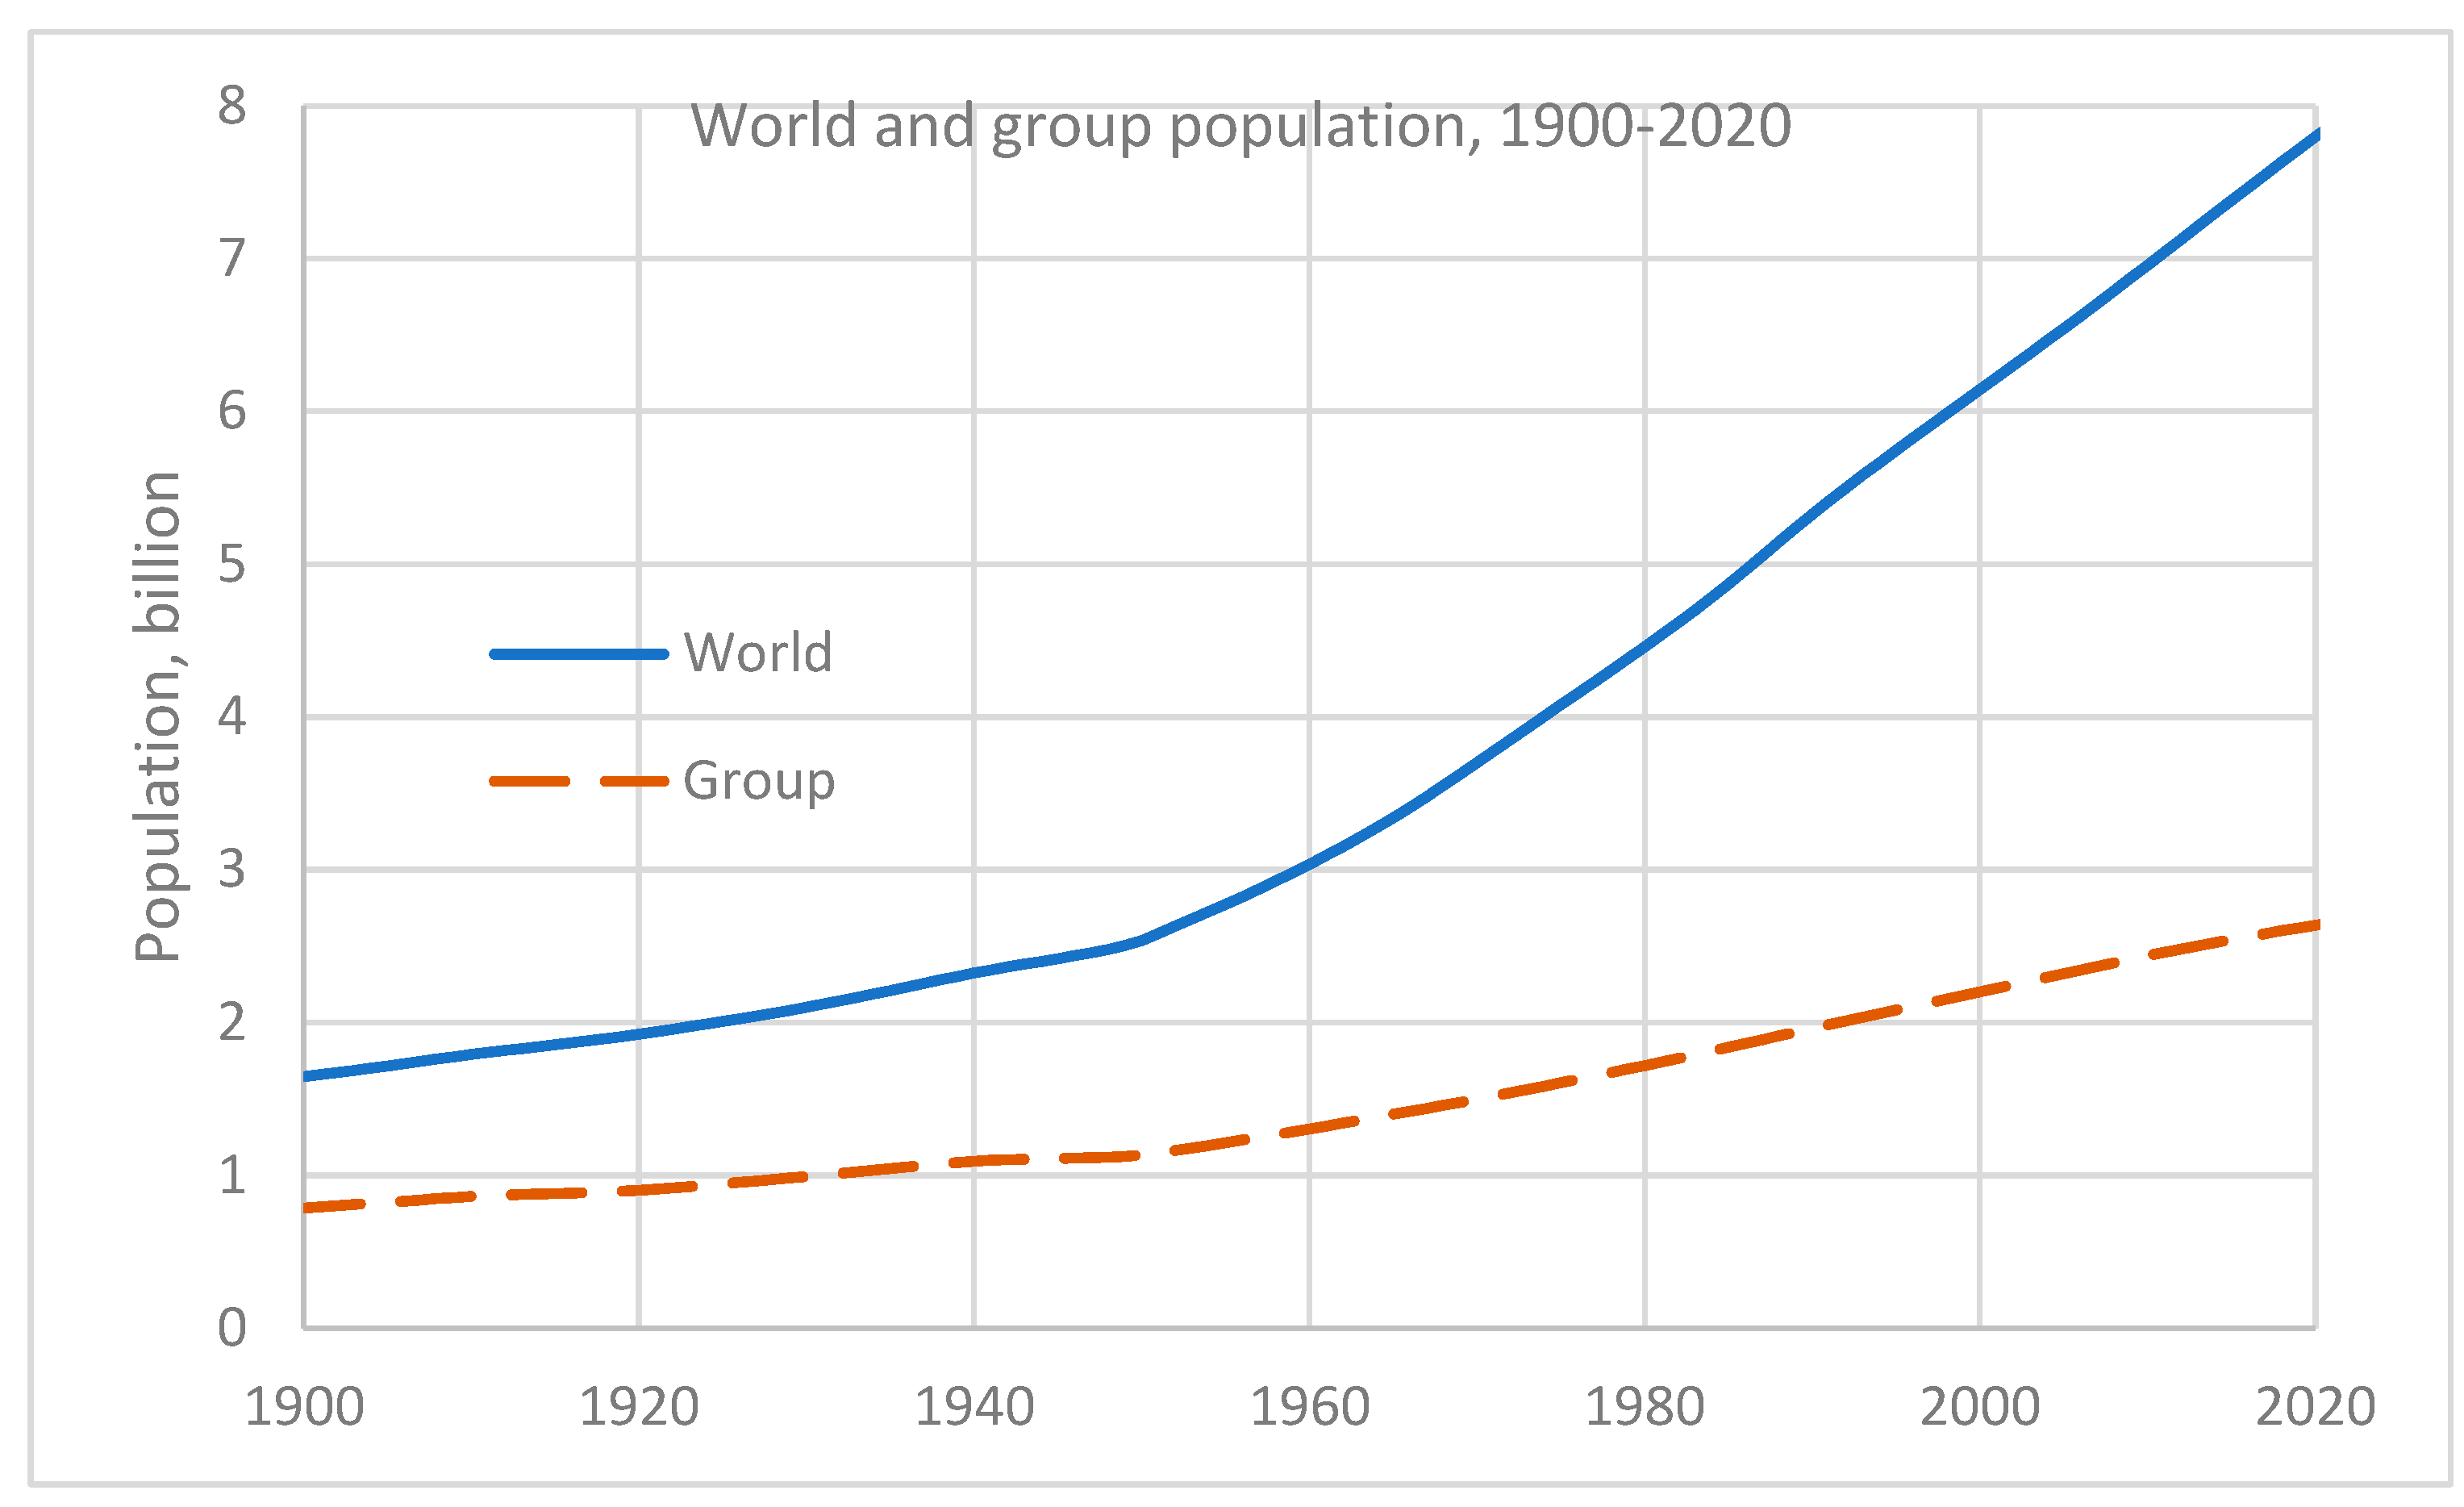
Figure 4.
Finding the number of articles accumulated over previous years (1900-1999) by the beginning of the observation period (2000-2018): (a) annual publication of articles vs. GDP: ; (b) GDP vs. population: (population over time is shown in Figure 3); (c) annual publication of articles over time: ; and finally (d) the accumulation of articles over time (since 1900): . Model calculations are compared with the data.
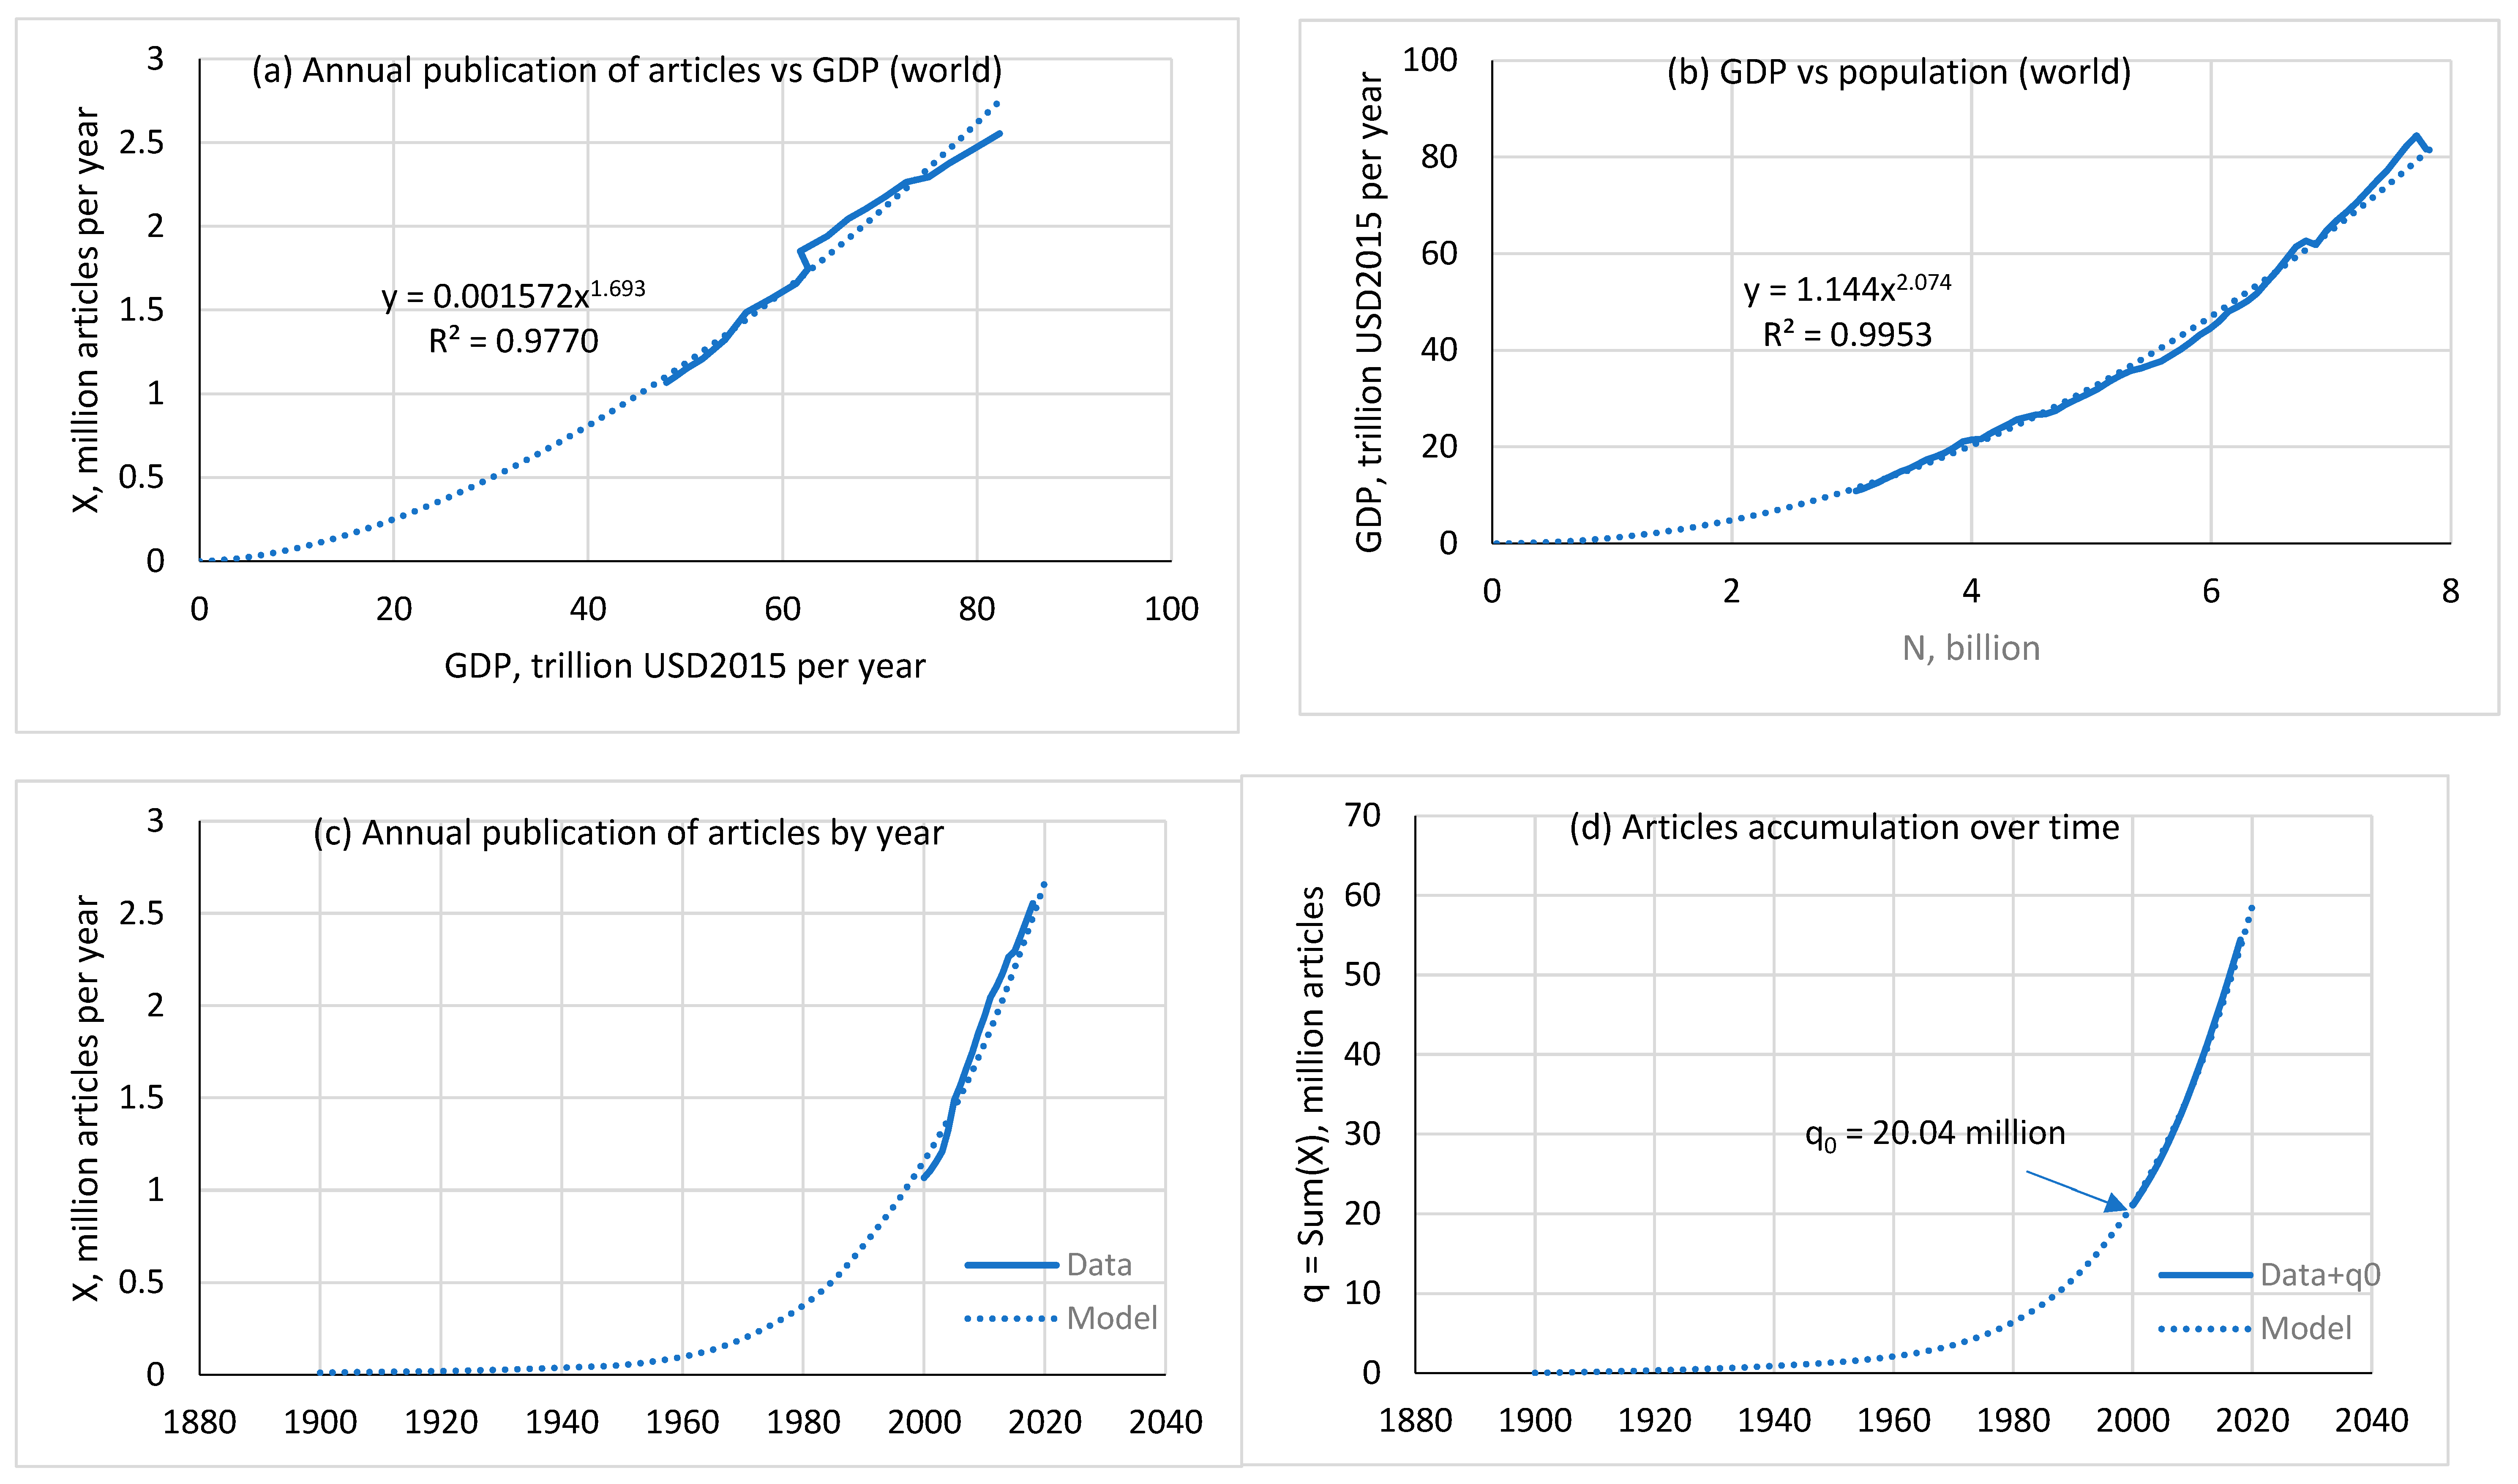
Figure 5.
Finding the number of accumulated patents (a, b) and books (c, d). Here, in contrast to Figure 4, only the start and end charts are shown.
Figure 5.
Finding the number of accumulated patents (a, b) and books (c, d). Here, in contrast to Figure 4, only the start and end charts are shown.
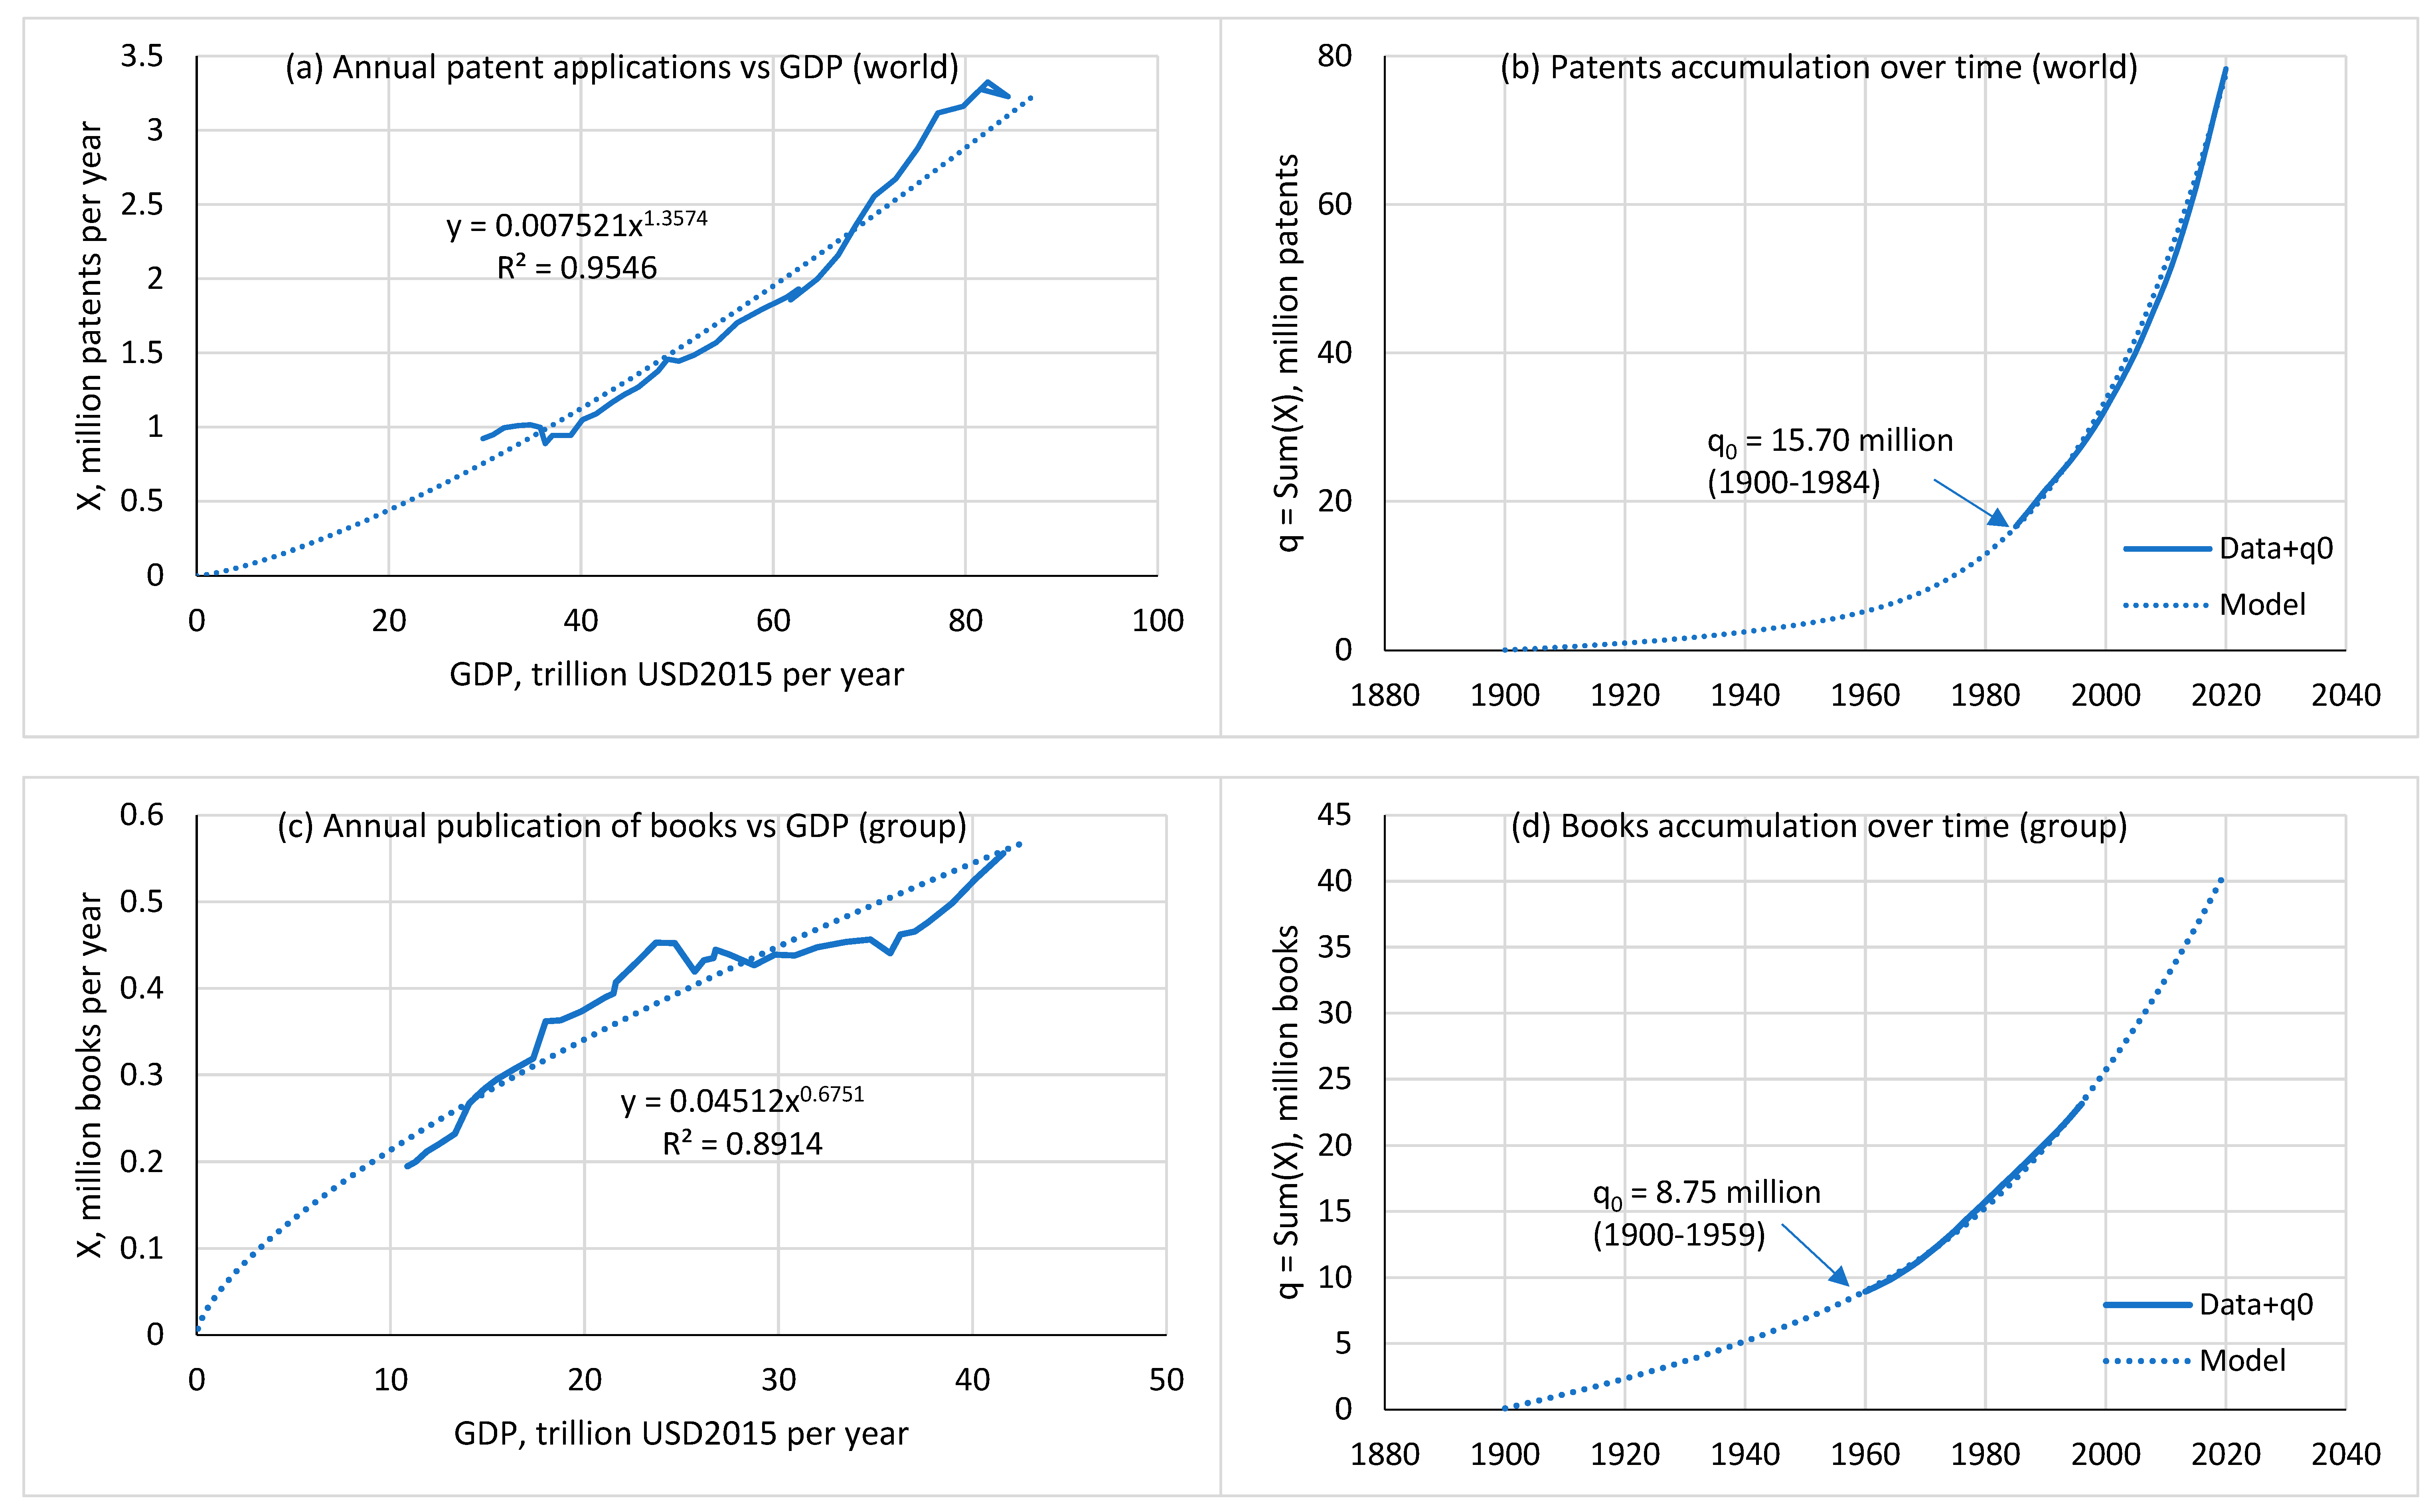
Figure 6.
Informational storage capacity (a) (four points correspond to 1986, 1993, 2000 and 2007) and the cumulative sums of patents (b), articles (c) and books (d) depending on the cumulative sum of population during the corresponding observation period, indicated at the top of the panels. Markers and solid lines are data, dotted lines are model. See Table 1 for model parameters. Data source for storage capacity: Hilbert (2014). Data sources for patents, articles, books and population are indicated in the captions to Figure 2 and Figure 3.
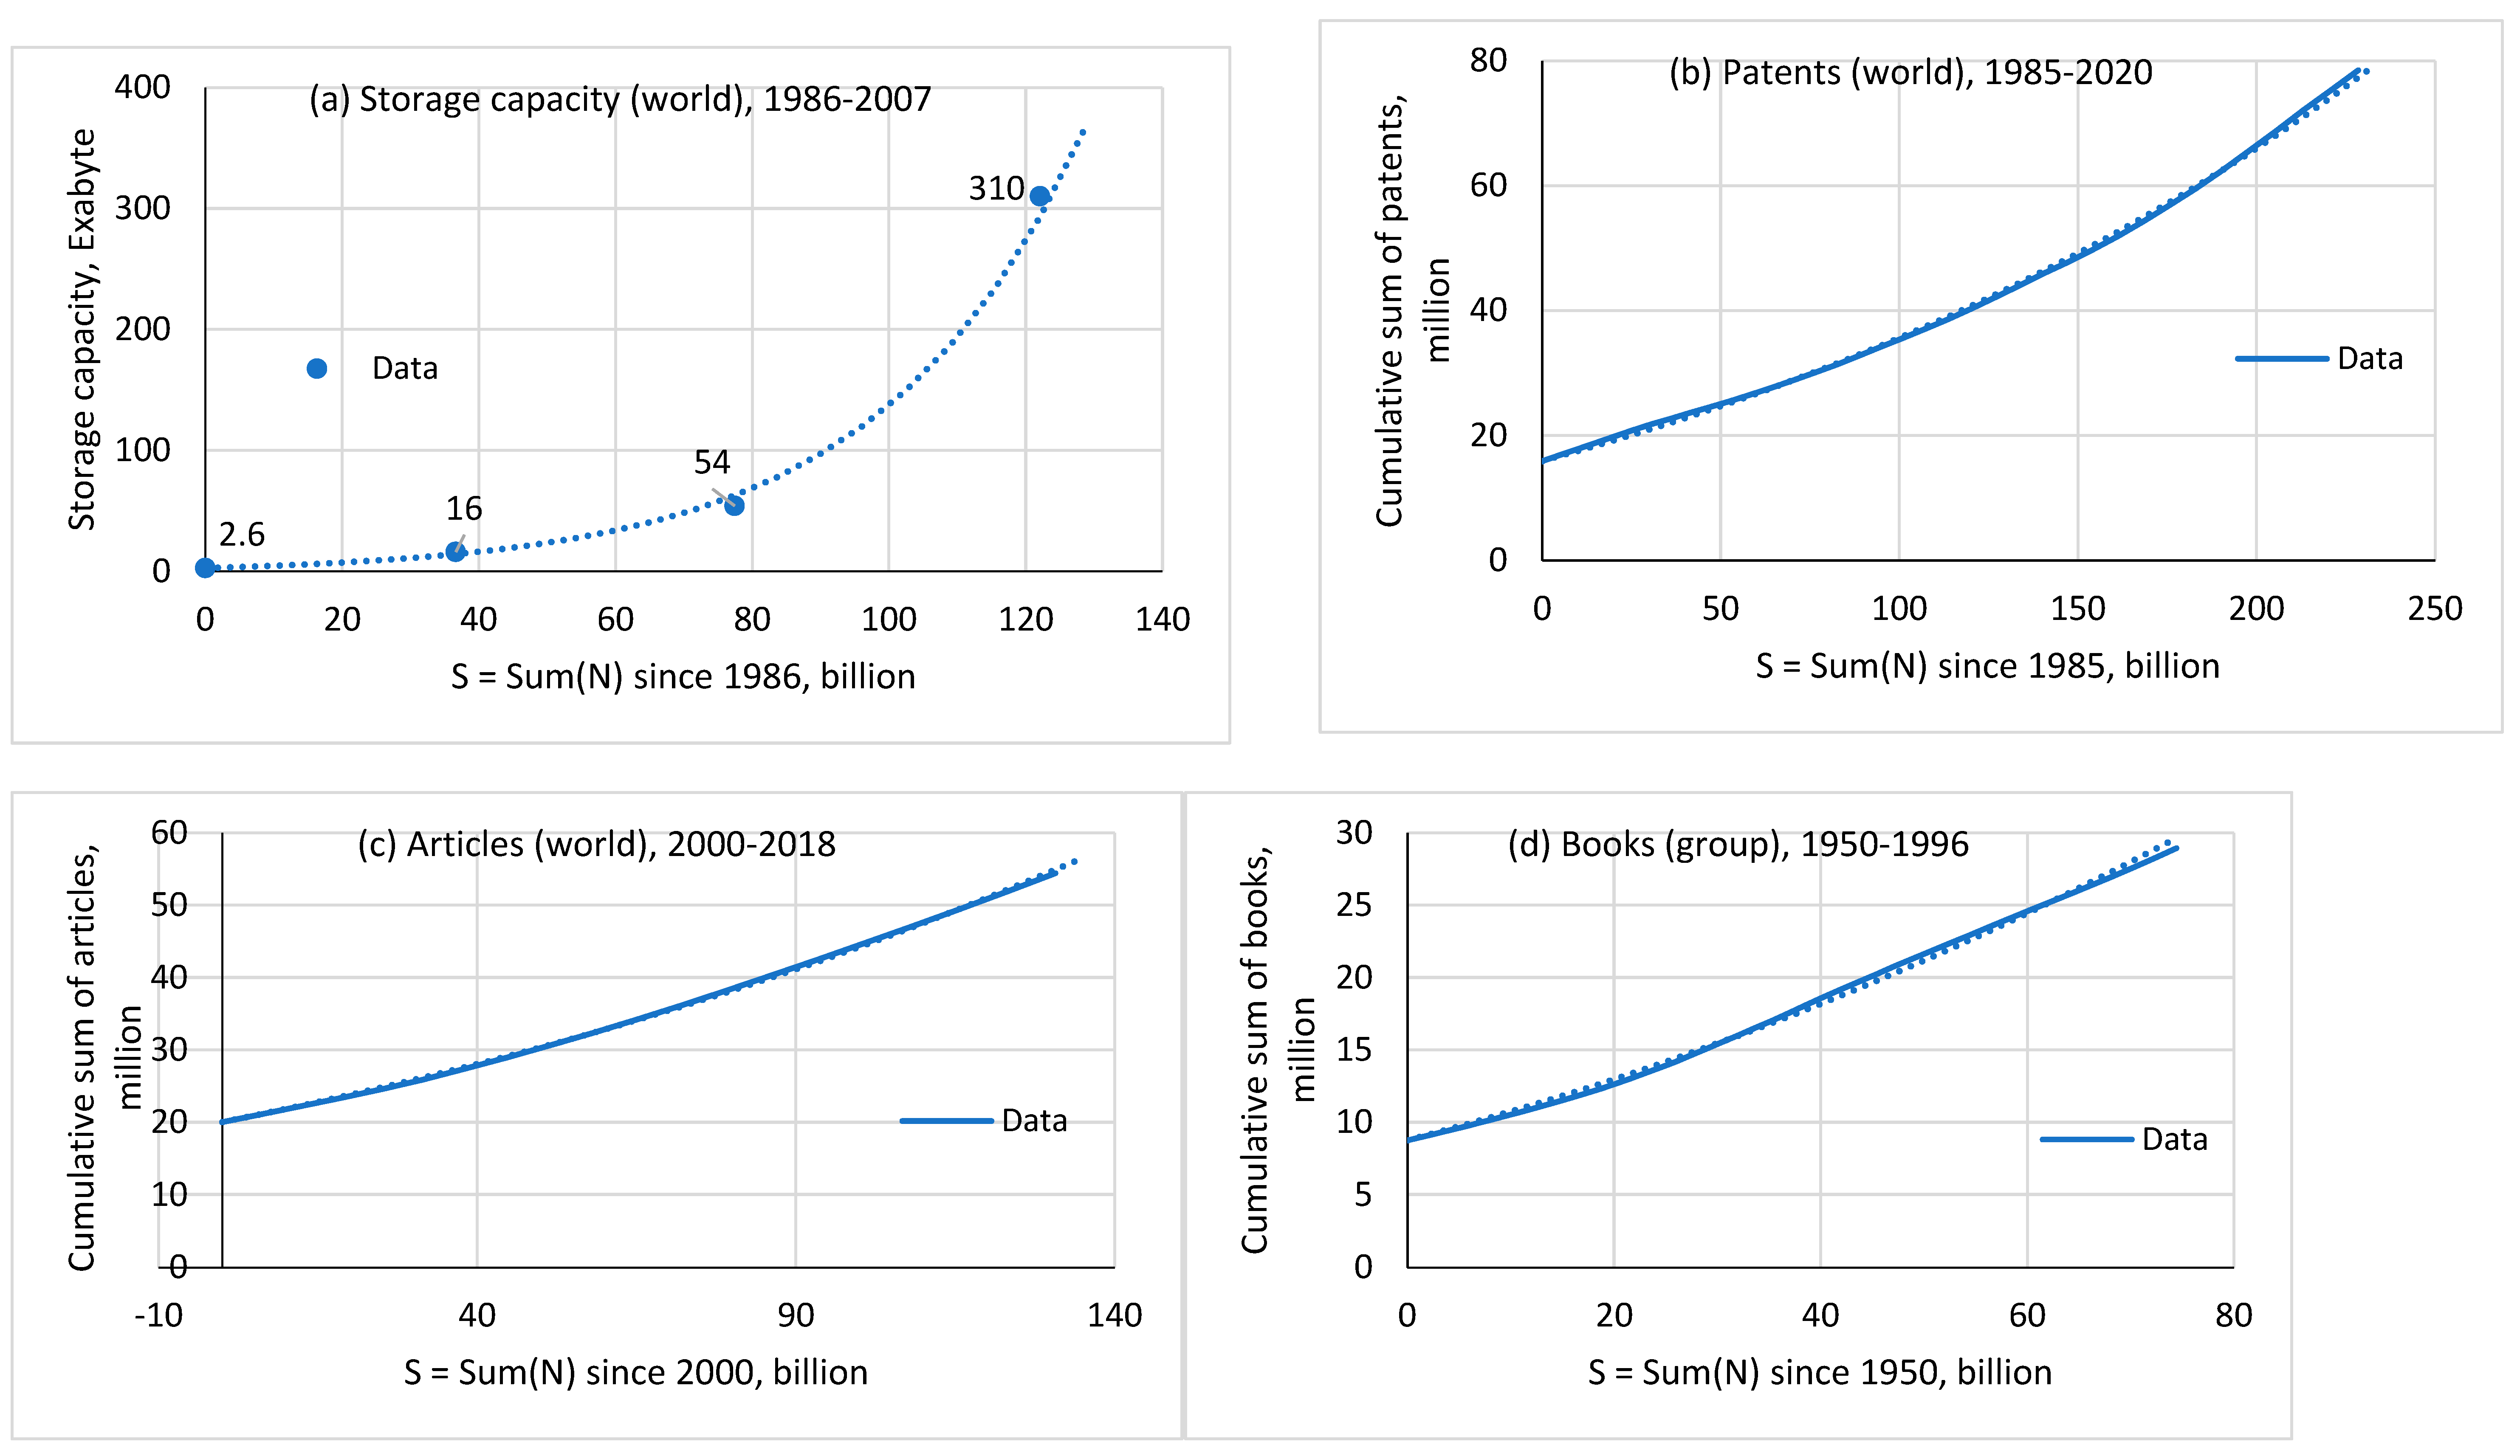
Figure 7.
Productivity as a function of knowledge amount for patents, articles, books ( on the left axis, in millions of texts) and storage capacity ( on the right axis, in Exabytes).
Figure 7.
Productivity as a function of knowledge amount for patents, articles, books ( on the left axis, in millions of texts) and storage capacity ( on the right axis, in Exabytes).
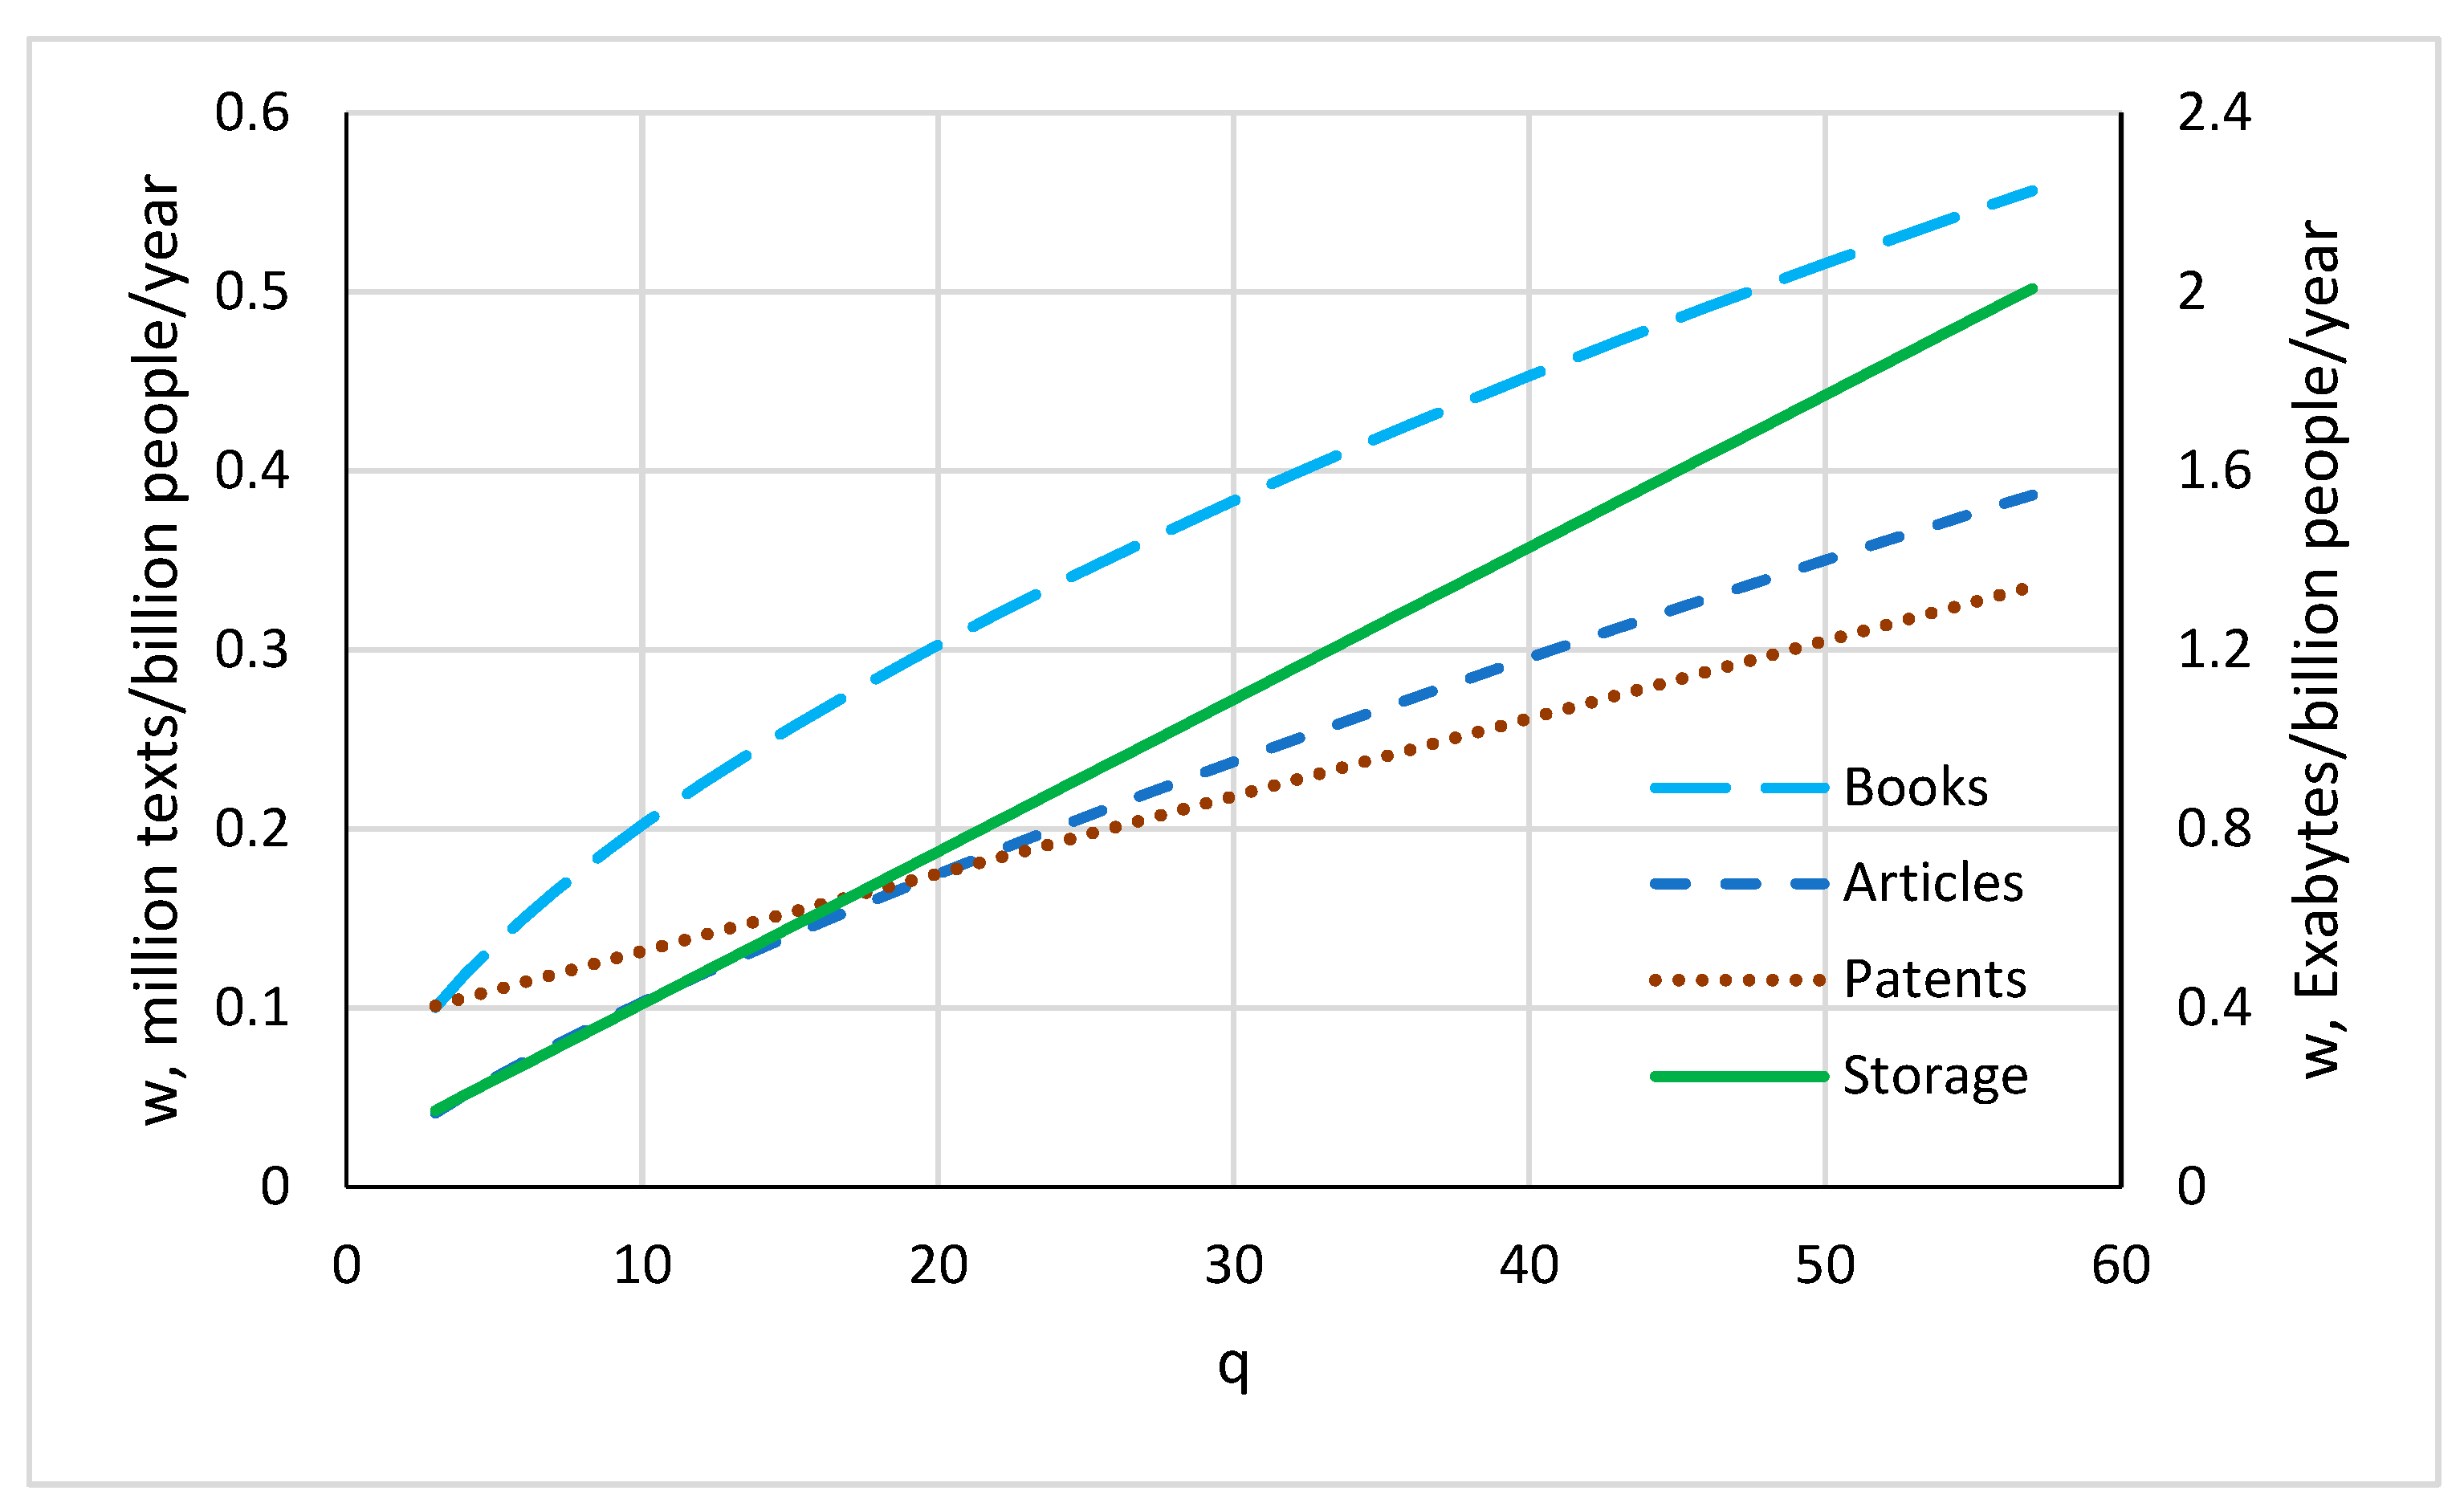

Table 1.
Optimal parameter values of the productivity function (13) and its asymptotics (25) for storage capacity and various types of knowledge representation*.
Table 1.
Optimal parameter values of the productivity function (13) and its asymptotics (25) for storage capacity and various types of knowledge representation*.
| Model parameters |
Storage 1986-2007 |
Patents 1985-2020 |
Articles 2000-2018 |
Books 1950-1996 |
| 2.6 | 15.70 | 20.04 | 8.75 | |
| 1 | 1 | 0.7580 | 0.5814 | |
| 0.487 | 0.0490 | — | — | |
| 0.06978 | 0.08841 | — | — | |
| — | — | 0.01804 | 0.05304 | |
| 0.9963 | 0.9991 | 0.9997 | 0.9977 |
* Notes: 1) The storage capacity and the number of texts (patents, articles or books) accumulated by the beginning of the corresponding observation period are denoted as . 2) System of units: , Exabytes (Exa = 1018) for storage capacity; , million texts for patents, articles and books; , billion people; , year. 3) The determination coefficient for articles and books is highest for the asymptotic formula (24). 4) Data on books are given for a group of 30 countries for which data are available for the entire specified period 1950-1996 (gaps for individual years are filled by linear interpolation). The group includes countries: Argentina, Australia, Austria, Belgium, Bulgaria, Denmark, Estonia, Finland, France, Germany, Greece, Hungary, Iceland, India, Italy, Japan, Latvia, Lithuania, Netherlands, Norway, Poland, Portugal, Romania, Russian Federation, Spain, Sweden, Switzerland, Turkey, United Kingdom, United States.
Table 2.
Memory capacity of informational storage and various types of knowledge representation as of 2007.
Table 2.
Memory capacity of informational storage and various types of knowledge representation as of 2007.
| Type | Number of texts (in 2007), million | Specific capacity, Megabyte per text |
Total capacity, Petabyte* |
| Storage (world) | — | — | 310 000 |
| Patents (world) | 44.0 | 1.5 | 0.07 |
| Articles (world) | 30.6 | 1.5 | 0.05 |
| Books (group) | 30.4 | 14 | 0.30 |
* 1 Petabyte = 1015 bytes.
Table 3.
The increase in productivity over the observation period.
| Type | Year | |||
| Storage* | 1986 | 2.6 | 0.1581 | 63.4 |
| 2007 | 292.8 | 10.02 | ||
| Patents** | 1985 | 15.92 | 0.1574 | 2.69 |
| 2020 | 78.51 | 0.4234 | ||
| Articles** | 2000 | 20.04 | 0.1750 | 2.15 |
| 2018 | 54.42 | 0.3757 | ||
| Books** | 1950 | 8.749 | 0.1872 | 2.03 |
| 1996 | 28.94 | 0.3805 |
*For storage: , Exabytes; , Exabytes per billion people per year. **For patents, articles, and books: , million texts; , million texts per billion people per year.
Disclaimer/Publisher’s Note: The statements, opinions and data contained in all publications are solely those of the individual author(s) and contributor(s) and not of MDPI and/or the editor(s). MDPI and/or the editor(s) disclaim responsibility for any injury to people or property resulting from any ideas, methods, instructions or products referred to in the content. |
© 2025 by the authors. Licensee MDPI, Basel, Switzerland. This article is an open access article distributed under the terms and conditions of the Creative Commons Attribution (CC BY) license (http://creativecommons.org/licenses/by/4.0/).
Copyright: This open access article is published under a Creative Commons CC BY 4.0 license, which permit the free download, distribution, and reuse, provided that the author and preprint are cited in any reuse.


