Specifications Table
| Hardware name |
DreamMachine |
| Subject area |
|
| Hardware type |
|
| Closest commercial analog |
OpenBCI, Emotiv, SMARTING mobi |
| Open-source license |
GNU General Public License v3.0 |
| Cost of hardware |
Around 150 Euro |
| Source file repository |
https://github.com/neuroinfo-os/dream-machine-eeg |
1. Hardware in Context
EEG is one of the most non-invasive methods for recording brain activity [
1]. A portable version, known as mobile EEG, allows for its use outside of traditional laboratory settings [
2]. EEG systems have a wide range of applications, and their versatility has been explored across various domains [
3]. Their significance is evident in both scientific research and practical applications. For instance, EEG is frequently employed in cognitive neuroscience, where brainwave patterns are analyzed to reveal the neural mechanisms underlying cognitive processes such as attention, memory, perception, and language, offering valuable insights into the complexities of human cognition [
4,
5,
6]. In clinical diagnosis and monitoring, EEG assumes a pivotal role in diagnosing and monitoring neurological disorders like epilepsy, sleep disorders, and brain injuries by recording abnormal electrical activities to facilitate precise diagnoses and tailored treatment plans, even assisting in pinpointing abnormal brain activity locations for surgical planning in epilepsy cases [
7,
8,
9]. In neurofeedback therapy, EEG-based techniques are employed in therapeutic settings to enable individuals to regulate brain activity patterns through real-time feedback, offering significant benefits for conditions such as attention deficit hyperactivity disorder (ADHD) and anxiety disorders [
10,
11]. Furthermore, EEG plays a pivotal role in developing brain computer interfaces (BCI), enabling individuals with severe motor disabilities to control external devices using brain signals, ranging from computer interactions to immersive virtual reality experiences [
12,
13]. EEG also enhances emotional and mood analysis by revealing how the brain processes emotions in response to stimuli, contributing valuable insights to affective computing and psychological research by uncovering patterns of emotional states [
14]. Additionally, EEG is utilized in educational research to study learning processes and interventions, allowing researchers to assess the impact of teaching methods on brain activity and cognitive engagement, ultimately refining instructional strategies [
15,
16]. In psychological studies, EEG aids in investigating brain processes related to decision-making, problem-solving, and social interactions, providing valuable insights into the neural foundations of human behavior and cognition [
17,
18,
19,
20]. Notably, many of these applications can yield meaningful conclusions without requiring high resolution or many electrodes. This trend is accelerated by the rise of deep learning and other machine learning approaches, which enhance signal processing and enable reliable conclusions from smaller datasets [
21]. Although these tools and algorithms can compensate for weaknesses in the original data, improving systems for recording high-quality data remains crucial.
A wide range of EEG and mobile EEG systems with various configurations are available on the market [
22,
23,
24]. However, the IFCN has established standards for EEG devices to ensure high-quality and consistent data recording in clinical settings [
25]. These specifications are designed to maintain the accuracy, reliability, and usability of EEG recordings. They include a minimum of 24 channels, a sampling rate of at least 200 Hz, a range of filters, a resolution of no less than 12-bit, and the provision of data in a standard file format. The DreamMachine fully meets all these requirements. This device connects to a companion app on an Android device via Bluetooth technology. It features a lightweight design, offers a battery life of up to six hours, and is capable of recording 24 channels at a 250 Hz sampling rate [
16]. Additionally, this device can be easily adjusted to capture EOG and ECG signals if needed. Remarkably, the production cost of the device remains below 150 Euros (as of the design period) [
16]. Moreover, every aspect of the project, from a detailed explanation of the hardware configuration to the source code of the companion app, is openly accessible and available for unrestricted use and on
GitHub repository.
Following the discussion of relevant research on mobile EEG devices and similar projects, the focus shifts to the software components of the mobile EEG systems. In this study, the software details of the DreamMachine project are investigated. This includes an explanation of data compression and decompression techniques, establishing bidirectional communication between the companion application and the EEG device, and the introduction of the filters used within the application. The analysis concludes with a performance evaluation based on a standard eyes open and eyes closed experiment, comparing the DreamMachine device with a laboratory EEG system (asalab™ by ANT Neuro) [
26]. For a detailed discussion on the hardware aspects, please refer to [
16].
1.1. State of the Art Mobile Smartphone-Based EEG Devices
In recent years, there has been a growing interest in using mobile EEG systems across a wide range of experiments. This increased interest is driving the development and innovation of new mobile EEG technologies. A standardized method for evaluating and comparing mobile EEG systems across different studies is essential for selecting the appropriate system for research or developing the next generation of mobile EEG technology. The Categorization of Mobile EEG (CoME) scheme was introduced to address this need. This scheme classifies mobile EEG devices based on several key parameters, including device mobility, participant mobility, system configuration (such as the number of channels, sampling rate, resolution, and other technical features), and contextual factors that may influence the usability and performance of the EEG system. By evaluating these aspects, the CoME scheme aims to enhance the quality and reliability of recorded data and ensure the practical application of mobile EEG technology. In the paper by Anthony Bateson and his colleagues [
27], the CoME scores for 15 mobile EEG experiments conducted with five different devices developed over the past twelve years were evaluated, including their own. The average CoME scores for these devices are as follows: 3.5 out of 5 for device mobility (D), 1 out of 5 for participant mobility (P), 9 out of 20 for system specification (S) (with the mean used when ranges were provided), and a channel count (C) of 10.3. In comparison, our device scores 4D, 1P, 10-12S, and 24C. The bit resolution is ambiguous, as we sample at 24-bit resolution (scoring 4) but transmit at 16-bit resolution (scoring 2). Considering this, DreamMachine meets or exceeds the average performance of current mobile EEG devices in the evaluated categories. The following paragraph highlights three recent devices to underscore the unique features of DreamMachine. It demonstrates that DreamMachine is unparalleled in being open-source and cost-effective while maintaining performance competitive with commercial mobile EEG systems.
In comparison to the mobile EEG system presented by Anthony Bateson [
27], several distinct approaches and advantages are offered by DreamMachine. The key differences include the use of Wi-Fi instead of Bluetooth, the implementation of the companion application in C# rather than Java, and the unique method of transmitting experimental triggers. In Anthony Bateson’s study, Wi-Fi was used because of its higher bandwidth compared to Bluetooth. However, in DreamMachine, an innovative encoding scheme effectively mitigates Bluetooth’ slower bandwidth and leverages the advantages of BLE. For further details, see Bluetooth section. The decision to implement the application in Java was made due to its widespread use and prevalence. Data indicates that Java is the second most learned programming language after Python [
28]. The versatile, open-source application developed in a widely known programming language allows researchers to easily customize the application to suit their experimental needs. An additional advantage of the DreamMachine lies in the seamless storage of triggers. Unlike the device presented in Anthony Bateson’s study, where triggers are sent via a designated channel, DreamMachine is compatible with LabRecorder and capable of streaming data using LabStreamingLayer (LSL). This compatibility enables researchers to continue using established methods for conducting experiments. Moreover, in this study, a prototype of the application has been developed to save triggers and experimental cues directly as a CSV file, allowing all channels to be utilized for recording EEG data. Although Bateson’s project incorporates an impedance check within their companion app—a feature that aids in setting up connections and improving recording quality—this functionality is currently absent in the DreamMachine system. However, the inclusion of this valuable feature is planned for a future version of the application.
A different, commercially available device is the SMARTING mobi3, which has been employed in several studies, including auditory attention decoding, saliency detection, visual selective attention tasks, and the development of BCI applications [
29,
30,
31]. This device, along with its included cap, records 24 channels and operates with a sampling frequency ranging from 250 to 500 Hz [
32]. Like DreamMachine, it is compatible with the Lab Streaming Layer (LSL). Although the SMARTING mobi3 is lightweight (< 60g) and can operate on battery power for up to five hours, optimal performance requires a connection to a PC via Bluetooth, limiting overall mobility. There is also an option to use a mobile phone as the receiving device. The advanced version, SMARTING pro4, offers enhanced characteristics, including 32 channels, a sampling rate of up to 1000 Hz, 3D head motion tracking, automatic artifact removal, and on-device data backup. However, the most significant differences compared to DreamMachine are its open-source nature, longer battery life, better Bluetooth performance, and lower price. DreamMachine provides insight into all parts of the device and allows researchers and interested parties to adapt the app according to their needs, offering a level of flexibility and customization that is not available with SMARTING devices.
The Emotiv Insight, first released in 2014, offers a range of commercially available EEG brainwear devices [
24,
33]. Their systems, equipped with between five and 32 sensors, record EEG data at a 128 Hz sampling rate and detect head movements. The systems connect to PCs and mobile devices via Bluetooth. The various devices are priced between
$500 and
$2100. In addition to the hardware, the company provides an ecosystem for designing, conducting, and analyzing experiments for an annual fee of
$1000 to
$2800. The Emotiv devices have been compared to research-grade EEG systems for recording auditory event-related potentials (Emotiv EPOC) [
34]. Moreover, modified versions of these devices have been employed in research on brain-mobile interaction, the development of a portable real-time neuroimaging system, and the detection of epileptiform abnormalities [
35,
36,
37]. On the other hand, DreamMachine differs most significantly from the Emotiv product range in terms of price and its commitment to supporting open science. DreamMachine hardware features enhance accessibility, enabling more people to conduct research and utilize the device. The source code for both the devices and the app, including alternative versions, has been published to facilitate easy adaptation for different research goals.
In conclusion, DreamMachine is valuable to existing mobile EEG devices such as Emotiv, SMARTING mobi, and the device presented in Bateson’s study [
38]. The emphasis on low cost, open source, open hardware, and the easy adaptation of the companion app sets DreamMachine apart. Its performance is comparable to other state-of-the-art devices while it is available at a fraction of their cost.
2. Hardware Description
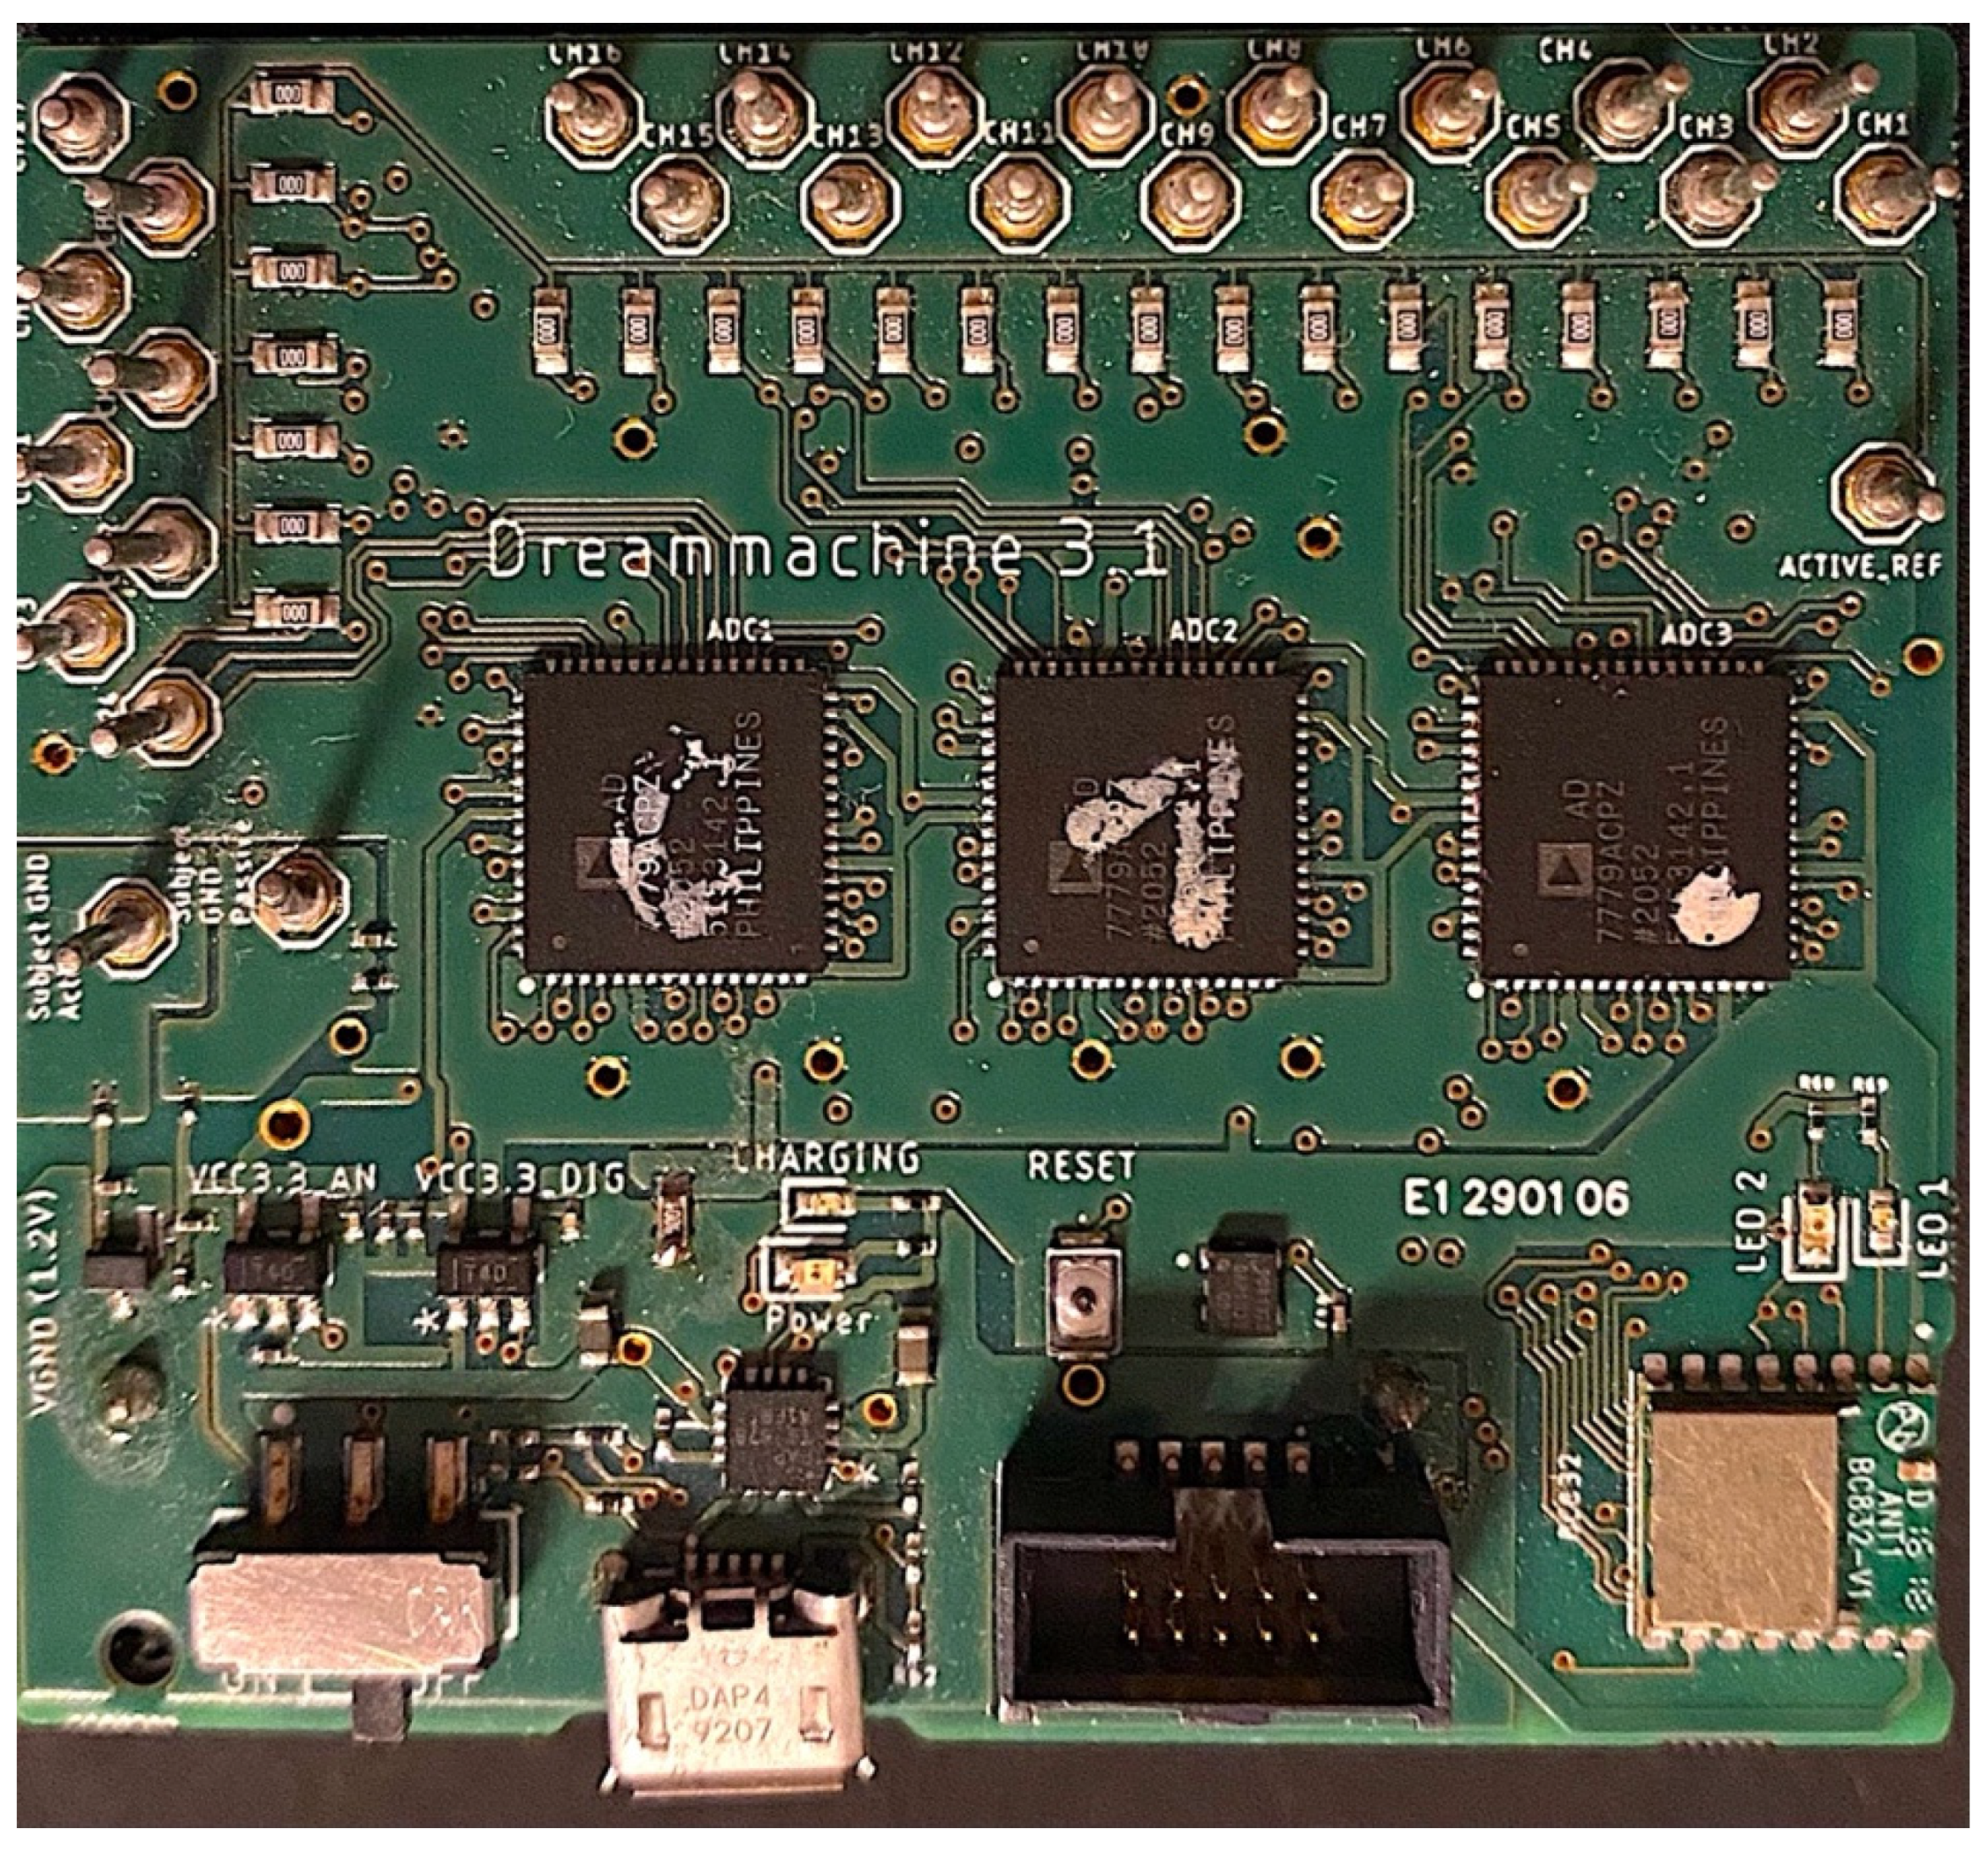
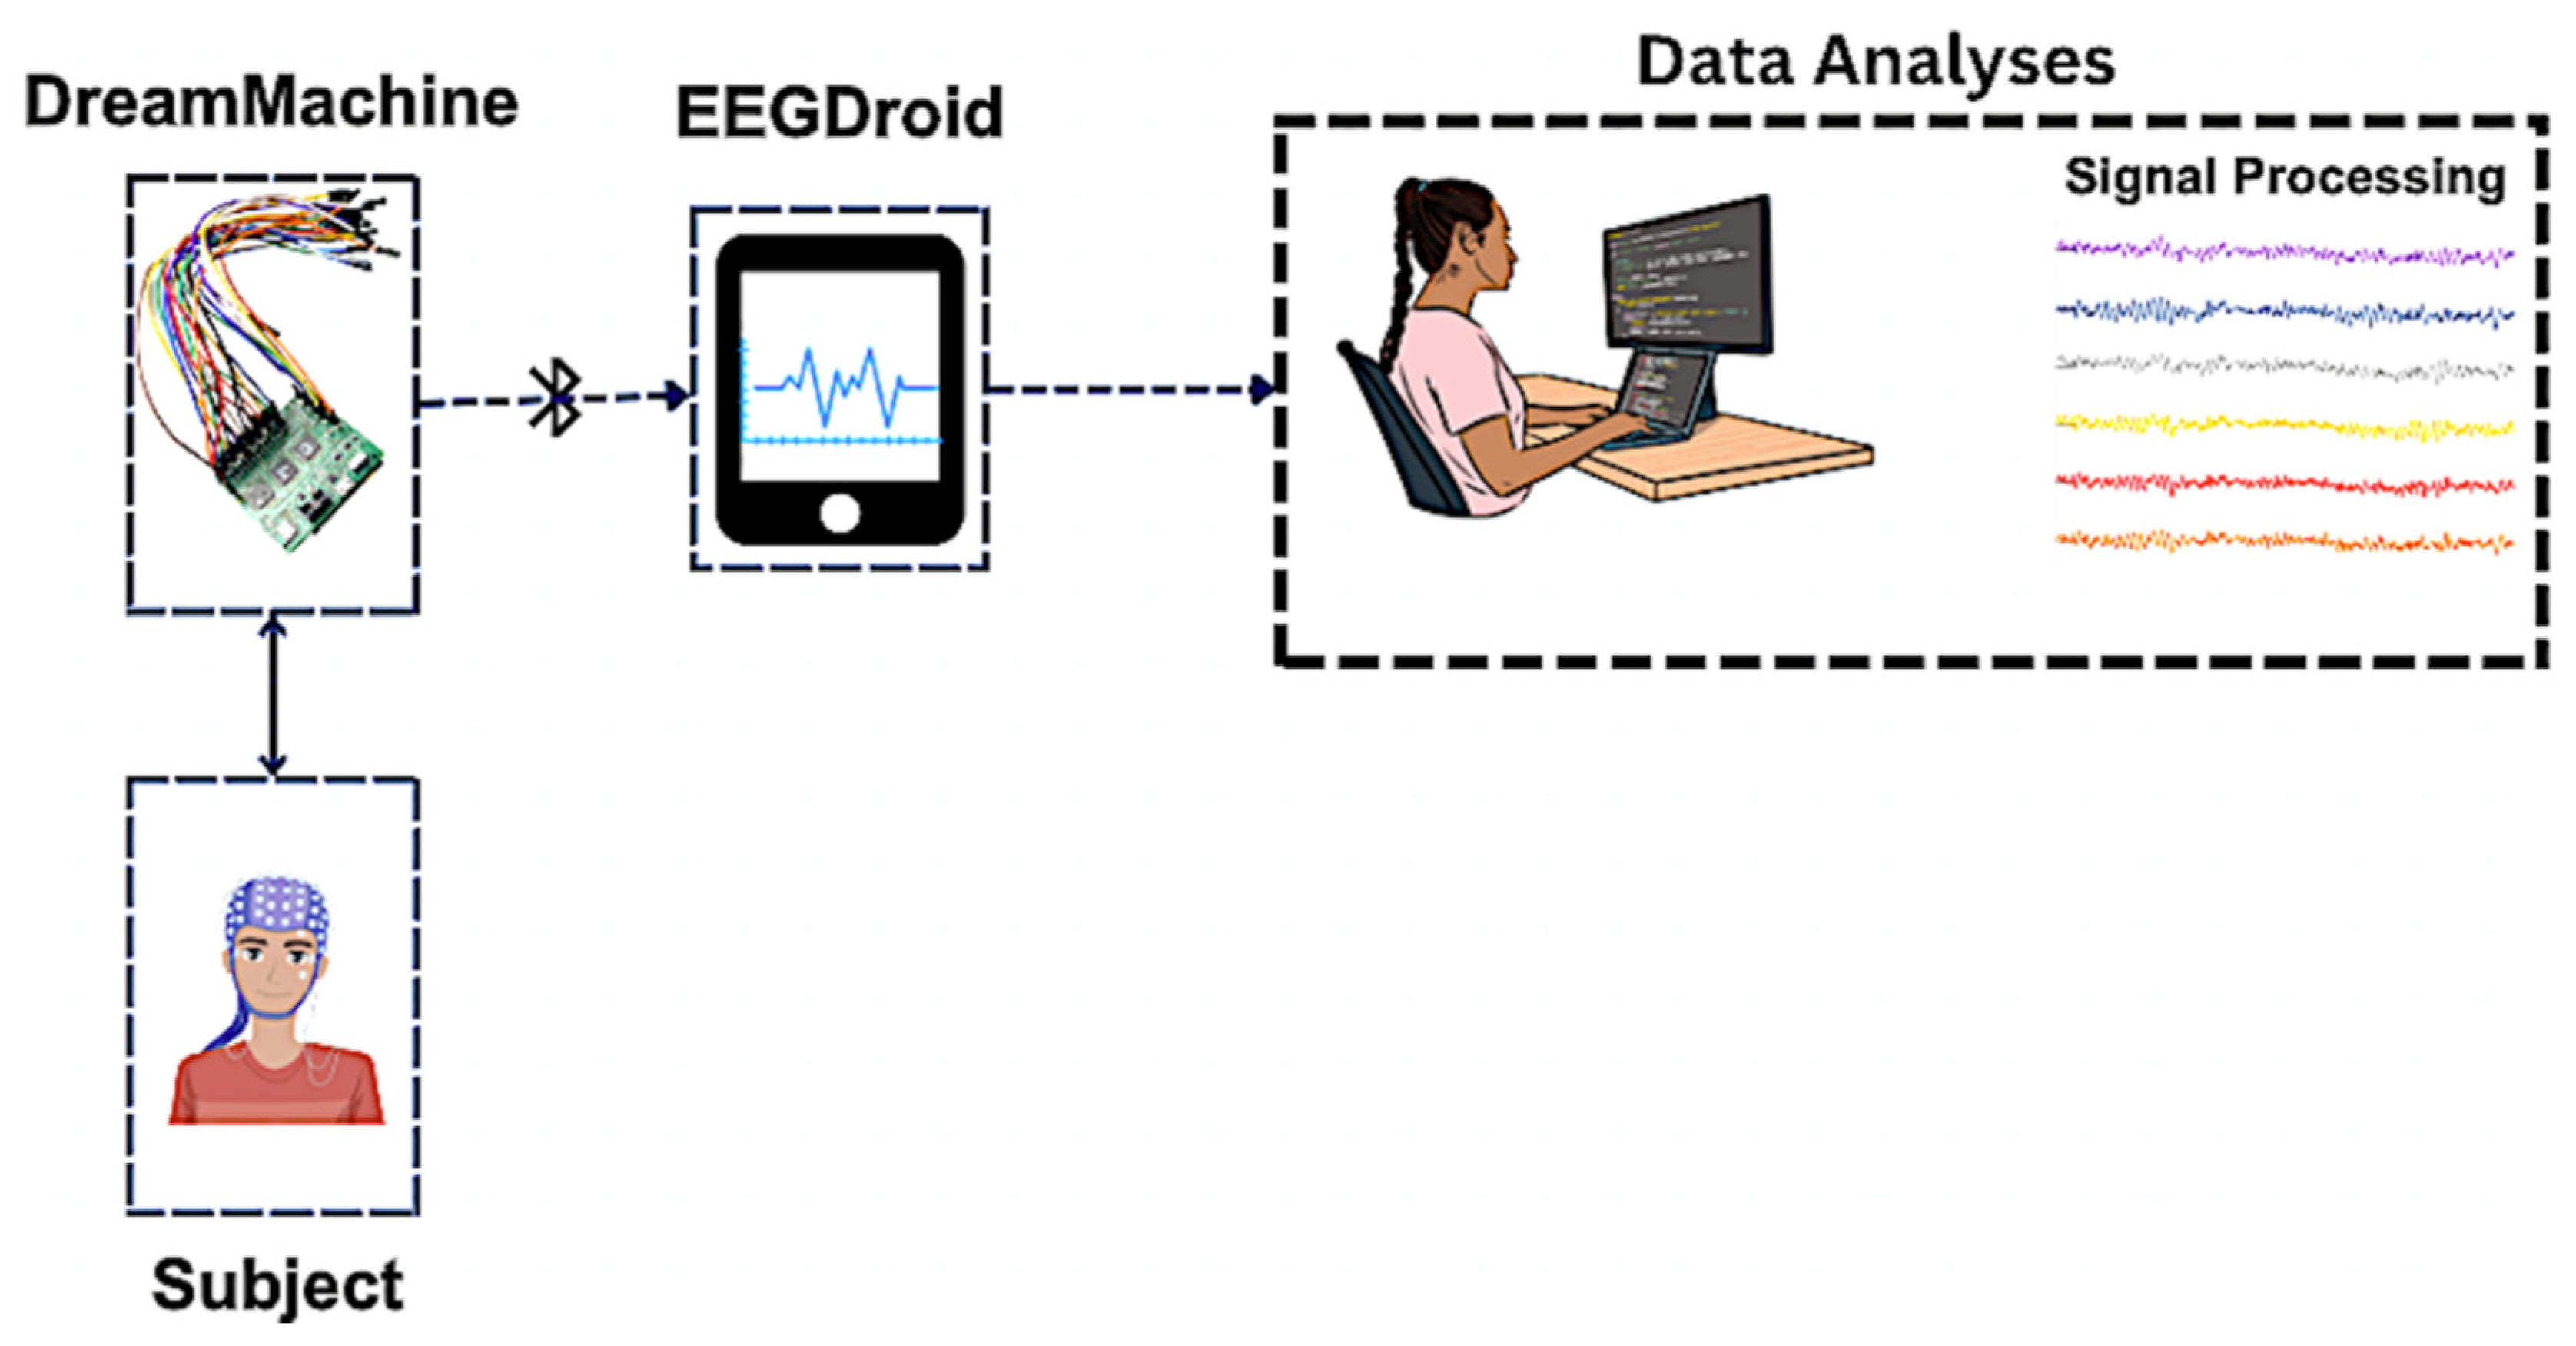
The DreamMachine hardware system is depicted in
Figure 1. This innovative device utilizes real-time electrode-transferred data, establishing seamless communication with an Android app via BLE. With a 24-bit resolution, DreamMachine accurately records and transfers brain activity data, which is managed through the dedicated Android app (EEGDroid). In terms of physical appearance, DreamMachine is a rectangular device with dimensions of 58.55 × 51.03 mm (L×W). It is equipped with 24 channels named FP1, FPZ, FP2, F7, F3, FZ, F4, F8, M1, T7, C3, CZ, C4, T8, M2, P7, P3, PZ, P4, P8, POZ, O1, OZ, and O2, placed on the scalp of a subject according to the 10–20 system. Additionally, two more channels are included, one serving as a reference and the other as a ground. The DreamMachine hardware system does not include the electrodes to allow researchers the flexibility to use available electrode caps. The electrodes can be connected via pins soldered onto the PCB board, as depicted in
Figure 1. The system is powered by a battery that weighs 36 g, enabling recordings of up to six hours with the current battery setup. Users have the option to choose between 10, 14, and 16-bit resolutions per channel. Furthermore, sampling rates of 250 Hz and 167 Hz can be selected.
2.1. Data Transmission
To transfer data from the DreamMachine system to the Android application, analog signals must first convert to digital form using analog-to-digital components. This process ensures the signals are accurately represented with a 24-bit resolution, delivering high precision. Sampling occurs at a rate of 250 Hz, capturing 250 data points per second. However, transmitting raw 24-bit data would demand significant bandwidth, making the process inefficient and costly. To address this, a compression technique is applied to encode the data before transmission, optimizing bandwidth usage while preserving data integrity. Without this compression, transmitting a significantly more significant amount of data would be necessary, leading to constraints on the device’s sampling rate and the number of channels that can be transmitted. Consequently, instead of transmitting 24-bit data, the data is compressed to 16-bit, which is a more manageable size for typical communication channels. However, it reduces some of the precision provided by 24-bit data. This is achieved by transmitting the difference between the current sample and a predicted sample value rather than the absolute recorded voltage. The predicted value is based on the previous sample or a linear combination of prior samples, a technique known as difference coding, delta encoding, or Differential Pulse Code Modulation (DPCM) [
39]. This method leverages the significant correlation between successive samples to represent the signal with fewer bits.
Another crucial aspect of the data transmission process is Adaptive Differential Pulse Code Modulation (ADPCM) [
40]. ADPCM ensures that only the most relevant 16-bit per channel are transmitted instead of all 24-bit. By encoding the difference between consecutive samples, ADPCM compresses digital signals, maintaining high resolution and incorporating an automatic artifact filter to enhance data quality. These approaches allow the transmission of 24 channels with a sampling rate of up to 250 Hz, preserving high resolution while minimizing the transmitted data volume. Additionally, ADPCM helps filter out artifacts, ensuring higher quality transmitted data. However, some data loss or errors may occur during Bluetooth transmission due to various factors.
It is important to be aware that data loss can occur during Bluetooth transmission itself, as Bluetooth uses radio waves for data transfer. Factors such as the distance between devices, Bluetooth signal strength, and interference from other wireless signals can impact the connection quality. An unstable Bluetooth connection may result in lost or corrupted data packets, leading to errors or incomplete data on the receiving device. Data loss can also occur on the receiving device if it is under high CPU load, which might hinder the processing of incoming data, or if the Bluetooth hardware or software is outdated, making it incompatible with the latest Bluetooth protocols. Several considerations should be made to minimize packet loss and avoid decoding errors and signal shifting during Bluetooth transmission.
First, maintaining a close distance between the DreamMachine device and the Android system helps ensure a strong Bluetooth signal and reduces data loss. Secondly, avoiding transmission in areas with heavy wireless interference, such as those with microwaves or cordless phones, can improve connection stability. Finally, reducing the CPU load on the receiving device by closing unnecessary applications and processes can free up resources for Bluetooth data processing. By adhering to these recommendations, the reliability of Bluetooth transmissions can be improved, data loss minimized, and decoding errors and signal shifting avoided.
Several mobile EEG devices utilize Wi-Fi instead of Bluetooth for data transmission, citing Bluetooth’s restricted bandwidth and comparatively lower data transmission capabilities as primary reasons. However, the compression algorithm developed has successfully addressed this limitation, making Bluetooth a viable option for data transmission.
One key advantage of using Bluetooth is its suitability for low-power applications, as it consumes significantly less energy than Wi-Fi modules. This efficiency helps extend the battery life of mobile EEG devices, allowing for longer recording sessions without needing to charge the device during use. This characteristic makes Bluetooth particularly well-suited for sleep experiments. Furthermore, the pairing process via Bluetooth is generally more user-friendly than Wi-Fi. However, Bluetooth’s reduced range compared to Wi-Fi remains a disadvantage. The EEG device must remain within proximity (<2 m) of the receiver device to transfer data without losing packets. While Wi-Fi offers a broader range, potentially providing participants with more freedom of movement, Bluetooth’s range is typically sufficient for most EEG applications. Its lower power consumption and ease of use make Bluetooth a preferred choice over Wi-Fi.
2.2. Bluetooth
The signal from conventional EEG devices is typically transmitted via cables to a computer. When connected to a computer or another device, these cables restrict participants’ mobility. Additionally, cable sway significantly contributes to motion artifacts. Consequently, replacing the cable between the EEG device and the computer with Bluetooth or Wi-Fi technology enhances mobility while concurrently mitigating motion artifacts caused by cable sway.
2.3. Android Application (EEGDroid)
The EEGDroid application, designed as the companion app for DreamMachine, has been developed for Android devices using the Java programming language. The application’s primary purpose is the reception and interpretation of compressed data sent by the EEG device. Additionally, it allows real-time data plotting, facilitates the saving and management of recordings, and enables the modification and programming of the DreamMachine hardware through provided configuration options. These options include adjusting device settings such as sampling rates, bit resolutions, and filters. Furthermore, the application serves as an educational resource on EEG and provides guidance on using EEGDroid, available on the GitHub repository. In the following sections, the details of the EEGDroid application configurations are specifically explained.
2.3.1. Gain and Bits per Channel
The AD7779 component, used in the DreamMachine hardware for Analog Digital Conversion (ADC), is equipped with options to select different gains to amplify the input signal before digitization, resulting in improved output resolution. Gains of 1, 2, 4, and 8 are provided by this component, ensuring that the analog input signal is multiplied by the corresponding gain factor. For instance, with an input signal voltage range of 0-5V, a gain of 1 produces a digitized output range of 0 − 224 (16,777,216) LSBs, equating to a resolution of approximately 298.1 µV per LSB. Conversely, a gain of 8 results in a digitized output range of 0 − 221 (2,097,152) LSBs, corresponding to a resolution of about 2.4 µV per LSB. All gain options are implemented within the Configuration settings of the EEGDroid application, allowing users to select their preferred gain to optimize the ADC’s resolution and precision level.
The term "bits per channel" describes the number of bits used to represent the amplitude of a signal recorded from a single EEG data channel. In EEG, electrical signals from brain neurons are measured and converted into digital values. Using a higher number of bits results in more precise measurements and a more comprehensive dynamic range. Within the EEGDroid application, bit depths of 10, 14, and 16 bits per channel are commonly used. A 10-bit signal offers a range of 0-1023, a 14-bit signal provides a range of 0-16383 and a 16-bit signal has a range of 0-65535. The selection of bit depth is influenced by the desired accuracy, dynamic range, and the capabilities of the hardware and software. Higher bit depths, while providing better resolution and dynamic range, require more memory and processing power due to the larger data size.
2.3.2. Filtering
Filtering of EEG signals is a critical step in data preprocessing for experiments. Because EEG signals are weak, they are prone to noise contamination from electrical devices, muscle movements, and environmental factors. Filtering is used to eliminate these unwanted components, improving the data’s signal-to-noise ratio (SNR). Specific frequency bands can also be selectively amplified or attenuated to enhance desired EEG components, such as brain waves. Filtering also assists in detecting and removing artifacts like eye blinks, eye movements, and electrode pops, aiding in the accurate interpretation of brain activity. Furthermore, filtering standardizes EEG data across various recording conditions and subjects, facilitating easier comparison of results across studies. For these reasons, DreamMachine offers configurable settings with a range of filtering options, enabling users to select the optimal settings for achieving high-quality EEG signals. These filters can be easily adjusted through the companion app.
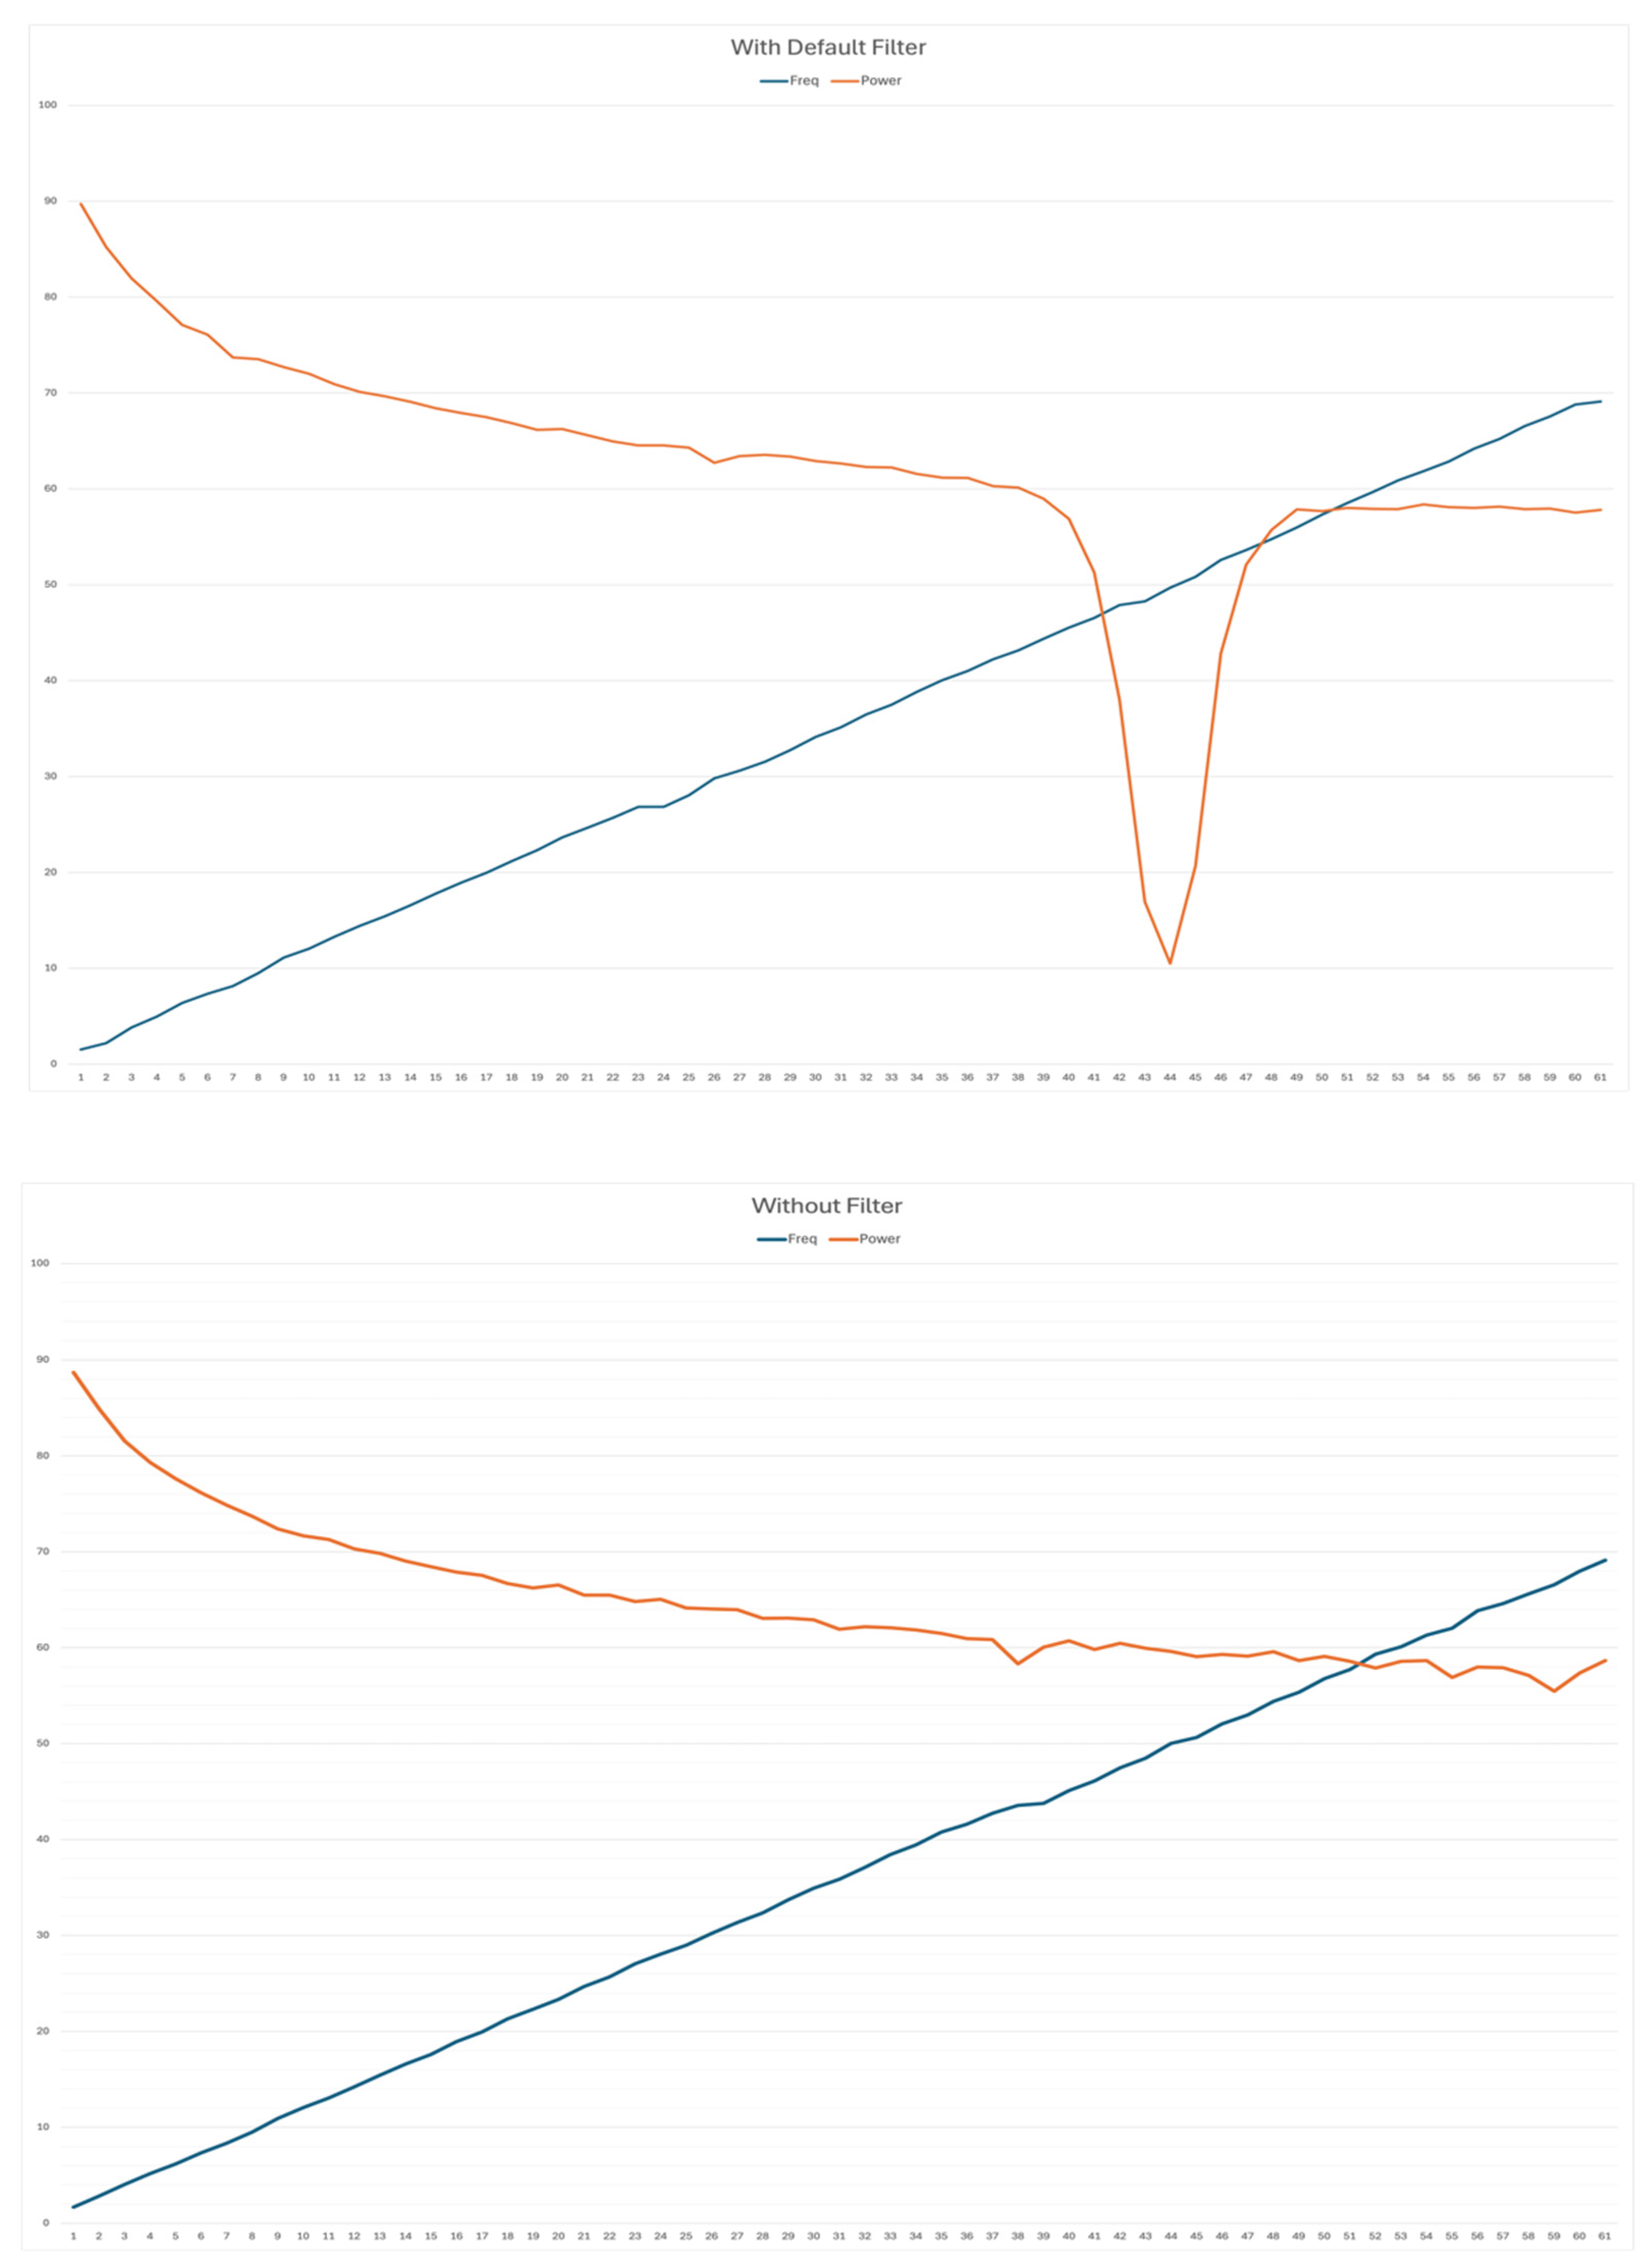
Data is initially sampled at a rate of 500 Hz, with filters applied before the data is downsampled to 250 Hz for transmission. The default filters include an infinite impulse response (IIR) filter, a fourth-order high-pass filter with a cutoff frequency of 1 Hz, a fourth-order low-pass filter with a cutoff frequency of 45 Hz, and a band-stop filter with a range of 46 to 54 Hz. The influence of the default filters is illustrated in
Figure 2. As shown in
Figure 2, the 50 Hz noise caused by power line interference could be perfectly filtered out by the DreamMachine.
Other filtering options DreamMachine provides are listed in
Table 1. Users can customize and select their own filtering configurations based on various experiments. However, tests conducted with DreamMachine indicate that the default filtering settings are recommended for optimal performance.
2.3.3. Bitshift and Safety Factor
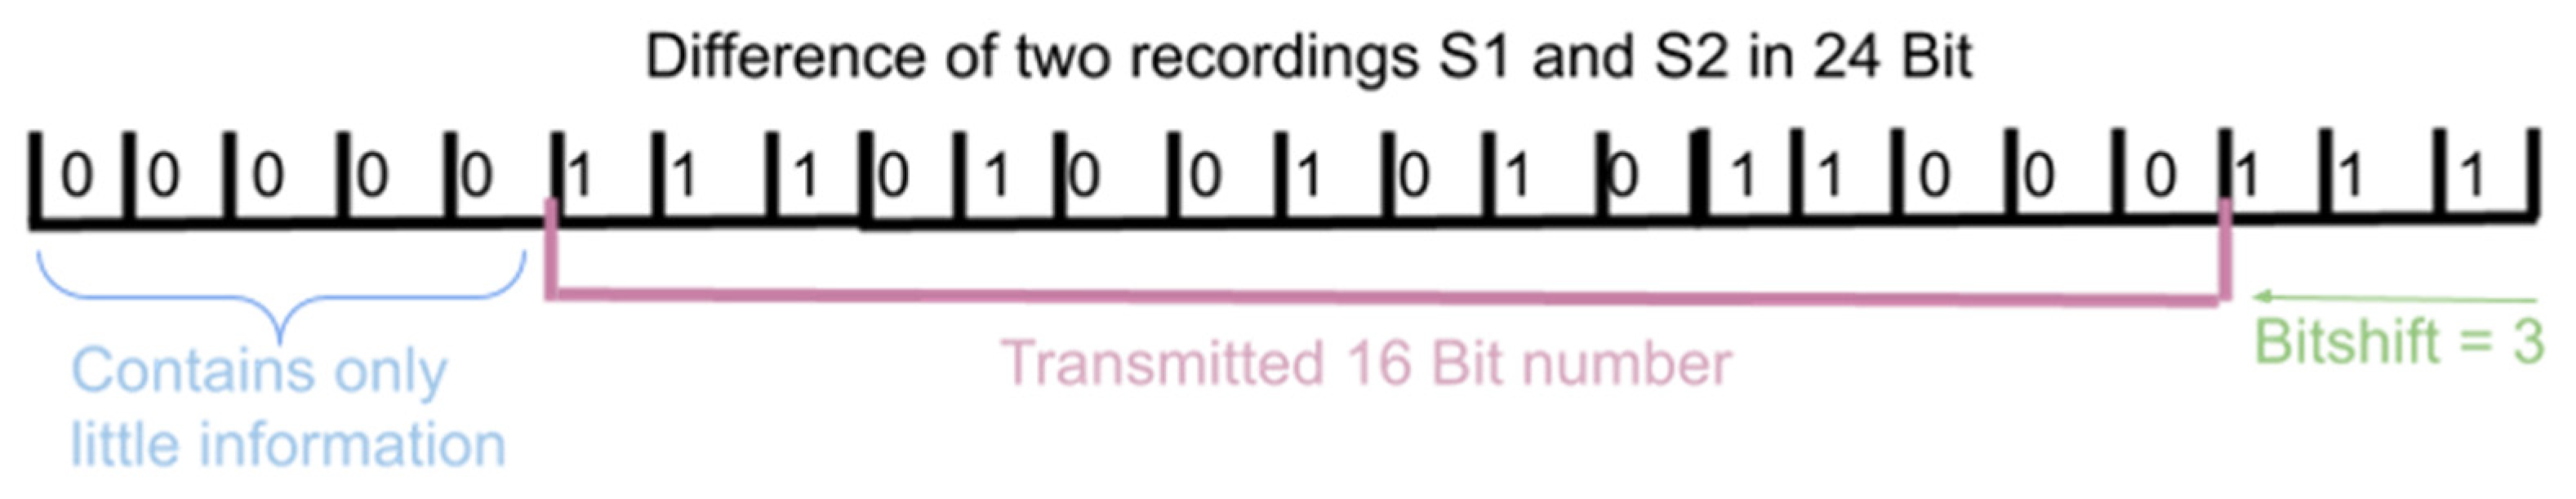
If only the difference between two 24-bit recordings were calculated and transmitted, the result would still be a 24-bit value, which limits the sampling rate or channel quantity. To address this, a floating average of the recorded values is tracked on the board, and each second, its standard deviation is used to identify the most relevant part of the 24-bit difference values. The bit shift is then transmitted along with the corresponding data value to the companion application, where an approximation of the recorded value is calculated based on the given bit shift and transmitted number. As depicted in
Figure 3, the bit shift indicates how many bits are skipped, starting from the left. A larger bit shift allows the transmission of larger values, though with greater inaccuracy, while a smaller bit shift represents smaller values with higher precision but less flexibility for transmitting large differences. The bit shift is calculated individually for each channel on the EEG device, and this encoding update is then sent to the companion application, where it is used to calculate the recorded value by adding the differences to the previous data point.
The option to set a maximal bit shift or a safety factor is available to expert users, which can be advantageous if there is prior knowledge of the signal’s variance or general amplitude. Setting a maximal bit shift is particularly sensible for EEG recordings with healthy participants, as a significant jump likely indicates artifacts, such as those caused by electrode, eye, or muscle movements. Consequently, cutting the peak does not result in significant information loss. By setting a maximal bit shift, the system is prevented from shifting to transfer large but likely artifact-induced values, forcing it to transmit the less significant bits on the right, thereby cutting the peak and losing some information while maintaining higher resolution for subsequent samples. The safety factor indicates how much larger the signal can be compared to the standard deviation calculated in the last second. For example, a safety factor of 8 indicates that signals up to eight times larger than the previously recorded standard deviation can be transmitted without cuts. To achieve this, four additional "front" bits are used, beyond what the algorithm would normally utilize, resulting in a trade-off of reduced resolution. The safety factor can be set when the prevention of peak cutting is desired. If sudden jumps are expected to contain valuable information, setting a safety factor can be considered a sensible option. This is particularly relevant when the device is used to detect seizures, where large differences may indicate seizures rather than artifacts, and cutting the peaks would hinder their detection.
The highest value and hence difference from the preceding data point that can be sent from the device can be calculated with the formula , whereas b is the number of bits and is the reference voltage (3.6V for AD7779) from the ADC. To account for both negative and positive differences, a division by two is necessary. For a 16-bit configuration, this results in a maximum transmitted difference of 0.00005493V (54.93 µV) and for 24-bit is 0.0000002146V (214.6 nV).
2.3.4. Data Formats
Facilitating the utilization of our device by numerous researchers and ensuring seamless data management in accordance with established EEG standards has been a paramount consideration. Consequently, we have incorporated two methods for recording and storing data. The first method involves the straightforward saving of recordings directly onto the smartphone or tablet in "CSV" format. Alternatively, particularly during experimental scenarios, data can be streamed through LSL. This approach enables impeccable synchronization with triggers and other experimental inputs essential for the processing of EEG data. The LSL format adheres to industry standards, specifically the "xdf" format, and allows for convenient further processing using popular EEG tools such as Fieldtrip and EEGLab [
41,
42].
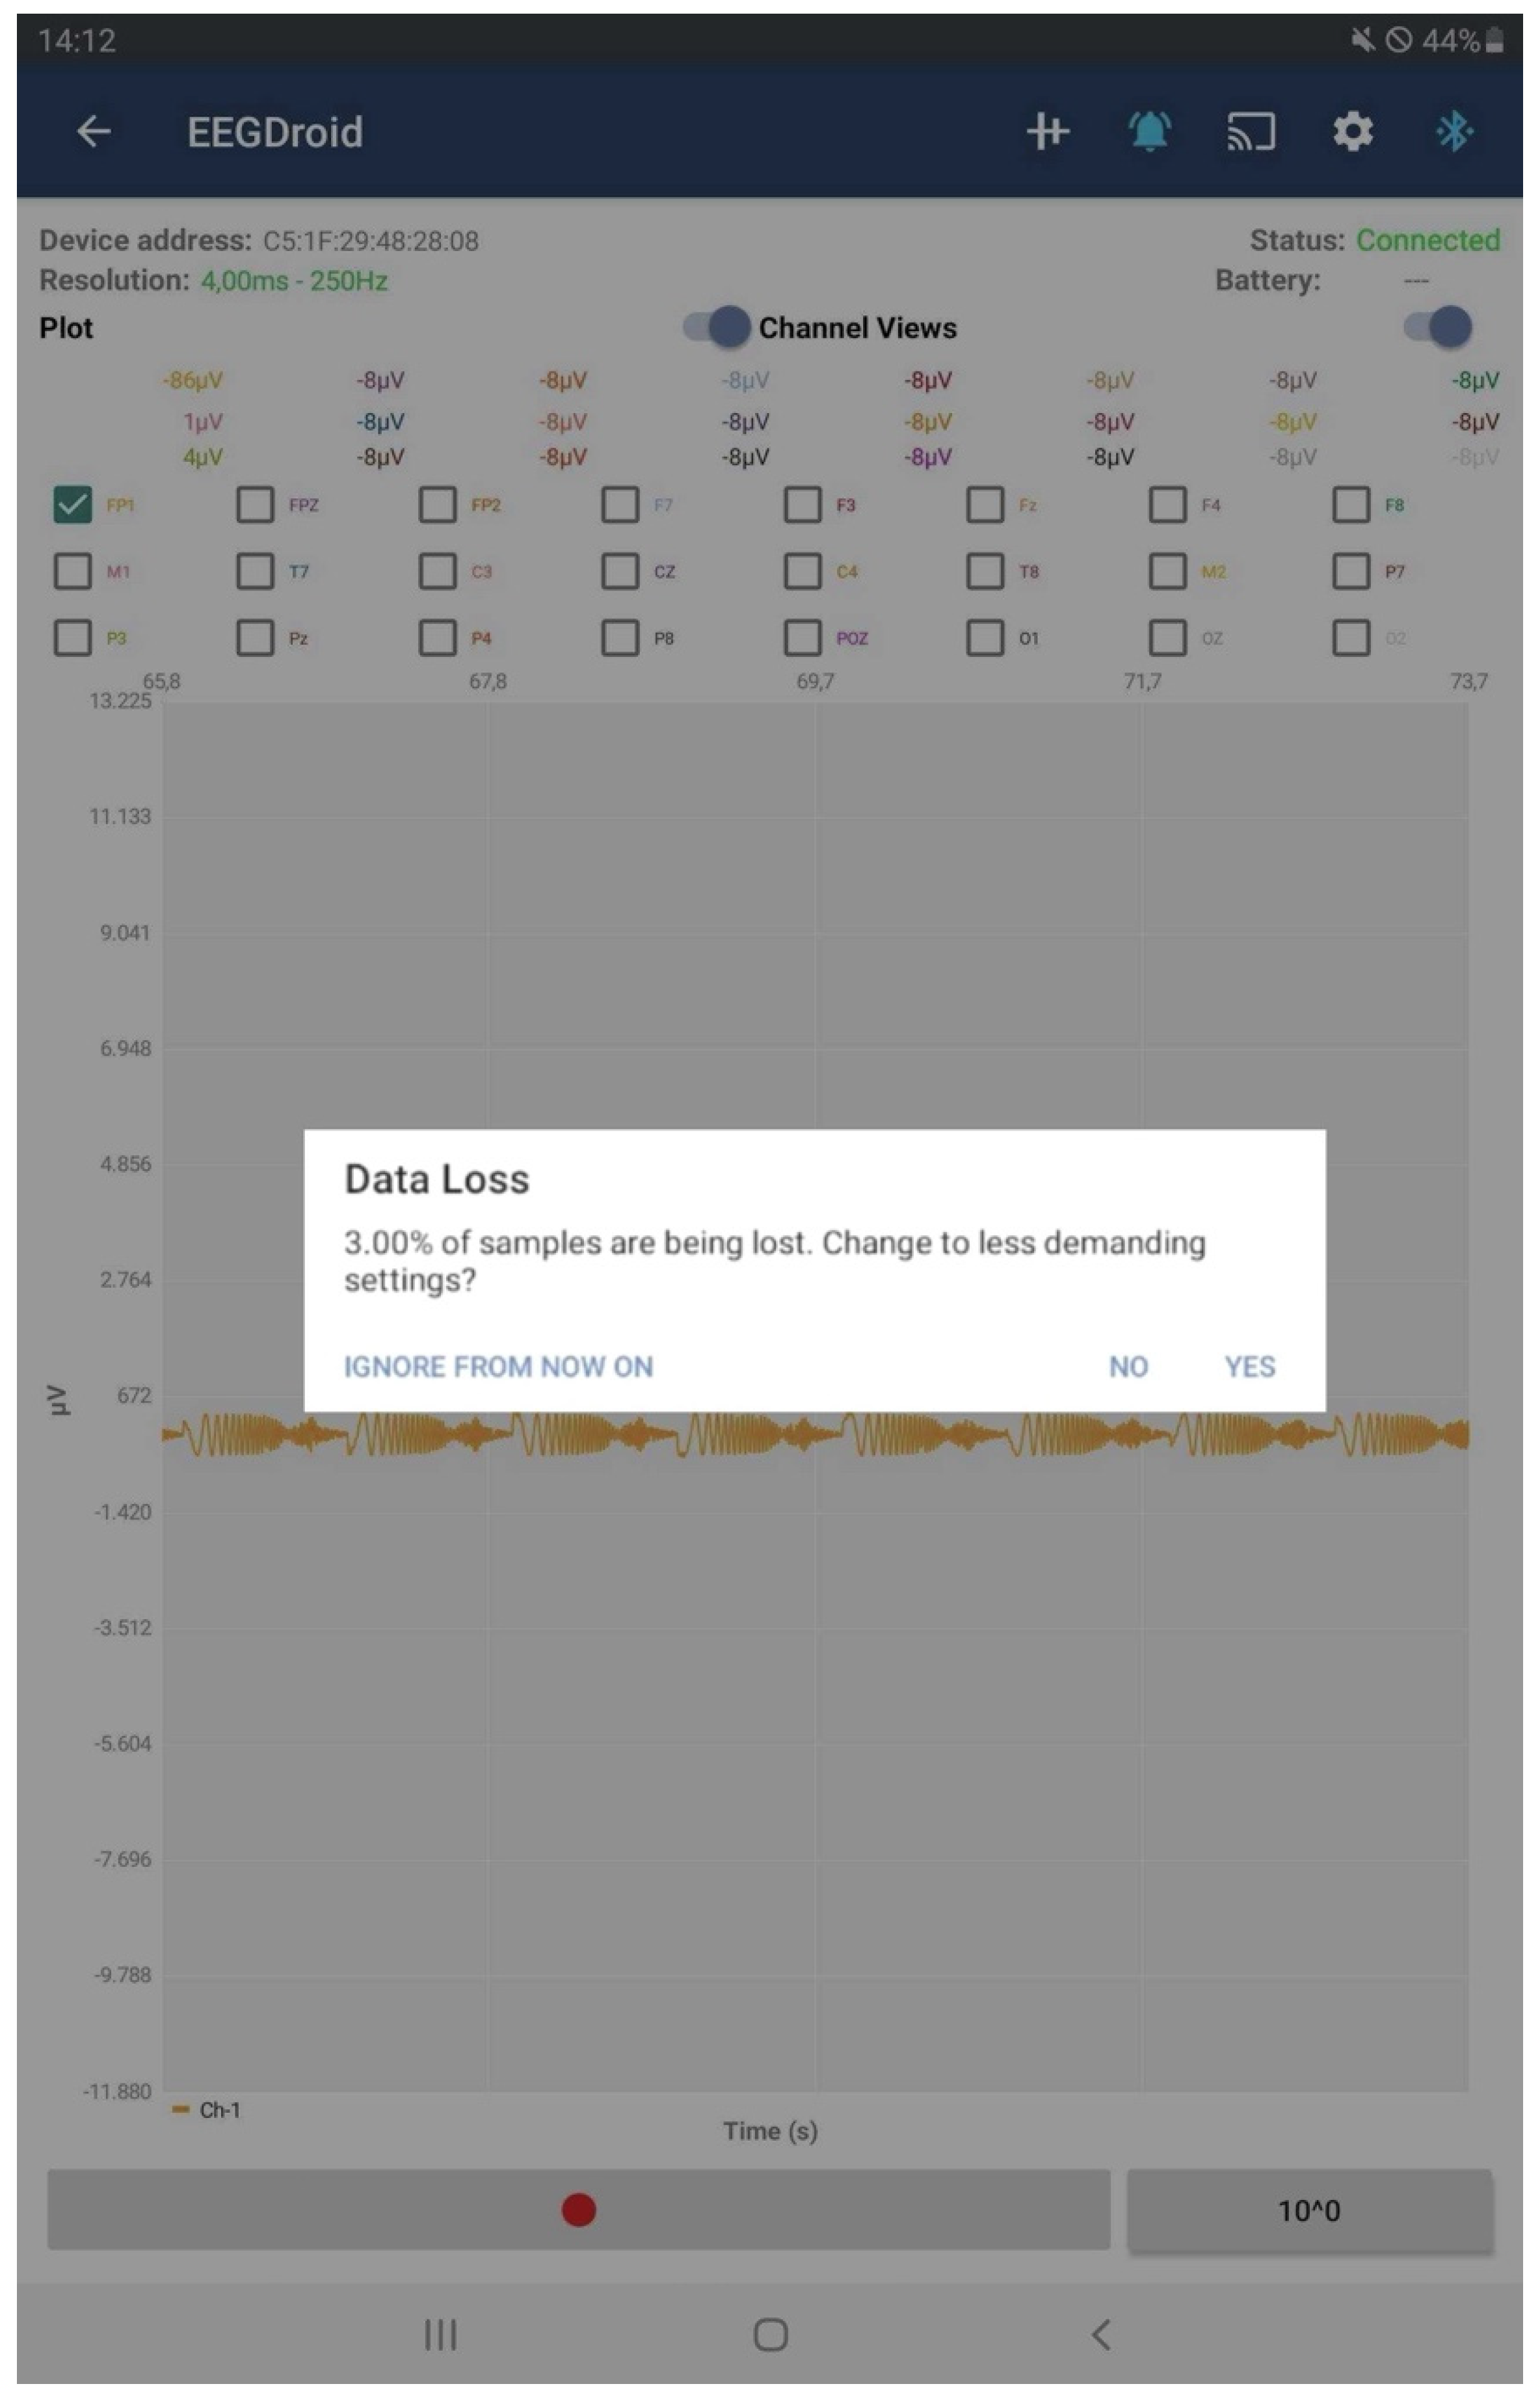
2.4. Package Loss
One of the goals of the DreamMachine system is to enable a broad range of people to use the EEG device. Therefore, the device should not only work with powerful end devices with high CPU capabilities and the latest Bluetooth technology but also yield satisfactory results with older devices. However, if sub-optimal settings are selected, data packages can be lost due to a full Bluetooth buffer or an overloaded CPU of the receiving device. As discussed before, the decoding algorithm does not perform optimally if packages are lost since a correlation between subsequent recordings is assumed. This effect is exacerbated if the packages are not evenly sampled and are lost in a set. Therefore, preventing package loss is preferred over maintaining a lower sampling rate, even if the absolute number of transmitted packages might be smaller. To maintain optimal performance, the app actively monitors the occurrence of data package loss and, when necessary, provides recommendations for switching to alternative settings, as depicted in
Figure 4.
3. Design Files Summary
Design Files Summary
| Design file name |
File type |
Open-source license |
Location of the file |
| PCB design |
.brd, .sch, .pdf
|
GNU General Public License v3.0 |
https://github.com/neuroinfo-os/dream-machine-eeg/tree/main/Board%20Design |
| Firmware code |
Source code |
GNU General Public License v3.0 |
https://github.com/paria-samimi/Traumschreiber/tree/master/Traumschreiber_BLE_Code |
| App Source code |
Source code |
GNU General Public License v3.0 |
https://github.com/mvidaldp/pylsl-keyboard-trigger/tree/0fafb58d2fed61b4e99d7929e7fb66c1639cb003
https://github.com/denizmgun/EEG-Droid/tree/d72ffb9ea78de1f27fe0690aa12f09323f0b82c2 |
The PCB design includes schematic files for constructing the hardware. The firmware code operates the device’s core functionalities, and the app source code handles data processing and configuration.
4. Bill of Materials Summary
5. Build Instructions
The DreamMachine build process involves three primary steps:
PCB Design and Assembly: The printed circuit board (PCB) is designed and assembled with key components, including three analog-to-digital converters (ADC) and a BLE transmitter. These components enable the DreamMachine to digitize EEG signals and transmit data wirelessly to the Android application, EEGDroid.
Firmware Programming: The firmware is flashed onto the microcontroller to enable communication with the EEGDroid application. This step involves programming the device to process and transmit EEG data effectively.
EEGDroid Application Installation: The EEGDroid application is installed on an Android device. This app is designed to record and store EEG signals, allowing users to pair the DreamMachine hardware system with the Android device via Bluetooth.
Once the system setup is complete, an appropriate electrode for recording brain activity must be selected and attached to the DreamMachine hardware system, depending on the experimental requirements.
A detailed PCB design, firmware code scripts, and the EEGDroid application are provided in the project's repositories (
GitHub). Comprehensive build instructions for both the hardware and firmware are further explained in our previous article [
16].
6. Operation Instructions
The general procedure for using the devices is illustrated in
Figure 5. Proper operation requires careful attention to the configuration setup, ensuring the device is used correctly and the selected configuration is suitable for the designed experiment.
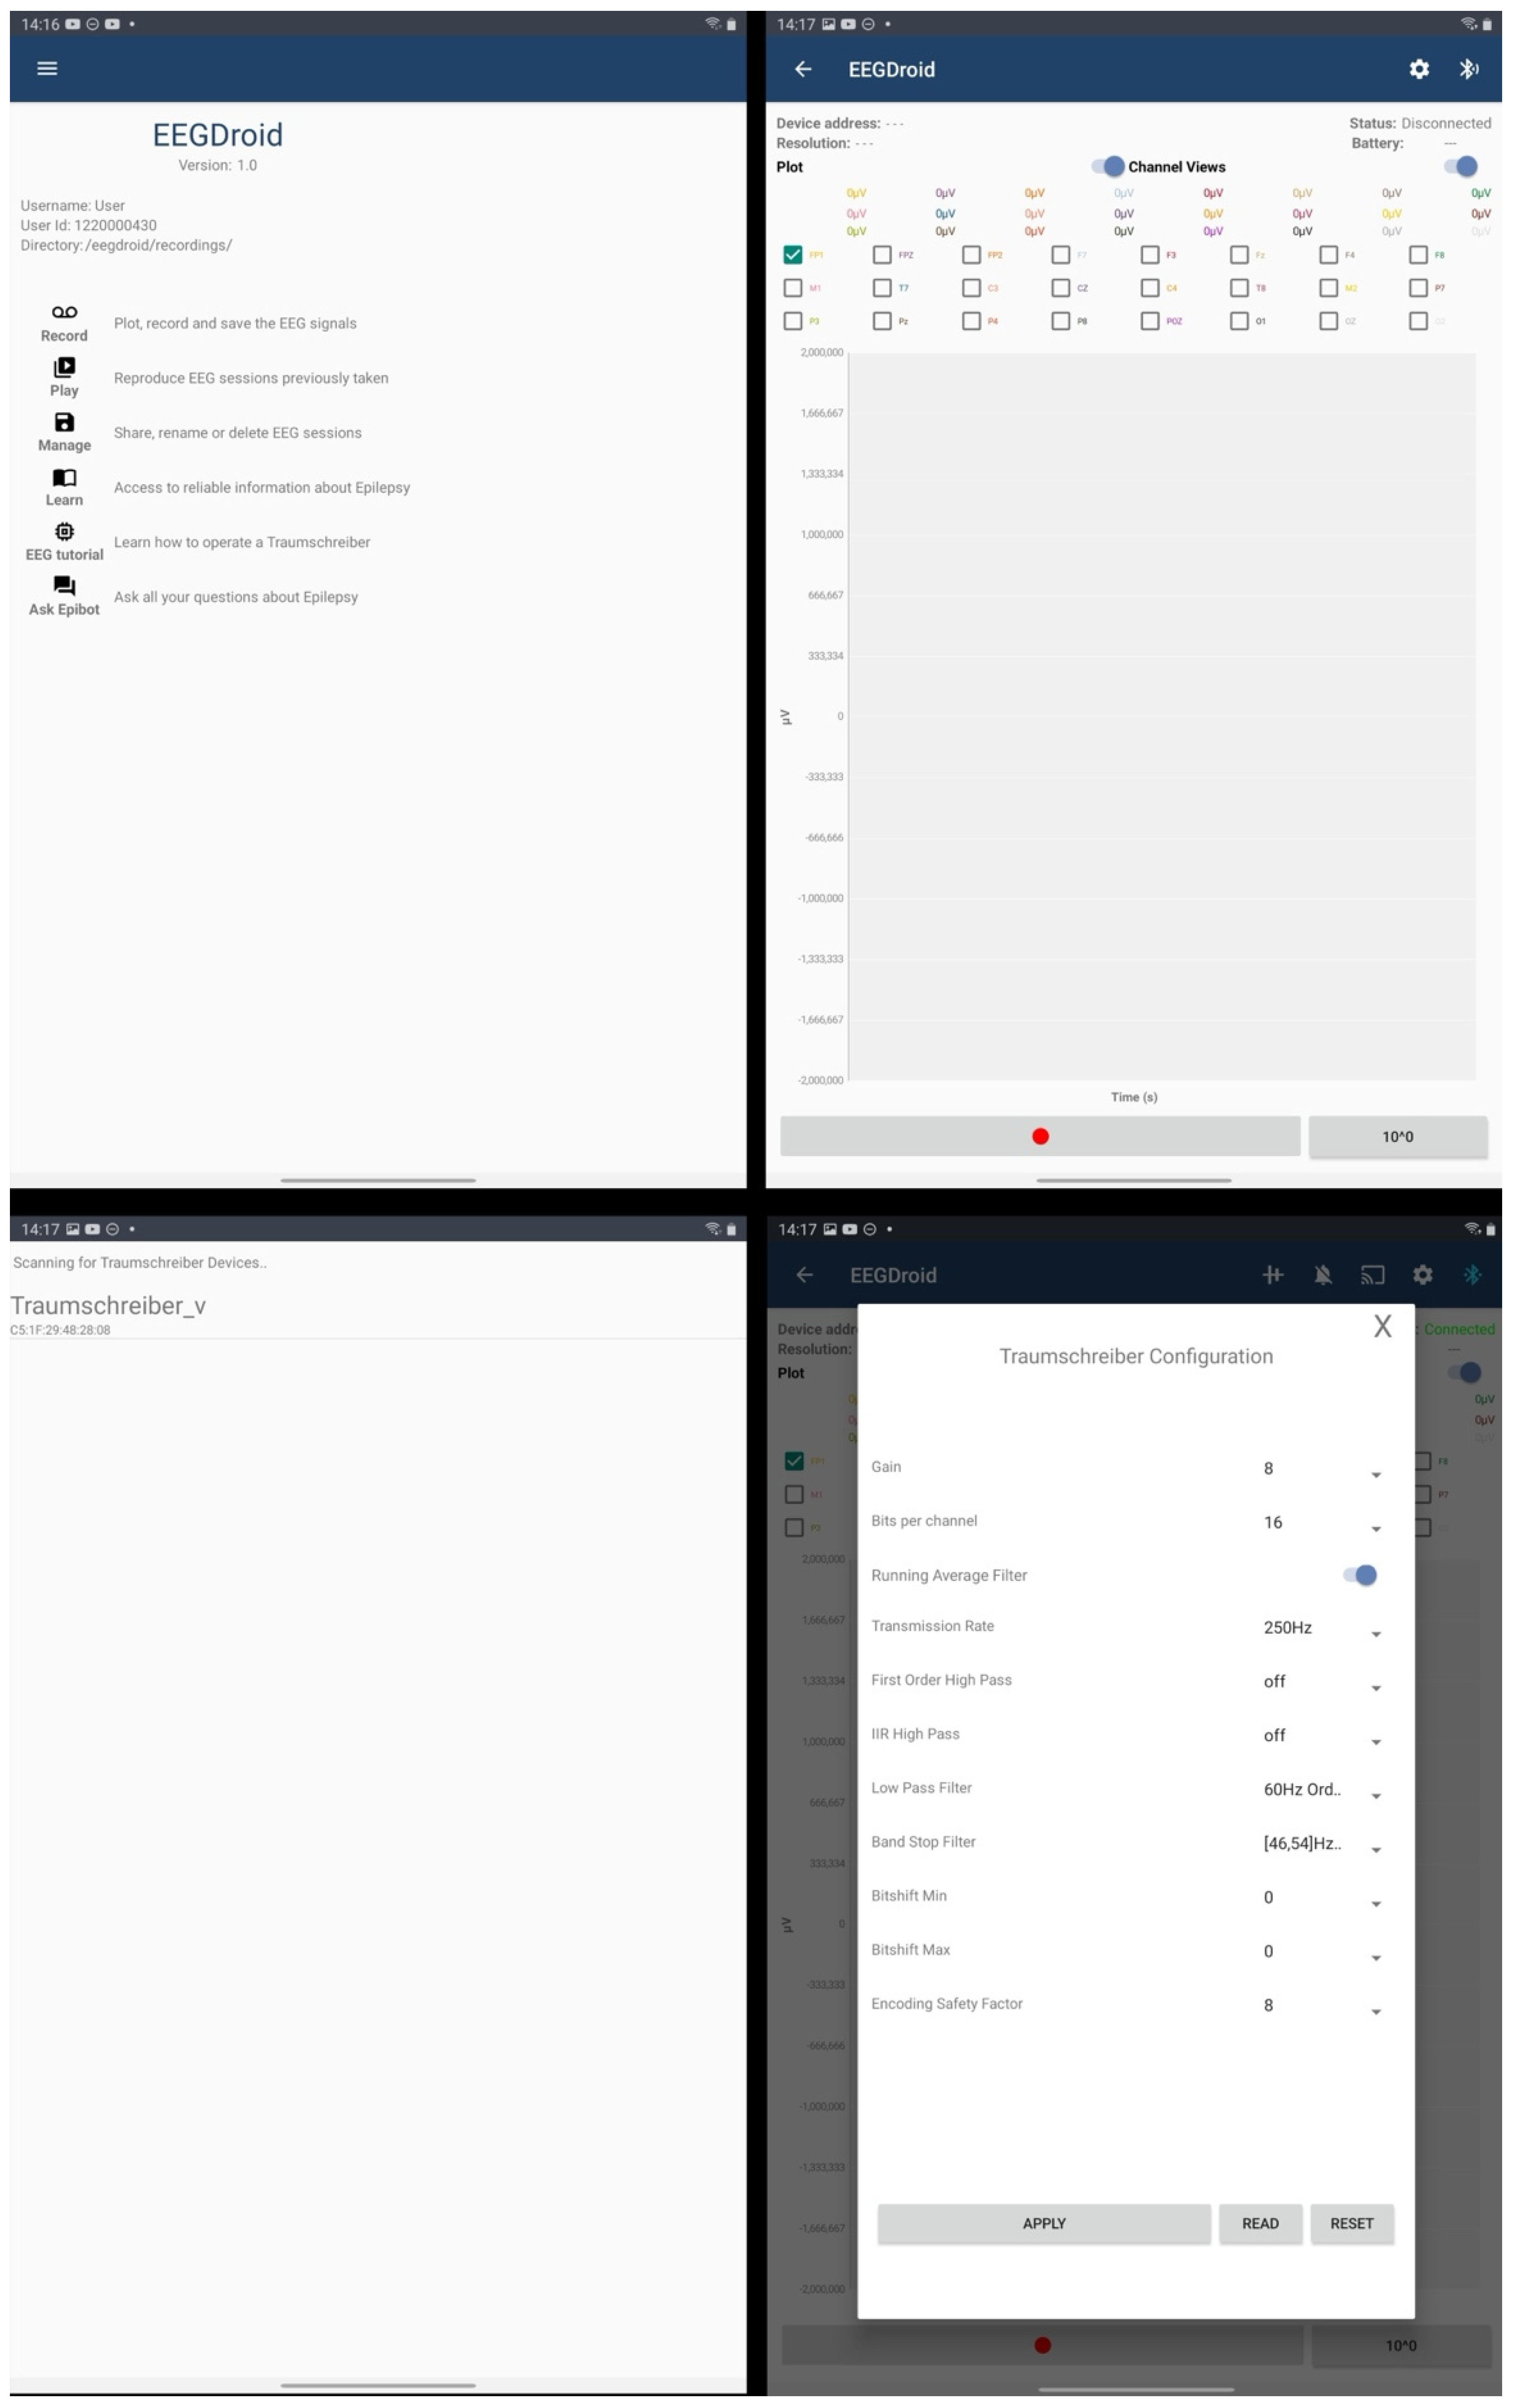
In
Figure 6, the prototype of the EEGDroid application is presented. The prototype Android application is designed to record EEG signals on Android devices. The process of using, connecting, and configuring the application is demonstrated through figures. The first menu of the EEGDroid application is accessible at the top left corner, where the "Record" button can be selected to initiate the recording process. Upon selecting "Record," the display menu is shown. To connect the DreamMachine hardware to the application, the Bluetooth symbol on the top right must be selected. When the DreamMachine hardware system is powered on, the name "Traumschreiber_v" appears in the list of detected Bluetooth devices. Once selected, the "Gear" icon, located next to the Bluetooth icon, allows configuration of the application to optimize EEG signal quality. Configuration options are displayed in the accompanying images, with further details explained in subsequent sections.
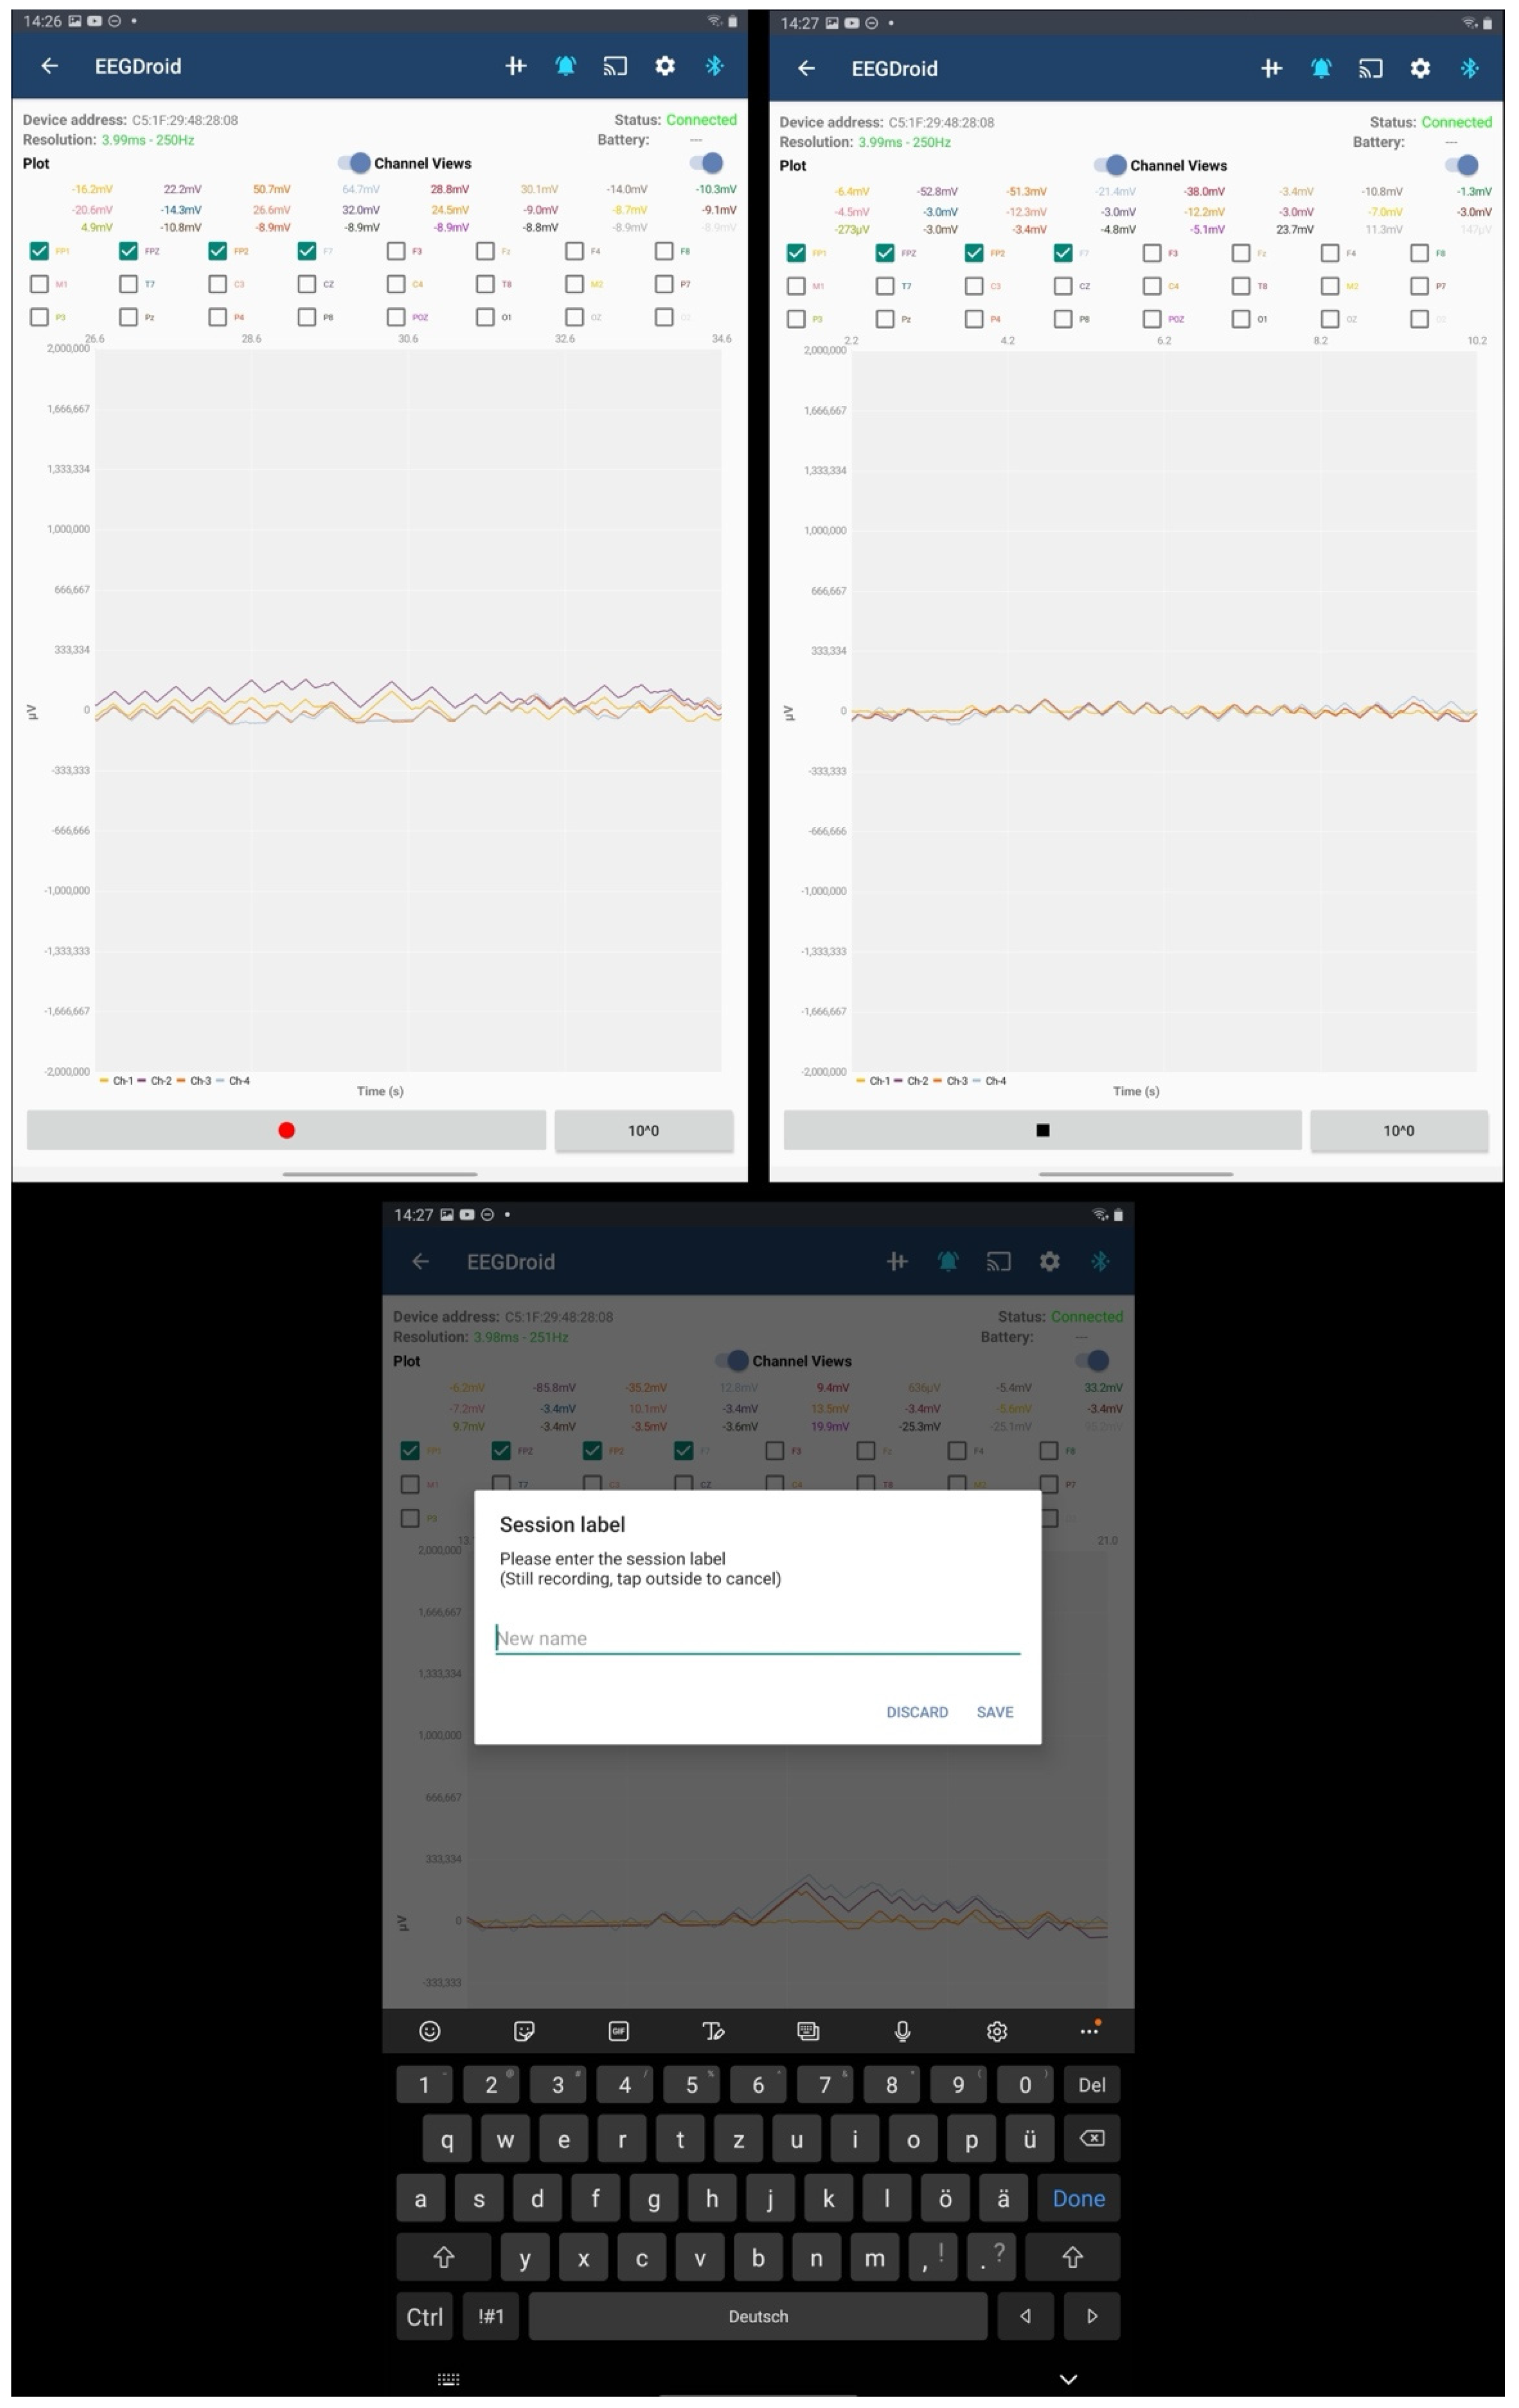
After the appropriate configuration is selected, EEG signals can be visualized on the screen by selecting the "Bell" symbol located at the top right. All 24 channels are displayed in distinct colors, and individual channels can be clicked to assess signal quality and behavior. The recording process begins by selecting the red button at the bottom left. Upon completion of the experiment, recording can be stopped, and recordings can be labeled as needed. The application provides a summary of the recording’s performance and saves the data in "CSV" format for further analysis.
7. Validation and Characterization
With the emergence of numerous low-cost and mobile EEG systems, doubts have arisen regarding the signal quality these systems provide. In 2017, a study was conducted to investigate how the variance across different systems compares to the variance across subjects or repeated sessions [
43]. In this study, the same experiment was applied with four different EEG systems to compare the quality of the recorded EEG signals. Building on this idea, a classic eyes open and eyes closed experiment was selected to investigate and compare the DreamMachine system with a standard EEG system. This experiment was conducted using the DreamMachine system and the conventional asalab™ (ANT Neuro) EEG system in the EEG laboratory at Osnabrueck University. The experiment was specifically chosen due to the extensive resources available detailing the expected results from EEG systems [
44,
45]. Additionally, it is crucial to evaluate the baseline noise levels of the EEG systems. Clear variations in alpha wave activity between the two conditions (eyes open and eyes closed) were used to assess whether the system accurately captures neural signals or is affected by noise.
Ten subjects, five males and five females aged between 18 and 25 years with normal or corrected vision, participated in the study. Before commencing the experiment, participants were not subjected to neurological, chronic, or psychological evaluations. Tthey were requested to disclose any such conditions if applicable. None of the participants reported any disabilities or the aforementioned medical issues to their knowledge. Furthermore, participants were instructed to abstain from consuming beverages containing alcohol or caffeine for at least three hours before the commencement of the experiment. For a more accurate comparison, the same cap (the waveguard™original ANT Neuro EEG) was used, and the experiment was conducted in the same location, with the same subjects, and under the same conditions. The experiment involved participants closing and opening their eyes for two-minute intervals, repeated five times. This resulted in one part of the experiment lasting 20 minutes, and the entire experiment taking 40 minutes for each subject. In this study, the experiment commenced with the eyes closed condition. The used cap, allowed for the continuous recording of signals from 24 electrodes (Fp1, Fpz, Fp2, F7, F3, Fz, F4, F8, M1, T7, C3, Cz, C4, T8, M2, P7, P3, Pz, P4, P8, POz, O1, Oz, O2), which were positioned by the international 10-20 system.
Similar research on DreamMachine and standard EEG devices for a single subject has been previously conducted and documented [
16]. The primary objective of the current study was to ensure the comparability between the DreamMachine and a conventional EEG device across a larger number of subjects, thereby demonstrating the reliability of the DreamMachine in a more extensive sample.
7.1. Methodology
Each subject was seated on a chair at a distance of 90 cm from the monitor, with the experiment receiving approval from the Osnabrueck University Ethics Committee for the Protection of Human Subjects. 24 channels of the waveguard™ original ANT Neuro EEG cap are connected to the subjects, and for all subjects, the left earlobe was used as a reference point, while the right earlobe served as the ground. In the initial phase of the experiment, recordings were made using the Standard EEG system. The cap was affixed and connected to an amplifier system, facilitating signal transmission to a computer placed in the laboratory. Subsequently, the recorded data was processed and stored using the ASALAB analysis software and data acquisition occurred at a sampling rate of 1024 Hz. Once all necessary steps were completed, the impedance of all 24 channels was checked using ASALAB software to ensure it remained below 5kΩ. Upon ensuring all channels were correctly connected, the subject was instructed to look left and right and blink to verify dissimilar behavior in all channels, confirming the proper connection of the reference and ground. Next, the subject was trained on the experiment protocol. The experiment was initiated after confirming that all equipment was properly connected and functioning. The standard EEG system was employed for all subjects first, followed by the DreamMachine device.
In the case of DreamMachine, it was wirelessly linked via Bluetooth to a tablet (Samsung Galaxy Tab S6 Lite, 64GB) running the EEGDroid application, facilitating the recording and storage of the EEG signal. The default recording settings in the EEGDroid application included a notch filter with a frequency range from 46 Hz to 54 Hz (fourth-order filter), a gain level of 8, and a low-pass filter set at 60 Hz (sixth-order filter) for this experiment was used. Additionally, data acquisition was performed at a sampling rate of 250 Hz, utilizing a 16-bit A/D converter. The registration of triggers and data was managed using a laptop equipped with the LSL-recorder application [
46], which was used to record and save the data as an xdf file. Triggers were systematically documented in both phases of the experiment to denote instances of participants closing or opening their eyes. In the eyes open condition, participants were required to direct their gaze toward a fixation cross displayed on the monitor, and in both conditions, they were asked not to move their body posture.
7.2. Data Extraction
The recorded data were obtained in two different formats due to the use of different devices. The standard EEG system produced data in the .cnt format, while the DreamMachine generated data in the .xdf format. Initially, the data were imported into MATLAB using Fieldtrip in two separate files, after which the same script was used for their analysis. First, a visual comparison was made between the plots generated by the DreamMachine system and those produced by the standard EEG system in time domain. This involved scrutinizing the plots from the DreamMachine system to identify prominent features under two different conditions (eyes open, eyes closed), such as eye movements, eye blinks, Alpha waves, and Delta waves. Subsequently, the same analysis was conducted on the standard EEG system’s plots. Following this, the data were denoised and analyzed in both time and frequency domains.
During the recording process, the EEGDroid application filtered out the alternating current (AC) to clean the data and eliminate noise, so this step was omitted from subsequent preprocessing steps. In the next stage, after excluding noisy channels, the signal was segmented into 40 sections, resulting in 30-second epochs for both eyes open and eyes closed conditions. Following this, the power spectrum for each epoch was calculated using the Fast Fourier Transform (FFT). Then, the same statistical analysis was applied to both devices. To address the multiple comparison problem (MCP) associated with multidimensional data, a rigorous cluster-based permutation test was employed. This test aimed to determine the significance probability (p-value) for multiple time points by computing clusters, rather than conducting individual statistical tests for each time point. Essentially, clusters were computed based on t-values, then their permutation was determined, and the maximum values were used to calculate the significance probability. For both datasets, the t-value was derived from the independent samples t-test, with an alpha threshold set at 0.01 for both conditions. Additionally, the Monte Carlo method was used to calculate the significance probability of the clusters. The results of the cluster-based permutation test were then presented in a topographical plot, illustrating power spectra for both conditions. The script for analyzing the experiment is available on a GitHub repository.
In summary, an analysis was conducted on each plot generated by the DreamMachine system to identify the presence of the Alpha rhythm in the occipital head channels during the eyes closed condition, as well as detecting eye blinking, eye movements, and Delta rhythm during the eyes open condition. This process was then repeated for the plots generated by the clinical EEG system. It was subsequently determined whether the two systems exhibited analogous components in each corresponding epoch or if specific features were unique to either of the recordings.
7.3. Data Analysis
The preprocessing steps were completed after the data were divided into different conditions. The data were then plotted in the time domain to compare the signals from both EEG systems. The signals from all subjects, recorded with both systems, were plotted and visually inspected. The behavior of the signals in both eyes open and eyes closed conditions was similar across both systems.
For data to be properly analyzed in the frequency domain, all cleaned data sets were analyzed using the multi-taper method with Fast Fourier Transform (FFT) to compute power spectra. To achieve better results, the data were examined in various frequency bands to gain insights into brain activity behavior under different conditions. The selected frequency bands in this project are Delta (1–4 Hz), Theta (4–8 Hz), Alpha (8–12 Hz), and Beta (12–30 Hz). Finally, a cluster-based permutation test was employed to compare the power spectral density between the ‘open’ and ‘closed’ conditions across the 24 channels [
16]. As a result, seven channels, namely FP1, FP2, FPz, POz, O1, O2, and OZ, are selected as the most effective channels. The results of the analysis are presented in the next section.
7.4. Results
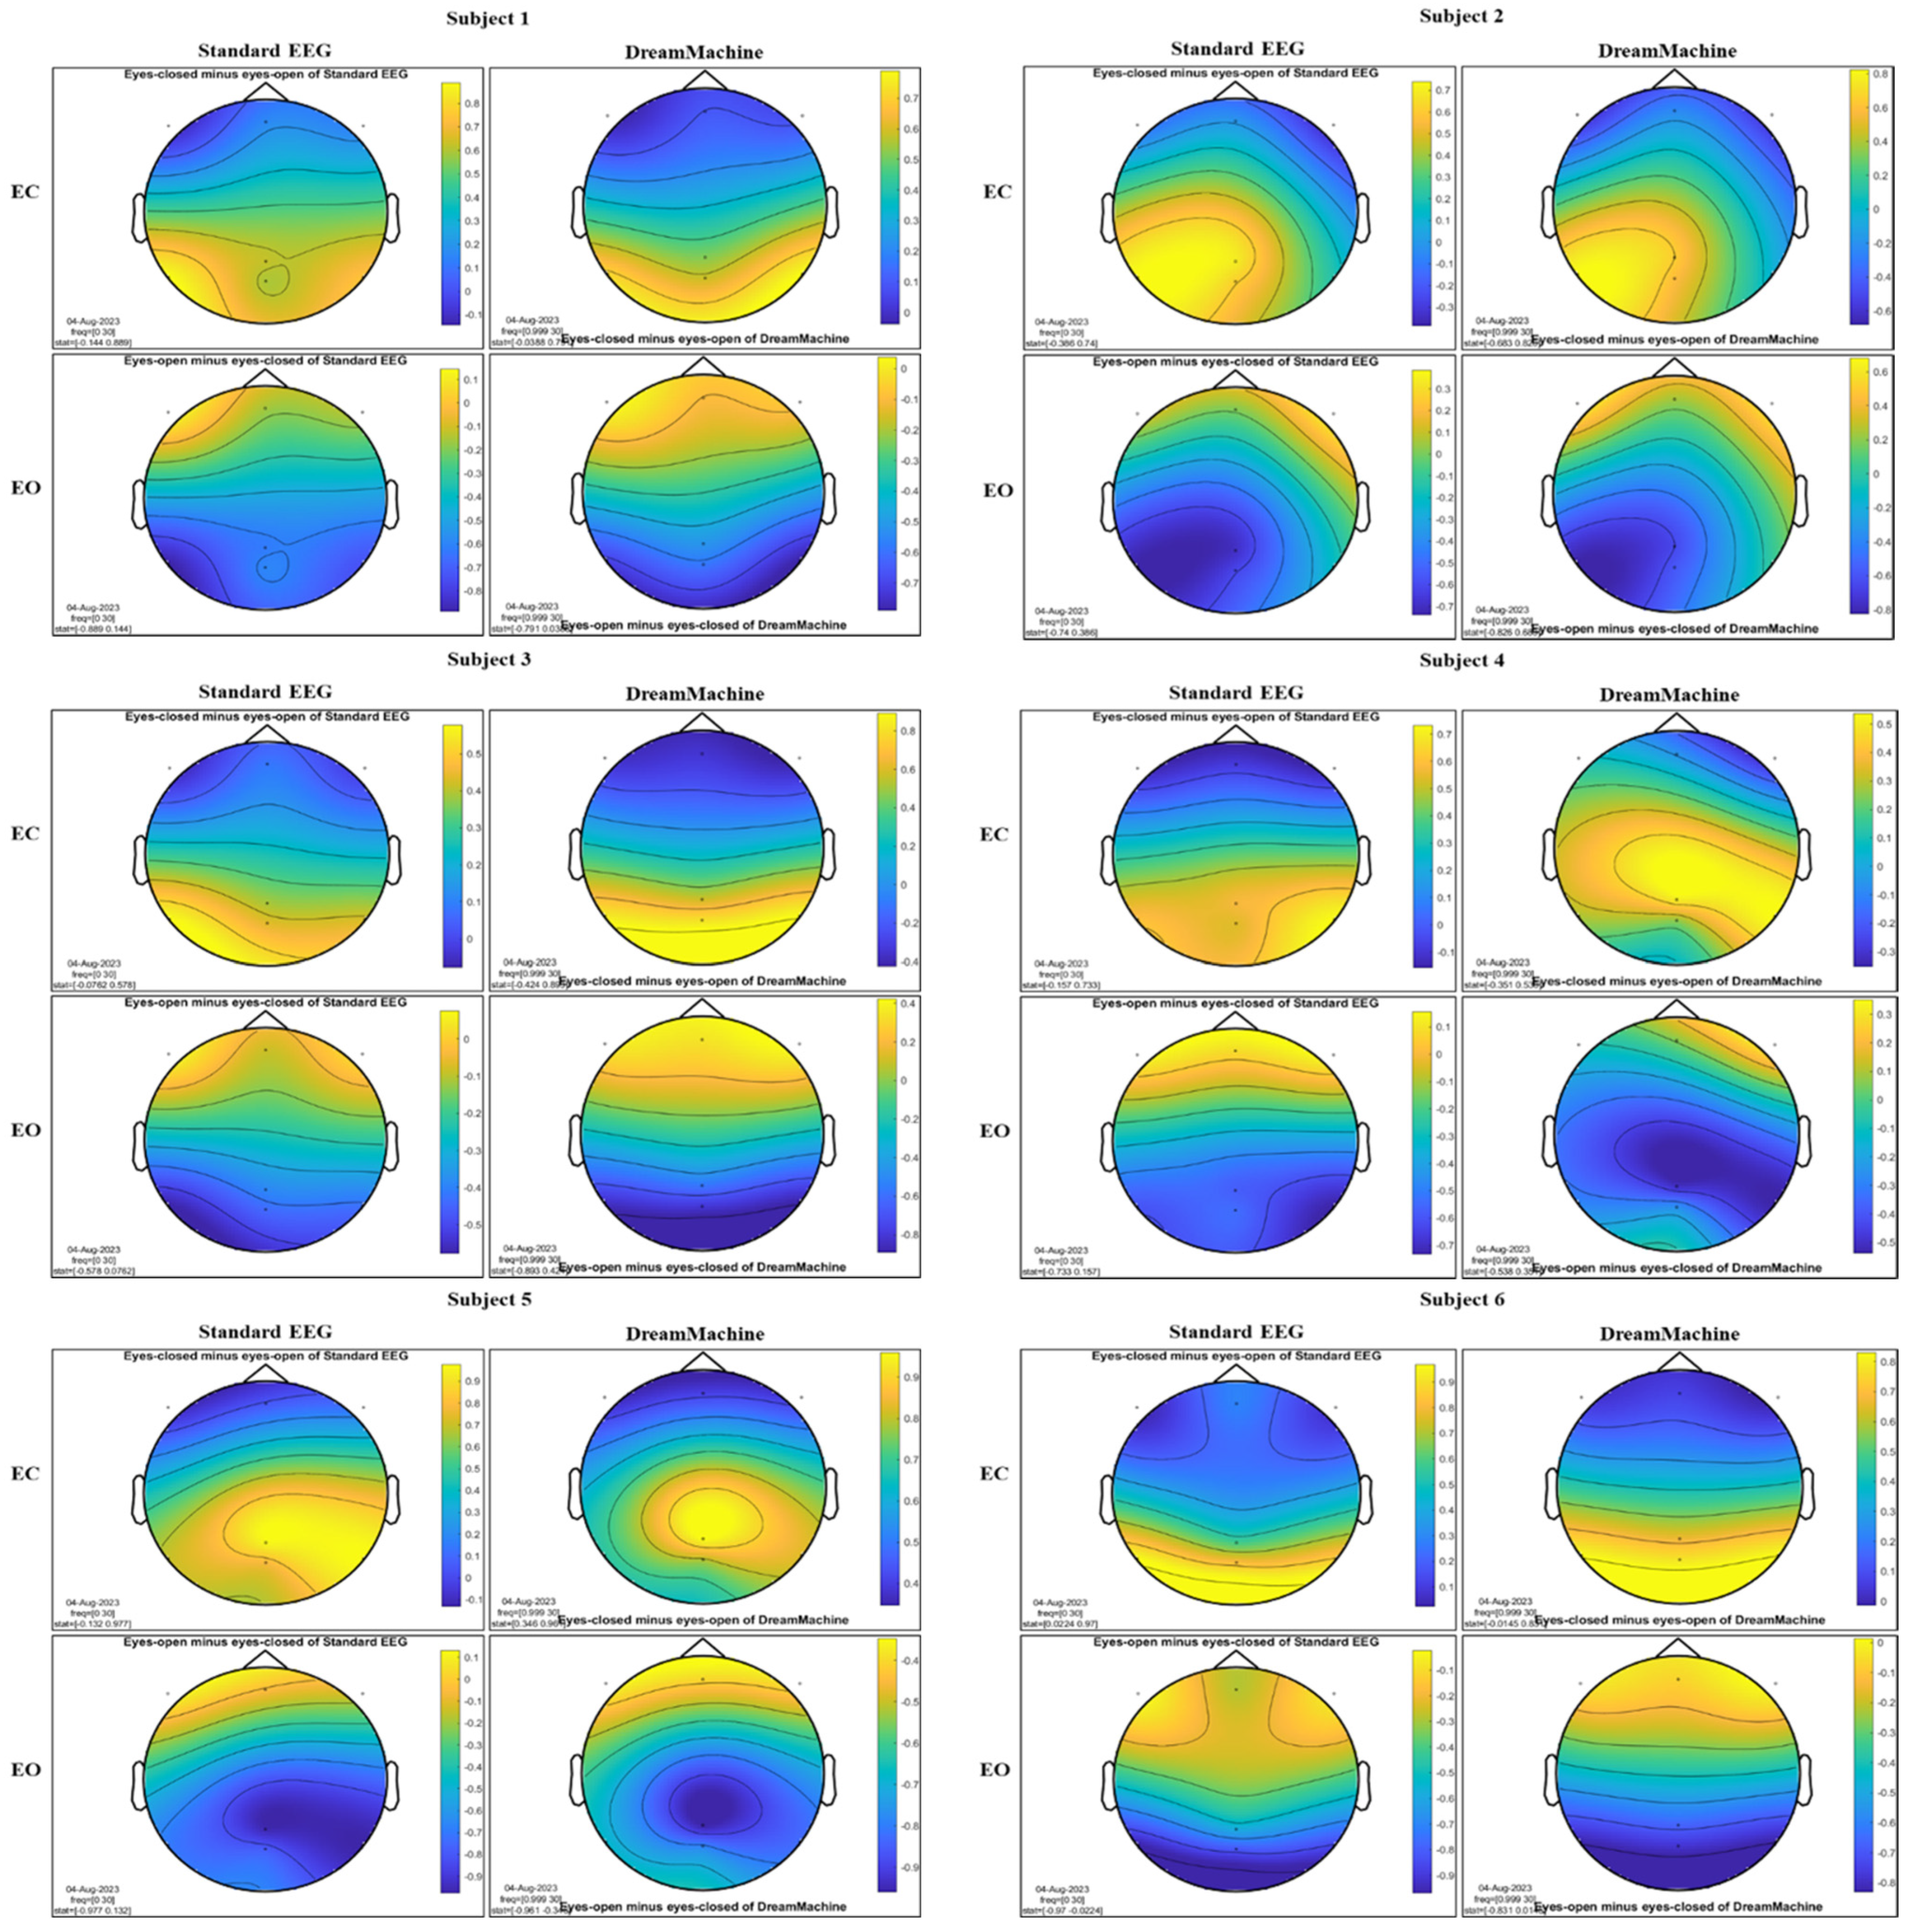
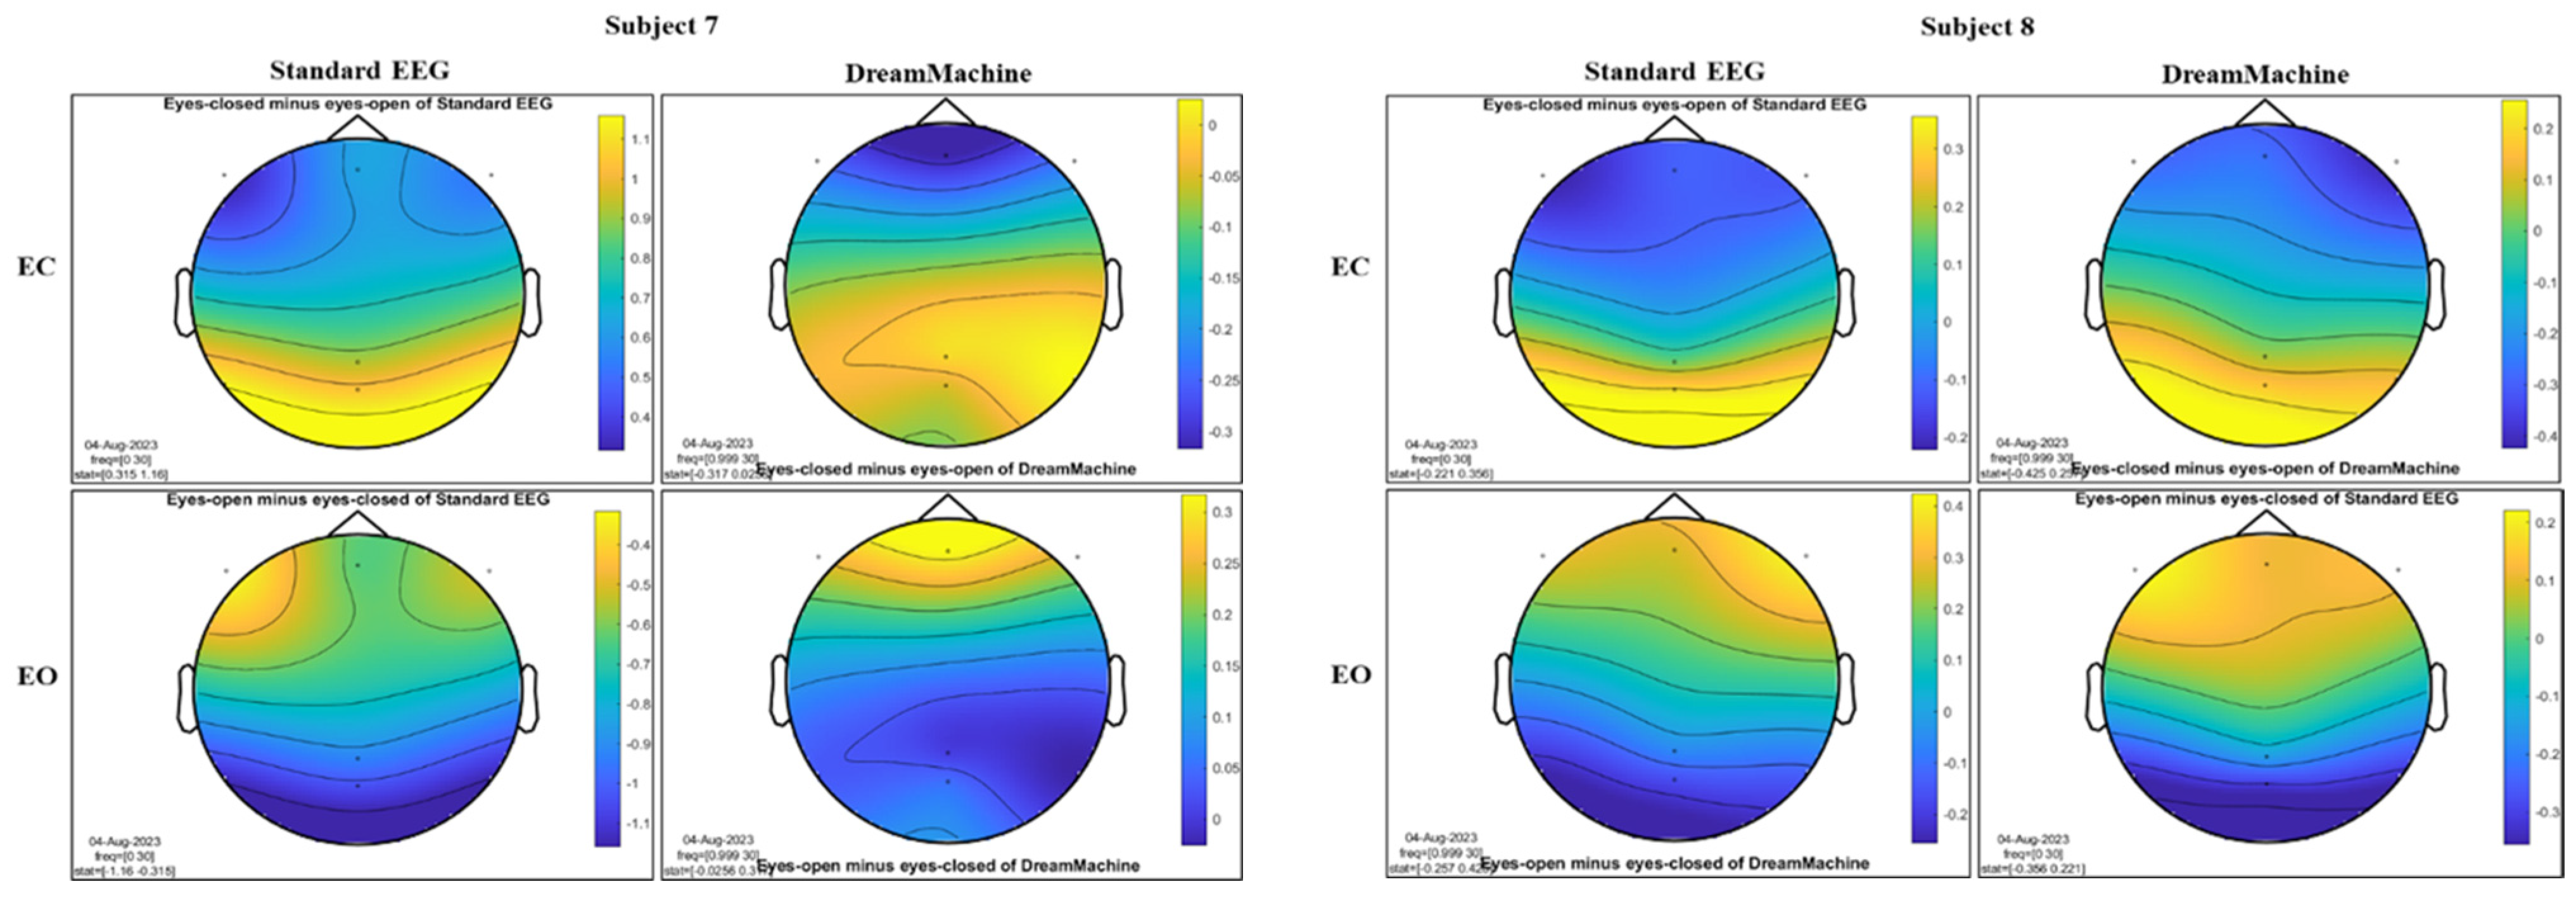
The results of the cluster-based permutation test for eight participants are shown in
Figure 7. It is evident that similar brain activity signals were captured by both EEG devices. In the eyes closed condition, a significant increase in activity (around 10 Hz) was observed in the occipital region for all participants. This finding highlights the prevalence of alpha activity during resting states. Additionally, increased activity in the frontal region was evident in the eyes open condition, corresponding to heightened visual activity during eyelid movement and information processing across the entire cortex. Despite some noise being present in the signals from both devices, their consistency across conditions is apparent.
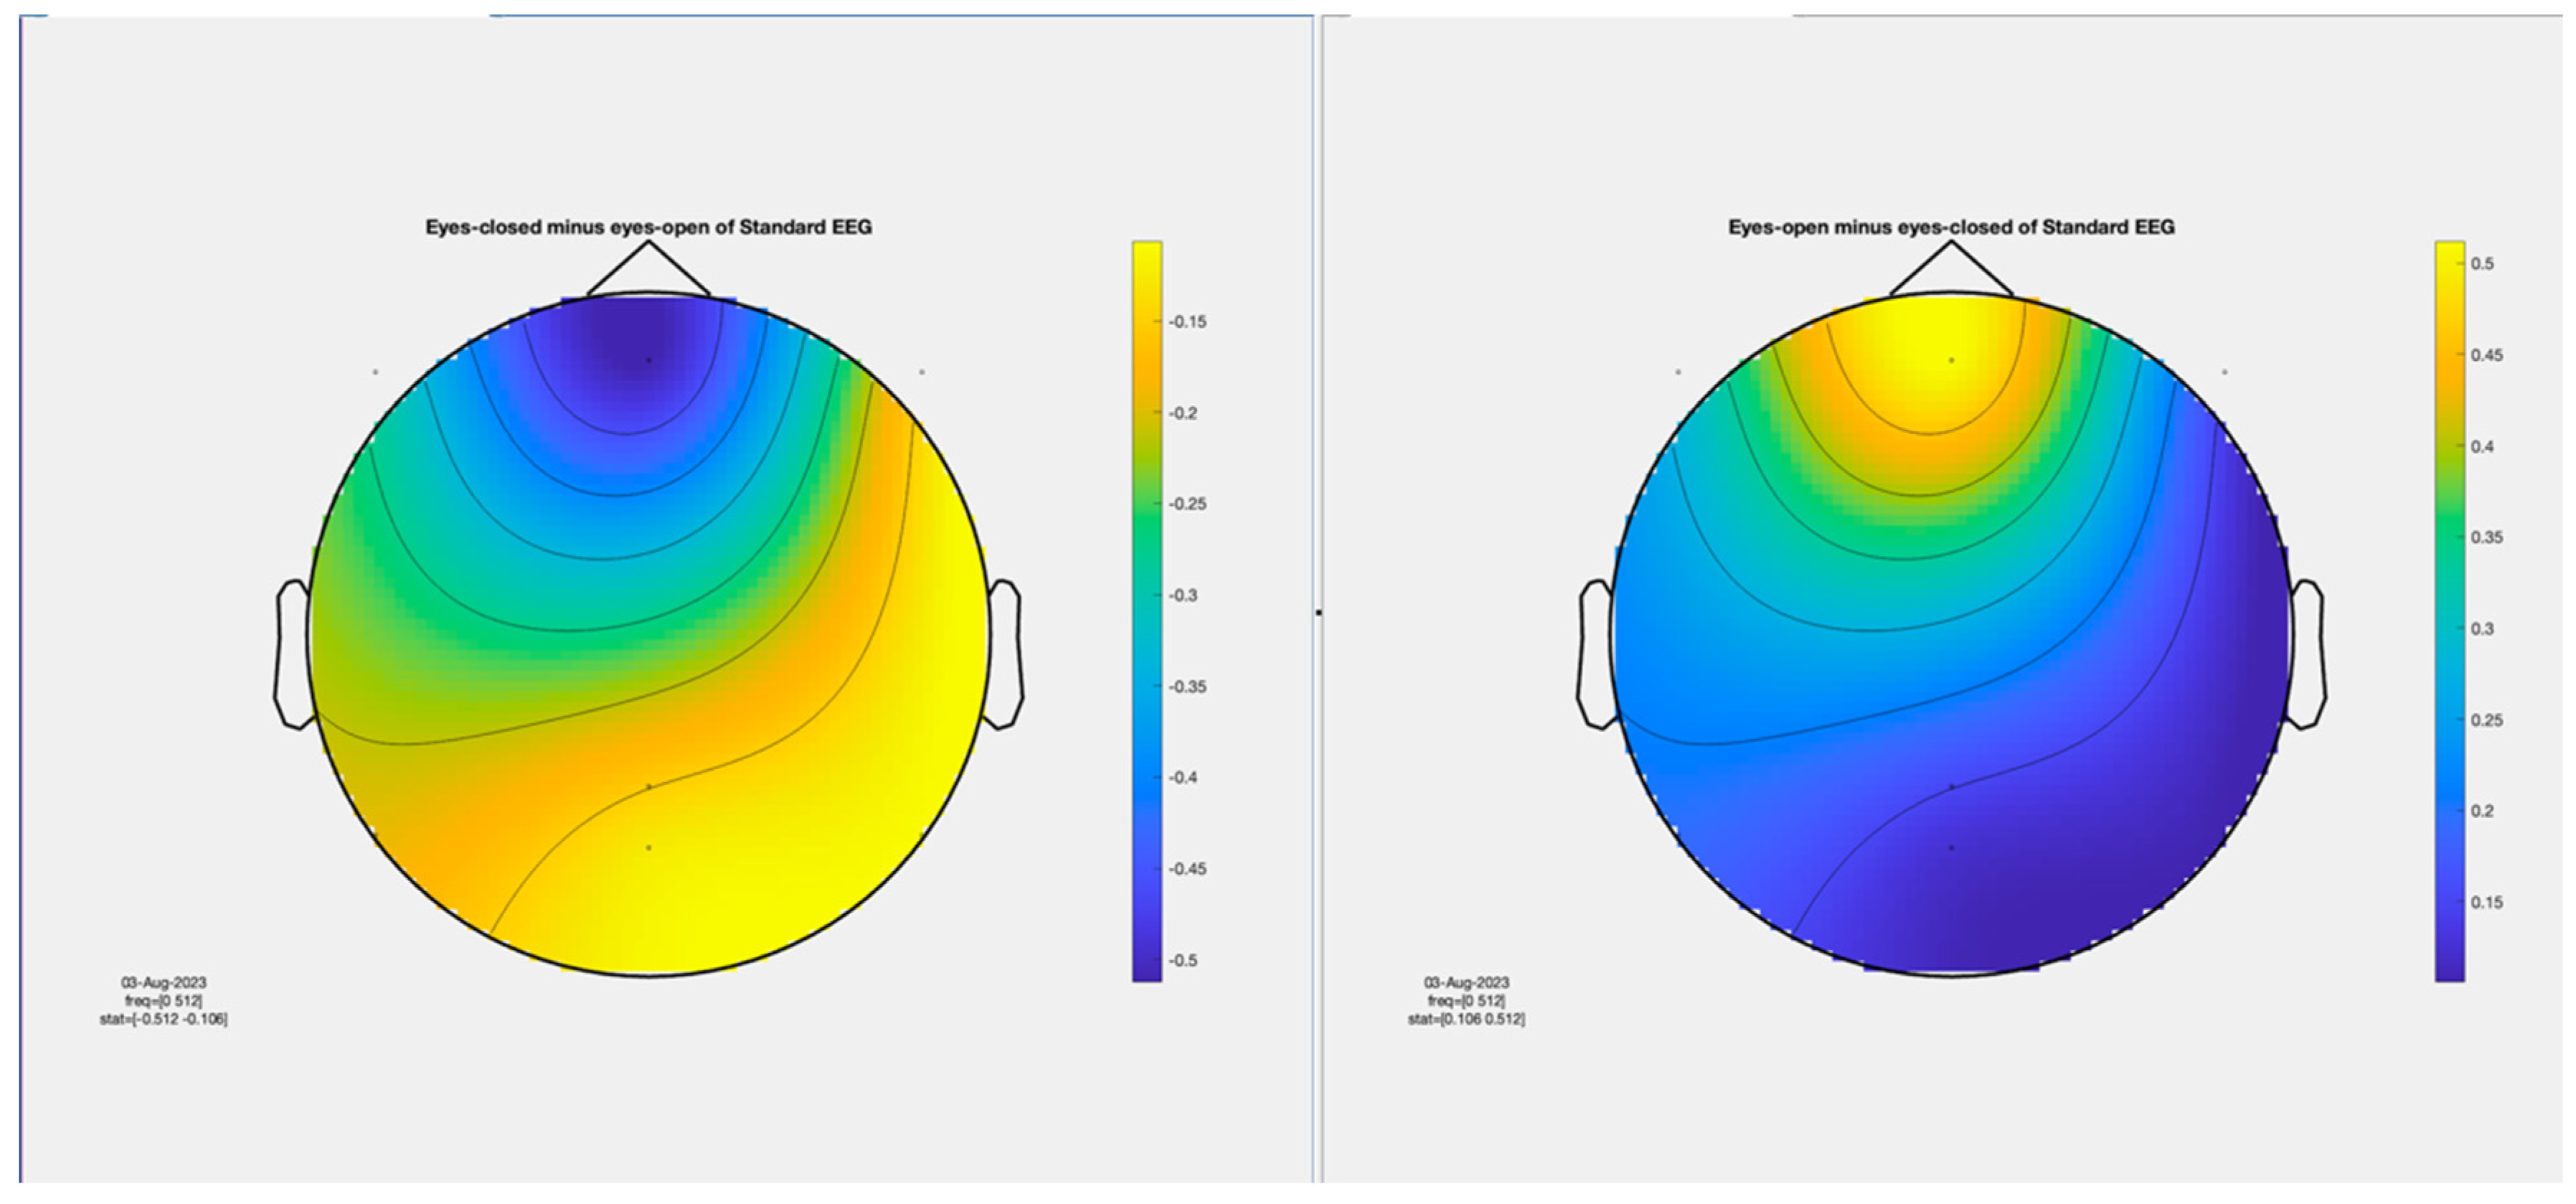
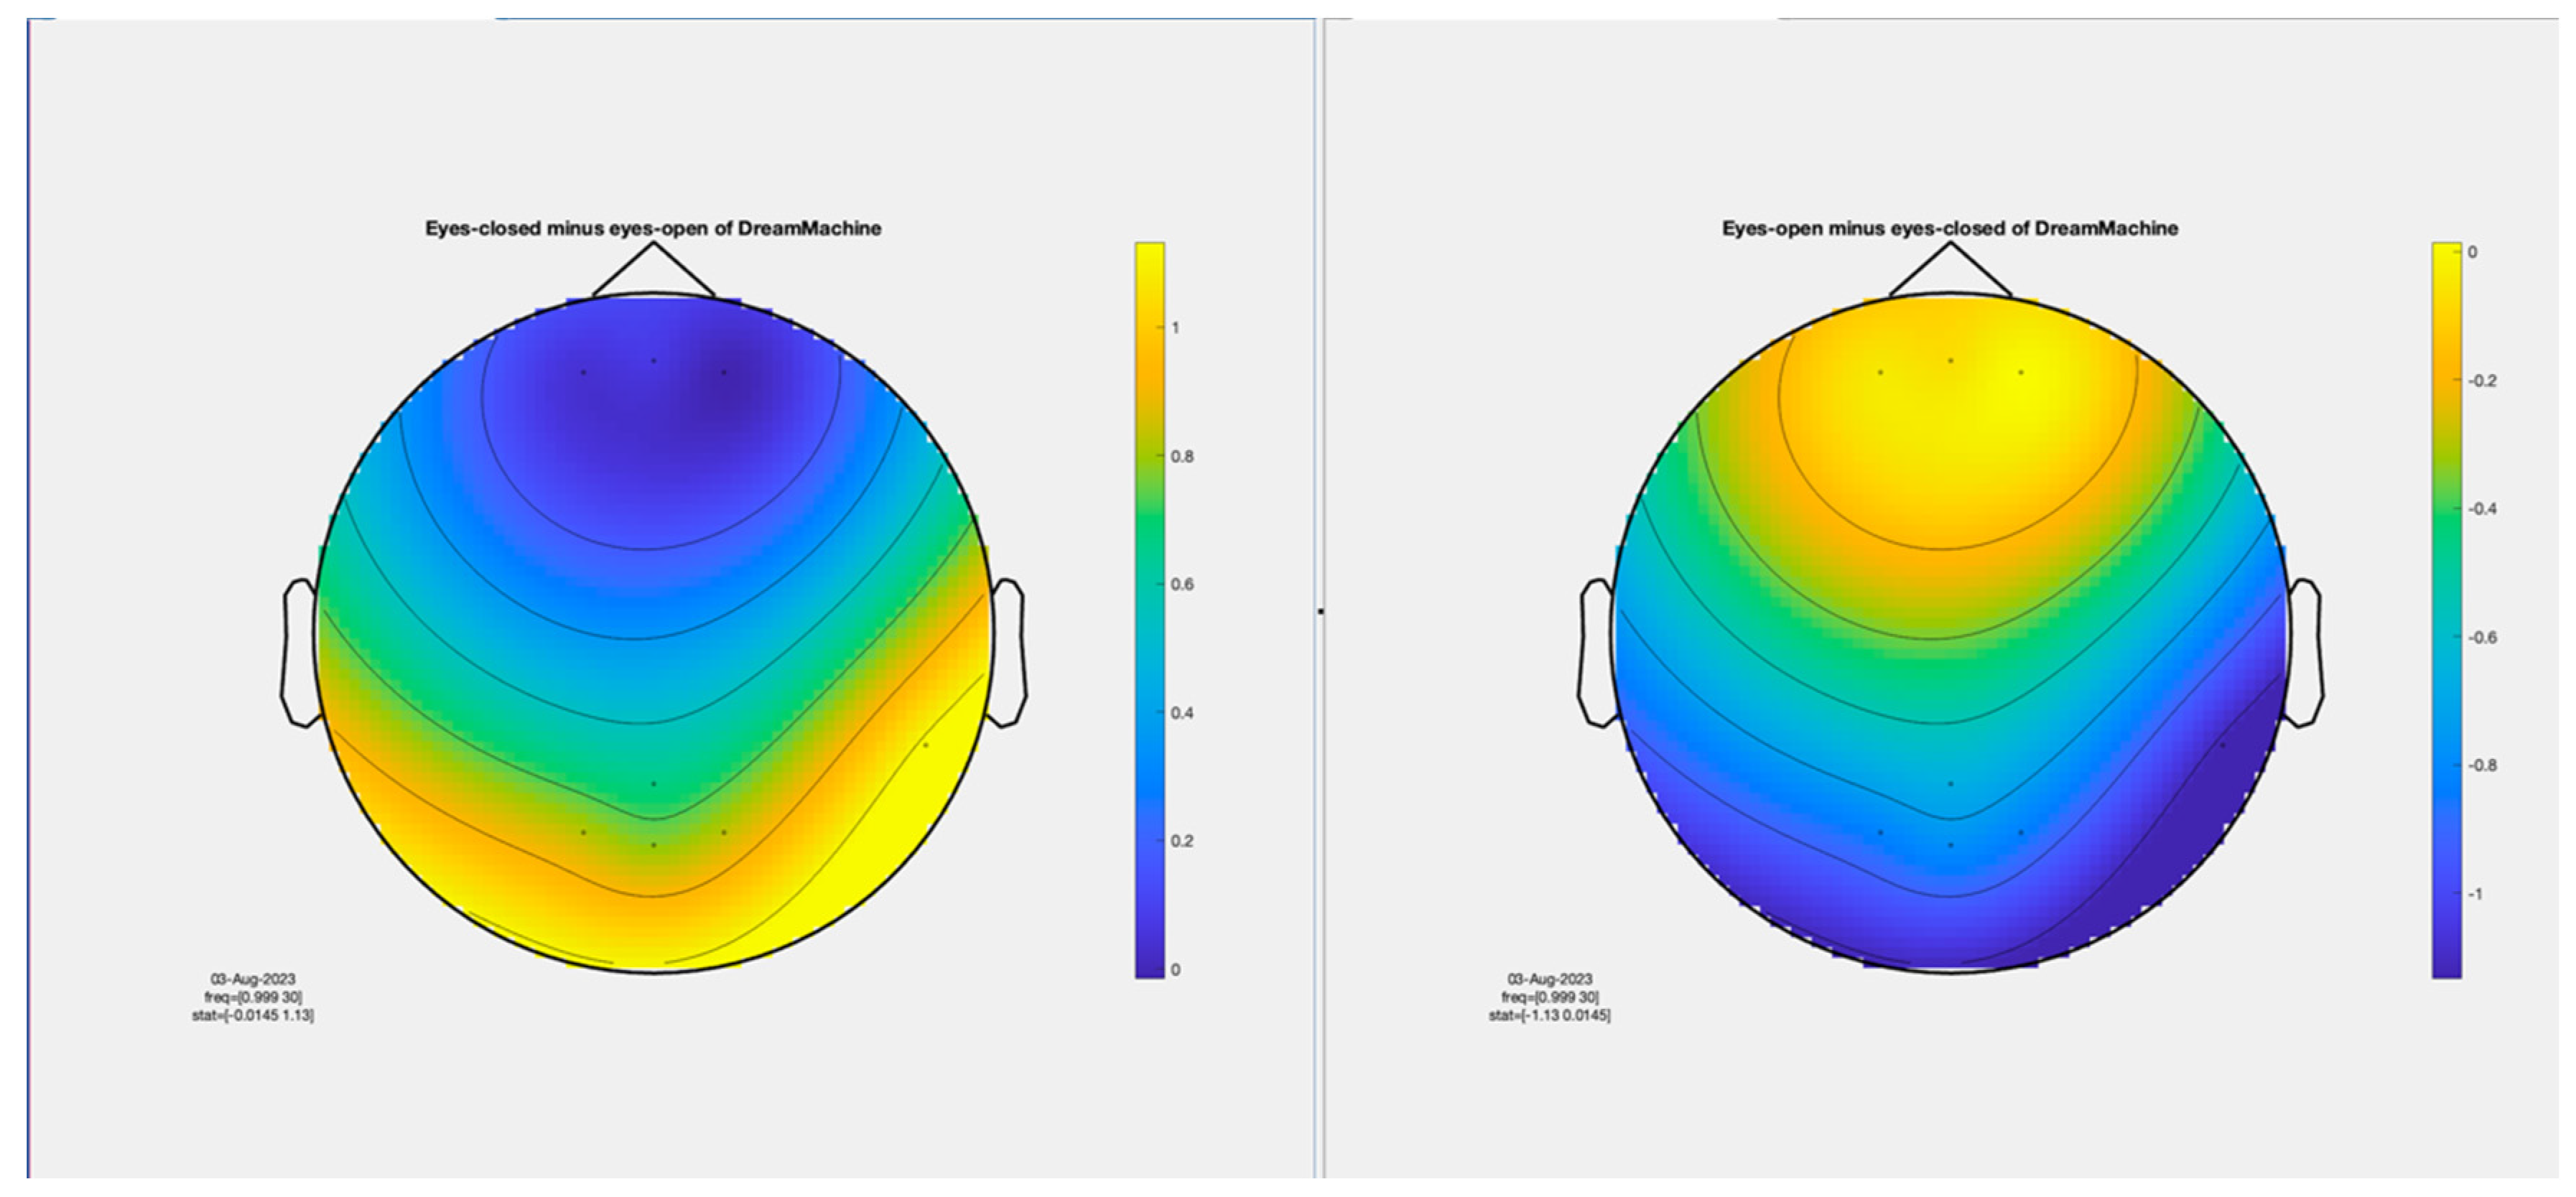
Figure 8 showcases topographical plots that visually represent statistically significant differences in power spectral density between the "eyes closed minus eyes open" and "eyes open minus eyes closed" conditions in both EEG systems. Distinct color-coded regions highlight clusters of electrodes with significant differences, with more intense colors signifying lower p-values (p < 0.01). These findings indicate that higher power spectral density is predominantly observed in the occipital region. It is also highlighted that the same behavior is observed in both EEG systems, which confirms that the results of both EEG systems are roughly the same.
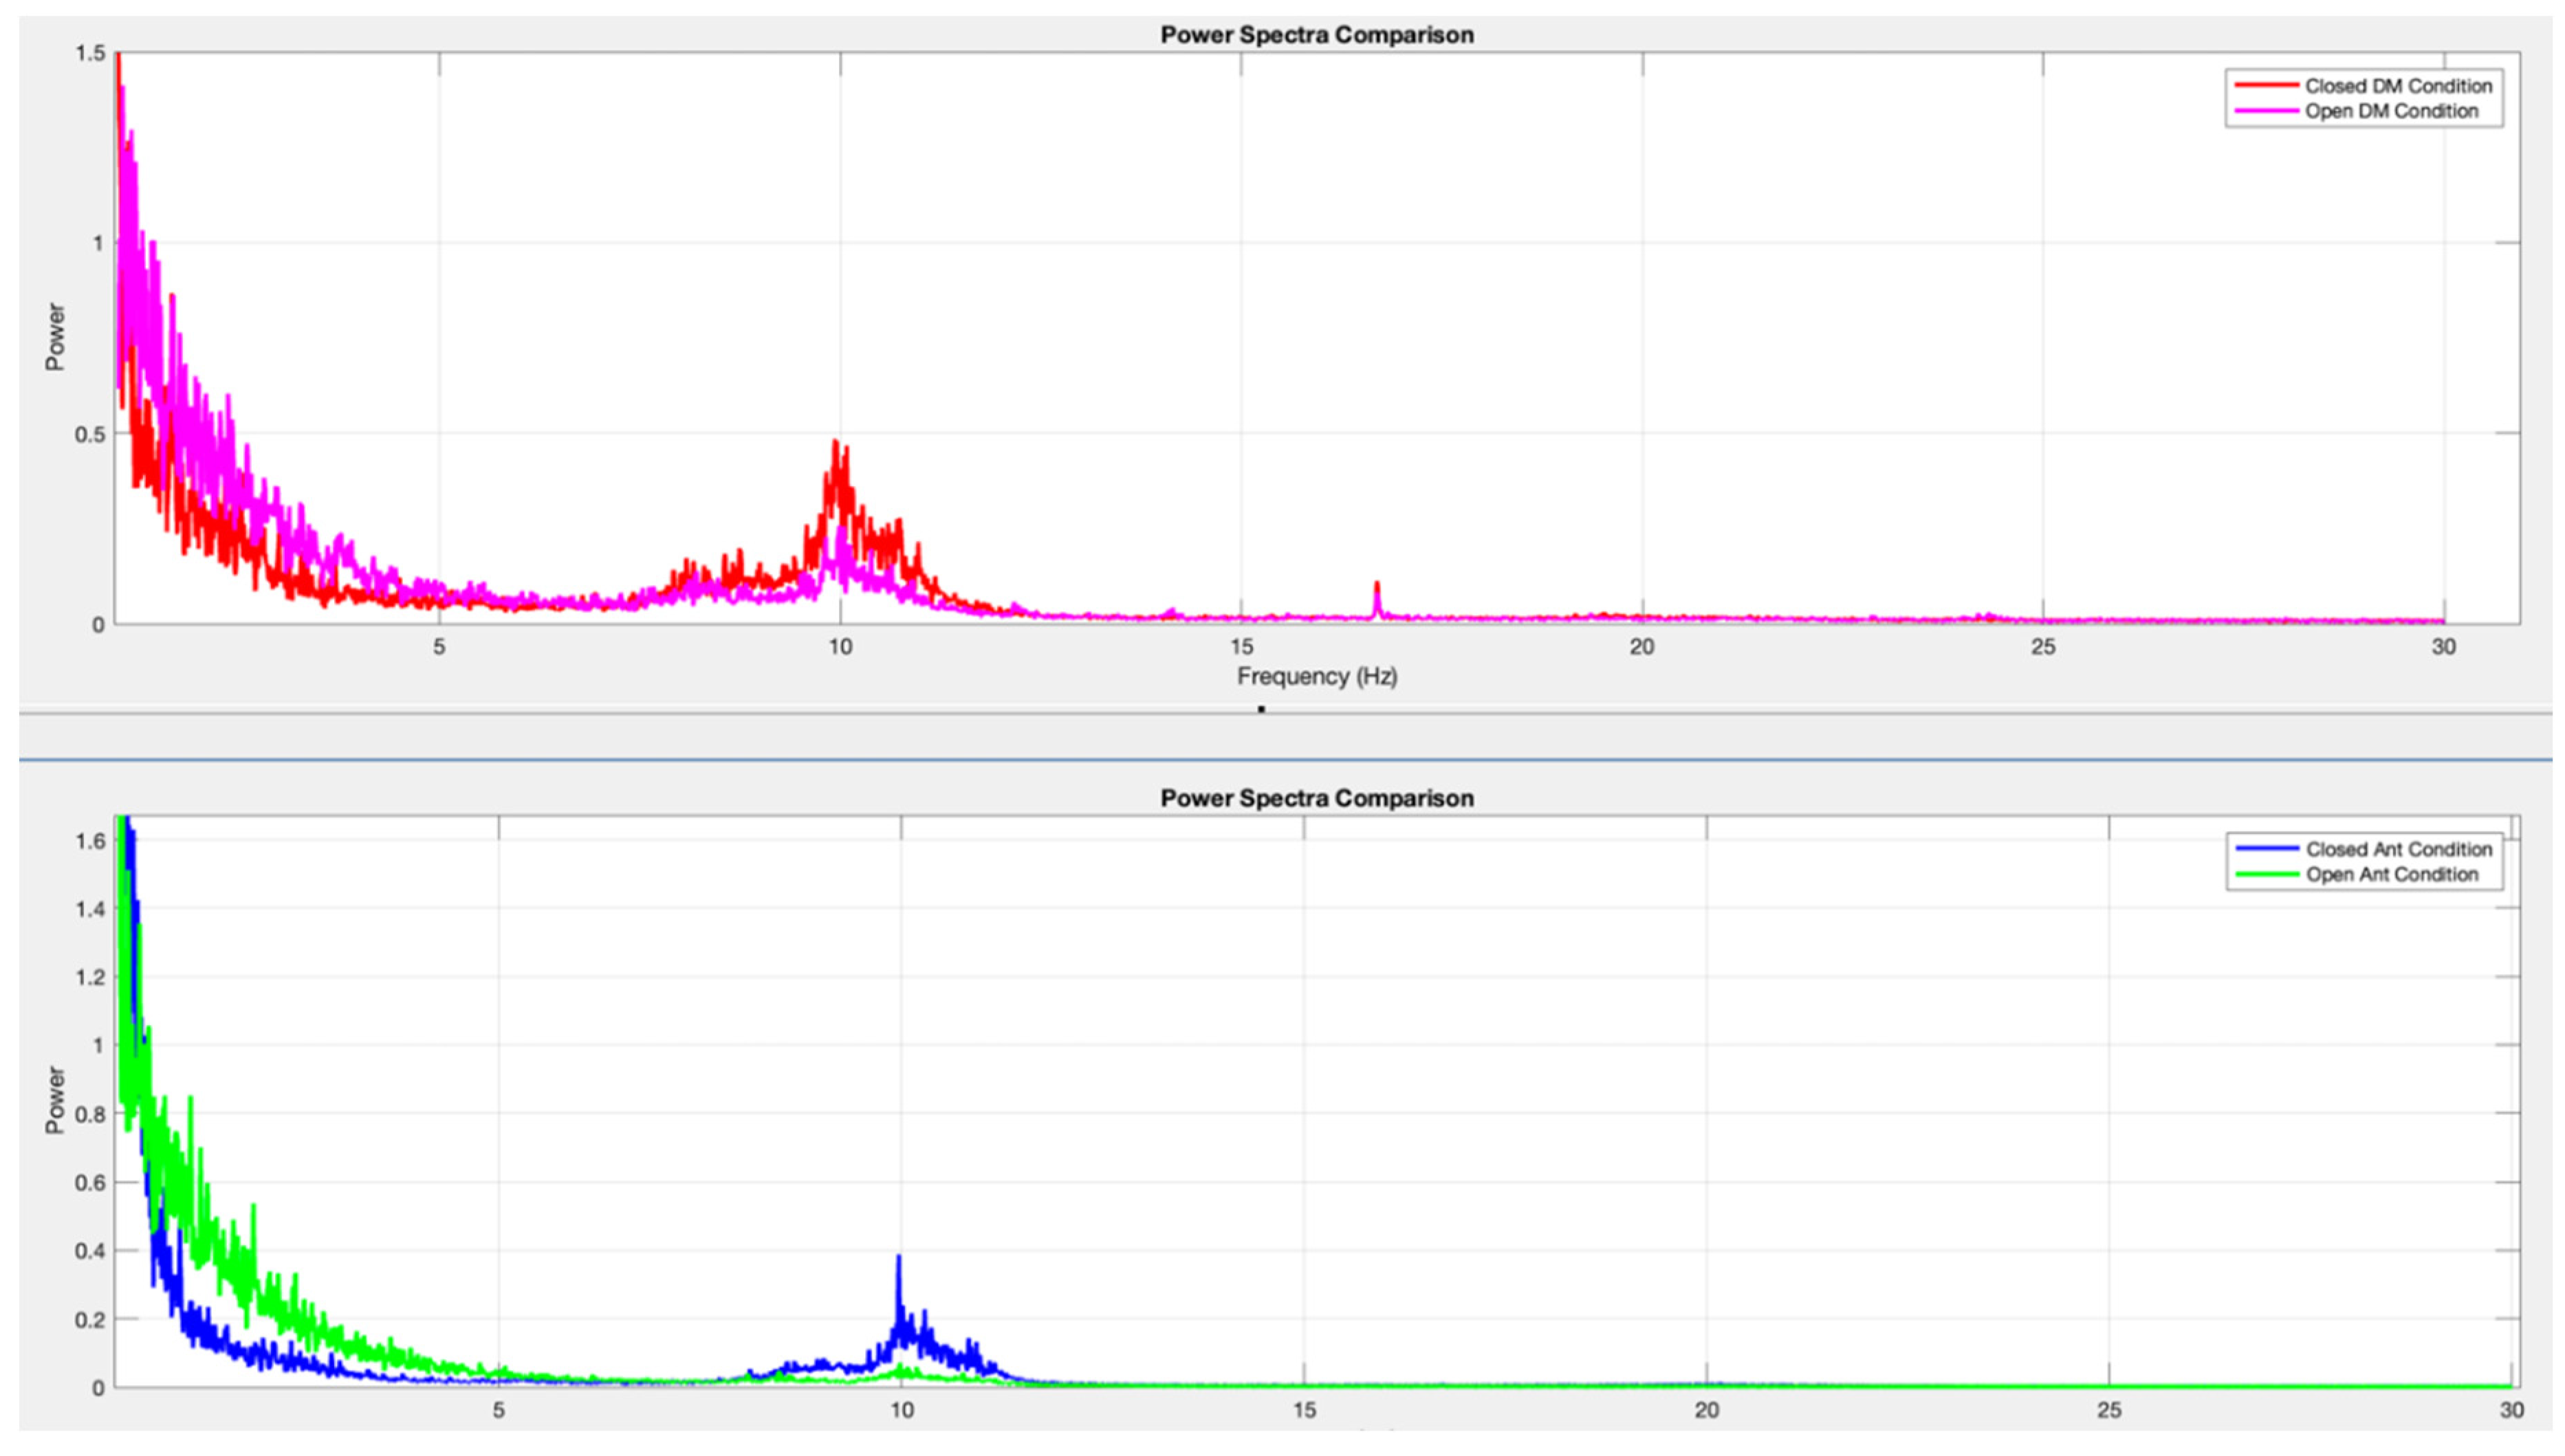
The final result is illustrated in
Figure 9 through a power spectra diagram, showing the relationship between power and frequency. For both devices, there is notable power in the range of 0 Hz – 4 Hz (Delta band), particularly in the eyes open condition. This increased power in the delta band in both standard EEG and DreamMachine systems in eyes open condition aligns with expected patterns arising from heightened cortical activity during information processing and visual stimulus reception. Additionally, a significant peak in power is observed around 10 Hz for the eyes closed condition, attributed to pronounced alpha activity during rest, consistent with the Berger effect and anticipated results. Overall, both EEG systems produced nearly identical outcomes across both conditions [
47].
8. Discussion
Enhancing EEG signal quality through Deep Learning relies on advanced techniques, with Classical Independent Component Analysis (ICA) standing out as a cornerstone of EEG signal processing. This method identifies and removes artifacts from EEG recordings, mainly when applied to many channels. The relationship is straightforward: More channels mean richer data, leading to finer resolution and improved sensitivity. This abundance of data empowers ICA to detect and isolate artifacts more effectively, resulting in cleaner and more reliable signals.
However, the DreamMachine, with its 24 channels, operates within a constrained framework compared to traditional EEG systems with numerous channels. Despite this limitation, recent advancements in Deep Learning offer promising alternatives for artifact detection. Neural networks trained specifically for this purpose can now precisely identify, remove, or replace segments affected by ocular or muscle artifacts.
In traditional EEG research, processing such data requires significant computational power, typically provided by EEGLAB running on high-performance computers. This process involves extensive pre-processing, and real-time artifact detection is generally unnecessary in a laboratory setting. The DreamMachine, on the other hand, is designed for broader accessibility, allowing users without specialized equipment to record EEG data. This key difference necessitates a distinct approach.
Efforts are focused on leveraging lightweight neural networks for real-time artifact detection tailored to the DreamMachine's capabilities. These advancements not only address its hardware constraints but also aim to enhance its potential for applications like brain-computer interfaces (BCIs). By embracing these innovations, the DreamMachine aspires to deliver high-quality EEG recording and processing in a compact and user-friendly system. The primary goal of the DreamMachine project is to create a standalone system that allows users to record high-quality EEG data using only the DreamMachine and an Android device. To achieve this, efforts are focused on integrating a lightweight neural network into DreamMachine's companion app to detect ocular and muscle artifacts in real-time. Additionally, researchers are exploring DreamMachine's potential for basic BCI applications, such as binary classification based on a participant's motor imagery responses.
The potential of the DreamMachine system in cognitive studies is also highlighted in this paper. The experimental results demonstrate that the DreamMachine system is as reliable as a Mobile EEG system. It is also suitable for use when tested on a broader statistical sample. The hypothesis that higher power in the alpha frequency range appears when the eyes are closed and increased power is noticeable when the eyes are open is confirmed by the eyes open, and eyes closed experiments conducted on both EEG systems. This behavior is observed consistently across both systems.
One limitation of the DreamMachine system is the lack of an impedance check. While the companion app currently provides a live view of each channel signal, allowing researchers to assess the quality of the electrode fit visually, the introduction of an automatic impedance check is imperative. This enhancement is crucial to empowering non-expert users to capture the highest-quality EEG recordings. Integrating an automated impedance check ensures a more comprehensive and standardized evaluation of electrode performance, contributing to the overall efficiency and reliability of EEG data collection.
Further research can be conducted to compare DreamMachine's performance with other mobile EEG systems in various experiments and applications. The development of advanced software tools for data analysis, visualization, and interpretation specifically tailored for DreamMachine could also be explored. Additionally, studies and case examples should be conducted to demonstrate DreamMachine's reliability and accuracy, along with testimonials showcasing its effectiveness in real-world applications. DreamMachine can also be used in long-term studies to monitor and analyze changes in brain activity over extended periods. The integration of DreamMachine with other wearable technologies and Internet of Things (IoT) devices to create comprehensive monitoring systems could be explored.
Acknowledgements
We extend our heartfelt thanks to the German Federal Ministry of Education and Research for funding the “SIDDATA” project (FKZ 16DHB2123) and to the Open Access Publishing Fund of Osnabrueck University. We are especially grateful to all the participants and students who took part in this study; your contributions and engagement have been truly invaluable.
Human Rights
The participant provided informed consent before taking part in the study. The research was carried out in compliance with the Declaration of Helsinki and received approval from the Ethics Committee of Osnabrueck University. The funding bodies played no role in the study's design, data collection, analysis, interpretation, manuscript preparation, or the decision to publish the findings.
References
- Monllor, P.; Cervera-Ferri, A.; Lloret, M.A.; Esteve, D.; Lopez, B.; Leon, J.L.; Lloret, A. Electroencephalography as a non-invasive biomarker of Alzheimer’s disease: a forgotten candidate to substitute CSF molecules? International Journal of Molecular Sciences 2021, 22, 10889. [Google Scholar] [CrossRef]
- Biondi, A.; Santoro, V.; Viana, P.F.; Laiou, P.; Pal, D.K.; Bruno, E.; Richardson, M.P. Noninvasive mobile EEG as a tool for seizure monitoring and management: A systematic review. Epilepsia 2022, 63, 1041–1063. [Google Scholar] [CrossRef] [PubMed]
- He, C.; Chen, Y.Y.; Phang, C.R.; Stevenson, C.; Chen, I.P.; Jung, T.P.; Ko, L.W. Diversity and suitability of the state-of-the-art wearable and wireless EEG systems review. IEEE Journal of Biomedical and Health Informatics 2023, 27, 3830–3843. [Google Scholar] [CrossRef] [PubMed]
- Sarrett, M.E.; McMurray, B.; Kapnoula, E.C. Dynamic EEG analysis during language comprehension reveals interactive cascades between perceptual processing and sentential expectations. Brain and Language 2020, 211, 104875. [Google Scholar] [CrossRef] [PubMed]
- Darfler, M.; Cruz-Garza, J.G.; Kalantari, S. An EEG-based investigation of the effect of perceived observation on visual memory in virtual environments. Brain Sciences 2022, 12, 269. [Google Scholar] [CrossRef]
- Toa, C.K.; Sim, K.S.; Tan, S.C. Electroencephalogram-based attention level classification using convolution attention memory neural network. IEEE Access 2021, 9, 58870–58881. [Google Scholar] [CrossRef]
- Supriya, S.; Siuly, S.; Wang, H.; Zhang, Y. Epilepsy detection from EEG using complex network techniques: A review. IEEE Reviews in Biomedical Engineering 2021, 16, 292–306. [Google Scholar] [CrossRef] [PubMed]
- Kataoka, H.; Takatani, T.; Sugie, K. Two-Channel Portable Biopotential Recording System Can Detect REM Sleep Behavioral Disorder: Validation Study with a Comparison of Polysomnography. Parkinson’s Disease 2022, 2022, 1888682. [Google Scholar] [CrossRef] [PubMed]
- Alkhachroum, A.; Appavu, B.; Egawa, S.; Foreman, B.; Gaspard, N.; Gilmore, E.J.; Hirsch, L.J.; Kurtz, P.; Lambrecq, V.; Kromm, J.; et al. Electroencephalogram in the intensive care unit: a focused look at acute brain injury. Intensive care medicine 2022, 48, 1443–1462. [Google Scholar] [CrossRef]
- Micoulaud-Franchi, J.; Jeunet, C.; Pelissolo, A.; Ros, T. EEG neurofeedback for anxiety disorders and post-traumatic stress disorders: A blueprint for a promising brain-based therapy. Current psychiatry reports 2021, 23, 1–14. [Google Scholar] [CrossRef]
- Wang, S.; Zhang, D.; Fang, B.; Liu, X.; Yan, G.; Sui, G.; Huang, Q.; Sun, L.; Wang, S. A study on resting EEG effective connectivity difference before and after neurofeedback for children with ADHD. Neuroscience 2021, 457, 103–113. [Google Scholar] [CrossRef]
- Douibi, K.; Le Bars, S.; Lemontey, A.; Nag, L.; Balp, R.; Breda, G. Toward EEG-based BCI applications for industry 4.0: Challenges and possible applications. Frontiers in Human Neuroscience 2021, 15, 705064. [Google Scholar] [CrossRef]
- Värbu, K.; Muhammad, N.; Muhammad, Y. Past, present, and future of EEG-based BCI applications. Sensors 2022, 22, 3331. [Google Scholar] [CrossRef] [PubMed]
- Mai, N.D.; Lee, B.G.; Chung, W.Y. Affective computing on machine learning-based emotion recognition using a self-made EEG device. Sensors 2021, 21, 5135. [Google Scholar] [CrossRef] [PubMed]
- Bashir, F.; Ali, A.; Soomro, T.A.; Marouf, M.; Bilal, M.; Chowdhry, B.S. Electroencephalogram (EEG) Signals for Modern Educational Research. In Innovative Education Technologies for 21st Century Teaching and Learning; CRC Press, 2021; pp. 149–171.
- Samimisabet, L.K.P. DreamMachine Mobile-EEG. https://github.com/neuroinfo-os/dream-machine-eeg, 2022.
- Cortes, P.M.; García-Hernández, J.P.; Iribe-Burgos, F.A.; Hernández-González, M.; Sotelo-Tapia, C.; Guevara, M.A. Temporal division of the decision-making process: An EEG study. Brain Research 2021, 1769, 147592. [Google Scholar] [CrossRef]
- Bitner, R.; Le, N.T. Can EEG-devices differentiate attention values between incorrect and correct solutions for problem-solving tasks? Journal of Information and Telecommunication 2022, 6, 121–140. [Google Scholar] [CrossRef]
- Oomen, D.; Cracco, E.; Brass, M.; Wiersema, J.R. EEG frequency tagging evidence of social interaction recognition. Social Cognitive and Affective Neuroscience 2022, 17, 1044–1053. [Google Scholar] [CrossRef]
- Johnson, E.L.; Kam, J.W.; Tzovara, A.; Knight, R.T. Insights into human cognition from intracranial EEG: a review of audition, memory, internal cognition, and causality. Journal of neural engineering 2020, 17, 051001. [Google Scholar] [CrossRef]
- Anaby-Tavor, A.; Carmeli, B.; Goldbraich, E.; Kantor, A.; Kour, G.; Shlomov, S.; Tepper, N.; Zwerdling, N. Do not have enough data? Deep learning to the rescue! In Proceedings of the Proceedings of the AAAI conference on artificial intelligence, 2020, Vol. 34, pp. 7383–7390.
- Guger, C. OpenBCI,Cyton Daisy Biosensing Boards—16 Channel. https://shop.openbci.com/products/cyton-daisy-biosensing-boards-16-channel, 2013.
- Zhang, L.; Cui, H. Reliability of MUSE 2 and Tobii Pro Nano at capturing mobile application users’ real-time cognitive workload changes. Frontiers in Neuroscience 2022, 16, 1011475. [Google Scholar] [CrossRef]
- Duvinage, M.; Castermans, T.; Petieau, M.; Hoellinger, T.; Cheron, G.; Dutoit, T. Performance of the Emotiv Epoc headset for P300-based applications. Biomedical engineering online 2013, 12, 1–15. [Google Scholar] [CrossRef] [PubMed]
- Groppa, S.; Oliviero, A.; Eisen, A.; Quartarone, A.; Cohen, L.; Mall, V.; Kaelin-Lang, A.; Mima, T.; Rossi, S.; Thickbroom, G.; et al. A practical guide to diagnostic transcranial magnetic stimulation: report of an IFCN committee. Clinical Neurophysiology 2012, 123, 858–882. [Google Scholar] [CrossRef] [PubMed]
- Neuro, A. asalab™ (ANT Neuro). https://www.ant-neuro.com.
- Bateson, A.D.; Baseler, H.A.; Paulson, K.S.; Ahmed, F.; Asghar, A.U. Categorisation of mobile EEG: a researcher’s perspective. BioMed research international 2017, 2017. [Google Scholar] [CrossRef] [PubMed]
- University, N. Most Popular Programming Languages. https://graduate.northeastern.edu/resources/most-popular-programming-languages/, 2023.
- Nuwer, M.R.; Comi, G.; Emerson, R.; Fuglsang-Frederiksen, A.; Guérit, J.M.; Hinrichs, H.; Ikeda, A.; Luccas, F.J.C.; Rappelsburger, P. IFCN standards for digital recording of clinical EEG. Electroencephalography and clinical Neurophysiology 1998, 106, 259–261. [Google Scholar] [CrossRef]
- Chen, X.; Cao, L.; Haendel, B.F. Differential effects of walking across visual cortical processing stages. Cortex 2022, 149, 16–28. [Google Scholar] [CrossRef]
- Blum, S.; Debener, S.; Emkes, R.; Volkening, N.; Fudickar, S.; Bleichner, M.G. EEG recording and online signal processing on android: A multiapp framework for brain-computer interfaces on smartphone. BioMed research international 2017, 2017. [Google Scholar] [CrossRef]
- Medical, S. SMARTING mobi. https://soterixmedical.com/research/mobile-eeg/smarting-mobi.
- Lightbody, G.; Galway, L.; McCullagh, P. The brain computer interface: Barriers to becoming pervasive. Pervasive Health: State-of-the-art and Beyond 2014, pp. 101–129.
- Badcock, N.A.; Mousikou, P.; Mahajan, Y.; De Lissa, P.; Thie, J.; McArthur, G. Validation of the Emotiv EPOC® EEG gaming system for measuring research quality auditory ERPs. PeerJ 2013, 1, e38. [Google Scholar] [CrossRef] [PubMed]
- Campbell, A.; Choudhury, T.; Hu, S.; Lu, H.; Mukerjee, M.K.; Rabbi, M.; Raizada, R.D. NeuroPhone: brain-mobile phone interface using a wireless EEG headset. In Proceedings of the Proceedings of the second ACM SIGCOMM workshop on Networking, systems, and applications on mobile handhelds, 2010, pp. 3–8.
- Stopczynski, A.; Stahlhut, C.; Larsen, J.E.; Petersen, M.K.; Hansen, L.K. The smartphone brain scanner: a portable real-time neuroimaging system. PloS one 2014, 9, e86733. [Google Scholar] [CrossRef] [PubMed]
- McKenzie, E.D.; Lim, A.S.; Leung, E.C.; Cole, A.J.; Lam, A.D.; Eloyan, A.; Nirola, D.K.; Tshering, L.; Thibert, R.; Garcia, R.Z.; et al. Validation of a smartphone-based EEG among people with epilepsy: A prospective study. Scientific reports 2017, 7, 1–8. [Google Scholar] [CrossRef]
- Bateson, A.D.; Asghar, A.U. Development and evaluation of a smartphone-based electroencephalography (EEG) system. IEEE Access 2021, 9, 75650–75667. [Google Scholar] [CrossRef]
- O’Neal Jr, J. Predictive quantizing systems (differential pulse code modulation) for the transmission of television signals. Bell System Technical Journal 1966, 45, 689–721. [Google Scholar] [CrossRef]
- Buchanan, W.; Buchanan, W. Pulse coded modulation (PCM). Applied Data Communications and Networks 1996, pp. 191–208.
- Oostenveld, R.; Fries, P.; Maris, E.; Schoffelen, J.M. FieldTrip: open source software for advanced analysis of MEG, EEG, and invasive electrophysiological data. Computational intelligence and neuroscience 2011, 2011, 1–9. [Google Scholar] [CrossRef] [PubMed]
- Delorme, A.; Makeig, S. EEGLAB: an open source toolbox for analysis of single-trial EEG dynamics including independent component analysis. Journal of neuroscience methods 2004, 134, 9–21. [Google Scholar] [CrossRef]
- Melnik, A.; Legkov, P.; Izdebski, K.; Kärcher, S.M.; Hairston, W.D.; Ferris, D.P.; König, P. Systems, subjects, sessions: to what extent do these factors influence EEG data? Frontiers in human neuroscience 2017, 11, 150. [Google Scholar] [CrossRef]
- Gargiulo, G.; Bifulco, P.; Calvo, R.A.; Cesarelli, M.; Jin, C.; van Schaik, A. A mobile EEG system with dry electrodes. In Proceedings of the 2008 IEEE biomedical circuits and systems conference; IEEE, 2008; pp. 273–276. [Google Scholar]
- Krukow, P.; Rodríguez-González, V.; Kopis´-Posiej, N.; Gómez, C.; Poza, J. Tracking EEG network dynamics through transitions between eyes-closed, eyes-open, and task states. Scientific Reports 2024, 14, 17442. [Google Scholar] [CrossRef]
- Palol, M.V.D. pylsl-keyboard-trigger. https://github.com/mvidaldp/pylsl-keyboard-trigger, 2022.
- Moreno-Castillo, M.; Manjarrez, E. Reduction of low-frequency oscillations in cerebral circulation correlates with pupil dilation during cognition: an fNIRS study. bioRxiv 2023, pp. 2023–11.
Figure 1.
Illustration of the DreamMachine Hardware System.
Figure 1.
Illustration of the DreamMachine Hardware System.
Figure 2.
A sweep signal ranging from 1 to 70 Hz is generated using a signal generator and injected into the DreamMachine. The experiment is conducted twice: once with the default filter setting (filter on) and once with all filters disabled (filter off). The blue line represents the sweep signal from 1 to 70 Hz, while the orange line shows the power attenuated at 50 Hz when the filter is active.
Figure 3.
Bitshift Diagram: The calculated difference between S1 and S2 is a smaller value still represented in 24-bit. When the difference is small, the leading bits are zeros and carry no information. In contrast, when the difference is large, the initial bits contain significant information, while the later bits, representing very fine voltages, can be neglected.
Figure 4.
This figure displays the EEGDroid Android application, which is generating a data loss notification. It indicates that 3% of the samples are being lost and suggests changing the current settings to prevent further data loss.
Figure 4.
This figure displays the EEGDroid Android application, which is generating a data loss notification. It indicates that 3% of the samples are being lost and suggests changing the current settings to prevent further data loss.
Figure 5.
The general procedure involves attaching electrodes to the subject's scalp, connecting them to the DreamMachine via cable, and pairing the DreamMachine with the EEGDroid application over Bluetooth. After selecting the desired configuration in EEGDroid, brain activity recording can be initiated. The recorded signals are exported as a CSV file, enabling researchers to perform further analyses on the data.
Figure 6.
The prototype of the EEGDroid.
Figure 6.
The prototype of the EEGDroid.
Figure 7.
The results from the cluster-based permutation test on the topographical power spectra are illustrated for every participant. These results are categorized by condition and EEG system for each individual. The topographies on the left side of each figure are from the standard EEG system, while those on the right side are from the DreamMachine system. The top two topographies also correspond to the eyes closed condition, and the bottom two topographies represent the eyes open condition.
Figure 8.
An extensive statistical examination utilizing the cluster-based permutation test. (A) the right side showcases the outcome of "eyes open minus eyes closed," while the left side portrays the contrast between eyes closed and eyes open for the Standard EEG system. (B) the results of "eyes open minus eyes closed" are presented on the right side. In contrast, the left side illustrates the differentiation between eyes closed and eyes open for the DreamMachine system.
Figure 9.
Power spectra diagram of the averaged data for both eyes open and eyes closed conditions and Standard and DreamMachine EEG systems.
Figure 9.
Power spectra diagram of the averaged data for both eyes open and eyes closed conditions and Standard and DreamMachine EEG systems.
Table 1.
Filter options provided by the DreamMachine system.
Table 1.
Filter options provided by the DreamMachine system.
| High-pass Filter |
Low-pass Filter |
Band-stop Filter |
| 0.8 Hz order 2 |
45 Hz order 4 |
46-54 Hz order 6 |
| 1.0 Hz order 4 |
60 Hz order 6 |
46-54 Hz order 4 |
| 1.7 Hz order 4 |
- |
48-52 Hz order 6 |
| 1.7 Hz order 2 |
- |
48-52 Hz order 4 |
|
Disclaimer/Publisher’s Note: The statements, opinions and data contained in all publications are solely those of the individual author(s) and contributor(s) and not of MDPI and/or the editor(s). MDPI and/or the editor(s) disclaim responsibility for any injury to people or property resulting from any ideas, methods, instructions or products referred to in the content. |
© 2025 by the authors. Licensee MDPI, Basel, Switzerland. This article is an open access article distributed under the terms and conditions of the Creative Commons Attribution (CC BY) license (http://creativecommons.org/licenses/by/4.0/).