Preprint
Article

This version is not peer-reviewed.

Comprehensive Evaluation of Soybean Germplasm Resources for Salt Tolerance During the Germination Period

A peer-reviewed article of this preprint also exists.

Submitted:

06 January 2025

Posted:

07 January 2025

You are already at the latest version

Abstract

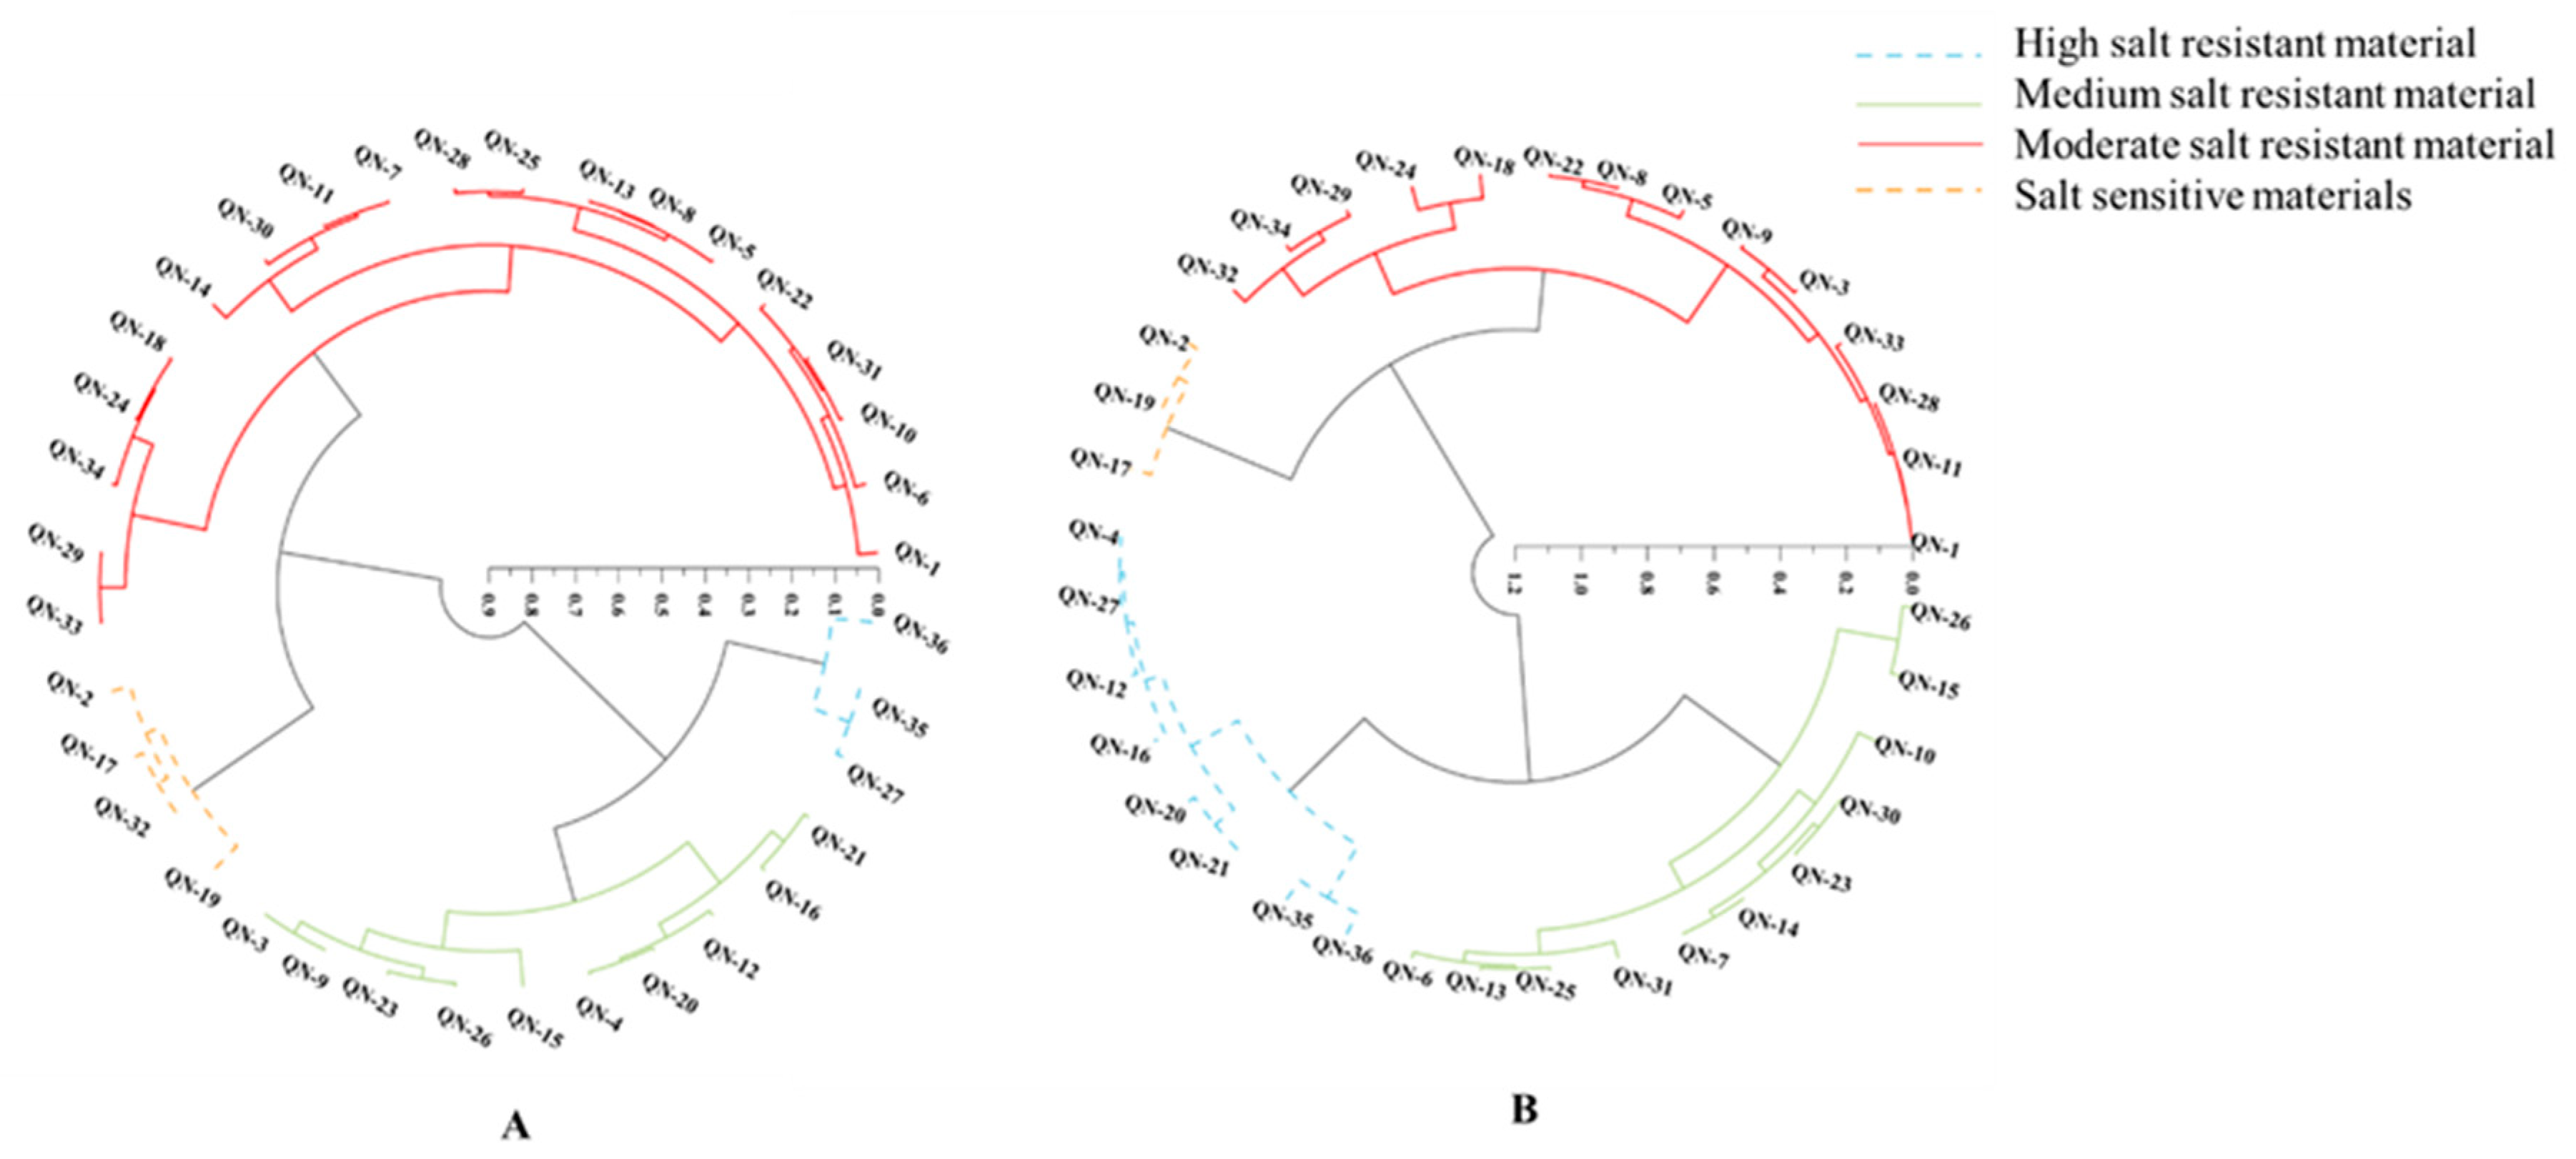
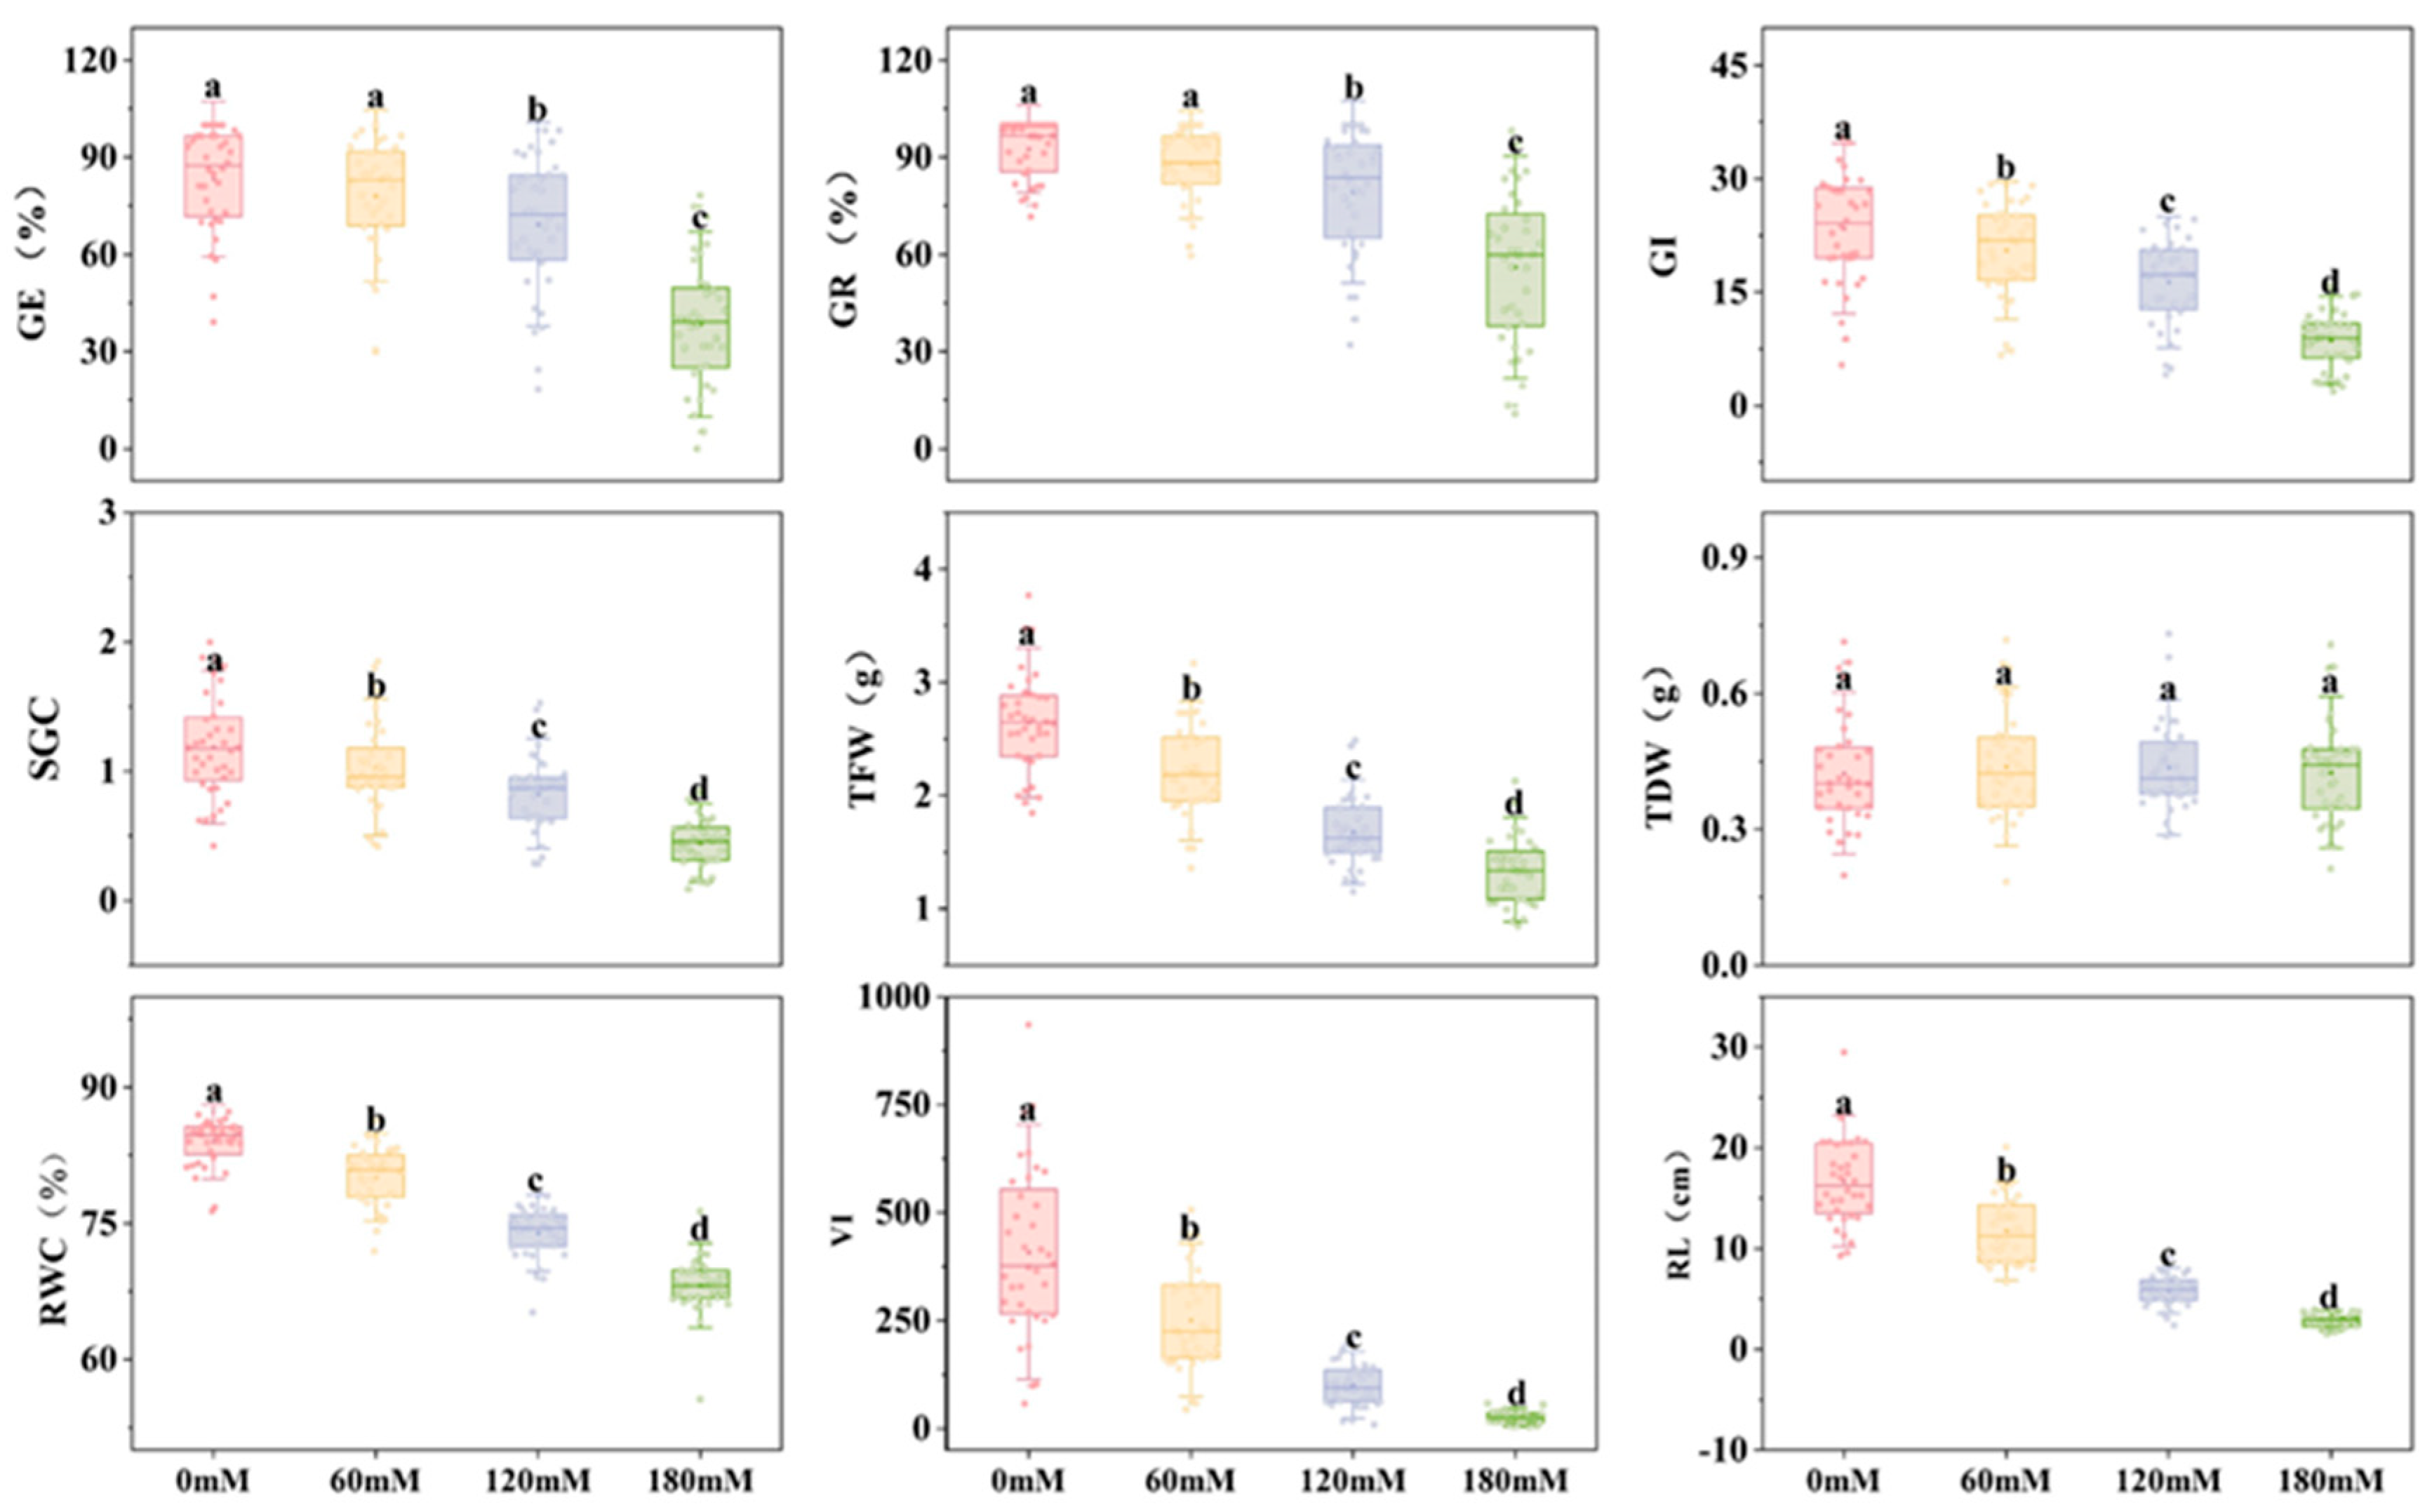
Various biotic and abiotic stresses challenge plant growth and production, with salt stress notably impeding normal development, compromising quality, and reducing yield in plants. The objective is to identify salt-tolerant soybean germplasm resources and develop a comprehensive method for assessing salt tolerance during soybean germination. This study involved the utilization of 36 soybean germplasm to induce varying degrees of salt stress through the application of 0, 60, 120, and 180 mmol/L NaCl solutions, employing the Petri dish germination identification method to assess nine phenotypic indices, such as germination potential, rate, and radicle length. The salt tolerance of soybean germination was comprehensively assessed using one-way ANOVA, multi-factor ANOVA, principal component analysis, affiliation function, quadratic regression equation analysis, and cluster analysis. These methods were employed to investigate the impact of varied NaCl concentrations on different germination indices, determine the best screening parameters for identifying soybean germination salt tolerance, and identify soybean germplasm with varying salt tolerances. The results indicated that soybean seeds exhibited tolerance to low salt concentrations, while concentrations exceeding 120 mmol/L led to significant inhibition of germination indicators. Notably, the vitality index and radicle length were highly sensitive indicators reflecting the impact of salt stress on seed germination. By analyzing the quadratic regression equation correlating the germination index and the salt tolerance coefficient, an LC50 value of 155.4 mmol/L with a coefficient of variation of 20.00% was derived. This value serves as a viable screening concentration for identifying salt tolerance during the soybean germination stage. Additionally, clustering analysis categorized 36 soybean varieties into 4 salt tolerance levels, with QN-27, QN-35, and QN-36 demonstrating high salt tolerance, and QN-2, QN-17, and QN-19 were classified as salt-sensitive materials.

Keywords: 
;  ;  ;  

1. Introduction

Soybean (Glycine max) is an annual plant within the dicotyledonous family Leguminosae, specifically the genus Soybean. Originating in China with a rich history of cultivation, it was domesticated from wild soybean (Glycine soja) around 6000-9000 years ago[1,2]. Currently, as a globally significant oil, grain, and feed crop, soybean plays a crucial role by supplying over half of the world's oil production and nearly a quarter of plant protein. This dual contribution is pivotal in ensuring national food security and enhancing dietary patterns. Due to China's swift economic expansion and improving living standards, the appetite for meat, eggs, milk, and animal feed is on the rise, consequently fueling the exponential surge in the demand for soybeans[3,4]. By 2023, China is projected to import 99.41 million tons of soybeans, marking an 11.4% surge from 2022. Local soybean production accounts for less than 20% of the total demand, highlighting a substantial disparity between production and consumption [5]. Mitigating soybean imports and lessening external soybean reliance stand as the primary challenge confronting China. Consequently, enhancing soybean yield, expanding cultivation areas, and boosting overall production emerge as critical imperatives for the advancement of China's soybean industry.
Salt stress represents a significant form of abiotic stress and a prevalent agricultural issue [6,7]), impacting over 800 million hectares of land globally, including 32 million hectares of agricultural land [8,9]. Projections suggest that soil salinization will contribute to 50% of land degradation by 2050[10]. When subjected to salt stress, the majority of plants experience root water loss, inhibited ion uptake, diminished leaf photosynthetic efficiency, and stunted plant growth, ultimately severely impacting both quality and yield formation [11,12]. Soybean exhibits moderate salt tolerance, characterized by a soil salinity threshold of 5.0 ds/m. Cultivating germplasm acclimated to adverse conditions stands as a paramount method to unlock the productivity potential inherent in saline soils [13]. Hence, the investigation into the impact of salt stress on soybeans bears immense theoretical and practical importance in the research and cultivation of salt-resistant soybean varieties. It aims to enhance soybean yield and quality, optimize land use, bolster agricultural economic gains, and foster the sustainable advancement of Chinese agriculture.
In contrast to abiotic stresses like drought and low temperatures, salt stress is a persistent companion to soybean during its reproductive phase, exhibiting varying degrees of salt tolerance across different growth stages such as germination, seedling emergence, flowering, and maturation. Notably, there exists no apparent correlation between the levels of salt tolerance observed at distinct reproductive stages[14,15]. Research indicates that the germination and seedling stage represents the most vulnerable phase to salt tolerance in plants. In practical agricultural settings, the fundamental requirement for ensuring robust and healthy crop seedlings serves as the cornerstone for achieving high and consistent yields. Thus, the ability of soybean seeds to germinate successfully under salt stress conditions emerges as a critical factor in guaranteeing subsequent growth and development[16,17]. Therefore, establishing a robust evaluation method for assessing salt tolerance in soybean germplasm during germination is crucial for acquiring high-performing salt-tolerant germplasm resources. The Huang-Huai-Hai region is the primary soybean production area in China, facing issues of soil salinization, primarily composed of sulfates and chlorides [18]. Analyzing the salt composition of salinized soils in the Huanghuaihai region, various concentrations of NaCl solutions were chosen to replicate the genuine salt stress environment in the area for identifying salt tolerance in diverse soybean germplasm resources. This methodology aimed to discern the salt tolerance levels of diverse soybean germplasm resources within this region. A study conducted by [7] utilized K-means clustering to analyze the germination indexes of 198 soybean germplasm genotypes, revealing substantial variations in salt tolerance across these genotypes. The salt-tolerant genotypes exhibited germination capabilities even at concentrations as high as 200mM. In contrast, the salt-sensitive genotypes failed to germinate even at the minimal concentration of 100 mM. Cao et al. [19]assessed the salt tolerance of 51 Indonesian soybean germplasms through hydroponic methods, and conducted a detailed analysis on six varieties exhibiting heightened salt tolerance. The findings indicated a notable positive correlation between the expression levels of the salt tolerance gene Ncl and the salt tolerance levels observed in the soybean varieties. Zhou et al. [20]assessed the salt tolerance levels of 20 distinct soybean varieties throughout the germination phase, determined the optimal screening concentration of NaCl to be 164.50 mmol/L-1. Through a comprehensive comparison of the affiliation function and cluster analysis techniques. Identified Dongnong 254, Heike 123, Heike 58, Heihe 49, and Heike 68 as salt-tolerant varieties, while Xihai 2, Suinong 94, Kenfeng 16, and Heinong 84 were categorized as salt-sensitive varieties. Yu et al. [21]devised a robust and validated methodology for assessing salt tolerance in alfalfa. This methodology involved the evaluation of 14 traits during the seedling stage of 20 distinct alfalfa varieties, This methodology incorporates the utilization of principal components, affiliation functions, clustering techniques, and stepwise regression analysis. Li et al.[22] assessed 552 sunflower germplasms with diverse genetic backgrounds for their salt tolerance. Out of these, thirty were classified as highly salt-tolerant germplasms, while twenty-three were categorized as highly salt-sensitive materials. Hence, to expedite the breeding process for salt tolerance in soybeans, a pressing requirement exists for a robust methodology to assess and procure salt-tolerant germplasm resources. In this research, 36 soybean germplasm samples underwent stress treatments using NaCl solutions at varying concentrations (0 mmol/L, 60 mmol/L, 120 mmol/L, and 180 mmol/L). Nine pertinent phenotypic traits, including germination potential, germination rate, and hypocotyl length, were scrutinized to establish a reliable method for assessing soybean salt tolerance during germination. Various statistical techniques, such as analysis of variance (ANOVA), correlation analysis, principal component analysis (PCA), weighted subordinate function (WSF), and quadratic regression (QR), were employed to cluster and comprehensively analyze the salt tolerance of soybean germplasm. The objective is to investigate how soybean germplasm responds to salt stress across various NaCl concentrations, analyze the relationship between different salt stress levels and diverse traits, determine the optimal screening concentration for identifying salt tolerance during soybean germination, integrate mean values of trait affiliations across stress levels and the half-lethal concentration, conduct cluster analysis to identify superior salt-tolerant soybean germplasm resources, and offer insights for studying soybean salt tolerance and selecting new germplasm.

2. Results

2.1. The Effects of Different Concentrations of NaCl on Various Indicators of Soybean Germination Stage

Salt tolerance assessment during germination of 36 soybean germplasm using NaCl solutions of varying concentrations(Figure 1 andTable 1 ). Compared to the control group, the germination vigor and germination rate of soybeans remained relatively stable at 60mM, indicating that soybean seeds exhibit moderate tolerance to lower levels of salt stress. However, the germination index, seed sprouting index, total fresh weight, relative water content, vigor index, and radicle length exhibited a consistent decline as salt concentrations increased. Notably, beyond 120 mM NaCl, this decline became more pronounced, indicating a substantial inhibitory effect of salt stress on germination indicators, with a more pronounced impact at higher concentrations. Particularly, the vigor index and radicle length were the most affected by increasing salt levels. In comparison to the control, the vigor index decreased by 38.48%, 75.32%, and 93.79% at 60 mM, 120 mM, and 180 mM, respectively, while the radicle length decreased by 29.48%, 65.07%, and 83.28% at the same concentrations. This highlights the sensitivity of the vigor index and radicle length as key indicators reflecting the impact of salt stress on soybean germination.
The coefficient of variation for each indicator of the test material differs at varying salt concentrations, indicating that these indicators exhibit inconsistent sensitivity to salt stress. Apart from embryonic root length, the coefficient of variation for each index generally follows the sequence of 180 mM > 120 mM > 60 mM > 0 mM. This trend signifies that salt stress magnifies the disparities among soybean varieties, facilitating the comparison and selection of germplasm with enhanced salt tolerance.
Note: the germination performance of 36 soybean germplasms under varying levels of salt stress, GR: Germination rate; GE: Germination energy; SGC: Seed germination coefficient; GI: Germination index; TFW: Total fresh weight; TDW: Total dry weight; RL: Radicle length; RWC: Relative water content; VI: Vigor index. Significant differences between treatments were denoted by distinct letters in the graphs, indicating statistical significance at the p < 0.05 level.

2.2. Multifactor Analysis of Variance of Each Single Indicator

The study employed multifactor analysis of variance (ANOVA) to examine the independent and interactive effects of two factors: different soybean germplasm and varying NaCl concentrations on the measured indexes (Table 2). The results indicated that, aside from the total dry weight, the F values corresponding to various NaCl concentrations were significantly greater than 0.5, while the F values for each index across different germplasm and NaCl concentrations were all below 0.01. This outcome underscored the substantial impact of different soybean varieties and NaCl concentrations on the measured indexes. Furthermore, a notable reciprocal influence between the varieties and NaCl concentrations was observed, with all corresponding F-values demonstrating significance levels below 0.01.

2.3. Principal Component Analysis of the Salt Tolerance Coefficient

The outcomes of the principal component analysis for the salt tolerance coefficients of the nine indexes are depicted (Table 3). Three principal components, each possessing eigenvalues exceeding 1, were derived. Respectively, their cumulative contributions amounted to 80.157%, 84.746%, and 82.928% at NaCl concentrations of 60 mM, 120 mM, and 180 mM, elucidating the variation in the nine traits. These findings help elucidate the variations observed in the nine traits under consideration.
At a concentration of 60 mM NaCl, the eigenvalue of CS1 was 3.484. This value predominantly comprised three indicators—RRWC, RVI, and RRL—explaining 38.487% of the contribution. This suggests that relative water content, vigor index, and radicle length serve as crucial indicators for assessing salt tolerance at 60 mM NaCl. With an eigenvalue of 2.114, CS2 was predominantly composed of RGE, RGR, RGI, and RSGC, explaining a contribution of 23.493%. This component chiefly delineates the overall germination of soybeans under 60 mM NaCl stress. CS3 exhibited an eigenvalue of 1.616, primarily comprising RTFW and RTDW indicators, elucidating a contribution of 17.956%. This component predominantly reflects the alterations in soybean biomass.
At a concentration of 120 mM NaCl, the eigenvalue of CS1 was 3.395. This value was primarily composed of four indicators—RGE, RGR, RGI, and RSGC—explaining 37.728% of the contribution. This component chiefly delineates the overall germination process of soybeans under 120 mM NaCl stress, making it a crucial indicator for evaluating salt tolerance at this specific concentration. With an eigenvalue of 2.623, CS2 was predominantly composed of three indicators—RRWC, RVI, and RRL—explaining 29.141% of the contribution. This component mainly responds to the changes in the embryonic root length of soybeans under stress. CS3 had an eigenvalue of 1.609, primarily composed of two indicators—RTFW and RTDW—explaining 17.877% of the contribution. This component mainly responds to the changes in soybean biomass.
At a concentration of 180 mM NaCl, the eigenvalue of CS1 was 3.727. This value was primarily composed of three indicators—RGE, RGR, and RSGC—explaining 41.414% of the contribution. This component chiefly delineates the overall sprouting process of soybeans under 180 mM NaCl stress, serving as a crucial indicator for evaluating salt tolerance at this particular concentration. With an eigenvalue of 2.020, CS2 was predominantly composed of two indicators—RVI and RRL—explaining a contribution rate of 22.449%. This component mainly responds to the changes in the embryonic root length of soybeans under stress. CS3 had an eigenvalue of 1.716, primarily composed of two indicators—RTFW and RTDW—explaining a contribution rate of 19.065%. This component mainly responds to the changes in soybean biomass.

2.4. Analysis of the Affiliation Function

The weight coefficients of the composite indexes were 40.52%, 33.4%, and 26.08% for the three composite indexes under the 60 mM NaCl treatment. Similarly, for the 120 mM NaCl treatment, the weight coefficients were 44.518%, 34.386%, and 21.095% for the respective three composite indexes. At 180 mM NaCl, the weight coefficients were 49.94%, 27.07%, and 22.99%, emphasizing the relative significance of each principal component under the respective concentration stress (Table 3). Consequently, by integrating the affiliation function values of each composite index across different germplasm with the respective weight coefficients, the composite evaluation values (D-values) representing the salt tolerance of diverse soybean germplasm under distinct NaCl concentrations were calculated.
The degree of affiliation (μn) and composite evaluation value (D-value) for each trait in 36 soybean germination were calculated based on the three principal component factor scores derived from the principal component analysis(Table S2、S3 and S4).The maximum D-value recorded was 0.93 (QN-27) with a minimum of 0.21 (QN-17) under the 60 mM NaCl treatment. Additionally, the maximum D-value reached 0.83 (QN-15) with a minimum of 0.35 (QN-17) under the 120 mM NaCl treatment. Under the 180 mM NaCl treatment, the D-value peaked at 0.90 (QN-16) and hit a minimum of 0.23 (QN-19).
The varied ranking of D-values under distinct NaCl treatments stems from the differential effects of varying concentrations on soybeans, resulting in diverse manners of impact and unique adaptations and resistances across various soybean germplasms. Moreover, given the differing weights of composite indexes under various salt concentrations, it is imperative to collectively analyze the indices across varying salt concentrations.

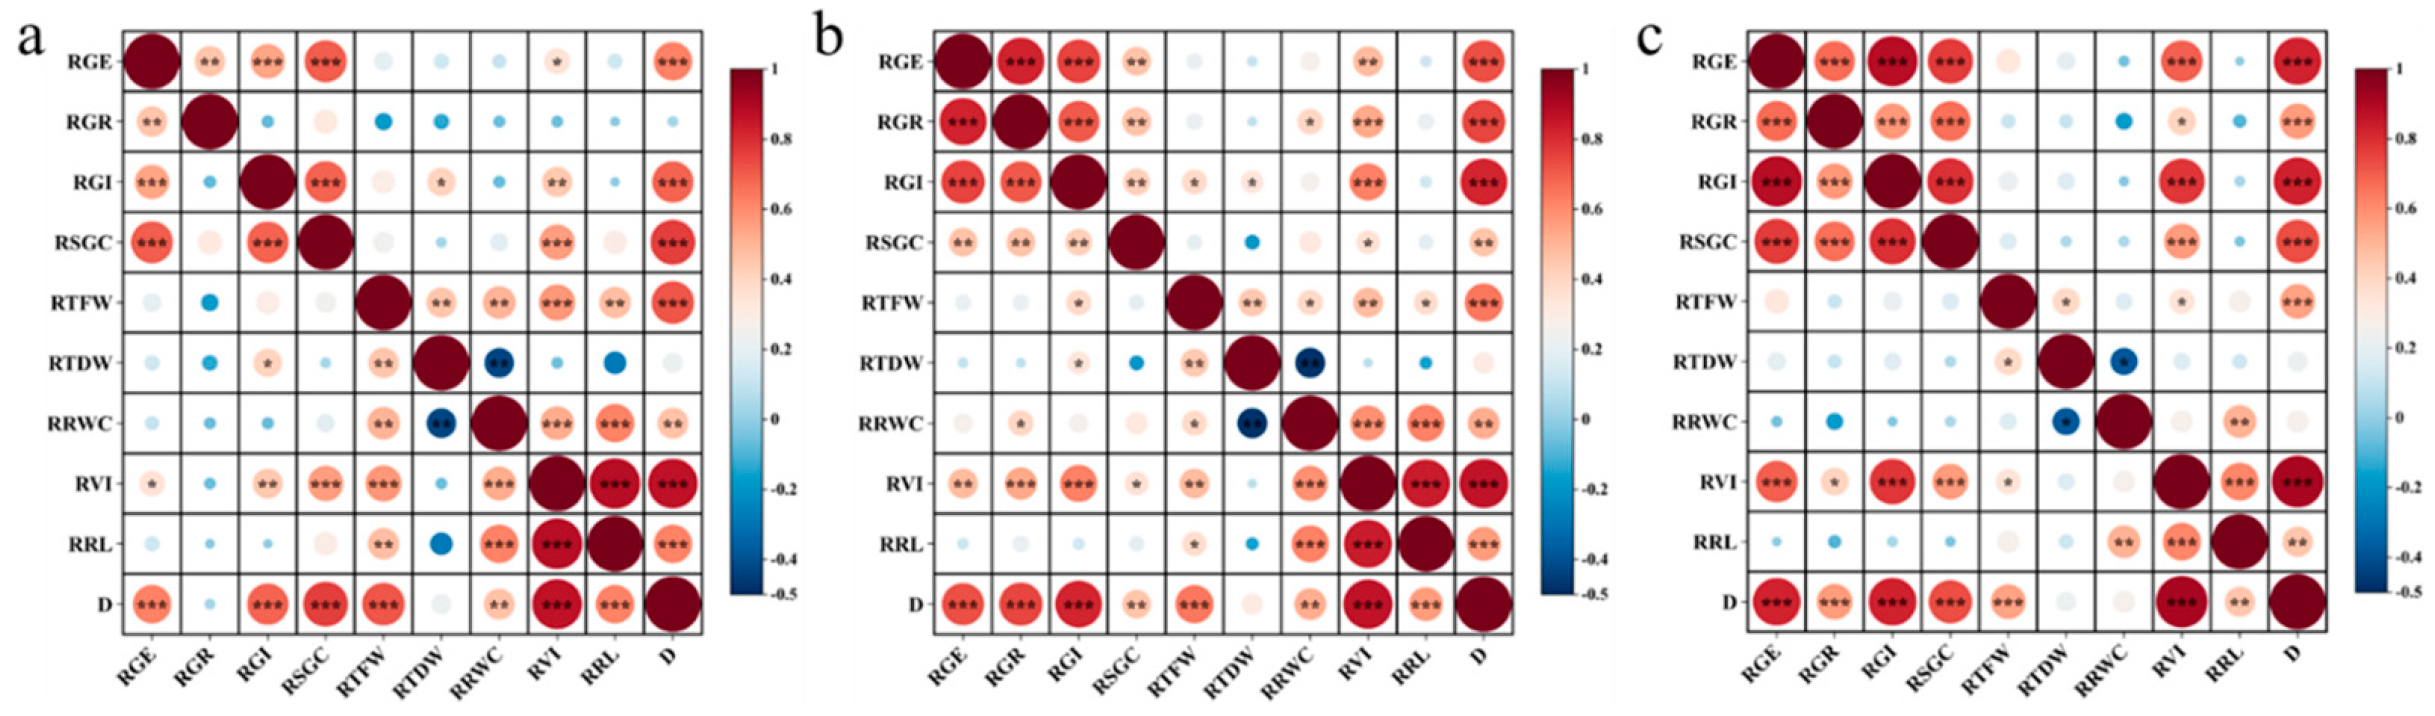
2.5. Correlation Analysis

Correlation analysis between the relative salt tolerance index and the D value of soybean germination under varying NaCl concentrations was conducted (Figure 2). In Figure a, no significant correlation between RGR and D value was observed initially. However, as salt concentration increased, the significance of RGR and D value gradually rose, indicating that low salt stress minimally affected soybean germination but became more pronounced with higher salt concentrations. Figure c revealed no significant positive correlation between RRWC and D value, suggesting that RRWC could not serve as a reliable index for identifying salt tolerance under intense salt stress. The analysis of graphs a, b, and c indicated an absence of significant correlation between RTDW and D value across varied salt stresses, thereby implying that TDW was not a pivotal index in the soybean germination salt tolerance identification system. Furthermore, indicators like RGE, RGR, RGI, and RSGC were found to have no association with RTFW, RTDW, RTGC, and other salt tolerance indexes. These findings suggest that germination and biomass indicators, such as RTFW, RTDW, RRWC, and RL, were largely independent of each other.
Note: The Pearson correlation coefficient method was employed to perform a correlation analysis on indicators from 36 soybean germplasm accessions: * indicates significant correlation at the 0.05 level, ** indicates significant correlation at the 0.01 level, and *** indicates significant correlation at the 0.001 level. a: The correlation between salt tolerance coefficient and D value during soybean germination under 60mmol/L NaCl stress; b: The correlation between salt tolerance coefficient and D value during soybean germination under 120mmol/L NaCl stress; c: The correlation between salt tolerance coefficient and D value during soybean germination under 180mmol/L NaCl stress;

2.6. Regression Analysis

Initially, the NaCl concentrations were simplified to 0, 1, 2, and 3, respectively. Selected indicators at different salt levels were analyzed through one-quadratic regression analysis using the relative values of each indicator at varying salt concentrations to derive equations and their coefficients (Table S5). Varieties with negative coefficients, as determined by the characteristics of the one-variable quadratic equation, exhibited a growth-promoting trend under low NaCl stress. Particularly, the RGR, RGE, and RGI indexes showed that over half of the varieties had negative coefficients, indicating that low NaCl concentrations had the most pronounced promotion effect on seed germination.
By utilizing the formula y=ax2+bx+c in conjunction with the coefficients provided in Table S5, the most precise screening concentrations for each germplasm were determined by predicting the half-lethal concentration (LC50) of each indicator at y=0.5. The outcomes are detailed in Table 4. The mean LC50 value for different soybean germplasms was 2.59, equivalent to 155.4 mmol/L, with a coefficient of variation of 0.20. LC50 values under RVI and RRL were relatively low at 1.30 and 1.59, corresponding to 78.00 mmol/L and 95.40 mmol/L, respectively, with coefficients of variation of 0.28 and 0.25. This suggests that the vigor index and radicle length were more sensitive to salt stress. LC50 values of RGE, RGR, and RTFW were relatively high, with mean values of 3.02, 3.90, and 3.01, and corresponding values of 181.20 mmol/L,234.00 mmol/L, and 180.60 mmol/L, and coefficients of variation of 0.24, 0.48, and 0.17. Significant variations were observed in the LC50 values among different germplasm and indicators. Consequently, the ideal screening concentration of NaCl for soybean germplasm was determined through the averaging of all LC50 values across the germplasm.

2.7. Cluster Analysis

A comprehensive assessment of plant salt tolerance during germination necessitates considering both seed germination under salt stress and subsequent seedling growth. Relying on a single NaCl concentration may not accurately and realistically portray the salt tolerance of soybean germplasm, given the substantial variability in salt tolerance among different varieties exposed to varying NaCl concentrations. The salt tolerance of 36 soybean germplasms was scrutinized through clustering based on mean values of the affiliation function values of RGR, RGE, RGI, RSGC, RTFW, RVI, and RRL across different salt stress levels. Employing a Euclidean distance of 0.3, the 36 soybean germplasms were categorized into four distinct classes, as illustrated in Figure 2 A. The figure delineated that QN-27, QN-35, and QN-36 exhibited high salt tolerance, while 10 germplasms, such as QN-3, QN-4, and QN-9, demonstrated moderate salt tolerance. Additionally, 13 germplasms, including QN-1, QN-6, and QN-33, displayed salt tolerance, whereas QN-2, QN-17, QN-19, and QN-32 were identified as salt-sensitive materials.
The analyzed LC50 of 2.59 was brought into the regression equation to obtain the relative values of each index under LC50. The relative values of each index were used to perform an affiliation function analysis, and the obtained affiliation function values (Table S6) were used for cluster analysis to obtain Figure 2B. At a Euclidean distance of 0.6, the 36 soybean germplasms were classified into four categories: eight materials, such as QN-35, QN-36, and QN-27, were salt-tolerant and high salt-tolerant lines; eleven germplasms, such as QN-6, QN-7, and QN-10, were moderately salt-tolerant materials; QN-1, QN-11, QN-18 and 14 other materials were salt-tolerant materials; QN-2, QN-17, QN-19 were salt-sensitive materials. Combining the two clustering methods, QN-27, QN-35, and QN-36 are highly salt-resistant materials, and QN-2, QN-17, and QN-19 are salt-sensitive materials.
Figure 3. Cluster analysis of salt tolerance in 36 soybean germplasms under NaCl stress.
Preprints 145290 g003
Note: (A) Cluster analysis under all salt concentration stresses; (B) LC50 cluster analysis. Hierarchical cluster analysis was performed using D value and Origin; the coordinate axis represents Euclidean distance.

3. Discussion

The regulation of salt tolerance in plants involves numerous genes and pathways, including factors like plant species, developmental stage, and salt concentrations[23,24]. Seed germination marks the inception of plant growth and development, representing a pivotal phase highly sensitive to salt stress. This sensitivity is predominantly evidenced by the diminished germination rate and the prolonged germination period. The presence of Na+ and Cl- ions induces lipid peroxidation in the cell membrane of the seed coat, leading to structural damage in plant cell membranes, interfering with cell division and other crucial activities. This process diminishes the permeability of the seed coat, consequently impeding water penetration into the cotyledons and hypocotyls, ultimately lowering the seed germination rate[25,26,27]. Salt stress disrupts the ionic balance in plants, where excessive Na+ penetration into plant cells hampers the uptake of essential ions like K+, Ca2+, and Mg2+, leading to detrimental effects on the cell membrane system, ion channels, and regulatory processes, thereby impairing the plant's physiological and metabolic functions. Salt-tolerant plants exhibit the capability to diminish intracellular salt levels by elevating the concentration of endogenous hormones such as abscisic acid and cytokinins in seeds, alongside boosting the activity of anti-salt enzymes. During this phase, salt-tolerant plants can modulate osmotic pressure and stimulate cell growth through upregulating the levels of endogenous hormones (abscisic acid and cytokinins) and intensifying the activity of anti-salt enzymes within seeds. This process aims to exclude or segregate Na+ and Cl- ions, thereby lowering the intracellular salt concentration. Concurrently, it enhances the absorption and storage of K+ while preserving the ionic equilibrium both intracellularly and extracellularly, enabling the plant to endure the challenges posed by salt stress [28,29,30].Researchers commonly utilize germination rate and germination percentage as fundamental metrics in studies assessing salt tolerance during soybean germination. Furthermore, some researchers opt to employ specific salt concentrations as part of the evaluation system for assessing soybean germination salt tolerance[31].Dependence on a sole evaluation index and salt tolerance assessment system carries limitations that can be overcome by analyzing the interrelation among multiple indicators and the soybean's resilience across various levels of salt stress.
The results indicated a lack of significant alterations in both germination potential and rate, while the salt tolerance coefficients of certain salt-tolerant materials notably rose under low salt concentration stress. This suggests that such stress levels can enhance water absorption, seed metabolism, and ultimately foster seed germination. As the salt concentration progressively rose, all indices, barring total dry weight, exhibited a consistent decline. Particularly, when the NaCl concentration surpassed 120 mM, the reduction in each index became more pronounced. Relative to the control group, the germination index, seed germination index, total fresh weight, relative water content, vigor index, and radicle length demonstrated notable decrements as the salt concentration escalated, signaling that intense salt stress surpassed the salt tolerance capacity of the majority of soybean germplasms. The multifactorial ANOVA results revealed a significant interaction effect among the germination period indicators, different varieties, and NaCl concentrations. Additionally, the principal component analysis of soybean germplasm under varying NaCl concentrations exhibited some inconsistencies. The ranking of the affiliation function varied across different germplasms. In correlation analysis, the lack of a significant relationship between RTDW and D value under different salt stress levels suggests that TDW is not a key index in identifying salt tolerance in soybean germination. Other indices should be prioritized as key factors in this identification system. Furthermore, germination indicators such as RGE, GGR, RGI, and RSGC displayed no or low correlation with biomass indicators like RTFW, RTDW, RRWC, and RL, indicating the independence of germination and biomass indicators from each other. The salt tolerance of 36 soybean germplasms was clustered and analyzed using the average affiliation function values of each index across varying NaCl concentrations. Based on their salt tolerance, they were classified into four groups: 10 high salt-tolerant germplasms (QN-27, QN-35, QN-36), 10 salt-sensitive germplasms (QN-2, QN-17, QN-19, QN-32), 10 moderately salt-tolerant germplasms (QN-3, QN-4, QN-9), and 13 salt-tolerant germplasms (QN-1, QN-6, QN-33).
The concentration of germplasm for salt tolerance identification should be chosen to ensure that the test indicator exhibits significant stress traits compared to the control and to confirm that it does not lead to near death of the test material and mask the true salt tolerance. Lemi-lethal concentration (LC50) is commonly used as a screening method for plant stress concentrations[32,33]. The average semi-lethal salt concentration in this study was 2.59, while the recommended NaCl concentration for screening soybean salt tolerance was 155.4 mmol/L. Shi et al. [34]studied the impact of 150 mmol/L NaCl on soybean germination. Moreover, Ravelombola et al.[35] established 150 mmol/L NaCl as a suitable concentration for assessing salt tolerance in cowpea. The salt tolerance of 36 soybean germplasm was assessed by clustering and analyzing the affiliation function values of each index under semi-lethal salt stress. Based on their salt tolerance, the 36soybean germplasm were divided into four groups: eight highly salt-tolerant (QN-35, QN-36, QN-27), eleven salt-sensitive (QN-2, QN-17, QN-19), eleven moderately salt-tolerant (QN-6, QN-7, QN-10), and fourteen salt-tolerant (QN-1, QN-11, QN-18). Additionally, salt tolerance was comprehensively evaluated by comparing the affiliation function values of each index under semi-lethal concentration stress with the average values under various NaCl concentrations. The results indicated a correlation in the screening outcomes of salt-tolerant and salt-sensitive germplasm among the 36 soybean germplasm resources, albeit with variations. These differences could stem from varying salt stress resistance levels across different soybean germplasm, showcasing stronger salt tolerance in some under low salt stress and in others under high salt stress. Nonetheless, screening salt-tolerant germplasm based on the average value of each index under differing salt stresses could potentially nullify the cumulative affiliation value of salt tolerance pre- and post-salt stress. In this study, germplasm screening was limited to the soybean germination phase to establish the salt tolerance threshold, ensuring the precision and dependability of the screened materials. Varieties exhibiting consistent performance in both phases can serve as valuable research subjects for investigating the molecular mechanisms of salt tolerance in soybean, thereby establishing the groundwork for understanding salt tolerance mechanisms and the selection and breeding of salt-tolerant soybean varieties.

4. Materials and Methods

4.1. Materials

The 36 soybean varieties (lines) utilized for testing were sourced from the Laboratory of Molecular Genetics and Crop Phenotypic Breeding of Soybean at Qingdao Agricultural University. Detailed information regarding these varieties (lines) can be found in the attached table S1.

4.2. Experimental Design

The experiment took place in October 2023 at the Laboratory of Molecular Genetics and Crop Phenotype Breeding of Soybean at Qingdao Agricultural University. Distilled water served as the control (0 mM), while solutions of 60 mmol/L NaCl simulated mild salt stress (60 mM), 120 mmol/L NaCl represented moderate salt stress (120 mM), and 180 mmol/L NaCl induced severe salt stress conditions (180 mM).
High-quality soybean seeds, free from insects and physical damage, were carefully selected, spread in Petri dishes, and placed within a desiccator. A 5.25% sodium hypochlorite solution was carefully added to the desiccator along with 5 ml of concentrated hydrochloric acid (36%) to initiate a gradual reaction producing chlorine gas. The desiccator was securely sealed with Vaseline, placed in a fume cupboard for 16 hours of sterilization. Following sterilization, the seeds underwent 2-3 rinses with distilled water before being arranged in a square Petri dish lined with a double layer of filter paper. Twenty-five seeds were evenly distributed, and repeated three times. The Petri dishes were incubated at a constant temperature of 25°C in an incubator for 7 days. Observations were conducted every 24 hours. The culture solution was daily supplemented with an equal concentration to maintain a moist environment. Any moldy seeds identified during the germination test were promptly removed and documented. If any solution emitted an unusual odor, the deteriorated solution was promptly replaced with fresh solution. If mold growth is evident in the germination bed, the germination bed needs to be replaced immediately. The germination progress was monitored continuously for 7 days, with the standard being root growth reaching half the seed length.
The number of germination was investigated every day until the 7thd. The related phenotypic indexes and formulas were determined as follows (See Supplementary Table S7 for the meaning of the acronyms):
Germination Energy (GE), GE/%=number of germinated seeds on the 4th day/number of seeds for test × 100;
Germination Rate (GR), GR/% = number of germinated seeds on day 7/number of seeds for test × 100;
Germination Index (GI), GI=∑(Gt/Dt), (Gt is the number of germinated seeds on day t, Dt is the corresponding number of days of germination);
Seed Germination Coefficient (SGC), SGC = 1.00 × nd2 + 0.70 × nd4 + 0.30 × nd6, (nd2, nd4, nd6 refer to the germination rate of seeds on days 2, 4 and 6, respectively);
Three representative bean sprouts were selected on day 7 to measure their Total Fresh Weight (TFW) and Root Length (RL); the samples were baked in an oven at 80°C until constant weight, and their Total Dry Weight (TDW) was determined;
Relative Water Content (RWC), RWC/%=(TFW-TDW)/TFW×100;
Vigor Index (VI), VI=GI×RL;
Salt tolerance Coefficient (SC) = treatment value/control value.

4.3. Data Statistics and Analysis

The data were organized using Microsoft Excel 2021. Origin2021 software was utilized for data plotting and systematic cluster analysis. IBM SPSS Statistics 26.0 was employed for tasks such as principal component analysis, Pearson correlation analysis, analysis of variance, affiliation function analysis, and quadratic regression analysis. Through these methodologies, the salt tolerance of the test materials was comprehensively assessed.
The formula of the affiliation function analysis was as follows:
The degree of affiliation μ(Xi) is calculated as follows: μ(Xi) = (Xi - Xmin) / (Xmax - Xmin), where Xi represents the ith composite index, Xmin denotes the minimum value of the ith composite index, and Xmax signifies the maximum value of the ith composite index.
The weight of each composite indicator (Wi) is determined by the formula: Wi = Pi / (∑Pi), where Wi represents the weight of the ith composite indicator among all composite indicators, and Pi stands for the contribution rate of the ith composite indicator for each variety or line.
The comprehensive evaluation value (D value) is computed as: D value =∑[μ(Xi) × Wi], where D value signifies the comprehensive evaluation value of salt tolerance of varieties or lines calculated using the comprehensive indexes under salt stress. A higher D value indicates superior composite traits.
Following the calculation of the affiliation function values for each soybean germplasm under various salt concentrations, the average value was derived, and systematic cluster analysis was conducted based on this average value. Subsequently, a one-way quadratic regression analysis of the relative values of each index concerning salt concentration was conducted using SPSS 26.0, represented by the equation y = ax² + bx + c, where a, b, and c denote the equation coefficients.
Utilizing the obtained quadratic regression equation, the LC50 concentration (the salt concentration under semi-lethal conditions) for each relative index at Y=0.5 was determined to assess the salt tolerance level of different soybean germplasms under semi-lethal conditions. The arithmetic mean of the LC50 values was calculated to ascertain the LC50 concentration, and these mean LC50 values were incorporated into a quadratic equation to derive the relative values of each index under the LC50 concentration. Subsequently, an affiliation function analysis was performed on these values, followed by a systematic cluster analysis. The results of both cluster analyses were amalgamated to validate the identified concentrations for a more comprehensive evaluation of the salt tolerance levels among different varieties.

5. Conclusions

Through evaluating the salt tolerance of diverse soybean germplasm during the germination phase, we identified soybean materials suitable for cultivation in saline soil. Mild salt stress levels enhanced soybean germination, while high NaCl concentrations notably hindered soybean seed germination. The germination and biomass indexes exhibited independence from each other, with GR, GE, GI, RVI, SGC, TFW, and RL identified as crucial parameters for characterizing salt tolerance during the soybean germination phase. Regression analysis indicated that the optimal NaCl concentration for screening salt tolerance in soybean was 155.4 mmol/L. A comprehensive comparison of affiliation function and cluster analysis revealed QN-27, QN-35, and QN-36 as highly salt-tolerant materials, while QN-2, QN-17, and QN-19 were identified as salt-sensitive materials.

Supplementary Materials

The following supporting information can be downloaded at the website of this paper posted on Preprints.org, Table S1: Schedule S1 36 soybean germplasm names; Table S2: Membership function values and comprehensive ranking of soybean germination stage under 60mM NaCl concentration; Table S3: Membership function values and comprehensive ranking of soybean germination stage under 120mM NaCl concentration; Table S4: Membership function values and comprehensive ranking of soybean germplasm under 180mM NaCl concentration; Table S5: Coefficient table of quadratic regression equation in one variable; Table S6: Membership function values and comprehensive ranking of soybean germplasm under semi lethal concentration (LC50); Table S7: The full names of abbreviations appearing in the article

Author Contributions

Conceptualization, L.H. and L.Z.; methodology, L.F.; software, L.H.; validation, L.H., R.G. and D.Z.; formal analysis, L.H.; investigation, W.F.; resources, L.Z.; data curation, L.H.; writing—original draft preparation, L.H.; writing—review and editing, L.H. and D.Z; visualization, Y.L.; supervision, C.H.; project administration, L.Z.; funding acquisition, L.Z. All authors have read and agreed to the published version of the manuscript.

Funding

National Key Research and Development Program of China (2022YFD2300101-1), Seed-Industrialized Development Program in Shandong Province (2021LZGC003; 2023LZGC008-001), Science & Technology Specific Projects in Agricultural High-tech Industrial Demonstration Area of the Yellow River Delta(2022SZX18), Shandong provincial Natural Science Foundation (ZR2022MC043), Qingdao Science and Technology Benefit the People Demonstration Project(23-2-8-xdny-10-nsh).

Data Availability Statement

Not applicable.

Conflicts of Interest

The authors declare no conflicts of interest.

References

  1. Kim, M.Y.; Van, K.; Kang, Y.J.; Kim, K.H.; Lee, S.-H. Tracing Soybean Domestication History: From Nucleotide to Genome. Breed. Sci. 2012, 61, 445–452. [Google Scholar] [CrossRef] [PubMed]
  2. Wang, X.; Chen, L.; Ma, J. Genomic Introgression through Interspecific Hybridization Counteracts Genetic Bottleneck during Soybean Domestication. Genome Biol 2019, 20, 22. [Google Scholar] [CrossRef] [PubMed]
  3. Hartman, G.L.; West, E.D.; Herman, T.K. Crops That Feed the World 2. Soybean—Worldwide Production, Use, and Constraints Caused by Pathogens and Pests. Food Sec. 2011, 3, 5–17. [Google Scholar] [CrossRef]
  4. Zhang, J.; Yang, D.; Li, M.; Shi, L. Metabolic Profiles Reveal Changes in Wild and Cultivated Soybean Seedling Leaves under Salt Stress. PLoS One 2016, 11, e0159622. [Google Scholar] [CrossRef] [PubMed]
  5. Li, Y.; Yang, Y.; Li, J.X.; Si, w. Development trends and policy suggestions of soybean industry in 2024. Soybean Science & Technology 2024, 1, 1–5. (in Chinese). [Google Scholar]
  6. Foti, C.; Khah, E.M.; Pavli, O.I. Germination Profiling of Lentil Genotypes Subjected to Salinity Stress. Plant Biol J 2019, 21, 480–486. [Google Scholar] [CrossRef] [PubMed]
  7. Gobade, A.; Arathi, S.; Gijare, S.; Pawar, D.; Patil, A.S. Evaluating Salt Tolerance in Soybean Core Collection: Germination Response under Salinity Stress. Genet Resour Crop Evol 2024. [Google Scholar] [CrossRef]
  8. Munns, R.; Tester, M. Mechanisms of Salinity Tolerance. Annu Rev Plant Biol 2008, 59, 651–681. [Google Scholar] [CrossRef] [PubMed]
  9. Qadir, M.; Quillérou, E.; Nangia, V.; Murtaza, G.; Singh, M.; Thomas, R.J.; Drechsel, P.; Noble, A.D. Economics of Salt-induced Land Degradation and Restoration. Natural Resources Forum 2014, 38, 282–295. [Google Scholar] [CrossRef]
  10. Jamil, A.; Riaz, S.; Ashraf, M.; Foolad, M.R. Gene Expression Profiling of Plants under Salt Stress. Critical Reviews in Plant Sciences 2011, 30, 435–458. [Google Scholar] [CrossRef]
  11. Chen, X.; Cheng, X.; Zhu, H.; Bañuelos, G.; Shutes, B.; Wu, H. Influence of Salt Stress on Propagation, Growth and Nutrient Uptake of Typical Aquatic Plant Species. Nordic Journal of Botany 2019, 37, njb.02411. [Google Scholar] [CrossRef]
  12. Soltabayeva, A.; Ongaltay, A.; Omondi, J.O.; Srivastava, S. Morphological, Physiological and Molecular Markers for Salt-Stressed Plants. Plants 2021, 10, 243. [Google Scholar] [CrossRef] [PubMed]
  13. Nguyen, N.T.; Vu, H.T.; Nguyen, T.T.; Nguyen, L.-A.T.; Nguyen, M.-C.D.; Hoang, K.L.; Nguyen, K.T.; Quach, T.N. Co-expression of Arabidopsis AtAVP1 and AtNHX1 to Improve Salt Tolerance in Soybean. Crop Science 2019, 59, 1133–1143. [Google Scholar] [CrossRef]
  14. Rasheed, A.; Raza, A.; Jie, H.; Mahmood, A.; Ma, Y.; Zhao, L.; Xing, H.; Li, L.; Hassan, M.U.; Qari, S.H.; et al. Molecular Tools and Their Applications in Developing Salt-Tolerant Soybean (Glycine Max L.) Cultivars. Bioengineering 2022, 9, 495. [Google Scholar] [CrossRef]
  15. Verma, O.; Sharma, S.; Kumar, V.; Singh, T.; Kumar, R.; Auji, R. Salinity Stress Effect on Staple Food Crops and Novel Mitigation Strategies. Biologia 2024, 79, 2359–2374. [Google Scholar] [CrossRef]
  16. Zhang, W.; Liao, X.; Cui, Y.; Ma, W.; Zhang, X.; Du, H.; Ma, Y.; Ning, L.; Wang, H.; Huang, F.; et al. A Cation Diffusion Facilitator, GmCDF1, Negatively Regulates Salt Tolerance in Soybean. PLoS Genet 2019, 15, e1007798. [Google Scholar] [CrossRef] [PubMed]
  17. Zuffo, A.M.; Steiner, F.; Aguilera, J.G.; Teodoro, P.E.; Teodoro, L.P.R.; Busch, A. Multi-trait Stability Index: A Tool for Simultaneous Selection of Soya Bean Genotypes in Drought and Saline Stress. J Agronomy Crop Science 2020, 206, 815–822. [Google Scholar] [CrossRef]
  18. Wang, B.; Dou, W.; Chen, J.; Chen, J.W.; La, J, B. Characteristics of Spatial-temporal Dynamics of Soil Salinity in the YellowRiver Delta and Zoning and High Quality Utilization of Saline Soil. Geoscience 2024, 1–13. (in Chinese). [Google Scholar]
  19. Cao, D.; Yan, Y.L.; Xu, D.H. Assessment of Salt Tolerance and Analysis of the Salt Tolerance Gene Ncl in Indonesian Soybean Germplasm. Plant Genet. Resour. 2019, 17, 265–271. [Google Scholar] [CrossRef]
  20. Zhou, X.; Tian, Y.; Qu, Z.; Wang, J.; Han, D.; Dong, S. Comparing the Salt Tolerance of Different Spring Soybean Varieties at the Germination Stage. Plants 2023, 12, 2789. [Google Scholar] [CrossRef]
  21. Yu, R.; Wang, G.; Yu, X.; Li, L.; Li, C.; Song, Y.; Xu, Z.; Zhang, J.; Guan, C. Assessing Alfalfa ( Medicago Sativa L.) Tolerance to Salinity at Seedling Stage and Screening of the Salinity Tolerance Traits. Plant Biol J 2021, 23, 664–674. [Google Scholar] [CrossRef] [PubMed]
  22. Li, W.; Zhang, H.; Zeng, Y.; Xiang, L.; Lei, Z.; Huang, Q.; Li, T.; Shen, F.; Cheng, Q. A Salt Tolerance Evaluation Method for Sunflower (Helianthus Annuus L.) at the Seed Germination Stage. Sci Rep 2020, 10, 10626. [Google Scholar] [CrossRef] [PubMed]
  23. Liu, T.; Ye, N.; Wang, X.; Das, D.; Tan, Y.; You, X.; Long, M.; Hu, T.; Dai, L.; Zhang, J.; et al. Drought Stress and Plant Ecotype Drive Microbiome Recruitment in Switchgrass Rhizosheath. JIPB 2021, 63, 1753–1774. [Google Scholar] [CrossRef] [PubMed]
  24. Shahid, M.A.; Sarkhosh, A.; Khan, N.; Balal, R.M.; Ali, S.; Rossi, L.; Gómez, C.; Mattson, N.; Nasim, W.; Garcia-Sanchez, F. Insights into the Physiological and Biochemical Impacts of Salt Stress on Plant Growth and Development. Agronomy 2020, 10, 938. [Google Scholar] [CrossRef]
  25. Dabravolski, S.A.; Isayenkov, S.V. The Regulation of Plant Cell Wall Organisation under Salt Stress. Front. Plant Sci. 2023, 14, 1118313. [Google Scholar] [CrossRef] [PubMed]
  26. Liu, J.; Shao, Y.; Feng, X.; Otie, V.; Matsuura, A.; Irshad, M.; Zheng, Y.; An, P. Cell Wall Components and Extensibility Regulate Root Growth in Suaeda Salsa and Spinacia Oleracea under Salinity. Plants 2022, 11, 900. [Google Scholar] [CrossRef] [PubMed]
  27. Xiao, F.; Zhou, H. Plant Salt Response: Perception, Signaling, and Tolerance. Front. Plant Sci. 2023, 13, 1053699. [Google Scholar] [CrossRef]
  28. Kim, S.T.; Sang, M.K. Enhancement of Osmotic Stress Tolerance in Soybean Seed Germination by Bacterial Bioactive Extracts. PLoS ONE 2023, 18, e0292855. [Google Scholar] [CrossRef]
  29. Meng, X.; Zhou, J.; Sui, N. Mechanisms of Salt Tolerance in Halophytes: Current Understanding and Recent Advances. Open Life Sciences 2018, 13, 149–154. [Google Scholar] [CrossRef]
  30. Wang, D.; Gao, Y.; Sun, S.; Lu, X.; Li, Q.; Li, L.; Wang, K.; Liu, J. Effects of Salt Stress on the Antioxidant Activity and Malondialdehyde, Solution Protein, Proline, and Chlorophyll Contents of Three Malus Species. Life 2022, 12, 1929. [Google Scholar] [CrossRef] [PubMed]
  31. Qu, Y.; Guan, R.; Bose, J.; Henderson, S.W.; Wege, S.; Qiu, L.; Gilliham, M. Soybean CHX-type Ion Transport Protein GmSALT3 Confers Leaf Na+ Exclusion via a Root Derived Mechanism, and Cl Exclusion via a Shoot Derived Process. Plant Cell & Environment 2021, 44, 856–869. [Google Scholar] [CrossRef]
  32. Kan, G.; Zhang, W.; Yang, W.; Ma, D.; Zhang, D.; Hao, D.; Hu, Z.; Yu, D. Association Mapping of Soybean Seed Germination under Salt Stress. Mol Genet Genomics 2015, 290, 2147–2162. [Google Scholar] [CrossRef] [PubMed]
  33. Wu, H.; Guo, J.; Wang, C.; Li, K.; Zhang, X.; Yang, Z.; Li, M.; Wang, B. An Effective Screening Method and a Reliable Screening Trait for Salt Tolerance of Brassica Napus at the Germination Stage. Front. Plant Sci. 2019, 10, 530. [Google Scholar] [CrossRef] [PubMed]
  34. Shi, M.; Liao, X.; Ye, Q.; Zhang, W.; Li, Y.; Bhat, J.A.; Kan, G.; Yu, D. Linkage and Association Mapping of Wild Soybean (Glycine Soja) Seeds Germinating under Salt Stress. Journal of Integrative Agriculture 2022, 21, 2833–2847. [Google Scholar] [CrossRef]
  35. Ravelombola, W.; Dong, L.; Barickman, T.C.; Xiong, H.; Olaoye, D.; Bhattarai, G.; Zia, B.; Alshaya, H.; Alatawi, I.; Shi, A. Evaluation of Salt Tolerance in Cowpea at Seedling Stage. Euphytica 2021, 217, 116. [Google Scholar] [CrossRef]
Figure 1. Comparison of indicators of soybean germination under different levels of salt stress.
Preprints 145290 g001
Figure 2. Correlation analysis between various indicators and D values during soybean germination under different degrees of salt stress.
Preprints 145290 g002
Table 1. Descriptive analysis of indicators of soybean germination under different levels of salt stress.
Treatment index GE/% GR/% GI SGC TFW/g TDW/g RWC/% VI RL/cm
0mM Max 100.00 100.00 37.13 2.00 3.77 0.71 89.34 934.42 29.49
Min 39.06 71.67 5.39 0.42 1.85 0.20 76.32 57.00 9.28
Mean 83.36 92.58 23.45 1.19 2.64 0.42 83.99 408.26 16.69
SD 15.97 8.96 7.53 0.39 0.44 0.12 2.73 196.27 4.33
CV 0.19 0.10 0.30 0.33 0.17 0.23 0.03 0.47 0.26
60mM Max 100.00 100.00 29.33 1.85 3.17 0.72 86.35 506.23 20.10
Min 29.81 59.64 6.66 0.42 1.36 0.18 71.90 44.26 6.64
Mean 78.09 87.66 20.54 1.03 2.22 0.44 80.08 251.17 11.77
SD 17.67 11.08 6.07 0.35 0.41 0.12 3.19 118.64 3.28
CV 0.23 0.13 0.32 0.34 0.18 0.26 0.04 0.48 0.28
120mM Max 98.33 100.00 26.26 1.53 2.49 0.73 78.49 212.73 9.07
Min 18.33 32.09 4.10 0.29 1.15 0.29 65.14 9.66 2.36
Mean 69.31 79.31 16.33 0.83 1.68 0.44 73.93 100.77 5.83
SD 20.97 18.73 5.77 0.28 0.31 0.10 2.80 51.44 1.51
CV 0.30 0.24 0.35 0.34 0.18 0.27 0.04 0.51 0.26
180 mM Max 78.27 98.13 15.79 0.86 2.13 0.71 76.34 58.41 3.90
Min 0.00 10.83 1.88 0.09 0.85 0.21 55.58 4.60 1.52
Mean 38.47 56.07 8.65 0.45 1.34 0.43 68.22 25.35 2.79
SD 19.06 22.94 3.86 0.20 0.31 0.11 3.12 14.14 0.68
CV 0.50 0.41 0.45 0.45 0.23 0.28 0.05 0.56 0.24
Note: This experimental data is based on the experimental results of 36 soybean varieties (strains) under different salt treatments. The values are the maximum (Max), minimum (Min), mean (Mean), standard deviation (SD), and coefficient of variation (CV) of all indicators of the tested materials at different concentrations. GR: Germination rate; GE: Germination energy; SGC: Seed germination coefficient; GI: Germination index; TFW: Total fresh weight; TDW: Total dry weight; RL: Root length; RWC: Relative water content; VI: Vigor index.
Table 2. Multifactor analysis of variance.
Index Germplasm NaCl concentration Germplasm and NaClconcentration
RGE F 27.176 300.58 2.199
Sig <0.01 <0.01 <0.01
RGR F 22.849 171.023 2.193
Sig <0.01 <0.01 <0.01
RGI F 39.542 497.529 2.376
Sig <0.01 <0.01 <0.01
RSGC F 29.284 469.048 2.124
Sig <0.01 <0.01 <0.01
RTFW F 23.385 612.680 1.989
Sig <0.01 <0.01 <0.01
RTDW F 34.640 1.077 1.473
Sig <0.01 >0.05 <0.01
RRWC F 7.484 443.229 1.224
Sig <0.01 <0.01 <0.01
RVI F 16.378 786.579 3.591
Sig <0.01 <0.01 <0.01
RRL F 17.471 1388.012 5.410
Sig <0.01 <0.01 <0.01
Note: The F-test was used for the analysis of variance. The F value in the result represents a specific value obtained by the F test formula, and the corresponding p-value is obtained according to the numerical table, that is, sig. A signal (sig) value < 0.05 indicates an influence on the result; otherwise, there is no influence. RGR: Relative germination rate; RGE: Relative germination energy; RSGC: Relative seed germination coefficient; RGI: Relative germination index; RTFW: Relative total fresh weight; RTDW: Relative total dry weight; RRL: Relative radicle length; RRWC: Relative water content; RVI: Relative vigor index.
Table 3. Factor score and contribution rate of each principal component in the germination period.
Item Trait 60 mM 120 mM 180 mM
CS1 CS2 CS3 CS1 CS2 CS3 CS1 CS2 CS3
Eigenverctor RGE 0.108 0.883 0.119 0.941 0.069 -0.014 0.919 0.009 0.203
RGR -0.184 0.657 -0.464 0.899 0.179 -0.046 0.771 -0.234 0.113
RGI 0.089 0.599 0.642 0.847 0.162 0.299 0.186 -0.037 -0.177
RSGC 0.306 0.850 0.168 0.815 0.248 0.218 0.897 -0.006 0.020
RTFW 0.650 0.021 0.591 0.143 0.550 0.655 0.117 0.296 0.867
RTDW -0.277 0.053 0.874 0.151 -0.233 0.935 0.201 -0.352 0.878
RRWC 0.837 -0.001 -0.211 0.241 0.808 -0.361 0.000 -0.172 0.041
RVI 0.861 0.329 0.203 0.466 0.796 0.190 -0.053 0.833 -0.232
RRL 0.915 0.075 -0.112 0.037 0.925 0.015 0.001 0.869 0.196
Eigenvalue 3.484 2.114 1.616 3.395 2.623 1.609 3.727 2.020 1.716
Contribution (%) 38.708 23.493 17.956 37.728 29.141 17.877 41.414 22.449 19.065
Cumulative contribution (%) 38.708 62.201 80.157 37.728 66.869 84.746 41.414 63.863 82.928
Weight coefficient (%) 40.520 33.400 26.080 44.518 34.386 21.095 49.940 27.070 22.990
Note: Using principal component analysis, CS1、CS2、CS3 are the principal component values corresponding to each trait. RGR: Relative germination rate; RGE: Relative germination energy; RSGC: Relative seed germination coefficient; RGI: Relative germination index; RTFW: Relative total fresh weight; RTDW: Relative total dry weight; RRL: Relative radicle length; RRWC: Relative water content; RVI: Relative vigor index.
Table 4. Salt-tolerant half-lethal concentration of soybean.
Germplasm Salt-tolerant half-lethal Average value
RGE RGR RGI RSGC RTFW RVI RRL
QN-1 3.16 3.38 2.51 2.20 3.66 0.93 1.17 2.43
QN-2 0.97 1.78 2.29 1.62 2.49 1.29 1.63 1.73
QN-3 3.25 2.52 2.28 2.48 3.76 1.62 2.10 2.57
QN-4 2.89 3.38 2.59 2.96 4.50 2.14 2.54 3.00
QN-5 2.71 2.87 2.36 2.67 2.47 1.65 2.10 2.40
QN-6 2.90 5.67 2.65 3.08 2.70 1.18 1.40 2.80
QN-7 3.70 5.08 2.80 2.52 2.94 1.27 1.58 2.84
QN-8 2.68 2.93 2.57 2.70 2.70 1.23 1.29 2.30
QN-9 2.84 2.96 2.62 1.18 2.99 1.51 1.76 2.27
QN-10 3.43 6.73 2.34 3.92 4.32 1.19 1.90 3.40
QN-11 2.32 2.49 2.38 2.32 2.54 1.90 2.33 2.33
QN-12 3.51 3.90 3.09 2.95 2.73 1.78 1.81 2.82
QN-13 2.85 4.63 2.59 2.94 2.74 1.11 1.36 2.60
QN-14 3.42 3.50 2.99 2.83 3.00 0.49 1.18 2.49
QN-15 2.87 4.53 2.77 2.97 3.07 1.47 1.77 2.78
QN-16 5.74 9.46 3.80 4.06 3.28 1.33 1.66 4.19
QN-17 1.88 1.74 1.66 1.54 2.69 0.90 1.55 1.71
QN-18 2.52 2.54 2.23 2.38 3.18 1.07 1.49 2.20
QN-19 2.54 2.58 2.29 1.97 2.31 0.93 1.13 1.96
QN-20 3.04 11.24 2.54 3.16 3.03 1.72 2.16 3.84
QN-21 3.29 3.47 3.12 2.85 3.18 1.45 1.51 2.69
QN-22 2.82 3.16 2.43 2.79 2.94 1.19 1.48 2.40
QN-23 2.50 2.91 2.64 2.50 3.05 1.46 1.84 2.41
QN-24 2.71 4.03 2.31 2.24 2.86 0.92 1.26 2.33
QN-25 3.77 3.35 3.15 3.51 2.55 1.01 1.22 2.65
QN-26 2.77 3.86 2.75 2.85 2.99 1.68 1.83 2.67
QN-27 3.59 2.34 3.27 3.53 3.34 1.78 1.43 2.75
QN-28 2.79 3.92 2.70 2.04 2.92 1.01 1.37 2.39
QN-29 2.37 2.72 2.33 2.15 2.60 1.37 1.69 2.17
QN-30 3.47 3.48 3.01 3.35 3.40 0.86 0.93 2.65
QN-31 3.23 3.32 2.70 2.38 2.87 1.06 1.33 2.41
QN-32 2.85 3.59 2.34 2.18 2.47 0.89 1.11 2.20
QN-33 2.82 3.53 2.65 2.46 2.39 1.07 1.22 2.31
QN-34 2.67 2.89 2.46 2.43 2.27 1.06 1.14 2.13
QN-35 4.09 5.06 2.75 2.86 3.90 2.03 2.47 3.31
QN-36 3.85 4.96 3.42 3.08 3.65 1.41 1.65 3.15
Mean 3.02 3.90 2.65 2.66 3.01 1.30 1.59 2.59
CV 0.24 0.48 0.15 0.23 0.17 0.28 0.25 0.20
Note: The values are the half-lethal salt concentrations x when each indicator is 0.5(Y=0.5), obtained from the quadratic function (Y = ax2+bx+c) in Supplementary Table S5.
Disclaimer/Publisher’s Note: The statements, opinions and data contained in all publications are solely those of the individual author(s) and contributor(s) and not of MDPI and/or the editor(s). MDPI and/or the editor(s) disclaim responsibility for any injury to people or property resulting from any ideas, methods, instructions or products referred to in the content.
Copyright: This open access article is published under a Creative Commons CC BY 4.0 license, which permit the free download, distribution, and reuse, provided that the author and preprint are cited in any reuse.
Prerpints.org logo

Preprints.org is a free preprint server supported by MDPI in Basel, Switzerland.

Subscribe

Disclaimer

Terms of Use

Privacy Policy

Privacy Settings

© 2025 MDPI (Basel, Switzerland) unless otherwise stated