
Submitted:
04 January 2025
Posted:
07 January 2025
You are already at the latest version
Abstract
The development of sustainable societies relies upon the institutional structures that govern the relationship between economic systems and environmental leadership. In this study, we engage with the juxtaposition between inclusive and extractive institutions, as potential molders of the trajectory of sustainability. Featuring governance indicators and economic metrics, we explore the impact of institutional inclusiveness and extractiveness on sustainability outcomes. Inclusiveness, which enables the proposperity of collective well-being through democratic governance, legal integrity, and innovation, is posited as an affirmative force for sustainability. In contrast, extractive institutions, which concentrate power and resources, hinder the realization of sustainable development by perpetuating inequality and exploitation. This paper suggests a statistic pipeline, comprised of econometric regression, machine learning models, and clustering analysis to assess the impact of governance, economic performance, on sustainability indices. We posit that inclusiveness serves as a potent driver for sustainability, particularly when coupled with economic resources, whereas extractiveness leads to the attenuation of sustainable progress. Through this work, we aim to gauge how institutions can either hinder or propel the material conditions necessary for the achievement of sustainability.
Keywords:
sustainability
; institutions
; inclusiveness
; extractiveness
; OLS
; machine learning
1. Introduction
In their work Why Nations Fail, Daron Acemoglu and James A. Robinson [1] introduce a taxonomic categorization of inclusive and extractive institutions. This distinction shows a profound perspicacity in the drivers of prosperity and stagnation within nations. This conceptual categorization lays the structural foundations of economic development and exposes the historical contingencies that have shaped the development trajectories of nations.
Inclusive institutions, as the concrete manifestation of freedom and equality, promote the flourishing of economic opportunities by ensuring that property rights, access to markets, and legal equality are accessible to all individuals. These institutions function as an expansive system that enables broad participation in economic and political decision-making, which, in turn, facilitates the development of human potential and the sustainable growth of society. In this sense, inclusive institutions are not merely neutral but actively advocate for innovation by ensuring a fair distribution of power and resources and preventing the consolidation of control in the hands of a few elites. They contribute to economic progress by distributing opportunities for social and economic mobility to the development of new ideas and technologies [2]. These concepts, when examined analytically, proclaim the precarious conjunction between political power, economic development, and societal inequality, and provide us with a framework through which the historical and contemporary dynamics of prosperity and poverty can be understood.
Inclusive institutions represent the realization of human freedom and equality within the socio-economic order. They are characterized by the broad distribution of opportunities, where power is decentralized and access to economic resources is afforded to the many rather than the few. In this system, property rights are safeguarded, markets are accessible, and social mobility is promoted. [2] maintain that these institutions are decisive for promoting innovation, economic growth, and sustained development, as they create a fertile ground for the flourishing of creative potential and entrepreneurship [3]. From a development perspective, inclusive institutions are the embodiment of the universal will, where the individual’s potential for self-realization is actualized within the context of a just and equitable society. They represent the sublation of inequality through the establishment of a society where power and opportunity are widely distributed, with the goal of bettering the conditions for social progress.
In contrast, extractive institutions are the manifestation of a restricted order, where power and wealth are concentrated in the hands of a narrow elite. These institutions are designed to extract resources from the broader population, leading to economic stagnation and inequality. They are often perpetuated by political structures that concentrate power within a select circle, subordinating economic institutions to serve the interests of the elite few. According to [2], extractive institutions stifle innovation, restrict access to opportunities, and confine the benefits of economic development to a small privileged group, while the majority is left in poverty and stagnation [3,4]. Extractive institutions represent the alienation of the many, where the individual’s potential is repressed in favor of an entrenched elite. They hinder historical growth by perpetuating inequality and stifling the capacity for collective progress [5].
The framework of [1], while elucidating in its analysis of the rational of inclusive and extractive institutions and their role in economic outcomes relies on variables such as GDP per capita, polity scores, and historical colonial data, but remains incomplete in its conceptual breadth by relapsing sustainability to a lower order. The discourse, as it stands, is circumscribed by its focus on the immediate mechanisms of growth, innovation, and disparity, yet fails to ascend to the higher synthesis wherein these institutional dynamics are reconciled with the imperatives of environmental and social sustainability. We live in a time characterized by a panoply of global crises: climate change, resource depletion, and entrenched inequalities, neglecting the environmental factor shows a limitation in the pipeline. The framework, in privileging the economic as the thesis, inadvertently sublates the ecological and the social, thereby precluding the holistic comprehension required for addressing the totality of contemporary development challenges. Thus, it becomes imperative to integrate sustainability as a necessary moment within the conceptual schema of institutional effectiveness. Such an integration would not merely append sustainability as an external consideration but would reconstitute the framework itself, elevating it to enclose the unity of economic growth, ecological balance, and societal welfare, thereby achieving a more universal and concrete realization of institutional theory.
2. Literature Review
2.1. Institutional Drivers of National Growth
Institutions act as vital mediators of economic, social, and political realities, serving as the structural essence through which the underlying forces of development materialize. They represent the synthesis of incentives and constraints that shape the actions of economic agents and the outcomes that follow. Thus, their role is not merely auxiliary but is fundamental to the trajectory of human progress. The primacy of institutions in economic development lies in their ability to condition the very essence of growth itself. Differences in economic institutions constitute the fundamental determinant of disparities in development, as they govern the incentives and constraints that direct economic activity and expansion [6,7].
Institutions that uphold property rights manifest a profound influence on long-term growth, sustaining investment and financial development by providing stability and security. Conversely, contracting institutions, while significant, primarily mold the forms of financial intermediation, and harbor a hierarchy of institutional influence [8].
The juxtaposition of formal and informal institutions emerges as an important to tool to assess development. Informal institutions, rooted in private constraints and shared norms, wield a potent influence as determinants of progress. Formal institutions achieve efficacy only when grounded in these informal frameworks, which proves an impossibility of facile transplantation of institutional models to disparate contexts [9]. This endogeneic contextualization of institutions further corroborates their pertinent belonging within specific historical and cultural milieus. Their functionality cannot be abstracted from the conditions in which they evolve, subsequently making universal institutional paradigms restricted [10].
The social trust reposed in institutions resonates with the values that individuals and communities prioritize. Trust thrives in contexts that harbor stability and tradition but diminishes when independence and transformative change are paramount. This divergence is further accentuated across religious and political spectrums, where values and institutional legitimacy are interdependent [11]. In the political domain, institutions that sustain economic growth emerge only under specific configurations of power. When political institutions allocate authority to groups committed to the enforcement of property rights and the restraint of power, economic institutions achieve their highest potential [6,7].
2.2. Theoretical Characterizations of Inclusive and Extractive Instituions
"Inclusive economic institutions, are those that allow and encourage participation bythe great mass of people in economic activities that make best use of their talents and skills and that enable individuals to make the choices they wish. To be inclusive, economic institutions must feature secure private property, an unbiased system of law, and a provision of public services that provides a level playing field in which people can exchange and contract; it also must permit the entry of new businesses and allow people to choose their careers." [1]
According to this definition, Inclusive economic institutions, in their essence, represent the structural apotheosis of a system that empowers the majority to engage fully in the economic sphere. They manifest the compliance of individual potential and collective prosperity, and warrant the full expression of talents and capacities while preserving the freedom of personal choice. Such institutions, to fulfill their inclusive character, must rest upon the secure foundation of private property rights, an impartial legal framework, and the equitable provision of public services. These elements establish the conditions for a balanced and just arena of exchange and cooperation, wherein individuals and enterprises alike can thrive. To achieve this, inclusivity necessitates an openness to innovation and renewal, signified by the unrestricted entry of new enterprises and the unimpeded determination of career paths. Thus, inclusive economic institutions reify not merely a system of facilitation but a dynamic realization of freedom, equality, and progress within the economic order.
Extractive political institutions concentrate power in the hands of a narrow elite and place few constraints on the exercise of this power. Economic institutions are then often structured by this elite to extract resources from the rest of the society. Extractive economic institutions thus naturally accompany extractive political institutions. In fact, they must inherently depend on extractive political institutions for their survival [1].
Extractive institutions constitute a mode of organization wherein the few, empowered by their dominion, subordinate the many to their exploitative designs. In such systems, access to political authority and economic opportunity is monopolized, concentrating power in the hands of an elite that wields it for the extraction of wealth from the broader populace. The governing principle here is not the recognition of individuals as citizens, bearing equal rights and dignity, but rather their subjugation as instruments of the elite’s enrichment [1,6]. The stultifying nature of extractive institutions finds its most pernicious expression in their antipathy toward innovation and growth. For such systems, the dynamic process of creative destruction wherein established paradigms give way to progress and technological advancement represents not an opportunity but a threat to people in power. This fear of destabilization leads to a deliberate suppression of progress, exemplified in historical instances such as Elizabeth I’s opposition to the knitting machine, a device whose potential for economic transformation was rejected in favor of preserving the status quo [1].
Whether a certain nation embraces extractive institutions or not is deeply connected with the phenomenon of "critical junctures," those pivotal moments in history when a society’s path is not predetermined, but is contingent upon the contingent decisions that emerge within the flux of historical circumstances [12]. Acemoglu and Robinson [1] expose this relationship through the divergent responses to the bubonic plague in Western and Eastern Europe. While the former embraced a transition toward inclusive labor markets, sustaining greater freedom and opportunity, the latter doubled down on extractive systems, thereby reinforcing servitude and inequality. The rigidity of extractive institutions exposes their vulnerability: their reliance on the perpetuation of static power structures renders them incapable of adapting to the demands of progress and equity, and even less to sustainable and ecological progress. This foundational weakness not only undermines their own sustainability but also raises profound questions about the historical forces that allow such systems to endure.
2.3. Research Objective
In the methodological pursuit of analyzing institutions and their bearing on sustainability, the categorization of inclusiveness and extractiveness is rendered into quantifiable dimensions, which allows us to consider the abstract principles of institutional governance to manifest as measurable constructs. While Acemoglu et al. [6] rely on variables such as GDP per capita, polity scores, and historical colonial data to account for the economic and political impact of inclusiveness and extractiveness, the framework remains largely silent on how these relationships interact with the imperatives of sustainability, especially the balance of ecological and social well being.
Our methodology rectifies this by integrating a sustainability score, derived from the SDG Index Score based on sustainability development goals, as a dependent variable. This addition explicitly accounts for the intersection of institutional characteristics with long-term societal and ecological outcomes. We also include research and development expenditure percentage of GDP as part of the inclusiveness score to measure the capacity of inclusive institutions to address environmental and technological challenges, a dimension absent from [6] framework, which prioritizes property rights and broad-based economic participation without explicitly tying them to sustainability outcomes.
The measure of the extractiveness score in this approach critically incorporates inverse relationships with variables like control of corruption, political stability, and regulatory quality. The goal is to prove the nuanced quantitative reflection of extractive institutions tendency to undermine systemic resilience, not just in economic terms but in terms of governance structures essential for sustainability. In contrast, [6] reliance on historical data, such as settler mortality rates and land inequality, focuses primarily on the persistence of inequality and economic stagnation but stops short of connecting these institutional dynamics to the degradation of natural and social systems.
In summa, this paper integrates standardized features such as GDP, Inclusiveness Score, and Extractiveness Score, to operationalize a modern, empirically scalable framework that addresses the inadequacies of the focus of Acemoglu et al. on growth-centric metrics. It acknowledges the complex mediating role of economic development, using GDP in a causal and a reverse causal variable that interacts with institutional factors to shape sustainability outcomes.
3. Hypotheses
We propose that nations, through the resolute development of inclusive institutions, are predisposed to cultivate sustainable practices, as inclusiveness sustains the conditions for long-term ecological and social well-being. In contrast, the persistence of extractive institutions, with their concentrated power and exploitative tendencies, impedes the flourishing of sustainable engagement. We also hypothesize that it is within the economic vitality of nations with higher GDPs that the capacity for investment in sustainability is more pronounced, as their economic strength facilitates the attainment of sustainable initiatives. Thus, we suggest that the pursuit of sustainability is not an antagonist to economic prosperity, but rather a necessary complement, where the latter creates the material conditions for the former’s realization.
- H1: In the resolute progression of institutional development, nations characterized by a higher degree of inclusiveness manifested in the amplification of voice and accountability, the establishment of effective governance, the adherence to the rule of law, and an augmented commitment to research and development shall inevitably achieve greater sustainability. Inclusive institutions by cultivating an environment where resources are equitably distributed, and innovation is not only encouraged but institutionalized, create the necessary conditions for sustainable practices. These institutions through their large participation, go beyond the limitations of narrow, self-serving interests, and establish congruity between economic growth and sustainability. Good governance and sustainability are inseparable aspects of the modern institution, as effective governance structures inherently facilitate the advancement of sustainability objectives. The integration of sustainability into the core operations of an institution is increasingly recognized as essential [13,14].
- H2: In contrast, nations that exhibit higher scores of extractiveness as evident in the prevalence of corruption, political instability, and low regulatory quality, will manifest diminished sustainability outcomes. These institutions, grounded in the concentration of power and wealth in the hands of a few, thwart the potential for sustainable development. By fostering a system wherein resources are misallocated and inequalities entrenched, such institutions obstruct the very conditions required for long-term prosperity and environmental equilibrium. Ineffective governance, as a limiting factor, can obstruct the advancement of environmental innovation. When governance structures are deficient, institutions are less likely to generate green innovations, particularly in circumstances where institutional ownership is minimal and financial constraints are prevalent. In this context, the lack of robust governance mechanisms acts as a barrier to the development of sustainable solutions, thus hindering the realization of the potential for environmental progress within the institution. The absence of such structures diminishes the capacity for innovation and reinforces the interdependence between governance quality and the pursuit of ecological sustainability [15].
- H3: We hypothesize that the relationship between inclusiveness and sustainability is mediated by the realization of economic growth, which is quantifiable by GDP. The economic growth that emerges from inclusive institutions provides the material foundation necessary for investments in sustainable infrastructures. Through the generation of capital, inclusive growth enables advancements in technology and the development of social programs, positioning economic growth as the essential conduit through which the aspirations of sustainability are actualized. Thus, GDP, as a manifestation of economic prosperity, reflects the material conditions that render sustainable progress achievable.
- H4: We suggest that a higher proportion of R&D expenditure relative to GDP amplifies the positive relationship between inclusiveness and sustainability. The rationale for this lies in the fact that economies driven by innovation, through the allocation of resources towards research and development, are better positioned to cultivate sustainable technologies and practices. In this hypothesis, R&D investment acts as a catalyst, by enhancing the capacity of inclusive institutions to achieve sustainable progress. Through innovation driven by R&D, economies achieve more efficient energy markets and achieve sustainable economic development. In the European Union and the United States, a clear connection emerges, wherein increased R&D spending is correlated with lower CO2 emissions, although the effect manifests more strongly within the European context (regarded as inclusive). However, in China (regarded as less inclusive), the relationship between R&D expenditure and CO2 emissions does not follow the same clear trajectory, as the economic and environmental contexts diverge [16].
- H5: The interaction between inclusiveness and GDP generates a significant positive effect on sustainability, as inclusive institutions channel economic resources toward sustainable outcomes. Inclusiveness amplifies the benefits of economic growth by engaging in equitable distribution of resources, thereby facilitating the pursuit of long-term sustainability. Conversely, the interaction between extractiveness and GDP exerts a negative influence on sustainability. In extractive systems, economic resources are disproportionately directed toward elite interests, which restricts the potential for widespread development and stalls sustainable progress. Thus, the concentration of power and wealth in such systems hinders the realization of sustainable objectives and creates a cycle that undermines sustainability.
- H6: We hypothesize that the relationship between GDP and sustainability is nonlinear, but follows a quadratic pattern, where the initial stages of economic growth promotes sustainability, yet beyond a certain point, the benefits of growth may plateau or even worsen. This occurs as overconsumption and environmental degradation begin to counterbalance the positive effects of economic development. We posit that the interaction between inclusiveness, extractiveness, and sustainability is not universal, but varies significantly across regions. Local factors and regional contexts, such as specific governance systems and the availability of resources, shape how these institutional frameworks influence sustainability.
4. Data
4.1. Governance Indicators
The idea of governance in this analysis follows a tripartite pipeline, wherein governance is understood as the traditions and institutions by which authority is exercised within a nation-state. This pipeline includes three fundamental domains as proposed in [17]: the mechanisms for selecting, monitoring, and replacing governments; the capacity to formulate and implement sound policies; and the mutual respect between citizens and the state for the rule of law and institutional integrity. Within each domain, two dimensions are delineated, with a total of six governance dimensions.
-
Mechanisms of Political Selection and Stability:
- -
- Voice and Accountability (VA) : measures the extent to which citizens can participate in governance through free expression, association, and media.
- -
- Political Stability and Absence of Violence/Terrorism (PV): assesses the likelihood of governmental stability and the absence of politically motivated unrest or terrorism.
-
Governmental Capacity for Policy Implementation:
- -
- Government Effectiveness (GE): measures the quality of public service delivery, civil service independence, and the credibility of policy commitments.
- -
- Regulatory Quality (RQ) : evaluates the ability to design and enforce regulations conducive to private sector development.
-
Institutional Respect and Legal Integrity:
- -
- Rule of Law (RL): examines confidence in societal rules, contract enforcement, property rights, and protection from crime and violence.
- -
- Control of Corruption (CC): assesses the extent of misuse of public power for private gain, encompassing both systemic and opportunistic corruption.
While the six dimensions are conceptually distinct, their operational realities clearly reflect a wide range of correlations. For instance, robust mechanisms for accountability may diminish corruption, or effective governance may enhance regulatory quality. Despite these interrelations, the dimensions are analyzed independently to preserve the individual definition of each. Combining these measures into a singular composite indicator risks oversimplification, conceptual ambiguity, and statistical imbroglio, provided that their data sources are shared. For clarity and analytical rigor in the interpretation of governance across varied contexts, data authors [18] refrain from aggregating the dimensions.
4.2. Economic Indicators
The analysis of economic indicators, in particular GDP per capita data from 2000 to 2023 from [19] careful collection, shows the trends of material prosperity in different countries. This dataset demonstrates the extensive relationship between historical development and economic advancement. As a metric, GDP per capita illustrates along with the total output the distribution of wealth in societies and indicates the effectiveness of institutions and the level of inclusiveness or extractiveness present in their systems of government.
The Maddison Project Database [19], an aggregation of scholarly endeavors, contains an extensive compilation of population and economic growth projections, extending research throughout centuries and into the past. This dataset, which provides a comprehensive perspective of GDP per capita and traces the material conditions of societies from as early as 1 CE for some countries and 1820 CE for larger regions, is based on the painstaking work of multiple researchers.
This dataset, expressed in international dollars at 2011 prices, uses a rigorous adjustment process to reconcile inflationary shifts and cross-national inequalities in the cost of living by combining 2011 and 1990 purchasing power parities. Such methodology assures that economic metrics are comparable across time and place, even expanding its analysis to include former countries and territories by extrapolating values based on their last official bounds.
In the scope of our work, we use data over the course of 23 years (from 2000 to 2023). This indicator provides us with a view of the trends of growth and stagnation as well as the emerging patterns of national divergence or convergence. It gives a detailed understanding of how economies are changing and the possibility of resource mobilization and infrastructure development, both of which are necessary for the achievement of sustainability. Depending on the institutional structure that mediates its expression, the GDP per capita dataset is our economic metric and reflects the material conditions that promote or obstruct the goals of equitable and sustainable development.
4.3. Innovation Indicators
The World Bank’s World Development Indicators dataset exemplifies an instrumental articulation of global economic goals by focusing on R&D expenditure as a percentage of GDP. This metric, which measures a country’s dedication to innovation and scientific advancement conveys the structural and institutional orientations that shape the trajectory of development. This data, measured with precision and anchored within the broader framework of national accounts, documents the allocation of resources toward knowledge generation and technological growth. Its historical scope and thorough aggregation make it possible to identify the underlying economic dichotomy that link intellectual capital to long-term growth. The World Bank extracted dataset provides both a quantitative measure of innovation and qualitative understanding of state priorities and governance systems.
4.4. Sustainibility Indicators
As stated in the global framework created by the United Nations in 2015, the Sustainable Development Goals (SDGs) are the conceptual synthesis of humanity’s hopes to address the concurrent issues of poverty, inequality, and environmental degradation in order to achieve equilibrium by 2030. These aims represent the unity of economic, social, and ecological components necessary for humanity to prosper. The achievement of these objectives necessitates collaborative efforts across industries and countries, relying on both traditional and creative ways [20].
In the 2023 Sustainable Development Report, [20] advance a rigorous methodology for assessing progress through the SDG Index, a composite measure that quantifies performance across the 17 SDGs. This index is expressed mathematically as:
where represents the performance of a country on indicator i, denotes the weight assigned to indicator i, and n is the total number of indicators. Each indicator is normalized on a scale from 0 to 100, with 100 signifying full achievement of the target.
Furthermore, individual SDG scores for a country are computed as the average of the normalized values of their corresponding indicators:
where denotes the score for SDG k, represents the normalized value of indicator j under SDG k, and is the total number of indicators within SDG k. This approach combines national and international advancements, clarifying both accomplishments and inconsistencies in the quest for sustainable development.
The report [20] clarifies implementation issues that have persisted since 2016 despite early advancements. According to Sachs, the dispersion of activities across sectors accentuates the need for data that overcomes the atomistic biases of policy-making through integrating the entirety of science-based approaches and systems thinking [21]. In this regard, digitalization is a key phenomenon that is characterized as both a source of ethical and structural quandaries that need to be resolved and a possible stimulus for innovation due to its ability to improve data integration [22,23].
5. Institutions and Sustainability: Methodological Analysis
The aim of our analysis in this section is to evaluate the relationship between governance, economic activity, and sustainability through two composite variables: Inclusiveness Score and Extractiveness Score, alongside GDP. These scores were carefully constructed from various data sources and collected into one dataset to quantify the distinct dimensions of governance and institutional performance.
In [6], the authors aim to understand the historical origins of institutions, particularly those established during the colonial era, and assess their long-term economic effects. Our study, on the other hand, examines the contemporary impact of institutional inclusiveness and extractiveness on sustainability, particularly progress toward achieving the Sustainable Development Goals. They center their analysis on the hypothesis that colonial settler mortality rates influenced the type of institutions established in different regions. High mortality rates led colonizers to create extractive institutions, while low mortality rates allowed for more inclusive institutions modeled after European governance structures. These historical choices, they argue, have had persistent effects on economic outcomes, as reflected in modern-day GDP per capita. Their key variables include settler mortality as an instrument for institutional origins, measures of institutional quality such as protection against expropriation risk, and GDP per capita as an economic performance indicator. In our study, we focus on the present-day characteristics of institutions and their ability to support or hinder sustainability. We quantify institutional quality through measures of inclusiveness and extractiveness, constructing composite scores based on governance indicators. We derive the Inclusiveness Score from four key indicators: Voice and Accountability, Government Effectiveness, Rule of Law, and Research and Development Expenditure (% of GDP) as proxies for innovation and citizen-centric governance, that promote participatory, effective, and rule-based institutions while incorporating innovation-driven investments as a measure of societal progress. Then we derive the Extractiveness Score by aggregating the inverse of three indicators: Control of Corruption, Political Stability, and Regulatory Quality. These components are institutional liabilities that reduce governance ability and promote practices that are unfavorable to sustainable development.
The dependent variable is the Sustainability Score, defined using the SDG Index Score, which measures a country’s overall progress toward achieving the Sustainable Development Goals. Our aim is to quantify multidimensional progress toward economic, social, and environmental goals and beyond economic growth to account for a variety of outcomes.
The explanatory variables include the standardized values of Inclusiveness Score, Extractiveness Score, and GDP..
5.1. OLS Estimates
We use the Ordinary Least Squares regression to assess the connections between the independent variables: Inclusiveness Score, Extractiveness Score, and GDP, and the dependent variable, Sustainability Score. Approximately 36.7% of the variance in sustainability outcomes can be explained by the model, according to the R-squared value of 0.367. This value shows that these governance and economic elements are important, but not all-inclusive, predictors of sustainability.
The regression model explains approximately 36.7% of the variance in the dependent variable, as indicated by an R-squared value of 0.367, with a slightly lower adjusted R-squared of 0.366 accounting for model complexity (See Table 1). Key coefficients show significant effects: Inclusiveness Score positively influences the Sustainability Score (coefficient: 2.96), while Extractiveness Score has a negative impact (-2.84), and GDP contributes positively (1.09). All predictors are statistically significant with p-values of 0.000 and large t-statistics. The model exhibits strong overall significance (F-statistic: 830.8, p-value: 0.00), but diagnostic tests reveal issues with residual normality (Omnibus and Jarque-Bera tests) and autocorrelation (Durbin-Watson: 0.12). Despite minor skewness (skewness: -0.377, kurtosis: 2.877) and no substantial multicollinearity concerns (condition number: 5.81).
To address autocorrelation and non-normality in the residuals, we applied a series of modeling refinements. We reapplied Generalized Least Squares to account for autocorrelation, which is pointed at by the Durbin-Watson statistic of 0.120, which confirms the presence of positive residual dependency (See Table 2. While GLS mitigated autocorrelation, the R-squared value remained modest at 0.367. By using RLM (Robust regression) using a log-transformed dependent variable we effectively addressed non-normality and outliers by using the HuberT norm, though the R-squared was slightly reduced compared to the OLS model (See Table 3).
The OLS results support the provided hypotheses about the impact of institutional inclusivity, extractiveness, and economic vitality in supporting sustainability. The positive coefficient of Inclusiveness Score (2.96) confirms H1, implying that countries with inclusive institutions are more likely to attain greater sustainability. Inclusive institutions, as theorized, allow for equal resource distribution and innovation, cultivating sustainability through effective governance, voice, and responsibility. On the other hand, the negative coefficient of Extractiveness Score (-2.84) supports H2, stressing the negative impact of extractive institutions on sustainability. These institutions, which are plagued by corruption and bad governance, undermine sustainable outcomes by misallocating resources and cementing disparities. The findings support the idea that extractive institutions stifle environmental innovation and long-term prosperity by missing the regulatory structures required for sustainable advancement.
Next, we constructed interaction terms and polynomial transformations to detect non-linearities and interactions. We created the interaction terms between GDP and both inclusiveness and extractiveness scores to explore how these institutional factors explain the relationship between economic strength and sustainability. We added quadratic transformations of the inclusiveness and extractiveness scores to the model to investigate potential curvilinear effects, as a sign of non-linear relationships often observed in complex socio-economic systems.
The regression results we obtained (See Table 4), show that the model explains 42.8% of the variance in the sustainability score, as evidenced by an R-squared of 0.428. GDP is positively and significantly associated with sustainability, aligning with the hypothesis that economic strength strengthens investments in sustainable practices (H5). However, the interaction term between GDP and inclusiveness score is negative and significant, which leads us to think that at higher levels of GDP, the marginal benefit of inclusiveness on sustainability diminishes. This result implies that inclusiveness may exhibit a more substantial impact on sustainability in lower or middle-income contexts, while wealthier nations rely more on direct economic mechanisms (H6). Conversely, the positive and significant interaction between GDP and extractiveness implies that extractive practices amplify the negative consequences of GDP growth on sustainability. This finding supports the idea that extractive institutions exacerbate unsustainable practices, even in economically advanced nations (H2).
Inclusiveness score squared is positively significant, which suggests that the benefits of inclusiveness on sustainability intensify as inclusiveness improves beyond moderate levels. This reinforces the hypothesis that inclusive institutions are important for ecological and social well-being (H1). Meanwhile, the negative quadratic effect of extractiveness indicates diminishing returns; as extractiveness worsens, its detrimental impact on sustainability becomes more pronounced.
Figure 1 the interaction between inclusiveness and GDP concerning sustainability. Nations with higher inclusiveness scores (green hues) exhibit higher sustainability across all GDP levels. This supports the hypothesis that inclusive governance sustains sustainable development by distributing resources equitably and institutionalizing innovation. Interestingly, nations with low inclusiveness (blue hues) display a wider variance in sustainability outcomes which leads us to believe that inclusiveness provides a stabilizing effect by reducing disparities and improving sustainability (H3).
Figure 2 shows GDP plotted against sustainability scores, colored by extractiveness. A clear trend is observed where higher extractiveness scores (red hues) cluster toward lower sustainability levels, regardless of GDP (H2. Conversely, lower extractiveness scores (blue hues) are associated with higher sustainability, especially at higher GDP levels. This pattern solidifies the hypothesis that extractive institutions hinder sustainability by misallocating resources and promoting inequality, even in economically robust contexts (H6).
5.2. Machine Learning Estimates
-
Random Forest is an ensemble learning method that builds multiple decision trees and aggregates their outputs. For regression tasks, the final prediction is computed as the average of predictions from n trees:where is the prediction of the i-th tree for input X. Random sampling of both the data and features ensures model diversity, reducing overfitting and variance.We evaluate the importance of each feature by the total reduction in impurity it provides across all trees. The impurity decrease can be computed using metrics such as the Gini Index or Mean Squared Error:where is the reduction in impurity for feature j in tree t.
-
Gradient Boosting sequentially builds decision trees to minimize a specified loss function . For regression tasks, this is commonly the Mean Squared Error:At each iteration, the algorithm fits a new tree to the negative gradient of the loss function (also the residuals):The model updates predictions as:where is the prediction of the k-th tree, and is the learning rate.The scatter plots for both models (See Figure 3 and Figure 4:) Random Forest and Gradient Boosting Regressors show a strong correlation between actual and predicted sustainability scores. This alignment confirms the models capability to observe patterns in the data effectively. The clustering of points near the diagonal line in both scatter plots confirm that the predictions closely follow the true values which leads us to conclude a minimal bias and a good fit.The feature importance analysis further helps us to find the significance of the predictors (Inclusiveness Score, Extractiveness Score, and GDP) in driving the models predictions. In the Random Forest model, feature importance is derived from the reduction in loss across the ensemble of decision trees. The results show that all three predictors contribute meaningfully to the sustainability score predictions, with the relative contributions that ensure their influence on the target variable.The Random Forest model builds on the diversity of decision trees by using bootstrap aggregation (bagging), which reduces variance and guards against overfitting. By averaging predictions across multiple trees, the model achieves robust performance, even when the data includes noise or complex interactions between variables.In contrast, the Gradient Boosting model follows a sequential shape, where each new tree corrects the residual errors of the previous ones. It’s an iterative learning mechanism that helps Gradient Boosting to focus on areas where the model struggles and leads to reduced bias and improved accuracy. The learning rate () in the Gradient Boosting controls the step size of corrections and balances the trade-off between training time and model precision.
5.3. Granger Causality Test: Research and Development as Driver for Sustainability
Granger causality is a tool designed to probe the relationships between time series data, to assess whether one series possesses the capacity to predict another. The test’s idea is based on the assumption that if a variable X Granger-causes variable Y, past values of X can be used to forecast future values of Y.
The quantile-based Granger causality tests proceeds with assessing causal relationships not solely at the mean but across different parts of the distribution. These tests thus become a means of observing causal effects that might otherwise remain hidden within the confines of traditional methods [24,25,26]. They expose the nonlinearities present in the system, and help detect risks that are often present only in the tails of the distribution.
Granger causality does not necessarily imply a direct "cause and effect" relationship in the traditional sense. Rather, it indicates a predictive relationship between the variables. For example, in the context of [6] the question is whether past values of government effectiveness can predict future values of GDP.
The Granger Causality test operates by evaluating whether lagged values of one time series provide statistically significant information about the future behavior of another time series, after accounting for the past behavior of the dependent variable. If significant results are found, it suggests that the first variable can help in forecasting the second variable, at least in terms of time-series data.

Table 5.
Granger Causality Test and ADF Test Results for R&D Expenditure and SDG Index Score
| Statistic | Value | Notes |
|---|---|---|
| R&D Expenditure ADF Test p-value | 0.0 | Stationary time series |
| SDG Index Score ADF Test p-value | 1.5818561954387344e-13 | Stationary time series |
| Lag | F-Test Value | p-value |
| Lag 1 F-Test | 5.8948 | 0.0152 |
| Lag 1 Chi-Square Test | 5.8991 | 0.0151 |
| Lag 1 Likelihood Ratio Test | 5.8949 | 0.0152 |
| Lag 1 Parameter F-Test | 5.8948 | 0.0152 |
| Lag 2 F-Test | 3.4995 | 0.0303 |
| Lag 2 Chi-Square Test | 7.0074 | 0.0301 |
| Lag 2 Likelihood Ratio Test | 7.0015 | 0.0302 |
| Lag 2 Parameter F-Test | 3.4995 | 0.0303 |
| Lag 3 F-Test | 2.3078 | 0.0745 |
| Lag 3 Chi-Square Test | 6.9350 | 0.0740 |
| Lag 3 Likelihood Ratio Test | 6.9292 | 0.0742 |
| Lag 3 Parameter F-Test | 2.3078 | 0.0745 |
| Lag 4 F-Test | 1.7889 | 0.1281 |
| Lag 4 Chi-Square Test | 7.1712 | 0.1271 |
| Lag 4 Likelihood Ratio Test | 7.1650 | 0.1274 |
| Lag 4 Parameter F-Test | 1.7889 | 0.1281 |
For the purpose of our study, we ran the Granger causality test between research and development expenditure percentage and the Sustainable Development Goals index, to assess the presence of causality. The results indicate that while there is some evidence of causality at specific lags, this relationship is not consistently strong across all tested lags.
Both variables are stationary, as confirmed by their respective Augmented Dickey-Fuller test results, which is a necessary condition for conducting Granger causality tests. At lag 1, the test shows a statistically significant F-statistic of 5.8948 with a p-value of 0.0152, which confirms that past values of R&D expenditure percentage Granger-cause the SDG index score. A similar result is observed at lag 2, with an F-statistic of 3.4995 and a p-value of 0.0303, further supporting the hypothesis that R&D expenditure has predictive power for the SDG index at short lags (H4). However, at lag 3, the F-statistic drops to 2.3078, and the p-value rises to 0.0745, which, while not significant at the 5% level, may suggest a weak potential causal link. By lag 4, the relationship weakens further, with an F-statistic of 1.7889 and a p-value of 0.1281, that tells us there’s no significant Granger causality.
6. Discussion
Figure 5 shows the global distribution of the Inclusiveness Score for the year 2022, wherein the colors, delineate the spectrum of social and economic inclusion among nations. The gradation, from the vivid warmth of yellow-green to the depth of blue, refers to a symbolic representation of inclusiveness: the darker blue hues signifying the zenith of equity and inclusion, while the paler tones, represent absence of opportunity and participation.
The Inclusiveness Score serves as the measure of a society’s ability to surpass the circumstances of birth, heritage, and fortune, and allows each individual to partake in its social and economic environment. Here, Scandinavian countries appear as exemplars of inclusivity, their darker blue hues consistent with their historical commitment to welfare systems, equitable policies, and social structures. Yet, in contrast, the lighter shades that pervade Sub-Saharan Africa, parts of Asia, and South America disclose a different reality a reflection of systemic inequities, limited access to resources, and the persistence of extractive institutions.
Scandinavian countries, characterized by strong inclusiveness, high innovation, and effective governance, consistently rank among the leaders in sustainability metrics (for instance, renewable energy adoption, low corruption). As further zoomed in Figure 7.
On the other hand, resource-rich countries with extractive institutions, such as Venezuela (See Figure 6), often fail to use their natural wealth for sustainable progress. Instead, wealth concentration and environmental degradation prevail. This supports the hypothesis that extractive institutions obstruct sustainability by supporting systemic inefficiencies and reinforcing structural barriers to innovation and equitable development.
Figure 5.
Inclusiveness Score by Country (2022)
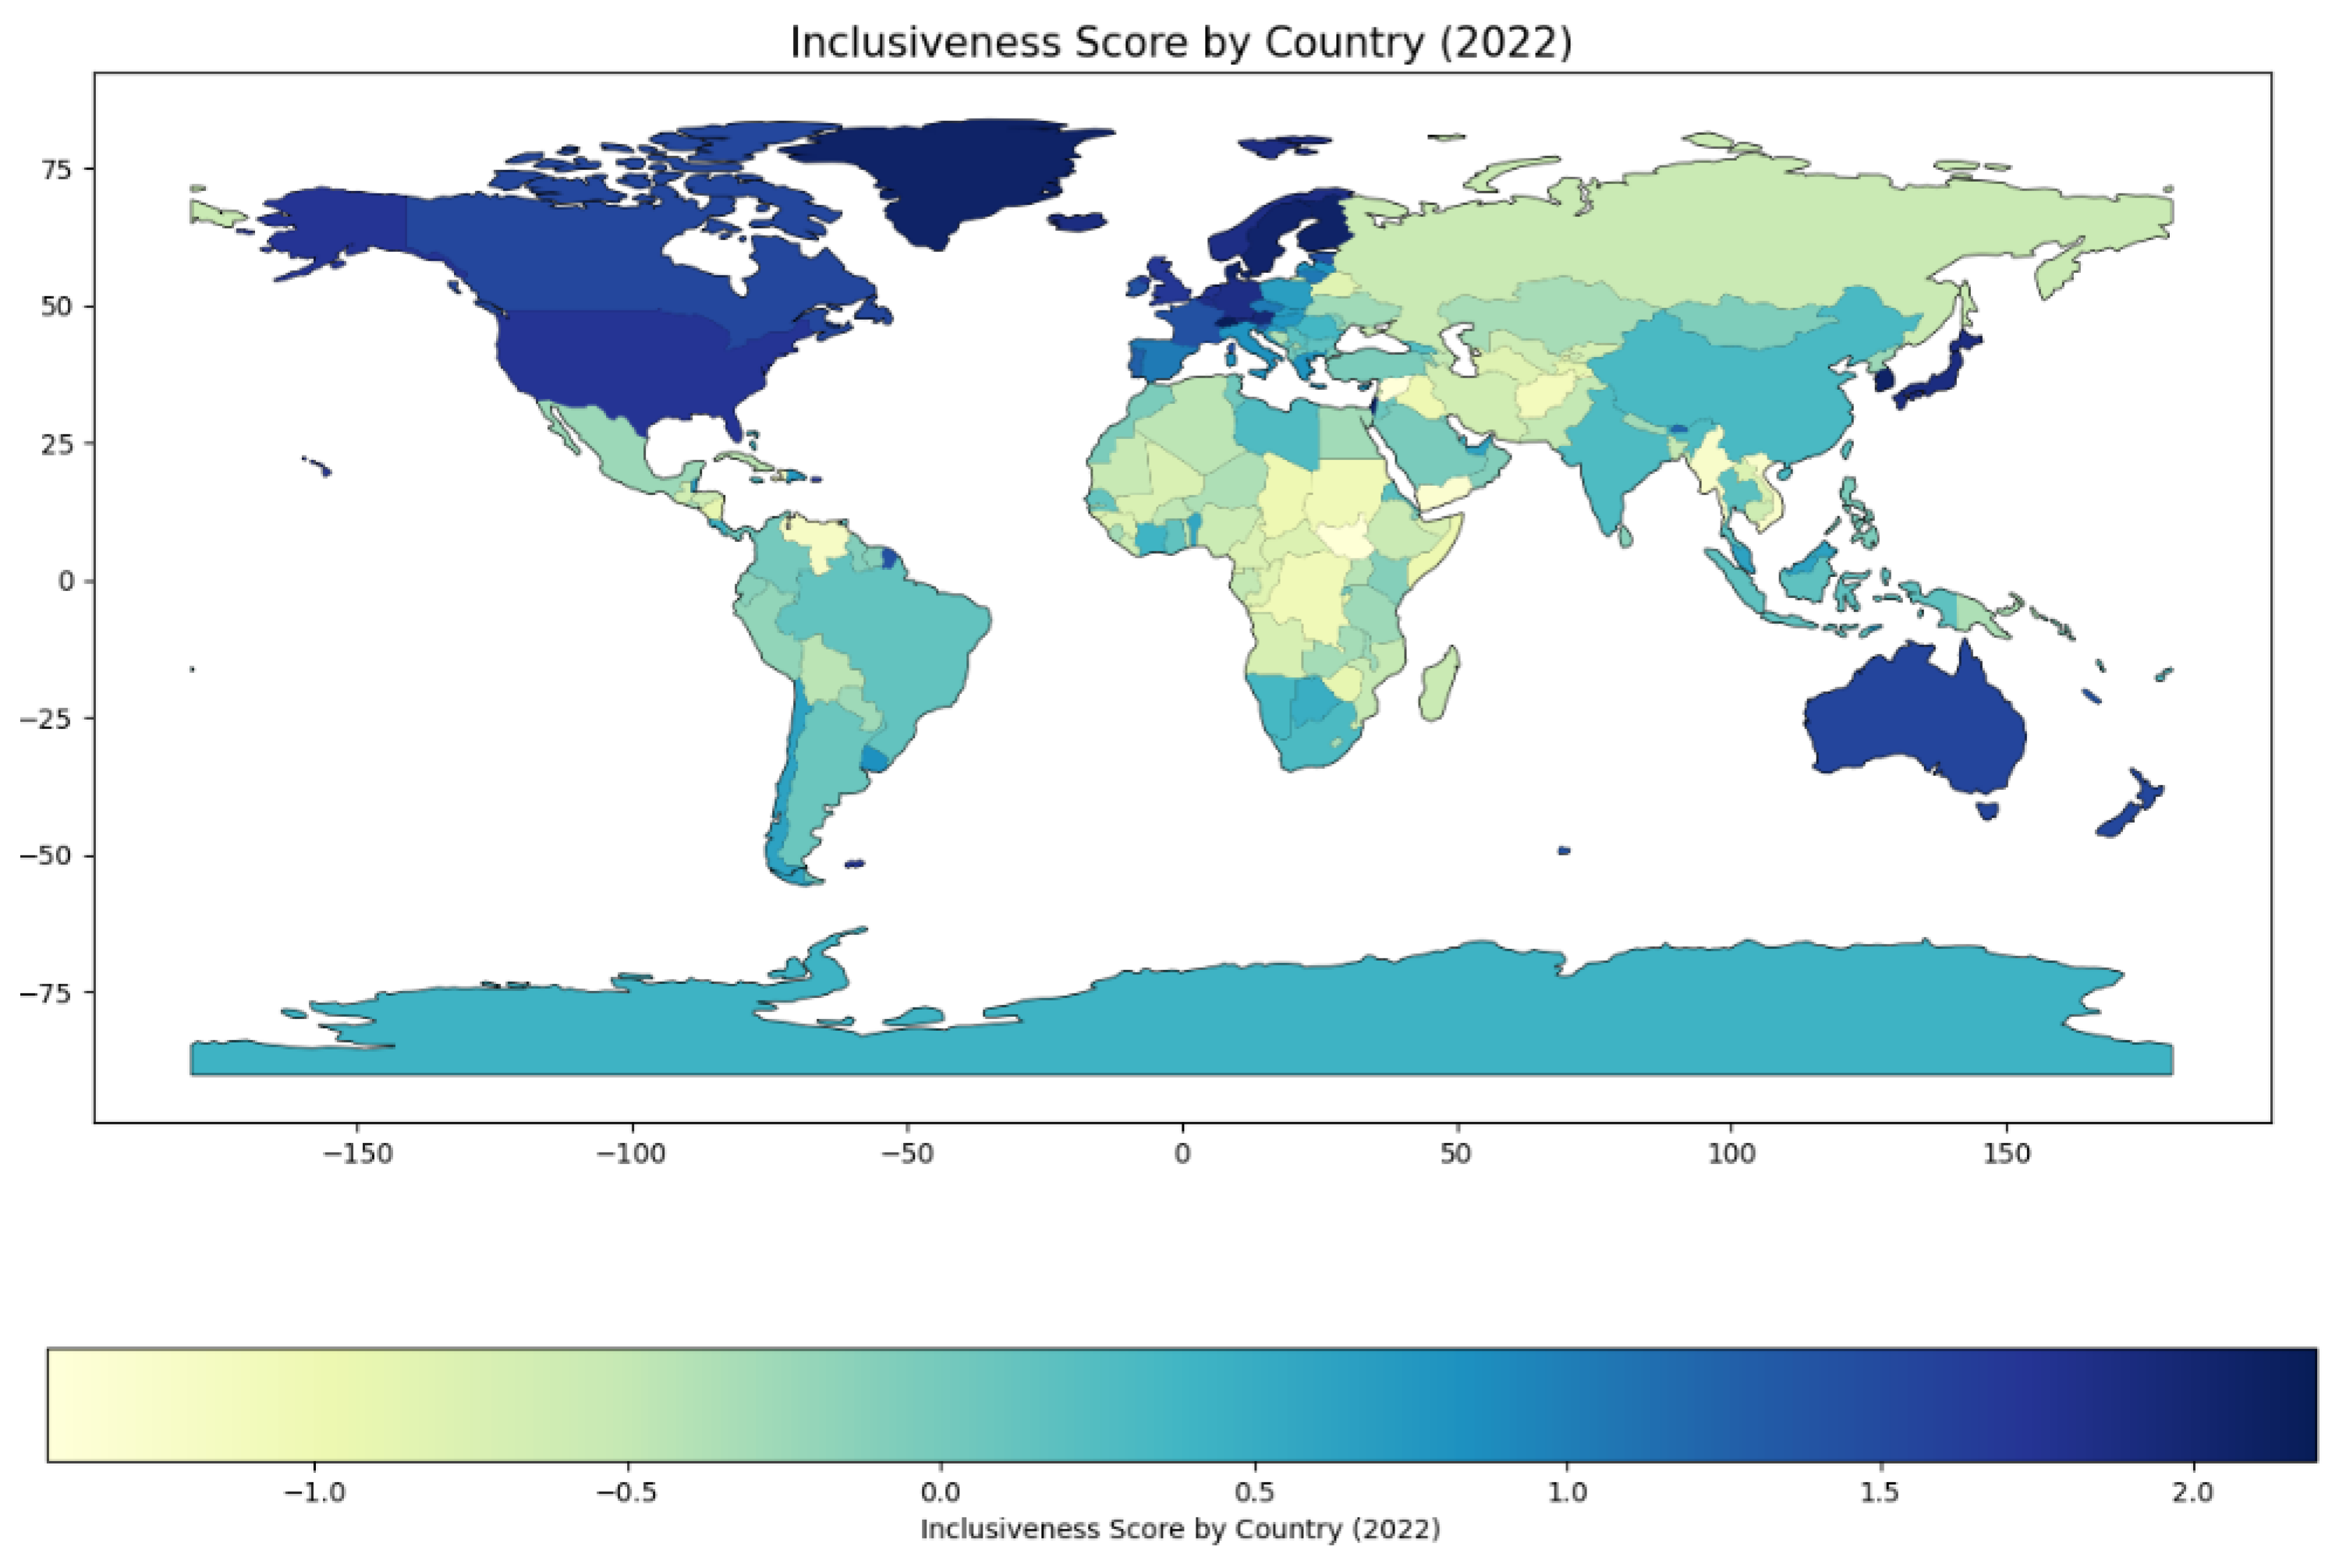
Figure 6.
Extractiveness Score by Country (2022)
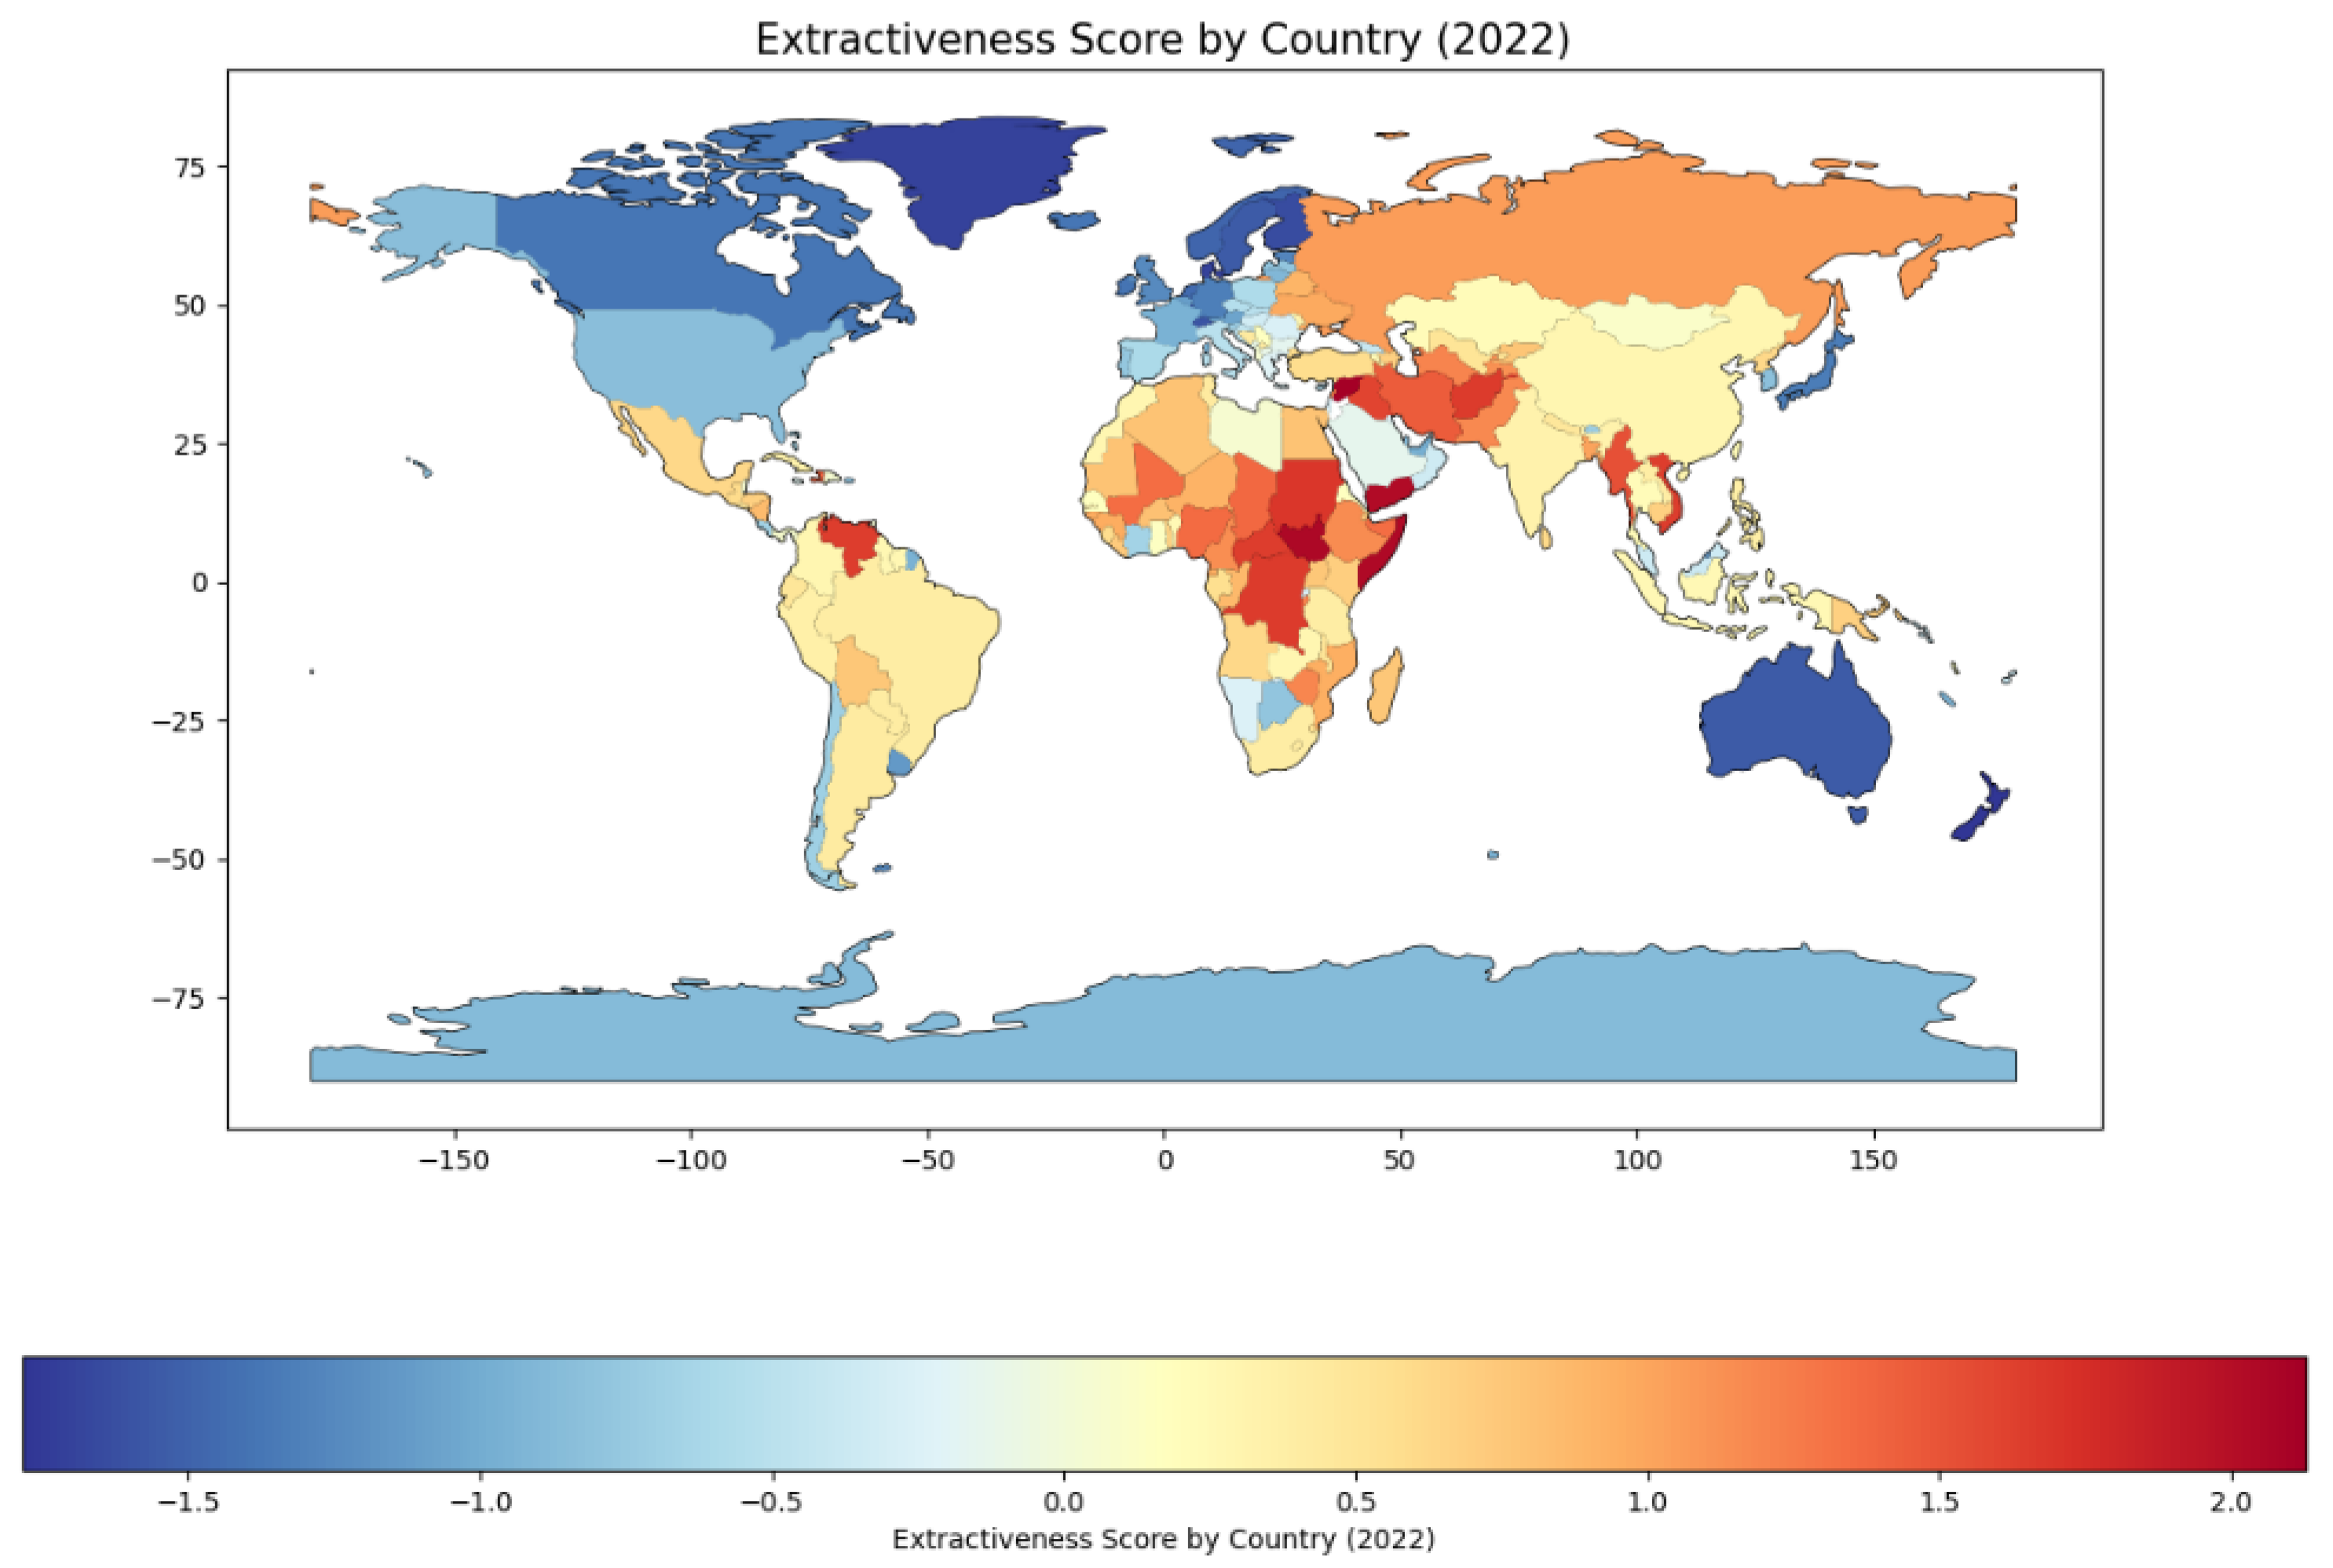
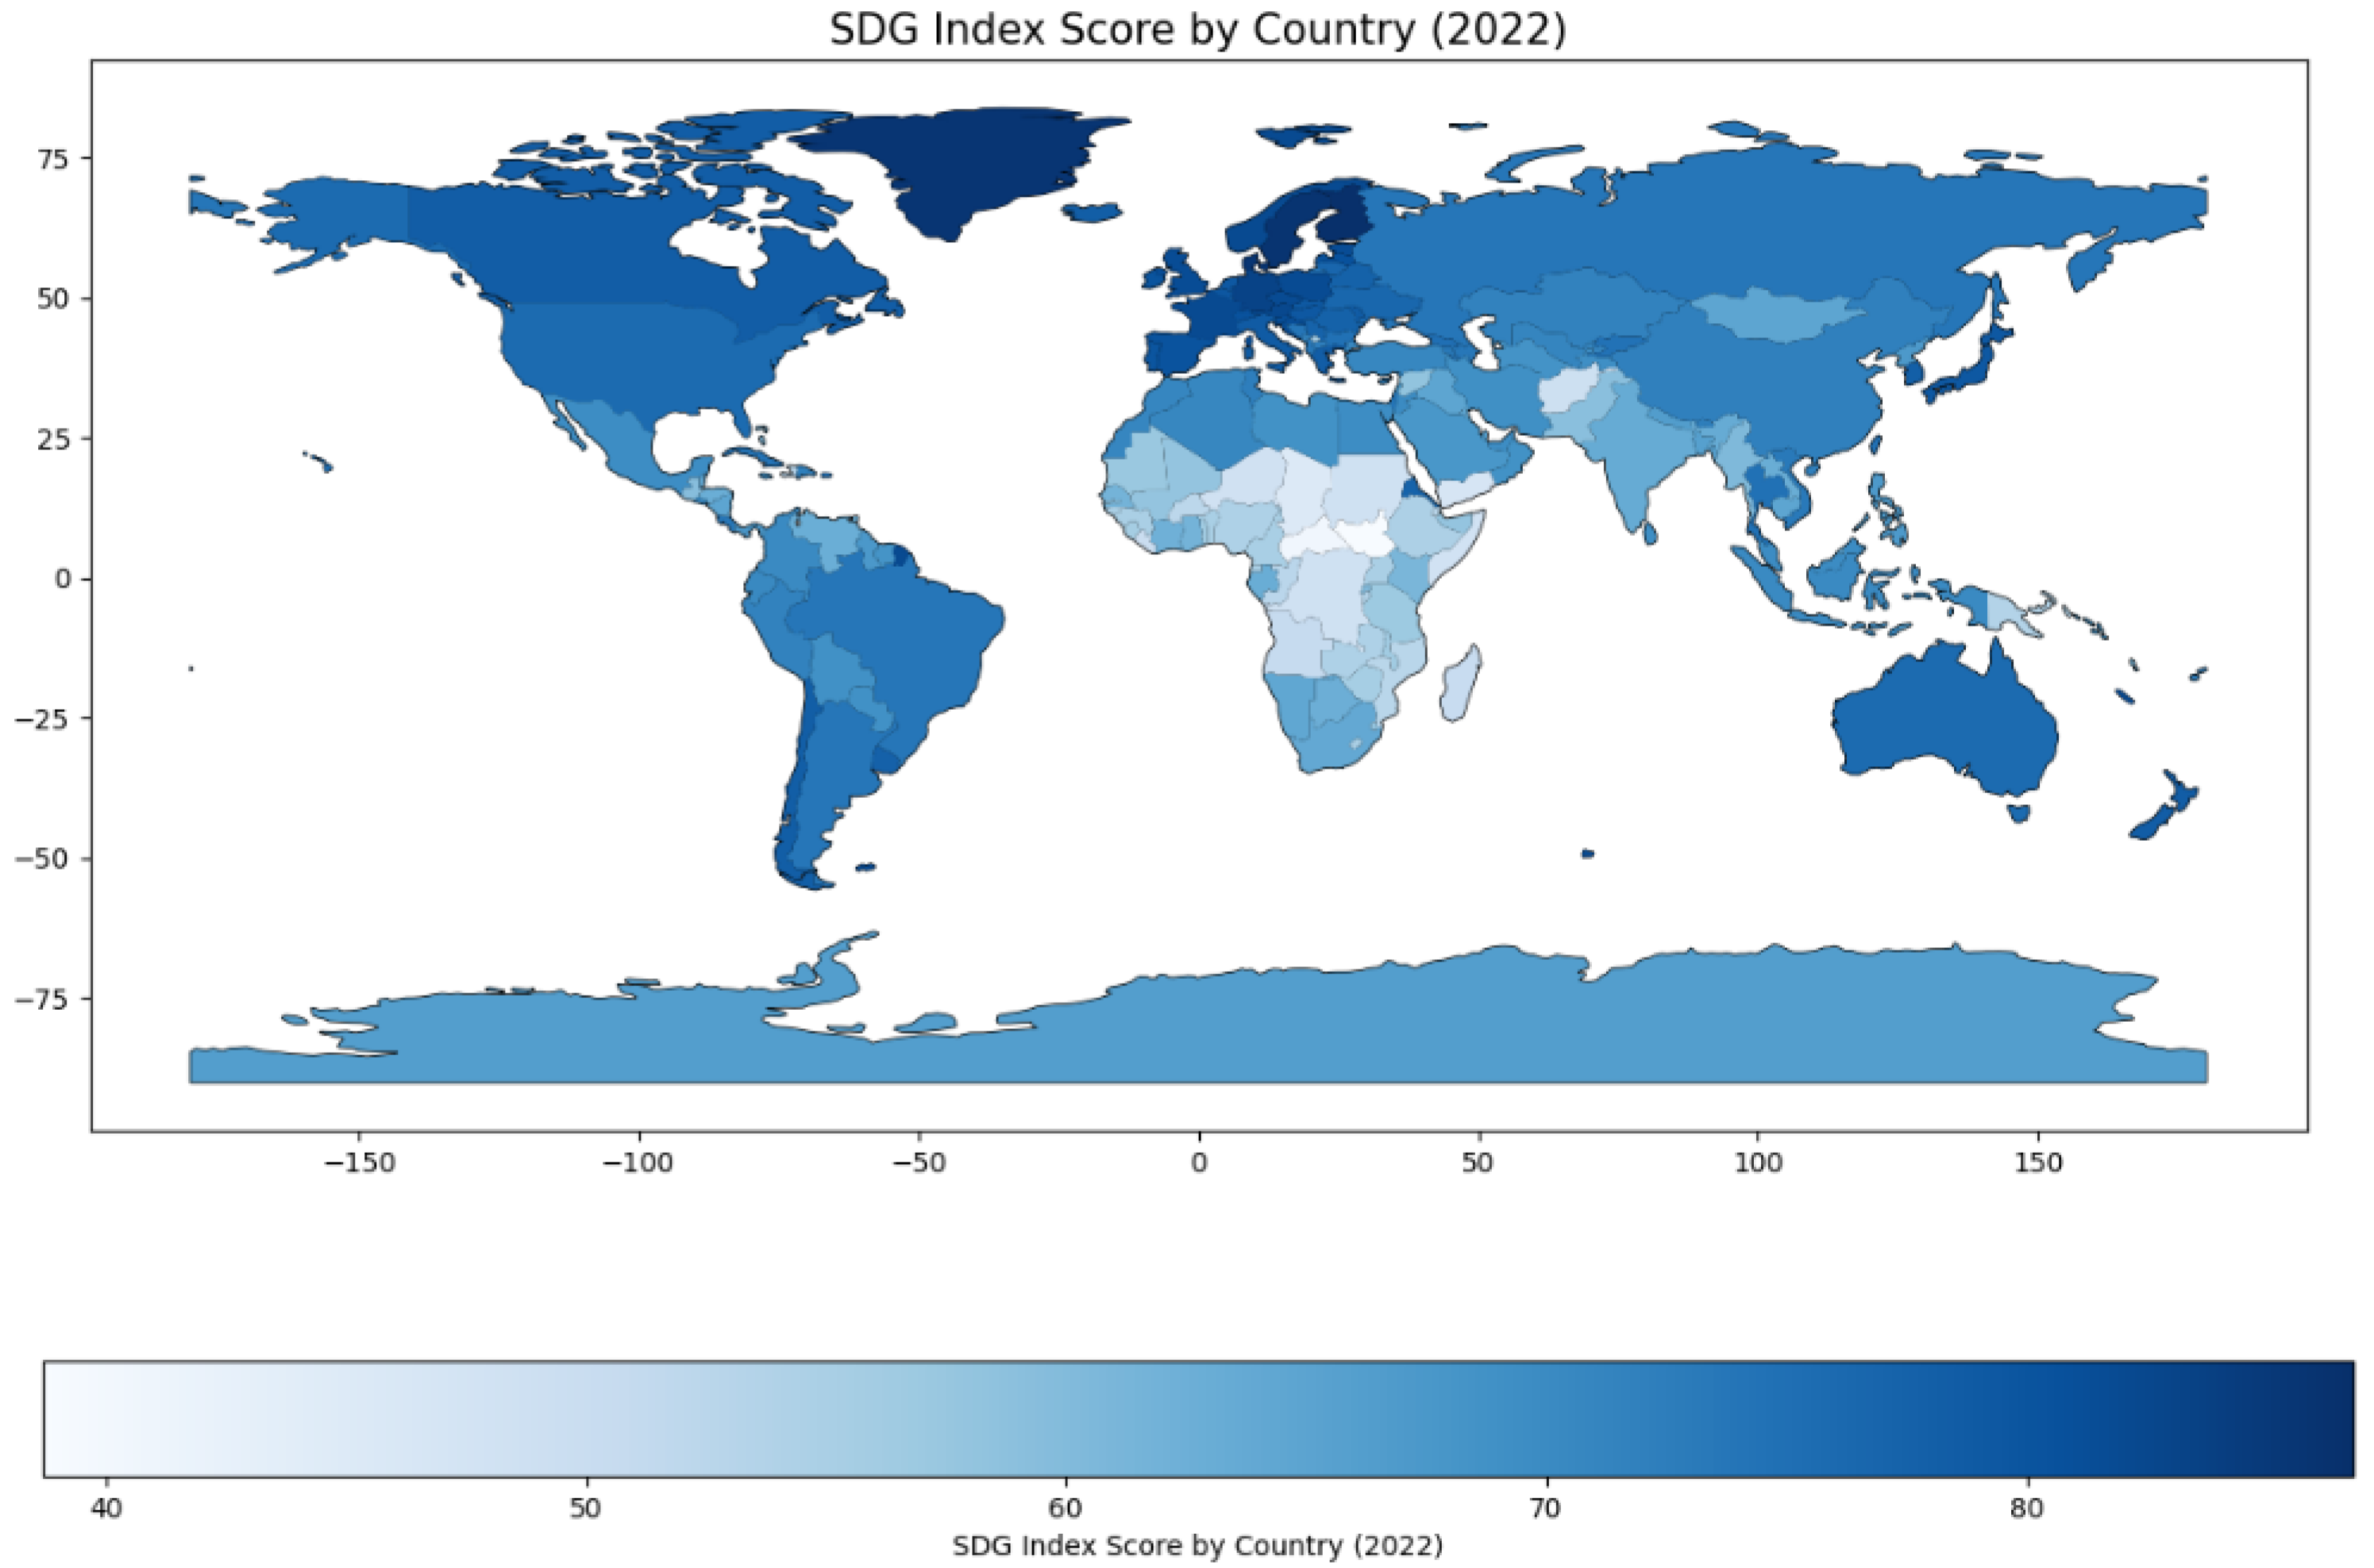
Figure 7.
Sustainability Score by Country (2022)
The concluding maps align with [1], who proved the role of institutional inclusivity. The inclusiveness and extractiveness scores as shown in Figure 5 and Figure 6, corroborate their thesis: that the inclusiveness of institutions is the sine qua non of societal equity and economic vitality. In lower-income nations, initial economic growth driven by inclusiveness often promotes sustainability, as evidenced by countries in Southeast Asia transitioning toward green growth. But in high-income nations with extractive tendencies, for example, oil-rich Gulf states, the benefits of GDP on sustainability may plateau or worsen due to overconsumption and environmental degradation.
Inclusive institutions promote societies where political accountability, equitable resource distribution, and robust legal frameworks converge to create systems that favor the many rather than the few. The lighter-hued regions bear the touch of extractive institutions, where power consolidates in the hands of the few, perpetuating cycles of exclusion and marginalization. Former (unsetller) colonies, in sub-Saharan Africa, parts of Asia, and segments of South America, scarred by systemic corruption, weak governance, and the absence of rule of law, represent the persistent challenges of extractiveness.
Authors of [6] historical analysis which frames nations as inheritors of "critical junctures" that determine their institutional trajectories is compellingly proven here. The colonial legacies of Latin America, caused by extractive exploitation, cast challenges that still hinder inclusiveness, while nations such as Canada and Australia, who benefitted from more inclusive colonial structures (settler colonies) scored well on inclusivity.
Whether using OLS regression, Random Forest or Gradient Boosting, they all affirm the hypotheses previously proposed. Inclusive institutions explain a significant fraction of sustainability, particularly in less affluent nations where their effects are magnified. Meanwhile, extractive institutions consistently undermine sustainability, every increase in extractiveness score is followed by a decrease in sustainability score. The results also cement the complementarity of economic growth and sustainability, and prove that GDP accomodates sustainability when assisted by inclusive governance and diminished extractiveness.
The results we obtained from the Granger causality test present important implications for the policies aimed at advancing progress towards the Sustainable Development Goals, particularly regarding the impact of Research and Development expenditure. The results show that R&D investments have a important short-term effect on the SDG index score, especially within the initial periods of investment. This strongly shows that governments should prioritize R&D funding, particularly in sectors directly related to SDG targets such as health, education, clean energy, and economic growth. Such investments, which could be supported by public-private partnerships, would advance innovation and contribute substantially to the achievement of SDG targets in the near future, such as those related to affordable and clean energy (SDG 7) and climate action (SDG 13).
For instance, European Union nations, particularly Germany and Sweden, combine inclusiveness with high R&D expenditure, and that helps them advance in sustainable technologies and reduce carbon footprints (See Figure 5). Conversely, countries with lower inclusiveness, such as China, show weaker links between R&D and sustainability (See Figure 6).
However, the findings also point to a diminishing effect of R&D expenditure over time, which makes us think about the necessity for a long-term approach to achieve long-term sustainability. R&D, while essential in the short run, can not, alone, guarantee lasting progress. Policymakers are advised to complement R&D investment with strategies that favor the scaling of innovations. For example, once the groundwork for clean technologies is laid, it becomes imperative to adopt regulatory systems and incentive structures that encourage their widespread use, particularly in industries aligned with SDG 9 (Industry, Innovation, and Infrastructure) and SDG 13.
Governments must allocate resources judiciously, and direct funding to priority areas where immediate impacts can be achieved. Targeting sectors such as healthcare or clean energy could yield quick advancements in important SDG indicators. The development of health technologies, for instance, could address public health concerns under SDG 3 and improve economic resilience as in SDG 8. For R&D to serve as a catalyst for progress, it must be integrated within an inclusive policy instituion that includes social, economic, and environmental reforms. Only when aligned with policies that address the root causes of SDG challenges, can R&D effectively sustain long-term advancements.
7. Conclusions
In this paper we built upon the work of Acemoglu et al. [6] in which they direct probe the historical processes that forged the foundational character of institutions, and trace their enduring legacies through the mechanisms by which colonial structures have inscribed patterns of economic inequality. Their work situates institutions within a colonial legacy, and maintain the persistent influence of extractive or inclusive systems on the trajectories of economic development.
Our study, shifts the focus to the contemporary problematic of institutions and their ability to cultivate sustainable development. Here, the emphasis lies not on the inherited legacies of the past but on the inclusivity or exclusivity that defines current institutional arrangements. We measure their effectiveness by their ability to advance the collective ideal of sustainability, an equilibrium combining social, environmental, and economic dimensions.
Yet these approaches, far from standing in opposition, are complementary perspectives. [6] historical analysis maintains the origins and persistence of institutional structures, and deepens our understanding of their present form and function. Simultaneously, our evaluation provides an assessment of their ongoing capacity to cultivate sustainable development and human progress. Thus, we aim to obtain a comprehensive understanding of the role of institutions which requires both historical analysis and an engagement with present day realities. To achieve human development, we must grasp the full potential of institutions as agents of human prosperity and combine both the historical roots and the impending imperatives of the present.
References
- Robinson, J.A.; Acemoglu, D. Why nations fail: The origins of power, prosperity and poverty; Profile London, 2012.
- Acemoglu, D.; Robinson, J.A. Rents and economic development: the perspective of Why Nations Fail. Public Choice 2019, 181, 13–28. [Google Scholar] [CrossRef]
- Radionova, I.O. INCLUSIVE SOCIETY: FROM THEORY TO REALITIES 2019. 2, 195–207. [CrossRef]
- Natkhov, T.; Polishchuk, L. Political Economy of Institutions and Development: The Importance of Being Inclusive. Reflection on "Why Nations Fail" by D. Acemoglu and J. Robinson. Part II. Institutional Change and Implications for Russia. Journal of the New Economic Association 2017, 35, 12–32. [Google Scholar] [CrossRef]
- Lane, J. Why Nations Fail. The Origins of Power, Prosperity and Poverty. International Journal of Social Economics 2014, 41. [Google Scholar] [CrossRef]
- Acemoglu, D.; Johnson, S.; Robinson, J.A. Institutions as the Fundamental Cause of Long-Run Growth. CEPR Discussion Paper Series 2004. [Google Scholar] [CrossRef]
- Acemoglu, D.; Johnson, S.; Robinson, J.A. Chapter 6 Institutions as a Fundamental Cause of Long-Run Growth 2005. 1, 385–472. [CrossRef]
- Acemoglu, D.; Johnson, S. Unbundling Institutions. Journal of Political Economy 2003, 113, 949–995. [Google Scholar] [CrossRef]
- Williamson, C.R. Informal institutions rule: institutional arrangements and economic performance. Public Choice 2009, 139, 371–387. [Google Scholar] [CrossRef]
- Przeworski, A. Institutions Matter? 1. Government and Opposition 2004, 39, 527–540. [Google Scholar] [CrossRef]
- Devos, T.; Spini, D.; Schwartz, S. Conflicts among human values and trust in institutions. The British journal of social psychology 2002, 41 Pt 4, 481–94. [Google Scholar] [CrossRef] [PubMed]
- Capoccia, G. 89Critical Junctures. In The Oxford Handbook of Historical Institutionalism; Oxford University Press, 2016; [https://academic.oup.com/book/0/chapter/212252849/chapter-ag-pdf/44594567/book_28116_section_212252849.ag.pdf]. [CrossRef]
- Aras, G.; Crowther, D. Governance and sustainability: an investigation into the relationship between corporate governance and corporate sustainability. Management Decision 2008, 46, 433–448. [Google Scholar] [CrossRef]
- Klettner, A.; Clarke, T.; Boersma, M. The Governance of Corporate Sustainability: Empirical Insights into the Development, Leadership and Implementation of Responsible Business Strategy. Journal of Business Ethics 2014, 122, 145–165. [Google Scholar] [CrossRef]
- Amore, M.; Bennedsen, M. Corporate Governance and Green Innovation. S&P Global Market Intelligence Research Paper Series 2015. [CrossRef]
- Fernández, Y.; López, M.A.F.; Blanco, B.O. Innovation for sustainability: The impact of R&D spending on CO2 emissions. Journal of Cleaner Production 2018, 172, 3459–3467. [Google Scholar] [CrossRef]
- World Bank. Worldwide Governance Indicators, 2024. Accessed: 2024-12-25.
- Kaufmann, D.; Kraay, A.C. The Worldwide Governance Indicators : Methodology and 2024 update. http://documents.worldbank.org/curated/en/099005210162424110/IDU17c6f0b9e1f0c214b1d1b30d176c4644af69e. Accessed: 2024-12-25.
- Roser, M.; Arriagada, P.; Hasell, J.; Ritchie, H.; Ortiz-Ospina, E. Data Page: GDP per capita. Online resource, 2023. Part of the publication: Economic Growth. Data adapted from Bolt and van Zanden.
- Sachs, J.D.; Lafortune, G.; Fuller, G.; Drumm, E. Implementing the SDG Stimulus. Sustainable Development Report 2023; Dublin University Press: Dublin, 2023. [Google Scholar] [CrossRef]
- Allen, C.; Metternicht, G.; Wiedmann, T. Initial progress in implementing the Sustainable Development Goals (SDGs): a review of evidence from countries. Sustainability Science 2018, 13, 1453–1467. [Google Scholar] [CrossRef]
- Sachs, J. The Age of Sustainable Development 2015. [CrossRef]
- del Río Castro, G.; Fernández, M.C.G.; Ángel Uruburu Colsa. Unleashing the convergence amid digitalization and sustainability towards pursuing the Sustainable Development Goals (SDGs): A holistic review. Journal of Cleaner Production 2021. [CrossRef]
- Troster, V. Testing for Granger-causality in quantiles. Econometric Reviews 2018, 37, 850–866. [Google Scholar] [CrossRef]
- Jeong, K.; Härdle, W. A CONSISTENT NONPARAMETRIC TEST FOR CAUSALITY IN QUANTILE. Econometric Theory 2007, 28, 861–887. [Google Scholar] [CrossRef]
- Hong, Y.; Liu, Y.; Wang, S. Granger Causality in Risk and Detection of Extreme Risk Spillover Between Financial Markets. Journal of Econometrics 2009, 150, 271–287. [Google Scholar] [CrossRef]
Figure 1.
GDP vs. Sustainability Score with Inclusiveness Score Interaction
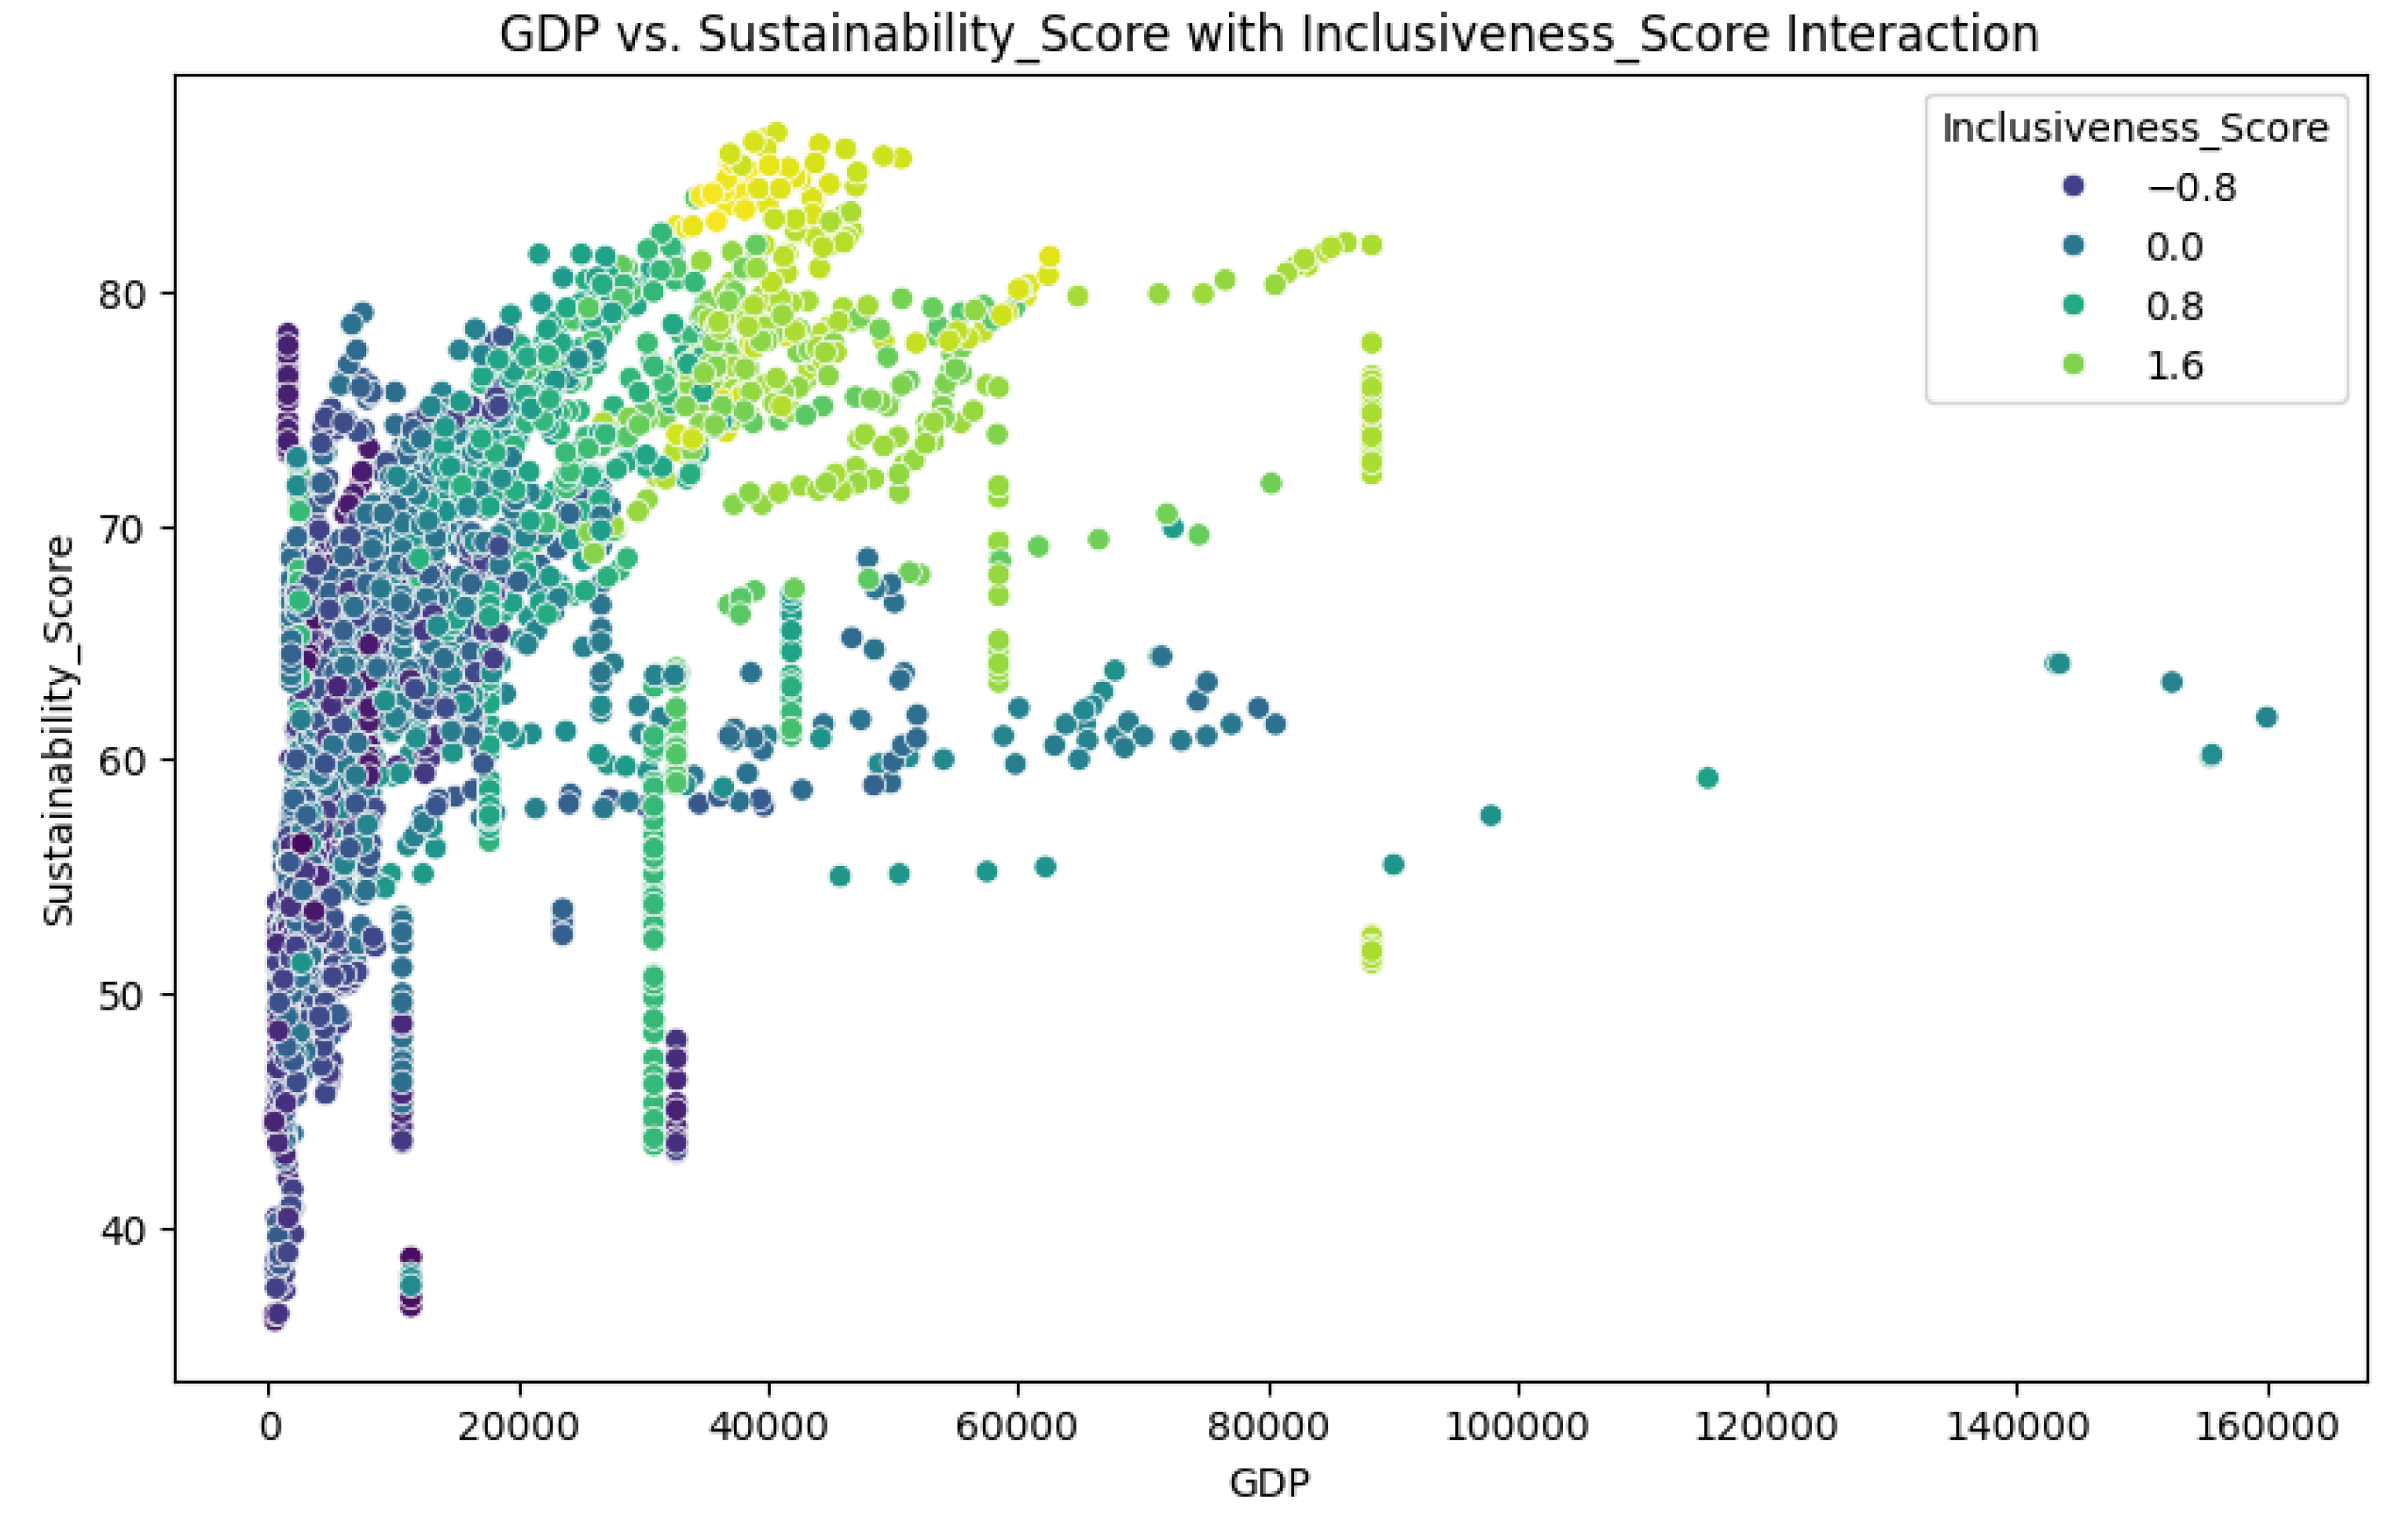
Figure 2.
GDP vs. Sustainability Score with Extractiveness Score Interaction
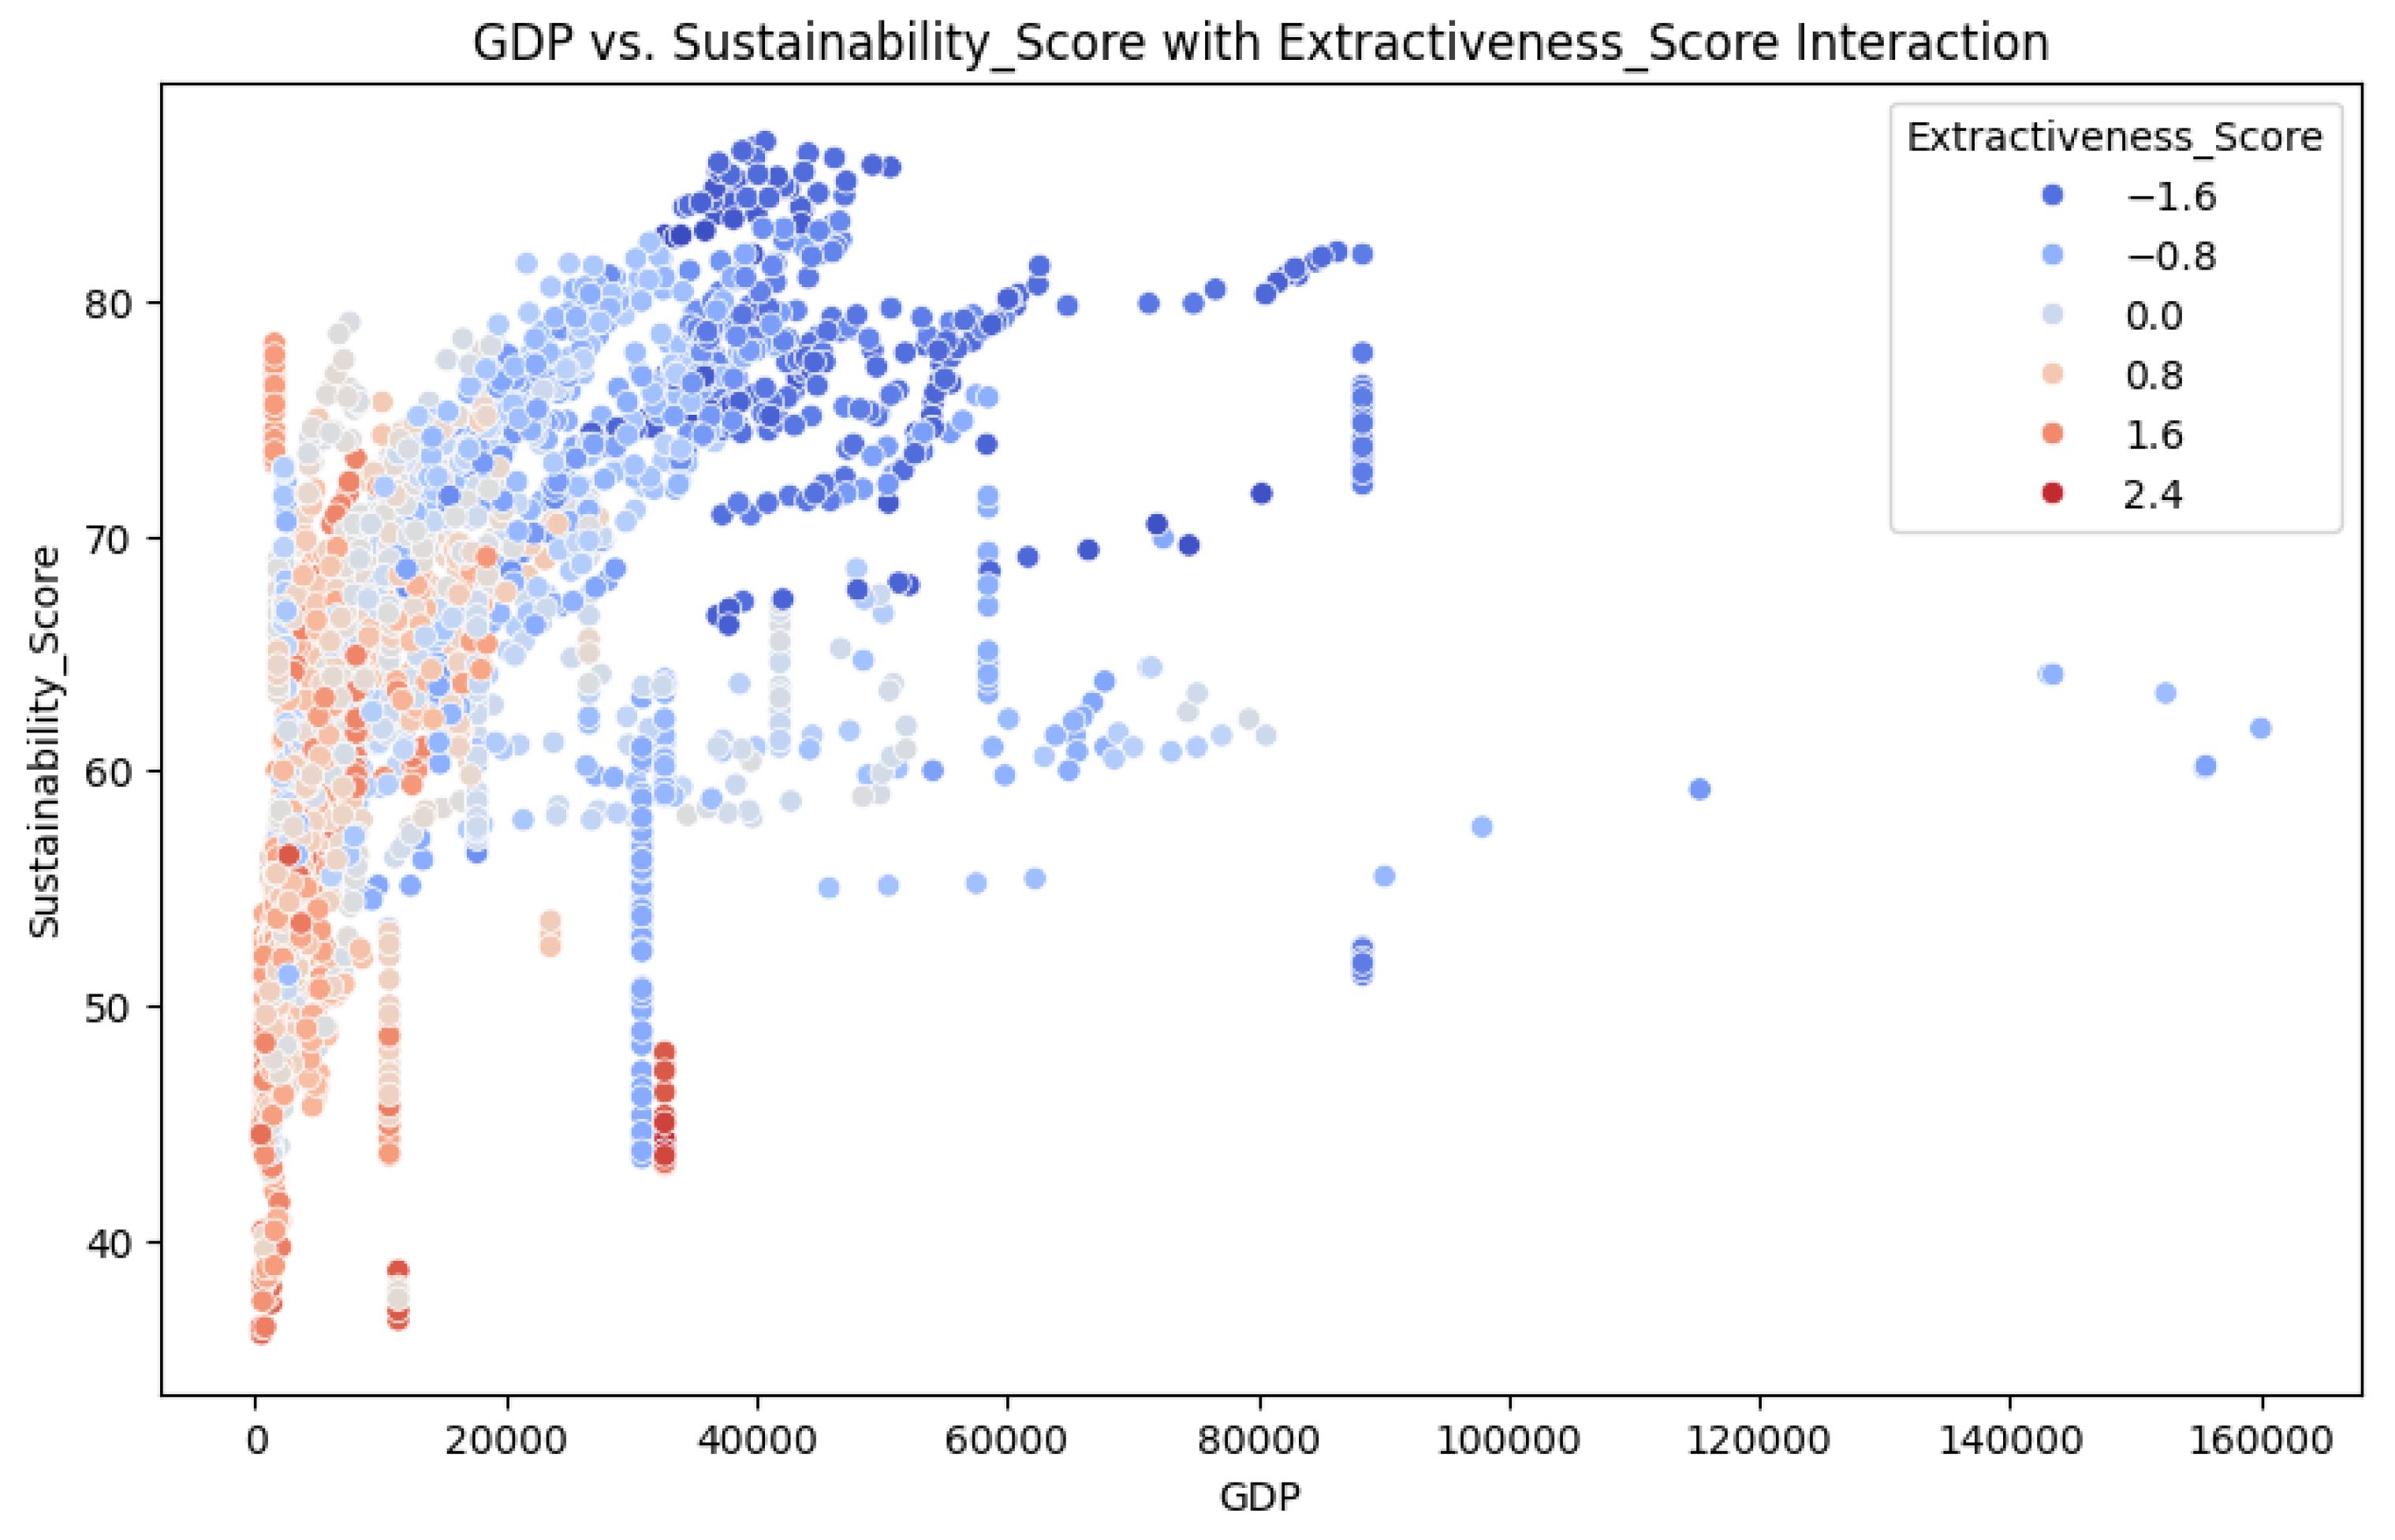
Figure 3.
Random Forest (left) vs Gradient Boosting (right) results
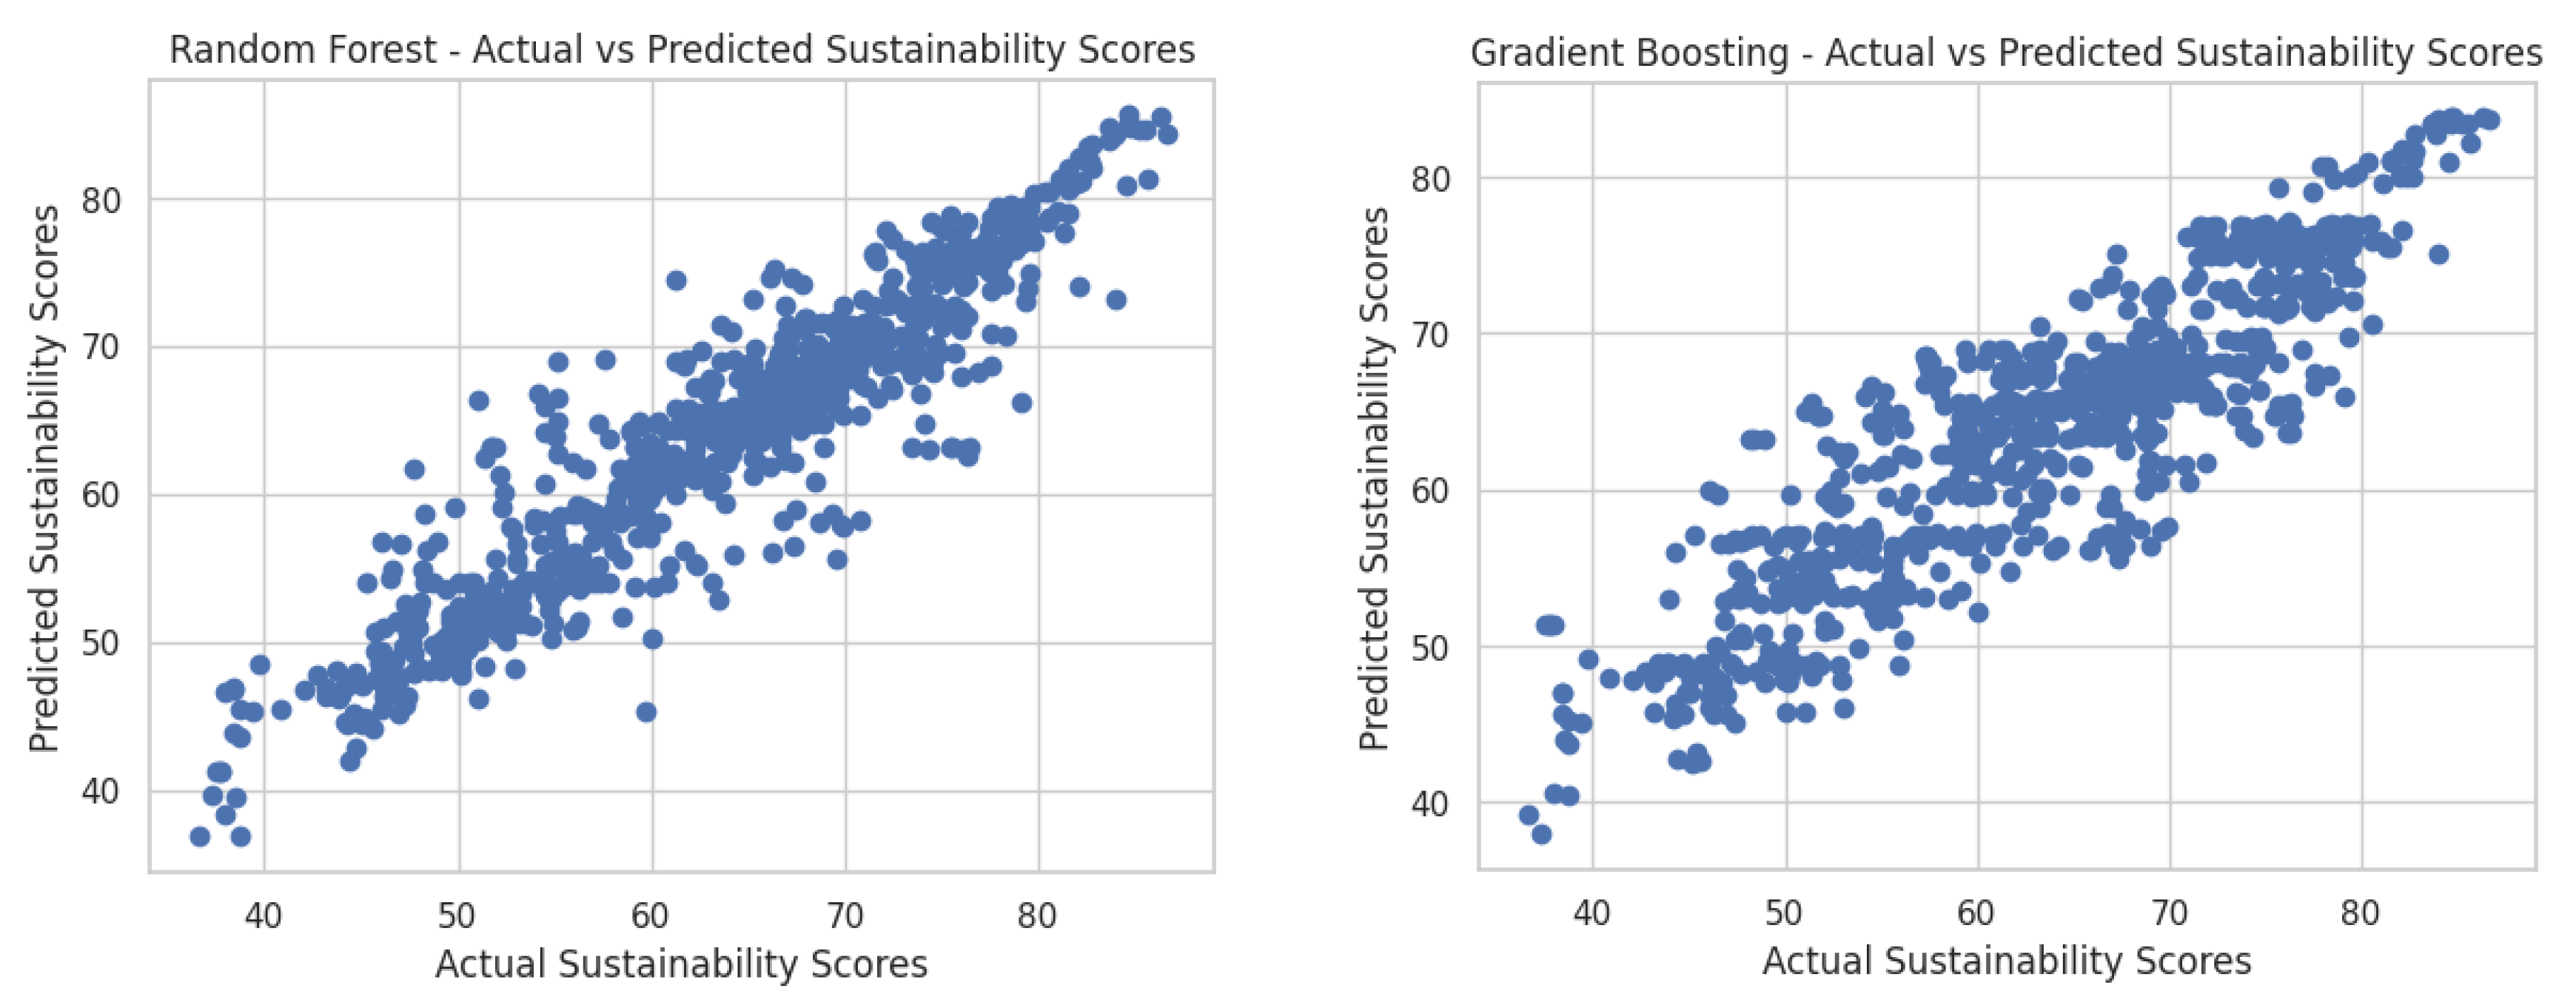
Figure 4.
Sustainability Score vs Inclusiveness Score, Extractiveness Score and GDP
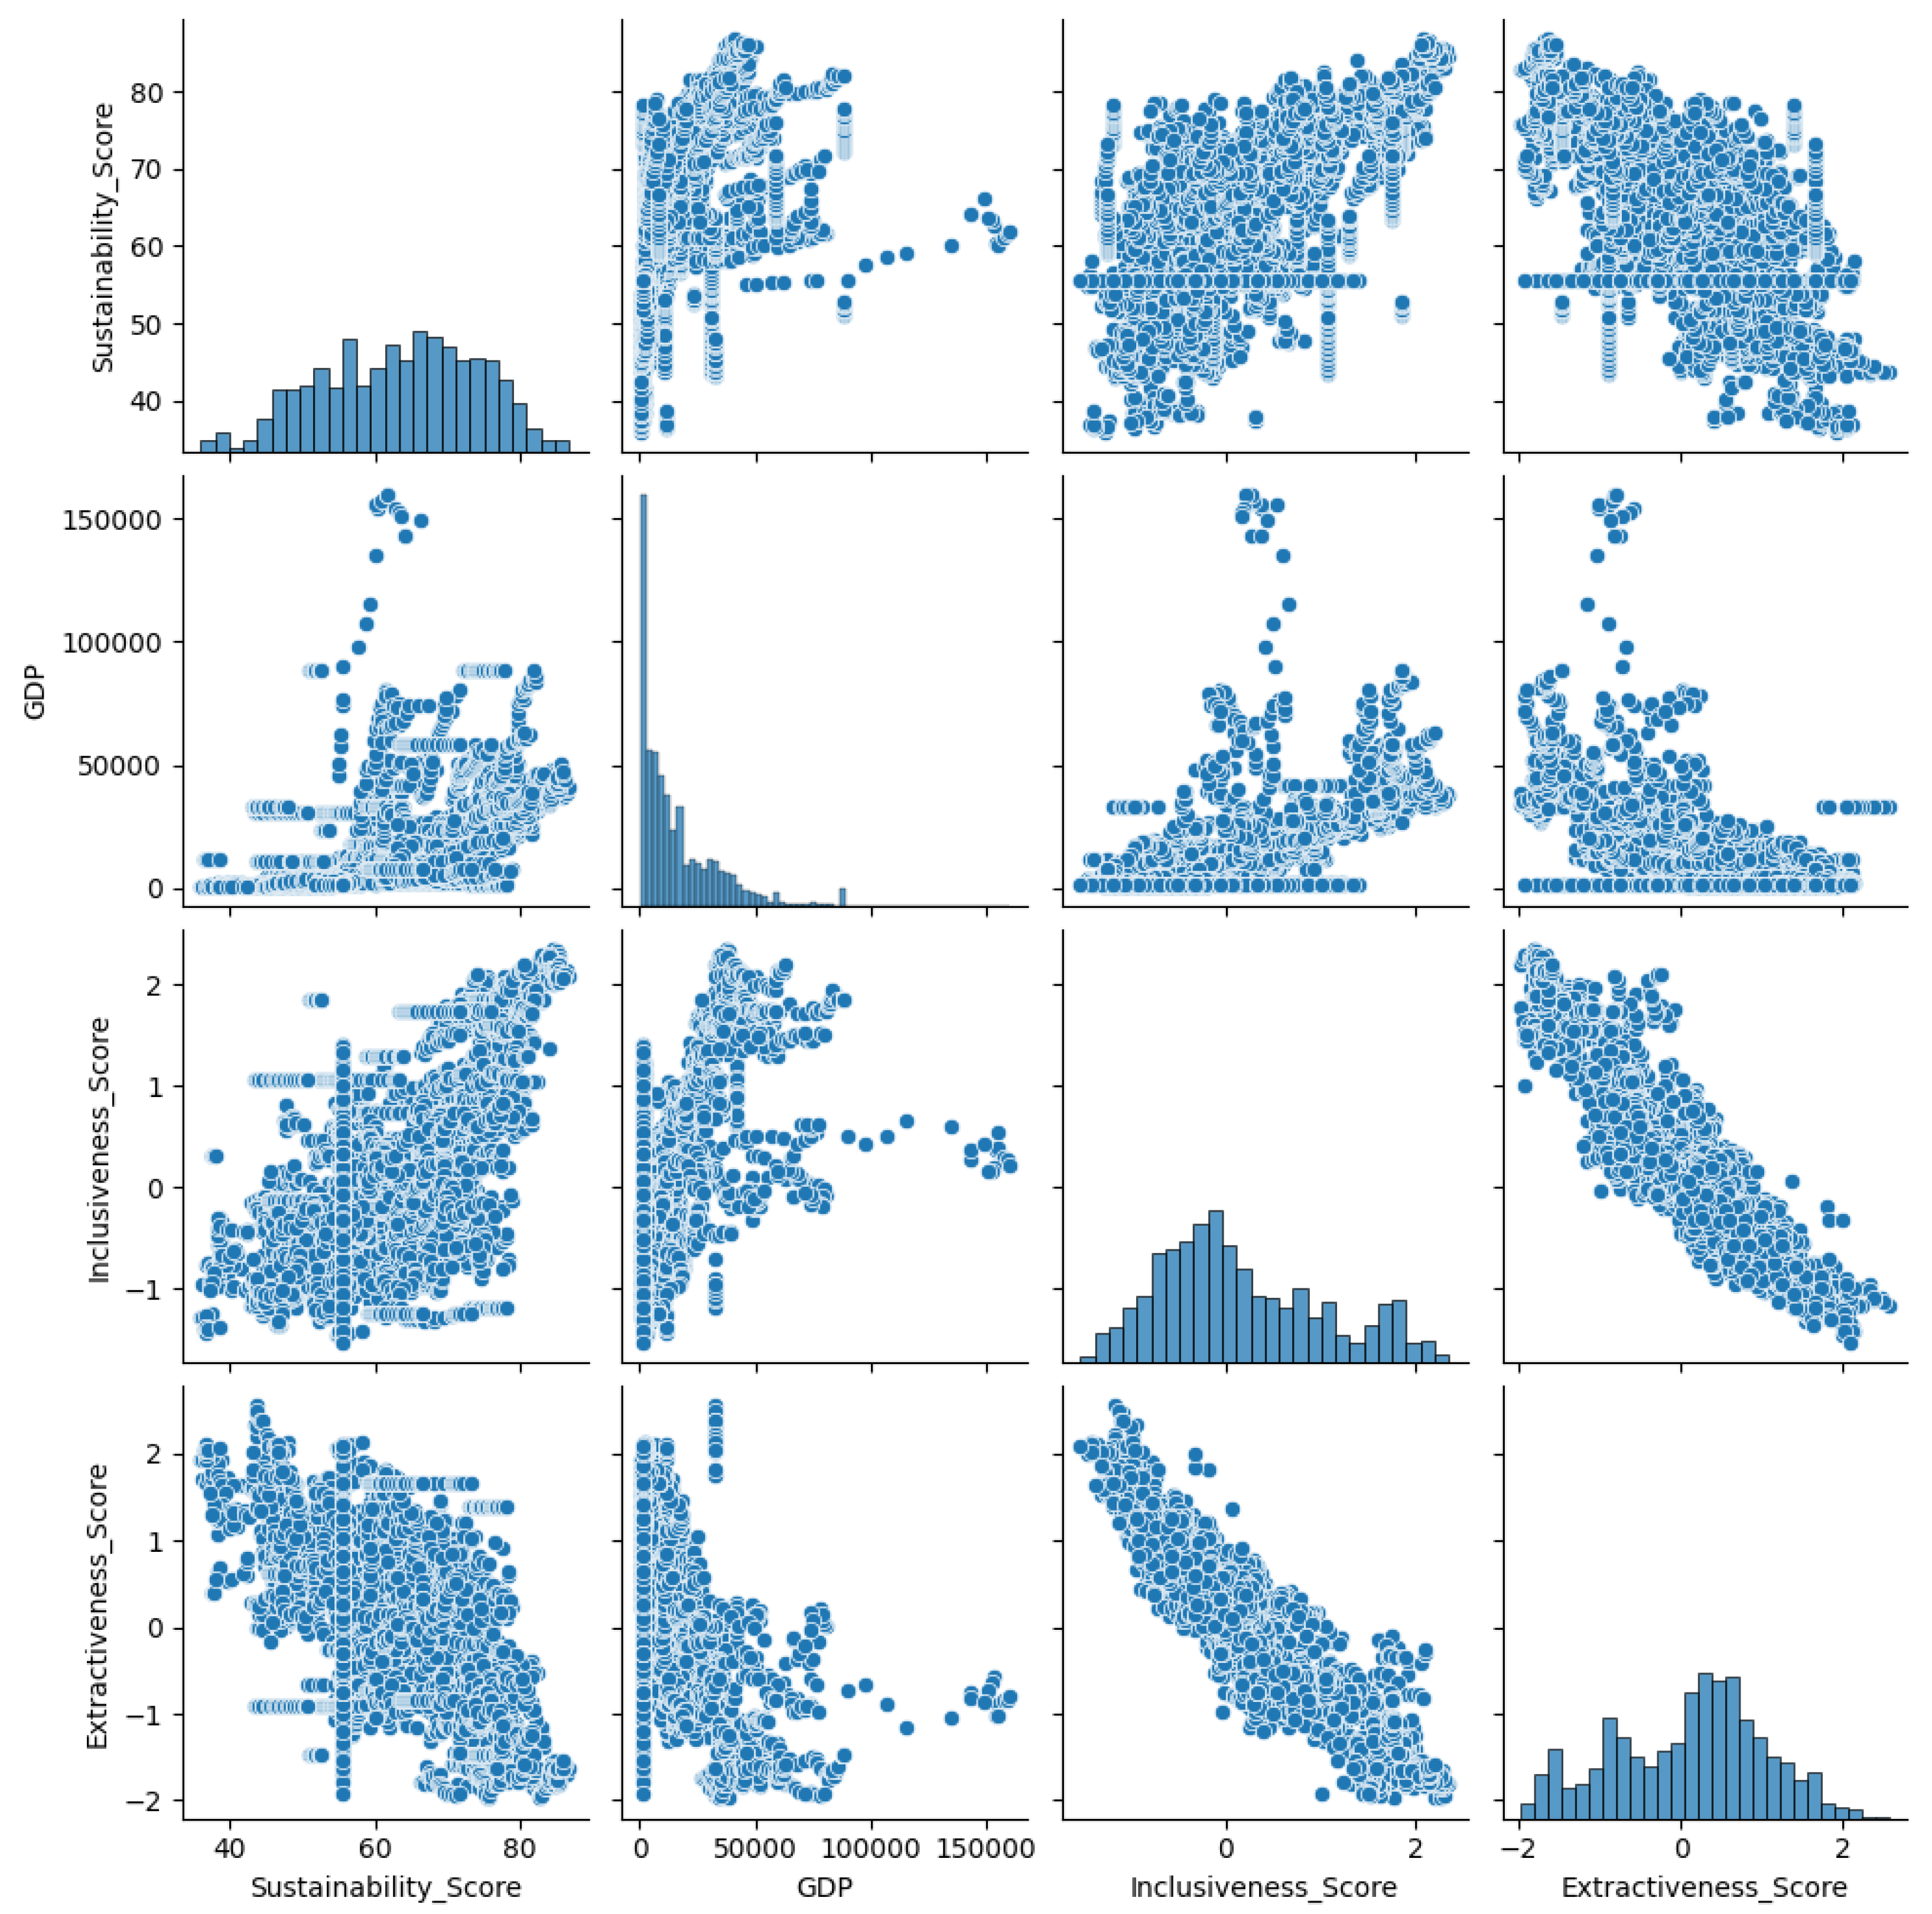
Table 1.
OLS Regression Results.
| Statistic | Value | Notes |
|---|---|---|
| Dependent Variable | Sustainability_Score | |
| R-squared | 0.367 | |
| Adjusted R-squared | 0.366 | |
| F-statistic | 830.8 | 1 |
| Prob (F-statistic) | 0.00 | Significant at the 0.01 level |
| Log-Likelihood | -15324 | |
| No. Observations | 4306 | |
| AIC | 30660 | Akaike Information Criterion |
| BIC | 30680 | Bayesian Information Criterion |
| Covariance Type | Nonrobust | |
| Variable | Coefficient | Confidence Interval (95%) |
| const | 63.3737 | [63.120, 63.628] |
| x1 | 2.9577 | [2.267, 3.649] |
| x2 | -2.8416 | [-3.516, -2.167] |
| x3 | 1.0927 | [0.752, 1.433] |
Table 2.
GLS Regression Results.
| Statistic | Value | Notes |
|---|---|---|
| Dependent Variable | Sustainability_Score | |
| R-squared | 0.367 | |
| Adjusted R-squared | 0.366 | |
| F-statistic | 830.8 | 1 |
| Prob (F-statistic) | 0.00 | Significant at the 0.01 level |
| Log-Likelihood | -15324 | |
| No. Observations | 4306 | |
| AIC | 30660 | Akaike Information Criterion |
| BIC | 30680 | Bayesian Information Criterion |
| Covariance Type | Nonrobust | |
| Variable | Coefficient | Confidence Interval (95%) |
| const | 63.3737 | [63.120, 63.628] |
| x1 | 2.9577 | [2.267, 3.649] |
| x2 | -2.8416 | [-3.516, -2.167] |
| x3 | 1.0927 | [0.752, 1.433] |
Table 3.
Robust Linear Model.
| Statistic | Value | Notes |
|---|---|---|
| Dependent Variable | log_Sustainability_Score | |
| Model | RLM | Robust Linear Model |
| Method | IRLS | Iteratively Reweighted Least Squares |
| Norm | HuberT | |
| Scale Estimation | MAD | Median Absolute Deviation |
| Covariance Type | H1 | |
| No. Observations | 4306 | |
| Df Residuals | 4302 | |
| Df Model | 3 | |
| Date | Fri, 20 Dec 2024 | |
| Time | 11:59:20 | |
| No. Iterations | 21 | |
| Variable | Coefficient | Confidence Interval (95%) |
| const | 4.1567 | [4.153, 4.161] |
| x1 | 0.0461 | [0.035, 0.057] |
| x2 | -0.0448 | [-0.056, -0.034] |
| x3 | 0.0205 | [0.015, 0.026] |
Table 4.
OLS Regression Results with Interactions
| Statistic | Value | Notes |
|---|---|---|
| Dependent Variable | Sustainability_Score | |
| Model | OLS | Ordinary Least Squares |
| Method | Least Squares | |
| Covariance Type | Nonrobust | |
| No. Observations | 4306 | |
| Df Residuals | 4300 | |
| Df Model | 5 | |
| Date | Fri, 20 Dec 2024 | |
| Time | 12:00:02 | |
| Variable | Coefficient | Confidence Interval (95%) |
| const | 63.3737 | [63.133, 63.614] |
| Inclusiveness_Score | 1.4549 | [0.640, 2.270] |
| GDP | -3.0980 | [-3.753, -2.443] |
| Extractiveness_Score | 8.2382 | [7.532, 8.945] |
| Extractiveness_GDP_Interaction | -1.2000 | [-1.725, -0.675] |
| Inclusiveness_GDP_Interaction | -6.1485 | [-6.721, -5.576] |
Disclaimer/Publisher’s Note: The statements, opinions and data contained in all publications are solely those of the individual author(s) and contributor(s) and not of MDPI and/or the editor(s). MDPI and/or the editor(s) disclaim responsibility for any injury to people or property resulting from any ideas, methods, instructions or products referred to in the content. |
© 2025 by the authors. Licensee MDPI, Basel, Switzerland. This article is an open access article distributed under the terms and conditions of the Creative Commons Attribution (CC BY) license (http://creativecommons.org/licenses/by/4.0/).
Copyright: This open access article is published under a Creative Commons CC BY 4.0 license, which permit the free download, distribution, and reuse, provided that the author and preprint are cited in any reuse.


