
Submitted:
05 January 2025
Posted:
06 January 2025
You are already at the latest version
Abstract
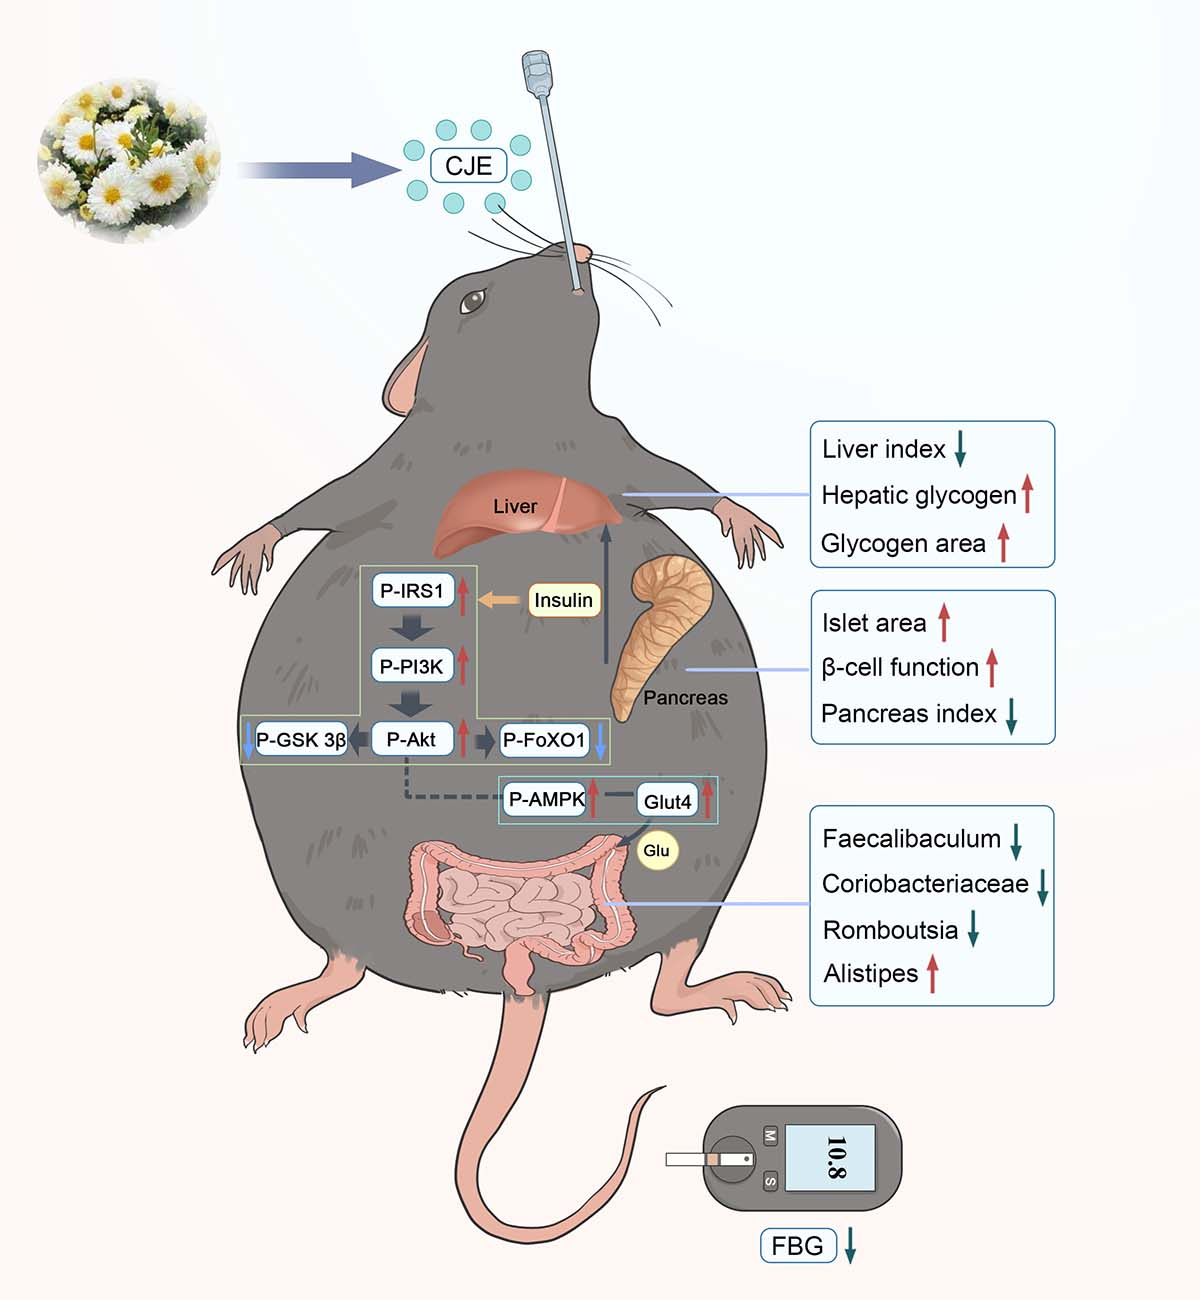
The prevention of type 2 diabetes mellitus (T2DM) and its associated complications is an urgent public health issue that affects hundreds of millions of people globally. Chuju has been proved to possess antihyperglycemic activity. However, the bioactive ingredients in chuju that contribute to antihyperglycemic activity as well as the relation between its antihyperglycemic activity and gut microbiota remain unclear. To understand the potential effect it has on T2DM, the glycolipid metabolism and gut microbiota regulation of flavonoids-rich extracts from chuju (CJE) were investigated. The results showed that CJE remarkably mitigated hyperglycemia and glycolipid metabolism by regulating the gut microbiota in T2DM mice. Furthermore, the macro-genome sequencing results showed that CJE intervention regulated the composition of gut microbiota in T2DM mice, characterized by downregulating the abundance of Faecalibaculum, Coriobacteriaceae, Romboutsia and up-regulating the abundance of Alistipes. In addition, CJE could promote glycogen synthesis, gluconeogenesis, glucose transport and inhibite glycolysis by regulating the expression of insulin-mediated IRS1-PI3K-Akt-FoxO1/GSK 3β pathway and non-insulin-mediated AMPK-GLUT4 pathway. Taken together, the results provided new evidence that CJE alleviate disturbance of glycolipid metabolism via regulating gut microbiota and mediating IRS1-PI3K-Akt-FoxO1/GSK 3β, AMPK-GLUT4 pathway.
Keywords:
Chuju extract
; Type 2 diabetes
; Glycolipid metabolism
; Gut microbiota
1. Introduction
Diabetes mellitus, as the commonest form of chronic metabolic disorder, which is characterized by persistent hyperglycemia, insulin resistance and an abnormally disturbance of glycolipid metabolism [1]. According to the latest epidemiological researches, the global prevalence of diabetes has risen dramatically in recent years, which will increase to 12.2% (783.2 million people) in 2045 [2], with nearly 90 % of diabetics are diagnosed with type 2 diabetes mellitus (T2DM) [3]. A persistently disturbance of glycolipid metabolism can lead to progressive lesions and even failure in multiple organs, including the eyes, kidneys, heart and blood vessels [4]. Consequently, the prevention and treatment of T2DM has become an urgent public health problem in the world. Currently, the main strategies for the treatment of T2DM are carbohydrate-restricted diet and coupled with hypoglycemic drugs, such as sulfonylureas, biguanides and lignans [5]. However, these drugs have undesirable side effects and toxicity for the body [6,7,8]. In recent years, the search for safe and nontoxic bioactive substances from natural sources to prevent and ameliorate of T2DM has attracted the attention of more and more food nutritionists.
The refers to the more than 1014 bacteria that reside in the human intestine, which participates in glucolipid metabolism [9], neurological function [10] and the immune response [11] for maintaining human health. Emerging study has suggested that intestinal flora plays a key role in the development of T2DM by metabolites of secondary bile acids and short-chain fatty acids for improving insulin resistance [12,13]. Consequently, regulating the homeostasis of intestinal flora should be regarded as a possible strategy for curing T2DM.
Chuju (Asteraceae Chrysanthemum L.) is a plant of the composite family, which is known as one of the four medicinal chrysanthemums and it has a long history of being used in traditional medicine and tea in China [14]. Chuju recognized as a plant with high nutritional value as well as anti-inflammatory [15], antioxidant [16] and hepatoprotective activities [17], which contains various phytochemical substance, including polysaccharides, flavonoids, phenolic acids, volatile oils and other natural active ingredients [18]. Additionally, flavonoids from chuju have been demonstrated to be beneficial to regulate the level of blood glucose [19]. However, the effect of flavonoid extracts from chuju on gut microbiota and the potential mechanism of alleviating disturbance of glycolipid metabolism remain unclear.
The aim of this study was to evaluated the effect of flavonoid extracts from chuju on the disturbance of glycolipid metabolism by a mouse model of type 2 diabetes, which was mediated via high-fat diet (HFD) with streptozotocin (STZ). Furthermore, the mechanism of flavonoids-rich extracts from chuju alleviated disturbance of glycolipid metabolism on T2DM mice via modulating the gut homeostasis was investigated. This study might provide a feasible strategy for applying natural active component by oral in ameliorating T2DM.
2. Materials and Methods
2.1. Materials and Chemicals
Chuju was purchased from Anhui Jutai Chuju herbal technology Co., LTD. AB-8 macroporous resin, recombinant human insulin, rutin standards, streptozocin (STZ), metformin hydrochloride and sodium citrate buffer were purchased from Beijing Solarbio Science & Technology Co., Ltd. (Beijing, China). D-(+)-Glucose, sucrose, anhydrous ethanol were obtained from Sigma-Aldrich (St. Louis, MO, USA). The primary antibodies IRS-1, phosphor-Akt (p-Akt) (Ser473), phosphor-FoxO1 (p-FoxO1) (Ser256), phosphor-GSK-3β (p-GSK3β) (Ser9), β-actin were obtained from Wuhan service biotechnology Co., Ltd. (Wuhan, China). AMPKα, phosphor-AMPKα (p-AMPK) (Thr172), FoxO1, GLUT4 were purchased from Affinity (Cincinnati, OH, USA). Phosphor-IRS-1 (p-IRS-1) (Ser307), PI3K, phosphor-PI3K (p-PI3K) (Tyr467/199), Akt, GSK-3β were obtained from Abmart (Shanghai, China).
2.2. Preparation of Flavonoid from Chuju
The CJE was extracted by the method of ultrasonic assisted ethanol solvent extraction according to the study of Huang et al (2024) with minor modifications [20]. Freshly dried chuju was pulverized and sieved to a particle size of less than 100 mesh. 100 g of chuju powder and 3100 mL of ethanol solution (77 % v/v) were mixed and extracted with ultrasonica extractor at 200 W for 25 min at 45 ℃ (GS-100A multi-function ultrasonic machine, Shenzhen, China). Subsequently, the homogenate was centrifuged at 6000 rpm for 20 min at 4 °C. An equal volume of anhydrous ethanol was added to the supernatant and stored in refrigerator for 12 h at 4 °C to precipitate carbohydrates and proteins in supernatant. Then, the supernatant was dried in a vacuum freeze-dryer to obtain the flavonoids extract of chuju. The obtained extract of flavonoids (500 mg/mL) were subjected to a chromatography column (2.5 × 100 cm) packed with AB-8 macroporous resin (M0042) to fractionate the different components. The separation was performed at a flow rate of 2.0 mL/min with 35 % (v/v) ethanol solution at room temperature. The separated components were assayed using an ultraviolet detector at 280 nm. Finally, the separated components were dried in a vacuum freeze-dryer for further analysis.
The compositions of CJE were measured by an ultra-high pressure liquid chromatography system equipped with a 6600 QTOF detector (UPLC-QTOF) (Water, CA, USA) with an ACQUITY UPLC HSS T3 column (1.8μm, 2.1×100mm). The UPLC-QTOF conditions are based on previous study [21]. The main components of flavonoids were Apigenin 6, 8-digalactoside, Dicaffeoyl quinolactone, Apigenin 6-C-glucoside 8-C-arabinoside, Luteolin-4'-O-glucoside, Isoshaftoside, Quercetin 3-O-malonylglucoside, Chrysoeriol 7-O-glucoside, Scutellarin, Quercetin-3, 4'-O-di-beta-glucoside and Luteolin 6-C-glucoside 8-C-arabinoside (Table 1). Moreover, the content of total flavonoids in CJE was 78.57±5.18 %. Simultaneously, the remaining components mainly consisted of protein (5.48 ± 1.03 %) and sugar (4.22 ± 0.94 %).
2.3. Animal Experiments
Seventy male C57BL/6 mice (4-week-old, 18–20 g) with the animal certificate number SCXK (Jin) 2022-006 were obtained from the SPF Biotechnology Co., Ltd (Beijing, China). The mice were adaptively fed for one week at 25 ± 2 ℃ and 60 ± 5 % relative humidity with a 12-h light-dark cycle and free access to water and food. All the experiments were approved by the biomedical ethics committee of Anhui University and were carried out in strict accordance with the guidelines.
The experimental design is shown in Figure 1A. Excluding one week of adaptation, the mice were randomly divided into 2 group of feeding with basal diet (n=20) and high-fat diet (D12492, Xietong Pharmaceutical Bio-engineering Co., Ltd., Jiangsu, China) (n=50). After 15 weeks, the mice on high-fat diet were given once STZ (dissolved in 0.1 mol/L citrate buffer, pH 4.5) at a dose of 100 mg/kg body weight (BW) by intraperitoneal injection after fasting overnight. By contrast, the mice on basal diet were given same volume of citrate buffer (0.1 mol/L, pH 4.5) by intraperitoneal injection. Then, fasting blood glucose (FBG) of mice on high-fat diet were measured by Accu-Chek glucometers (Roche Diagnostics, Mannheim, Germany) after one week. The level of FBG more than 11.1 mmol/L in two consecutive analysis was considered as successful construction of the T2DM mice models [22]. Subsequently, the mice on basal diet were randomized into two groups: normal control group (NC, n = 10) and normal mice with CJE group (NC+CJE, 400 mg/kg/day, n = 10). The T2DM mice were randomly divided into five groups (n = 10): positive control group (PM, metformin, 200 mg/kg/day), diabetic control group (DC), diabetic with low-dose CJE group (CL, 100 mg/kg/day), diabetic with medium-dose CJE group (CM, 200 mg/kg/day) and diabetic with high-dose CJE group (CH, 400 mg/kg/day). The normal control group and the diabetic control group were oral gavaged equal amount of normal saline once daily for an additional 6 weeks. CJE and metformin were dissolved in sterile saline. During the whole experiment, normal control group and normal mice with CJE group were fed with a basal diet, others were fed with a high-fat diet. The levels of FBG, food intake, water consumption and body weight of each group were monitored weekly. After the last week of the experiment, all mice were fasted overnight. Finally, all mice were euthanized in a CO2 chamber, followed by the collection of blood, liver, colon, pancreas, and white adipose tissue (WAT) (including epididymal fat, perirenal fat and mesenteric fat) for further analysis.
2.4. Oral Glucose and Insulin Tolerance Tests
The oral glucose tolerance test (OGTT) were investigated according to previously described with minor modifications [23]. After 6 weeks of CJE treatment by gavage, the OGTT was performed in all mice from normal control group, normal mice with CJE group, diabetic control group, positive group and diabetic with CJE groups. All mice were orally administrated with 2 g/kg BW glucose after depriving of food for 12 h while water was still provided ad libitum. The levels of blood glucose were determined after glucose administration in a different time period (0, 15, 30, 60, 90 and 120 min) by Accu-Chek glucometers.
Insulin tolerance test (ITT) was evaluated according to previous study with minor modifications [24]. Mice were intraperitoneally injected with human recombinant insulin (0.75 unit/kg BW) and the blood was taken from tail tip for measuring the concentration of blood glucose by using Accu-Chek glucometers at 0, 15, 30, 60, 90 and 120 min post-injection. For mitigate stress-induced hyperglycemia, all mice were pinched tails to acclimatize prior to OGTT and ITT for a week [25,26].
2.5. Biochemical Parameter Analysis
Serum was collected after 3500 rpm centrifugation for 20 min at 4 °C. The levels of glycogen, fasting serum insulin (FINS), glycosylated serum protein (GSP), total triglyceride (TG), total cholesterol (TC), low-density lipoprotein cholesterol (LDL-C), high-density lipoprotein cholesterol (HDL-C) were assayed using commercially available kits from Nanjing Jiancheng Bioengineering Institute (Nanjing, China). Homeostasis model assessment of insulin resistance (HOMA-IR), β-cell function (HOMA-β), and quantitative insulin sensitivity check index (QUICKI) were calculated according to the following formulas, respectively [27]:
HOMA-IR = FBG (mmol/L) × FINS (mIU/L)/22.5
HOMA-β = 20 × FINS (mIU/L)/[FBG (mmol/L) - 3.5]
QUICKI = Ln[FINS (mIU/L) × FBG (mmol/L)]−1
2.6. Histological Assessment
Liver, pancreas and colon tissue were fixed with 4% paraformaldehyde solution at 4°C more than 24 h. Then embedded in paraffin and sectioned into 5 μm slices by freezing microtome (CRYOSTAR NX50, Thermo Fisher Scientific,Shanghai ,China). Liver, pancreas and colon tissue were stained with hematoxylin-eosin (H&E) (hematoxylin dye for 5 min, wash with distilled water, return to blue solution, wash again; the sections were dehydrated with 95 % alcohol for 5 min, and then stained with eosin solution for 15 sec) to observe histopathological morphology. with Periodic Acid-Schiff (PAS) (PAS solution B dye for 15 min, rinse thrice with distilled water, then PAS solution A dye for 25 min in the dark, wash with distilled water, and then PAS solution C dye for 30 s, wash, treat the slices with Hydrochloric acid solution and Ammonia) to measure liver glycogen levels and with Oil Red O (oil red O solution dye for 10 min in the dark, 60 % isopropyl alcohol for differentiation, wash with distilled water, and hematoxylin dye for 5 min) to observe condition of lipid accumulation. All images were scanned using a Pannoramic DESK (3DHISTECH). Quantification of islet area and total hepatic glycogen area was assessed using Image J software (National Institutes of Health, Bethesda, MD).
2.7. Analysis of Gut Microbiota
DNA of gut microbiota was extracted from the cecal contents according to the instructions of the Omega EZNATM fecal DNA extraction kit (Omega Bio-tek, Norcross, GA, U.S.). The concentration of DNA in the extract was quantitatively analyzed by a NanoDrop 1000 nucleic acid concentration analyzer (Thermo Scientific, Wilmington, USA), and the quality of DNA was qualitatively analyzed by electrophoresis on 1 % agarose gels. The samples meeting the sequencing requirements (with DNA concentration greater than 50 ng/μL and clear bands) were stored in the refrigerator at -80 ℃. Thermal cycle PCR (GeneAmp 9700, ABI, USA) was used to analyze the structure of intestinal microbiota based on the V3-V4 variable region of the bacterial 16S rRNA gene. The V3-V4 variable region of the 16S rRNA gene of the bacterial genome was amplified with 338F (5’-ACTCCTACGGGAGGCAGCAGCAG-3’) and 806R (5’-GGACTACHVGGGTWTCTAAT-3’) as primers. The results were analyzed using the Majorbio cloud platform (https://www.majorbio.com).
2.8. Western Blot Analysis
The liver tissues were thoroughly homogenized with 10 times the volume of RIPA buffer containing 1% protease inhibitors for 60 s. After adding the loading buffer, all protein samples were denatured in a boiling water bath for 15 min. Collect the supernatant by centrifuging 12,000 g for 30 min at 4°C, which was the total protein solution. The protein concentration in the supernatant was determined by using the BCA protein concentration assay kit (Wuhan Xavier Biotechnology Co., LTD, Wuhan, China). Aliquots containing 5 ul protein samples were separated by 10% sodium dodecyl sulfate-polyacrylamide gel electrophoresis (SDS-PAGE) at 80V for 40min and upgrade to 120 V. The bands were transferred from the glue onto a polyvinylidene fluoride (PVDF) membranes under the action of a constant current of 300 mA for 55 min. After sealing for 1 h, PVDF membranes were washed with TBST 3 times, each time for 5 min. PVDF membranes were performed using the primary monoclonal antibodies against p-IRS1, IRS1, p-PI3K, PI3K, p-Akt, Akt, p-FoxO1, FoxO1, p-GSK 3β, GSK 3β, p-AMPK, AMPK, GLUT4 (all dilution ratios 1:1000), respectively and incubated at 4 °C overnight. After washing the membranes by TBST, the HRP-conjugated secondary antibodies were performed using at room temperature for 1 h (1:5000). Used anti-Rabbit β-actin as internal reference. The Western blot images were captured with the AIWBwell System (Wuhan servicebio technology Co., Ltd., Wuhan, China) and quantified by densitometric analysis using Image J software (National Institutes of Health, Bethesda, MD).
2.9. Statistical Analysis
All datas were presented as mean ± SEM. Significant differences among all groups were calculated using one-way ANOVA followed by the Bonferroni post hoc test. All statistical analysis was performed using Graph Pad Prism 8.0.2 software (GraphPad Software, La Jolla, CA).
3. Results
3.1. CJE Ameliorated Basal Physiological Indicators in T2DM Mice
Increment in FBG, food intake, water consumption and weight loss are generally considered as the indicators to evaluate the occurrence of type 2 diabetes. Compared with the NC group, the level of FBG in DC group was significantly increased and remained above 11.1 mmol/L after pretreatment of high-fat diet combined with STZ (Figure 2A). Those results indicated that the model of diabetic mice was successfully established. Simultaneously, the levels of weight loss, energy intake and water consumption in diabetic mice with the medium and high dose of CJE treatment were significantly higher (P<0.05) than those of DC group (Figure 1B-E). In addition, the basal physiological indicators, including liver index, pancreas index and WAT index, were explored in diabetic mice with oral administration of CJE. The results showed that CJE administration could effectively slowed down the trend of weight loss and significantly lower the increase in the levels of water consumption, energy intake, liver index, pancreas index and WAT index in diabetic mice (Figure 1F-H).
3.2. CJE Alleviated Hyperglycemia and Insulin Resistance in T2DM Mice
The effects of CJE dosage on the level of FBG in diabetic mice were investigated in this study. As shown in Figure 2A, the level of FBG in normal mice with oral administration of CJE at dose of 400 mg/kg/day was not significantly different (P > 0.05) in comparison to the NC group. In contrast, compared with the DC group, the levels of FBG in CL, CM, CH group were significantly decreased (P<0.05) in a dose-dependent manner. These results indicated that CJE alleviate disturbance of FBG on type 2 diabetic mice. Moreover, GSP is taken as a key clinical indicator to diagnose the level of glycemic control, which is used to reflect the average level of blood glucose in the 1-3 weeks prior to the measurement [28]. As shown in Figure 2B, the level of GSP in the DC group significantly increased (P<0.05) compared with those of the NC and CJE group. On the contrary, the levels of GSP in diabetic mice treated with metformin (PM group) and CJE (CL, CM and CH group) significantly decreased in comparison to the DC group. Moreover, the levels of GSP in CH group were lower than in CL and CM group. This result indicated that CJE could significantly ameliorate the increasing trend of GSP level in diabetic mice with a dose-dependent manner.
OGTT is commonly used to measure the ability of animal to respond to acute hyperglycemia. As shown in Figure 2D, the blood glucose of mice in each group increased dramatically and the blood glucose of mice in DC, CL and CM groups reached a peak value at 30 min, while in the NC, CJE, PM, and CH groups reached a peak value at 15 min after glucose gavage. Compared to the DC group, the blood glucose of mice in PM, CL, CM and CH groups were significantly decreased (P<0.05) at the termination of the 120 min OGTT experiment. Simultaneously, the area under curve (AUC) of OGTT was significantly decreased in PM (50.45 %), CL (21.50 %), CM (31.28 %) and CH (42.30 %) groups compared with the DC group at the end of OGTT experiment (Figure 2E). ITT is commonly used to evaluate the ability of animal to insulin sensitivity. As shown in Figure 2F, the blood glucose of mice in PM, CL, CM and CH groups were significantly decreased (P<0.05) at the termination of the 120 min ITT experiment. Notably, the CH group was able to achieve the same efficacy as the PM group. Compared with the DC group, the area under curve (AUC) of ITT was significantly decreased in PM (68.24 %), CL (37.40 %), CM (49.23 %) and CH (63.17 %) groups at the end of ITT experiment (Figure 2G). The results definitely showed that CJE could significantly enhance glucose tolerance and improve insulin tolerance.
Insulin is a key hormone in animals used to lower blood glucose, which is considered as an important index reflecting the storage and secretion function of insulin cells. Compared with the NC group, the level of serum insulin significantly increased (P < 0.05) in the DC group. As shown in Figure 2C, the levels of serum insulin significantly decreased (P < 0.05) in PM (45.07 %), CL (15.10 %), CM (22.14 %) and CH (37.52 %) groups in comparison to the DC group. The levels of HOMA-IR, HOMA-β and QUICKI are commonly used to assess islet β-cell function and insulin resistance. Compared with the NC group, the level of HOMA-IR significantly increased (P < 0.05) in the DC group. As shown in Figure 2H, the levels of HOMA-IR significantly decreased (P < 0.05) in CL (38.33 %), CM (52.21 %) and CH (69.44 %) groups in comparison to the DC group. Concurrently, the levels of HOMA-β and QUICKI in DC group significantly decreased (P < 0.05) in comparison to the NC group. As illustrated in Figure 3I, the levels of HOMA-β in CM (44.08 %) and CH (62.81 %) groups significantly increased (P < 0.05) in comparison to the DC group. Compared with the DC group, the level of QUICKI significantly increased (P < 0.05) in the CL (8.43 %), CM (13.07 %) and CH (23.31 %) group (Figure 2J). These results suggested that CJE could effectively improve glucose tolerance and insulin sensitivity to ameliorate the insulin resistance.
3.3. CJE Improved the Damage of Pancreatic Morphology and β Cell Function in T2DM Mice
The pancreas plays an important role in the control of blood glucose by secreting insulin and glucagon [29]. Compared with the NC group, the pathological of the pancreas appeared the unorganized distribution of histiocytes with accompanied by focal necrosis and lymphocytic infiltration (Figure 3A). This result indicated that CJE treatment could significantly improve pancreatic injury in diabetic mice. Pancreatic β cells belong to the endocrine part of the pancreas, which is responsible for the secretion of insulin to maintain the body's blood glucose levels and closely related to the occurrence of type 2 diabetes [30]. The pancreatic β cells of normal mice were large, plump and regular in shape with clear edges. Nevertheless, the pancreatic β cells showed atrophy and apoptosis with significant reduction in volume and number, irregular cell morphology with accompanied by blurred area margins in T2DM mice. Compared with DC group, the ratio of β cell area to pancreatic area increased in a dose-dependent manner after GJE intervention (Figure 3B). The area of the largest beta cells in the pancreas was significantly increased after medium and high doses of CJE treatment (Figure 3C). These results suggested that CJE could alleviate the disorders of glucose metabolism in T2DM mice by improving the pathological structure of the pancreas and promoting the regeneration of pancreatic β cells.
3.4. CJE Regulated Lipid Profile Disorders and Ameliorated Liver Injury in T2DM Mice
The liver is one of the important organs for regulation of glucolipid metabolism, which played an important role in the pathogenesis of diabetes [31]. Previous study had confirmed that the disorder of lipid metabolism was closely related to fatty liver, insulin resistance and hyperglycemia [32]. As shown in Figure 4D-G, the levels of TC (4.1 mmol/L), TG (1.7 mmol/L) and LDL-C (2.74 mmol/L) in DC group were significantly higher (P < 0.05) in comparison to the NC group. On the contrary, the levels of HDL-C (1.45 mmol/L) significantly decreased in DC group. Fortunately, the levels of TC, TG and LDL-C significantly decreased (P < 0.05) in diabetic mice with moderate and high doses of administration of CJE. Simultaneously, the decreasing trend of HDL-C was significantly ameliorated in CM and CH groups.
In addition, the pathological organization of the livers were investigated in this study. Compared with NC group, the pathological of the livers were stained with H&E and O red exhibited massive lipid accumulation and degeneration accompanied in DC group. The levels of lipid accumulation and degeneration were significantly alleviated with administration of CJE in a dose-dependent manner (Figure 4A). In addition, as the main organ for glucose production and storage, the liver plays a key role in maintaining glucose homeostasis by regulating glycogen synthesis and breakdown and gluconeogenesis pathways [33]. The results of PAS staining showed that the area of liver glycogen in DC group decreased significantly, accounting for only 33.08 % of NC group, but showed a dose-dependent increase after CJE administration. Compared with DC group, the area of liver glycogen in PM, CL, CM, CH and groups increased by 170.94 %, 52.93 %, 108.84 % and 141.44 %, respectively (Figure 4B). At the same time, the content of liver glycogen in T2DM mice was significantly increased in CM (44.94 %) and CH (76.06 %) group in comparison to the DC group (Figure 4C). This suggested that CJE could promote the ability of glycogen synthesis and storage in T2DM mice. The results of liver pathological sections showed a similar change trend with blood glucose and lipid levels, indicating that the intervention of CJE could effectively improve the disorders of glucose and lipid metabolism in T2DM mice.
3.5. CJE Intervened Intestinal Microbiota Diversity and Composition of T2DM Mice
Recent study proved that the disorder of glucose and lipid metabolism in diabetic patients was interrelated to the imbalance of intestinal homeostasis [34]. Therefore, the effect of CJE on gut microbiota composition and function was investigated in this study. The Simpson and Shannon indices of the DC group were not significantly different (P > 0.05) in comparison to the NC, CJE, and CH groups (Figure 5A). These results showed that the flora richness and community diversity of the gut microbiota were not significantly different in all the group, which were consistent with previous studies [22,35]. The effects of CJE on beta diversity and structural clustering of gut microbiota were evaluated in this study. The results showed that the microbial community structure and composition of DC group and NC group were completely separated, indicating that the composition and structure of gut microbiota in diabetic mice were significantly altered (Figure 5B). Moreover, the microbial community in the CH group showed a high similarity with that in the NC group after CJE intervention, suggesting that CJE can improve the structure of gut microbiota in diabetic mice. The gut microbiome health index (GMHI) in DC group was significantly lower than that in NC group, indicating that the dysbiosis of gut microbiota was existed in diabetic mice (Figure 5C). Compared with the DC group, the GMHI was significantly increased in diabetic mice with a high dose of CJE treatment, which suggested that CJE could significantly improve the gut health index in diabetic mice. As shown in Figure 5D, the number of unique OTUs in NC group, CJE group, DC group, PM group and CH group was 111, 182, 877, 97 and 97, respectively (Figure 5D). These results indicated that the number of species of gut microbiota in T2DM mice was significantly lower than that in healthy mice, which were reversed by CJE treatment. The phylotypes of GM were analysed at the phylum, genus and species levels among the different groups. The gut microbiota of mice at the phylum level was mainly composed of Firmicutes, Bacteroides, Verrucomicrobia, Proteobacteria, Actinobacteria and Deferribacterota (Figure 5E and F). Compared with NC group, the abundance of Firmicutes was increased (72.37%) and Bacteroides was significantly decreased (4.796 %) in DC group, which was consistent with the observation of Zhao et al [36] (Figure 5G and H). Furthermore, the F/B ratio of DC group was significantly higher than that of NC group, which were reversed by CJE treatment (Figure 5I). Compared with NC group, the abundances of Faecalibaculum, Mucispirillum, Colidextribacter, Romboutsia in the DC group were significantly increased and the abundances of norank_f__Muribaculaceae, Helicobacter, Alistipes and norank_f__UCG-010 were significantly reduced in the genus level (Figure 5J and K). As shown in Figure S2A-D, the abundance of Faecalibaculum, Coriobacteriaceae_UCG-002, Romboutsia were significantly decreased and Ileibacterium was significantly increased in T2DM mice with CJE treatment.
The abundances of Faecalibaculum_rodentium,Mucispirillum_schaedleri,uncultured_bacterium_g__Colidextribacter and Romboutsia_ilealis in the DC group were significantly increased and the abundances of uncultured_bacterium_g__norank_f__Muribaculaceae and uncultured_Bacteroidales_bacterium_g_norank_f__Muribaculaceae were significantly reduced in the species level (Figure 5L and M). As shown in Figure S2E-H, the abundance of Faecalibaculum_rodentium,bacterium_g__Coriobacteriaceae_UCG-002 and Romboutsia_ilealis were significantly decreased and Ileibacterium_valens was significantly increased in T2DM mice with CJE treatment. These results suggested that CJE can significantly improve the disorder of gut microbiota in diabetic mice.
3.6. CJE Improved Metabolic Homeostasis of T2DM Mice by Mediating Intestinal Microbiota
The analysis of LEfSe was used to compare the relative abundance of species among gut microbiota and the bacteria with significant differences between groups were identified from the phylum, genus and species levels. The results showed that Bacteroidetes and Firmicutes were the top enriched key differential bacteria between NC group and DC group (Figure 6A), which was consistent with the analysis at the phylum level (Figure 5E, F). As shown in Figure 5J-M, compared with NC group, the key difference in bacterial flora of Faecalibaculum,Mucispirillum,Colidextribacter and Romboutsia were significantly increased in DC group. The key difference in bacterial flora of Ileibacterium, Clostridia, Lachnoclostridium and Alistipes were significantly increased in T2DM mice after CJE intervention (Figure 6B). These results suggested that CJE might improve the disorders of glucose and lipid metabolism in T2DM mice by increasing the abundance of Alistipes and reducing the abundance of Faecalibaculum, Coriobacteriaceae and Romboutsia.
In order to explore the relationship between the body homeostasis index and gut microbiota in T2DM mice under the intervention of CJE, Db-RDA analysis was performed based on distance matrix. Db-RDA analysis showed that CJE intervention was negatively correlated with blood glucose homeostasis indexes FBG, GSP, TC, TG, LDL-C, FINS, HOMA-IR and positively correlated with HDL-C, HOMA-β and QUICKI (Figure 6C). As shown in Figure 6D, the abundance of Alistipes was negatively correlated with FBG, GSP, TC, TG, LDL-C, FINS, HOMA-β, and positively correlated with HDL-C, HOMA-β, QUICKI and hepatic glycogen. The dominant bacteria of Faecalibaculum, Coriobacteriaceae and Romboutsia enriched in T2DM mice showed a completely opposite correlation with various homeostasis indicators, and the abundances of these three bacteria were significantly reduced after CJE intervention. These results indicated that CJE interfered the gut microbiota of Alistipes, Faecalibaculum, Coriobacteriaceae and Romboutsia, which were closely related to glucose and lipid metabolism homeostasis in T2DM mice. Combined with the analysis of 16S rRNA sequencing data from eggNOG database, it was observed that the intestinal flora of each group was involved in a variety of functions, mainly focused on energy production and conversion, gene expression, and the transport and metabolism of carbohydrates, amino acids, lipids and coenzymes (Figure 6E). The metabolic pathways of the sequencing data were predicted based on the Kyoto Encyclopedia of Genes and Genomes (KEGG) database. The results showed that in the second level, carbohydrate, amino acid and energy metabolism pathways as well as membrane transport pathways dominated the functions of gut microbiota (Figure 6F).
3.7. CJE Regulated Hypoglycemic Signaling Pathways in in the Liver of T2DM Mice
The expression levels of marker proteins in key pathways of glucose metabolism were determined for elucidating the mechanism of CJE regulating glucose and lipid metabolism disorders by western blotting. The results showed that the phosphorylation levels of IRS1, PI3K and Akt in DC group were lower, accounting for only 43.36 %, 42.77 % and 37.60 % of NC group (Figure 7A-C). Compared with DC group, the phosphorylation levels of IRS1 (58.62 %), PI3K (85.05 %) and Akt (108.76 %) were significantly increased in T2DM mice with a high dose of CJE treatment (Figure 7A-C). GSK-3β and FoxO1 are negatively regulated genes related to glucose metabolism. Activation of PI3K-Akt pathway further inhibits the phosphorylation of GSK-3β and FoxO1 in healthy mice [37]. As the phosphorylation of AKT, an indirect substrate of insulin signaling pathway, was inhibited in T2DM mice, the phosphorylation levels of GSK-3β and FoxO1 in the liver of DC group were significantly higher than those of NC group (Figure 7D, E). However, this change was significantly reversed by CJE administration. These results suggested that CJE could activate the phosphorylation of IRS1-PI3K-Akt pathway and inhibit the phosphorylation of FoxO1/GSK-3β to promote hepatic gluconeogenesis, and glycogen synthesis for improving glucose metabolism disorders and insulin resistance in T2DM mice. AMPK, as a key regulator of energy balance by increasing glucose uptake and inhibiting intracellular glucose production [38], plays an important role in the prevention and treatment of diabetes [39]. The phosphorylation level of AMPK in the liver of DC group mice was significantly lower than that of the control group, which were reversed by CJE treatment (Figure 7F). The expression level of GLUT4 protein directly affects the body's glucose utilization [40]. When GLUT4 is involved in an insulin-independent glucose uptake pathway, its expression level is regulated by AMPK [41]. The up-regulation of AMPK phosphorylation activated the expression of GLUT4, and the expression level of GLUT4 in T2DM mice was significantly increased after CJE intervention (Figure 7G). Compared with the DC group, the expression of GLUT4 in the high dose group was up-regulated by 83.84 %. This suggested that CJE can up-regulate GLUT4 expression by activating AMPK phosphorylation, thereby increasing glucose transport and uptake capacity in T2DM mice.
4. Discussion
In this study, the diabetic mouse model induced by HFD and STZ was used as the experimental object to explore the therapeutic effect and mechanism of CJE on T2DM mice. Firstly, the water intake, food intake and body weight of the mice were monitored every week, and it was found that the T2DM mice showed obvious symptoms of "three more and one less" (Figure 1B-E), indicating that the model was successfully established. Secondly, the organ indexes of the mice in each group were measured and calculated (Figure 1F-H). The results showed that CJE significantly improved many basic indexes of T2DM mice, which preliminarily indicated that CJE had the potential to treat T2DM.
The results of blood glucose monitoring showed that CJE had significant hypoglycemic activity and could reduce the fasting blood glucose level in T2DM mice in a dose-dependent manner (Figure 2A), and the intervention with a high dose of CJE could achieve a similar therapeutic effect as metformin. At the same time, it was found that CJE intervention with 6 weeks of high-dose had no significant effect on FBG levels in normal healthy mice, indicating that CJE has no potential risk of inducing hypoglycemia. GSP is the product of a slow, non-enzymatic glycation reaction of various proteins in serum with glucose, which reflects the average blood glucose level over a 3-week period [28]. The GSP of T2DM mice was significantly reduced by CJE intervention (Figure 2B), which was consistent with the change trend of FBG, and further confirmed that CJE could reduce hyperglycemia caused by T2DM. CJE intervention significantly increased the ability of T2DM mice to regulate blood glucose in the OGTT and ITT experiments, and the efficacy of CJE at a high dose was similar to that of metformin (Figure 2D, F). These results suggested that CJE could maintain glucose homeostasis by increasing glucose tolerance and insulin sensitivity in T2DM mice. Type 2 diabetes mellitus is characterized by insulin resistance and pancreatic β-cell dysfunction [42]. The results showed that FINS, HOMA-IR, HOMA-β and QUICKI of T2DM mice were significantly decreased after CJE intervention (Figure 2C, H-J), which indicated that CJE could effectively alleviate insulin resistance, increase islet β cell function and insulin sensitivity in T2DM mice. This is also consistent with the results of the ITT experiment.
As an important organ involved in the body's digestive and glucose metabolism pathways, the repair of pancreatic functional damage has been proved to be an effective way to treat T2DM [43]. H&E staining of pancreatic tissue showed that the pathological morphology of pancreas such as focal necrosis and inflammatory infiltration was significantly improved in T2DM mice after CJE intervention (Figure 3A). In addition, insulin is secreted by pancreatic β cells and plays an important role in maintaining the stability of blood glucose levels. The evaluation of the number and morphological function of β-cells has been recognized as the hallmark of diabetes [44]. Compared with the DC group, the morphology of islet β cells in the CJE intervention groups was restored, and the number and area of islet β cells showed a dose-dependent increase (Figure 3B and C). These results suggest that CJE ameliorates glucose metabolism disorders in T2DM mice by ameliorating pancreatic pathological morphology, inhibiting apoptosis and promoting regeneration of pancreatic β-cells.
The liver is the largest digestive gland in the human body. It has a variety of functions such as storage, immunity, filtration, and directly participates in a variety of metabolic pathways in the body. Moreover, as one of the important target organs of insulin, the liver plays an important role in the balance between glycogenolysis and gluconeogenesis [31]. PAS staining showed that CJE could significantly increase the area and content of liver glycogen in T2DM mice and restore glycogen storage (Figure 4A-C). At the same time, as an important organ of lipid synthesis and metabolism, the liver plays a dominant role in maintaining lipid homeostasis. It has been reported that T2DM is closely related to liver inflammatory infiltration, steatosis and other lesions [45]. CJE intervention could significantly treat the abnormal morphology and structure of hepatocytes in T2DM mice, effectively improve the pathological changes such as lipid accumulation and steatosis according to the pathological structure of liver tissue observation (Figure 3A). Lipid metabolism pathways are negatively affected in T2DM mice due to impaired liver function. Previous studies have shown that abnormal lipid deposition in the liver of T2DM is closely related to insulin resistance, which is usually accompanied by different degrees of lipid metabolism disorders in the body [32,46]. In this study, the intervention of CJE with a high dose could significantly inhibit the abnormal changes of four items of blood lipids in T2DM mice (Figure 3D-G). These results suggested that CJE can improve glucose and lipid metabolism disorders in T2DM mice by repairing liver pathological damage.
Gut microbiota plays an important role in a variety of metabolic pathways. A large number of studies have shown that gut microbial imbalance is closely related to the pathogenesis of T2DM, and the regulation of gut microbial can improve obesity and glucose and lipid metabolism disorders caused by T2DM [13,47]. Flavonoids could improve glucose and lipid metabolism disorders in T2DM mice by remodeling the gut microbiota [48]. CJE intervention improved the gut microbiome health index (Figure 5C) and gut microbiota richness (Figure 5A, B, D) in T2DM mice, which effectively ameliorated the dysbiosis of gut microbiota caused by T2DM. At the phylum level, CJE intervention reversed the increase in Firmicutes abundance and the decrease in Bacteroides abundance in T2DM mice (Figure 5E-H), significantly reducing the F/B ratio (Figure 5I). This efficacy has been confirmed for a variety of polyphenols [41,49,50,51]. Faecalibaculum, Coriobacteriaceae and Romboutsia, as the top key differential flora in the abundance of T2DM mice, were significantly down-regulated after CJE intervention (Figure 5J, L and Fig.6A, B). A high-fat, high-sugar diet induces an increase in the abundance of Faecalibaculum rodentium, which provides additional energy to the host and promotes lipid accumulation [52,53]. The abundance of Coriobacteriaceae is significantly increased in patients with T2DM [54], which promotes fat accumulation and leads to insulin resistance [55], which has been confirmed to be closely related to blood glucose and insulin indicators [56]. Down-regulation of Romboutsia_ilealis, which is involved in the metabolism of multiple amino acids and fatty acids and lipid accumulation in the liver, has been shown to be an effective way to improve colitis and maintain gut homeostasis [57,58,59]. The reported trends in abundance of these bacterial groups are consistent with our study. Meanwhile, CJE significantly reversed the downregulation of Alistipes abundance induced by T2DM. This result indicated that Alistipes could effectively control blood glucose and alleviate insulin resistance, which is consistent with the results of Takeuchi et al [60]. In this study, CJE improved the glucolipid metabolism disorders of T2DM mice by regulating the abundance of Faecalibaculum, Coriobacteriaceae, Romboutsia and Alistipes, which are closely related to metabolic indicators (Figure 6C and D).
The PI3K/Akt pathway regulates metabolic processes such as hepatic gluconeogenesis, glycolysis and glycogen synthesis [61,62], plays a key role in insulin signaling and is essential for maintaining the homeostasis of glucose and lipid metabolism [63]. As the mediator of most metabolic effects of insulin receptor (INSR) activation, phosphorylation of IRS-1 is required for the development of insulin sensitivity, thereby activating PI3K [64,65]. PI3K is an intracellular signaling enzyme with two subunits, p85 and p110, whose effects on hepatic glucose and lipid metabolism are mediated through Akt [66], and recruitment of PI3K significantly promotes the phosphorylation of Akt [67]. Akt, a downstream target of PI3K, is an important multifunctional protein kinase [68]. Activated Akt can inhibit the protein expression of GSK3β and promote the synthesis of liver glycogen [69]. As a transcription factor invo lved in G6P and PEPCK activation, FoxO1 is responsible for the regulation of hepatic gluconeogenesis [70]. However, activation of the PI3K/Akt pathway inhibits the phosphorylation of FoxO1 [71]. In this study, CJE could significantly activate the phosphorylation of RS1-PI3K-Akt and inhibit the phosphorylation of GSK 3β and FoxO1 in T2DM mice (Figure 7A-E). AMPK is a key regulator in maintaining cellular energy homeostasis [72]. CJE significantly upregulated AMPK phosphorylation in T2DM mice (Figure 7F). It has been shown that AMPK is closely related to the PI3K/AKT signaling pathway and that activation of AMPK can improve insulin resistance by promoting oxidative consumption of fatty acids in the liver and reducing ectopic accumulation of lipids [73,74]. Numerous studies have shown that hepatic gluconeogenesis and glycogen synthesis are also improved through the insulin-independent AMPK pathway [75]. GLUT4 is the major protein responsible for glucose transport and plays an important role in glucose uptake and metabolism [76]. The activation of PI3K/AKT can up-regulate the expression of GLUT4 and improve insulin resistance, which is an insulin-mediated regulation [77,78]. Phosphorylated AMPK activates GLUT4 expression, which in turn promotes glucose transport to the cell membrane [79], a non-insulin-mediated mechanism of glucose uptake [41,80]. CJE could inhibit gluconeogenesis and promote glycogen synthesis through the insulin-mediated IRS1-PI3K-Akt-FoxO1/GSK 3β pathway, and increase glucose transport through the non-insulin-mediated AMPK-GLUT4 pathway, thereby regulating glucose and lipid metabolism disorders in T2DM mice.
5. Conclusions
In this study, we found that the CJE could significantly improve hyperglycemia in T2DM mice. CJE could significantly improve glucose tolerance and insulin sensitivity in T2DM mice by reducing liver lipid accumulation, promoting the regeneration and recovery of islet β cells, and reducing insulin resistance to improve glucose and lipid metabolism disorders in T2DM mice. Simultaneously, CJE has the ability to improve the disorder of intestinal flora, and can improve the structure of gut microbiota in T2DM mice in the direction of healthy mice. CJE can down-regulate the phosphorylation of FoXO1 and GSK3β by activating PI3K-AKT signaling pathway, thereby promoting glycogen synthesis and inhibiting gluconeogenesis. In addition, CJE up-regulates the expression of GLUT4 by activating the AMPK pathway, thereby promoting glucose transport. These results indicated the potential value of CJE as a drug for the treatment of T2DM, and provided a theoretical basis for the high-value utilization of GJE.
Supplementary Materials
The following supporting information can be downloaded at the website of this paper posted on Preprints.org.
Author Contributions
Conceptualization, Methodology, Investigation, Writing - original draft, Y.Y.; Supervision, S.J.Z; Writing - review & editing, W.E., Z.Q.T. and S.J.Z.; funding acquisition, S.J.Z. and W.N. All authors have read and agreed to the published version of the manuscript.
Funding
This study was funded by the Scientific Research Program of Anhui Province (No. 2023AH051632); Anhui University Natural Science Research Major Project (No. KJ2021ZD0133); Open fund project of State Key Laboratory of applied Optics (SKLAO2021001A19).
Institutional Review Board Statement
The animal research protocol was approved by the Institutional Animal Care and Use Committee of Anhui University. Approval code: IACUC(AHU) -2024-097. Approval date: 29 October 2024.
Informed Consent Statement
Not applicable.
Data Availability Statement
The original contributions presented in the study are included in the article/Supplementary Material, further inquiries can be directed to the corresponding authors.
Conflicts of Interest
The authors declare no conflicts of interest.
References
- Cole, J. B.; Florez, J. C. Genetics of diabetes mellitus and diabetes complications. Nat. Rev. Nephrol. 2020, 16, 377–390. [Google Scholar] [CrossRef] [PubMed]
- Sun, H.; Saeedi, P.; Karuranga, S.; Pinkepank, M.; Ogurtsova, K.; Duncan, B. B.; Stein, C.; Basit, A.; Chan, J. C. N.; Mbanya, J. C.; Pavkov, M. E.; Ramachandaran, A.; Wild, S. H.; James, S.; Herman, W. H.; Zhang, P.; Bommer, C.; Kuo, S.; Boyko, E. J.; Magliano, D. J. IDF Diabetes Atlas: Global, regional and country-level diabetes prevalence estimates for 2021 and projections for 2045. Diabetes Res. Clin. Pract. 2022, 183, 109119. [Google Scholar] [CrossRef] [PubMed]
- Saeedi, P.; Petersohn, I.; Salpea, P.; Malanda, B.; Karuranga, S.; Unwin, N.; Colagiuri, S.; Guariguata, L.; Motala, A. A.; Ogurtsova, K.; Shaw, J. E.; Bright, D.; Williams, R.; IDF Diabetes Atlas Committee. Global and regional diabetes prevalence estimates for 2019 and projections for 2030 and 2045: Results from the International Diabetes Federation Diabetes Atlas, 9th edition. Diabetes Res. Clin. Pract. 2019, 157, 107843. [Google Scholar] [CrossRef] [PubMed]
- Peer, N.; Balakrishna, Y.; Durao, S. Screening for type 2 diabetes mellitus. Cochrane Database Syst. Rev. 2020, 5, CD005266. [Google Scholar]
- Gong, Y.; Zhang, J.; Gao, F.; Zhou, J.; Xiang, Z.; Zhou, C.; Wan, L.; Chen, J. Structure features and in vitro hypoglycemic activities of polysaccharides from different species of Maidong. Carbohydr. Polym. 2017, 173, 215–222. [Google Scholar] [CrossRef]
- Asman, A. G.; Hoogendoorn, C. J.; McKee, M. D.; Gonzalez, J. S. Assessing the association of depression and anxiety with symptom reporting among individuals with type 2 diabetes. J. Behav Med. 2020, 43, 57–68. [Google Scholar] [CrossRef] [PubMed]
- Cao, Y.; Zou, S.; Xu, H.; Li, M.; Tong, Z.; Xu, M.; Xu, X. Hypoglycemic activity of the Baker's yeast β-glucan in obese/type 2 diabetic mice and the underlying mechanism. Mol Nutr Food Res. 2016, 60, 2678–2690. [Google Scholar] [CrossRef] [PubMed]
- Wu, J.; Shi, S.; Wang, H.; Wang, S. Mechanisms underlying the effect of polysaccharides in the treatment of type 2 diabetes: A review. Carbohydr. Polym. 2016, 144, 474–494. [Google Scholar] [CrossRef] [PubMed]
- Keshet, A.; and Segal, E. Identification of gut microbiome features associated with host metabolic health in a large population-based cohort. Nat. Commun. 2024, 15, 9358. [Google Scholar] [CrossRef] [PubMed]
- Loh, J. S.; Mak, W. Q.; Tan, L. K. S.; Ng, C. X.; Chan, H. H.; Yeow, S. H.; Foo, J. B.; Ong, Y. S.; How, C. W.; Khaw, K. Y. Microbiota-gut-brain axis and its therapeutic applications in neurodegenerative diseases. Signal Transduct. Target. Ther. 2024, 9, 37. [Google Scholar] [PubMed]
- Izadifar, Z.; Cotton, J.; Chen, S.; Horvath, V.; Stejskalova, A.; Gulati, A.; LoGrande, N. T.; Budnik, B.; Shahriar, S.; Doherty, E. R.; Xie, Y.; To, T.; Gilpin, S. E.; Sesay, A. M.; Goyal, G.; Lebrilla, C. B.; Ingber, D. E. Mucus production, host-microbiome interactions, hormone sensitivity, and innate immune responses modeled in human cervix chips. Nat. Commun. 2024, 15, 4578. [Google Scholar] [CrossRef] [PubMed]
- Allin, K. H.; Nielsen, T.; Pedersen, O. Mechanisms in endocrinology: Gut microbiota in patients with type 2 diabetes mellitus. Eur. J. Endocrinol. 2015, 172, R167–R177. [Google Scholar] [CrossRef]
- Hosomi, K.; Saito, M.; Park, J.; Murakami, H.; Shibata, N.; Ando, M.; Nagatake, T.; Konishi, K.; Ohno, H.; Tanisawa, K.; Mohsen, A.; Chen, Y. A.; Kawashima, H.; Natsume-Kitatani, Y.; Oka, Y.; Shimizu, H.; Furuta, M.; Tojima, Y.; Sawane, K.; Saika, A.; Kondo, S.; Yonejima, Y.; Takeyama, H.; Matsutani, A.; Mizuguchi, K.; Miyachi, M.; Kunisawa, J. Oral administration of Blautia wexlerae ameliorates obesity and type 2 diabetes via metabolic remodeling of the gut microbiota. Nat. Commun. 2022, 13, 4477. [Google Scholar] [CrossRef] [PubMed]
- Cui, H.; Bai, M.; Sun, Y.; Abdel-Samie M. A., S.; Lin, L. Antibacterial activity and mechanism of Chuzhou chrysanthemum essential oil. J. Funct. Foods. 2018, 48, 159–166. [Google Scholar] [CrossRef]
- Han, Y.; Zhou, M.; Wang, L.; Ying, X.; Peng, J.; Jiang, M.; Bai, G.; Luo, G. Comparative evaluation of different cultivars of Flos Chrysanthemi by an anti-inflammatory-based NF-κB reporter gene assay coupled to UPLC-Q/TOF MS with PCA and ANN. J. Ethnopharmacol. 2015, 174, 387–395. [Google Scholar] [CrossRef] [PubMed]
- Zhan, G.; Long, M.; Shan, K.; Xie, C.; Yang, R. Antioxidant Effect of Chrysanthemum morifolium (Chuju) Extract on H2O2-Treated L-O2 Cells as Revealed by LC/MS-Based Metabolic Profiling. Antioxidants. 2022, 11, 1068. [Google Scholar] [CrossRef]
- Chen, L.; Liu, Y.; Huang, X.; Zhu, Y.; Li, J.; Miao, Y.; Du, H.; Liu, D. Comparison of Chemical Constituents and Pharmacological Effects of Different Varieties of Chrysanthemum Flos in China. Chem. Biodivers. 2021, 18, e2100206. [Google Scholar] [CrossRef] [PubMed]
- Wang, X.; He, Z.; Zhang, W.; Liu, X.; Yu, S.; Qian, Z. The Influence of Planting Sites on the Chemical Compositions of Chrysanthemum morifolium Flowers (Chuju) as Revealed by Py-GC/MS Combined with Multivariate Statistical Analysis. Chem. Biodivers. 2024, 21, e202401383. [Google Scholar] [CrossRef]
- Zhao, W.; Ge, Q.; Ding, Z.; Pan, L.; Gu, Z.; Liu, Y.; Cai, H. Network pharmacology and metabolomics-based detection of the potential pharmacological effects of the active components in Chrysanthemum morifolium ‘Chuju’. Journal of Chinese Pharmaceutical Sciences. 2022, 31, 412–428. [Google Scholar]
- 20 Huang, C.; Wang, Y.; Zhou, C.; Sun, Q.; Zhang, L.; Niu, Y.; Yao, D.; Song, L.; Okonkwo, C. E.; Phyllis, O.; Ma, H. Ultrasonic vacuum synergistic assisted ethanol extraction of steviol glycosides and kinetic studies. Ind. Crops Prod. 2024, 221, 119385. [Google Scholar] [CrossRef]
- 21 Jiang, T.; Li, X.; Wang, H.; Pi, M.; Hu, J.; Zhu, Z.; Zeng, J.; Li, B.; Xu, Z. Identification and quantification of flavonoids in edible dock based on UPLC-qTOF MS/MS and molecular networking. J. Food Compost. Anal. 2024, 133, 106339. [Google Scholar] [CrossRef]
- Han, C.; Kong, X.; Xia, X.; Huang, X.; Mao, Z.; Han, J.; Shi, F.; Liang, Y.; Wang, A.; Zhang, F. Effects of ginseng peptides on the hypoglycemic activity and gut microbiota of a type 2 diabetes mellitus mice model. J. Funct. Foods. 2023, 111, 105897. [Google Scholar] [CrossRef]
- Sun, L.; Jiang, J.; Jing, T.; Hu, D.; Zhu, J.; Zeng, Y.; Pang, Y.; Huang, D.; Cheng, S.; Cao, C. A polysaccharide NAP-3 from Naematelia aurantialba: Structural characterization and adjunctive hypoglycemic activity. Carbohydr. Polym. 2023, 318, 121124. [Google Scholar] [CrossRef] [PubMed]
- Zhong, Q. W.; Zhou, T. S.; Qiu, W. H.; Wang, Y. K.; Xu, Q. L.; Ke, S. Z.; Wang, S. J.; Jin, W. H.; Chen, J. W.; Zhang, H. W.; Wei, B.; Wang, H. Characterization and hypoglycemic effects of sulfated polysaccharides derived from brown seaweed Undaria pinnatifida. Food Chem. 2021, 341, 128148. [Google Scholar] [CrossRef] [PubMed]
- Nagy, C.; Einwallner, E. Study of In Vivo Glucose Metabolism in High-fat Diet-fed Mice Using Oral Glucose Tolerance Test (OGTT) and Insulin Tolerance Test (ITT). J. Vis. Exp. 2018, 56672. [Google Scholar] [CrossRef]
- Hull, R. L.; Hackney, D. J.; Giering, E. L.; Zraika, S. Acclimation Prior to an Intraperitoneal Insulin Tolerance Test to Mitigate Stress-Induced Hyperglycemia in Conscious Mice. J. Vis. Exp. 2020, 61179. [Google Scholar] [CrossRef]
- Tao, W.; Liu, D.; Guo, Z.; Han, P.; Ma, Y.; Wu, M.; Zhang, R.; He, J. Physicochemical properties, structural characterization, and antidiabetic activity of selenylated low molecular weight apple pectin in HFD/STZ-induced type 2 diabetic mice. Carbohydr. Polym. 2025, 348, 122790. [Google Scholar] [CrossRef]
- Liu, S.; Hou, H.; Yang, M.; Zhang, H.; Sun, C.; Wei, L.; Xu, S.; Guo, W. Hypoglycemic effect of orally administered resistant dextrins prepared with different acids on type 2 diabetes mice induced by high-fat diet and streptozotocin. Int. J. Biol. Macromol. 2024, 277, 134085. [Google Scholar] [CrossRef]
- Tu, J.; Liu, G.; Cao, X.; Zhu, S.; Li, Q.; Ji, G.; Han, Y.; Xiao, H. Hypoglycemic effects of wheat bran alkyresorcinols in high-fat/high-sucrose diet and low-dose streptozotocin-induced type 2 diabetic male mice and protection of pancreatic β cells. Food Funct. 2019, 10, 3282–3290. [Google Scholar] [CrossRef] [PubMed]
- Cui, D.; Feng, X.; Lei, S.; Zhang, H.; Hu, W.; Yang, S.; Yu, X.; Su, Z. Pancreatic β-cell failure, clinical implications, and therapeutic strategies in type 2 diabetes. Chin. Med. J. 2024, 137, 791–805. [Google Scholar] [CrossRef]
- Xiang, G.; Sun, H.; Chen, Y.; Guo, H.; Liu, Y.; Li, Y.; Lu, C.; Wang, X. Antioxidant and hypoglycemic activity of tea polysaccharides with different degrees of fermentation. Int. J. Biol. Macromol. 2023, 228, 224–233. [Google Scholar] [CrossRef] [PubMed]
- Wang, X.; Wang, Y.; Hou, J.; Liu, H.; Zeng, R.; Li, X.; Han, M.; Li, Q.; Ji, L.; Pan, D.; Jia, W.; Zhong, W.; Xu, T. Plasma proteome profiling reveals the therapeutic effects of the PPAR pan-agonist chiglitazar on insulin sensitivity, lipid metabolism, and inflammation in type 2 diabetes. Sci. Rep. 2024, 14, 638. [Google Scholar] [CrossRef]
- Gonzalez-Rellan, M. J.; Fondevila, M. F.; Fernandez, U.; Rodríguez, A.; Varela-Rey, M.; Veyrat-Durebex, C.; Seoane, S.; Bernardo, G.; Lopitz-Otsoa, F.; Fernández-Ramos, D.; Bilbao, J.; Iglesias, C.; Novoa, E.; Ameneiro, C.; Senra, A.; Beiroa, D.; Cuñarro, J.; Chantada-Vazquez, M. D.; Garcia-Vence, M.; Bravo, S. B.; Lima, N. D. S.; Porteiro, B.; Carneiro, C.; Vidal, A.; Tovar, S.; Müller, T. D.; Ferno, J.; Guallar, D.; Fidalgo, M.; Sabio, G.; Herzig, S.; Yang, W. H.; Cho, J. W.; Martinez-Chantar, M. L.; Perez-Fernandez, R.; López, M.; Dieguez, C.; Mato, J. M.; Millet, O.; Coppari, R.; Woodhoo, A.; Fruhbeck, G.; Nogueiras, R. O-GlcNAcylated p53 in the liver modulates hepatic glucose production. Nat. Commun. 2021, 12, 5068. [Google Scholar] [CrossRef] [PubMed]
- Lu, X.; Ma, J.; Li, R. Alterations of gut microbiota in biopsy-proven diabetic nephropathy and a long history of diabetes without kidney damage. Sci. Rep. 2023, 13(1), 12150. [Google Scholar] [CrossRef] [PubMed]
- Zhang, L.; Wang, Z.; Zhang, X.; Zhao, L.; Chu, J.; Li, H.; Sun, W.; Yang, C.; Wang, H.; Dai, W.; Yan, S.; Chen, X.; Xu, D. Alterations of the Gut Microbiota in Patients with Diabetic Nephropathy. Microbiol. Spectr. 2022, 10, e0032422. [Google Scholar] [CrossRef] [PubMed]
- Zhao, L.; Lou, H.; Peng, Y.; Chen, S.; Zhang, Y.; Li, X. Comprehensive relationships between gut microbiome and faecal metabolome in individuals with type 2 diabetes and its complications. Endocrine. 2019, 66, 526–537. [Google Scholar] [CrossRef] [PubMed]
- Lin, Y.; Pan, J.; Liu, Y.; Yang, H.; Wu, G.; Pan, Y. Acanthopanax trifoliatus (L.) Merr polysaccharides ameliorates hyperglycemia by regulating hepatic glycogen metabolism in type 2 diabetic mice. Front. Nutr. 2023, 10, 1111287. [Google Scholar] [CrossRef] [PubMed]
- Liu, H.; Qi, X.; Yu, K.; Lu, A.; Lin, K.; Zhu, J.; Zhang, M.; Sun, Z. AMPK activation is involved in hypoglycemic and hypolipidemic activities of mogroside-rich extract from Siraitia grosvenorii (Swingle) fruits on high-fat diet/streptozotocin-induced diabetic mice. Food Funct. 2019, 10, 151–162. [Google Scholar] [CrossRef] [PubMed]
- Aodah, A. H.; Alkholifi, F. K.; Alharthy, K. M.; Devi, S.; Foudah, A. I.; Yusufoglu, H. S.; Alam, A. Effects of kaempherol-3-rhamnoside on metabolic enzymes and AMPK in the liver tissue of STZ-induced diabetes in mice. Sci. Rep. 2024, 14, 16167. [Google Scholar] [CrossRef]
- Ying, L.; Wang, L.; Guo, K.; Hou, Y.; Li, N.; Wang, S.; Liu, X.; Zhao, Q.; Zhou, J.; Zhao, L.; Niu, J.; Chen, C.; Song, L.; Hou, S.; Kong, L.; Li, X.; Ren, J.; Li, P.; Mohammadi, M.; Huang, Z. Paracrine FGFs target skeletal muscle to exert potent anti-hyperglycemic effects. Nat. Commun. 2021, 12, 7256. [Google Scholar] [CrossRef] [PubMed]
- Wang, R.; Zhang, L.; Zhang, Q.; Zhang, J.; Liu, S.; Li, C.; Wang, L. Glycolipid Metabolism and Metagenomic Analysis of the Therapeutic Effect of a Phenolics-Rich Extract from Noni Fruit on Type 2 Diabetic Mice. J. Agric. Food Chem. 2022, 70, 2876–2888. [Google Scholar] [CrossRef]
- Wang, H.; Tan, H.; Zhan, W.; Song, L.; Zhang, D.; Chen, X.; Lin, Z.; Wang, W.; Yang, Y.; Wang, L.; Bei, W.; Guo, J. Molecular mechanism of Fufang Zhenzhu Tiaozhi capsule in the treatment of type 2 diabetes mellitus with nonalcoholic fatty liver disease based on network pharmacology and validation in minipigs. J. Ethnopharmacol. 2021, 274, 114056. [Google Scholar] [CrossRef] [PubMed]
- 43Chen, C.; Huang, Q.; Li, C.; Fu, X. Hypoglycemic effects of a Fructus Mori polysaccharide in vitro and in vivo. Food Funct. 2017, 8, 2523–2535. [Google Scholar]
- Copps, K. D.; White, M. F. Regulation of insulin sensitivity by serine/threonine phosphorylation of insulin receptor substrate proteins IRS1 and IRS2. Diabetologia. 2012, 55, 2565–2582. [Google Scholar] [CrossRef]
- Schmidt-Christensen, A.; Eriksson, G.; Laprade, W. M.; Pirzamanbein, B.; Hörnberg, M.; Linde, K.; Nilsson, J.; Skarsfeldt, M.; Leeming, D. J.; Mokso, R.; Verezhak, M.; Dahl, A.; Dahl, V.; Önnerhag, K.; Oghazi, M. R.; Mayans, S.; Holmberg, D. Structure-function analysis of time-resolved immunological phases in metabolic dysfunction-associated fatty liver disease (MASH) comparing the NIF mouse model to human MASH. Sci. Rep. 2024, 14, 23014. [Google Scholar] [CrossRef]
- Zhu, Y.; Wang, D.; Zhou, S.; Zhou, T. Hypoglycemic Effects of Gynura divaricata (L. ) DC Polysaccharide and Action Mechanisms via Modulation of Gut Microbiota in Diabetic Mice. J. Agric. Food Chem. 2024, 72, 9893–9905. [Google Scholar]
- Li, H.; Zhang, L.; Li, J.; Wu, Q.; Qian, L.; He, J.; Ni, Y.; Kovatcheva-Datchary, P.; Yuan, R.; Liu, S.; Shen, L.; Zhang, M.; Sheng, B.; Li, P.; Kang, K.; Wu, L.; Fang, Q.; Long, X.; Wang, X.; Li, Y.; Ye, Y.; Ye, J.; Bao, Y.; Zhao, Y.; Xu, G.; Liu, X.; Panagiotou, G.; Xu, A.; Jia, W. Resistant starch intake facilitates weight loss in humans by reshaping the gut microbiota. Nat. Metab. 2024, 6, 578–597. [Google Scholar] [CrossRef]
- Cai, C.; Cheng, W.; Shi, T.; Liao, Y.; Zhou, M.; Liao, Z. Rutin alleviates colon lesions and regulates gut microbiota in diabetic mice. Sci. Rep. 2023, 13, 4897. [Google Scholar] [CrossRef] [PubMed]
- Zhao, C.; Yang, C.; Chen, M.; Lv, X.; Liu, B.; Yi, L.; Cornara, L.; Wei, M.; Yang, Y.; Tundis, R.; Xiao, J. Regulatory Efficacy of Brown Seaweed Lessonia nigrescens Extract on the Gene Expression Profile and Intestinal Microflora in Type 2 Diabetic Mice. Mol. Nutr. Food Res. 2018, 62, 1700730. [Google Scholar] [CrossRef] [PubMed]
- Qi, B.; Ren, D.; Li, T.; Niu, P.; Zhang, X.; Yang, X.; Xiao, J. Fu Brick Tea Manages HFD/STZ-Induced Type 2 Diabetes by Regulating the Gut Microbiota and Activating the IRS1/PI3K/Akt Signaling Pathway. J. Agric. Food Chem. 2022, 70, 8274–8287. [Google Scholar] [CrossRef] [PubMed]
- Li, W.; Yang, H.; Zhao, Q.; Wang, X.; Zhang, J.; Zhao, X. Polyphenol-Rich Loquat Fruit Extract Prevents Fructose-Induced Nonalcoholic Fatty Liver Disease by Modulating Glycometabolism, Lipometabolism, Oxidative Stress, Inflammation, Intestinal Barrier, and Gut Microbiota in Mice. J. Agric. Food Chem. 2019, 67, 7726–7737. [Google Scholar] [CrossRef]
- Kawano, Y.; Edwards, M.; Huang, Y.; Bilate, A. M.; Araujo, L. P.; Tanoue, T.; Atarashi, K.; Ladinsky, M. S.; Reiner, S. L.; Wang, H. H.; Mucida, D.; Honda, K.; Ivanov, I. I. Microbiota imbalance induced by dietary sugar disrupts immune-mediated protection from metabolic syndrome. Cell. 2022, 185, 3501–3519. [Google Scholar] [CrossRef]
- He, Q.; Zhang, Y.; Ma, D.; Zhang, W.; Zhang, H. Lactobacillus casei Zhang exerts anti-obesity effect to obese glut1 and gut-specific-glut1 knockout mice via gut microbiota modulation mediated different metagenomic pathways. Eur. J. Nutr. 2022, 61, 2003–2014. [Google Scholar] [CrossRef]
- Sedighi, M.; Razavi, S.; Navab-Moghadam, F.; Khamseh, M. E.; Alaei-Shahmiri, F.; Mehrtash, A.; Amirmozafari, N. Comparison of gut microbiota in adult patients with type 2 diabetes and healthy individuals. Microb. Pathog. 2017, 111, 362–369. [Google Scholar] [CrossRef]
- Campbell, C. L.; Yu, R.; Li, F.; Zhou, Q.; Chen, D.; Qi, C.; Yin, Y.; Sun, J. Modulation of fat metabolism and gut microbiota by resveratrol on high-fat diet-induced obese mice. Diabetes Metab. Syndr. Obes. Targets Ther. 2019, 12, 97–107. [Google Scholar] [CrossRef] [PubMed]
- Kong, F.; Kang, S.; Zhang, J.; Zhao, H.; Peng, Y.; Yang, M.; Zheng, Y.; Shao, J.; Yue, X. Whey protein and xylitol complex alleviate type 2 diabetes in C57BL/6 mice by regulating the intestinal microbiota. Food Res. Int. 2022, 157, 111454. [Google Scholar] [CrossRef] [PubMed]
- Hanson, T.; Constantine, E.; Nobles, Z.; Butler, E.; Renteria, K. M.; Teoh, C. M.; Koh, G. Y. Supplementation of Vitamin D3 and Fructooligosaccharides Downregulates Intestinal Defensins and Reduces the Species Abundance of Romboutsia ilealis in C57BL/6J Mice. Nutrients. 2024, 16, 2236. [Google Scholar] [CrossRef] [PubMed]
- Liu, Y.; Huang, W.; Ji, S.; Wang, J.; Luo, J.; Lu, B. Sophora japonica flowers and their main phytochemical, rutin, regulate chemically induced murine colitis in association with targeting the NF-κB signaling pathway and gut microbiota. Food Chem. 2022, 393, 133395. [Google Scholar] [CrossRef] [PubMed]
- Zhu, C. H.; Li, Y. X.; Xu, Y. C.; Wang, N. N.; Yan, Q. J.; Jiang, Z. Q. Tamarind Xyloglucan Oligosaccharides Attenuate Metabolic Disorders via the Gut-Liver Axis in Mice with High-Fat-Diet-Induced Obesity. Foods. 2023, 12, 1382. [Google Scholar] [CrossRef]
- Takeuchi, T.; Kubota, T.; Nakanishi, Y.; Tsugawa, H.; Suda, W.; Kwon, A. T.-J.; Yazaki, J.; Ikeda, K.; Nemoto, S.; Mochizuki, Y.; Kitami, T.; Yugi, K.; Mizuno, Y.; Yamamichi, N.; Yamazaki, T.; Takamoto, I.; Kubota, N.; Kadowaki, T.; Arner, E.; Carninci, P.; Ohara, O.; Arita, M.; Hattori, M.; Koyasu, S.; Ohno, H. Gut microbial carbohydrate metabolism contributes to insulin resistance. Nature. 2023, 621, 389–395. [Google Scholar] [CrossRef]
- Zhang, Q.; Li, R. L.; Wang, L. Y.; Zhang, T.; Qian, D.; Tang, D. D.; He, C. X.; Wu, C. J.; Ai, L. Hydroxy-α-sanshool isolated from Zanthoxylum bungeanum Maxim. has antidiabetic effects on high-fat-fed and streptozotocin-treated mice via increasing glycogen synthesis by regulation of PI3K/Akt/GSK-3β/GS signaling. Front. Pharmacol. 2022, 13, 1089558. [Google Scholar] [CrossRef] [PubMed]
- Xiao, H.; Sun, X.; Lin, Z.; Yang, Y.; Zhang, M.; Xu, Z.; Liu, P.; Liu, Z.; Huang, H. Gentiopicroside targets PAQR3 to activate the PI3K/AKT signaling pathway and ameliorate disordered glucose and lipid metabolism. Acta Pharm. Sin. B. 2022, 12, 2887–2904. [Google Scholar] [CrossRef] [PubMed]
- Huang, X.; Liu, G.; Guo, J.; Su, Z. The PI3K/AKT pathway in obesity and type 2 diabetes. Int J Biol Sci. 2018, 14, 1483–1496. [Google Scholar] [CrossRef]
- Li, Y.; Tang, Y.; Shi, S.; Gao, S.; Wang, Y.; Xiao, D.; Chen, T.; He, Q.; Zhang, J.; Lin, Y. Tetrahedral Framework Nucleic Acids Ameliorate Insulin Resistance in Type 2 Diabetes Mellitus via the PI3K/Akt Pathway. ACS Appl. Mater. Interfaces. 2021, 13, 40354–40364. [Google Scholar] [CrossRef]
- Dong, X.; Park, S.; Lin, X.; Copps, K.; Yi, X.; White, M. F. Irs1 and Irs2 signaling is essential for hepatic glucose homeostasis and systemic growth. J. Clin. Invest. 2006, 116, 101–114. [Google Scholar] [CrossRef] [PubMed]
- Taniguchi, C. M.; Kondo, T.; Sajan, M.; Luo, J.; Bronson, R.; Asano, T.; Farese, R.; Cantley, L. C.; Kahn, C. R. Divergent regulation of hepatic glucose and lipid metabolism by phosphoinositide 3-kinase via Akt and PKClambda/zeta. Cell Metab. 2006, 3, 343–353. [Google Scholar] [CrossRef]
- Ren, L.; Zhou, X.; Huang, X.; Wang, C.; Li, Y. The IRS/PI3K/Akt signaling pathway mediates olanzapine-induced hepatic insulin resistance in male rats. Life Sci. 2019, 217, 229–236. [Google Scholar] [CrossRef] [PubMed]
- Jiang, Q.; Chen, L.; Wang, R.; Chen, Y.; Deng, S.; Shen, G.; Liu, S.; Xiang, X. Hypoglycemic mechanism of Tegillarca granosa polysaccharides on type 2 diabetic mice by altering gut microbiota and regulating the PI3K-akt signaling pathwaye. Food Sci. Hum. Wellness. 2024, 13, 842–855. [Google Scholar] [CrossRef]
- Chen, D.; Chen, X.; He, C.; Xiao, C.; Chen, Z.; Chen, Q.; Chen, J.; Bo, H. Sanhuang xiexin decoction synergizes insulin/PI3K-Akt/FoxO signaling pathway to inhibit hepatic glucose production and alleviate T2DM. J. Ethnopharmacol. 2023, 306, 116162. [Google Scholar] [CrossRef]
- Wang, H. Y.; Li, Q. M.; Yu, N. J.; Chen, W. D.; Zha, X. Q.; Wu, D. L.; Pan, L. H.; Duan, J.; Luo, J. P. Dendrobium huoshanense polysaccharide regulates hepatic glucose homeostasis and pancreatic β-cell function in type 2 diabetic mice. Carbohydr. Polym. 2019, 211, 39–48. [Google Scholar] [CrossRef] [PubMed]
- Liu, Q.; Zhang, F. G.; Zhang, W. S.; Pan, A.; Yang, Y. L.; Liu, J. F.; Li, P.; Liu, B. L.; Qi, L. W. Ginsenoside Rg1 Inhibits Glucagon-Induced Hepatic Gluconeogenesis through Akt-FoxO1 Interaction. Theranostics 2017, 7, 4001–4012. [Google Scholar] [CrossRef] [PubMed]
- Peng, W.; He, C. X.; Li, R. L.; Qian, D.; Wang, L. Y.; Chen, W. W.; Zhang, Q.; Wu, C. J. Zanthoxylum bungeanum amides ameliorates nonalcoholic fatty liver via regulating gut microbiota and activating AMPK/Nrf2 signaling. J. Ethnopharmacol. 2024, 318, 116848. [Google Scholar] [CrossRef] [PubMed]
- Qian, D.; Chen, J.; Xu, Y.; He, C.; Wu, Y.; Peng, W.; Li, X. Pungent agents derived from the fruits of Zanthoxylum armatum DC. are beneficial for ameliorating type 2 diabetes mellitus via regulation of AMPK/PI3K/Akt signaling. Journal of Functional Foods, J. Funct. Foods, 2024, 116, 106160. [Google Scholar]
- Choi, J. H.; Noh, J. R.; Kim, Y. H.; Kim, J. H.; Kang, E. J.; Choi, D. H.; Choi, J. H.; An, J. P.; Oh, W. K.; Lee, C. H. Sicyos angulatus Prevents High-Fat Diet-Induced Obesity and Insulin Resistance in Mice. Int. J. Med. Sci. 2020, 17, 787–798. [Google Scholar] [CrossRef] [PubMed]
- Ren, Z.; Xie, Z.; Cao, D.; Gong, M.; Yang, L.; Zhou, Z.; Ou, Y. C-Phycocyanin inhibits hepatic gluconeogenesis and increases glycogen synthesis via activating Akt and AMPK in insulin resistance hepatocytes. Food Funct. 2018, 9, 2829–2839. [Google Scholar] [CrossRef] [PubMed]
- Leto, D.; Saltiel, A. R. Regulation of glucose transport by insulin: traffic control of GLUT4, Nat. Rev. Mol. Cell Biol. 2012, 13, 383–396. [Google Scholar] [CrossRef]
- Dong, X.; Zhao, S. X.; Xu, B. Q.; Zhang, Y. Q. Gynura divaricata ameliorates hepatic insulin resistance by modulating insulin signalling, maintaining glycolipid homeostasis and reducing inflammation in type 2 diabetic mice. Toxicol. Res. 2019, 8, 928–938. [Google Scholar] [CrossRef] [PubMed]
- Chen, B.; Abaydula, Y.; Li, D.; Tan, H.; Ma, X. Taurine ameliorates oxidative stress by regulating PI3K/Akt/GLUT4 pathway in HepG2 cells and diabetic rats. J. Funct. Foods. 2021, 85, 104629. [Google Scholar] [CrossRef]
- Wu, D.; Yu, H. C.; Cha, H. N.; Park, S.; Lee, Y.; Yoon, S. J.; Park, S. Y.; Park, B. H.; Bae, E. J. PAK4 phosphorylates and inhibits AMPKα to control glucose uptake. Nat. Commun. 2024, 15, 6858. [Google Scholar] [CrossRef]
- Toma, T.; Miyakawa, N.; Arakaki, Y.; Watanabe, T.; Nakahara, R.; Ali, T. F. S.; Biswas, T.; Todaka, M.; Kondo, T.; Fujita, M.; Otsuka, M.; Araki, E.; Tateishi, H. An antifibrotic compound that ameliorates hyperglycaemia and fat accumulation in cell and HFD mouse models. Diabetologia. 2024, 67, 2568–2584. [Google Scholar] [CrossRef]
Figure 1.
Effects of CJE on the basal physiological indicators in T2DM mice (n = 10). (A) Treatment of each experimental groups. (B) Initial (week 17) body weight and final (week 23) body weight. (C) Body weight variation during 6 weeks. (D) Water consumption at the end of 6-week administration. (E) Energy intake at the end of 6-week administration. (F) The liver index. (G) The pancreatic index. (H) The white adipose tissue (WAT) index. Data are presented as mean ± SEM. *P < 0.05, **P < 0.01, ***P < 0.001 versus the DC group.
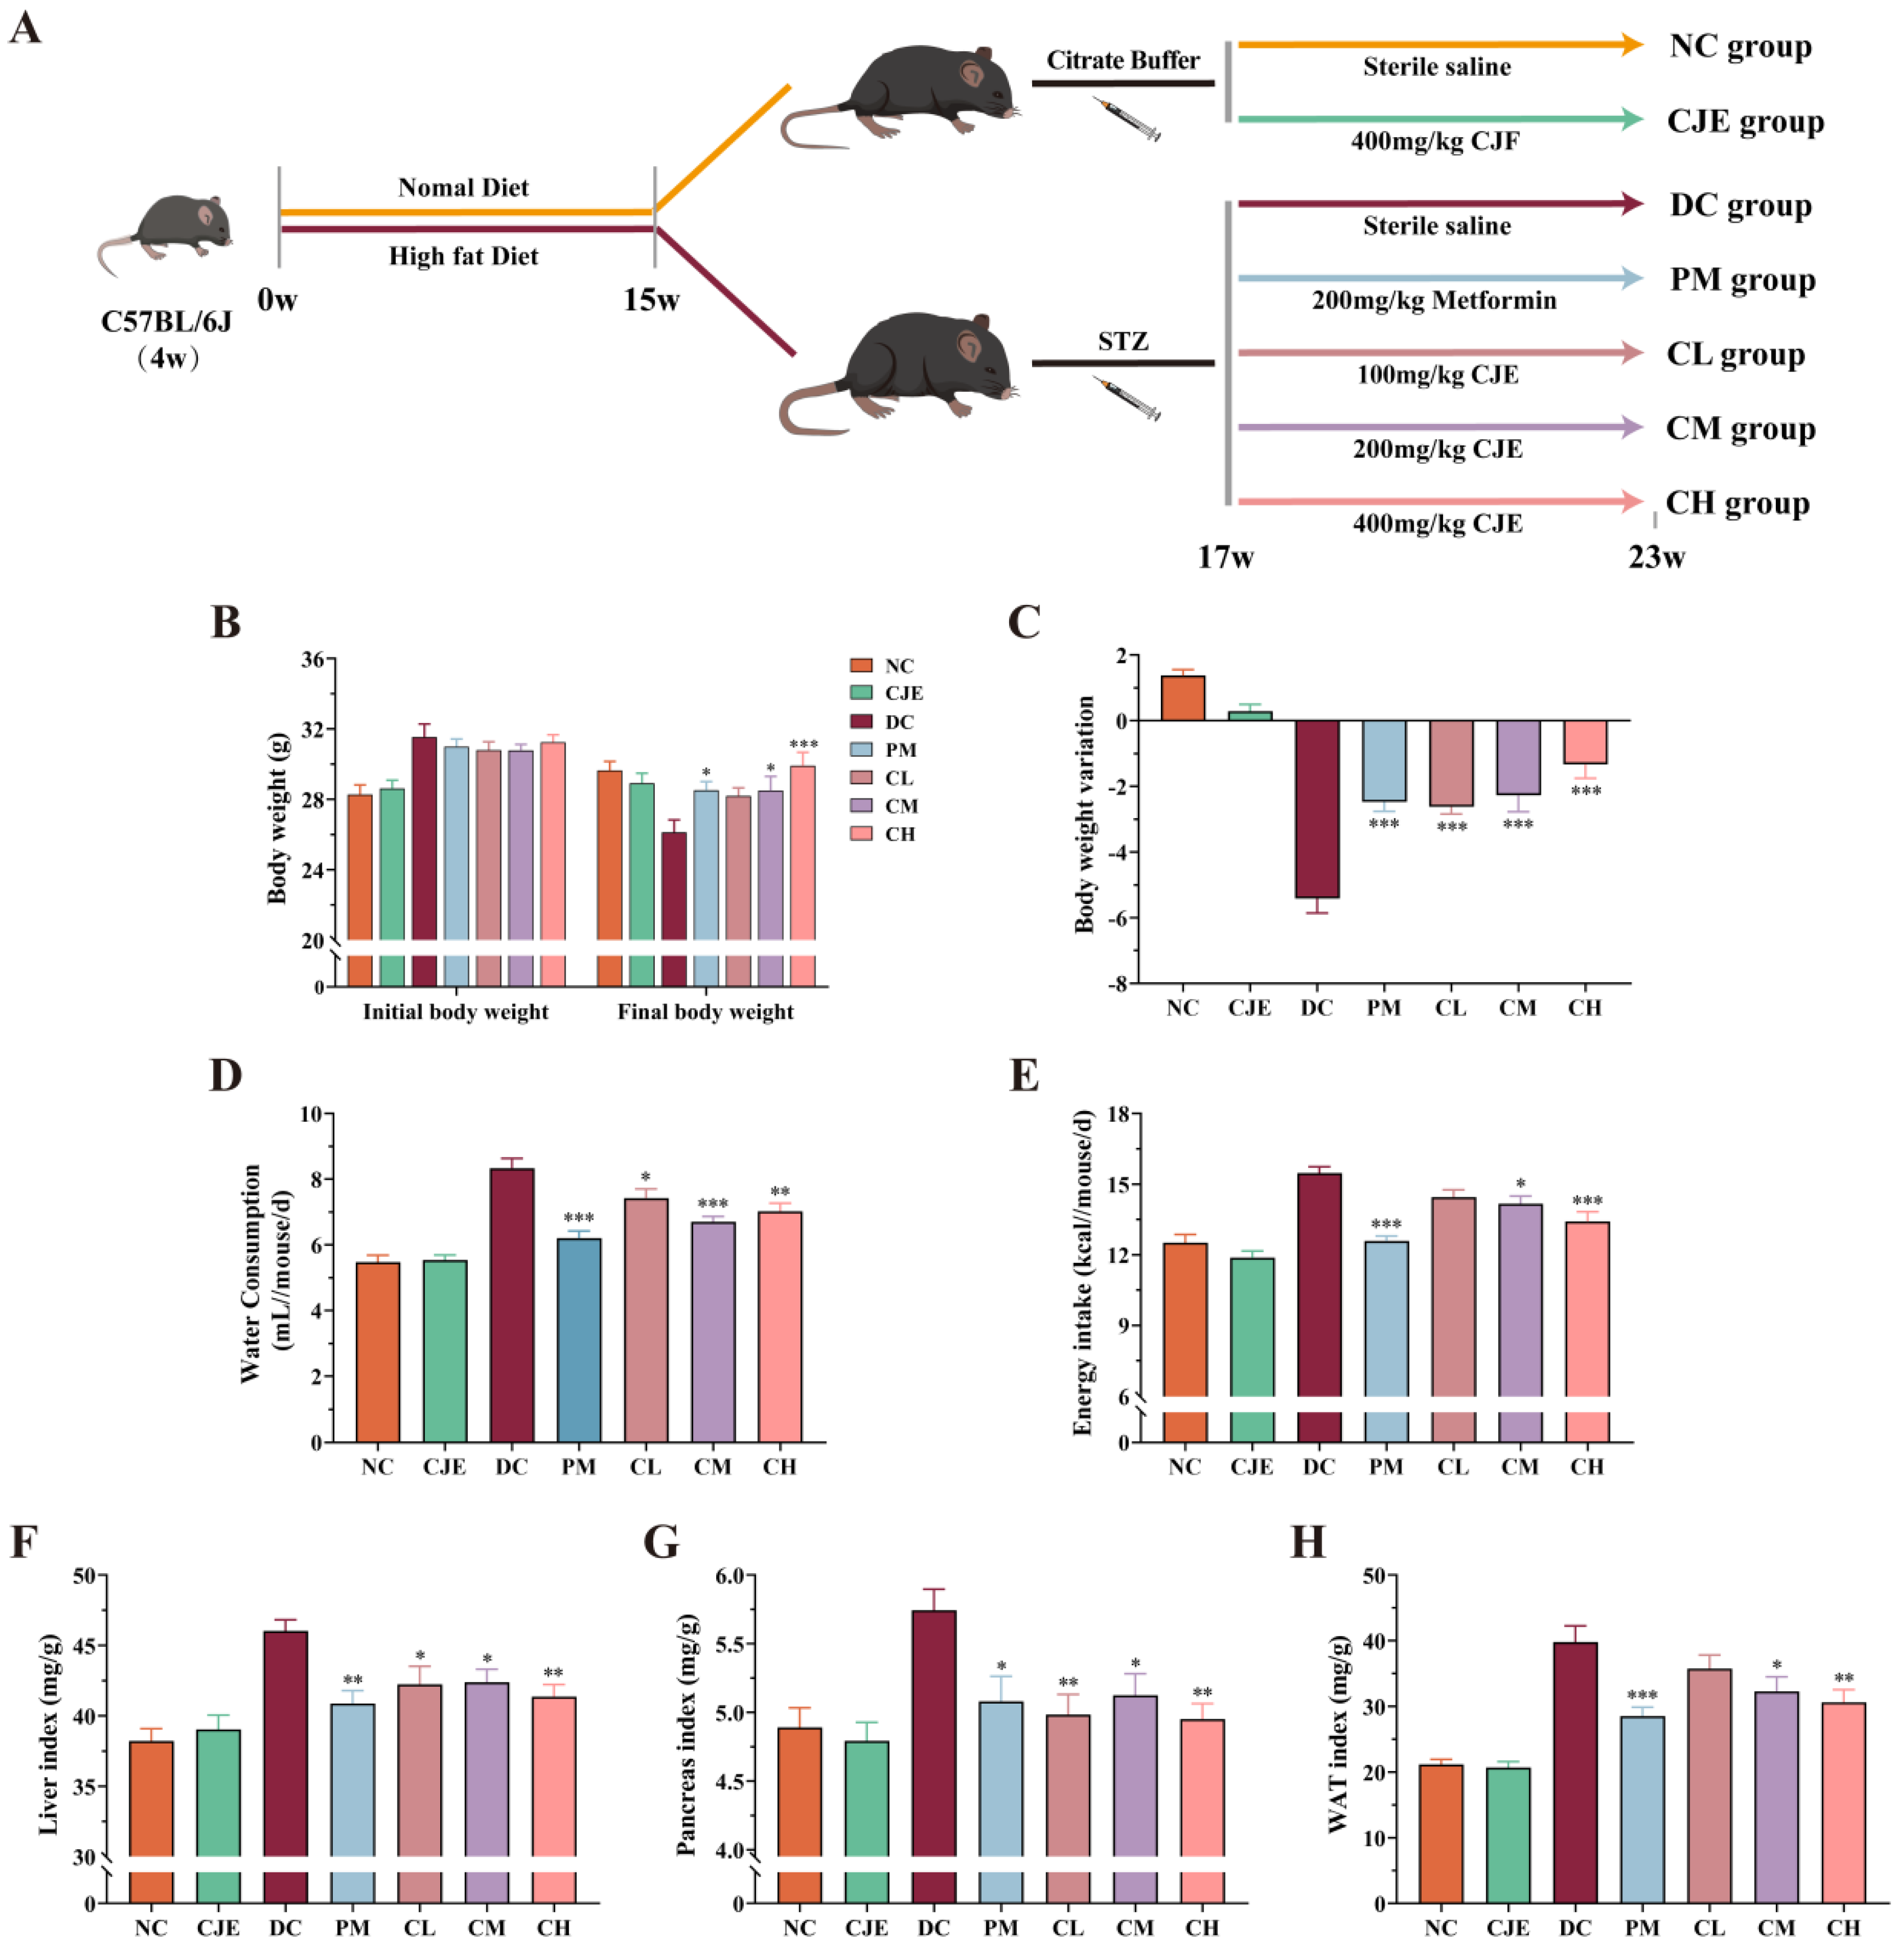
Figure 2.
Effect of CJE on blood glucose homeostasis in T2DM mice (n = 10). (A) FBG levels of each group of mice during 6 weeks (n = 10). (B) Effect of CJE on glycated serum proteins (GSP) level in each group of mice. (C) Serum insulin levels at the end of 6-week administration. (D) The curve of OGTT. (E) AUCs of OGTT. (F) The curve of ITT. (G) AUCs of ITT. (H) HOMA-IR at the end of 6-week administration. (I) HOMA-β at the end of 6-week administration. (J) Quantitative insulin sensitivity check index (QUICKI) at the end of 6-week administration. Data are presented as mean ± SEM. *P < 0.05, **P < 0.01, ***P < 0.001 versus the DC group.
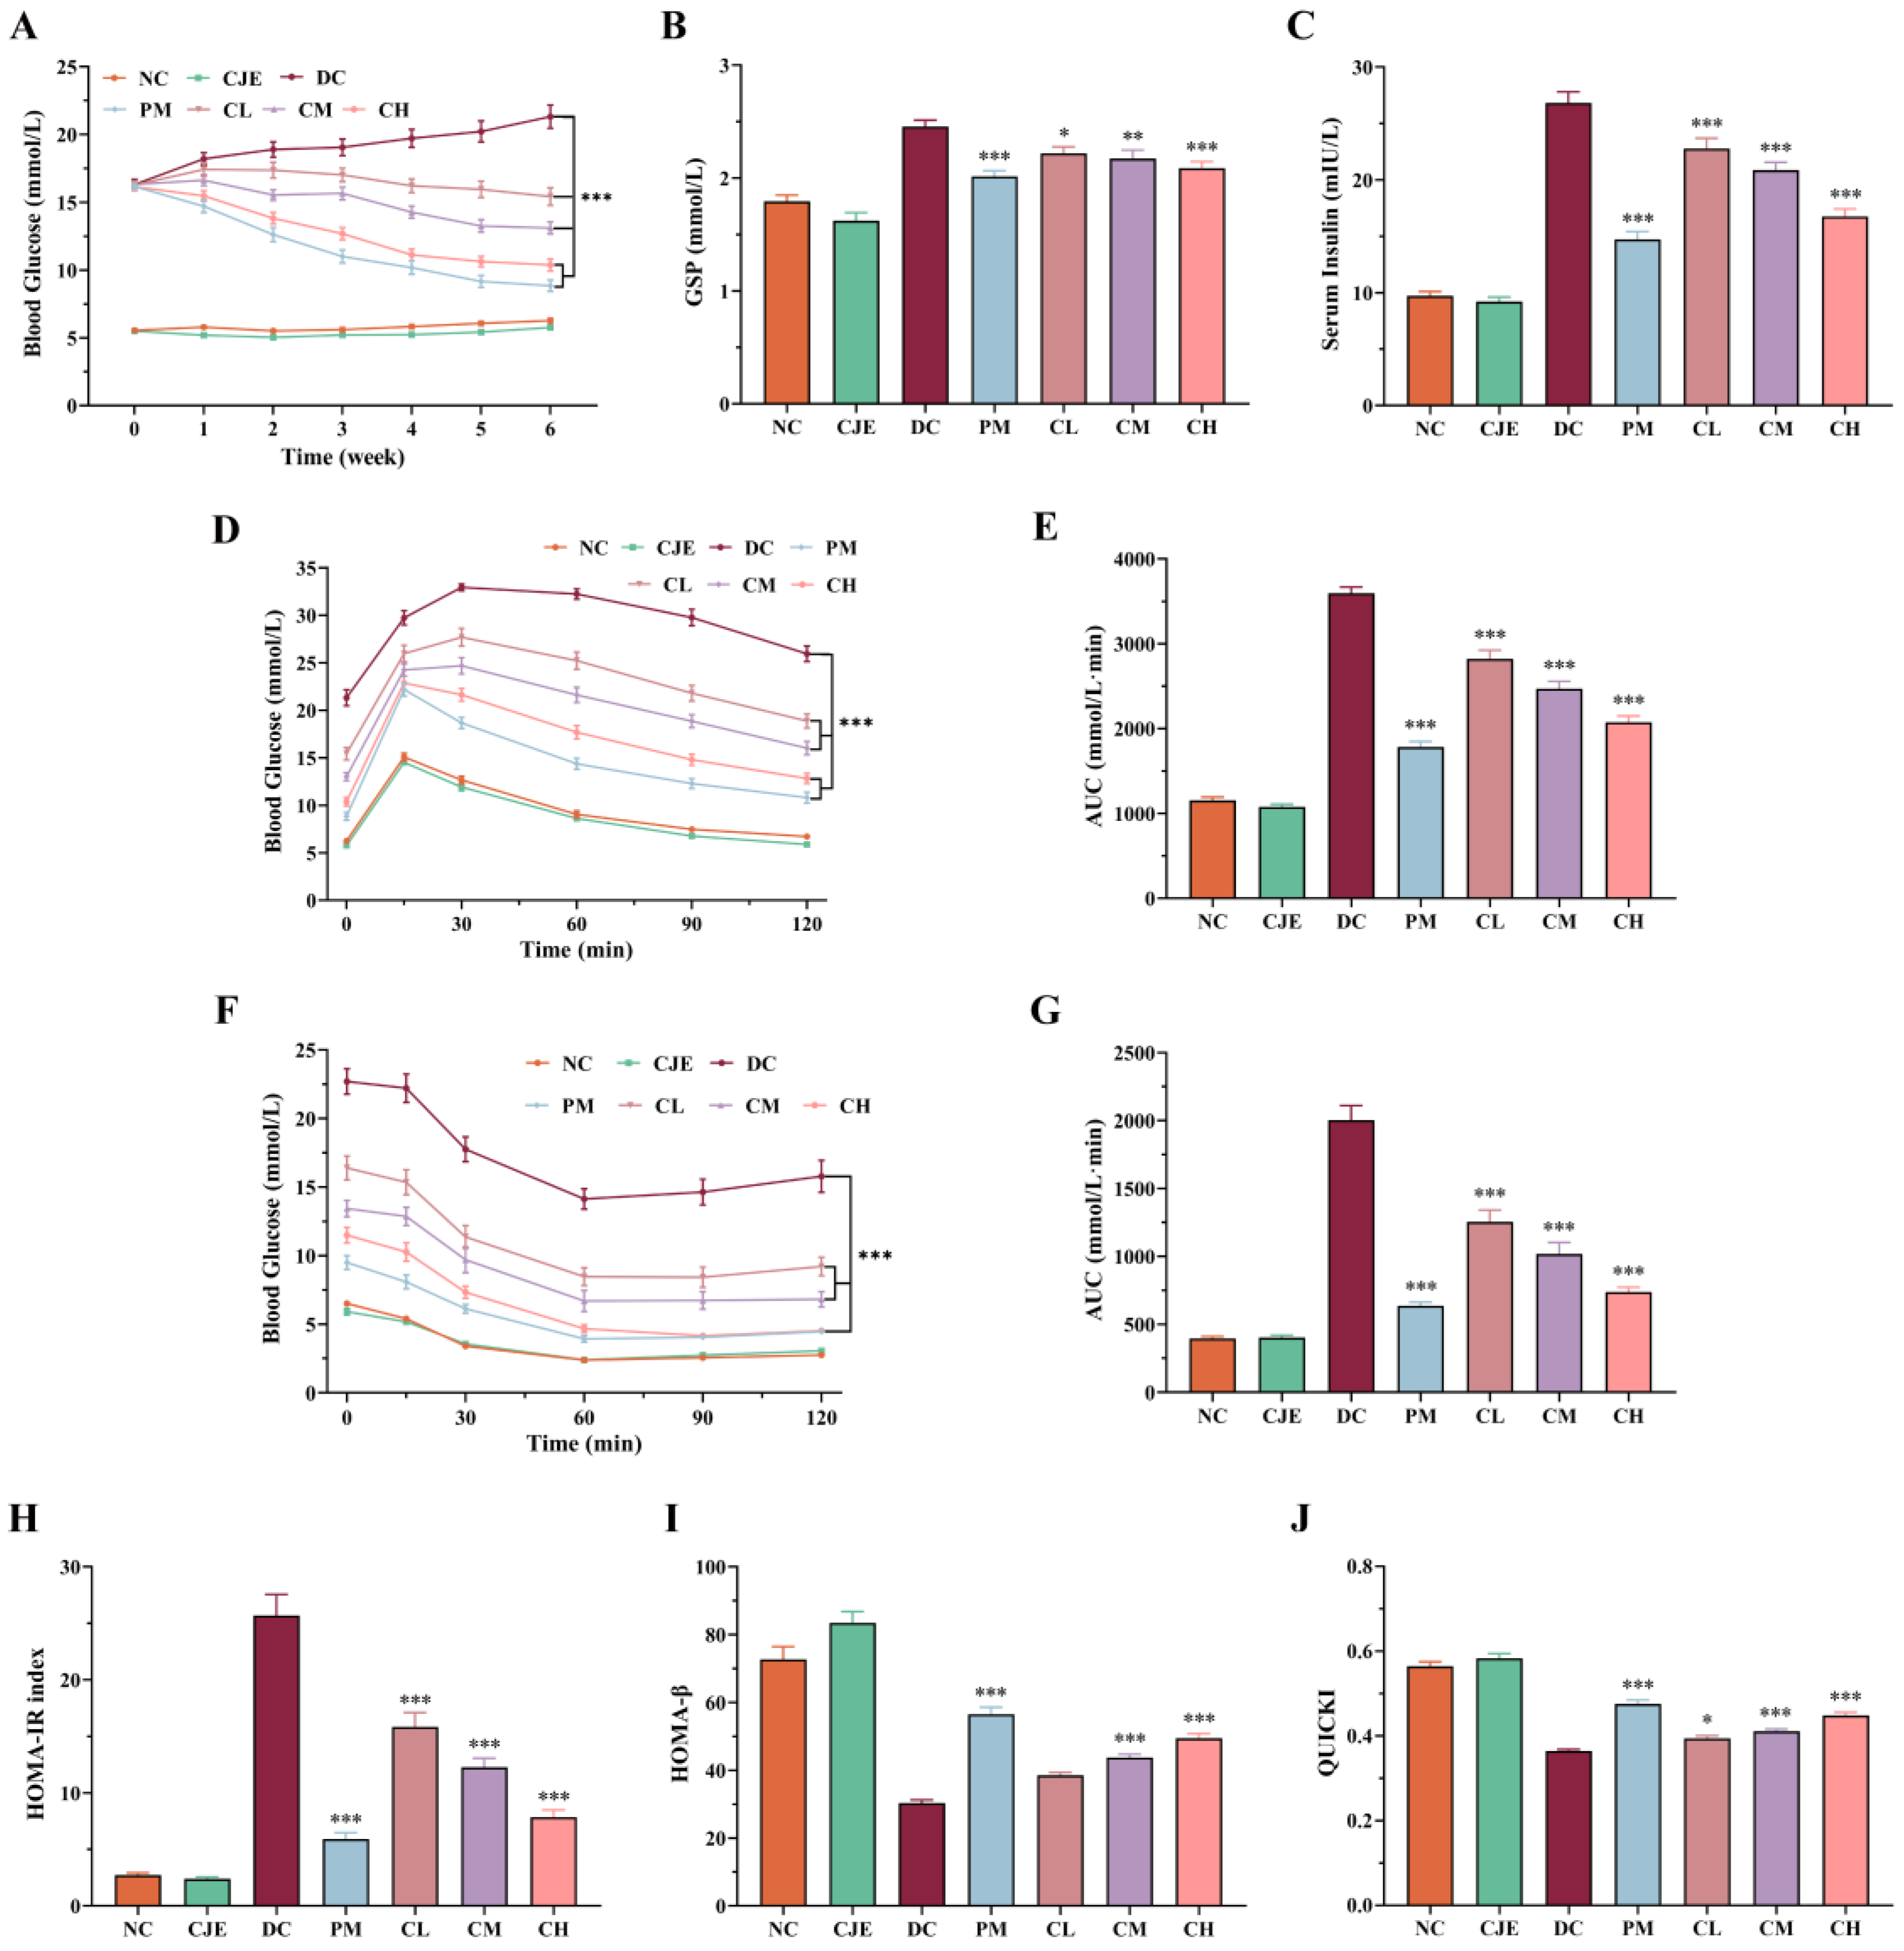
Figure 3.
Histological analyses of the pancreas based on H&E staining. (A) Pancreas sections of mice. Scale bar, 100 μm. (B) Quantification of islet area was calculated based on H&E staining of pancreatic section. (C) Quantification of each largest islets area. Data are presented as mean ± SEM. *P < 0.05, **P < 0.01, ***P < 0.001 versus the DC group.
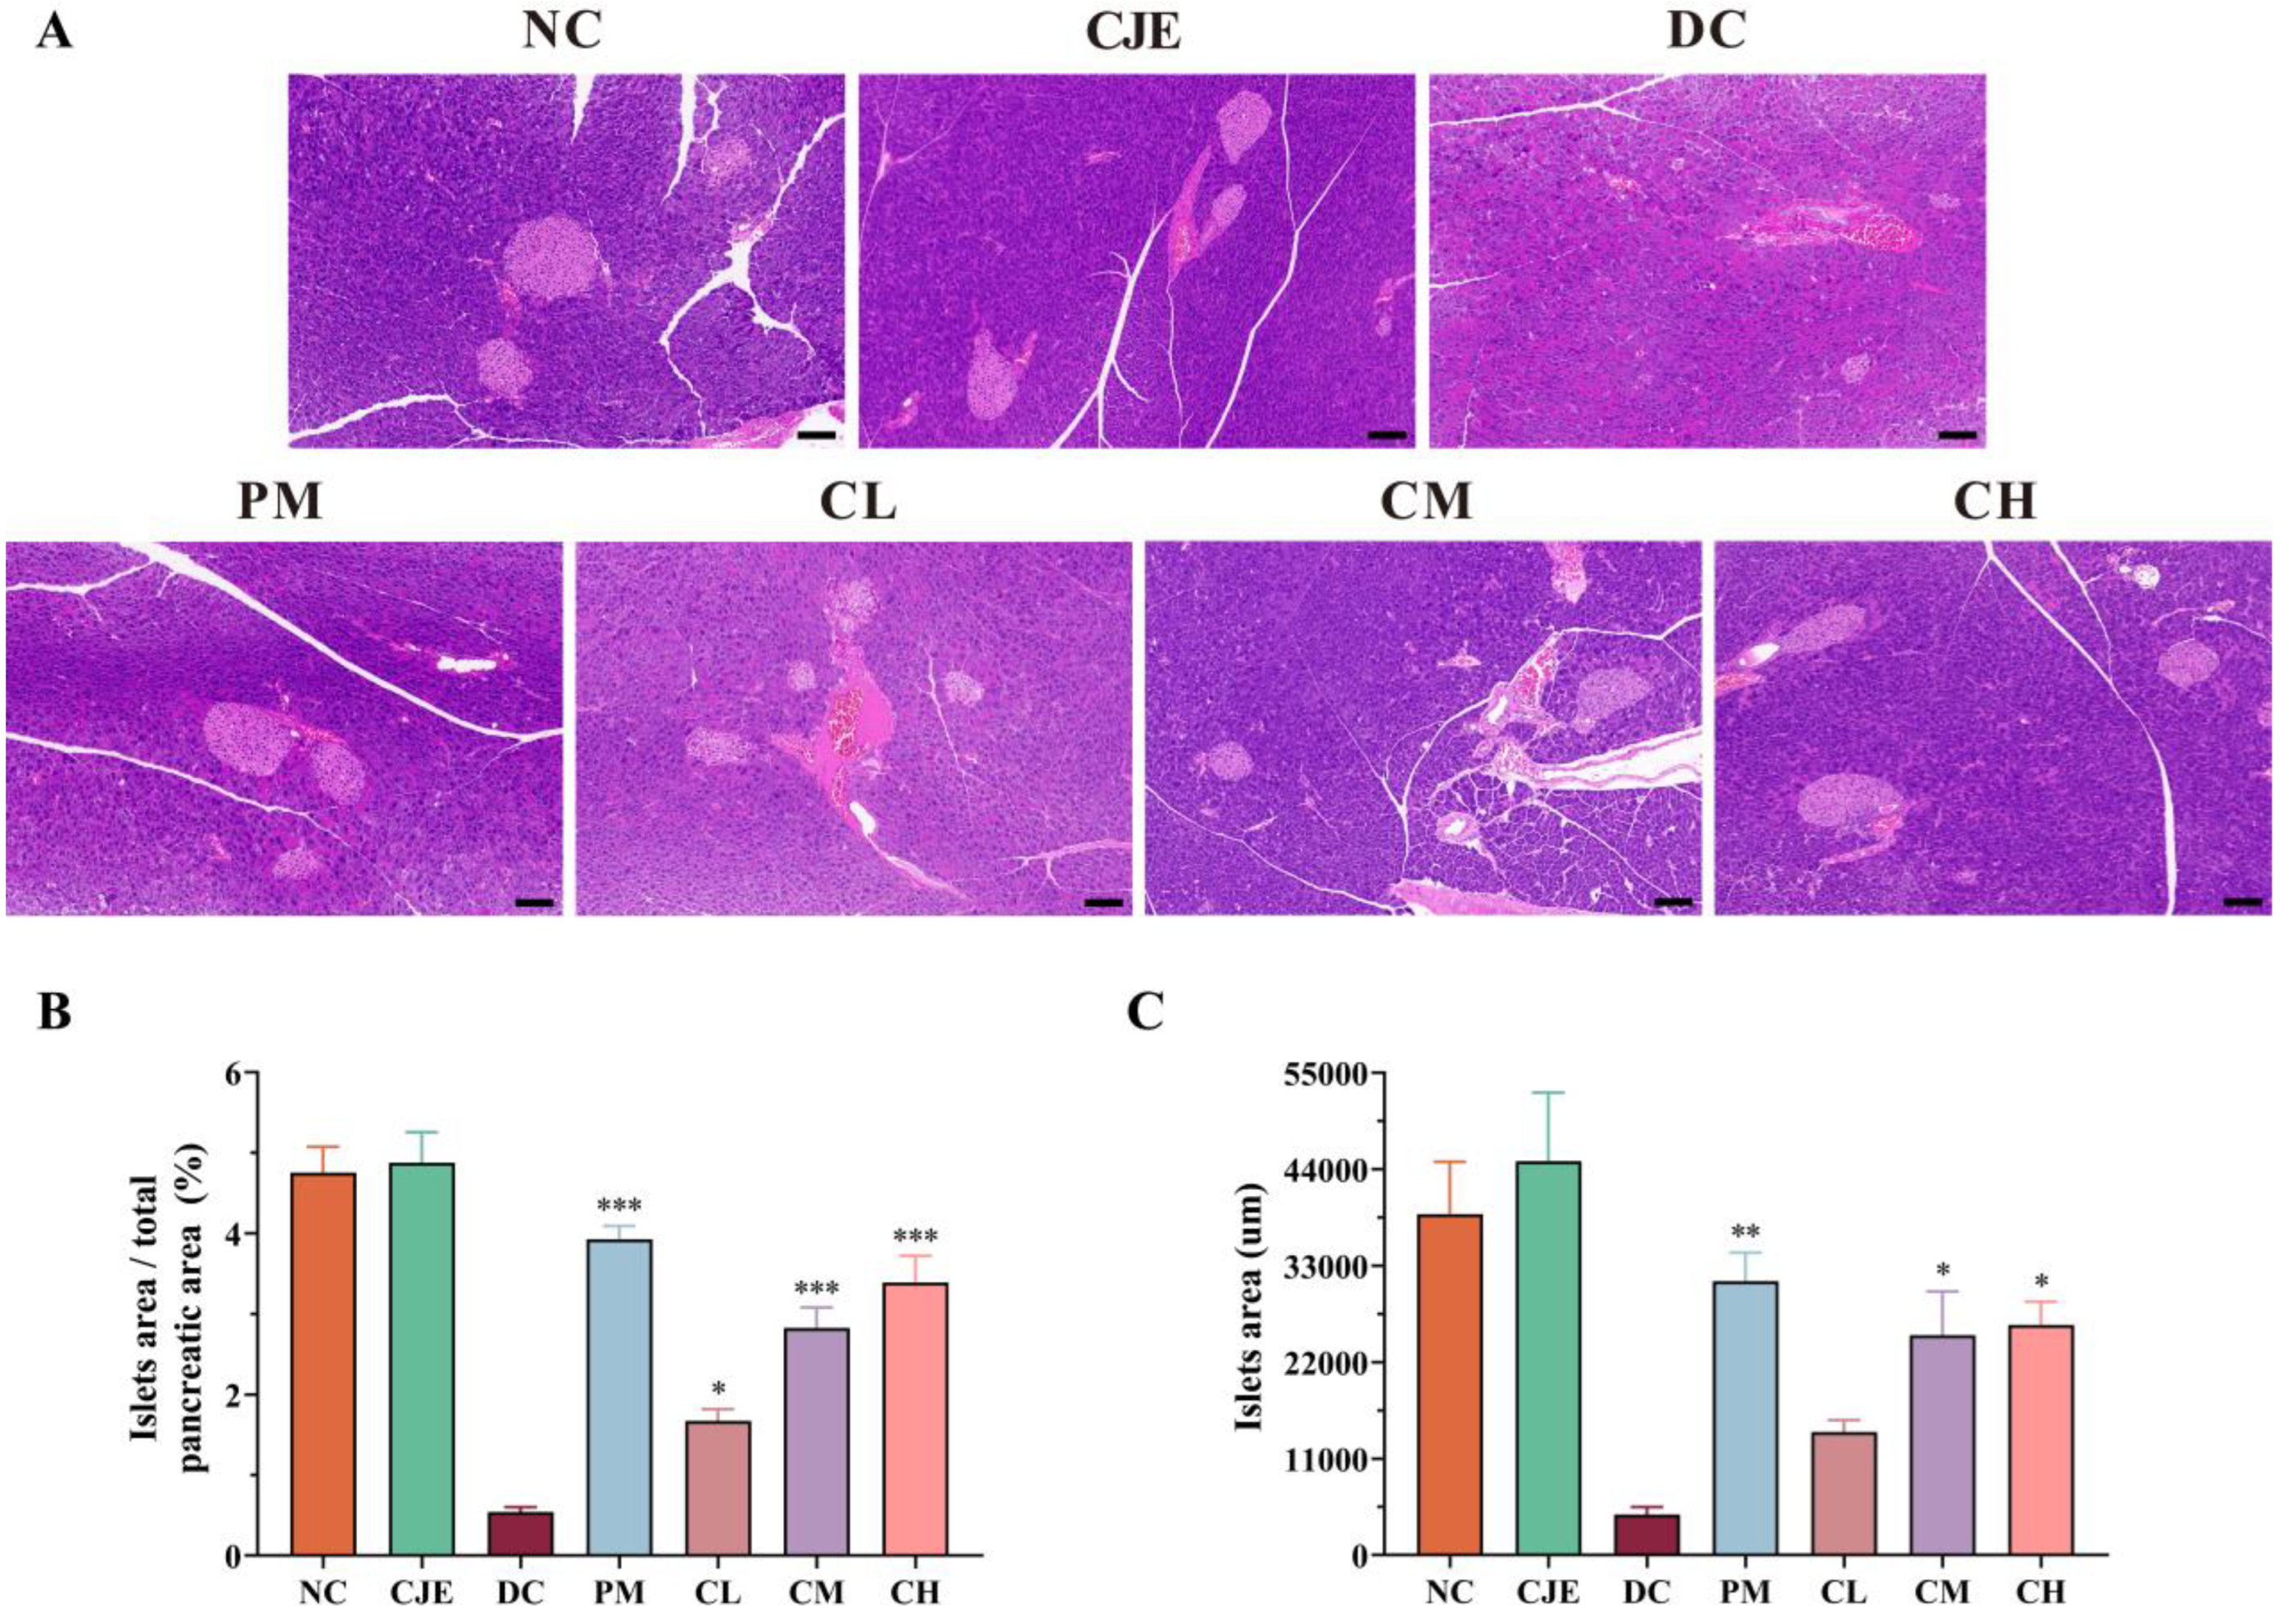
Figure 4.
Effects of CJE administration on pathological features, lipid and glucose metabolism of liver in T2DM mice (n = 10). (A) Representative images from sections stained with H&E, PAS, and Oil Red O. Scale bar, 50μm. (B) Quantification of hepatic glycogen in PAS-stained sections. (C) Effect of CJE on glycogen content in the liver tissue. (D) Total cholesterol (TC) levels. (E) Triglyceride (TG) levels. (F) High-density lipoprotein cholesterol (HDL-C) levels. (G) Low-density lipoprotein cholesterol (LDL-C) levels. The data are expressed as the mean ± SEM. *P < 0.05, **P < 0.01, ***P < 0.001 versus the DC group.
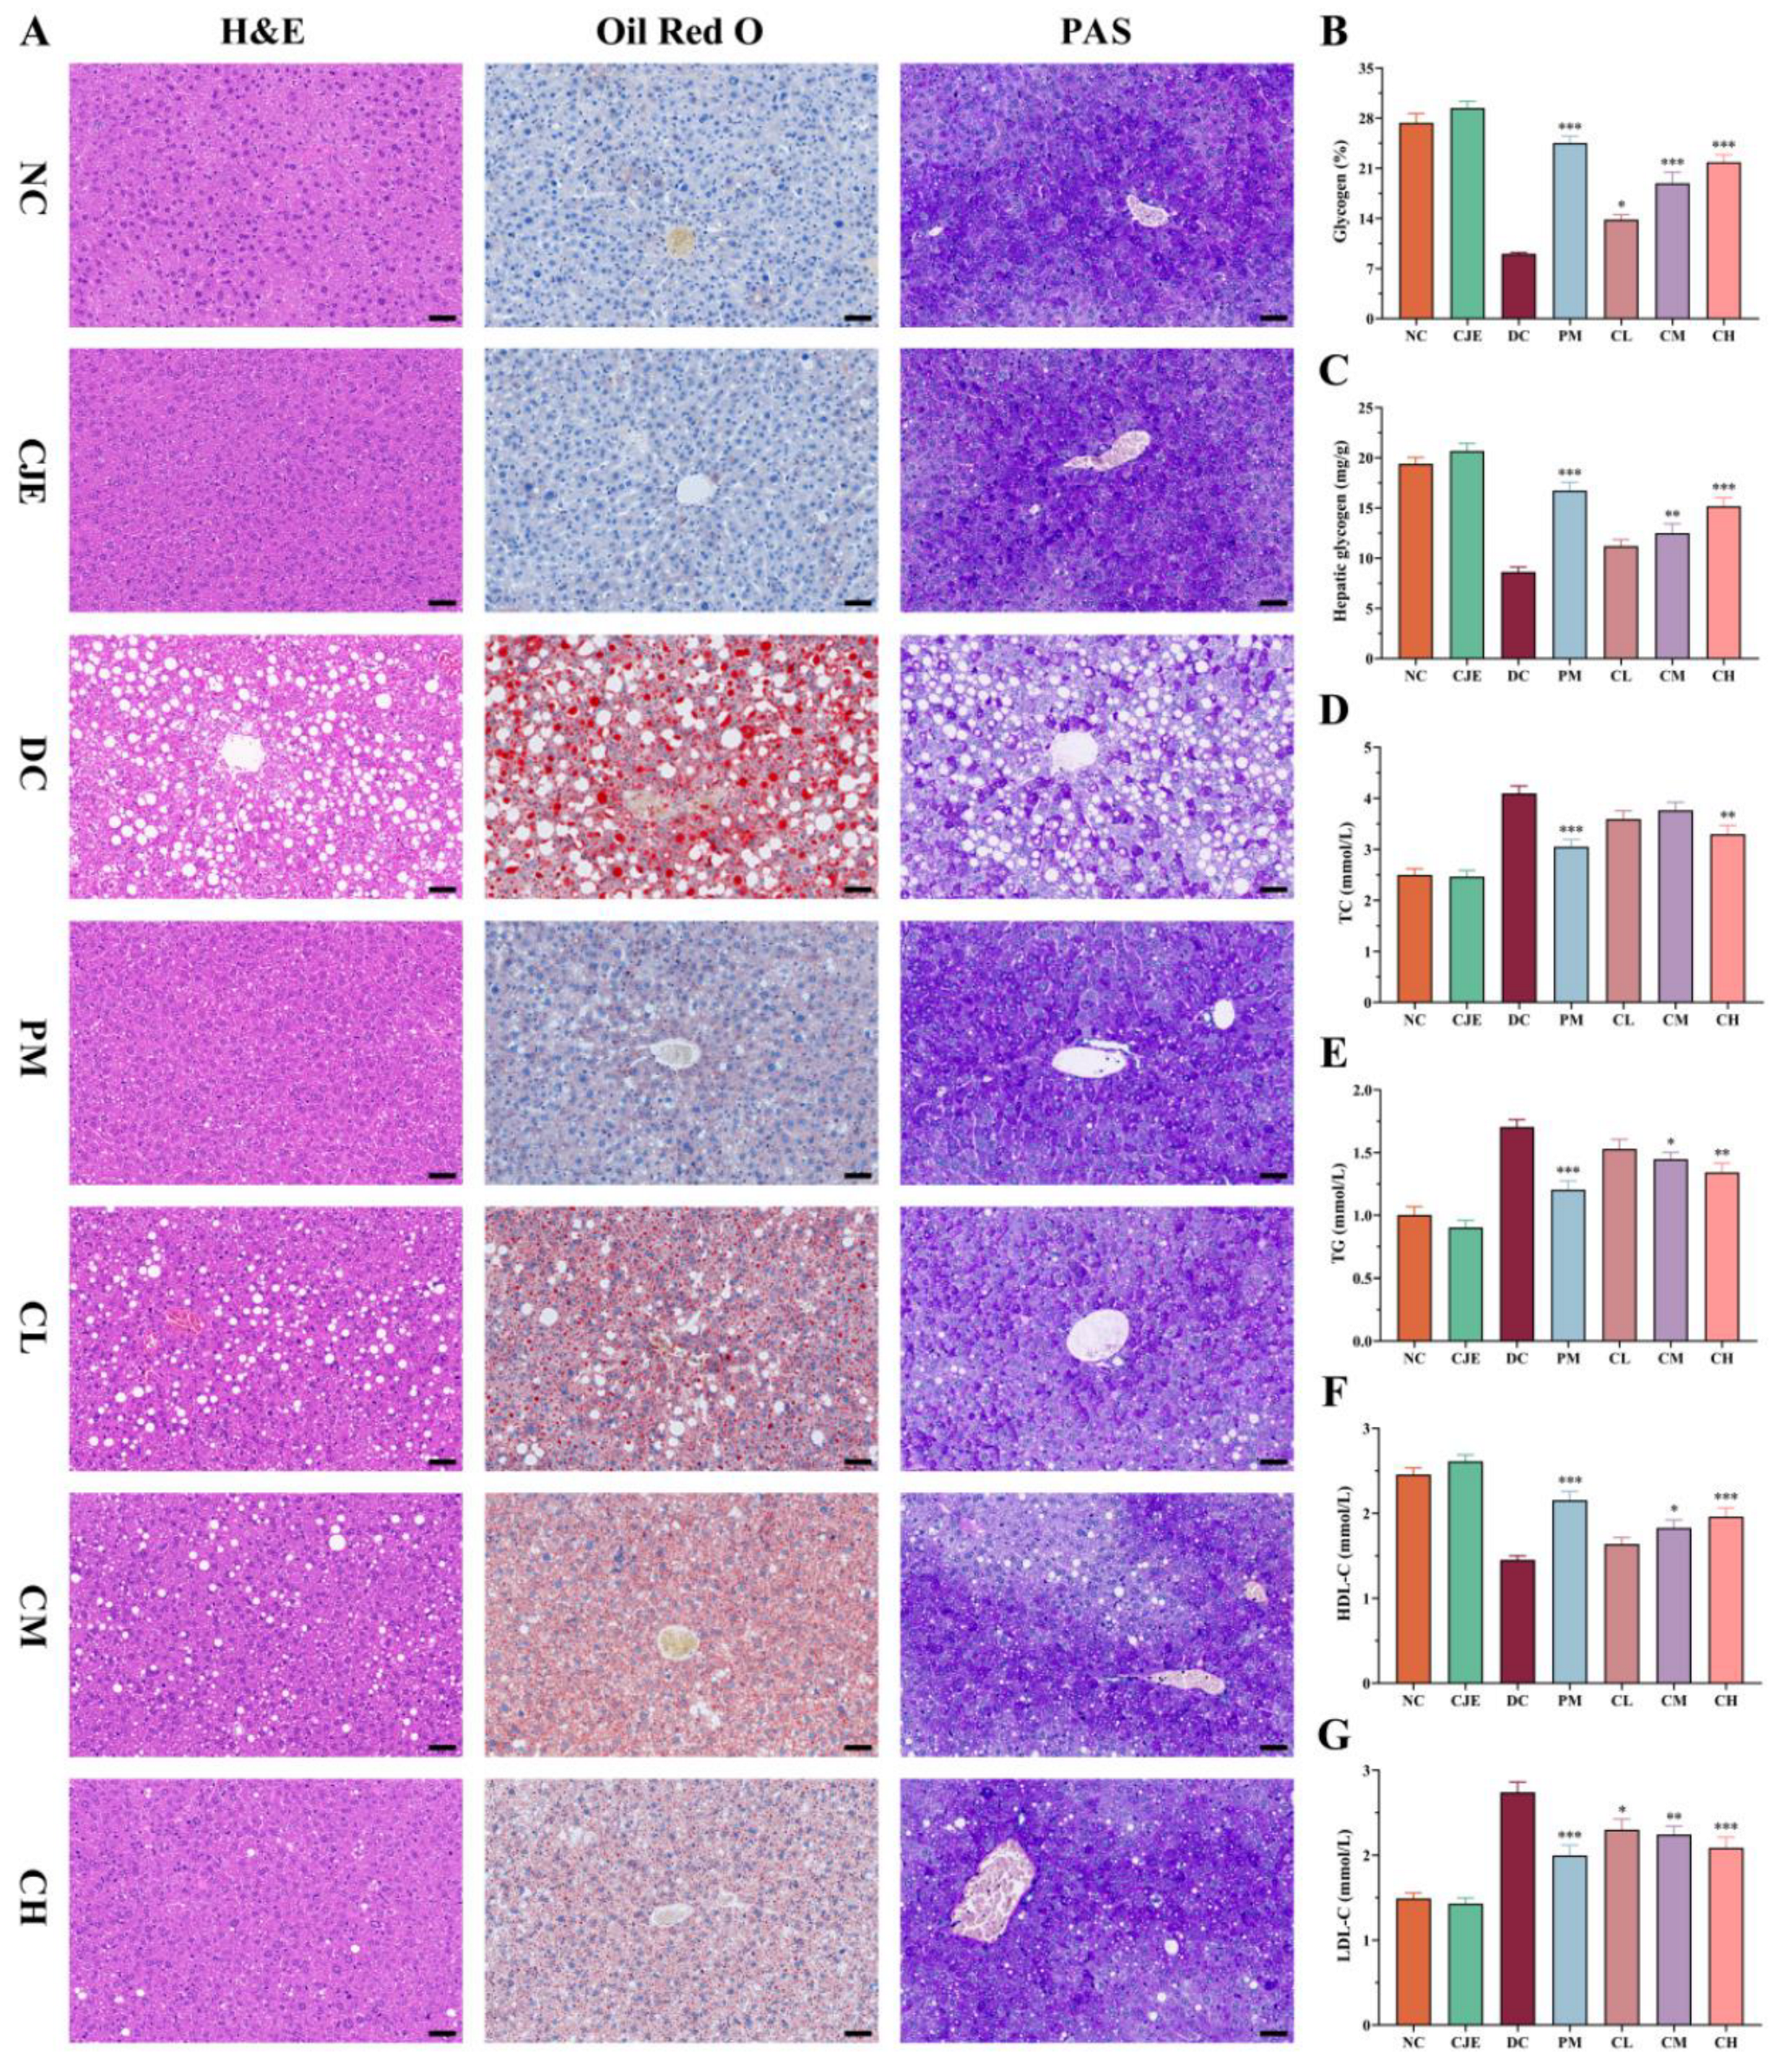
Figure 5.
Effect of CJE on gut microbiota abundance and composition in T2DM mice (n = 4). (A) Alpha diversity analysis at the OTU level. (B) Beta diversity analysis by NMDS and PCoA methods at the OTU level. (C) Gut microbiome health index at the OTU level. (D) Venn diagram for OTUs. (E) Phylum level distribution of gut microbiota. (F) Percent community abundance diagram at the phylum level in the five groups. (G) Firmicutes richness. (H) Bacteroidota richness. (I) F/B ratio. (J) Gut microbiota composition at the genus level in the five groups. (K) Percent community abundance diagram between NC group and DC group at the genus level. (L) Gut microbiota composition at the species level in each group. (M) Percent community abundance diagram between NC group and DC group at the species level. Data are presented as mean ± SEM. *P < 0.05, **P < 0.01, ***P < 0.001 versus the DC group.
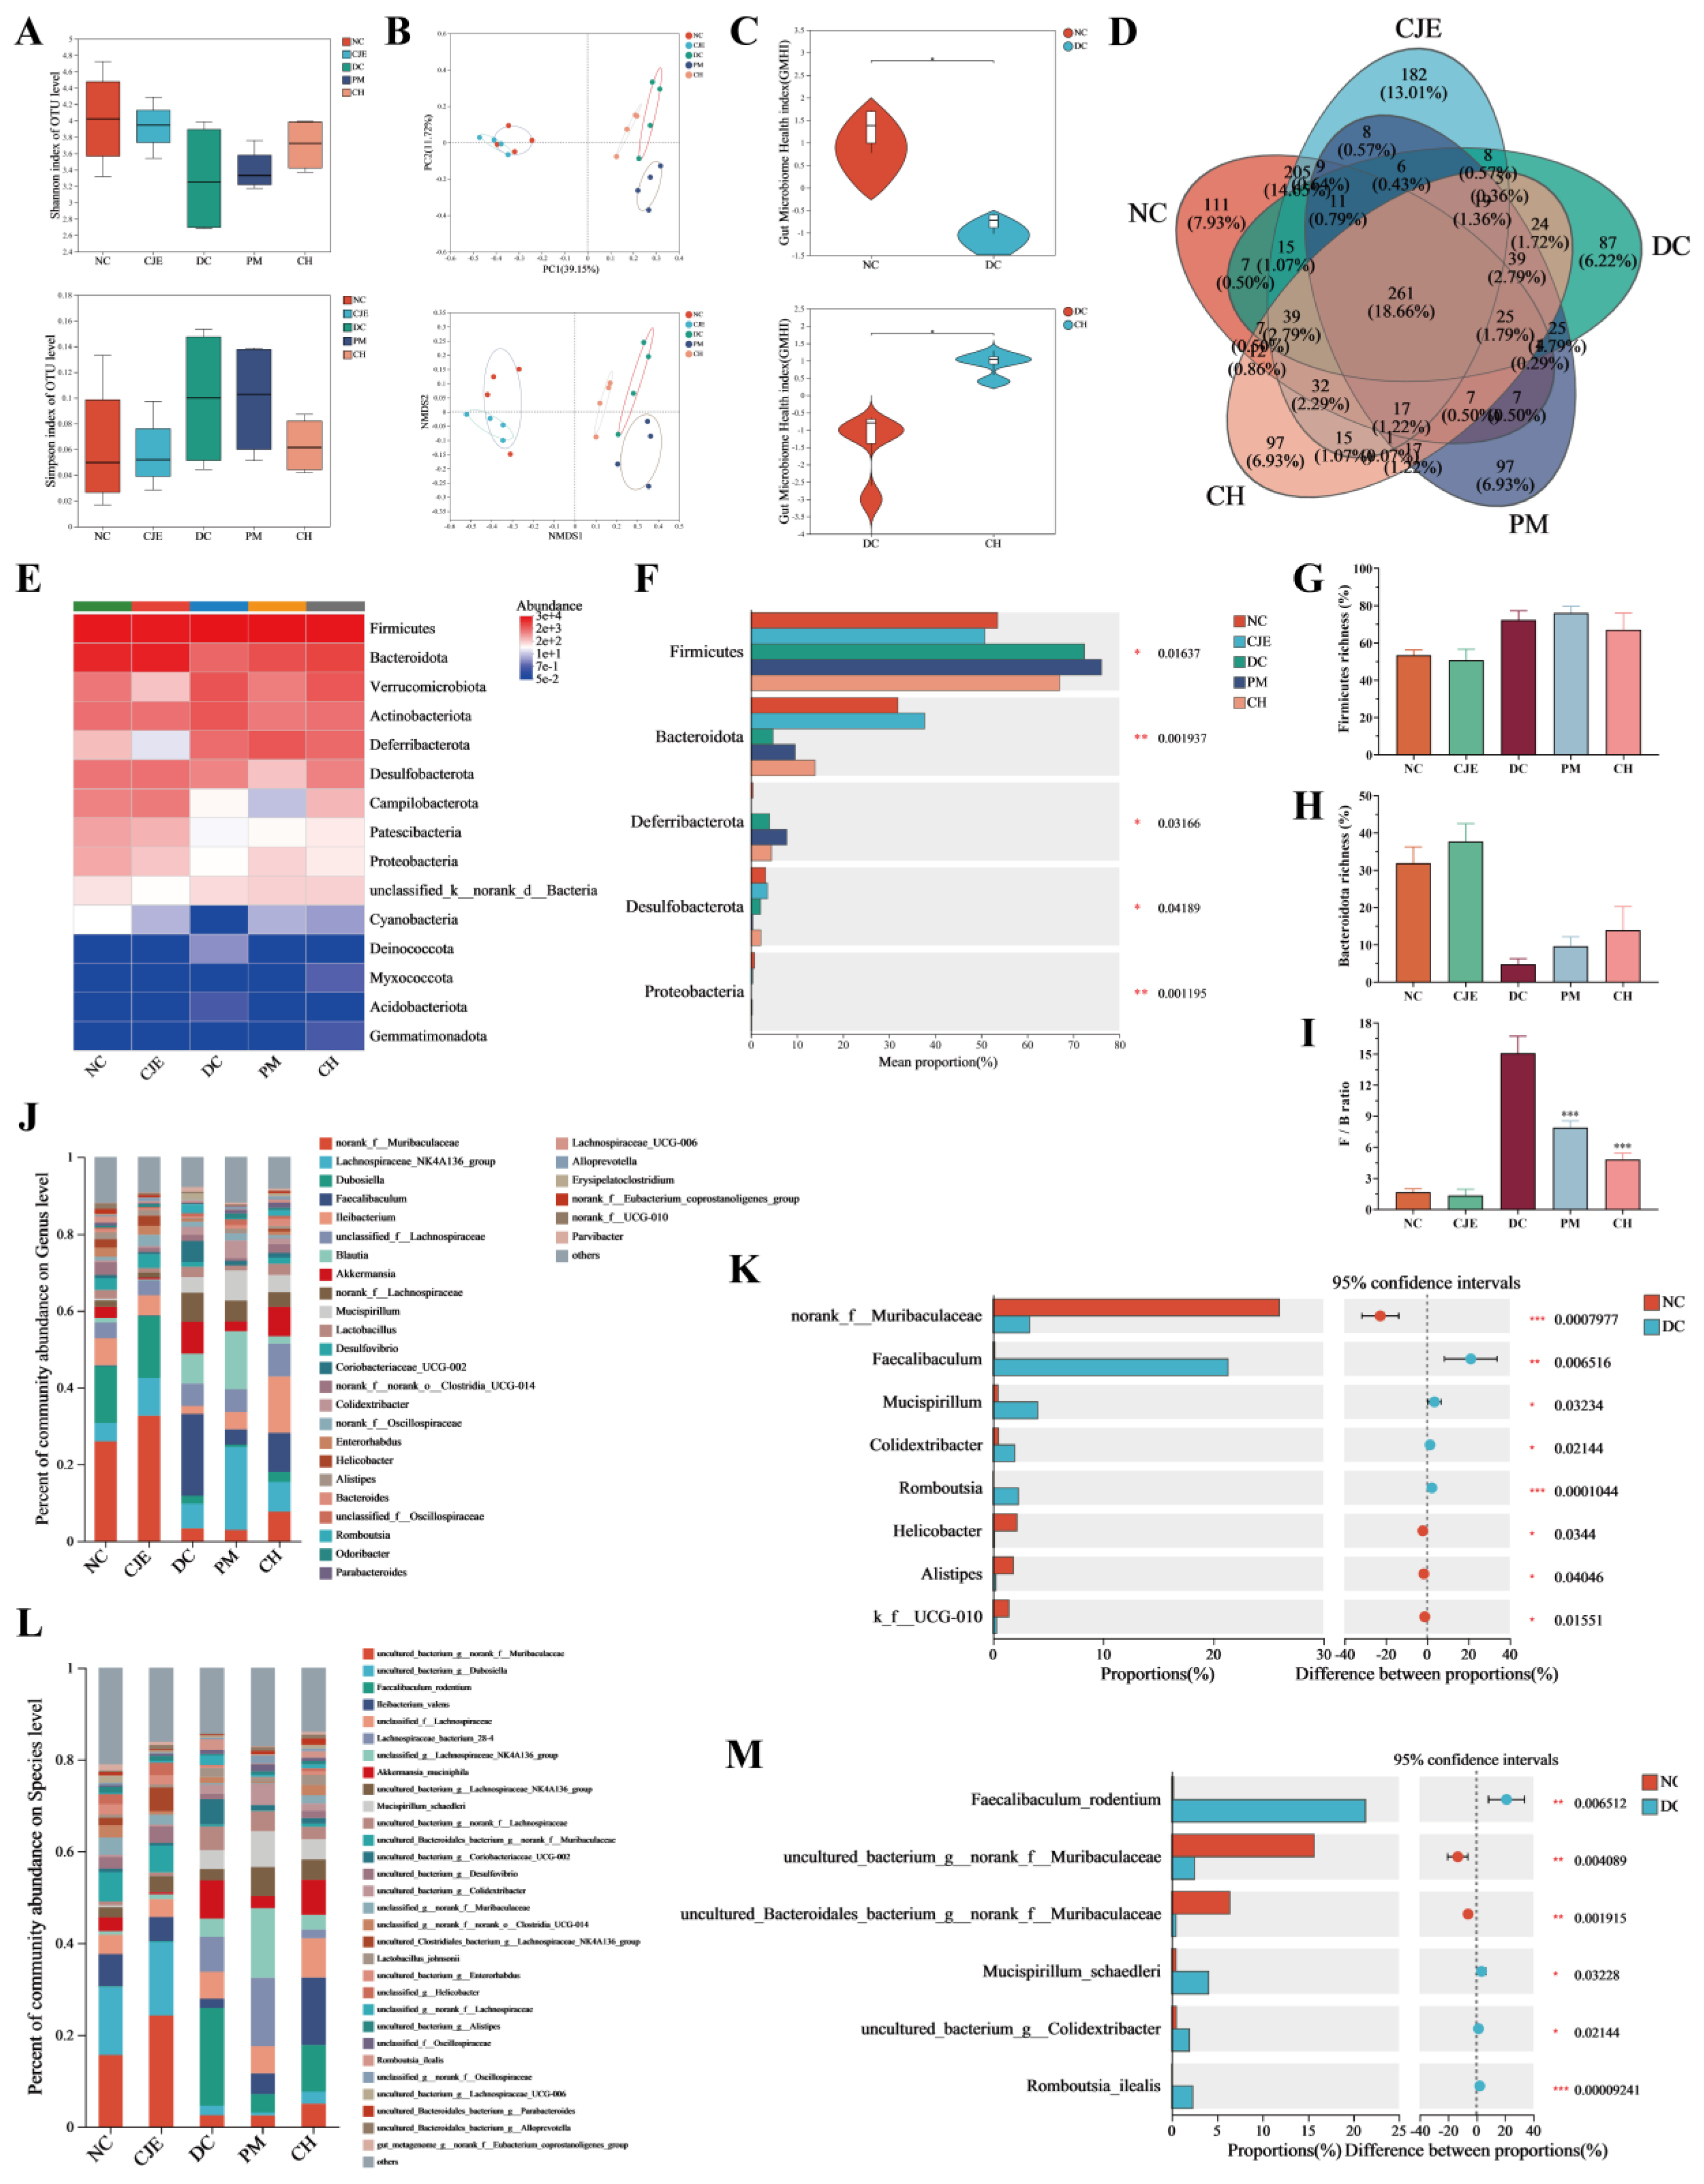
Figure 6.
Association of intestinal microbiota composition and function under CJE intervention in T2DM mice and prediction of metabolic pathways. (A) LEfSe analysis of intestinal flora between NC group and DC group from the phylum level to the species level. (B) LEfSe analysis between DC group and CH group. (C) Distance-based redundancy analysis at the genus level. (D) Pearson correlation analysis between the top 30 microbial genera in the intestinal flora and related metrics of glucose metabolism homeostasis. (E) COG function classification. (F) Average abundance of KEGG pathway in the five groups at level 2.
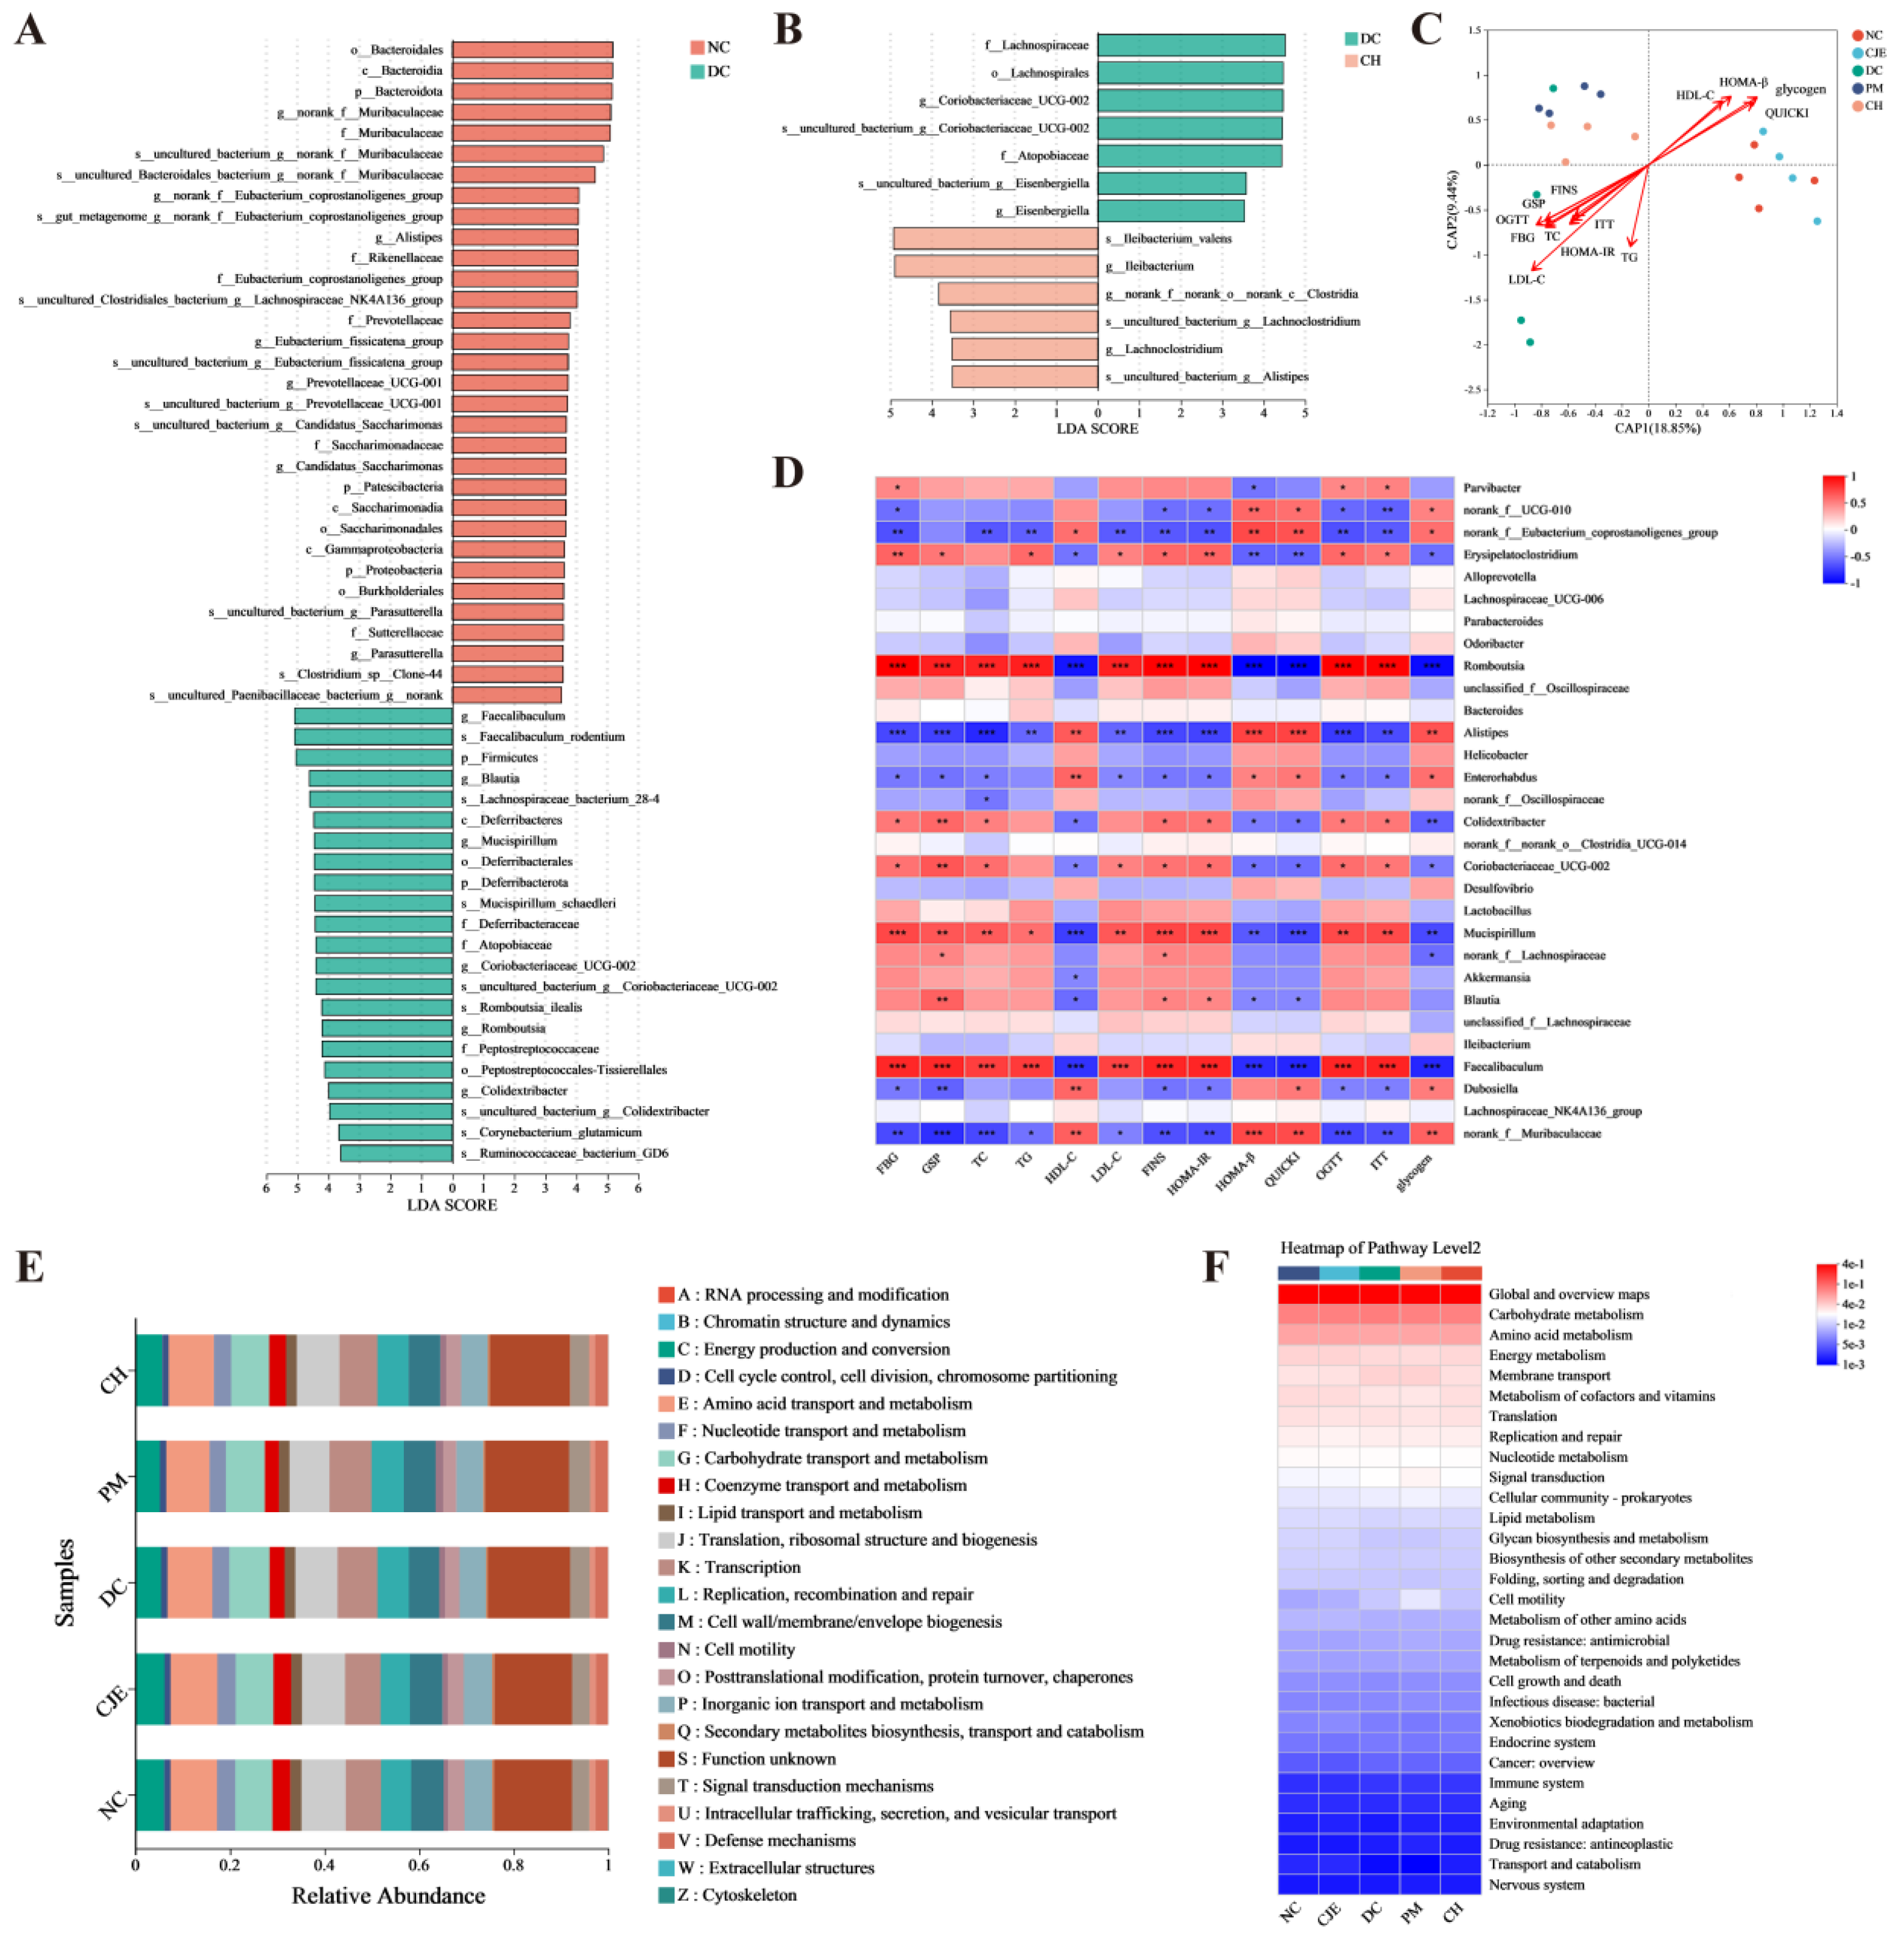
Figure 7.
Effects of CJE administration on IRS1-PI3k/AKT-FoxO1-GSK 3β signaling Pathway and AMPK signaling Pathway in the liver of T2DM mice. (A) p-IRS1 and IRS. (B) p-PI3K and PI3K. (C) p-Akt and Akt. (D) p-FoxO1 and FoxO1. (E) p-GSK-3β and GSK-3β. (F) p-AMPK and AMPK. (G) GLUT4. Data are presented as mean ± SEM. *P < 0.05, **P < 0.01, ***P < 0.001 versus the DC group.
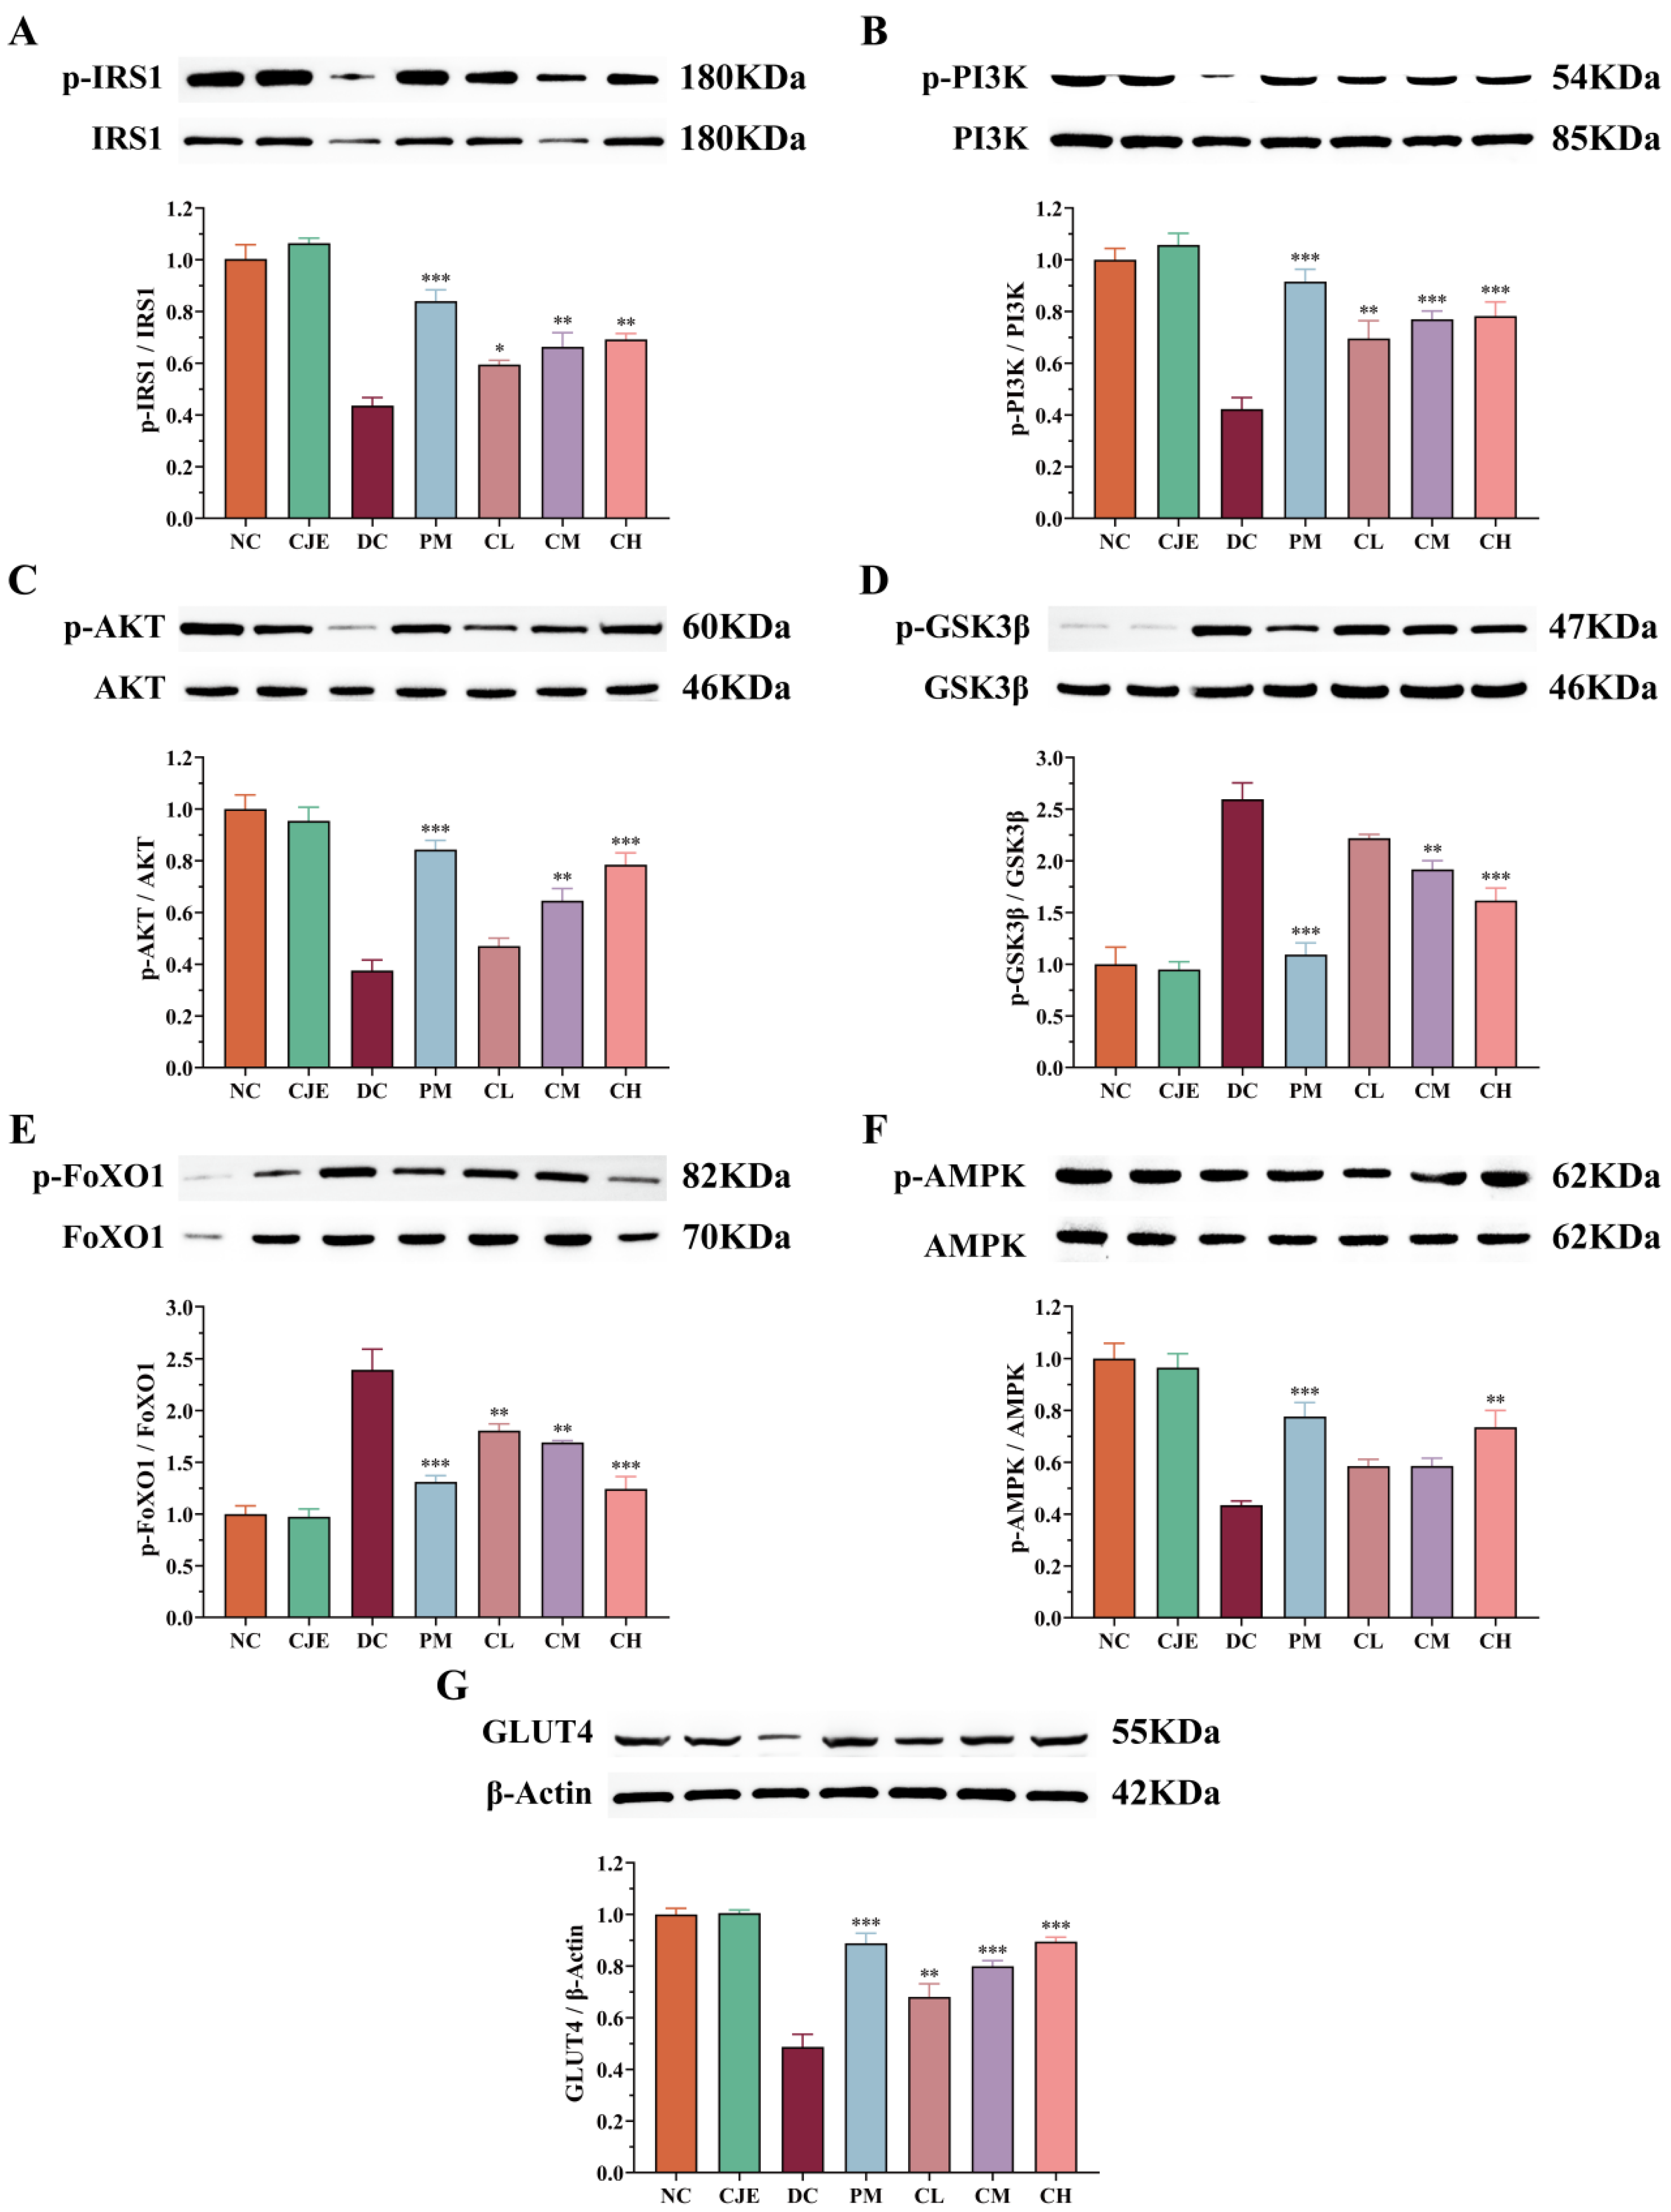

Table 1.
The main contents of flavonoids of CJE.
| Flavonoids | Content (μg/g) |
|---|---|
| Apigenin 6, 8-digalactoside | 77245.92831 |
| Dicaffeoyl quinolactone | 60064.4289 |
| Apigenin 6-C-glucoside 8-C-arabinoside | 54672.57871 |
| Luteolin-4'-O-glucoside | 34516.45459 |
| Isoshaftoside | 24582.14705 |
| Scutellarin | 24113.02598 |
| Quercetin 3-O-malonylglucoside | 16414.19393 |
| Chrysoeriol 7-O-glucoside | 14663.34312 |
| Quercetin-3, 4'-O-di-beta-glucoside | 13151.14052 |
| Luteolin 6-C-glucoside 8-C-arabinoside | 11983.51217 |
Disclaimer/Publisher’s Note: The statements, opinions and data contained in all publications are solely those of the individual author(s) and contributor(s) and not of MDPI and/or the editor(s). MDPI and/or the editor(s) disclaim responsibility for any injury to people or property resulting from any ideas, methods, instructions or products referred to in the content. |
© 2025 by the authors. Licensee MDPI, Basel, Switzerland. This article is an open access article distributed under the terms and conditions of the Creative Commons Attribution (CC BY) license (http://creativecommons.org/licenses/by/4.0/).
Copyright: This open access article is published under a Creative Commons CC BY 4.0 license, which permit the free download, distribution, and reuse, provided that the author and preprint are cited in any reuse.


